Embed Size (px)
Citation preview

Cleveland State University Cleveland State University
EngagedScholarship@CSU EngagedScholarship@CSU
Urban Publications Maxine Goodman Levin College of Urban Affairs
3-5-2019
Youngstown MSA: Growing Regional Industry Drivers (GRIDs) Youngstown MSA: Growing Regional Industry Drivers (GRIDs)
Iryna Lendel Cleveland State University, [email protected]
Iryna Demko Cleveland State University, [email protected]
Merissa Piazza Cleveland State University, [email protected]
Samuel Owusu-Agyemang
Matthew Ellerbrock
See next page for additional authors
Follow this and additional works at: https://engagedscholarship.csuohio.edu/urban_facpub
Part of the Urban Studies and Planning Commons
How does access to this work benefit you? Let us know! How does access to this work benefit you? Let us know!
Repository Citation Repository Citation Lendel, Iryna; Demko, Iryna; Piazza, Merissa; Owusu-Agyemang, Samuel; Ellerbrock, Matthew; and Jarus, Kyle, "Youngstown MSA: Growing Regional Industry Drivers (GRIDs)" (2019). Urban Publications. 0 1 2 3 1591. https://engagedscholarship.csuohio.edu/urban_facpub/1591
This Presentation is brought to you for free and open access by the Maxine Goodman Levin College of Urban Affairs at EngagedScholarship@CSU. It has been accepted for inclusion in Urban Publications by an authorized administrator of EngagedScholarship@CSU. For more information, please contact [email protected].

Authors Authors Iryna Lendel, Iryna Demko, Merissa Piazza, Samuel Owusu-Agyemang, Matthew Ellerbrock, and Kyle Jarus
This presentation is available at EngagedScholarship@CSU: https://engagedscholarship.csuohio.edu/urban_facpub/1591

YOUNGSTOWN MSAGROWING REGIONAL
INDUSTRY DRIVERS (GRIDs)
March 5, 2019 | Cleveland, Ohio
Dr. Iryna V. LendelDr. Ira Demko
Dr. Merissa Piazza
Samuel Owusu-AgyemangMatthew B. Ellerbrock
Kyle Jarus
THE GEORGE GUND FOUNDATION

INTRODUCTION
• The economic trends in Northeast Ohio (NEO) over the last 20 years are typical of the Midwest region, with a positive increase in output outpaced by the state of Ohio, and the United States
• The double recessions of 2001 and 2007-2009 show a deeper output decline in NEO than in comparable Midwest regions and the United States
• Traditionally, industries with high regional specialization that have a competitive advantage and drive regional economies are called economic base industries
• Groups of Regional Industry Drivers (GRIDs) are part of the economic base of a region
2

EMPLOYMENT AND OUTPUT TRENDS IN NEO
3

*
NORTHEAST OHIO MSAs
• The 18-county Northeast Ohio labor market is composed of four metropolitan areas (MSAs) and eight non-MSA counties
4*Note: Carroll County is not included in JobsOhio’s 18-county NEO definition, but is included in the Canton-Massillon MSA, and therefore used in Canton-Massillon MSA’s calculations in this study.
2017 Employment 2017 Output
Jobs % of NEO Output % of NEO
Cleveland MSA 1,069,941 52% $136.9B 59%
Akron MSA 344,321 17% $36.7B 16%
Non-MSA Counties 285,532 14% $27.3B 12%
Canton MSA 176,893 9% $16.4B 7%
Youngstown MSA 174,603 9% $16.4B 7%
NEO 18-Counties* 2,051,290 100% $233.7B 100%
Source: Moody’s Analytics

NEO MSAs EMPLOYMENT TRENDS
• Employment trends for all four NEO MSAs show a picture of deep employment losses stemming from the last two recessions (2001 and 2007-2009)
• These recessions brought structural changes to the manufacturing sector, which is a significant employer in all MSAs, by slashing jobs while keeping output high increased the sector’s productivity
• During the last two decades, the Youngstown MSA lost half of its employment in the manufacturing sector which can be seen in a steady decline of its overall employment
5
Akron MSA, 103
Canton MSA, 92
Cleveland MSA, 93
Youngstown MSA, 83
80
85
90
95
100
105
Emp
loym
ent
Ind
ex, 2
00
0=1
00
RecessionRecession
Source: Moody’s Analytics

NEO MSAs OUTPUT TRENDS
• Despite considerable job losses, real output of NEO MSAs have shown an upward trend since 2000
• Output dove in 2008 due to the Great Recession but recovered relatively quickly within two years of the Recession’s onset
• Although output growth in the Youngstown MSA was positive, it remained significantly behind other metropolitan areas in NEO
6
Akron MSA, 235
Canton MSA, 206
Cleveland MSA, 218
Youngstown MSA, 176
80
100
120
140
160
180
200
220
240
260
Re
al G
ross
Pro
du
ct In
de
x, 2
00
0=1
00
RecessionRecession
Source: Moody’s Analytics

GROWING REGIONAL INDUSTRY DRIVERS
(GRIDs)
7

DATA AND METHODOLOGY
• Using the wealth-creation variables of industries, we conducted statistical analyses to form, identify, and analyze the characteristics of industry groups to discern GRIDs
• Variables used in the model examined: • competitiveness of industries (change in wages, output, and productivity)
• importance to the regional economy (share and concentration of output, wages, and employment in the regional economy)
• comparison to the national economy (local competitiveness component of a shift-share analysis using output and employment)
• Variables are measured by the levels in 2017 or changes over the five-year period (2013 to 2017)
8

GROWING REGIONAL INDUSTRY DRIVERS (GRIDs)
• Groups of Regional Industry Drivers (GRIDs) are groups of industries with strong or increasing regional specialization and competitiveness, and growing output and productivity
• Some GRIDs are capital intensive and do not employ many people
• However, these industries contribute to the regional economy by paying high wages and creating jobs in companies of their supply chain
• The capital-intensive industries fuel service industries due to people having higher disposable income
• Region of study – the Youngstown-Warren-Boardman Metropolitan Statistical Area (MSA), also known as Mahoning Valley – includes Mahoning and Trumbull Counties in OH; does not include Mercer County, PA
9

GRIDs IN THE YOUNGSTOWN MSA
• Two GRIDs in the Youngstown MSA represented 7 industries• GRIDs produced $2.7 billion of output and employed 5,360 people
• The Oil and Gas GRID produced $2 billion of output and employed 1,260 people
• The Growing Legacy Manufacturing GRID produced $790 million of output and employed 4,100 people
• Declining Economic Base, composed of 19 industries, accounted for 24% ($3.9 billion) of output and 18% (31,930) of total employment
10

YOUNGSTOWN MSA GRIDs
• The Youngstown Metropolitan Area (MSA) accounts for nearly 10% of NEO’s economy
• Seven industries are classified into two different GRIDS: Oil and Gas, and Growing Legacy Manufacturing
• Oil and Gas GRID was the largest GRID providing nearly $2 billion in output
• Growing Legacy Manufacturing GRID represented three industries producing $790 million of output
• In 2017, these GRIDs employed 5,360 workers, 3% of the total workforce in the Youngstown MSA
• In this report, the Youngstown MSA is a 2-county area that includes Mahoning and Trumbull counties in Ohio
11

OIL AND GAS GRID• Consists of 4 industries associated with an increase in
regional output, productivity, and wages
• Real estate activities also describe this GRID because land leases and right-of-way agreements must be obtained to extract shale natural gas and build pipelines
• The Oil and Gas Extraction (2111) industry in the Youngstown MSA had exceptionally high growth in output (275%) and productivity (361%) from 2013 to 2017
• Output specialization saw triple-digit growth from 2013 to 2017 (564%)
• Can be categorized as an emerging base industry from its growth in output specialization
• Total output of the GRID in 2017 was $2 billion
• Industries in this GRID are small employers, with total employment of 1,260 in 2017
12
NAICS code Industry Name2111 Oil and Gas Extraction3241 Petroleum and Coal Products Manufacturing
5311 Lessors of Real Estate5313 Activities Related to Real Estate
Oil and Gas Extraction150 employees
Petroleum and Coal Products
Manufacturing210 employees
Lessors of Real Estate520 employees
Activities Related to Real Estate
380 employees
-50%
0%
50%
100%
150%
200%
250%
300%
350%
400%
-0.5 +0.0 +0.5 +1.0 +1.5 +2.0
% C
han
ge in
Pro
du
ctiv
ity
(20
13
-2
01
7)
Absolute Change in Output Specialization (2013 - 2017)
Source: Moody’s Analytics
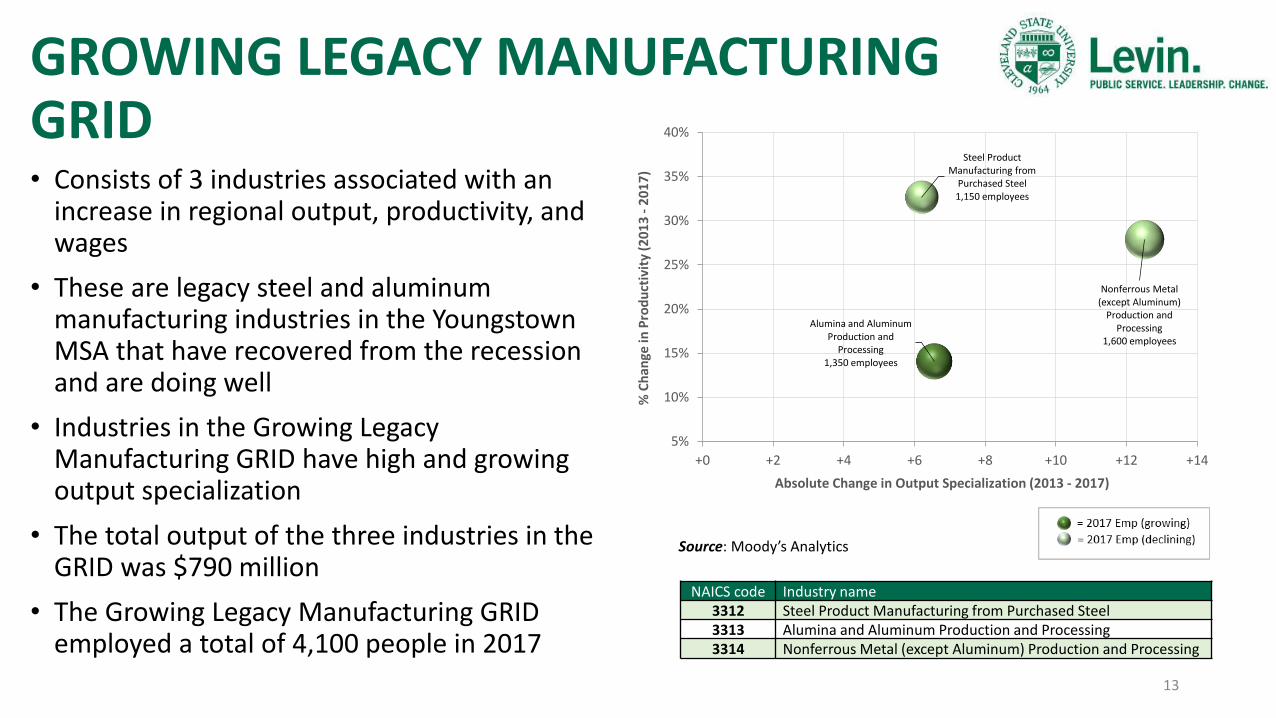
GROWING LEGACY MANUFACTURING GRID• Consists of 3 industries associated with an
increase in regional output, productivity, and wages
• These are legacy steel and aluminum manufacturing industries in the Youngstown MSA that have recovered from the recession and are doing well
• Industries in the Growing Legacy Manufacturing GRID have high and growing output specialization
• The total output of the three industries in the GRID was $790 million
• The Growing Legacy Manufacturing GRID employed a total of 4,100 people in 2017
13
NAICS code Industry name3312 Steel Product Manufacturing from Purchased Steel3313 Alumina and Aluminum Production and Processing3314 Nonferrous Metal (except Aluminum) Production and Processing
Steel Product Manufacturing from
Purchased Steel1,150 employees
Alumina and Aluminum Production and
Processing1,350 employees
Nonferrous Metal (except Aluminum)
Production and Processing
1,600 employees
5%
10%
15%
20%
25%
30%
35%
40%
+0 +2 +4 +6 +8 +10 +12 +14
% C
han
ge in
Pro
du
ctiv
ity
(20
13
-2
01
7)
Absolute Change in Output Specialization (2013 - 2017)
Source: Moody’s Analytics
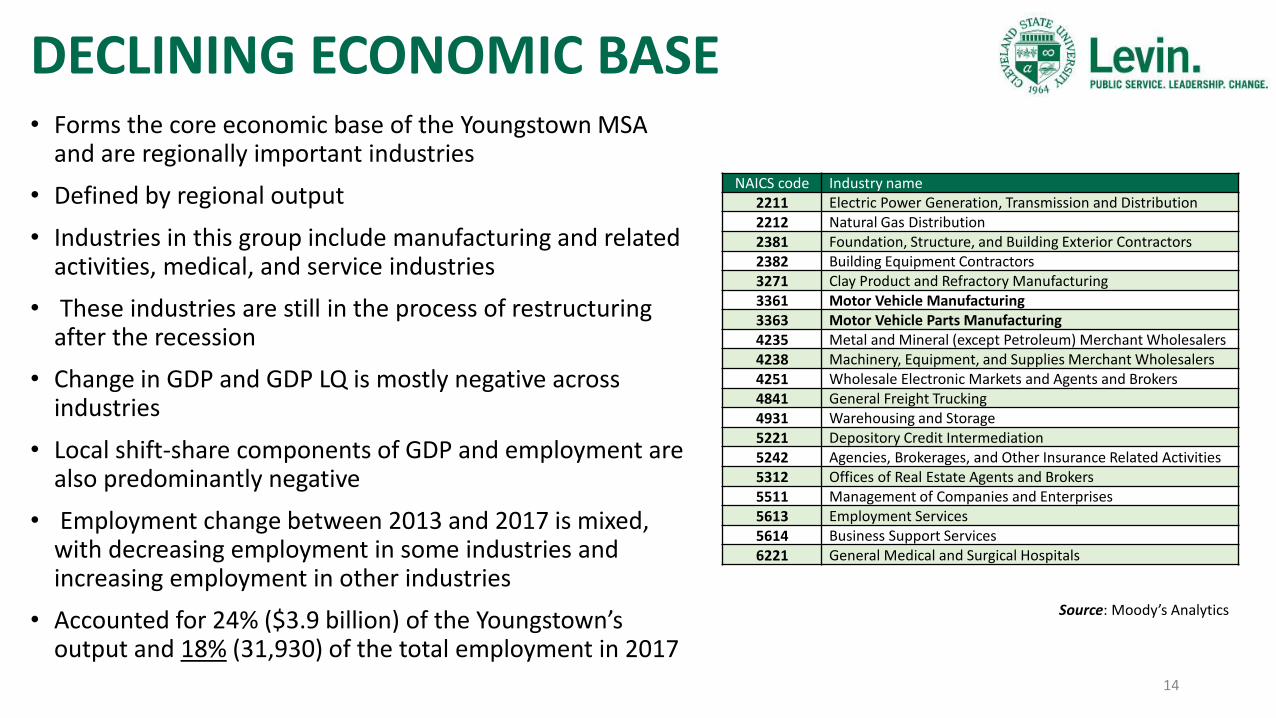
DECLINING ECONOMIC BASE• Forms the core economic base of the Youngstown MSA
and are regionally important industries
• Defined by regional output
• Industries in this group include manufacturing and related activities, medical, and service industries
• These industries are still in the process of restructuring after the recession
• Change in GDP and GDP LQ is mostly negative across industries
• Local shift-share components of GDP and employment are also predominantly negative
• Employment change between 2013 and 2017 is mixed, with decreasing employment in some industries and increasing employment in other industries
• Accounted for 24% ($3.9 billion) of the Youngstown’s output and 18% (31,930) of the total employment in 2017
14
NAICS code Industry name2211 Electric Power Generation, Transmission and Distribution2212 Natural Gas Distribution2381 Foundation, Structure, and Building Exterior Contractors2382 Building Equipment Contractors3271 Clay Product and Refractory Manufacturing3361 Motor Vehicle Manufacturing3363 Motor Vehicle Parts Manufacturing4235 Metal and Mineral (except Petroleum) Merchant Wholesalers4238 Machinery, Equipment, and Supplies Merchant Wholesalers4251 Wholesale Electronic Markets and Agents and Brokers4841 General Freight Trucking4931 Warehousing and Storage5221 Depository Credit Intermediation5242 Agencies, Brokerages, and Other Insurance Related Activities5312 Offices of Real Estate Agents and Brokers5511 Management of Companies and Enterprises5613 Employment Services5614 Business Support Services6221 General Medical and Surgical Hospitals
Source: Moody’s Analytics

General Medical and Surgical Hospitals
6,490
Business Support Services3,780
Employment Services2,620
General Freight Trucking2,290
Building Equipment Contractors
2,230
Management of Companies and Enterprises
1,970
Motor Vehicle Parts Mfg1,640
Warehousing and Storage1,580
Motor Vehicle Mfg1,570
Depository Credit Intermediation1,470
Foundation, Structure, and Building Exterior Contractors
1,410
Machinery, Equipment, and Supplies Merchant Wholesalers
1,180
Agencies, Brokerages, and Other Insurance Related Activities
1,090
Metal and Mineral (except Petroleum) Merchant Wholesalers
1,020
Wholesale Electronic Markets and Agents and Brokers
620
Clay Product and Refractory Mfg370
Electric Power Generation, Transmission and Distribution
320
Natural Gas Distribution140
Offices of Real Estate Agents and Brokers
140
-40%
-30%
-20%
-10%
0%
10%
20%
30%
40%
50%
60%
70%
-4.0 -3.5 -3.0 -2.5 -2.0 -1.5 -1.0 -0.5 +0.0 +0.5 +1.0
% C
han
ge in
Pro
du
ctiv
ity
(20
13
-2
01
7)
Absolute Change in Output Specialization (2013 - 2017)
DECLINING ECONOMIC BASE
15
(value shown in label is employment)
Source: Moody’s Analytics

NEO GRIDs
16

Takeaways
• NEO is re-balancing its economic structure to be less concentrated in manufacturing, which can better protect it from recessionary pressures in the manufacturing sector
• In 2017, manufacturing was only 13% (down from 1/3 in 1970)
• NEO still had 4% more manufacturing than the U.S.: 13% vs. 9%
• U.S. had 12% higher productivity in manufacturing than NEO
• The gap is three times smaller if measured without Computer and Electronic Product Manufacturing sectors
17

The Largest Employment-Based GRID: Professional services
18
NAICS Industry Name
4251 Wholesale Electronic Markets and Agents and Brokers
5211 Monetary Authority – Central Bank
5221 Depository Credit Intermediation
5241 Insurance Carries
5242 Agencies, Brokerages, and Other Insurance Related Activities
5311 Lessors of Real Estate
5312 Offices of Real Estate Agents and Brokers
5313 Activities Related to Real Estate
5511 Management of Companies and Enterprises
6221 General Medical and Surgical Hospitals
• More than 12% (251,030) of the total employment and over 26% ($61 billion) of the regional output
• In 2013-2017, added 9,670 jobs (4%) and $18.6 billion in GRP (15%)
• Contributed 71% of GRIDs output• Insurance increased their productivity
almost 50%

NAICS Industry Name
3251 Basic Chemic Manufacturing
3252 Resin, Synthetic Rubber, and Artificial Synthetic Fibers and Filaments Mfg
3255 Paint, Coating, and Adhesive Manufacturing*
3256 Soap, Cleaning Compound, and Toilet Preparation Manufacturing
3259 Other Chemical Product and Preparation Manufacturing
3271 Clay Product and Refractory Manufacturing
3311 Iron and Steel Mills and Ferroalloy Manufacturing
3312 Steel Product Manufacturing from Purchased Steel*
3313 Alumina and Aluminum Production and Processing
3314 Nonferrous Metal (except Aluminum) Production and Processing*
3315 Foundries*
3321 Forging and Stamping
3322 Cutlery and Handtool Manufacturing
3324 Boiler, Tank, and Shipping Container Manufacturing
3327 Machine Shops; Turned Product; and Screw Nut and Bolt Mfg
3328 Coating, Engraving, Heat Treating, and Allied Activities,
3329 Other Fabricated Metal Product Manufacturing
3335 Metalworking Machinery Manufacturing
3339 Other General-Purpose Machinery Manufacturing
4235 Metal and Mineral (except Petroleum) Merchant Wholesalers
19
Growing Legacy Manufacturing
• 109,470 jobs, representing 5% of NEO; $19 billion in output – 8% of all industries & 22% of GRIDs• In 2013-2017, this GRID lost 5,010 (-5%) jobs, added $1 billion GRP (8%)• All capital-intensive industries – generate another 88,199 jobs in their supply chain• Fueling another 98,038 induced jobs – totaling to 295,707 total affected jobs• All industries paying higher than the NEO living wage ($49,663 for a family of 3)

NAICS code
Industry Name NAICS code
Industry Name
3219 Other Wood Product Mfg 3333 Commercial and Service Industry Machinery Mfg
3221 Pulp, Paper, and Paperboard Mills 3334 Ventilation, Heating, Air-Conditioning, and Commercial Refrigeration Equipment Mfg
3222 Converted Paper Product Mfg 3351 Electric Lighting Equipment Mfg
3231 Printing and Related Support Activities 3352 Household Appliance Mfg
3261 Plastics Product Mfg 3353 Electrical Equipment Mfg
3262 Rubber Product Mfg 3359 Other Electrical Equipment and Component Mfg
3272 Glass and Glass Product Mfg 3361 Motor Vehicle Mfg
3279 Other Nonmetallic Mineral Product Mfg 3362 Motor Vehicle Body and Trailer Mfg
3323 Architectural and Structural Metals Mfg 3363 Motor Vehicle Parts Mfg
3325 Hardware Mfg 3371 Household and Institutional Furniture and Kitchen Cabinet Mfg
3326 Spring and Wire Product Mfg 3391 Medical Equipment and Supplies Mfg
3331 Agriculture, Construction, and Mining Machinery Mfg
3399 Other Miscellaneous Mfg
3332 Industrial Machinery Mfg
20
Another Half of Manufacturing is Still Struggling

NAICS code
Industry Name
2111 Oil and Gas Extraction
3241 Petroleum and Coal Products Manufacturing
4860 Pipeline Transportation
21
Oil and Gas GRID
• <1% of total NEO employment but 3% of output & 7% of GRIDs output ($6 billion)
• Fast-growing, emerging economic base: Double-digit growth in output & growing specialization
• Needs to increase in size and scale to impact overall regional performance
• One of the highest employment multipliers – supply chain; high wages in the supply chain companies –chemical and steel
• 3,160 direct jobs, additional 18,945 workers in indirect and 14,208 induced jobs
• In 2013-2017, added 270 jobs (9%) and $2.1 billion in GRP (52%)

NAICS code
Industry Name Average Wage
2017
Higher or Lower Than the NEO Living Wage
4860 Pipeline Transportation $199,707 H
5211 Monetary Authorities - Central Bank $131,743 H
3251 Basic Chemical Mnf $120,261 H
4251 Wholesale Electronic Markets and Agents and Brokers $112,958 H
5511 Management of Companies and Enterprises $103,924 H
3314 Nonferrous Metal (except Aluminum) Production and Processing $100,936 H
3252 Resin, Synthetic Rubber, and Artificial Synthetic Fibers and Filaments Mnf $99,236 H
3311 Iron and Steel Mills and Ferroalloy Mnf $84,678 H
3255 Paint, Coating, and Adhesive Manufacturing $83,139 H
3256 Soap, Cleaning Compound, and Toilet Preparation Mnf $81,526 H
3312 Steel Product Mnf from Purchased Steel $76,563 H
3241 Petroleum and Coal Products Mnf $76,475 H
5242 Agencies, Brokerages, and Other Insurance Related Activities $74,609 H
3324 Boiler, Tank, and Shipping Container Mnf $73,772 H
5241 Insurance Carriers $72,858 H
3259 Other Chemical Product and Preparation Mnf $69,870 H
3339 Other General Purpose Machinery Mnf $69,013 H
3315 Foundries $66,458 H
3329 Other Fabricated Metal Product Mnf $64,386 H
3313 Alumina and Aluminum Production and Processing $63,986 H
5221 Depository Credit Intermediation $61,860 H
6221 General Medical and Surgical Hospitals $61,576 H
4235 Metal and Mineral (except Petroleum) Merchant Wholesalers $60,702 H
3321 Forging and Stamping $59,413 H
5312 Offices of Real Estate Agents and Brokers $58,358 H
3322 Cutlery and Handtool Mnf $56,410 H
3327 Machine Shops; Turned Product; and Screw, Nut, and Bolt Mnf $55,954 H
3335 Metalworking Machinery Mnf $51,855 H
3328 Coating, Engraving, Heat Treating, and Allied Activities $50,551 H
3271 Clay Product and Refractory Mnf $50,277 H
5313 Activities Related to Real Estate $49,817 H
5311 Lessors of Real Estate $44,155 L
2111 Oil and Gas Extraction $42,950 L
22
Ave
rage
Wag
es o
f A
ll G
RID
s
Living wage $49,663
Median Wage $50,797

Group NAICS code
Industry Name Emp Diff
(2013-2017)
Emp 2017
Average Wage 2017
Higher or Lower
Living Wage
WIG 7225 Restaurants and Other Eating Places 11,030 146,890 $17,103 L
WIG 6241 Individual and Family Services 3,900 23,270 $24,048 L
GRID 6221 General Medical and Surgical Hospitals 3,680 106,620 $61,576 H
GRID 5242 Agencies, Brokerages, and Other Insurance Related Activities
3,000 16,470 $74,609 H
WIG 2382 Building Equipment Contractors 2,260 24,180 $64,559 H
WIG 7211 Traveler Accommodation 2,090 14,870 $24,043 L
WIG 2373 Highway, Street, and Bridge Construction 1,990 4,950 $69,091 H
WIG 6111 Elementary and Secondary Schools 1,890 21,710 $17,903 L
WIG 6113 Colleges, Universities, and Professional Schools 1,770 19,750 $45,877 L
WIG 5415
Computer Systems Design and Related Services
1,760 17,310 $94,054 H
WIG 4411 Automobile Dealers 1,670 19,580 $50,287 H
WIG 4529 Other General Merchandise Stores 1,650 24,330 $22,685 L
WIG 5613 Employment Services 1,570 47,320 $31,241 L
WIG 5416
Management, Scientific, and Technical Consulting Services
1,490 11,830 $76,621 H
GRID 4251 Wholesale Electronic Markets and Agents and Brokers
1,430 12,710 $112,958 H
WIG 6213 Offices of Other Health Practitioners 1,310 12,690 $40,998 L
WIG 2361 Residential Building Construction 1,290 8,010 $50,427 H
WIG 4841 General Freight Trucking 1,270 17,790 $51,045 H
WIG 6233 Community Care Facilities for the Elderly 1,190 15,220 $24,552 L
WIG 3363 Motor Vehicle Parts Manufacturing 1,170 17,010 $72,838 H
23
What Industries are Adding Jobs in NEO?
• Between 2013 and 2017, 160 industries added total of 90,770 jobs, 107 lost 42,510 jobs; the net gain was 48,260 jobs
• Top 20 growing industries added ~ 53% of that or 47,410 jobs
• Only three of the top growing industries are in GRIDs (total empl 119,330), they added 8,110 jobs:
• Hospitals
• Insurance agencies
• B2B electronic wholesale
• Of the other 17 WIG industries, 8 paid wages above NEO’s living wage, 6 paid wages above the NEO median
24
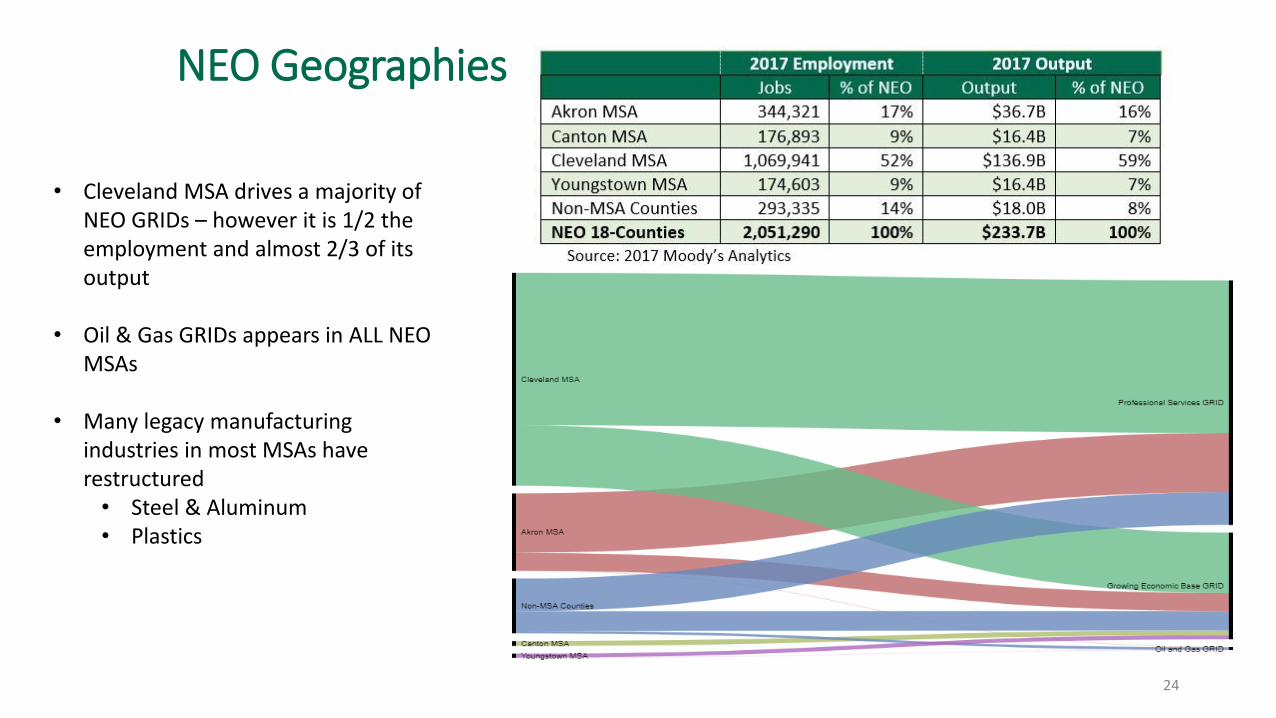
NEO Geographies
• Cleveland MSA drives a majority of NEO GRIDs – however it is 1/2 the employment and almost 2/3 of its output
• Oil & Gas GRIDs appears in ALL NEO MSAs
• Many legacy manufacturing industries in most MSAs have restructured• Steel & Aluminum• Plastics

RECENT DEVELOPMENTS
25

DOMESTIC AND INTERNATIONAL TRADE POLICY
• Summer 2018 saw growing rhetoric from U.S. government officials about increasing tariffs on many foreign-produced products
• Based on this threat, retaliatory tariffs from China, the European Union, and Canada were announced which may significantly impact manufacturing industries in NEO
• While global and national policies are outside of local control, it is essential for regional economic development strategies to be responsive to global influences and risks
26

LORDSTOWN GM PLANT CLOSURE• In December 2018, General Motors announced plans to discontinue
production of the Chevy Cruze, idling the GM Lordstown Plant while cutting 1,607 jobs
• This was on top of already deep workforce cuts when the plant eliminated second shift workers in July 2018 (1,500 jobs) and the third shift in February 2017 (1,245 jobs) 1
• It is estimated that the total economic impact of these cuts is upwards of $8.2 billion2
• The Motor Vehicle Manufacturing (NAICS 3361) industry in NEO is among the legacy manufacturing industries currently losing their competitive advantage3
• In 2017, it contributed $747 million to NEO output• Over the 2013-2017 period, its effective output in the region declined 22%, compared
to 19% growth national-wide
27
1 Ohio Department of Jobs and Family Services Worker Adjustment and Retraining (WARN) Notices filed by Lordstown GM, 2018; Youngstown Vindicator, 2016 2 IMPLAN 3 Moody’s Analytics

NEXT STEPS
• What kind of information could be most useful for further steps?
• What type of research assistance we can contribute?
• What are the next steps?
28

Dr. Iryna V. Lendel
Research Associate Professor | DirectorCenter for Economic Development
216.875.9967
http://levin.urban.csuohio.edu/ced/
29THE GEORGE GUND FOUNDATION