Embed Size (px)
Citation preview

[Type text]
Young People
A Social Profile
Blacktown City Social Profile 2016

For further information regarding issues identified in this profile or if you are seeking information on issues not included please contact the Social Planning Team on 02 9839 6420.
1
Contents
Executive Summary .............................................................................................................. 1 1. Introduction .................................................................................................................... 4 2. What does the data say? ............................................................................................... 7
2.1 Young people - population and age structure, Blacktown City ................................. 7 2.2 Where do they live? ................................................................................................ 8 2.3 Forecast for young people .................................................................................... 10 2.4 Aboriginal and Torres Strait Islander young people ............................................... 10 2.5 Young people born overseas ................................................................................ 10 2.6 Language spoken at home .................................................................................... 12 2.7 Education .............................................................................................................. 13 2.8 Employment .......................................................................................................... 14 2.9 Engaged or disengaged youth .............................................................................. 15 2.10 Homelessness ...................................................................................................... 15 2.11 Young parents ...................................................................................................... 15 2.12 Need for assistance .............................................................................................. 16 2.13 Obesity and diabetes ............................................................................................ 16 2.14 Addiction ............................................................................................................... 19 2.15 Psychological distress ........................................................................................... 19 2.16 Other health issues ............................................................................................... 20 2.17 Social capital and young people ............................................................................ 20
3. What do the community and service providers say? .................................................... 25
3.1 Social gradient ...................................................................................................... 25 3.2 Stress ................................................................................................................... 26 3.3 Early life ................................................................................................................ 27 3.4 Social exclusion .................................................................................................... 27 3.5 Work ..................................................................................................................... 27 3.6 Unemployment ...................................................................................................... 28 3.7 Social support ....................................................................................................... 28 3.8 Addiction ............................................................................................................... 28 3.9 Food ..................................................................................................................... 28 3.10 Transport .............................................................................................................. 28 3.11 Service development ............................................................................................ 29

Tables and figures
Figure 1: Age group of survey participants ............................................................................ 5 Table 1: Statistical local areas and precincts in Blacktown City ............................................. 7 Figure 2: People aged 12 – 17 years, Blacktown City, 2011 ................................................. 8 Figure 3: People aged 18 – 24 years, Blacktown City, 2011 ................................................. 9 Table 2: Forecast population of young people 10 – 24 years .............................................. 10 Table 3: Country of birth of people aged 12 to 17 years ...................................................... 11 Table 4: Country of birth of people aged 18 to 24 years ...................................................... 12 Table 5: Education institution attending ............................................................................... 14 Table 6: Need for assistance with core activities ................................................................. 16 Table 7: Adequate fruit and vegetable consumption for student and children ...................... 18 Figure 4: Belonging ............................................................................................................. 21 Figure 5: Speaking with neighbours .................................................................................... 22 Figure 6: Satisfied with their local neighbourhood ............................................................... 22 Figure 7: Relying on your neighbours .................................................................................. 23 Figure 8: Feeling safe in the street ...................................................................................... 23

Executive Summary
This profile outlines the major social issues currently facing young people aged 12-24 years in Blacktown City. It explores the key issues for eleven priority areas being the social gradient, stress, early life, social exclusion, work, unemployment, social support, addiction, food, transportation and service development.
The profile is a resource to support planning and research. It is a tool for strategic planning, reviewing strategic plans and should be used along-side consideration of the policies and activities of organisations, Local, State and Federal governments.
The executive summary provides an overview of findings from research and community engagement.
Young people (aged 12-24 years) in Blacktown City had the following characteristics in 2016:
• 59,607 people were aged between 12 and 24 years. 27,583 were aged 12-17 years old and 32,024 were aged 18-24 years old.
• The projected youth population (10-24 years) for 2036 is 105,207 persons.
• 2,650 young people identified as Aboriginal and/or Torres Strait Islander, representing 4.4% of young people in Blacktown City.
• 15,328 young people were born overseas, representing 25.9% of young people in Blacktown City.
• Where young people live varies. Mount Druitt Precinct had the highest rates of young people compared to Blacktown and the North West Precinct.
• 10.9% of 15 to 24 year olds were not employed or attending an education institution (Greater Sydney 7. 6%). This rate varied across the city from 3.6% in Acacia Gardens – Parklea to 30.0% in Bidwill.
• The unemployment rate for 15-24 year olds was 15.7%, with the highest youth unemployment experienced in the Mount Druitt Precinct.
• There were 1,545 persons requiring assistance for core activities, representing 2.6% of young people in Blacktown City.
• There were an estimated 177 young parents (15-19 years), representing 0.8% of the 15-19 year old population.
Young people - A Social Profile 1

Issues
• Social exclusion of young people – stigma/ stereotyping associated with being young, living in particular suburbs, in public housing, rural fringe and living with a disability.
• Homelessness, sleeping in cars and couch surfing is the experience of many young people serviced by youth services in the city.
• There are a limited number of public spaces where young people can gather and feel safe.
• Personal and community safety is a major concern. Young people are very aware of high crime rates and antisocial behaviour in their neighbourhoods, around shopping centres, parks and transport interchanges (including drinking alcohol, drug-taking and swearing). Vandalism and graffiti make areas look run-down and people feel unsafe.
• Reports of online safety linked harassment and bullying through social media.
• Mental health and well-being of young people including depression, anxiety disorders, low self-esteem and self-harm are key issues.
• Mental health services are at capacity with long waiting lists for psychologist services.
• Climate change and the importance of conservation, restoration and limiting their impacts on the environment are important to young people.
• Tensions have been found to exist between generations as well as between communities with young people growing up caught between the Australian way of life and that of their parents.
Strengths
• Young people value having close access to work, facilities and services (libraries, education, shops, health, community)
Recommendations
• Additional government funding to help young people with skills and employment.
• Additional local job opportunities for young people.
• Targeted support for young parents who are at home and in schools.
Young people - A Social Profile 2

• Support for young people and their families living in poverty to minimise the impacts on their development, education and lifestyle.
• Reducing stigma/ stereotyping associated with being a young person in our city.
• Increasing the number of public spaces where young people can gather and feel safe.
• Promoting personal and community safety across our city by reducing youth crime, antisocial behaviour and promoting safe use of social media.
• Development of services and programs to improve the overall physical health and wellbeing of young people in our city aimed at overweight and obesity, healthy eating, physical activity and problem alcohol and drug use.
• Additional early intervention and support services and programs to improve the overall mental health and wellbeing of young people aimed at support for vulnerable and disengaged youth, for young people with mental illness and reducing family and domestic violence.
•
Young people - A Social Profile 3

1. Introduction
Social and community planning helps us focus on the needs and aspirations of local communities through a whole of community approach. It provides an evidence base that guides our activities over the short-term and long-term.
This profile, focused on young people aged 12 – 24 years, presents research from the Blacktown City Social Profile 2016 and provides a more detailed understanding of the social situation for young people in Blacktown City.
The principles of equity, access and social justice underpin this profile. The profile is also strength based, recognising community strengths and resources which can be used to build strong, healthy and sustainable communities.
While we have a lead role in addressing many of the issues identified, we recognise not all issues raised in community engagement are solely the responsibility of local government and require strategic linkages and collaborative partnerships with the community sector and other stakeholders. This document will guide us in focussing resources on key issues and actions in response to community need and mindful of the directions of other stakeholders.
The profile is a resource to support planning and research. It is a tool for strategic planning, reviewing strategic plans and should be used along-side consideration of the policies and activities of organisations, Local, State and Federal governments.
The social profile on young people includes the following sections:
• What does the data say? - The key social indicators for young people
• What do the community and service providers say? - A summary of the priority issues young people identified in our community engagement.
How did we develop the social profile?
The Blacktown City Social Profile 2016 is a key reference document for developing our community strategic plan. It was developed through community engagement and research. We engaged with over 2,155 people who participated in social profile surveys, focus groups, stakeholder forums and service interviews.
The target groups consulted are in line with the New South Wales Department of Local Government mandatory target groups and included Aboriginal and Torres Strait Islander People, children, men, older people, people with disability, people from culturally and linguistically diverse background, women and young people.
Young people - A Social Profile 4

This social profile includes any results related to participants who were young people aged 10 to 24 years. A lower percentage of young people, in comparison to the overall population of young people, participated in the survey. While young people 10 – 24 years make up 21.7% of our city’s population, our survey sample in this age group was 11.1%.
Figure 1: Age group of survey participants
Source: Blacktown City Social Profile 2016 Community Engagement Report
The survey was provided on-line, used in face to face interviews at key festivals and events, distributed through Blacktown City administration, libraries, community organisations, social groups and clubs. Multicultural groups and agencies helped distribute translated surveys in 12 languages.
A detailed summary of findings is contained in the Community Engagement Report - Blacktown City Social Profile 2016.
We researched key social indicators for the Blacktown City and were informed, in part, by research from Westir Ltd. A detailed summary of indicator results are contained in the Social Indicator Report - Blacktown City Social Profile 2016.
0.0% 10.0% 20.0% 30.0%
Under 10
10-14
15-24
25-39
40-49
50-64
65-69
70-74
75+
Blacktown City
Survey
Young people - A Social Profile 5
Additional resources in this series include:
• The Blacktown City Social Profile 2016.
The Blacktown City Social Profile 2016 can be found at
https://www.blacktown.nsw.gov.au/About-Council/Our-city/Blacktown-City-Social-Profile-2016
• Blacktown City Social Profile 2016
• Blacktown City Social Profile 2016 Community Engagement Report
• Blacktown City Social Profile 2016 Social Indicator Report
• Blacktown City Social Profile 2016 Community Engagement Report
• Blacktown City Social Profile 2016 Social Indicator Report
• Blacktown Precinct - A Social Profile
• Mount Druitt Precinct - A Social Profile
• North West Precinct - A Social Profile
• Aboriginal and Torres Strait Islander communities - A Social Profile
• Children - A Social Profile
• People from culturally and linguistically diverse backgrounds - A Social Profile
• Older people - A Social Profile
• People with disability - A Social Profile
• Women - A Social Profile.
Young people - A Social Profile 6
2. What does the data say?
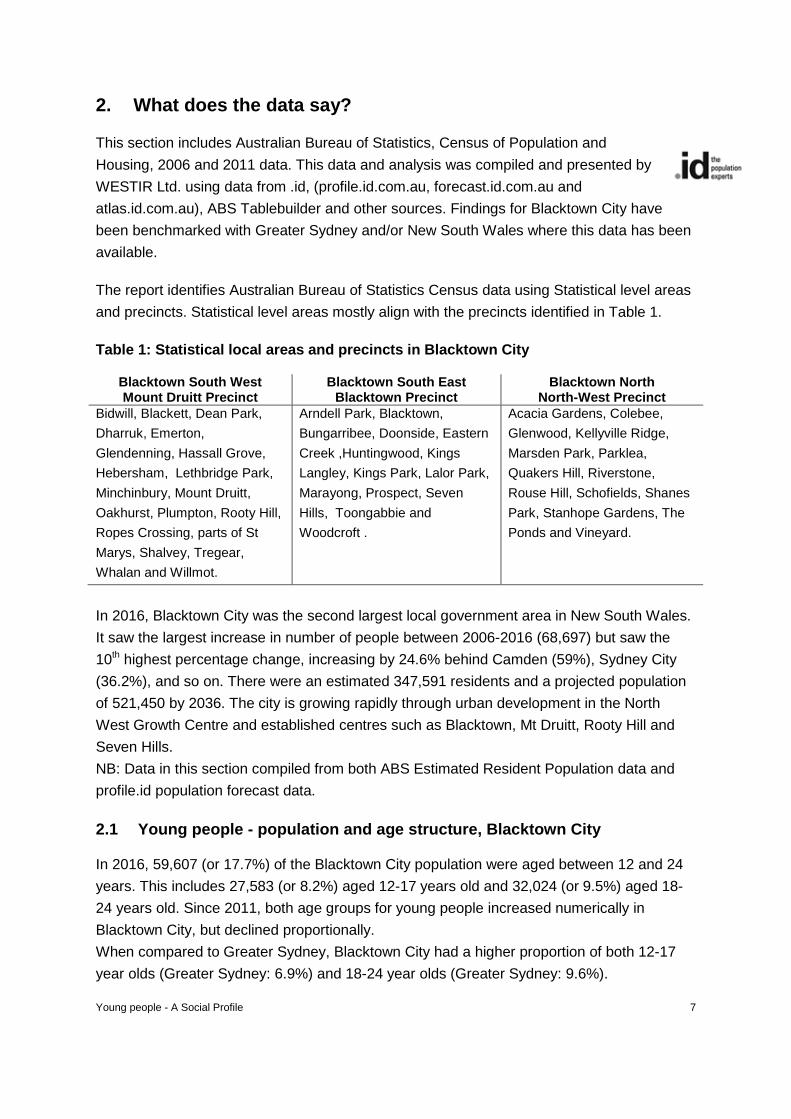
This section includes Australian Bureau of Statistics, Census of Population and Housing, 2006 and 2011 data. This data and analysis was compiled and presented by WESTIR Ltd. using data from .id, (profile.id.com.au, forecast.id.com.au and atlas.id.com.au), ABS Tablebuilder and other sources. Findings for Blacktown City have been benchmarked with Greater Sydney and/or New South Wales where this data has been available.
The report identifies Australian Bureau of Statistics Census data using Statistical level areas and precincts. Statistical level areas mostly align with the precincts identified in Table 1.
Table 1: Statistical local areas and precincts in Blacktown City
Blacktown South West Mount Druitt Precinct
Blacktown South East Blacktown Precinct
Blacktown North North-West Precinct
Bidwill, Blackett, Dean Park, Dharruk, Emerton, Glendenning, Hassall Grove, Hebersham, Lethbridge Park, Minchinbury, Mount Druitt, Oakhurst, Plumpton, Rooty Hill, Ropes Crossing, parts of St Marys, Shalvey, Tregear, Whalan and Willmot.
Arndell Park, Blacktown, Bungarribee, Doonside, Eastern Creek ,Huntingwood, Kings Langley, Kings Park, Lalor Park, Marayong, Prospect, Seven Hills, Toongabbie and Woodcroft .
Acacia Gardens, Colebee, Glenwood, Kellyville Ridge, Marsden Park, Parklea, Quakers Hill, Riverstone, Rouse Hill, Schofields, Shanes Park, Stanhope Gardens, The Ponds and Vineyard.
In 2016, Blacktown City was the second largest local government area in New South Wales. It saw the largest increase in number of people between 2006-2016 (68,697) but saw the 10th highest percentage change, increasing by 24.6% behind Camden (59%), Sydney City (36.2%), and so on. There were an estimated 347,591 residents and a projected population of 521,450 by 2036. The city is growing rapidly through urban development in the North West Growth Centre and established centres such as Blacktown, Mt Druitt, Rooty Hill and Seven Hills. NB: Data in this section compiled from both ABS Estimated Resident Population data and profile.id population forecast data.
2.1 Young people - population and age structure, Blacktown City
In 2016, 59,607 (or 17.7%) of the Blacktown City population were aged between 12 and 24 years. This includes 27,583 (or 8.2%) aged 12-17 years old and 32,024 (or 9.5%) aged 18-24 years old. Since 2011, both age groups for young people increased numerically in Blacktown City, but declined proportionally. When compared to Greater Sydney, Blacktown City had a higher proportion of both 12-17 year olds (Greater Sydney: 6.9%) and 18-24 year olds (Greater Sydney: 9.6%).
Young people - A Social Profile 7

2.2 Where do they live?
While Blacktown City had a high proportion of teenagers aged 12 to 17 years, it is important to note that this varied across the City. Proportions ranged from a low of 5.8% in Marsden Park - Shanes Park - Ropes Crossing to a high of 11.8% in Willmot. The five areas with the highest percentages were: Willmot (11.8%), Bidwill (11.0%), Hassall Grove (10.9%), Oakhurst (10.5%) and Tregear (10.2%).
Figure 2: People aged 12 – 17 years, Blacktown City, 2016
Young people - A Social Profile 8

In 2016, 9.5% of Blacktown City's population was aged between 18 and 24 years compared to 9.6% in Greater Sydney. While Blacktown City had a similar proportion of people aged 18 to 24 years, it is important to note that this varied across the City. Proportions ranged from a low of 6.0% in The Ponds to a high of 12.8% in Hassall Grove. The five areas with the highest percentages were: Hassall Grove (12.8%), Tregear (11.9%), Oakhurst (11.6%), Minchinbury (11.5%) and Woodcroft (11.4%).
Figure 3: People aged 18 – 24 years, Blacktown City, 2016
Young people - A Social Profile 9

2.3 Forecast for young people
The population of young people (10-24 years) is forecast to increase steadily during the next two decades from 72,168 (20.8%) in 2016 to 105,207 in 2036.
Table 2: Forecast population of young people 10 – 24 years
Blacktown City 2016 2026 2036 Change between 2016 and
2036 Age group
(years) Number Blacktown City (%) Number Blacktown
City (%) Number Blacktown City (%) Number
None 1,584 1.9 2.4 2,560 3.7 4.1 4,145 1 hour - 15 hours 4,966 6.0 7.3 8,282 12.0 14.6 13,245 16 hours - 24 hours 4,753 5.8 6.6 8,835 12.8 14.7 13,583 25 hours - 34 hours 5,043 6.1 6.8 9,426 13.7 14.6 14,462 35 hours - 39 hours 21,122 25.6 19.0 18,163 26.3 19.2 39,287 40 hours 21,266 25.8 23.6 12,534 18.2 16.1 33,793 41 hours - 48 hours 8,935 10.8 11.4 3,753 5.4 6.5 12,689 49 hours or more 12,647 15.3 20.8 3,979 5.8 8.4 16,628 Not stated 2,159 2.6 2.2 1,465 2.1 1.8 3,626 Total (Persons in the labour force) 82,475 100 100 68,997 100 100.0 151,458
Source: Population and household forecasts, 2016 to 2036, prepared by .id, the population experts, October 2017.
2.4 Aboriginal and Torres Strait Islander young people
In 2016, 2.8% of Blacktown City's population identified as Aboriginal and/or Torres Strait Islander compared to 1.5% in Greater Sydney. There were 2,650 young people aged 12 to 24 years who identified as Aboriginal and/or Torres Strait Islander - making up 4.4% of the total population of young people and around 27.9% of the total Aboriginal and Torres Strait Islander population.
While Blacktown City had a higher proportion of Aboriginal and/or Torres Strait Islander youth, it is important to note that this varied across the city. The highest Aboriginal youth population in 2016 was in Doonside at 8.3%, while little to no Aboriginal and Torres Strait Islander youth were found in newer suburbs such as Bungarribee and The Ponds.
2.5 Young people born overseas
In 2016, approximately 15,328 young people aged 12 to 24 years were born overseas, representing 25.9% of all young people in Blacktown City.
Approximately 5,689 (20.7%) of those aged 12 to 17 years in Blacktown City were born overseas, compared with 15.4% in Greater Sydney. The top five countries of birth other than Australia for this age group include India (1,061 persons), Philippines (1,023 persons), New Zealand (814 persons), Pakistan (237 persons) and Fiji (195 persons).
Young people - A Social Profile 10

Between 2011 and 2016, the number of people aged 12 to 17 years born overseas increased by 335 or 6.3%, compared to Australian born which increased by 1.6%. The largest increase for an overseas country of birth for those aged 12 to 17 years was India.
Table 3: Country of birth of people aged 12 to 17 years
Blacktown City 12 to 17 years 2016 2011 Change
Birthplace Number Blacktown City (%)
Greater Sydney
(%) Number Blacktown
City (%) Greater Sydney
(%) 2011 to
2016
Total born overseas 5,689 20.7% 15.4% 5,354 20.1% 14.6% +335 Total born Australia 20,471 74.6% 80.2% 20,147 75.6% 80.9% +324 Not stated/ inadequately described
1,266 4.6% 4.3% 1,131 4.2% 4.5% +135
Total people 12-17 years 27,426 100.0% 100.0% 26,632 100.0% 100.0% +794 Source: Australian Bureau of Statistics, Census of Population and Housing, 2011 and 2016. Place of usual residence data. Approximately 9,639 (30.3%) of those aged 18 to 24 years were born overseas, compared to 30.5% in Greater Sydney. The top five countries of birth other than Australia for this age group include India (2,083 persons), Philippines (1,458 persons), New Zealand (1,182 persons), Fiji (429 persons) and Pakistan (412 persons). Between 2011 and 2016, the number of people aged 18 to 24 years born overseas increased by 806 or 9.1%, compared to Australian born at 10.4%. The largest increase for an overseas country of birth for those aged 18 to 24 years was India.
Young people - A Social Profile 11

Table 4: Country of birth of people aged 18 to 24 years
Blacktown City 18 to 24 years 2016 2011 Change
Birthplace Number Blacktown City (%)
Greater Sydney
(%) Number Blacktown
City (%) Greater Sydney
(%) 2011 to
2016
Total born overseas 9,639 30.3% 30.5% 8,833 30.6% 27.5% +806 Total born Australia 20,544 64.6% 63.5% 18,609 64.5% 66.4% +1,935 Not stated/ inadequately described
1,601 5.0% 6.0% 1,404 4.9% 6.1% +197
Total people 18-24 years 31,784 100.0% 100.0% 28,846 100.0% 100.0% +2,938 Source: Australian Bureau of Statistics, Census of Population and Housing, 2011 and 2016. Place of usual residence data.
2.6 Language spoken at home
12-17 year olds
Analysis of the language spoken at home by people aged 12 -17 years in Blacktown City in 2016 shows that 64.7% spoke English only and 31.1% spoke another language with varying levels of English proficiency. When compared to Greater Sydney, there were a lower proportion of 12-17 year olds in Blacktown City that spoke English only (64.7% Blacktown City compared to 67.1% Greater Sydney) and a higher proportion speaking another language with varying levels of English proficiency (31.1% Blacktown City compared to 28.8% Greater Sydney).
Between 2011 and 2016, the number of people aged 12-17 years who spoke a language other than English at home increased by 754 or 9.6%, and the number of people who spoke English only decreased by 86 or -0.5%.
• Other than English, the dominant languages spoken at home by people aged 12-17 years in Blacktown City in 2016 was Arabic (911 persons), Hindi (868 persons), Tagalog (690 persons), Punjabi (590 persons) and Urdu (507 persons). The major differences between the languages spoken at home for 12-17 year olds of Blacktown City and Greater Sydney in 2016 were:
a larger percentage speaking Hindi at home (3.1% compared to 1.0%)
a larger percentage speaking Tagalog at home (2.5% compared to 0.6%)
a larger percentage speaking Punjabi at home (2.1% compared to 0.4%)
a larger percentage speaking Urdu at home (1.8% compared to 0.6%)
a smaller percentage speaking Arabic at home (3.3% compared to 5.0%).
Young people - A Social Profile 12

Between 2011 and 2016, the largest changes in the languages spoken other than English of people aged 12-17 years in Blacktown City were for those speaking Urdu (+169 persons), Punjabi (+115 persons), Arabic (+98 persons) and Hindi (+51 persons).
18-24 year olds
Analysis of the language spoken at home by people aged 18-24 years in Blacktown City in 2016 shows that 59.6% spoke English only and 35.5% spoke another language with varying levels of English proficiency.
When compared to Greater Sydney, there were a higher proportion of 18-24 year olds in Blacktown City that spoke English only (59.6% Blacktown City compared to 55.5% Greater Sydney) and a lower proportion speaking another language with varying levels of English proficiency (35.5% Blacktown City compared to 38.6% Greater Sydney).
Between 2011 and 2016, the number of people aged 18-24 years who spoke a language other than English at home increased by 1,519 persons or 15.4% and the number of people who spoke English only increased by 1,214 or 6.8%.
• Other than English, the dominant languages spoken at home by people aged 18-24 years in Blacktown City in 2016 was Punjabi (1,323 persons), Arabic (1,055 persons), Hindi (1,055 persons), Tagalog (985 persons) and Samoan (538 persons). The major differences between the languages spoken at home for 18-24 year olds of Blacktown City and Greater Sydney in 2016 were:
a larger percentage speaking Hindi at home (3.3% compared to 1.1%)
a larger percentage speaking Tagalog at home (3.1% compared to 0.6%)
a larger percentage speaking Punjabi at home (4.1% compared to 0.7%)
a larger percentage speaking Samoan at home (1.7% compared to 0.5%)
a smaller percentage speaking Arabic at home (3.3% compared to 4.4%).
Between 2011 and 2016, the largest changes in the languages spoken other than English of people aged 18-24 years in Blacktown City were for those speaking Punjabi (+506 persons) and Hindi (+217 persons).
2.7 Education
Analysis of the type of educational institution attended by 15-24 year olds in Blacktown City in 2016 shows that most were in secondary school (27.6%), followed by university (21.5%). 6.2% of young people in the City stated that they were attending TAFE. When compared to
Young people - A Social Profile 13

Greater Sydney, there was a lower proportion of 15-24 year olds in Blacktown City attending university (Greater Sydney: 28.9%) and a higher proportion in secondary school (Greater Sydney: 25.5%) or attending TAFE (Greater Sydney: 5.9%).
The largest changes in the number of young people persons attending educational institutions in Blacktown City between 2011 and 2016 included those attending university (+3,749 persons) and secondary school (+1,478 persons).
The 2016 Census results for persons aged 15-24 years in Blacktown City also found that 6.6% stated they had a bachelor degree (Greater Sydney: 10.4%) and 0.6% stated that they had a post graduate degree (Greater Sydney: 0.8%).
Table 5: Education institution attending
Blacktown City 15-24 year olds (usual residence)
2016 2011 Change
Type of institution Number Blacktown City (%)
Greater Sydney
(%) Number Blacktown
City (%) Greater Sydney
(%) 2011 to
2016
Secondary school 12,733 27.6% 25.5% 11,255 26.6% 25.5% +1,478 Technical or Further Education (TAFE) 2,872 6.2% 5.9% 3,746 8.8% 7.9% -874
University 9,922 21.5% 28.9% 6,709 15.8% 23.8% +3,213 Other institution 849 1.8% 1.9% 660 1.6% 1.6% +189 Not stated / not applicable 19,741 42.8% 37.8% 19,998 47.2% 40.0% -257
Total 15-24 year olds 46,117 100.0% 100.0% 42,368 100.0% 100.0% +3,749 Source: Australian Bureau of Statistics, Census of Population and Housing, 2011 and 2016. Place of usual residence data.
2.8 Employment
Collecting data on youth unemployment can be challenging as young people are often transitioning between employment and education and this can make it difficult to assess their employment status. Youth are defined as individuals aged 15-24 years old.
• In 2016, the youth unemployment rate for Blacktown City was 15.7%. This was higher than the youth unemployment rates for Greater Sydney (13.3%) and NSW (13.6%). When looking at Blacktown’s precincts, Mount Druitt Precinct had the highest youth unemployment rate (18.2%), followed by Blacktown Precinct (15.2%) and North West Precinct (12.9%). The youth unemployment rate varied across the suburbs of the City, ranging from as low as 9.2% in Kings Park and 33.6% in Bidwill.
Young people - A Social Profile 14

• It is important to note that unemployment rates, including for youth, fluctuate over time. The NSW Department of Jobs and Small Business releases regular labour force statistics, including youth unemployment figures. In February 2018, the unemployment rate for persons aged 15-24 years in Blacktown City was 13.4%, but this was still higher than the youth unemployment rate for NSW (10.7%).
2.9 Engaged or disengaged youth
The term “disengaged youth” refers to young people who are not in employment or education. In the 15-24 age group individuals are generally expected to be starting out in life, either in employment or looking for work, in full-time study, or a combination of both. These young people who are not in either of these categories are particularly vulnerable. Large numbers of people in this category indicates a lack of access to employment or education facilities or a population in need of targeted services to assist them in gaining a foothold in society.
In 2016, 10.9% of Blacktown City's population aged 15 to 24 years were not employed or attending an education institute compared to 7.6% in Greater Sydney. While Blacktown City had a higher proportion of 'disengaged youth', it is important to note that this varied across the City. Proportions ranged from a low of 3.6% in Acacia Gardens - Parklea to a high of 30.0% in Bidwill. The five areas with the highest percentages were: Bidwill (30.0%), Emerton (27.2%), Willmot (26.8%), Tregear (24.4%) and Blackett (22.8%).
2.10 Homelessness
Persons aged 12 to 24 years old are often over-represented in the estimated homeless population. The latest homelessness estimates from the 2016 Census show that young people (12-24 years) made up 16% of the NSW total population but accounted for 24% of the NSW homeless population. There are many reasons why young people experience homelessness including poverty, social exclusion, domestic and family violence, and high cost of living (ABS 2018).
The age of homeless persons on a local level are not available, however it was estimated that 1,534 persons in Blacktown City in 2016 were homeless, up from 1,400 persons in 2011 (ABS 2018).
2.11 Young parents
In 2016, 219 births were recorded for mothers aged 12-19 years in Western Sydney Local Health District (1.5% of all births). This was the second highest for local health districts in the Sydney Metropolitan Area following South Western Sydney Local Health District with 297 births (2.9%). In the same year, 1,529 births were recorded for mothers aged 20-24 years in the district (10.4% of all births). This was also the second highest following South Western Sydney Local Health District with 1,921 births (14.0%) (NSW Mothers and Babies Report 2016).
Young people - A Social Profile 15

The Census estimates that there were 177 young parents (15-19 years old) living in Blacktown City in 2016, representing 0.8% of the 15-19 year old population. This was the highest younger parent population in Greater Western Sydney (by number) and was higher than the younger parent rates in Greater Sydney (ABS 2016).
2.12 Need for assistance
In 2016, there were 1,545 persons aged 12-24 years that required assistance with core activities. This represented 2.6% of young people in Blacktown City, slightly higher when compared with Greater Sydney (2.0%). There were slightly more 12-17 year olds (858 persons) than 18-24 year olds (687 persons) that stated they needed assistance in 2016.
Between 2011 and 2016, the number of young people aged 12 to 24 years needing assistance increased by 441 persons or 39.9%. Those aged 18 to 24 years requiring assistance grew at a faster rate than those aged 12 to 17 years.
Table 6: Need for assistance with core activities Blacktown City 2016 2011 Change
Assistance needed by age group (years) Number % of total
age group Greater Sydney
% Number % of total
age group Greater
Sydney % 2011 to
2016
12 to 17 858 3.1 2.6 644 2.4 1.9 +214 18 to 24 687 2.1 1.6 460 1.6 1.2 +227 Total persons 12-24 needing assistance 1,545 2.6 2.0 1,104 2.0 1.5 +441 Source: Australian Bureau of Statistics, Census of Population and Housing, 2011 and 2016. Place of usual residence data.
2.13 Obesity and diabetes
Excess weight in children and younger people increases the risk of poor health later in adulthood. Overweight or obese children are at greater risk of developing chronic conditions such as asthma and type 2 diabetes and may experience negative social and mental wellbeing.
• The most recent overweight and obesity rates for secondary school students (12-17 years old) are available on a Local Health District (LHD) level. In 2014, 24.8% of 12-17 years olds surveyed in Western Sydney and Nepean Blue Mountains LHD were considered overweight and obese, higher than South Western Sydney (27.4%) and all LHDs combined (20.6%). The overweight and obesity rates for Western Sydney and Nepean Blue Mountains LHD have steadily increased over time, up from 20.1% in 2005.
Young people - A Social Profile 16

• Diabetes prevalence among 15-24 year olds is not available on a local level. The NSW rates however show that in 2016-17, 104.7 persons per 100,000 aged 15-24 years had diabetes. Of those, 91.8 persons per 100,000 had type 1 diabetes (91.8) and 12.9 persons per 100,000 had type 2 or other diabetes. Prevalence estimates for all diabetes types have been slowly increasing over time.
Information regarding hospitalisations for diabetes is available at a Local Health District (LHD) level for young people (0-24 years). In 2016-17 in Western Sydney, 65.9 per 100,000 aged 0-24 years were hospitalised with Type 1 diabetes, with 7.9 per 100,000 hospitalised for all other types of diabetes. In South Western Sydney, 79.3 per 100,000 aged 0-24 years were hospitalised with Type 1 diabetes, with 8.3 per 100,000 hospitalised for all other types of diabetes. In Nepean Blue Mountains 92.1 per 100,000 were hospitalised with Type 1 diabetes, with 6.6 per 100,000 hospitalised for all other types of diabetes.
• Behavioural indicators such as physical activity and fruit and vegetable consumption are important in preventing and managing chronic conditions such as overweight/obesity and type 2 diabetes.
• The most recent physical activity rates for secondary school students (12-17 years old) are available on a Local Health District (LHD) level. In 2014, 20.3% of 12-17 years olds surveyed in Western Sydney and Nepean Blue Mountains LHD stated that they received adequate physical activity (more than 300 minutes in the last week), higher than South Western Sydney (15.4%) and slightly lower than all LHDs combined (21.0%). The physical activity rates for Western Sydney and Nepean Blue Mountains LHD have steadily increased over time, up from 12.9% in 2005.
• The most recent fruit and vegetable consumption data for secondary school students (12-17 years old) is also available on a Local Health District (LHD) level. In 2014, 73.0% of 12-17 years olds surveyed in Western Sydney and Nepean Blue Mountains LHD stated that they consumed the recommended daily fruit intake and only 8.7% stated that they consumed the recommended daily vegetable intake. This is lower than the fruit and vegetable intake rates for all LHDs combined (77.7% and 9.9% respectively).
• Interestingly, fruit consumption was higher in young females and vegetable consumption was higher in young males in Western Sydney and Nepean Blue Mountains LHD in 2014. Overall fruit and vegetable consumption in 12-17 year olds decreased in a three year period, down from 77.0% for fruit in 2011 and 13.4% for vegetables in 2011.
Young people - A Social Profile 17

• The Social Health Atlas of Australia also estimates the number of children (4-17 years) with adequate fruit intake on a local government area (LGA) level. In 2014-15, it was estimated that 63.9% of 4-17 year olds in Blacktown LGA consumed the adequate amount of daily fruit. Blacktown LGA had the third lowest fruit consumption rates for 4-17 year olds when compared to other LGAs in Greater Western Sydney.
Table 7: Adequate fruit and vegetable consumption for student and children
Fruit and vegetables: adequate consumption in students (12-17 years old) by LHD, 2011-14 Local Health
Districts, 2011-14 Students (12-17 year olds) Students (12-17 year olds)
2014 2011 Fruit Vegetables Fruit Vegetables
LHD Number Actual
estimate (%)
Number Actual
estimate (%)
Number Actual
estimate (%)
Number Actual
estimate (%)
Western Sydney and Nepean Blue Mountains
884 73.0 886 8.7 1,478 77.0 1,478 13.4
South Western Sydney 753 74.4 753 6.8 968 74.9 966 10.4 All LHDs 5,180 77.7 5,178 9.9 7,837 77.2 7,822 10.9 Source: Health Stats NSW 2018
Estimated number of children (4-17 years) with adequate fruit intake by LGA, 2014-15 2014-15
Local government area Number Rate per
100
The Hills Shire 21,460 69.4
Blue Mountains 9,614 68.9 Hawkesbury 8,870 67.9 Wollondilly 6,629 67.7 Fairfield 24,694 66.5 Parramatta 24,222 65.6 Liverpool 26,773 65.5 Penrith 23,800 65.3 Camden 9,943 64.7 Campbelltown 19,109 64.2 Blacktown 43,762 63.9 Canterbury Bankstown 40,576 63.6 Cumberland 22,556 61.9 Source: Social Health Atlas 2018
Young people - A Social Profile 18

2.14 Addiction
• Smoking and alcohol consumption among secondary school students aged 12 to 17 years in NSW has declined over time. Smoking for this age group decreased from 10.3% in 2005 to 6.7% in 2014 and alcohol consumption decreased from 82.7% in 2005 to 65.1% in 2014. Smoking and alcohol consumption rates for 12-17 year olds are not available on a local level, however they are available for the Western Sydney and Nepean Blue Mountains Local Health Districts (LHDs) (Health Stats NSW 2018).
• In 2014, 9.6% of 12-17 year olds surveyed in the Western Sydney and Nepean Blue Mountains Local Health Districts stated that they had smoked in the past year. This is down from 21.5% of the same age group in 2005 (Health Stats NSW 2018).
• Alcohol consumption among secondary school students also appears to be declining over time. In 2014, 38.3% of 12-17 year olds surveyed in the Western Sydney and Nepean Blue Mountains Local Health Districts stated that they had consumed alcohol in the past year, down from 58.3% in 2005 (Health Stats NSW 2018).
2.15 Psychological distress
• Children and young adults are identified as being at risk of developing mental and behavioural problems from an early age. Girls are more likely to feel unhappy, depressed, nervous or stressed than boys of the same age, but boys are generally less likely to speak about their feelings than girls. Psychological indicators for 12-17 year olds are not available on a local level, however they are available for the Western Sydney and Nepean Blue Mountains Local Health Districts (LHDs) (Health Stats NSW 2018).
• In 2014, 12.8% of 12-17 year olds surveyed in Western Sydney and Nepean Blue Mountains LHDs reported experiencing psychological distress. This decreased from 17.7% in 2005 (Health Stats NSW 2018).
• Psychological distress by Kessler categories (low, moderate, high and very high) were also collected for 12-17 years olds living in the Western Sydney LHD in 2013-15. The survey found that most young people surveyed reported low level of psychological distress (68.3%), followed by a moderate level of psychological distress (22.2%). A total of 9.5% of 12-17 year olds reported high or very high levels of psychological distress. Since 2003-4, high or very high levels of psychological distress among 12-17 year olds have generally decreased but low or medium levels of psychological distress have increased (Health Stats NSW 2018).
Young people - A Social Profile 19

• Suicide and self-harm rates for 15-24 year olds are not available on a local level, but NSW data shows that the suicide rate for this age group in 2015 was 10.6 persons per 100,000, generally increasing over a ten-year period. Intentional self-harm rates for 15-24 year olds in NSW have generally increased since 2001-2, with higher rates of self-harm reported among females than males (Health Stats NSW 2018).
2.16 Other health issues
• The NSW Ministry of Health undertakes a School Student Health Behaviours Survey every three years to provide information about the health behaviours and attitudes of secondary school students in NSW. The last survey was undertaken in 2014, and showed that smoking and alcohol consumption rates were generally down and fresh fruit consumption had increased.
• The previous survey (2011) also showed that 1 in 5 (21.8%) students aged 12–17 years spent most of their time inside, during peak exposure times on sunny summer days, and just under 1 in 2 (43.3%) wore maximum protective sunscreen. For students who were in the summer sun for more than 1 hour, a higher percentage of females aged 12–17 years wore maximum protection sunscreen or sunglasses, than boys of the same age, while a higher percentage of males aged 12–15 years wore a hat or covered most of their body with clothes than other students. Over a quarter of students (26.3%) did not experience sunburn at all in the summer prior to being interviewed, however 1 in 7 (14.8%) experienced sunburn 4 or more times. A large majority (94.4%) of students in 2011 had never used a solarium or sunbed.
2.17 Social capital and young people
Social capital is a term used to describe the social relationships within a group or community that facilitate the group’s cooperation and cohesion. This includes levels of trust between people; whether they have a shared understanding of how they should behave towards, and care for one another; and participation in civic organisations, such as sporting clubs and school councils. It is also used to describe the resources available within communities that are built from networks of mutual support, reciprocity, trust and obligation. It can be accumulated when people interact with each other in families, workplaces, neighbourhoods, local associations and a range of informal and formal meeting places. (ABS, 2000) It can be measured by surveying residents about levels of community belonging, trust, safety, participation and harmony.
Regular community surveys across the city provide a snapshot of community belonging and see how community perceptions vary for each community and target group over time. In previous surveys (2006, 2011), residents from across the city have reported positive levels of ‘feeling that they belong to their community’.
Young people - A Social Profile 20

During March-May 2015, Blacktown City engaged 2155 residents from across the city in a Social Plan 2016 “Have Your Say” survey. The survey included the following social capital questions:
• I feel like I belong in this neighbourhood
• If you had a problem, could you rely on one of your neighbours to help you?
• I feel safe walking down my street
• I speak with my neighbours – frequently, sometimes, never
• How satisfied are you with your local area as a place to live, work and spend time?
The following results are from respondents to the survey aged from 10 – 25 years.
I feel like I belong in this neighbourhood
The majority of young participants reported feeling “they belonged in their neighbourhood” (68%), compared to 79% for all participants. This is response was higher than in 2011, when 56.7% of young people surveyed reported feeling “they belonged in their neighbourhood”.
Figure 4: Belonging
Speaking with neighbours
This was the first time this question was included in the survey and it provides a baseline for comparison for future surveys. Young people were less likely to speak to a neighbor at least once a week (37%) when compared to all participants (43.1%).
40%
4% 23%
28%
5%
Agree
Disagree
Neutral
Strongly agree
Strongly disagree
Young people - A Social Profile 21

Figure 5: Speaking with neighbours
Satisfaction with neighbourhood
The majority of young people were satisfied with their neighbourhood as a place to live work and spend their time (44%) compared to 49.2% for all participants. 6% were very satisfied compared with 18.4% of all participants. In 2011, 41.6% were satisfied and 13.3% were very satisfied.
Figure 6: Satisfied with their local neighbourhood
If you had a problem, could you rely on a neighbour for help?
The majority (55%) reported being able to “rely on a neighbour for help with a problem”. This compared to 64.1 % for all participants. Almost one third (32%) reported they “didn’t know”.
37%
12%
51%
Frequently (at leastonce a week)
Never
Sometimes
6%
26%
44%
10%
14%
Dissatisfied
Neutral
Satisfied
Very dissatisfied
Very satisfied
Young people - A Social Profile 22

Figure 7: Relying on your neighbours
Feeling safe walking down their street
This was the first time this question was included in the survey and it provides a baseline for comparison for future surveys. The majority (47%) reported always feeling safe walking down their street compared to 48.8% for all participants. Young people had a slightly higher rate of “never” feeling safe (9%) when compared to all participants (6%).
Figure 8: Feeling safe in the street
32%
13%
55%
I don't know
No
Yes
47%
9%
45% Always
Never
Sometimes
Young people - A Social Profile 23

Young people - A Social Profile 24

3. What do the community and service providers say?
The results of our community engagement (with residents, workers and service providers) are presented using the World Health Organisation Social Determinants of Health (Wilkinson & Marmot 2003). The social determinants of health are mostly responsible for health inequities - the unfair and avoidable differences in health status seen within and between communities.
The key aspects of social and economic circumstances affecting social wellbeing and health: The social gradient, stress, early life, social exclusion, work, unemployment, social support, addiction food and transport. As a result of the community engagement, we have included an eleventh priority area focussing on how services can be enhanced or supported to improve outcomes for the community: service development.
3.1 Social gradient
• Services say education as a pathway is not valued for young people in Blacktown City as it should be and attainment rates reflect this. It can depend on school, family and other variants.
• Participants and services say young people make deliberate choices to go on benefits as many entry positions pay less than a government benefit/pension (e.g. Newstart).
• Services note a lack of internet access at home is not uncommon for some of our young people and is a major disadvantage to learning. This is compounded by some areas in the city with poor internet access (Riverstone).
• Many of the young people supported by our youth services are unable to read and write.
• Participants and services think education success stories and mentoring might improve how young people view education.
• Aboriginal community members think we need more Aboriginal school counsellors to help our Aboriginal students stay in school.
• Young people in Riverstone who wish to do Year 11 and 12 have to travel to Quakers Hill.
• Some residents say homework clubs help young people who have fallen behind but they are not available in many areas.
• Young people from a CALD background report that the lack of language skills and racism made them feel isolated at school.
Young people - A Social Profile 25

• Services report adjusting to our education system puts children and young people from our migrant and refugee communities at a disadvantage.
• Participants report the cost of renting is out of the reach for many young people
• Many young people feel like growing up in public housing amounts to a 'life sentence' which they cannot escape.
• Homelessness, sleeping in cars and couch surfing is the experience of many young people serviced by youth services in the city.
3.2 Stress
• Many young people say there are plenty of recreational, sporting, social, religious or cultural activities, with lots of things for different age groups and backgrounds.
• However, there are still a number of young people who say there are not enough affordable recreational, sporting, social or cultural activities.
• Young people value having close access to work, facilities and services (libraries, education, shops, health, and community).
• There are few public spaces where young people can gather and feel safe without either the police or other groups of young people intimidating them.
• Many residents report that they like where they live because it is quiet but this is matched equally by residents who dislike the noises in their neighbourhood.
• Residents are concerned about antisocial behaviour towards young people, in their neighbourhoods, around shopping centres, parks and transport interchanges (including drinking alcohol, drug-taking and swearing).
• Young people are concerned about vandalism and graffiti that make some areas look run-down and people feel unsafe.
• Young people are very aware of high crime rates and have concerns about personal and community safety.
• There is community concern about online safety, the use of social media to harass and bully.
• There is a stigma associated with living in particular suburbs or being young and perceived by the community as 'threatening'.
Young people - A Social Profile 26
• Resident young people do not like the distance they have to travel to work, services, friends and family.
• Residents are concerned about the increase of young people and children, in groups, out on the streets at night unsupervised.
• Young people are presenting to some services with anxiety disorders, very low self-esteem and do not know where to get support.
• There are residents who are concerned about climate change and the importance of conservation, restoration and limiting their impacts on the environment.
• While services are seeing an increase in clients willing to seek out help with mental health issues we need more support services for people with mental illness across all target groups including older people and young people. Services are at capacity with long waiting lists for psychologist services.
3.3 Early life
• Targeted, intense support is needed for young parents who are at home and in schools.
• Single parents and young parents continue to need services to support them.
• Affordable, accessible childcare for young parents makes their participation in community life easier.
3.4 Social exclusion
• Young people in rural areas feel excluded and face barriers, perceived and real, to services away from their homes (Riverstone).
• Young people report feeling excluded if they do not fit in with the youth sub-cultures around them.
• Stereotyping of young people as 'ratbags' and 'threatening' makes many feel excluded and unsafe.
• It is important for young people with a disability to be included into mainstream services.
3.5 Work
• Not reported in community engagement.
Young people - A Social Profile 27

3.6 Unemployment
• There are fewer local job opportunities for young people.
• For some young people getting a job is not a high priority, particularly if there are no working role models in your family and community.
• Current courses and training do not always lead to work.
• There are lots of young people not working and not in education.
• Services believe we need more government funding to help young people with skills and employment.
3.7 Social support
• Having supporting families, friends and schools is likely to be the most effective way of intervening to help young people.
• There are not enough programs or services to help young people.
• Many young people see their parents as not supportive or understanding.
• A local service has seen an increase in young people at risk of suicide and self-harm due to family and relationship breakdown.
• Tensions have been found to exist between generations as well as between communities with young people growing up caught between the Australian way of life and that of their parents.
• Residents say they valued Blacktown City as being youthful and friendly where family and close friends live nearby.
3.8 Addiction
• Minimal reporting in community engagement.
3.9 Food
• Minimal reporting in community engagement.
3.10 Transport
• Some residents lack the confidence to use public transport and need support.
• Local transport is too expensive, infrequent and doesn’t take young people where they want or need to go.
Young people - A Social Profile 28

3.11 Service development
• A lack of services and supports for many people including: homeless people, refugees and migrants, young people, people with mental illness, and family violence.
• Services need to be responsive to young people - open when they need them, using the technologies they use, speaking their language.
• Many services report facing uncertainty in regards of funding. This is impacting on service provision, clients and staff.
• There are ongoing issues with funding that divides mental health and drug issues despite the fact that often these are inextricable problems.
• Residents say that they would like to see cultural competency and awareness training for non-Aboriginal and Torres Strait Islander staff working with Aboriginal communities.
• A sample survey of local organisations shows a high staff turn-over in community services due to both the aging workforce and uncertainty of the sector.
• Job certainty is a real concern with many staff on contracts until changes in funding models is completed by the state government.
• Many organisations are concerned about the stress on staff having to 'do more with less', an impact of funding changes and the uncertainty in the sector.
• The need for services to keep up with social media as an important way to share information about what they do.
• There continue to be challenges on sharing information with the community about the services available to them. This particularly impacts those who are disengaged and isolated.
• There continues to be disconnection amongst services and a need for improved partnerships, collaboration and service integration, insufficient resources is often argued as a reason why this occurs.
• Services are concerned about the current referral system for older people
• The service interagencies in the city help planning and partnerships and improve outcomes for communities.
• The sector is seeing big changes, particularly in the models of care. While these will improve service to clients the changes are challenging to manage
Young people - A Social Profile 29

• It is challenging for services to keep up with sector changes and changing government priorities. This is made more difficult as there is very little information available from funding departments.
Young people - A Social Profile 30