Embed Size (px)
Citation preview

DIVERSE INTELLIGENCE SERIES
YOUNG, CONNECTED AND BLACKAFRICAN-AMERICAN MILLENNIALS ARE DRIVING SOCIAL CHANGE AND LEADING DIGITAL ADVANCEMENT
2016 REPORT

YOUNG, CONNECTED AND BLACK2
Saul RosenbergChief Content Officer
FOREWORD“Young, Connected and Black” continues a dialogue started in the 2015 Diverse
Intelligence Series report—“Increasingly Affluent, Educated and Diverse, African-
American Consumers: The Untold Story.” This latest report highlights African-
Americans’ economic and cultural gains and continues to shine a spotlight on
how African-American Millennials are forging ahead in their use of technology
and social media to raise awareness and evoke a national discussion on civic and
political issues. African-American Millennials are expanding the use of mobile
devices (particularly smartphones with a 91% penetration rate for all African-
Americans), expanding their shopping carts with fresh foods and contributing
to the diversification of mainstream primetime television viewership —forging a
significant increase in advertising dollars focused on African-American audiences.
African-Americans are also making impressive gains in high school and college
achievement. Fully 89% of African-American Millennials ages 25–34 completed
high school, compared to 77% of those who are ages 55 and older, and 21% of
Black Millennials ages 25–34 have an associate's degree or higher versus 17% of
those 55 and older.
A rise in educational advancement leads to increased buying power. In 2015,
African-Americans controlled almost $1.2 trillion in buying power, 8.6% of the
nation’s total—a 21% increase over 2010, according to the Selig Center for
Economic Growth. African-American household income growth remains steady.
The share of African-American households with an income under $25,000 declined
from 43% in 2004 to 37% in 2014, while the share of households with annual
incomes over $100,000 increased from 7% in 2004 to 12% in 2014.
African-Americans are optimistic about America’s future, and they are catalysts
of change. As African-Americans, particularly younger Millennials, continue
to develop and expand their influence on mainstream America, companies
are making changes to reach this culture-rich group with unique, captivating
campaigns, as well as products and services that meet their needs.
Since 2011, Nielsen has provided a comprehensive annual report focused on
African-Americans’ unique media consumption and purchasing habits along with
relevant community topics that change year to year. This report is a collaboration
with Nielsen’s External African-American Advisory Council and its sub-committee
members: Eugene Campbell (co-chair), Reverend Jacques DeGraff, Adonis
Hoffman (co-chair) and Deborah Gray-Young. We are grateful for their support and
involvement throughout.
Cheryl Grace Senior Vice President
U.S. Strategic Community Alliances
and Consumer Engagement

Copyright © 2016 The Nielsen Company 3
EXECUTIVE SUMMARYAfrican-Americans are exuberant and reflective—optimistic about
present-day advances in income, education, entrepreneurship and
healthcare, and determined to forge a better future as influential leaders
and catalysts of social awareness against discrimination and social
injustice. With incomes steadily rising at a rate that outpaces that of the
general population, African-Americans’ buying power is expected to grow
21.6% between now and 2020, by which time it will reach just over $1.4
trillion, according to the Selig Center for Economic Growth.
Led by tech-savvy Millennials, who regard and use technology and social
media as extensions of their identity, African-Americans are adept at
using and leveraging digital platforms to communicate with each other
and the world around them.
African-American consumers are focused on eating well and looking
good, over-indexing across a wide variety of product categories, ranging
from beauty products to fresh foods and ingredients that reflect their
proud heritage and cultural traditions. Given the combination of African-
Americans’ penchant for fresh foods and a need for meals on-the-go,
there is a clear opportunity for innovation and new-product development
in the convenient-healthy eating space.
Black advancement is a multi-generational affair, powered by a civil
rights legacy that guides and inspires older African-Americans even as
younger Blacks solidify and expand their role as cultural influencers in a
pan-cultural American mainstream.
Capital gains. African-Americans have shown strong income growth
over the last decade. The percentage of Black households with annual
incomes over $100,000 increased from 7% in 2004 to 12% in 2014, and
the percentage increase in the number of African-American households
making $50,000 or more per year has been greater for African-Americans
than it has for the nation as a whole, with the number of Black
households with incomes between $50,000 and $75,000 increasing 18%
between 2004 and 2014, compared to 2% for the total U.S. The share of
those households with an income under $25,000 declined from 43% in
2004 to 37% of the total African-American population in 2014.

YOUNG, CONNECTED AND BLACK4
Viral empowered persuaders. Technology and social media is
transforming and elevating the way in which African-Americans use their
mobile devices. African-Americans are the second-largest multicultural
group with regard to smartphone ownership, with 91% of Blacks owning
smartphones (compared to 94% of Asian-Americans, and 90% of
Hispanics).* The use of social media for community-based activism
brought national awareness to issues affecting the Black community, and
African-Americans, especially Millennials, are leading the charge to bring
about institutional change. The #BlackLivesMatter, #BankBlack, and
#OscarsSoWhite social media movements, all of which sparked national
conversations, are just three viral examples of how savvy applications
of social media and technology are increasingly able to focus national
attention on issues of social, civic and political importance.
Valuing the beauty within. Personal image is highly valued and is
regarded with an immense sense of pride in the African-American
community. African-American Millennials have higher buying rates (per
household) for hair care products and personal soap and bath products
than their Millennial counterparts. African-Americans 35 and older also
over-indexed (per household) against their counterparts for purchasing
these items, as well as men’s toiletries.
Cooking with tradition and a need for speed. African-American shopping
norms show that these households over-index for cooking from scratch
and using fresh foods, and the majority agree they usually plan meals
ahead of time, cook meals frequently, and prefer cooking with fresh
foods. African-American households also are filling their pantries
with the spices and ingredients of regional dishes that reflect their
roots, over-indexing on a variety of pork and poultry cuts, seafood,
greens, cabbage, green beans, and dried vegetables and grains. But
busy lives and a need for convenience and speed show that there is a
clear opportunity for innovation and new product development in the
convenient-healthy eating space.
Optimism about the future. In 2012, for the first time in American
history, African-Americans had the highest rate of voter registration
and turnout of all races, surpassing non-Hispanic Whites in election
turnout at 66% versus 64%. And while the majority of African-Americans
are optimistic that the country is headed in the right direction, there
is an ongoing need in their communities for more affordable housing,
healthcare, childcare and higher education.
*Source: Nielsen Mobile Insights, April 11, 2016–June 30, 2016. Mobile device penetration among mobile subscribers 13+.
Note: For the purposes of this report, African-American and Black are used interchangeably.

Copyright © 2016 The Nielsen Company 5
CONTENTSSECTION I—AFRICAN-AMERICAN DEMOGRAPHIC GAINS ....................................................... 6Population growth ......................................................................................................... 6A generational shift ....................................................................................................... 7Educational advancement ............................................................................................ 8Increasing entrepreneurship. ........................................................................................ 9Household income ....................................................................................................... 12
SECTION II—VIRAL EMPOWERED PERSUADERS ........... 14A viral vanguard ............................................................................................................ 14Social media is driving change .................................................................................... 17Mobile trendsetters: Closing the (mobile) digital divide .......................................... 18Vigorous video content consumers ........................................................................... 20Radio .............................................................................................................................. 21TV—African-Americans are moving ahead in creating and acting, as well as watching ....................................................................................................... 22More diverse content drives increased ad spend ...................................................... 26Gaming attitudes are competitive ............................................................................. 28
SECTION III—CONSUMPTION GAINS OUTPACE THE TOTAL POPULATION ........................................................... 31Buying power gains and state distribution ................................................................. 31Feeling proud, looking good and spending more ..................................................... 33Cooking from scratch is valued, but speed and efficiency are key ......................... 36High-frequency shopping channels .......................................................................... 40Purchase influencers ................................................................................................... 42
SECTION IV—REACHING HIGHER—BUILDING ON RECENT GAINS .................................................................... 46Building on the legacy of America’s first African-American presidency .............. 46Eligible voters............................................................................................................... 48Healthcare gains .......................................................................................................... 49Optimism about the future ....................................................................................... 50
CONCLUSION ....................................................................... 52
METHODOLOGIES .............................................................. 53

YOUNG, CONNECTED AND BLACK6
SECTION IAFRICAN-AMERICAN DEMOGRAPHIC GAINS
POPULATION GROWTHAfrican-Americans continue to represent a significant percentage of
growth in the U.S. population. Having grown 21% between 2004 and 2014,
the U.S. Black population is currently at 46.3 million* (14% of the total
U.S. population), according to the most recent U.S. Census information.
Ninety-one percent of U.S. African-Americans were native-born as of 2014,
but the foreign-born population, primarily from Jamaica, Haiti, and other
African and Caribbean countries is growing rapidly, having increased 40%
between 2004 and 2014.
The U.S. is increasingly diverse and younger, which has largely been driven
by Millennials, those born between 1982 and 2000, according to the U.S.
Census. There are 83.1 million Millennials currently in the U.S. and of
which African-American Millennials comprise 14% (about 11.5 million).**
African-American Millennials comprise 25% (about 11.4 million) of the
total Black population.
* Source: U.S. Census 2014 ACS 1-year PUMS Data tabulated by EthniFacts.**Note: In this report, unless otherwise noted, Millennials are between the ages of 18 and 34.
U.S. AFRICAN-AMERICAN POPULATION
Source: U.S. Census Bureau, 2004, 2009, and 2014 American Community Survey; Black race plus Black race in combination with any other race.
2004 2009 2014
36.646.341.0
(MILLIONS)AFRICAN-AMERICAN MILLENNIALS COMPRISE
14% OF THE TOTAL U.S.
MILLENNIAL POPULATION

Copyright © 2016 The Nielsen Company 7
AFRICAN-AMERICAN DEMOGRAPHIC GAINSA GENERATIONAL SHIFTAlthough African-Americans are a relatively young population, with
a median age of 33.4 versus 40.4 for Whites and 36.5 for Asians, the
African-American population is aging, even as the U.S. is getting
younger. While the number of African-Americans under 18 increased by
5% between 2004 and 2014, minors represented 33% of the total Black
population in 2004, but only 28% in 2014. Meanwhile, the number of
African-Americans ages 18–34 and 35–54 grew in number by 33% and
10%, respectively, but maintained relatively steady shares of the total
Black population. The 55 and older age group grew by 55%, increasing
from 16% of the total African-American population to 20% during the
same time period.
As the African-American population ages, distinct differences can be
seen among the generations, from shopping behaviors to media usage
and voting participation, which will be discussed throughout the report.
Source: U.S. Census Bureau, 2004, and 2014 American Community Survey; Black race plus Black race in combination with any other race. Percentages may not add to 100% due to rounding.
AGING AFRICAN-AMERICAN POPULATION
2004 2014
55+
35–54
18–34
UNDER 18
16%
28%
24%
33%
20%
25%
26%
28%

YOUNG, CONNECTED AND BLACK8
EDUCATIONAL ADVANCEMENTEducational progress continues when it comes to high school and
college achievement, with African-American women making the most
gains. Based on the most recent Census data, the high school dropout
rate for the total African-American population declined from 21% in
2004 to 16% in 2014. In 2014, as previously reported in last year’s
report, 70.9% of African-American recent high school graduates enrolled
in college, dramatically up from 59.3% in 2013, exceeding the college
enrollment rate of Whites (67.3%), according to U.S. Bureau of Labor
Statistics.
Of the degrees awarded in the U.S. from 2012 to 2013, Blacks received
10% of the bachelor’s degrees, 12% of the master’s degrees, and 7%
of the doctorates. Black women outpaced their male counterparts,
receiving 65% of the bachelor’s degrees, 70% of the master’s degrees,
and 64% of the doctorate degrees awarded to Blacks.
AFRICAN-AMERICAN MALE
AFRICAN-AMERICAN FEMALE
TOTALAFRICAN-AMERICAN
6%9%7%
33%
12% 11%13%
31%35%
32% 35%29%
16% 17%15%
SOME COLLEGE ORASSOCIATE’S DEGREE
BACHELOR’S DEGREE
MASTER’S DEGREEOR HIGHER
LESS THAN HIGH SCHOOL DEGREE
HIGH SCHOOLDIPLOMA OR GED
Source: U.S. Census Bureau, 2014 American Community Survey; African-Americans 25+.
AFRICAN-AMERICAN WOMEN EXCEL IN HIGHER EDUCATION
AFRICAN-AMERICAN EDUCATIONAL ATTAINMENT BY GENDER, 2014

Copyright © 2016 The Nielsen Company 9
Source: U.S. Census Bureau, 2014 American Community Survey; African-Americans 25+.
AFRICAN-AMERICAN EDUCATIONAL ATTAINMENT BY AGE, 2014
25–34 55 & OLDERTOTAL 35–54
6% 7%7%
33%
12% 15% 10%
38%
28%32%30%
32%
16% 12% 23%8%
13%
35%
32%
12%
SOME COLLEGE ORASSOCIATE’S DEGREE
BACHELOR’S DEGREE
MASTERS DEGREEOR HIGHER
LESS THAN HIGH SCHOOL DEGREE
HIGH SCHOOLDIPLOMA OR GED
When looking at Black education attainment by age group, today’s
Millennials are outpacing older generations by impressive margins. Fully,
89% of Black Millennials ages 25–34 completed high school, compared
to 77% of those 55 and older. Furthermore, 21% of Black Millennials ages
25–34 have an associate's degree or higher, versus 17% of those who are
55 and older. Further, the higher education attainment levels for Black
Millennials may see a sharp increase over the next few years, because
29% of African-Americans 18–34 say they intend to go back to school for
a degree or certification in the next 12 months.
YOUNG, CONNECTED AND BLACK10
1992–1997 1997–2002 2002–2007 2007–2012
ALL U.S. BUSINESSES ALL FEMALE BUSINESSES
ALL BLACK FEMALE BUSINESSES
33%
45%
75%
18%
60%
20%
67%
2%
34%
67%
27%20%21%
13% 10%
-8%
ALL BLACK BUSINESSES
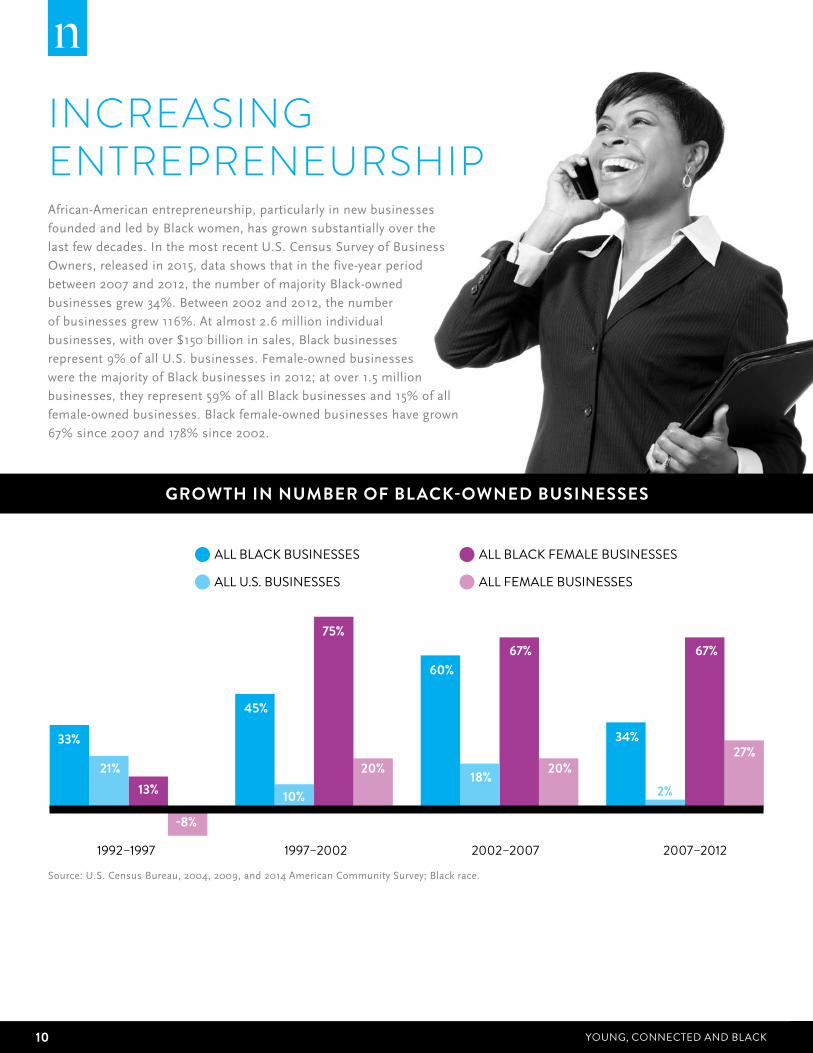
INCREASING ENTREPRENEURSHIPAfrican-American entrepreneurship, particularly in new businesses
founded and led by Black women, has grown substantially over the
last few decades. In the most recent U.S. Census Survey of Business
Owners, released in 2015, data shows that in the five-year period
between 2007 and 2012, the number of majority Black-owned
businesses grew 34%. Between 2002 and 2012, the number
of businesses grew 116%. At almost 2.6 million individual
businesses, with over $150 billion in sales, Black businesses
represent 9% of all U.S. businesses. Female-owned businesses
were the majority of Black businesses in 2012; at over 1.5 million
businesses, they represent 59% of all Black businesses and 15% of all
female-owned businesses. Black female-owned businesses have grown
67% since 2007 and 178% since 2002.
Source: U.S. Census Bureau, 2004, 2009, and 2014 American Community Survey; Black race.
GROWTH IN NUMBER OF BLACK-OWNED BUSINESSES

Copyright © 2016 The Nielsen Company 11
Aside from “non-specified other” services, which account for 25% of
all Black-owned businesses, the industries with the most Black-owned
businesses are healthcare and social assistance (19% of all Black-owned
businesses), and administration, waste management and remediation
services (11% of all Black-owned businesses).
AFRICAN-AMERICAN FIRMS BY INDUSTRY
Source: U.S. Census Bureau, Survey of Business Owners, majority-Black-owned businesses, 2012 (information released in 2015).
25%
19%
11%
8%
7%
6%
5%
5%
3%
3%
2%
2%
1%
1%
1%
OTHER SERVICES(EXCEPT PUBLIC ADMINISTRATION)
PROFESSIONAL/SCIENTIFIC/TECHNICAL SERVICES
RETAIL TRADE
HEALTH CARE/SOCIAL ASSISTANCE
ACCOMODATION/FOOD SERVICES
REAL ESTATE/RENTAL/LEASING
TRANSPORTATION/WAREHOUSING
CONSTRUCTION
WHOLESALE TRADE
ADMINISTRATIVE/SUPPORT/WASTEMANAGEMENT/REMEDIATION SERVICES
ARTS/ENTERTAINMENT/RECREATION
EDUCATIONAL SERVICES
FINANCE/INSURANCE
INFORMATION
MANUFACTURING

YOUNG, CONNECTED AND BLACK12
2004 2009 2014
43%
28%
15%
7%7%
40%
27%
15%
8%10%
37%
26%
16%
9%
12%
$50,000–$74,999
$75,000–$99,999
$100,000
$0–$24,999
$25,000–$49,999
HOUSEHOLD INCOMEAfrican-Americans have shown steady and at times significant income
growth in certain brackets over the last decade: The share of those
households with an income under $25,000 declined from 43% in 2004 to
37% of the total African-American population in 2014. For the $25,000-
$50,000 bracket, the decline was from 28% to 26%. Meanwhile, the share
of households with annual incomes from $50,000-$75,000 and $75,000-
$100,000 increased from 15% to 16% and from 7% to 9%, respectively. The
share of households with annual incomes over $100,00 increased from
7% to 12%. These figures are not inflation-adjusted, but comparisons with
the broader population clarify the picture. The percentage increase in the
number of African-American households making $50,000 or more per year
has been greater for African-Americans than it has been for the nation as
a whole. From 2004 to 2014, the number of Black households with annual
incomes between $50,000 and $75,000 increased 18%, compared with 2%
for the total U.S. During the same period, the number of Black households
earning between $75,000 and $100,000 per year increased 35%, compared
to 16% for the total U.S., and the number of Black households earning
$100,000 or more increased 95%, compared to 66% for the total U.S.
Meanwhile, the number of Black households in the up to $25,000 income
bracket decreased 4% as compared to an 11% decrease for the nation, and
the number in the $25,000 to $50,000 income bracket increased by 3%, as
compared to a decrease of 9% for the nation as a whole.
Source: U.S. Census Bureau, 2004, 2009, and 2014 American Community Survey; Black race.
U.S. BLACK HOUSEHOLD INCOME
(NOT ADJUSTED FOR INFLATION)

Copyright © 2016 The Nielsen Company 13
U.S. BLACK HOUSEHOLD INCOME
AFRICAN-AMERICANS ARE MAKING ECONOMIC GAINS AND REACHING HIGHER
African-Americans are a relatively young population; however, they are aging with the under-18 share of the
population decreasing and the share who are 55+ increasing. The total Black population is currently at 46.3
million (14% of the total U.S. population), with an increasing degree of population growth coming from
older adults and those who are foreign born.
Progress continues in African-American educational advancement and entrepreneurship, with Black women
leading the way. In education, high school dropout rates continue to decline and college enrollment rates
are increasing. Black women have outpaced their male counterparts in terms of both the percentage of
degrees awarded to African-Americans and level of educational attainment.
African-American entrepreneurship, particularly in businesses founded and led by Black women, has grown
substantially over the last few decades. At almost 2.6 million individual businesses, Black businesses
represent 9% of all U.S. firms, with female-owned businesses being the majority (59%) of Black firms.
African-Americans have also shown income growth over the last decade: The share of households with
incomes under $25,000 declined, the share of households with incomes over $100,000 increased.
Additionally, the percentage increase in the number of African-American households making $50,000 or
more per year has been greater for African-Americans than it has been for the nation as a whole. All of
these advancements are contributing to increased Black buying power, as well as to a more sophisticated,
savvy and largely female-driven African-American market.

YOUNG, CONNECTED AND BLACK14
VIRAL EMPOWERED PERSUADERS
The rising visibility and influence of Black consumers is making a profound
and far-reaching impact when it comes to social media usage, television
programming diversification, sports-viewing, technology adoption, and social
activism.
A VIRAL VANGUARDLed by tech-savvy Millennials who regard and use technology and social
media almost as extensions of their personal identity, African-Americans have
become adept at using digital platforms and apps to communicate with each
other and the world around them. Although Black Millennials under-index
for the percentage of leisure time spent on social networking sites (8%),
they over-index for the actual number of hours spent. Fifty-five percent of
Black Millennials say they spend an hour or more daily on social networking
sites, which is 11% higher than the total Millennial population. Additionally,
29% of Black Millennials say they spend three or more hours daily on
social networking sites, an amount that is 44% higher than that of the total
Millennial population.
SECTION II
Copyright © 2016 The Nielsen Company 15
VIRAL EMPOWERED PERSUADERS
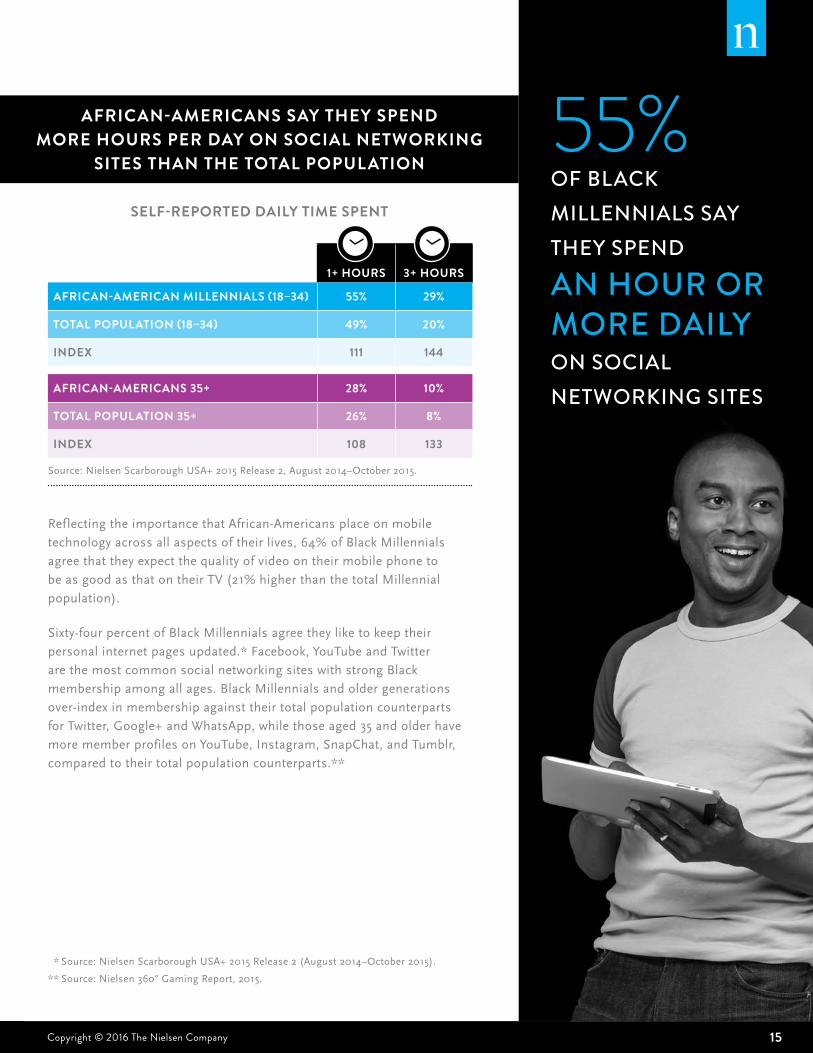
AFRICAN-AMERICANS SAY THEY SPEND MORE HOURS PER DAY ON SOCIAL NETWORKING
SITES THAN THE TOTAL POPULATION
Reflecting the importance that African-Americans place on mobile
technology across all aspects of their lives, 64% of Black Millennials
agree that they expect the quality of video on their mobile phone to
be as good as that on their TV (21% higher than the total Millennial
population).
Sixty-four percent of Black Millennials agree they like to keep their
personal internet pages updated.* Facebook, YouTube and Twitter
are the most common social networking sites with strong Black
membership among all ages. Black Millennials and older generations
over-index in membership against their total population counterparts
for Twitter, Google+ and WhatsApp, while those aged 35 and older have
more member profiles on YouTube, Instagram, SnapChat, and Tumblr,
compared to their total population counterparts.**
1+ HOURS 3+ HOURS
AFRICAN-AMERICAN MILLENNIALS (18–34) 55% 29%
TOTAL POPULATION (18–34) 49% 20%
INDEX 111 144
AFRICAN-AMERICANS 35+ 28% 10%
TOTAL POPULATION 35+ 26% 8%
INDEX 108 133
Source: Nielsen Scarborough USA+ 2015 Release 2, August 2014–October 2015.
55% OF BLACK MILLENNIALS SAY THEY SPEND
AN HOUR OR MORE DAILY ON SOCIAL NETWORKING SITES
SELF-REPORTED DAILY TIME SPENT
* Source: Nielsen Scarborough USA+ 2015 Release 2 (August 2014–October 2015).
** Source: Nielsen 360° Gaming Report, 2015.

YOUNG, CONNECTED AND BLACK16
SOCIAL NETWORKING SITE MEMBERSHIP
Source: Nielsen 360° Gaming Report, 2015.
85% 80%
72%84%
57% 40%
58%56%
46% 38%
45%48%
48% 35%
32%41%
41% 28%
42%55%
55% 24%
30%42%
36% 9%
12%35%
20% 8%
13%22%
15% 6%
11%21%
AFRICAN-AMERICANMILLENNIALS (18–34)
TOTAL POPULATION(18–34)
AFRICAN-AMERICANS(35+)
TOTAL POPULATION(35+)
YOUTUBE
GOOGLE+
SNAPCHAT
TUMBLR
Copyright © 2016 The Nielsen Company 17
SOCIAL NETWORKING SITE MEMBERSHIP SOCIAL MEDIA IS DRIVING CHANGEIn addition to interacting on social media for maintaining relationships
with colleagues, family, and friends, or for engaging with products
and celebrities, African-Americans, particularly Millennials, have
elevated the platform to a usage level far beyond just communicating,
entertainment and shopping. They are using social media to raise
awareness of the situation of the Black community in American society.
The grassroots #BlackLivesMatter movement, which began in 2012,
has since become an ideological and political organization, with the
goal of raising the national consciousness of social justice issues
facing the Black community.
The hashtag #OscarsSoWhite is another example of social media
driving change in the media industry. In response to the lack of
diversity in actor nominations in nearly all categories in the 2015
Oscar nominations, the hashtag was born. The Academy of Motion
Picture Arts and Sciences, the Oscars’ governing body, responded. The
most recent invitee list to the academy’s class of 2016 reflects a step
toward increased diversity among its membership. Of the 683 actors,
directors, producers and executives invited in 2016, 46% were women,
compared to 25% previously, and 41% were people of color, compared
to 8% previously, demonstrating the power of social media to drive
awareness and evoke change.
SOCIAL SPOTLIGHTIn the wake of social-issue protests earlier this year, hip-hop artist Killer Mike offered an economic solution to help the
Black community. A hashtag – #bankblack – laid the foundation for a plan encouraging at least one million African-
Americans to deposit $100 in Black-owned banks in America. MTV News and BET News hosted a joint town hall to address
the issues and also offer possible solutions. Citizen’s Trust, an Atlanta-based bank, experienced an increase in deposits,
as 8,000 people opened new accounts for a total of about $800,000 in deposits. The CEO of the bank tweeted Killer Mike
to thank him for his contributions to beginning the dialogue that shifted the focus from disappointment to empowerment.
There were 23 Black-owned banks as of March 31, according to the U.S. Federal Reserve. According to Nielsen Scarborough,
African-Americans of all ages say they will recommend a financial product or service to someone else, and regularly read
financial publications.*
*Source: Nielsen Scarborough USA+ 2015 Release 2 (August 2014–October 2015).
62%OF AFRICAN-AMERICAN MILLENNIALS SAY THEY WOULD RECOMMEND A FINANCIAL PRODUCT OR SERVICE IF THEY LIKE IT

YOUNG, CONNECTED AND BLACK18
MOBILE TRENDSETTERSCLOSING THE (MOBILE) DIGITAL DIVIDE The digital divide for multicultural consumers with regard to mobile internet
access has been closing rapidly in recent years, and in 2015, African-Americans
are leading the way: 91% of African-Americans say they access the internet via a
smartphone or broadband, up from 86% the year prior—outpacing other racial/
ethnic groups by six percent. African-Americans are not only showing the largest
increase in mobile internet access, but they are the second-largest multicultural
group for mobile device ownership, with 91% owning smartphones (compared
to 94% of Asian-Americans, and 90% of Hispanics).*
That said, penetration is lower for both computer and tablet ownership among
African-Americans. Forty-five percent of African-Americans own desktop or
laptop computers (compared to 79% of Whites), and 38% of African-Americans
own tablets (compared to 47% of Whites). As noted, mobile devices (particularly
smartphones) have been the catalysts in bringing a heightened awareness of
social issues via social media, highlighting the devices’ importance to African-
Americans. Recognizing that importance, marketers looking to connect with
African-Americans, particularly Millennials, must include mobile as an essential
element in their strategic plans.
*Source: Nielsen Mobile Insights, April 11, 2016–June 30, 2016. Mobile device penetration among mobile subscribers 13+.
HISPANIC
ASIAN-AMERICAN
WHITE ANDNON-HISPANIC
AFRICAN-AMERICAN
TOTAL
91%
95%
93%90%
86%
93%
97%96%
93%91%
3%CHANGE
6%CHANGE
2%CHANGE
1%CHANGE
2%CHANGE
AUGUST 2015 AUGUST 2016
MOBILE INTERNET USE ON THE RISE AMONG AFRICAN-AMERICANS
Source: Nielsen National People Meter (NPM), based on average scaled installed August 15, 2016 versus August 15, 2015 among households with one or more smartphone or high speed internet connection.
INTERNET PENETRATION AMONG TV HOUSEHOLDS WITH ONE OR MORE SMARTPHONE OR HIGH SPEED INTERNET CONNECTION

Copyright © 2016 The Nielsen Company 19
On a self-reported basis, African-Americans of all ages are more likely
than their counterparts to agree that they are among the first of their
friends and colleagues to try new technology. The majority are fascinated
by new technology, enjoy learning about technology from others and
will typically recommend a technology or electronics product they like to
people they know.
AFRICAN-AMERICAN MILLENNIALS ARE TECH TRAILBLAZERS
AFRICAN-AMERICAN
MILLENNIALS (18–34)
TOTAL MILLENNIALS
(18–34) INDEX
AFRICAN-
AMERICANS (35+)
TOTAL POPULATION
(35+) INDEX
I AM AMONG THE FIRST OF MY FRIENDS AND COLLEAGUES TO TRY NEW TECHNOLOGY PRODUCTS
41% 33% 125 29% 24% 119
I ENJOY LEARNING ABOUT TECHNOLOGY OR ELECTRONIC PRODUCTS FROM OTHERS
68% 65% 105 57% 54% 105
I GIVE OTHERS ADVICE WHEN THEY ARE LOOKING TO BUY TECHNOLOGY OR ELECTRONICS PRODUCTS
52% 49% 106 37% 32% 115
I OFTEN TAKE THE OPPORTUNITY TO DISCUSS MY KNOWLEDGE OF TECHNOLOGY OR ELECTRONIC PRODUCTS WITH OTHERS
49% 41% 120 36% 29% 125
I WANT OTHERS TO SAY “WOW” WHEN THEY SEE MY ELECTRONICS
43% 33% 131 28% 19% 145
I’M FASCINATED BY NEW TECHNOLOGY
70% 67% 105 58% 54% 108
WHEN I FIND A TECHNOLOGY OR ELECTRONICS PRODUCT I LIKE, I TYPICALLY RECOMMEND IT TO PEOPLE I KNOW
68% 68% 100 51% 53% 96
Source: Nielsen Scarborough USA+ 2015 Release 2 (August 2014–October 2015).
PERCENT WHO SAY THEY COMPLETELY AGREE OR SOMEWHAT AGREE

YOUNG, CONNECTED AND BLACK20
VIGOROUS VIDEO CONTENT CONSUMERS African-Americans are vigorous viewers of television and video,
particularly live TV, with Millennial Blacks spending almost 33 hours per
week watching live plus time-shifted TV, a rate 61% higher than their
total market counterparts and African-Americans 35 to 49 spending 48
hours per week, a rate 49% higher than their total market counterparts.
The same holds true for watching video on PCs and smartphones, which
Black Millennials watch at rates 48% and 23% higher, respectively, than
their total market counterparts, and African-Americans ages 35 to 49
watch at rates 45% and 32% higher, respectively.
AFRICAN-AMERICANS’ WEEKLY TIME SPENT ON DEVICES, BY AGE
AFRICAN-AMERICAN
MILLENNIALS (18–34)
TOTALMILLENNIALS
(18–34) INDEX
AFRICAN-AMERICANS
(35–49)
TOTALPOPULATION
(35–49) INDEX
LIVE + DVR/TIME-SHIFTED TV 32:51 20:24 161 47:58 32:07 149
DVR/TIME-SHIFTED TV 2:25 2:22 102 4:20 4:22 99
AM/FM RADIO 11:00 10:54 101 14:00 13:40 102
DVD/BLU-RAY DEVICE 0:59 0:59 100 1:10 1:05 108
GAME CONSOLE 3:33 3:44 95 1:22 1:30 91
MULTIMEDIA DEVICE 1:54 2:19 82 1:31 1:44 88
INTERNET ON A PC 8:29 6:28 131 9:10 8:20 110
VIDEO ON A PC 3:47 2:33 148 3:12 2:12 145
APP/WEB ON A SMARTPHONE 13:28 14:23 94 14:56 14:34 103
VIDEO ON A SMARTPHONE 0:50 0:41 123 0:34 0:25 132
Sources: Nielsen Live+DVR/Time-shifted TV, DVR/Time-shifted TV, DVD/Blu-Ray Device, Game Consoles, Multimedia Devices December 28, 2015– March 27, 2016 via Nielsen NPOWER/National Panel; Radio, March 26, 2015–March 23, 2016 via RADAR 129; PC, January 1, 2016–March 31, 2016 via Nielsen Netview and Nielsen VideoCensus; Mobile, January 1, 2016–March 31, 2016 via Nielsen Electronic Mobile Measurement.

Copyright © 2016 The Nielsen Company 21
RADIOAfrican-American adults have different preferences when it comes to
AM/FM radio. Black Millennials favor Urban Contemporary (Hip-Hop)
while African-Americans 35 and older prefer Urban Adult Contemporary
(R&B). Worthy of call out is the multi-year growth of the Urban
Contemporary format among both demo groups. From 2012–2016, the
number of Urban Contemporary stations increased 23% (178 versus
219, respectively) while the number of Rhythmic Contemporary Hit
radio stations decreased 3% during the same time period (213 and 206,
respectively). Radio stations playing hip-hop have seen listenership
increase at the expense of more “pop” oriented formats like
Rhythmic Contemporary Hit radio.
RADIO LISTENERSHIP AMONG AFRICAN-AMERICANS, BY AGE
SHARE OF TOTAL LISTENING
AFRICAN-AMERICAN MILLENNIALS (18–34)Q2
2012Q2
2013Q2
2014Q2
2015Q2
2016
URBAN ADULT CONTEMPORARY 21.8% 21.1% 22.0% 21.0% 21.1%
URBAN CONTEMPORARY 30.6% 32.3% 32.1% 33.7% 33.3%
RHYTHMIC CONTEMPORARY HIT RADIO 15.6% 14.2% 12.5% 11.1% 10.4%
URBAN OLDIES 0.3% 0.6% 0.8% 0.6% 0.8%
COMBINED TOTAL 68.4% 68.3% 67.4% 66.5% 65.6%
AFRICAN-AMERICANS (35+)Q2
2012Q2
2013Q2
2014Q2
2015Q2
2016
URBAN ADULT CONTEMPORARY 36.9% 36.8% 36.6% 35.2% 35.1%
URBAN CONTEMPORARY 12.1% 12.2% 12.7% 13.8% 14.5%
RHYTHMIC CONTEMPORARY HIT RADIO 5.6% 5.3% 5.1% 5.4% 5.1%
URBAN OLDIES 0.8% 1.5% 2.0% 1.4% 1.5%
COMBINED TOTAL 55.4% 55.9% 56.4% 55.8% 56.2%
Source: Nielsen National Respondent Data from Spring 2012–2016.

YOUNG, CONNECTED AND BLACK22
TV AFRICAN-AMERICANS ARE MOVING AHEAD IN CREATING AND ACTING, AS WELL AS WATCHING When it comes to leisure activities, watching TV and movies is the
primary way that African-Americans claim they spend their time, with
Millennial Blacks over-indexing their total market counterparts by 20%.
Overall, Black viewers are helping to elevate up-and-coming Black
celebrities and programs, which are at the forefront of a trend towards
diversity in television, movies and other media forms. In fact, 62% of
Black Millennials agree that they feel really good about seeing celebrities
in the media who share their ethnic background.*
*Source: Nielsen Scarborough USA+ 2015 Release 2 (August 2014–October 2015).
SHARE OF WEEKLY LEISURE TIME ACTIVITIES BY ACTIVITY AMONG AFRICAN-AMERICANS, BY AGE
MILLENNIALS (18–34) 35+
AFRICAN-AMERICAN
AFRICAN-AMERICAN
SHARE/INDEXED TO TOTAL 18–34
SHAREAFRICAN-
AMERICAN
AFRICAN-AMERICAN
SHARE INDEXED TO TOTAL 35+
SHARE
22% 120 TV & MOVIES 21% 92
21% 134 SPORTS & WELLNESS 12% 79
16% 110 INTERNET 16% 106
11% 69 SOCIAL ACTIVITIES 17% 120
9% 75 VIDEO GAMES 13% 107
8% 85 SOCIAL NETWORKING 5% 88
6% 81 MUSIC 9% 123
4% 106 READING 4% 76
Source: Nielsen 360° Gaming Report, 2015.
62% OF BLACK MILLENNIALS AGREE THAT THEY FEEL REALLY GOOD ABOUT SEEING CELEBRITIES IN THE MEDIA WHO SHARE THEIR ETHNIC BACKGROUND.
Copyright © 2016 The Nielsen Company 23
Four of the top network TV shows among African-American Millennials—
Empire (Fox), Scandal (ABC), Love & Hip-Hop Atlanta 5 (VH1), and How
to Get Away With Murder (ABC)—all have Black creators, co-creators, or
executive producers, as well as predominantly Black casts and/or leading
Black characters. Empire’s leading stars, Terrence Howard and Taraji
P. Henson, are on their way to becoming household names across all
demographic viewing audiences and 35% of the show’s viewers are non-
African-American. Even further exemplifying the growing mainstream
audience appeal of these shows, 68% of Scandal’s viewers and 76% of
Black-ish’s viewers are non-African-American.
All but one of the top 10 shows among African-Americans, for both
Millennials and those 35 and older, are shows where African-Americans
significantly over-index against the total population. The one exception is
The Walking Dead (AMC), which ranks as the eighth most popular show for
Black Millennial viewers, but actually under-indexes for Black audiences.
While Empire, Scandal, How to Get Away With Murder, and Love and Hip
Hop Atlanta (VH1) are in the top 10 shows among Black Millennials and
older generations, The Walking Dead, and the other series installments
of the Love and Hip Hop reality show franchise, as well as various series
installments of Black Ink Crew (VH1) are also popular shows.
Industry titans Oprah Winfrey and Tyler Perry have joined forces for a
portfolio of scripted content on Winfrey’s cable network, OWN. And Fox’s
Empire success effectively greenlit other scripted content featuring African-
American lead characters such as Morris Chestnut who stars in Fox’s
sophomore series Rosewood. For Blacks 35 and older, shows that make the
top 10 list are OWN’s The Haves and the Have Nots and If Loving You Is
Wrong, Rosewood (FOX), Little Big Shots (NBC), Being Mary Jane (BET), and
Real Housewives of Atlanta (BRAVO).

YOUNG, CONNECTED AND BLACK24
TOP TV PROGRAMS AMONG AFRICAN-AMERICAN VIEWERS, BY AGE
PROGRAMS NETWORK
AFRICAN-AMERICAN MILLENNIALS (18–34)
AVERAGE AUDIENCE RATING
AFRICAN-AMERICAN MILLENNIALS (18–34)
VIEWERS (000)
EMPIRE FOX 25.6 2,572
LOVE & HIP HOP ATLANTA 5 VH1 11.5 1,157
LOVE & HIP HOP HOLLYWOOD 2 VH1 10.8 1,091
LOVE & HIP HOP 6 VH1 10.7 1,077
BLACK INK CREW 3 VH1 9.4 950
BLACK INK CREW 4 VH1 8.9 895
BLACK INK CREW CHICAGO VH1 7.9 795
THE WALKING DEAD AMC 7.2 728
HOW TO GET AWAY WITH MURDER ABC 7.0 710
SCANDAL ABC 6.7 678
Read as: The average audience rating for Empire was 25.6% of African-Americans, 18–34.
Source: Nielsen NPOWER, Persons 18–34, Persons 35–99, Broadcast and Cable, Live +7 Days, TV with Digital, TV with Video On Demand (VOD), September 21, 2015–June 26, 2016, does not include syndicated programs, specials, sports or programs with less than four telecasts.
PROGRAMS NETWORK
AFRICAN- AMERICANS (35+)
AVERAGE AUDIENCE RATING
AFRICAN- AMERICANS (35+)
VIEWERS (000)
EMPIRE FOX 32.4 6,378
SCANDAL ABC 13.2 2,607
HOW TO GET AWAY WITH MURDER ABC 12.7 2,502
THE HAVES AND THE HAVE NOTS OWN 11.6 2,295
ROSEWOOD FOX 11.0 2,165
IF LOVING YOU IS WRONG OWN 10.0 1,969
LITTLE BIG SHOTS NBC 7.9 1,566
BEING MARY JANE 3 BET 7.9 1,557
REAL HOUSEWIVES OF ATLANTA 8 BRAVO 7.5 1,491
LOVE & HIP-HOP ATLANTA 5 VH1 7.0 1,384
Read as: The average audience rating for Empire was 32.4% of African-Americans, 35+.
Source: Nielsen NPOWER, Persons 18–34, Persons 35–99, Broadcast and Cable, Live +7 Days, TV with Digital, TV with Video On Demand (VOD), September 21, 2015–June 26, 2016, does not include syndicated programs, specials, sports or programs with less than four telecasts.

Copyright © 2016 The Nielsen Company 25
Sports programs, specifically Super Bowl 50 (CBS) and the NBA Finals
game series (ABC), along with an Empire holiday special, dominated the top
10 sports and specials for both African-American Millennials and African-
Americans 35 and over. There is little difference between the age groups when
it comes to top specials, with eight of the 10 being the same.
TOP SPORTS AND OTHER SPECIALS AMONG AFRICAN-AMERICAN VIEWERS, BY AGE
PROGRAM NETWORK
AFRICAN-AMERICAN MILLENNIALS (18–34)
AVERAGE AUDIENCE RATING
AFRICAN-AMERICAN MILLENNIALS (18–34)
VIEWERS (000)
SUPER BOWL 50 CBS 32.0 3,218
EMPIRE (HOLIDAY SPECIAL) FOX 22.3 2,242
NBA FINALS (GAME 7) ABC 17.2 1,732
NFC CHAMPIONSHIP (NFL) FOX 15.7 1,581
NBA FINALS (GAME 5) ABC 15.6 1,573
NBA FINALS (GAME 6) ABC 14.3 1,444
NBA FINALS (GAME 1) ABC 14.0 1,406
NBA FINALS (GAME 2) ABC 13.0 1,309
AFC CHAMPIONSHIP (NFL) CBS 13.0 1,308
NBA FINALS (GAME 3) ABC 12.5 1,264
Read as: The average audience rating for Super Bowl 50 was 32% of African-Americans, 18–34.
Source: Nielsen NPOWER, September 21, 2015–June 26, 2015, Season to Date. Broadcast and Cable. Live+7. Excluding Repeats. Including only Specials with one telecast and a rating of 1.0 or higher. Excluding telecasts with less than 10 minutes duration.
PROGRAM NETWORK
AFRICAN- AMERICANS (35+)
AVERAGE AUDIENCE RATING
AFRICAN- AMERICANS (35+)
VIEWERS (000)
SUPER BOWL 50 CBS 41.5 8,162
EMPIRE (HOLIDAY SPECIAL) FOX 27.7 5,459
NBA FINALS (GAME 7) ABC 25.4 5,004
NFC CHAMPIONSHIP (NFL) FOX 23.9 4,703
AFC CHAMPIONSHIP (NFL) CBS 23.0 4,520
THE WIZ LIVE! NBC 22.9 4,511
NBA FINALS (GAME 5) ABC 20.6 4,058
NBA FINALS (GAME 6) ABC 20.2 3,987
NFC PLAYOFF GAME (NFL) FOX 19.0 3,740
NBA FINALS (GAME 1) ABC 18.8 3,702
Read as: The average audience rating for Super Bowl 50 was 41.5% of African-Americans, 35+.
Source: Nielsen NPOWER, Persons 18–34, Persons 35–99, Broadcast, Live +7 Days, TV with Digital, TV with Video On Demand (VOD), September 21, 2015–June 26, 2016, does not include syndicated programs.

YOUNG, CONNECTED AND BLACK26
MORE DIVERSE CONTENT DRIVES INCREASED AD SPENDTV captured the largest share of Black advertising spend in 2015, which
is up 11% versus 2011. In fact, in the four-year period between 2011 and
2015, broadcast TV ad spend focused on Black audiences increased
255% and syndicated TV ad spending increased 55%. The reason? In the
most recent broadcast seasons, specifically 2014-2015 and 2015-2016,
broadcast TV drew a larger number of Black viewers due to increased
diversity of primetime programs on mainstream networks that featured
predominantly Black casts and/or leading Black actors. Dramas such as
Empire, Rosewood, Scandal, How to Get Away with Murder; sitcoms like
Black-ish and specials like The Wiz LIVE! have contributed to a significant
shift in ad dollars reaching Black audiences, further evidence of the wide
reach of Black cultural influence.
Advertising spend focused on Black audiences (ad dollars placed
on programming that has greater than 50% Black viewers) through
syndicated and broadcast TV, increased slightly in 2015 versus 2014,
and slightly decreased for spot radio and cable TV during the same time
period. Cable TV represents the largest share of dollars in spend focused
on Black audiences at $1.3 billion in 2015. And in light of the recent
broadcast TV ad dollar boost toward Black audiences, cable TV still
offers niche, audience-segmented programming for African-American
viewers of all ages.
Source: Nielsen Ad Intel; January 1, 2011–December 31, 2015.
AD SPEND CHANGE 2011-2015
CABLETV
BROADCASTTV
SYNDICATEDTV
55%
17%
255%
3%6%0%
TOTAL AD SPEND CHANGE
AD SPEND FOCUSEDON BLACK AUDIENCES
BETWEEN 2011 AND 2015, BROADCAST TV AD SPEND FOCUSED ON BLACK AUDIENCES INCREASED
255%
DEFINITONS OF AFRICAN-AMERICAN COVERAGE Broadcast: Ads placed on programs aired on TV networks such as CBS, ABC, NBC, FOX, The CW, etc. where the composite African-American viewing audience is greater than 50% compared to the total viewing audience.
Cable: Ads placed on programs aired on TV networks such as Bounce TV, BET, Centric, TV One, Up, OWN, VH1, etc. where the composite African-American viewing audience is greater than 50% compared to the total viewing audience.
Syndicated TV: Ads placed on programs where the composite African-American viewing audience is greater than 50% compared to the total viewing audience.
Spot radio: Ads placed on local radio stations which have African-American targeted formats such as urban, gospel, smooth jazz, Black talk/news, etc.

Copyright © 2016 The Nielsen Company 27
AD SPEND CHANGE 2011-2015
Source: Nielsen Ad Intel; January 1, 2014–December 31, 2015.
AD SPEND FOCUSED ON BLACK AUDIENCES – DOLLARS (000)
SYNDICATED TV
CABLE TV
BROADCAST TV
SPOT RADIO
15,895
15,297
$1,444,258
$1,316,813
$100,243
$258,460
$547,564
104,474
100,968
$199,658
$203,506
$545,200
Source: Nielsen Ad Intel; January 1, 2014–December 31, 2015.
TOTAL MEDIA AD SPEND - DOLLARS (000)
TELEVSION(BROADCAST AND CABLE)
NEWSPAPER
OUTDOOR
RADIO
MAGAZINE
COUPON
BUSINESS TO BUSINESS
$337,698
$15,895,480
$15,297,102
$11,554,387
$9,867,719
$255,882
$2,063,641
$1,880,676
$3,909,069
$4,191,512
$5,759,035
$104,473,814
$100,968,232
$5,947,802
2014 2015
2014 2015

YOUNG, CONNECTED AND BLACK28
GAMING ATTITUDES ARE COMPETITIVEAfrican-American Millennials claim to spend 9% of their leisure time
on video games, versus 12% for the total Millennial population, while
African-Americans 35 and older spend 13% of their leisure time on video
games. Although some African-Americans spend less of their free time
on video games, they are often early adopters and influencers among
gamers. African-Americans of all ages over-index against their total
population counterparts for agreeing that they are the first to buy the
newest games or gaming systems, that their friends ask their opinion
about video games, and that all of their friends are gamers. Interestingly,
they are more social gamers: African-Americans under-index for playing
single player games and over-index for playing video games for the
competition. With increased internet access and a large representation
on multiple social media networks, Black gamers connect and play
games with others who are not necessarily living in the same household.
AFRICAN-AMERICAN MILLENNIALS ARE ACTIVE GAMERS
AFRICAN-AMERICANMILLENNIALS
(18–34)
TOTAL MILLENNIALS
(18–34)
TOTAL AFRICAN-AMERICAN
(35–49)
TOTAL POPULATION
(35–49)
MY FRIENDS OFTEN ASK FOR MY OPINION ABOUT VIDEO GAMES
42% 34% 11% 11%
I PLAY VIDEO GAMES FOR THE COMPETITION
39% 33% 21% 17%
ALL OF MY FRIENDS ARE GAMERS
34% 28% 15% 11%
I AM THE FIRST TO BUY THE NEWEST GAMES OR GAMING SYSTEMS
29% 22% 11% 9%
Source: Nielsen 360° Gaming Report, 2015.
PERCENT WHO SAY THEY COMPLETELY AGREE OR SOMEWHAT AGREE

Copyright © 2016 The Nielsen Company 29
AFRICAN-AMERICAN MILLENNIALS ARE ACTIVE GAMERS
GAMING CONSOLES,HANDHELDS, COMPUTERS
SMARTPHONES TABLETS DIGITAL/STREAMING MEDIA PLAYERS AND
GAMING MICROCONSOLES
81%85%
65%60% 64%63%
40%46% 43%
39% 35%37%
48%53%
34%29%
AFRICAN-AMERICANMILLENNIALS (18–34)
TOTAL POPULATION(18–34)
AFRICAN-AMERICANS(35+)
TOTAL POPULATION(35+)
Source: Nielsen 360° Gaming Report, 2015.
VIDEO GAME DEVICE OWNERSHIP
African-Americans of all ages are most likely to own gaming consoles,
handheld devices, or computers for playing their video games. Black
Millennials over-index against their total population counterparts for
net (collective) ownership of gaming consoles/handheld devices/
computers/digital or streaming media players, and gaming micro-
consoles. The 35-and-older age group over-indexes for owning
smartphones to play video games.

YOUNG, CONNECTED AND BLACK30
CONSUMPTION GAINS OUTPACE THE TOTAL POPULATION
AFRICAN-AMERICANS ARE TECHNOLOGY TRAILBLAZERS AND CATALYSTS OF SOCIAL AWARENESS
Trend-setting Black consumers are influencing the U.S. mainstream in profound and far-reaching ways
when it comes to social media usage, television programming diversification, sports-viewing, technology
adoption and social activism. Led by tech-savvy Millennials, African-Americans have become adept at
using digital platforms and apps to communicate, and to leverage social media to increase the national
consciousness with regard to issues affecting the Black community and to effect change.
African-Americans outpace Whites in both smartphone ownership and mobile internet access, but there
is a gap in penetration for both computers and tablets. Since African-Americans, particularly Millennials,
over-index for learning about technology and electronic products from others, discussing and giving others
advice about technology, and recommending technology products to people they know, campaigns using
brand ambassadors should be considered when developing growth strategies.
African-Americans are vigorous viewers of television and video, with both Millennial and those 35 and older
over-indexing against their total market counterparts. Watching TV and movies are the primary way that
Blacks claim they spend their leisure time. These Black viewers are helping to popularize Black celebrities
and programs, which are at the forefront of an overall trend toward diversity in television, movies, and
other media forms. Four of the current top network TV shows, several of which are watched predominantly
by non-Blacks, have Black creators, co-creators, or executive producers, as well as predominantly Black
casts or leading Black characters.
TV captured the largest share of Black advertising spend in 2015, which was up 11% versus 2011. Between
2011 and 2015, broadcast TV ad spend focused on Black audiences increased 255% and syndicated TV
increased 55%. The diversification of TV programming is affecting advertising spend, as popular lead Black
talent, Black show producers and creators as well as Black culture-influenced storylines on mainstream
media are reaching larger audiences.

Copyright © 2016 The Nielsen Company 31
SECTION IIICONSUMPTION GAINS OUTPACE THE
TOTAL POPULATION
BUYING POWER GAINS AND STATE DISTRIBUTIONIn 2015, African-Americans controlled $1.2 trillion in buying power,
8.6% of the nation’s total, and a 21% increase over 2010, according to
the Selig Center for Economic Growth. Black buying power is expected
to grow 21.6% between 2015 and 2020 (compared with 20.3% growth for
the total U.S.), and to reach just over $1.4 trillion by 2020. The gains in
Black buying power reflect not only African-Americans’ population growth,
but also their increasing education and entrepreneurship, as well as their
advancing into their peak earning years.

YOUNG, CONNECTED AND BLACK32
The states with the largest African-American buying power in 2015 were
New York ($109 billion), Texas ($106 billion), California ($84 billion),
Georgia ($81 billion), Florida ($80 billion), Maryland ($69 billion),
North Carolina ($55 billion), Virginia ($49 billion), Illinois ($49 billion)
and New Jersey ($42 billion), also according to Selig. These 10 states
represent 62% of African-American buying power. The same states, with
the exception of Georgia and Maryland, ranked (by buying power) among
the top markets for all consumers. With the African-American market
spread widely throughout the U.S., it is an attractive customer segment
nationwide. Tremendous opportunities for geo-targeted campaigns over
the next few years are especially promising in Texas, the state with the
second-largest Black buying power and the highest projected growth rate
of the top 10 states, at 32%.
Source: Selig Center for Economic Growth, Terry College of Business, University of Georgia, 2015.
32%
22%
22%
22%
22%
20%
19%
17%
16%
14%
TEXAS
GEORGIA
FLORIDA
MARYLAND
NEW YORK
CALIFORNIA
NORTH CAROLINA
VIRGINIA
NEW JERSEY
ILLINOIS
AFRICAN-AMERICAN BUYING POWER PROJECTED GROWTH RATE—TOP 10 STATES, 2015-2020

Copyright © 2016 The Nielsen Company 33
AFRICAN-AMERICAN BUYING POWER PROJECTED GROWTH RATE—TOP 10 STATES, 2015-2020
FEELING PROUD, LOOKING GOOD AND SPENDING MOREPersonal image is highly valued and is regarded with an immense sense of
pride in the African-American community. Consumer product companies
have long been aware of the dedicated consumption of personal
healthcare items by Black consumers. African-Americans of all ages show
higher buying rates than non-African-Americans for women’s fragrances,
grooming aids, personal soap and bath needs, deodorant, sanitary
protection, family planning, and feminine hygiene. African-Americans ages
35 and older also over-index on men’s toiletries and baby needs, while
those ages 18–34 also over-index on oral hygiene, skin-care preparations
and hair care.
The long history of personal care spending has led many consumer
products companies to offer highly-developed lines of popular African-
American cosmetic, fragrance, and hair-care products that cater to the
wants and needs of African-American men and women. While the wide
array of product offerings for these items result in African-Americans
having a lower index than the total non-African-American market on
general skin care preparation and hair-care product categories (87 index
and 91 index, respectively), they spend a higher percent of dollars in the
booming African-American health and beauty aid categories.

YOUNG, CONNECTED AND BLACK34
AFRICAN-AMERICAN MILLENNIALS (18–34)
INDEXED TO NON-AFRICAN-
AMERICANS (18–34)
AFRICAN-AMERICANS (35+) INDEXED TO
NON-AFRICAN-AMERICANS (35+)
AFRICAN-AMERICANS INDEXED TO
NON-AFRICAN-AMERICANS
WOMEN’S FRAGRANCES 115 115 110
GROOMING AIDS 113 105 105
PERSONAL SOAP AND BATH NEEDS 146 145 143
DEODORANT 110 105 107
MEN’S TOILETRIES 98 121 128
ORAL HYGIENE 107 98 101
SANITARY PROTECTION 117 101 103
SKIN CARE PREPARATIONS 109 84 87
HAIR CARE 116 85 91
FEMININE HYGIENE 116 103 102
ETHNIC HEALTH AND BEAUTY AIDS 158 175 153
Read as: African-American Millennials, 18–34, spend 15% more on women’s fragrances than their non-African-American counterparts.
Source: Nielsen Homescan, 52 weeks ending December 26, 2015.
AFRICAN-AMERICANS OVER-INDEX ON PERSONAL CARE SPENDING
PERSONAL CARE ITEMS INDEX – CATEGORY BUYING RATE (DOLLARS)
Copyright © 2016 The Nielsen Company 35
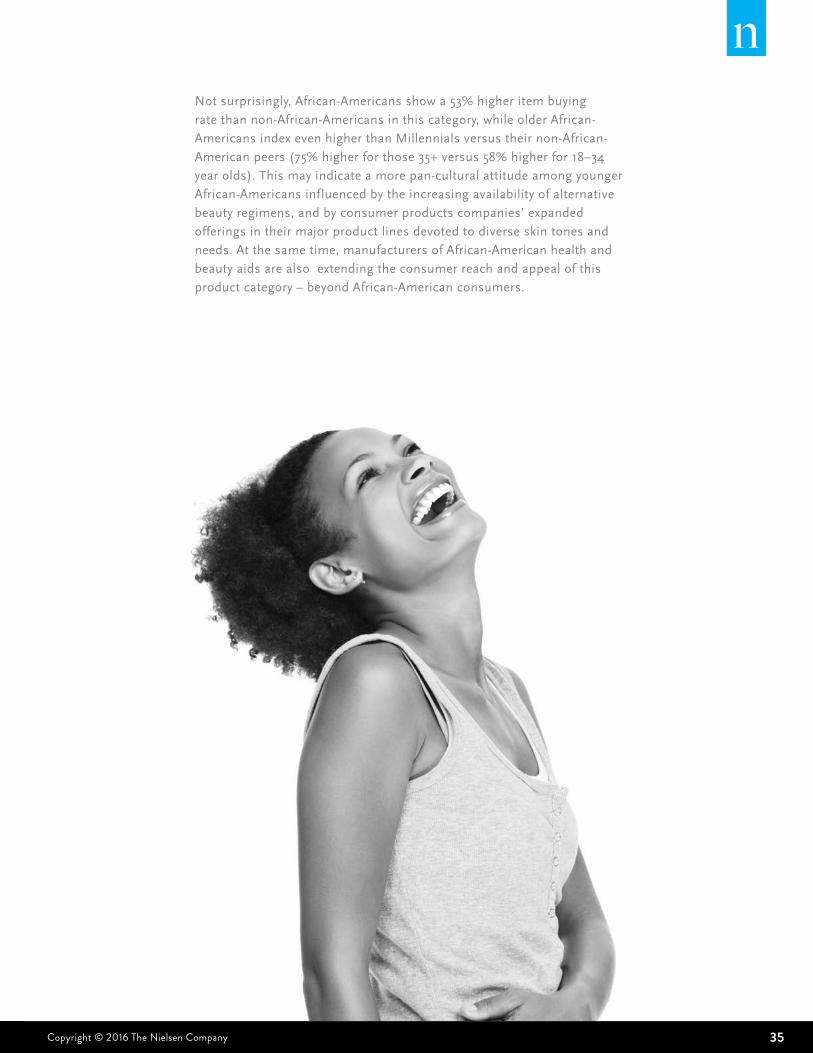
AFRICAN-AMERICANS OVER-INDEX ON PERSONAL CARE SPENDINGNot surprisingly, African-Americans show a 53% higher item buying
rate than non-African-Americans in this category, while older African-
Americans index even higher than Millennials versus their non-African-
American peers (75% higher for those 35+ versus 58% higher for 18–34
year olds). This may indicate a more pan-cultural attitude among younger
African-Americans influenced by the increasing availability of alternative
beauty regimens, and by consumer products companies’ expanded
offerings in their major product lines devoted to diverse skin tones and
needs. At the same time, manufacturers of African-American health and
beauty aids are also extending the consumer reach and appeal of this
product category – beyond African-American consumers.

YOUNG, CONNECTED AND BLACK36
COOKING FROM SCRATCH IS VALUED, BUT SPEED AND EFFICIENCY ARE KEY Traditional cultural recipes have been adapted over time, but their
primary components have endured and are still reflected in the
grocery-buying habits of African-Americans today: These shoppers
buy meat (particularly a variety of pork and poultry cuts), seafood,
greens, cabbage, and green beans, at a higher rate than non-
African-Americans. Black Millennials and older Black generations
have similar purchasing patterns for fresh food items, however,
there are a few items that standout for the younger shoppers
when compared to total African-Americans. Black Millennials buy
56% more fresh green beans and 8% more fresh chicken than total
African-American shoppers.
AFRICAN-AMERICANS OF ALL AGES HAVE SIMILAR PURCHASING PATTERNS FOR FRESH FOOD ITEMS

Copyright © 2016 The Nielsen Company 37
In terms of item buying rate, African-American Millennials and older
Black generations over-index against non-African-Americans on
additional items used in “from-scratch” cooking such as: shortening and
oil; spices, seasonings, and extract; sugar and sugar substitutes; syrups
and molasses; baking mixes; unprepared frozen meat and seafood, and
dry vegetables and grains.
YOUNGER AND OLDER AFRICAN-AMERICANS HAVE SIMILAR FRESH FOOD TASTES
ITEM BUYING RATE (DOLLARS)
AFRICAN-AMERICAN MILLENNIALS (18–34)
INDEXED TO NON-AFRICAN-
AMERICANS (18–34)
AFRICAN-AMERICANS (35+) INDEXED TO
NON-AFRICAN-AMERICANS (35+)
TOTAL AFRICAN-AMERICANS
INDEXED TO NON-AFRICAN-
AMERICANS
TOTAL PERISHABLES 89 102 100
TOTAL FRESH VEGETABLES 99 100 85
FRESH GREEN BEANS 156 90 116
FRESH CABBAGE 90 101 117
FRESH GREENS 94 101 123
TOTAL FRESH MEAT 86 103 108
TOTAL FRESH BEEF 91 102 81
TOTAL FRESH PORK 76 104 122
TOTAL FRESH MEAT OTHER THAN BEEF OR PORK 105 99 114
TOTAL FRESH POULTRY 101 100 125
TOTAL FRESH CHICKEN 108 99 119
TOTAL FRESH TURKEY 87 102 118
FRESH SEAFOOD 81 103 117
Read as: African-American Millennials buy 56% more fresh green beans than the total non-African-American Millennial population.
Source: Homescan Total Shopper View, 52 weeks ending December 26, 2015.

YOUNG, CONNECTED AND BLACK38
AFRICAN-AMERICAN MILLENNIALS (18–34)
INDEXED TO NON-AFRICAN-
AMERICANS (18–34)
AFRICAN-AMERICANS (35+) INDEXED TO
NON-AFRICAN-AMERICANS (35+)
TOTAL AFRICAN-AMERICANS
INDEXED TO NON-AFRICAN-
AMERICANS
BABY FOOD 128 134 133
CANNED SEAFOOD 117 107 106
SHORTENING/OIL 131 125 126
SPICES/SEASONING/EXTRACT 118 135 130
SUGAR/SUGAR SUBSTITUTES 123 115 118
BAKING MIXES 109 87 93
DRY VEGETABLES & GRAINS 134 134 131
SHELF STABLE JUICES AND DRINKS 136 127 132
BOTTLED WATER 119 114 119
REFRIGERATED JUICES AND DRINKS 144 122 121
PACKAGED MEAT DEPARTMENT 98 108 107
TABLE SYRUPS/MOLASSES 136 98 106
COOKIES/ICE CREAM CONES 109 85 90
FROZEN FOOD DEPARTMENT 106 94 93
PREPARED FROZEN FOODS 105 92 91
UNPREPARED FROZEN MEAT AND SEAFOOD 151 139 137
FROZEN VEGETABLES 112 114 113
Read as: African-American Millennials spend 28% more on baby food than their non-African-American counterparts.
Source: Nielsen Homescan 52 weeks ending December 26, 2015. Categories chosen because of highest index.
A GLANCE INSIDE AFRICAN-AMERICANS’ SHOPPING CARTS
CATEGORY BUYING RATE INDEX (DOLLARS)
African-Americans also buy baby food, frozen vegetables, bottled water,
and both refrigerated and shelf-stable drinks and juices at a higher rate
than non-African-Americans. Also, African-American Millennials buy
cookies and ice cream cones at a higher rate than their non-African-
American counterparts, perhaps indicating a higher presence of young
children in the home or just a preference for sweets.

Copyright © 2016 The Nielsen Company 39
A GLANCE INSIDE AFRICAN-AMERICANS’ SHOPPING CARTS
African-American Millennials and those 35 and older have similar
attitudes towards cooking and dining. Almost three-quarters of both age
groups say that during a given week, they frequently cook meals. Both
groups also plan their dinners ahead of time and like to cook with fresh
ingredients.
Busy African-Americans, however, are on the go and also need
convenient meal solutions. More than half of African-American
Millennials agree that frozen dinners are a convenient alternative for
a meal, and that they often eat meals on the run. In fact, like most
Millennials (91%), 92% of African-American Millennials say they have
visited a quick-service restaurant in the past 30 days. This tendency
towards expedience and convenience explains why African-Americans
over-index against non-African-Americans for unprepared frozen meat
and seafood and frozen vegetables.* Combining African-Americans’
desire for fresh foods and a need for speed, there is a clear opportunity
for innovation and new product development in the convenient healthy
eating space.
*Source: Nielsen Homescan 52 weeks ending December 26, 2015.
ATTITUDES TOWARD COOKING AND DINING
PERCENT WHO SAY THEY COMPLETELY AGREE OR SOMEWHAT AGREE
AFRICAN- AMERICAN
MILLENNIALS (18–34)
AFRICAN-AMERICAN MILLENNIALS (18–34)
INDEXED TO TOTAL POPULATION
(18–34)
AFRICAN- AMERICANS
(35+)
AFRICAN-AMERICANS (35+) INDEXED TO
TOTAL POPULATION (35+)
DINNERS IN MY HOME ARE USUALLY PLANNED AHEAD OF TIME
65% 103 62% 97
DURING A GIVEN WEEK, I COOK MEALS FREQUENTLY
72% 98 72% 98
PREFER COOKING WITH FRESH FOOD RATHER THAN CANNED OR FROZEN
72% 95 75% 97
FROZEN DINNERS ARE A CONVENIENT ALTERNATIVE FOR A MEAL
54% 105 50% 107
OFTEN, I EAT MY MEALS ON THE RUN
58% 116 44% 117
Source: Nielsen Scarborough USA+ 2015 Release 2 (August 2014–October 2015).

YOUNG, CONNECTED AND BLACK40
HIGH-FREQUENCY SHOPPING CHANNELSWhen it comes to how African-Americans shop, those ages 35 and older shop
23% more frequently their younger counterparts, while Black Millennials
have a 14% higher purchase size (dollar volume) than older consumers. As
Millennials spend more but make less trips to the store, they may be looking
for shopping experiences that streamline their busy life styles.
Convenience and price often dominate African-Americans’ shopping
decisions, so it is no surprise that while they under-index for the amount
spent in stores overall, they collectively over-index against the total
population for shopping at convenience stores, gas and service stations,
and dollar stores. This is not always about preference, as in many African-
American neighborhoods, these are the closest store options available. Black
Millennials also over-index against their total population counterparts for
shopping at drug stores and dollar stores at a significant rate (54% more and
113% more, respectively).

Copyright © 2016 The Nielsen Company 41
AFRICAN-AMERICAN SHOPPING CHANNEL FREQUENCY
TOTAL BASKET RING DOLLAR INDEX PER SHOPPER AT A RETAILER
Source: Nielsen Homescan, 52 weeks ending December 26, 2015.
978789
TOTAL OUTLETS
726367
WAREHOUSE CLUBS
848082
GROCERY/DISCOUNTSUPER CENTERS
7786
119GAS STATIONS
8081
118SERVICE STATIONS
213170172
DOLLAR STORES
8391
114CONVENIENCE STORES
15493101
DRUG STORES
827677
GROCERY STORES
AFRICAN-AMERICANMILLENNIALS (18-34) INDEXED TONON-AFRICAN-AMERICANS (18-34)
AFRICAN-AMERICANS 35+ INDEXED TONON-AFRICAN-AMERICANS 35+
TOTAL AFRICAN-AMERICANSINDEXED TO NON-AFRICAN-AMERICANS

YOUNG, CONNECTED AND BLACK42
ADVERTISING PROVIDES USEFUL INFORMATION ABOUT BARGAINS
PURCHASE INFLUENCERSAfrican-Americans of all ages agree that media advertising across
platforms provides them with meaningful or useful information. When
looking for information about bargains, most African-Americans think
TV provides the most meaningful information, and their secondary
sources show the distinction among the age groups. After TV, African-
American Millennials turn to the internet for information about bargains,
while African-Americans age 35 or older turn to newspapers.
Compared to their total population counterparts, both African-American
Millennials and African-Americans 35 or older are more likely to agree
that advertising on mobile phones provides useful information about
bargains.
PERCENT WHO SAY THEY COMPLETELY AGREE OR SOMEWHAT AGREE
AFRICAN- AMERICAN
MILLENNIALS (18–34)
AFRICAN-AMERICAN MILLENNIALS (18–34)
INDEXED TO TOTAL POPULATION
(18–34)
AFRICAN- AMERICANS
(35+)
AFRICAN-AMERICANS (35+) INDEXED TO
TOTAL POPULATION (35+)
ADVERTISING IN MAGAZINES
39% 122 41% 113
ADVERTISING IN NEWSPAPERS
39% 102 53% 98
ADVERTISING ON MOBILE PHONES
33% 142 24% 162
ADVERTISING ON RADIO
40% 114 39% 116
ADVERTISING ON INTERNET
43% 110 36% 117
ADVERTISING ON TV
48% 120 55% 124
Source: Nielsen Scarborough USA+ 2015 Release 2 (August 2014–October 2015).

Copyright © 2016 The Nielsen Company 43
ADVERTISING PROVIDES USEFUL INFORMATION ABOUT BARGAINS
Sixty-two percent of African-Americans say they buy based on quality,
not price, 77% say that when they find a brand they like, they stick to it,
and 66% say that if a product is made by a company they trust, they’ll
buy it even if it is slightly more expensive. But price is still a deciding
factor in many African-Americans’ purchasing decisions. More than half
(53%) say they will gladly switch brands to use a coupon and 62% agree
that if generic brands are on sale, they will purchase store brands or
private labels over their usual name-brand. Seventy percent agree that
generic or store brand products are as effective as brand-name products,
which is an attitudinal shift from what has been reported in previous
reports. Brands should be aware of this new reality for African-American
shoppers and should no longer rely too heavily on historical notions of
brand loyalty.
Relative to the total market, both groups over-index for agreeing that
their purchases are influenced by a variety of other factors (other than
price), including celebrity endorsement, what’s hot, what their parents
bought, what their friends and neighbors approve of, what image it
conveys and name brands.

Copyright © 2016 The Nielsen Company 44
FACTORS THAT INFLUENCE WHAT AFRICAN-AMERICANS BUY
Black Millennials can also be critical brand advocates and influencers,
as 45% agree that they like to share their opinions about products and
services by posting reviews and ratings online (24% higher than total
Millennials). Understanding the unique needs of African-American
consumers and their ability to help influence the success of a brand
should be a critical part of any marketing strategy.
PERCENT WHO SAY THEY COMPLETELY AGREE OR SOMEWHAT AGREE
AFRICAN- AMERICAN
MILLENNIALS (18–34)
AFRICAN-AMERICAN MILLENNIALS (18–34)
INDEXED TO TOTAL POPULATION
(18–34)
AFRICAN- AMERICANS
(35+)
AFRICAN-AMERICANS 35+ INDEXED TO
TOTAL POPULATION (35+)
A CELEBRITY ENDORSEMENT MAY INFLUENCE ME TO CONSIDER OR BUY A PRODUCT
41% 147 29% 159
I AM INFLUENCED BY WHAT’S HOT AND WHAT’S NOT
49% 129 37% 135
I BUY BRANDS THAT REFLECT MY STYLE
64% 100 62% 102
I BUY THE BRANDS I GREW UP WITH, THE ONES MY PARENTS USED
58% 113 53% 114
I EXPECT THE BRANDS I BUY TO SUPPORT SOCIAL CAUSES
38% 104 41% 114
I PREFER TO BUY THINGS MY FRIENDS OR NEIGHBORS WOULD APPROVE OF
38% 113 28% 122
I WOULD PAY EXTRA FOR A PRODUCT THAT IS CONSISTENT WITH THE IMAGE I WANT TO CONVEY
52% 114 48% 124
I ONLY BUY FOOD ITEMS THAT ARE NAME-BRAND, NOT GENERIC BRANDS
47% 136 37% 127
Source: Nielsen Scarborough USA+ 2015 Release 2 (August 2014–October 2015).

Copyright © 2016 The Nielsen Company 45
FACTORS THAT INFLUENCE WHAT AFRICAN-AMERICANS BUY AFRICAN-AMERICANS EXPAND THEIR WALLETS IN NEW AND TRADITIONAL WAYS
With the African-American market spread widely throughout the U.S., controlling almost $1.2 trillion in
buying power, and growing at a higher rate than the total U.S., it is in a number of ways an attractive
customer segment nationwide. Gains in Black buying power reflect not only African-Americans’ population
growth, but also their increasing education and entrepreneurship, as well as their advancing into their peak
earning years, all of which contribute to growing anticipated incomes.
The long history of high personal care spending by African-Americans has led to unique product offerings,
such that sales are divided between mainstream beauty products and beauty products designed specifically
for the African-American market. Millennial African-Americans appear to be expanding their beauty regimen
items beyond African-American specific beauty products, as consumer products’ companies are broadening
their general market product offerings to address the wants and needs of a more diverse population.
This shift has led to an effort to include ethnic health and beauty aids in the mainstream beauty aisle, as
opposed to a physical separation in stores.
Millennial African-Americans and those 35 and older have similar attitudes towards cooking and dining,
with both groups over-indexing for fresh traditional cultural foods items, and items used when cooking
from scratch. However, although the majority of African-Americans agree that they usually plan meals
ahead of time, frequently cook meals, and prefer cooking with fresh foods, they still search for convenience
and often eat meals on the run. Combining African-Americans’ desire for fresh foods and a clear need for
convenience suggests a clear opportunity for innovation and new product development in the convenient
healthy-eating space.
Convenience, location and price tend to dominate African-Americans’ shopping channel decisions, which
is why they over-index for shopping at both the higher-priced but location-driven convenience stores and
gas and service stations, as well as at the price-driven dollar stores. Millennial African-Americans spend
more per trip but make fewer trips to the store than African-Americans 35 and older. Grocery stores,
discount super-centers, and warehouse clubs have an opportunity for growth in this market if they can offer
convenient alternatives to the smaller stores.
In general, African-Americans are more receptive to information via any form of media than the total
population. However, African-Americans find that advertising on TV provides the most meaningful or
useful information, while penetration of mobile phones offer an opportunity for digital connections.
Though the majority of African-Americans claim to be brand-loyal, quality-based shoppers, price, sales,
and coupons are still deciding factors for most. African-Americans over-index for other factors influencing
purchase decisions including celebrity endorsement, what’s hot, what reflects their personal style, what
their parents bought, supporting social causes, what their friends and neighbors approve of, and the image
conveyed. Since Black Millennials over-index for sharing their opinions about products and services by
posting reviews and ratings online, there is an opportunity to leverage these brand advocates to influence
others.

YOUNG, CONNECTED AND BLACK46
SECTION IVREACHING HIGHER—BUILDING ON RECENT GAINS
BUILDING ON THE LEGACY OF AMERICA’S FIRST AFRICAN-AMERICAN PRESIDENCYAs eight years of Barack Obama’s historic presidency come to a close,
African-Americans are invested in continuing to pursue economic and
political gains, as well as advancing equality and rallying awareness
about social justice issues. African-American Millennials, in particular,
have been leaders in leveraging social media, mobile, and live video
streaming to take control of the social issues narrative and to
rally growing support through grassroots efforts from many who
are witnessing their concerns and grievances with much more
immediacy than before. This utilization of technology to effect social
and civic change is a manifestation of growing, grassroots political
involvement in the African-American community.
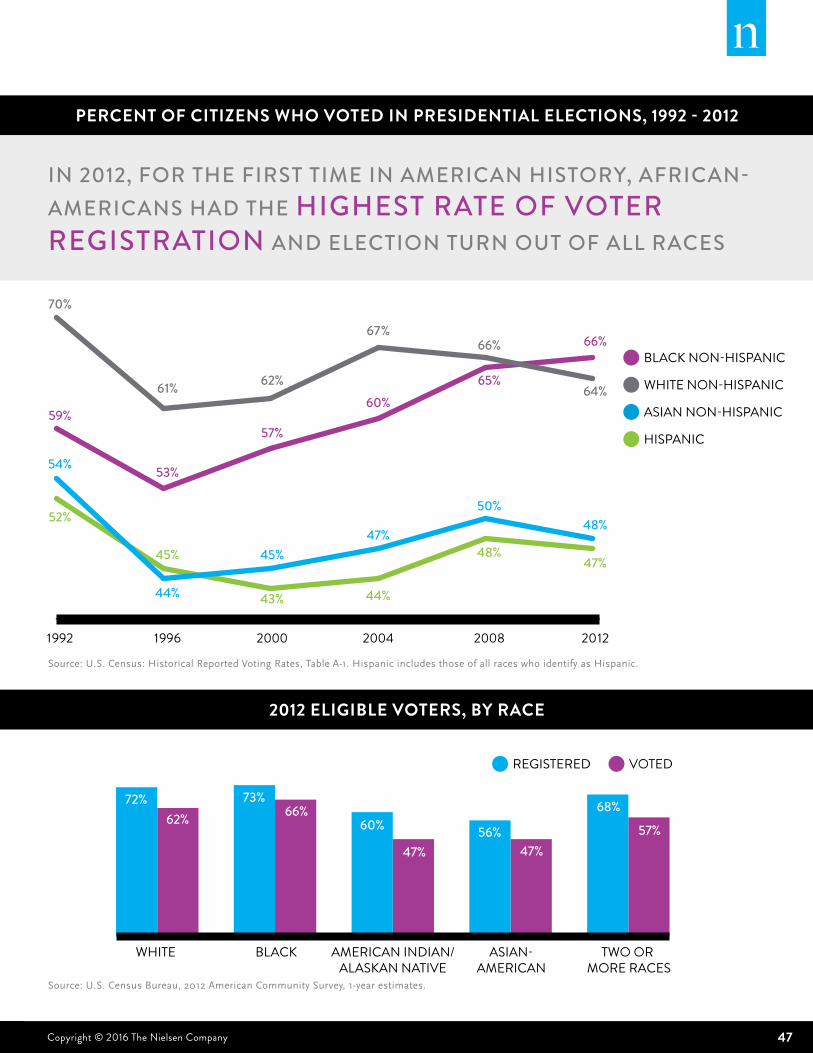
In 2012, for the first time in American history, African-Americans
had the highest rate of voter registration and election turn out of all
races, surpassing non-Hispanic Whites in election turnout at 66%
versus 64%. Just under 29 million African-Americans over the age
of 18 are eligible to vote; they represent 13% of U.S. eligible voters
and are growing at a rate of 3.7% every two years.
Black voter turnout has steadily increased over the last three
decades, and because the right to vote was so hard-won, many in
the Black community view not voting as irresponsible.
PERCENT OF CITIZENS WHO VOTED IN PRESIDENTIAL ELECTIONS, 1992 - 2012
2012 ELIGIBLE VOTERS, BY RACE
Copyright © 2016 The Nielsen Company 47
REACHING HIGHER—BUILDING ON RECENT GAINS
Source: U.S. Census: Historical Reported Voting Rates, Table A-1. Hispanic includes those of all races who identify as Hispanic.
PERCENT OF CITIZENS WHO VOTED IN PRESIDENTIAL ELECTIONS, 1992 - 2012
Source: U.S. Census Bureau, 2012 American Community Survey, 1-year estimates.
BLACKWHITE AMERICAN INDIAN/ALASKAN NATIVE
ASIAN-AMERICAN
TWO OR MORE RACES
VOTEDREGISTERED
72%62%
73%66%
60%
47%56%
47%
68%
57%
2012 ELIGIBLE VOTERS, BY RACE
70%
59%
54%
52%
61%
53%
44%
45%
62%
57%
45%
43%
67%
60%
47%
44%
66%
65%
50%48%
64%
66%
48%47%
1992 1996 2000 2004 2008 2012
WHITE NON-HISPANIC
BLACK NON-HISPANIC
ASIAN NON-HISPANIC
HISPANIC
IN 2012, FOR THE FIRST TIME IN AMERICAN HISTORY, AFRICAN-AMERICANS HAD THE HIGHEST RATE OF VOTER REGISTRATION AND ELECTION TURN OUT OF ALL RACES

YOUNG, CONNECTED AND BLACK48
ELIGIBLE VOTERSIn 2014, 55% of eligible Black voters were female, and for every age
group, there were significantly more Black females eligible to vote
than males. Black females were also more likely to register (76%) and
to vote (70%) in the 2012 presidential election than were Black males
(69% and 61%, respectively). For both genders, the older the age group
(up to age 75), the more likely the person was to register and to vote.
In total, 73% of eligible African-Americans registered to vote in 2012
and 66% voted, representing the highest rates of registration and voter
turn-out of all the races.
Source: U.S. Census Bureau, 2012 American Community Survey, 1-year estimates.
ELIGIBLE AFRICAN-AMERICAN VOTERS, 2012
69%61%
50%40%
64%54%
72%65%
75%68%
80%74%
81%
76%
76%70%
63%53%
74%66%
77%71%
80%76%
81%77%
80%
72%
23–34 YEARS
18–22 YEARS
TOTAL 18+ YEARS
35–44 YEARS
65–74 YEARS
45-64 YEARS
75+ YEARS
FEMALEMALE
VOTEDREGISTERED

Copyright © 2016 The Nielsen Company 49
ELIGIBLE AFRICAN-AMERICAN VOTERS, 2012
HEALTHCARE GAINS One of the undeniable legacies of the last eight years is the increase in
insurance coverage for the Black community: 2.3 million African-Americans
(ages 18–64) gained health insurance coverage through the Affordable Care
Act (ACA), lowering the uninsured rate among African-Americans by 9.2
percentage points, from 22.4% in the first quarter of 2012 to 13.2% in the
first quarter of 2015. Additionally, more than 500,000 African-American
young adults between the ages of 19 and 26 who would otherwise have
presumably gone uninsured gained coverage under their parents’ plan prior
to 2012, and 7.8 million African-Americans with private insurance gained
access to preventive services like mammograms or flu shots with no co-pay
or deductible, according to the U.S. Department of Health and Human
Services.
However, 1.4 million African-Americans living in states that have not
expanded Medicaid eligibility under the ACA fall into the “coverage gap”
where they earn too much to qualify for Medicaid, but not enough to
qualify for subsidized insurance on the federal health care exchanges. It
is projected by the Urban Institute that if changes are made in the ACA,
resulting in all states participating and the “coverage gap” being reduced,
that the disparity in coverage between Whites and African-Americans
would drop to just 2.6 percentage points.

YOUNG, CONNECTED AND BLACK50
OPTIMISM ABOUT THE FUTUREAccording to a March 2016 Harris Poll Survey, despite what many
perceive as a growing lack of faith in the system as a whole, African-
Americans are more optimistic than any other segment about the future
of the country: 49% of African-Americans say the country is headed
in the right direction versus only 45% of Hispanics, 42% of Asian-
Americans and 23% of Whites.
While there is optimism about the future, many feel there is still
more work to be done. According to a July 2016 Harris Poll Survey,
significant percentages of African-Americans say there is a need in their
communities for more affordable housing (53%), affordable quality
healthcare (52%), affordable childcare (42%), affordable college (42%)
and affordable healthy food (39%).
Nevertheless African-Americans, particularly young African-Americans,
over-index for being aspirational: 67% of all African-Americans and 74%
of Black Millennials agree that they often find themselves in a leadership
position (13% and 14% higher than the total population, respectively)
and 41% of all African-Americans and 48% of Black Millennials agree
that they strive for a high social status (35% and 21% higher than the
total population, respectively).
This optimism translates to the workplace, as 60% of all African-
Americans and 73% of Black Millennials say their goal is to make it
to the top of their profession (36% and 23% higher than the total
population, respectively). With increasing opportunities, societal-
leading civic participation, and expanding power of the wallet, African-
Americans, particularly the empowered Millennial generation, will
continue to shape American society in new and progressive ways for
many years to come.

Copyright © 2016 The Nielsen Company 51
AFRICAN-AMERICANS ARE ASPIRATIONAL ABOUT THE FUTURE
African-American voter turnout has steadily increased over the last three decades and in 2012, African-
Americans had the highest rates of both voter registration and voter turn-out of any racial or minority
group surpassing non-Hispanic White voters. They are an important demographic with a powerful and
influential voice to effect change.
African-Americans show the most optimistic and upward aspiration of all racial groups, but there remains
ongoing concerns about employment, the remaining healthcare coverage gap, racial discrimination and
social injustices, affordable education, childcare and housing.
To effectively reach African-American consumers, a multi-media approach is necessary as older African-
Americans engage more heavily with TV and radio, while Black Millennials are also connected through
social media, mobile, and live video streaming.

YOUNG, CONNECTED AND BLACK52
CONCLUSIONAfrican-Americans are a unique and vital multicultural consumer
group in the U.S. With rich, deeply rooted traditions, Black consumers
have been the drivers of mainstream cultural influence in a myriad of
industries. The Diverse Intelligence report series on African-American
consumers has highlighted the impact of this influential consumer
segment and strives to assist advertisers and manufacturers alike to
understand how to effectively market their products and services to
African-American consumers.
As business executives look for opportunities to grow their businesses
and gain market share, it is critical to measure and evaluate the
opportunities. As the population of the U.S. becomes more ethnically
diverse, the complexity of the effort has grown. To help close the gap
and give insight with regard to how to address the needs of the growing
diverse base, Nielsen has provided these reports to better illustrate
the unique qualities of the African-American community, the business
opportunities that exist, and the best methods for a productive and
successful connection.
These reports have not only highlighted the unique media consumption
and purchasing habits of African-Americans, but they have also
covered important issues that reflect the fabric of the African-American
community. By exploring African-American consumers holistically, these
reports serve a compass for detailed campaigns to better reach and
engage them in ways that are memorable and impactful.

Copyright © 2016 The Nielsen Company 53
METHODOLOGIES Insights used in this report were sourced from the following Nielsen
analytical tools and solutions. All tools offer their own representative
levels of consumer insights and behavior across African-American, non-
Hispanic White and/or total population respondents (based on data
collection, survey/panel design and/or fusion approaches).
Homescan Panel Data: The Homescan national panel consists of
a randomly dispersed sample of households that is intended to be
representative of, and projectable to, the Total U.S. market. Panel members
use handheld scanners to record items with a UPC code purchased from
any outlet. For Nielsen Total Homescan Shopper View, panelists scan from
a code book for fresh items rather than a UPC Code. Data for this report
is based on Homescan panel data from the following period: 52 weeks
ending, December 26, 2015.
Nielsen Scarborough USA+ 2014 Release 2, GfK/MRI Attitudinal Insights Module August 2014–October 2015: (Base: Age of respondent
summaries: Adults 18+ – Projected 242,977,984, Respondents: 203,
921) By integrating 400+ attitudinal statements and segmentations
with Nielsen Scarborough’s syndicated data set, this analysis reflects
consumer psychographics in the studied categories.
Nielsen NPOWER: Audience estimates based on a nationally
representative panel of people whose televisions are metered with
a device called the National People Meter (NPM), which passively
detects exposures to codes embedded in content. A comprehensive
questionnaire is also collected of the panel.
Nielsen 360 Gaming Report, 2015Data collection:
Annual data for the Nielsen 360° Gaming Report is collected via
consumer online surveys in Q1 of each year* using Nielsen’s proprietary,
high-quality ePanel in the United States. (*Previous survey methodology
fielded two waves, Q4 and Q1 to capture pre and post holiday metrics.)
Groups Sampled:
Teens/adults Age 13+: 2000+ interviews among 50% male/50% female
sample.
Representativity:
Post-survey, raw data is weighted to ensure representation of the U.S.
general population based on U.S. Census data.
YOUNG, CONNECTED AND BLACK54
The Harris Poll This Harris Poll was conducted online, in English, within the U.S.
March 16–31, 2016 among 2,236 adults and in July 14–27, 2016 among
2,463 adults. Figures for age, sex, race/ethnicity, education, region and
household income were weighted where necessary to bring them into
line with their actual proportions in the population. Propensity score
weighting was also used to adjust for respondents’ propensity to be
online.
All sample surveys and polls, whether or not they use probability
sampling, are subject to multiple sources of error which are most
often not possible to quantify or estimate, including sampling error,
coverage error associated with nonresponse, error associated with
question wording and response options, and post-survey weighting
and adjustments. Therefore, The Harris Poll avoids the words “margin
of error” as they are misleading. All that can be calculated are
different possible sampling errors with different probabilities for pure,
unweighted, random samples with 100% response rates. These are only
theoretical because no published polls come close to this ideal.
Respondents for this survey were selected from among those who have
agreed to participate in Harris Poll surveys. The data have been weighted
to reflect the composition of the adult population. Because the sample
is based on those who agreed to participate in our panel, no estimates
of theoretical sampling error can be calculated.
Nielsen Ad IntelNielsen Ad Intel is a comprehensive source of advertising intelligence
that can track the full range of competitive advertising activity. It
monitors the media landscape—across 18 different media types and
throughout all 210 Nielsen Designated Market Areas (DMAs).
Media coverage includes the following:• Network TV• Syndication TV• National Cable TV• Spanish-Language Network TV• Spanish-Language Cable TV• Spot TV• Spot Radio• Network Radio• National Consumer Magazines• Local Magazines*• National Newspapers• Local Newspapers• Local Sunday Supplements• National Sunday Supplements• Outdoor• Coupons*• Internet
*Exclusive media type

ABOUT NIELSENNielsen Holdings plc (NYSE: NLSN) is a global performance management company that provides a
comprehensive understanding of what consumers watch and buy. Nielsen’s Watch segment provides
media and advertising clients with Total Audience measurement services for all devices on which
content—video, audio and text—is consumed. The Buy segment offers consumer packaged goods
manufacturers and retailers the industry’s only global view of retail performance measurement. By
integrating information from its Watch and Buy segments and other data sources, Nielsen also provides
its clients with analytics that help improve performance. Nielsen, an S&P 500 company, has operations in
over 100 countries, covering more than 90% of the world’s population.
For more information, visit www.nielsen.com.
Copyright © 2016 The Nielsen Company. All rights reserved. Nielsen and the Nielsen logo are
trademarks or registered trademarks of CZT/ACN Trademarks, L.L.C. Other product and service names
are trademarks or registered trademarks of their respective companies.
MANAGING EDITORS:Rebecca K. Roussell – Senior Director, Diverse Intelligence Series
Kathleen Mancini – Senior Vice President, Global Communications
CONTRIBUTORS:Thank you to all the contributors to this report.
Angela Talton – Chief Diversity Officer
Andrew McCaskill – Senior Vice President, Global Diversity Marketing and Communications
Courtney Jones – Vice President, Multicultural Growth and Strategy
Lara Colton – Senior Research Analyst, Client Services, Scarborough
Tony Hereau – Vice President, Audience Insights
Justin LaPorte – Vice President, Audience Insights
Patrick Godefroy – Research Executive, Audience Insights
Patty Macko – Client Support Associate, Nielsen Ad Intel
Nicole Pike – Director, Nielsen Games
Lauren Fernandes – Senior Communications Specialist, North America Buy Marketing and Communications
Bridget Schemmel – Senior Research Analyst Client Services, Scarborough
Hannah Pollack – Research Analyst, The Harris Poll
NIELSEN EXTERNAL ADVISORY COUNCIL REPORT SUB-COMMITTEE MEMBERS: Eugene Campbell (Council co-chair)
Adonis Hoffman (Council co-chair)
Deborah Gray-Young
Reverend Jacques DeGraff
ETHNIFACTS:Guy Garcia
Mike Lakusta
Arwen Zemborain