Embed Size (px)
Citation preview
Young Children at Risk
Closing the Gap between what we know and what we do
Mary Eming Young
Early Child Development Team
Human Development Network Children and Youth
The World Bank

2
This presentation will focus on
• Why early childhood?
– The magnitude of the problem: Young
children under threat
– Global, Science, and Business imperative
• Do we know what to do?
– is it doable?
• Challenges and Opportunities

Magnitude of Children at Risk
•
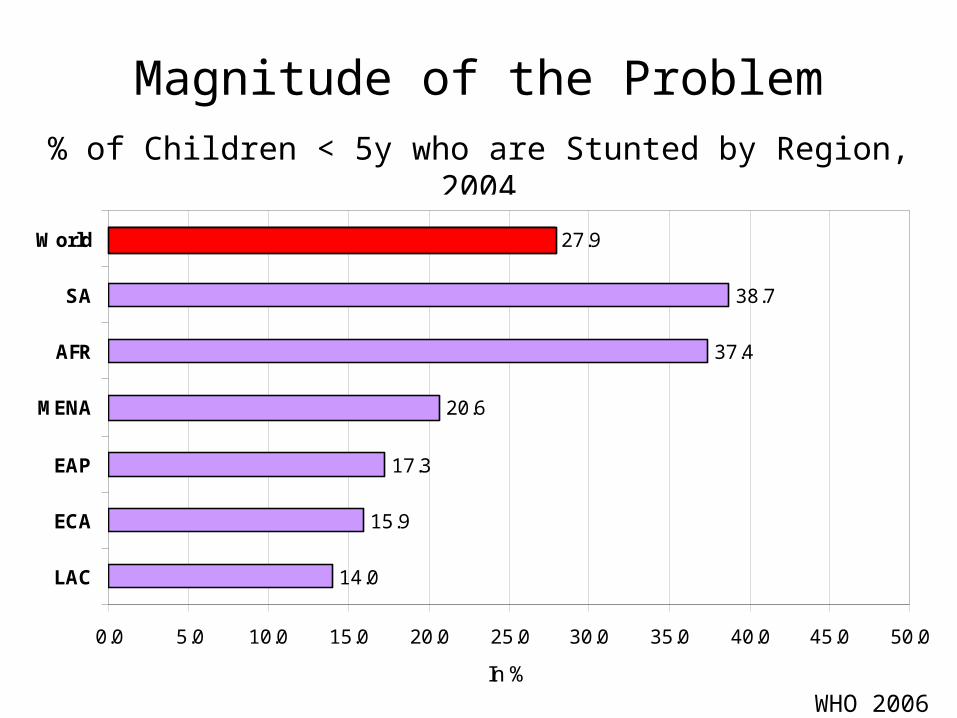
% of Children < 5y who are Stunted by Region, 2004
WHO 2006
14.0
15.9
17.3
20.6
37.4
38.7
27.9
0.0 5.0 10.0 15.0 20.0 25.0 30.0 35.0 40.0 45.0 50.0
LAC
ECA
EAP
MENA
AFR
SA
World
In %
WHO 2006
Magnitude of the Problem
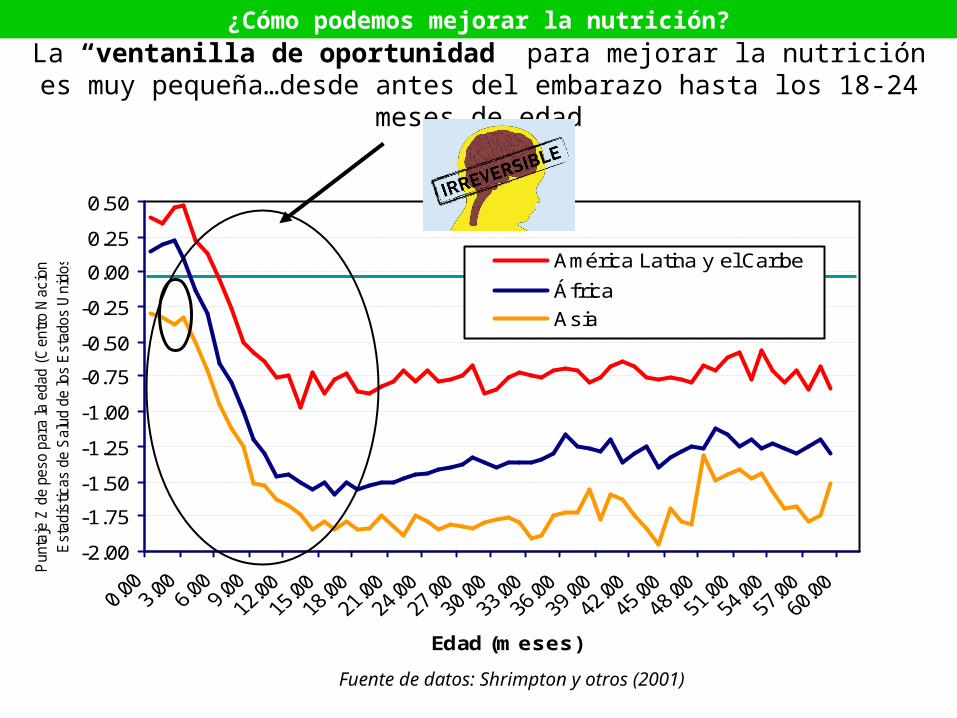
La “ventanilla de oportunidad” para mejorar la nutrición es muy pequeña…desde antes del embarazo hasta los 18-24 meses de edad
-2.00
-1.75
-1.50
-1.25
-1.00
-0.75
-0.50
-0.25
0.00
0.25
0.50
Edad (meses)
Pun
taje
Z d
e pe
so p
ara
la e
dad
(Cen
tro
Nac
iona
l de
Est
adís
ticas
de
Sal
ud d
e lo
s E
stad
os U
nido
s) América Latina y el Caribe
África
Asia
Fuente de datos: Shrimpton y otros (2001)
¿Cómo podemos mejorar la nutrición?

% of Children < 5y who are Poor (<$1 per day)by Region, 2004
WHO 2006
3.6
3.8
10.4
11.4
27.3
46.4
22.5
0.0 5.0 10.0 15.0 20.0 25.0 30.0 35.0 40.0 45.0 50.0
MENA
ECA
LAC
EAP
SA
AFR
World
In %

% of Children < 5y who are Disadvantaged (stunted or poor or both) by Region, 2004
WHO 2006
17.8
19.1
22.4
23.1
52.5
60.6
39.1
0.0 10.0 20.0 30.0 40.0 50.0 60.0 70.0
ECA
LAC
MENA
EAP
SA
AFR
World
In %
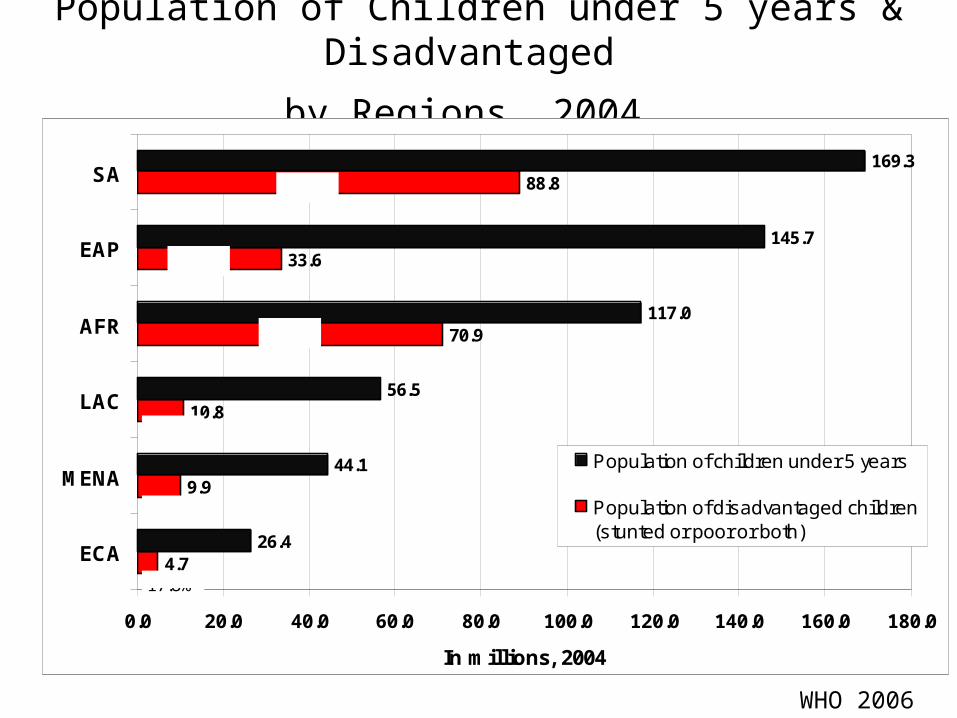
Population of Children under 5 years & Disadvantaged
by Regions, 2004
WHO 2006
4.7
9.9
10.8
70.9
33.6
88.8
26.4
44.1
56.5
117.0
145.7
169.3
0.0 20.0 40.0 60.0 80.0 100.0 120.0 140.0 160.0 180.0
ECA
MENA
LAC
AFR
EAP
SA
In millions, 2004
Population of children under 5 years
Population of disadvantaged children(stunted or poor or both)
52.5%
23.1%
19.1%
60.6%
22.4%
17.8%

% of Disadvantaged Children by Country
Source: S. Grantham-McGregor, Y.B. Cheung, S. Cueto, et.al.: Developmental potential in the first 5 years for children in developing countries, Lancet, 369:60-70, 2007.
What Do We Know?
•
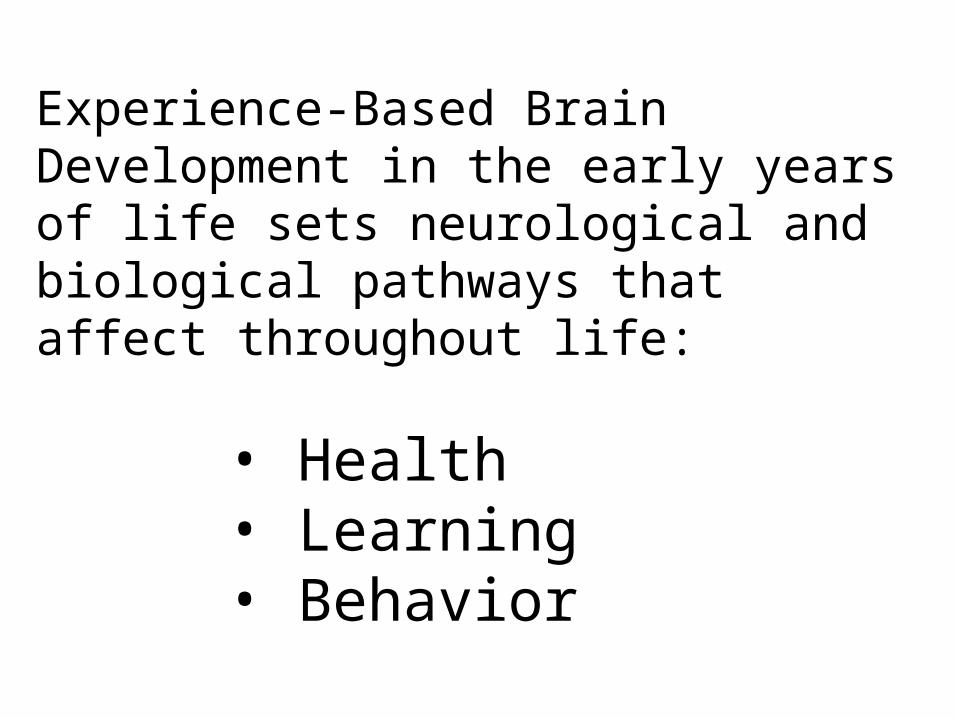
Experience-Based Brain Development in the early years of life sets neurological and biological pathways that affect throughout life:
• Health• Learning• Behavior
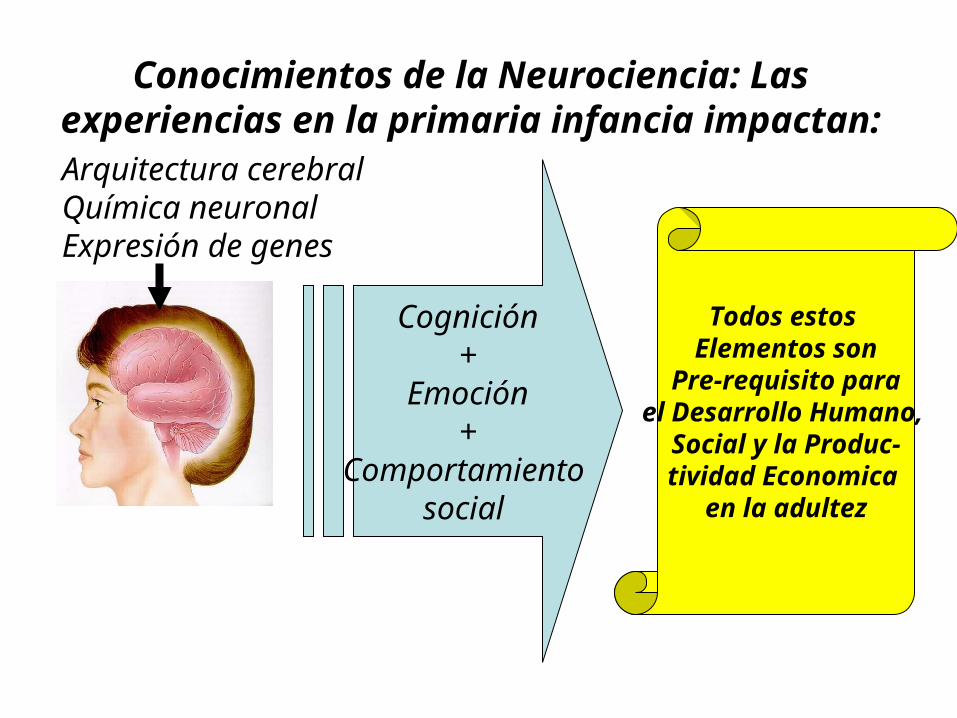
Conocimientos de la Neurociencia: Las experiencias en la primaria infancia impactan:Arquitectura cerebralQuímica neuronalExpresión de genes
Cognición+
Emoción+
Comportamiento social
Todos estos Elementos son
Pre-requisito parael Desarrollo Humano,
Social y la Produc-tividad Economica
en la adultez

The Global Imperatives
1. Eradicate extreme poverty and hunger
2. Achieve universal primary education
3. Promote gender equality and empower women
4. Reduce child mortality, and other health goals
1. Expand and improve comprehensive early childhood care and education
2. Universal primary education by 2015
3. Learning and life skills programs for youth and adults
4. 50% increase in adult literacy rates by 2015
5. Gender parity by 2005 and gender equality by 2015
6. Improving quality of education
MDGsEFA Goals

Rates of Return to Human Development Investments Across All Ages
Pre-school Programs
School
Job Training
ReturnPer $
Invested
R
2
4
6
0 6 18Age
Pre-school School Post-school
Source: P. Carneiro & J. Heckman, Human Capital Policy, NBER, 2003.
8
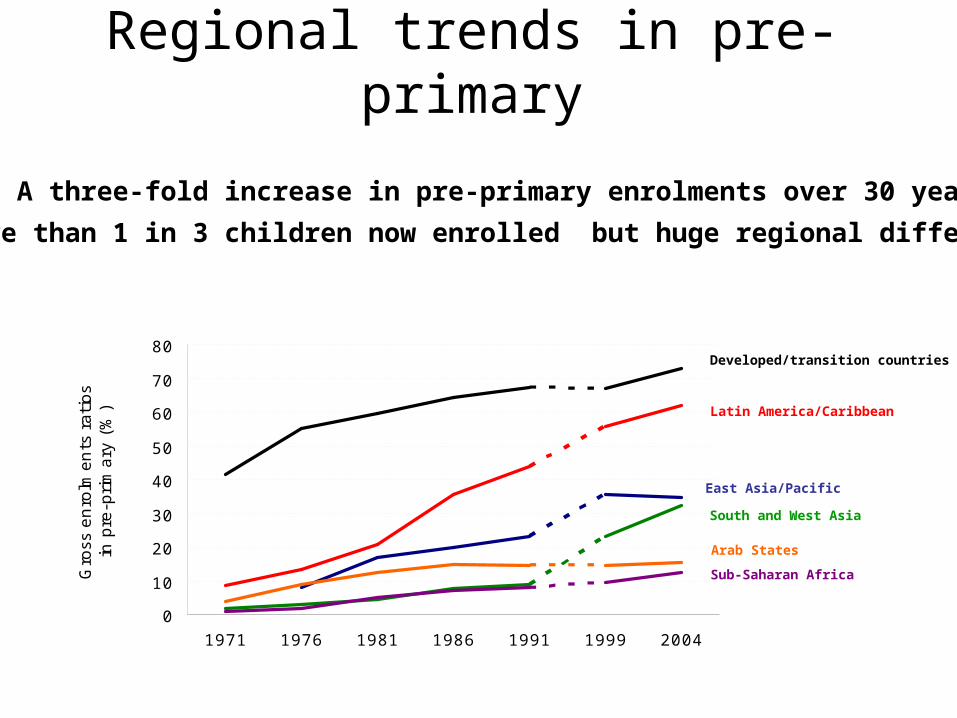
Regional trends in pre-primary
Developed/transition countries
Latin America/Caribbean
East Asia/Pacific
South and West Asia
Arab States
Sub-Saharan Africa
A three-fold increase in pre-primary enrolments over 30 years
More than 1 in 3 children now enrolled but huge regional differences
0
10
20
30
40
50
60
70
80
1971 1976 1981 1986 1991 1999 2004
Gro
ss e
nro
lmen
ts r
ati
os
in p
re-p
rim
ary
(%
)

% of Children who Enter Grade 1 and ReachGrade 5 by Region
UNESCO 2005
61.066.0
83.0
91.0 93.098.0
0.0
20.0
40.0
60.0
80.0
100.0
SA AFR LAC MENA EAP ECA
In %
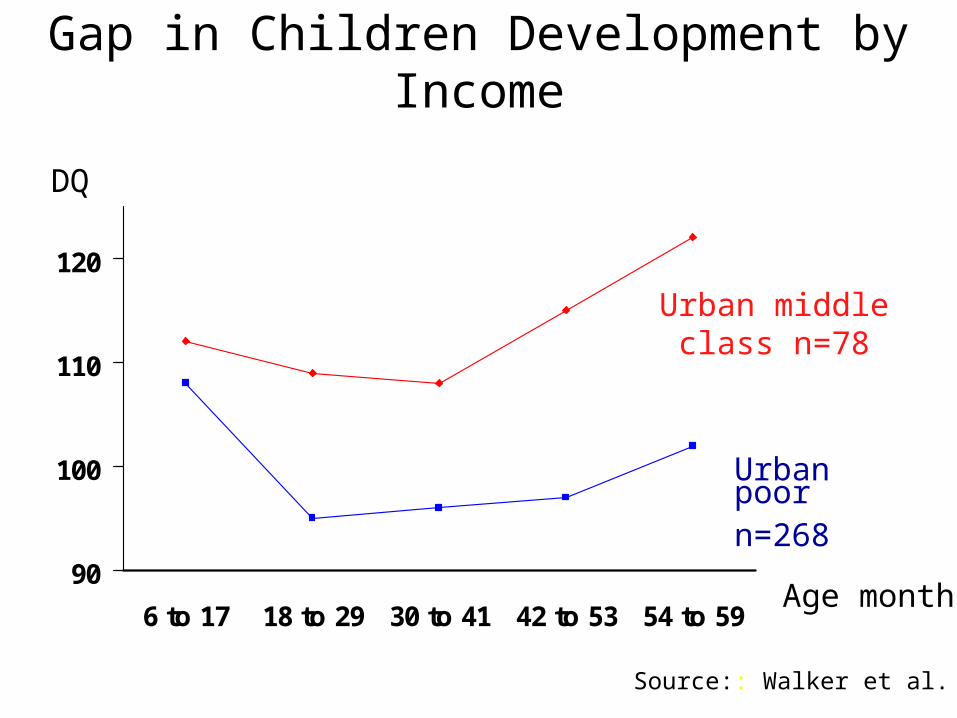
Gap in Children Development by Income
90
100
110
120
6 to 17 18 to 29 30 to 41 42 to 53 54 to 59
DQ
Age months
Urban middle class n=78
Urban poor n=268
Source:: Walker et al.

Vocabulary Scores by SES quartiles in 36 to 72 month old children Ecuador
age in months
Source: C. Paxson, N. Schady: Cognitive development among young children in Ecuador : The roles
of wealth, health and parenting, The World Bank, Policy Research Working Paper, 3605, 2005.
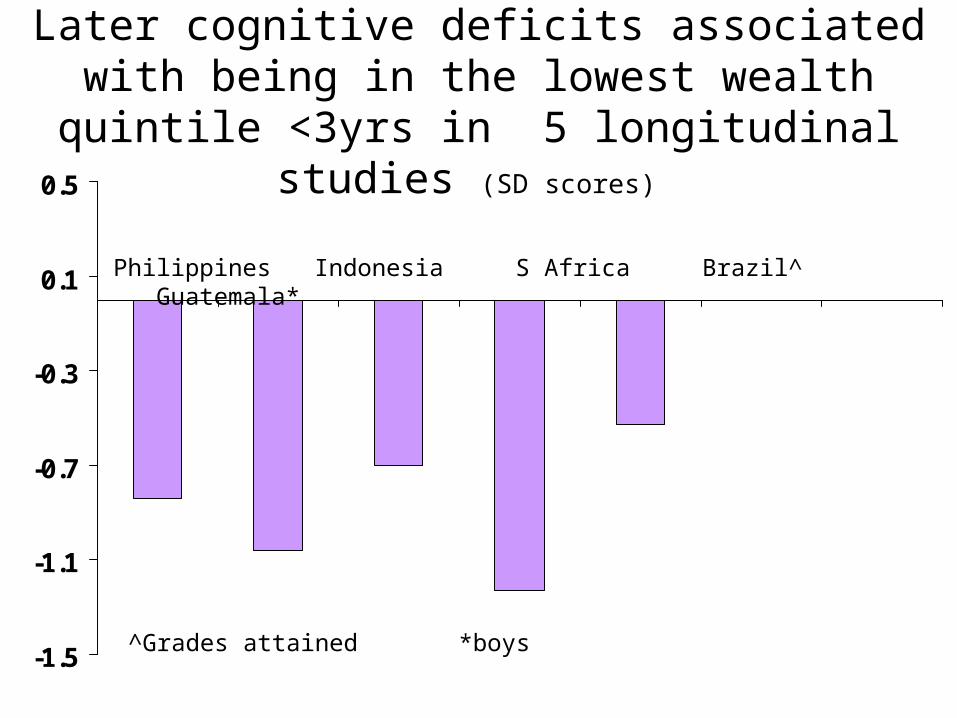
Later cognitive deficits associated with being in the lowest wealth quintile <3yrs in 5 longitudinal
studies (SD scores)
-1.5
-1.1
-0.7
-0.3
0.1
0.5
Philippines Indonesia S Africa Brazil^ Guatemala*
^Grades attained *boys

IQ scores of stunted and non-stunted Jamaican children from age 9-24 mo to 18 y
Non-stunted
Stunted..
-0.6
-0.4
-0.2
0
0.2
0.4
0.6
0.8
Griffiths onEnrollment(9-24 mo)
Griffiths(33-48 mo))
Stanford-Binet(7-8 y)
WISC-R(11-12 y)
WAIS(17-18 y)
SD
sco
re
Source: S. Grantham-McGregor, and J. Habadani: Preventing the loss of children’s developmental potential, Centre of Excellence for Early Childhood Development, Vaudreuil (Québec) April 26-28, 2006

10
Intergenerational Transmission of Poverty
preschool childlow IQ, behavior problems
schoolpoor school achievement,
behavior problems
adult
low education
low skilled/no work
high fertility
depressed/stressed
Poor stimulation,
health and nutrition
National
Economy

10
If all these were true, do we know what to do?
To start with,• better nutrition,• essential mother and
child care, and• early sustained
sensory and social stimulation
Program Options:• Delivery of services to young
children• Education and support of
parents• training and support of
caregivers/paraprofessionals• Sensitization of the public,
through the mass media, to the value of ECD
• Promoting and strengthening community-based activities
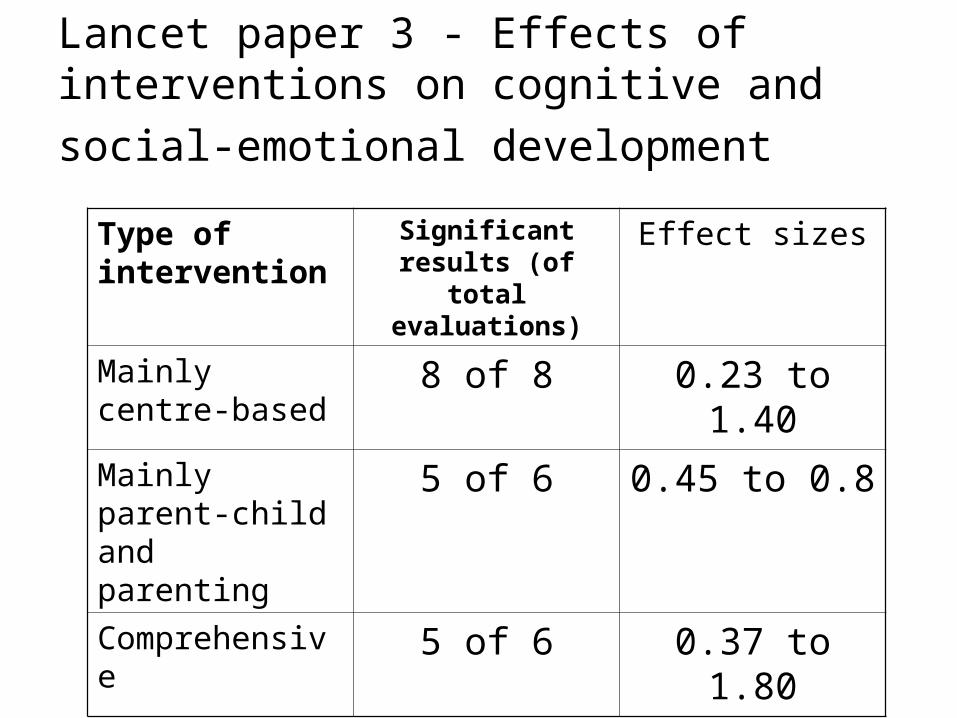
Lancet paper 3 - Effects of interventions on
cognitive and social-emotional development
Type of intervention
Significant results (of total
evaluations)
Effect sizes
Mainly centre-based
8 of 8 0.23 to 1.40
Mainly parent-child and parenting
5 of 6 0.45 to 0.8
Comprehensive 5 of 6 0.37 to 1.80

Philippines Early Child Development Program
-0.5
0
0.5
1
1.5
2
4 to 12 mos 13 to 16 mos 17 to 25 mos
Duration in months
Dev
elop
men
tal I
nd
ex
(z-s
core
) 2 yrs
3 yrs
4 yrs
5 yrs
6 yrs
Developmental index varies by child’s age and duration of time in program, favoring younger children with longer duration.
Child age at initiation

Closing the Gap…
Opportunities and Challenges

0 1 2 3 4 5 6
parent-oriented
child-oriented
Opportunities.. Source of Brain Stimulation
age
Components of Early Childhood Development and Parenting Centers:
ECD & care (parental and non-parental) arrangements
Play-based learning
Prenatal & postnatal supports
Nutrition programs

Implement an Overall ECD Strategy
Intervene early, often and effectively
Allocate sufficient resources
Ensure relevant trainingNew generation competent in the understanding of human development
Build systems, not just projects.Emphasize equity, sustainability, and population health.
Monitor and evaluate. Measure child development outcomes
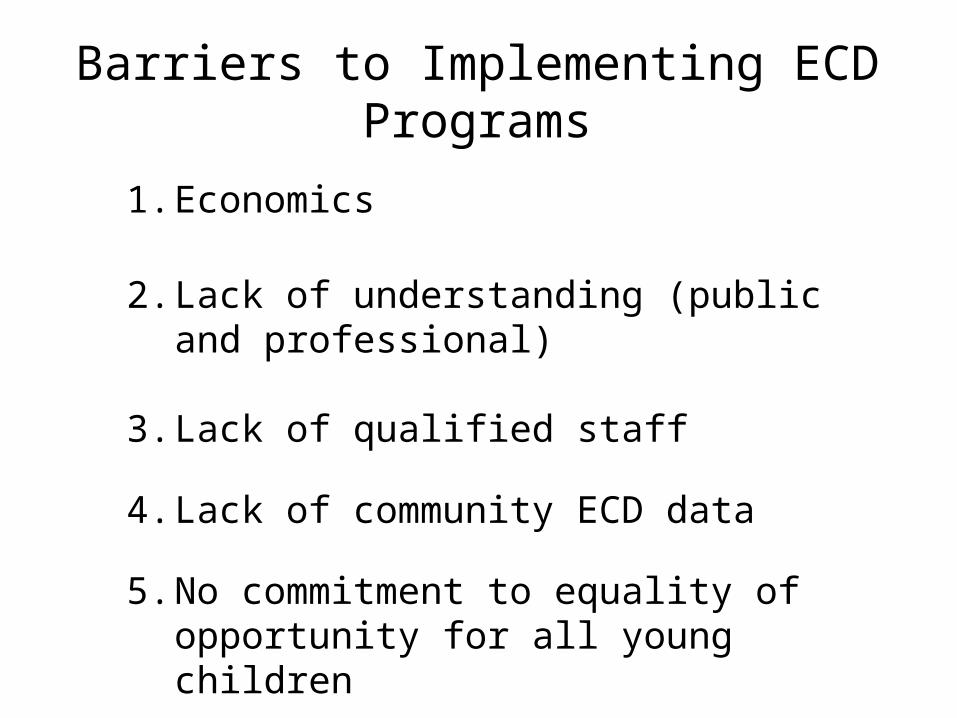
Barriers to Implementing ECD Programs
1. Economics
2. Lack of understanding (public and professional)
3. Lack of qualified staff
4. Lack of community ECD data
5. No commitment to equality of opportunity for all young children

World Bank Cumulative Lending for ECD by Regions (1990-2006)
$1.7 billion over 16 years
28.9
32.8
122.1
151.0
504.6
840.1
0.0 100.0 200.0 300.0 400.0 500.0 600.0 700.0 800.0 900.0
ECA
EAP
MENA
AFR
SA
LAC
Lending for ECD in millions (1990-2006)
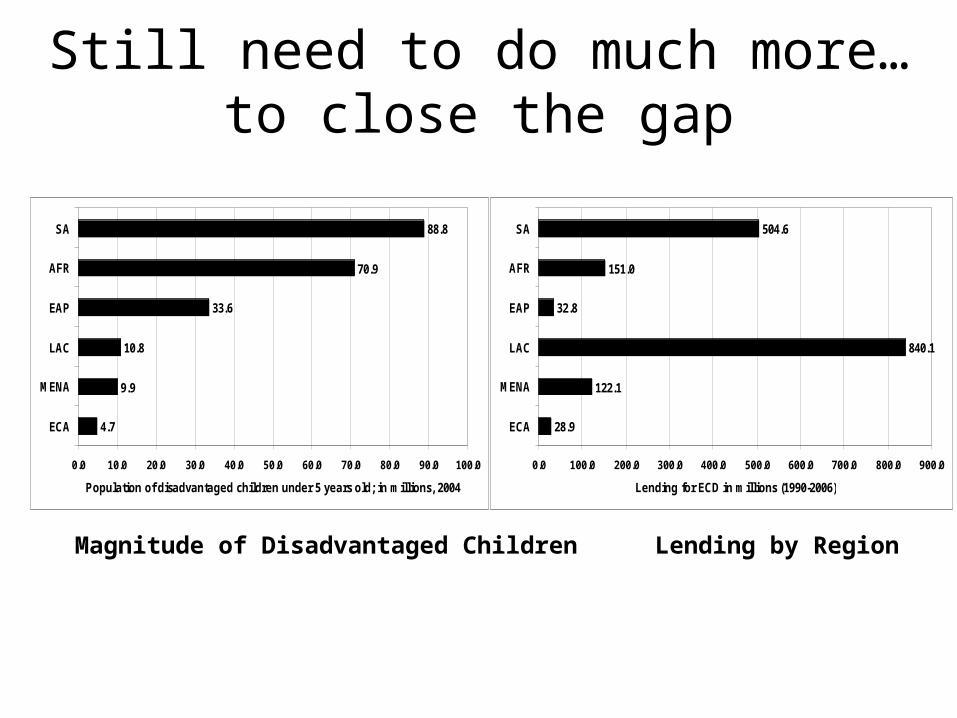
Still need to do much more…to close the gap
Magnitude of Disadvantaged Children Lending by Region
4.7
9.9
10.8
33.6
70.9
88.8
0.0 10.0 20.0 30.0 40.0 50.0 60.0 70.0 80.0 90.0 100.0
ECA
MENA
LAC
EAP
AFR
SA
Population of disadvantaged children under 5 years old; in millions, 2004
28.9
122.1
840.1
32.8
151.0
504.6
0.0 100.0 200.0 300.0 400.0 500.0 600.0 700.0 800.0 900.0
ECA
MENA
LAC
EAP
AFR
SA
Lending for ECD in millions (1990-2006)

Indicators to Monitor Differ Significantly
ChildDevelopment
Index
(measureof child
developmentoutcome)
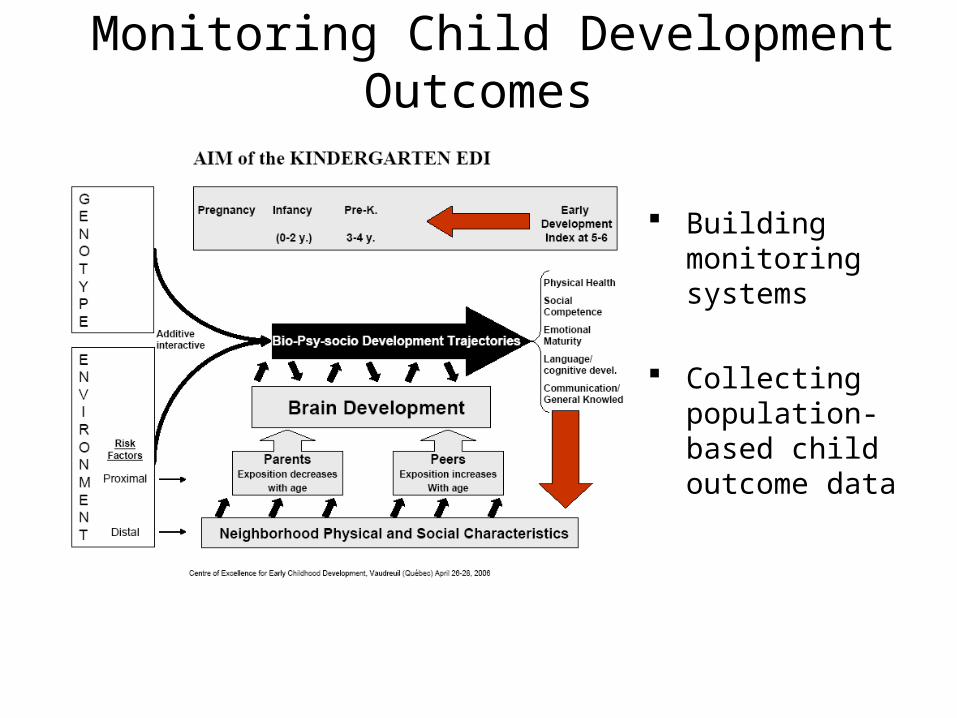
Monitoring Child Development Outcomes
Building monitoring systems
Collecting population-based child outcome data
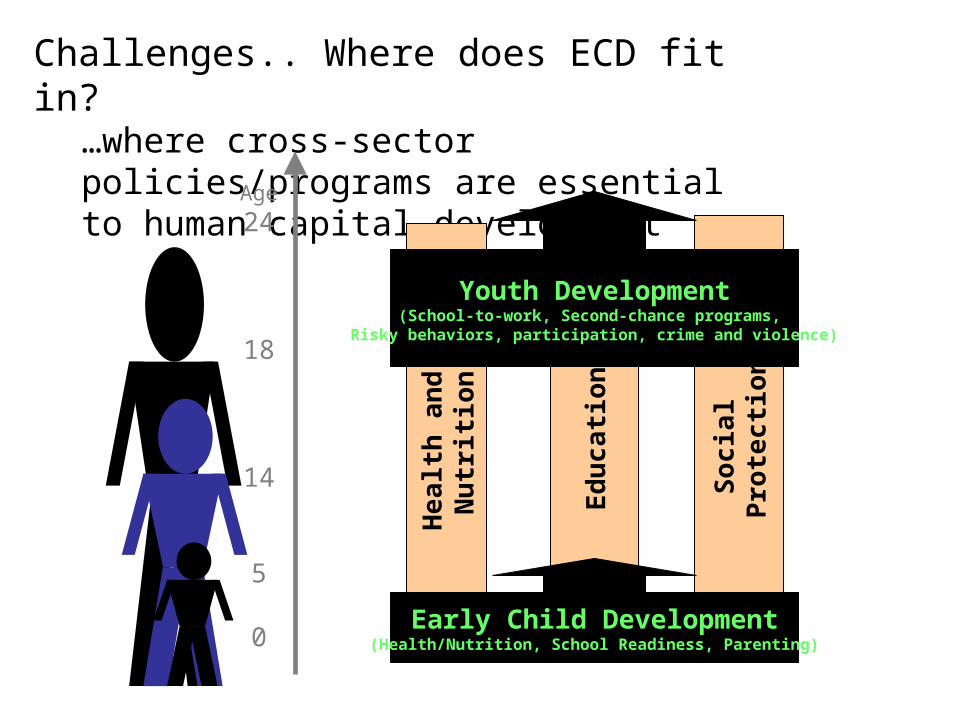
Challenges.. Where does ECD fit in? …where cross-sector policies/programs are essential to human capital development
Age24
18
14
5
0
Healt
h a
nd
N
utr
itio
n
Ed
ucati
on
Socia
l P
rote
cti
on
Early Child Development(Health/Nutrition, School Readiness, Parenting)
Youth Development(School-to-work, Second-chance programs,
Risky behaviors, participation, crime and violence)

Challenges.. A Diverse Field
Providers• Governments (national, sub-national)• Private sector (non-profit and for-profit)• International non-governmental organizations• Community-based organizations
Informal provision of care for children aged 0 to 8, by parents or extended family, mainly at home but sometimes in other family or community settings.
Primary education (age 6 up)
ECCE policies and programs for ages 3 and up -pre-primary education -non-formal education
ECCE policies and programs for ages 0 to 2 -organized care and education -non-formal care or education -support to parents
Informal care and child rearing
Organized care and education
- parental leave

Preschools
Local school
authorities
Public health
Munici-palities
Community services
Parks & recreatio
n
Early interventio
n
Health Social services Educatio
n
Family support
Chaos
Child care
Parenting centres
Children’s mental health centres
Kindergartens

Optimal Investment Levels
Pre-school School Post-school
Age0
Challenges … Optimal vs. Actual Investment
Example of the U.S
Cumulative Public Investment
Source: P. Carneiro & J. Heckman, Human Capital Policy, NBER, 2003; Voices for America and the Child and Family Policy Center, Early Learning Left Out An Examination of Public Investment in Education and Development by Child Age, 2004.

Sweden’s Public Expenditure for Children 0-17 age old - Ultimate Goal!!
Source: S. Bremberg (2006), National Institute of Public Health, Karolinska Institute, Stockholm, Sweden