Embed Size (px)
Citation preview
You found an You found an interaction! interaction! Now what?Now what?
A practical guide to graphing & probing A practical guide to graphing & probing significant interactionssignificant interactions
Design and Statistical Analysis Lab ColloquiumDesign and Statistical Analysis Lab Colloquium
Laura J. ShermanLaura J. Sherman
[email protected]@gmail.com
Bauer & Curran (2005)Bauer & Curran (2005)
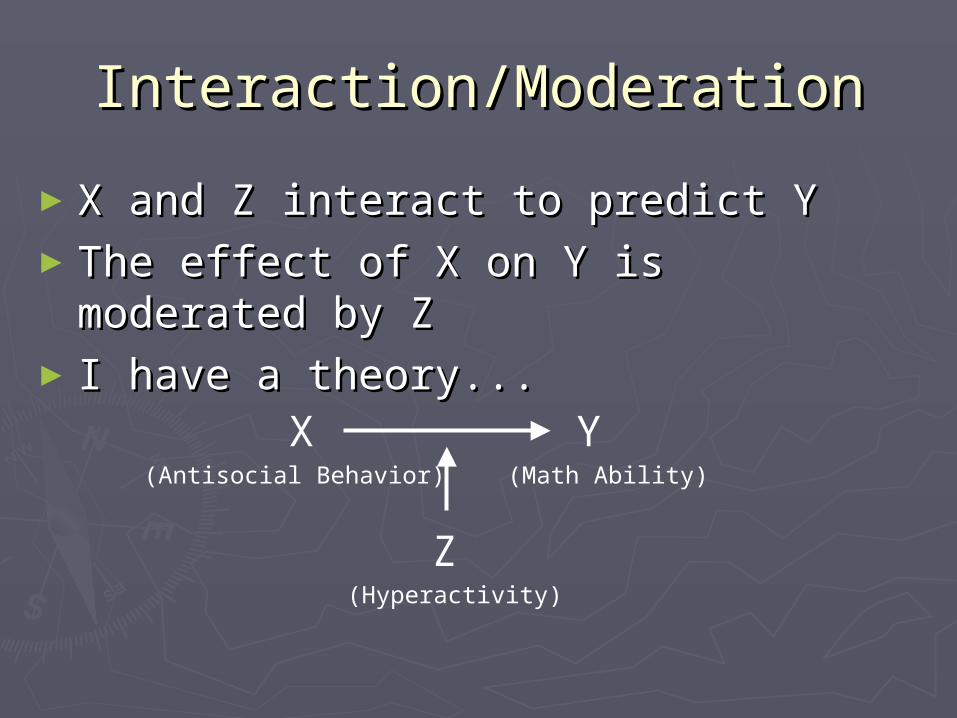
Interaction/ModerationInteraction/Moderation
►X and Z interact to predict YX and Z interact to predict Y►The effect of X on Y is moderated by ZThe effect of X on Y is moderated by Z► I have a theory...I have a theory...
X Y
Z
(Antisocial Behavior) (Math Ability)
(Hyperactivity)
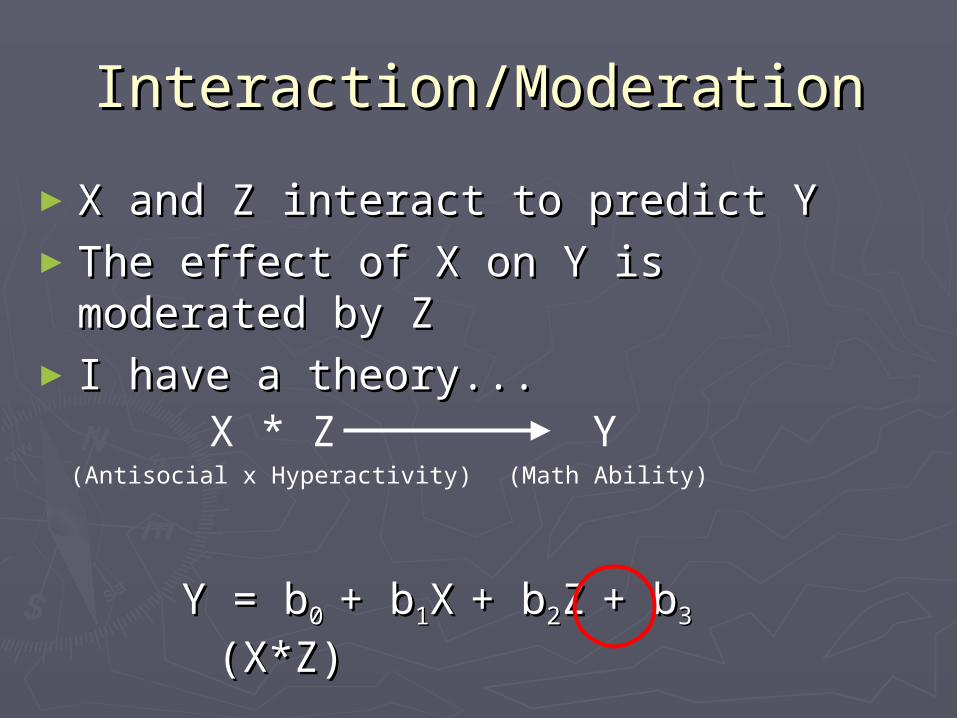
Interaction/ModerationInteraction/Moderation
►X and Z interact to predict YX and Z interact to predict Y►The effect of X on Y is moderated by ZThe effect of X on Y is moderated by Z► I have a theory...I have a theory...
X * Z Y(Antisocial x Hyperactivity) (Math Ability)
Y = bY = b0 0 + b+ b11XX + b+ b22ZZ + b+ b3 3
(X*Z)(X*Z)
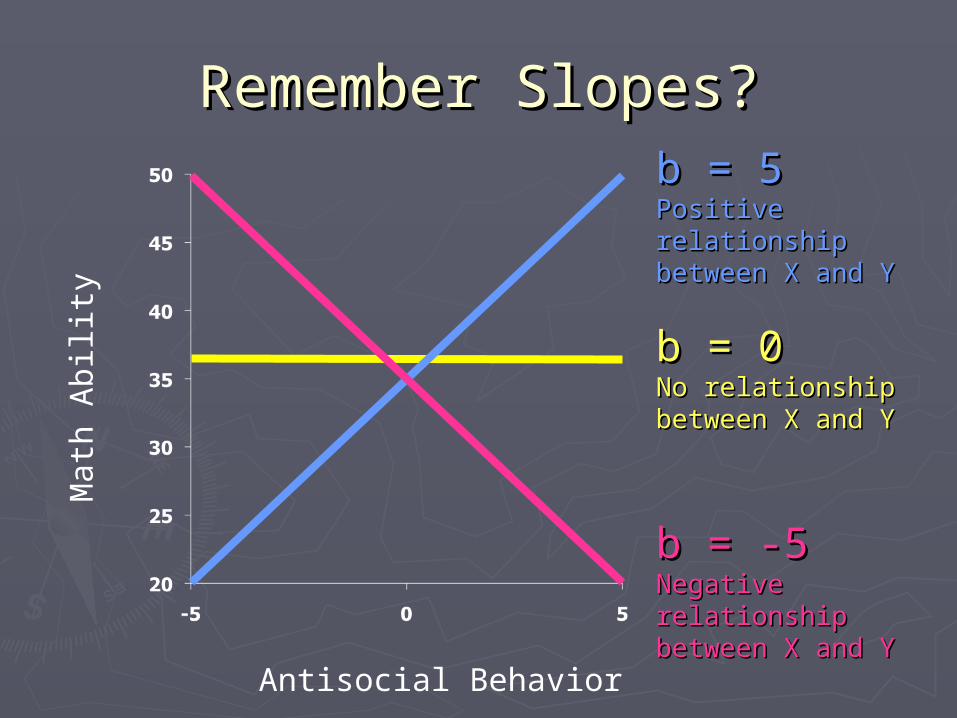
Remember Slopes?Remember Slopes?
Antisocial Behavior
Math
Ab
ility
b = 0b = 0No relationship No relationship between X and Ybetween X and Y
b = 5b = 5Positive relationship Positive relationship between X and Ybetween X and Y
b = -5b = -5Negative relationship Negative relationship
between X and Ybetween X and Y
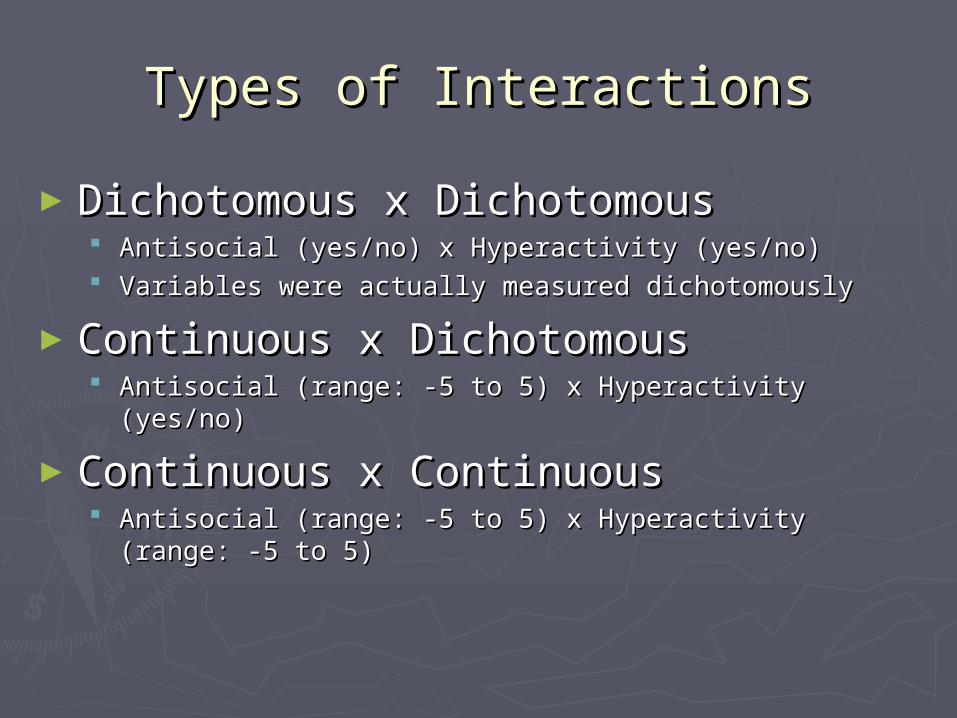
Types of InteractionsTypes of Interactions
►Dichotomous x DichotomousDichotomous x Dichotomous Antisocial (yes/no) x Hyperactivity (yes/no)Antisocial (yes/no) x Hyperactivity (yes/no) Variables were actually measured dichotomouslyVariables were actually measured dichotomously
►Continuous x DichotomousContinuous x Dichotomous Antisocial (range: -5 to 5) x Hyperactivity (yes/no)Antisocial (range: -5 to 5) x Hyperactivity (yes/no)
►Continuous x ContinuousContinuous x Continuous Antisocial (range: -5 to 5) x Hyperactivity (range: -5 to 5)Antisocial (range: -5 to 5) x Hyperactivity (range: -5 to 5)
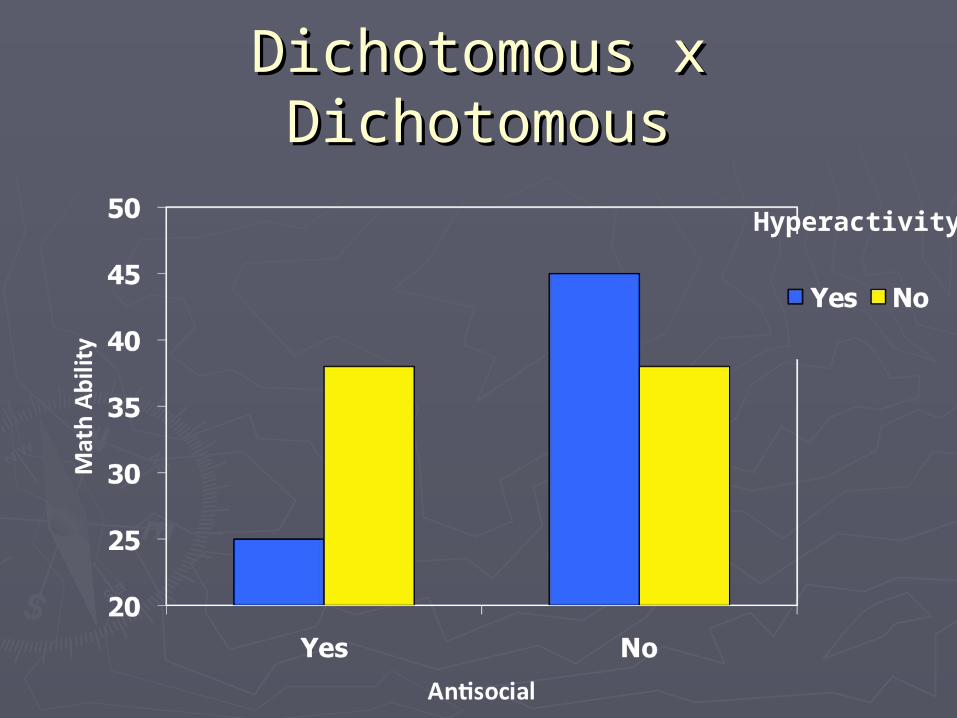
Dichotomous x DichotomousDichotomous x Dichotomous
Hyperactivity
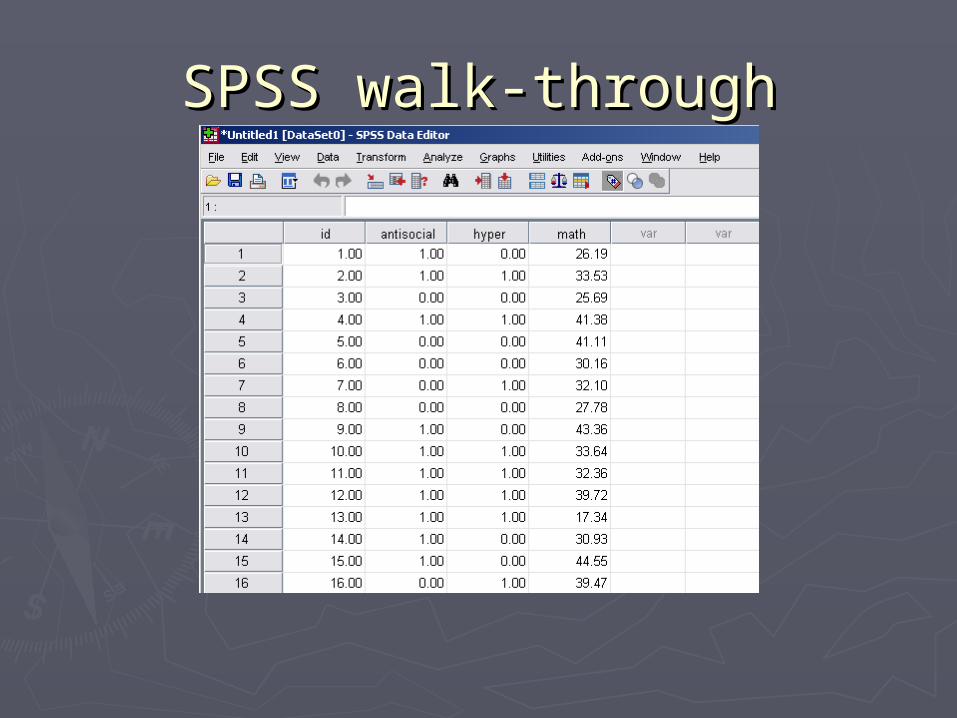
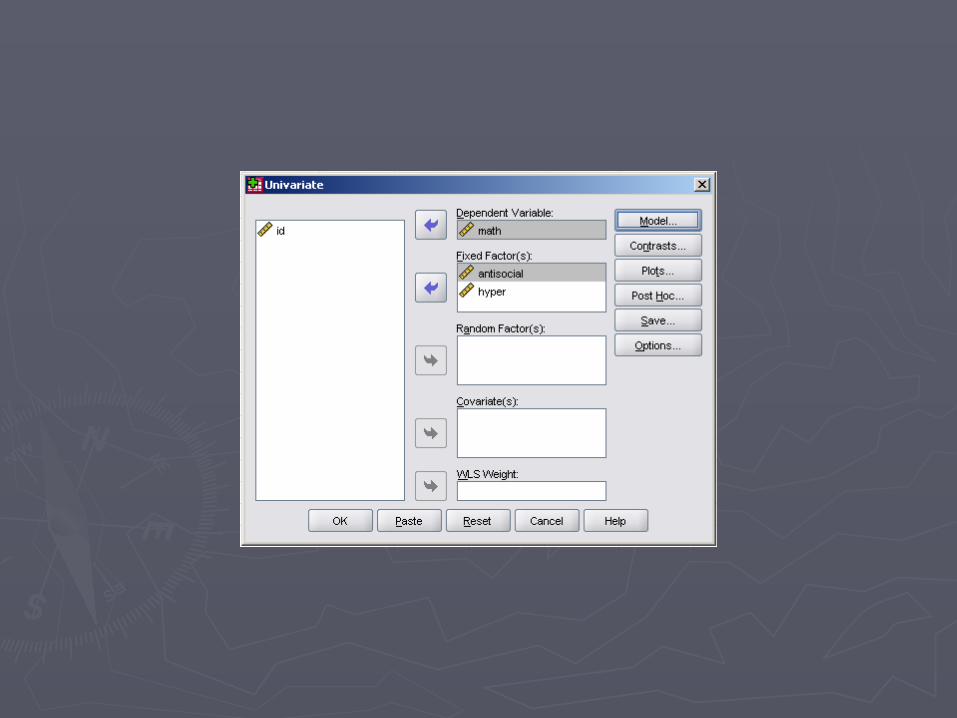
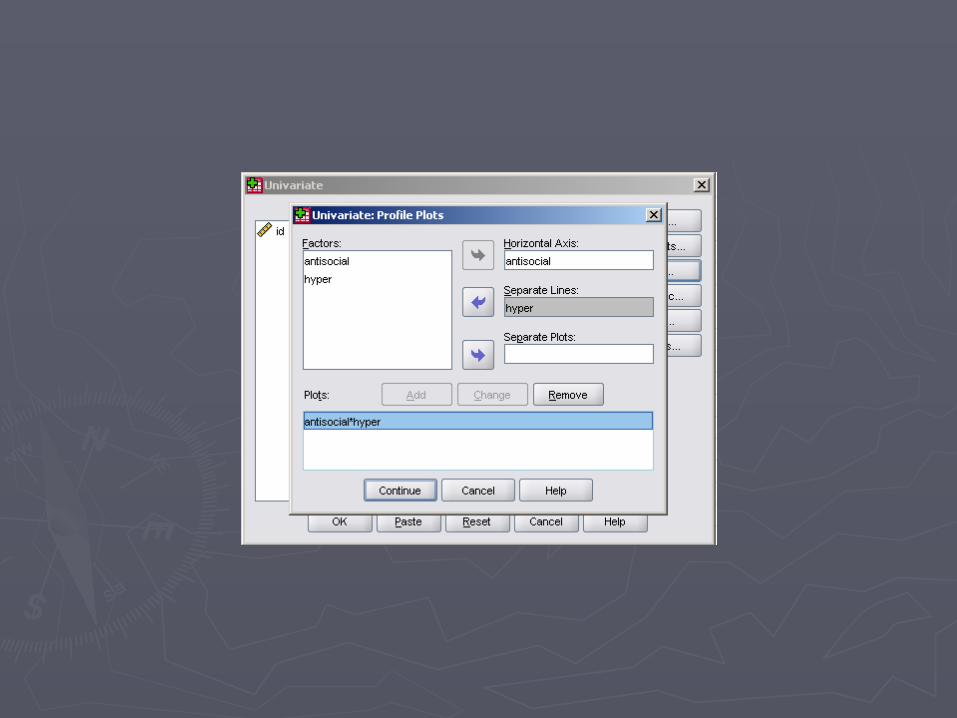
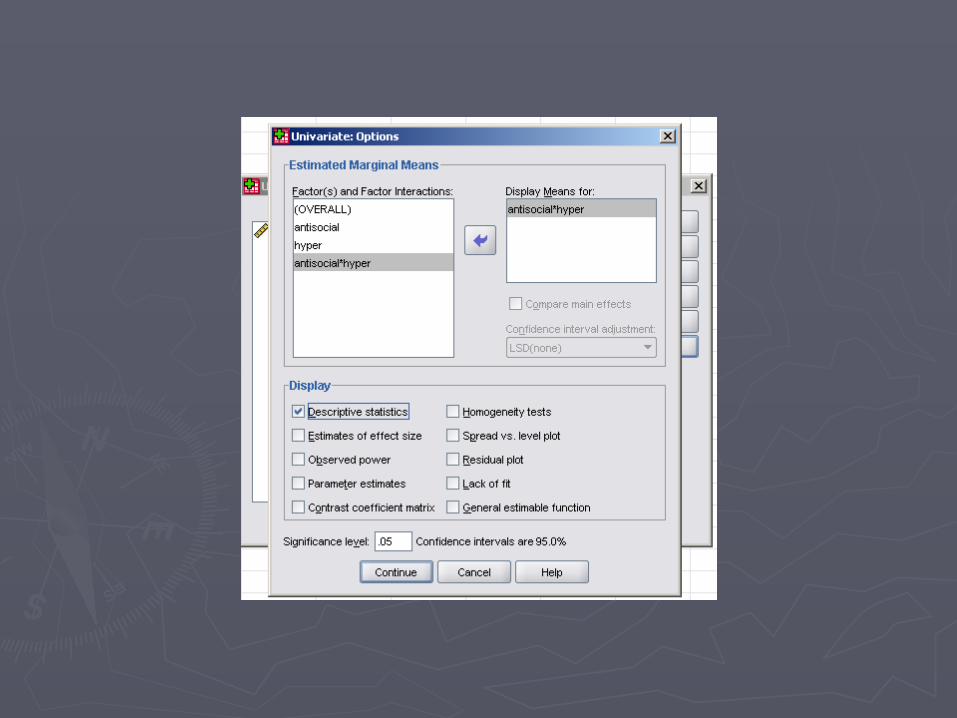
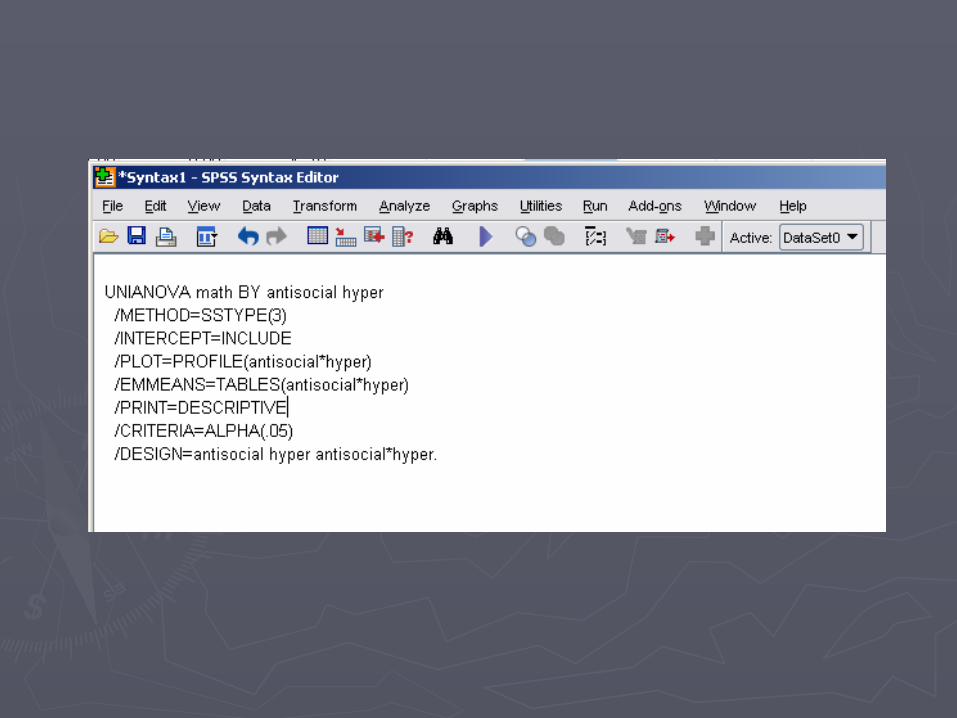
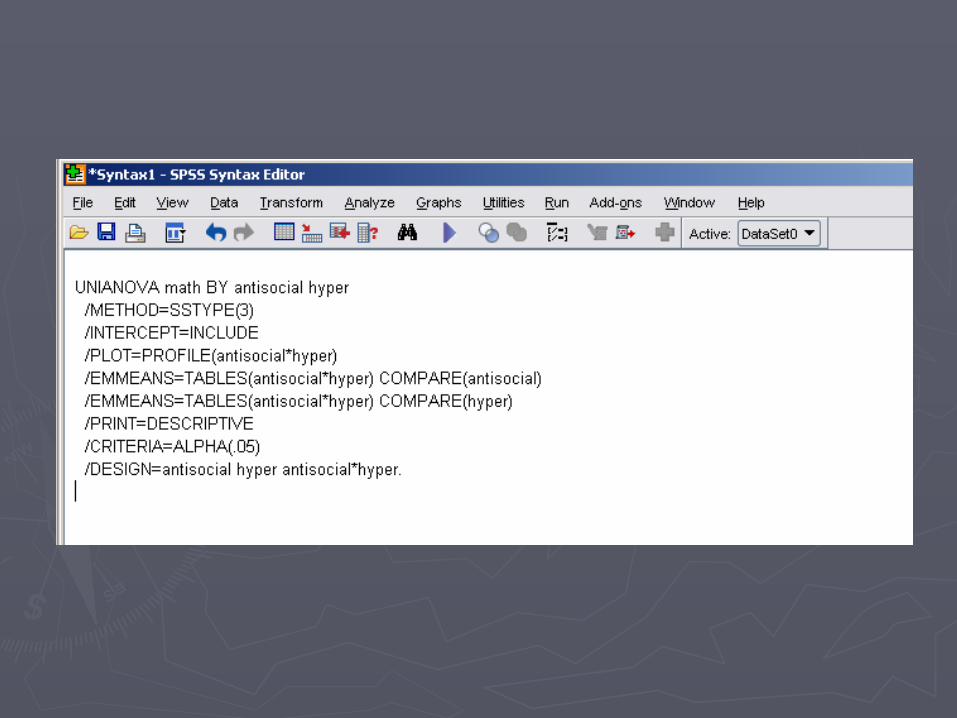
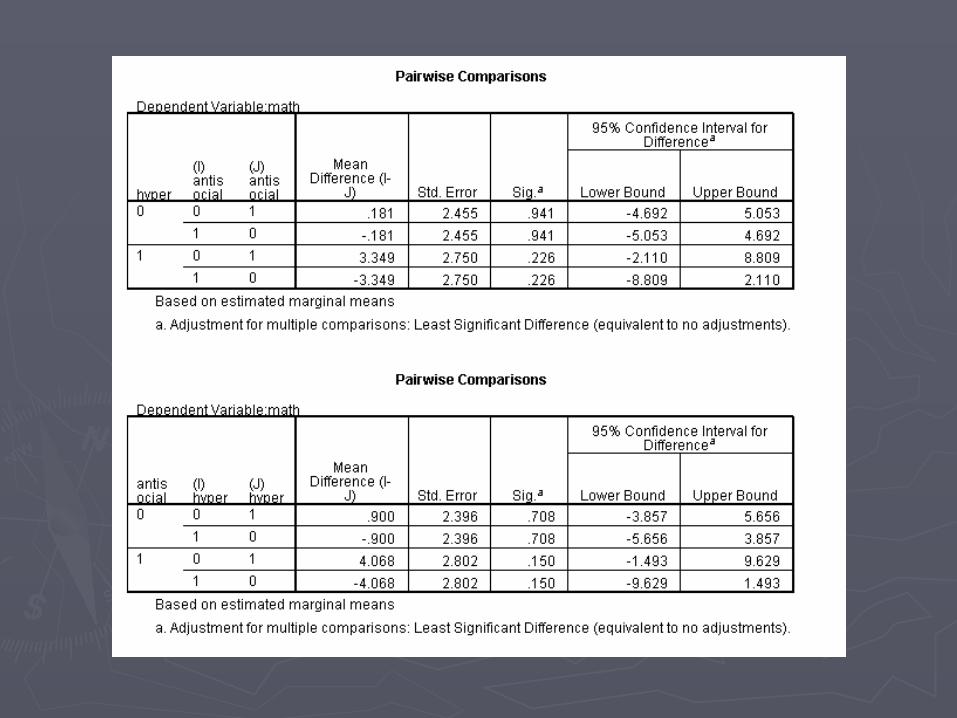
SPSS walk-throughSPSS walk-through
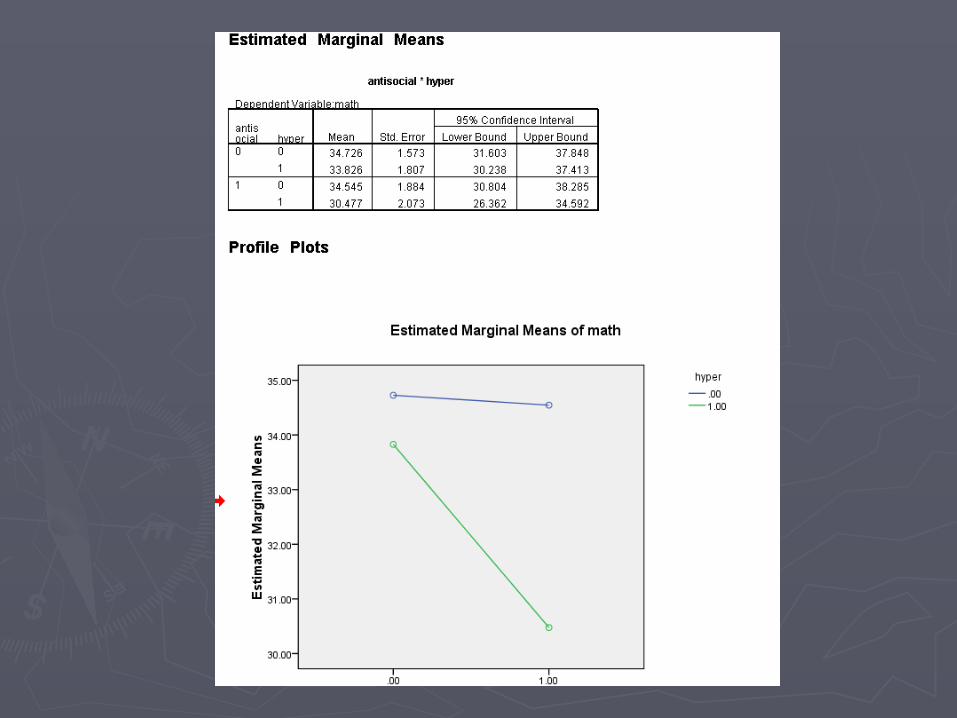
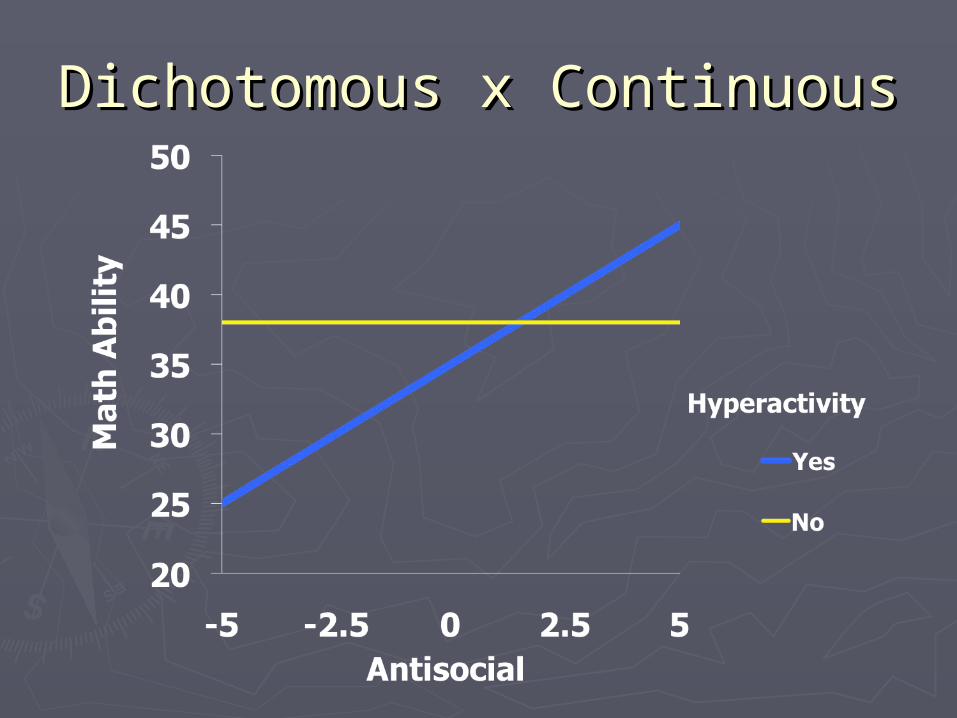
Dichotomous x ContinuousDichotomous x Continuous
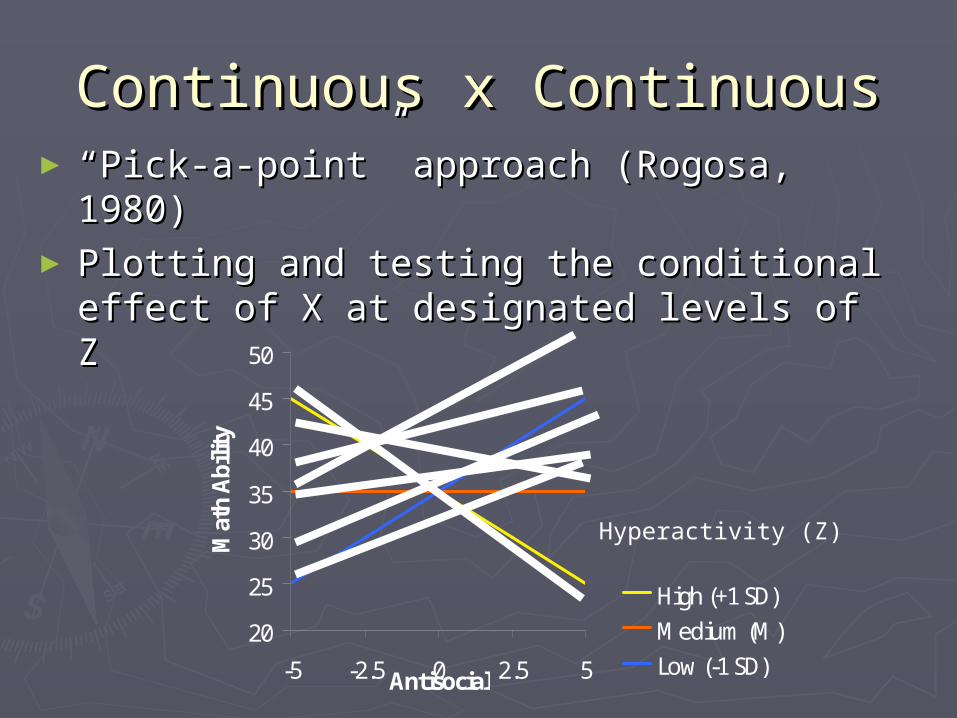
Continuous x ContinuousContinuous x Continuous► ““Pick-a-point” approach (Rogosa, 1980)Pick-a-point” approach (Rogosa, 1980)► Plotting and testing the conditional effect of Plotting and testing the conditional effect of
X at designated levels of ZX at designated levels of Z
20
25
30
35
40
45
50
-5 -2.5 0 2.5 5Antisocial
Mat
h A
bilit
y
High (+1 SD)Medium (M)Low (-1 SD)
Hyperactivity (Z)

Problems with pick-a-point Problems with pick-a-point approachapproach
►Values selected arbitrarilyValues selected arbitrarily►May even be outside range of May even be outside range of
observed sample dataobserved sample data►Sample dependentSample dependent►You designated a continuous variable, You designated a continuous variable,
but you are only testing its effect at a but you are only testing its effect at a few valuesfew values
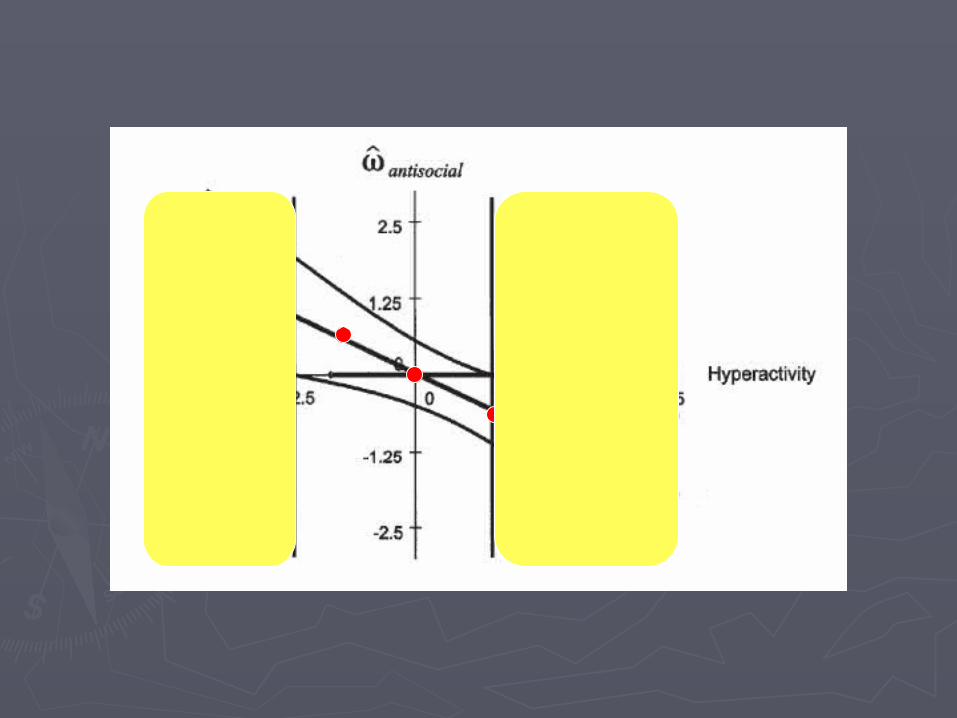
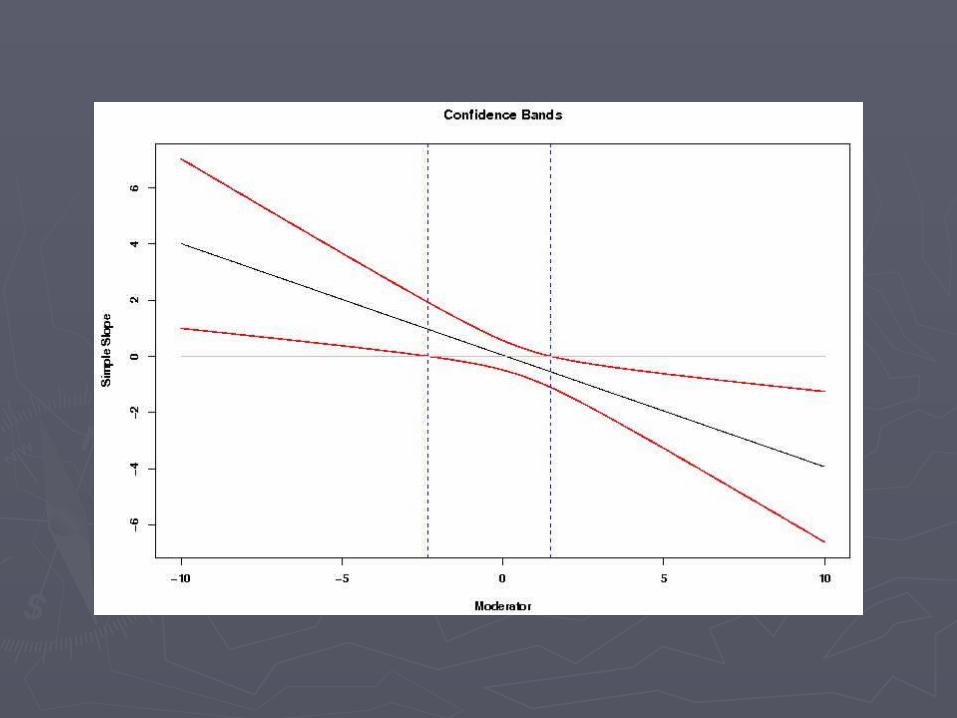
Johnson-Neyman TechniqueJohnson-Neyman Technique
►Computation of regions of significanceComputation of regions of significance Indicates Indicates over what range of the moderator over what range of the moderator
the effect of X is significantly positive, the effect of X is significantly positive, nonsignificant, or significantly negativenonsignificant, or significantly negative
►Plotting of confidence bands for the Plotting of confidence bands for the conditional effectconditional effect APA task force: confidence intervals are much APA task force: confidence intervals are much
more informative than null hypothesis testsmore informative than null hypothesis tests In the case of conditional effects, both the In the case of conditional effects, both the
effect estimate and its standard error vary as effect estimate and its standard error vary as a function of M. Cannot plot just one a function of M. Cannot plot just one confidence interval, must plot bands over full confidence interval, must plot bands over full range of M.range of M.
Empirical ExampleEmpirical Example
►Child math ability, antisocial, & Child math ability, antisocial, & hyperactivityhyperactivity
►Hypothesis: There would be a negative Hypothesis: There would be a negative relation between antisocial behavior relation between antisocial behavior and math ability that would be and math ability that would be moderated by the presence of child moderated by the presence of child hyperactive behavior.hyperactive behavior.
►Stated alternatively, antisocial behavior Stated alternatively, antisocial behavior and hyperactive behavior interact to and hyperactive behavior interact to predict math abilitypredict math ability
(assessment of the Children of the National Longitudinal Survey of Youth, 1990)(assessment of the Children of the National Longitudinal Survey of Youth, 1990)
Prepping VariablesPrepping Variables
►Mean center X and ZMean center X and Z►Calculate X * Z variable (do not center Calculate X * Z variable (do not center
that)that)
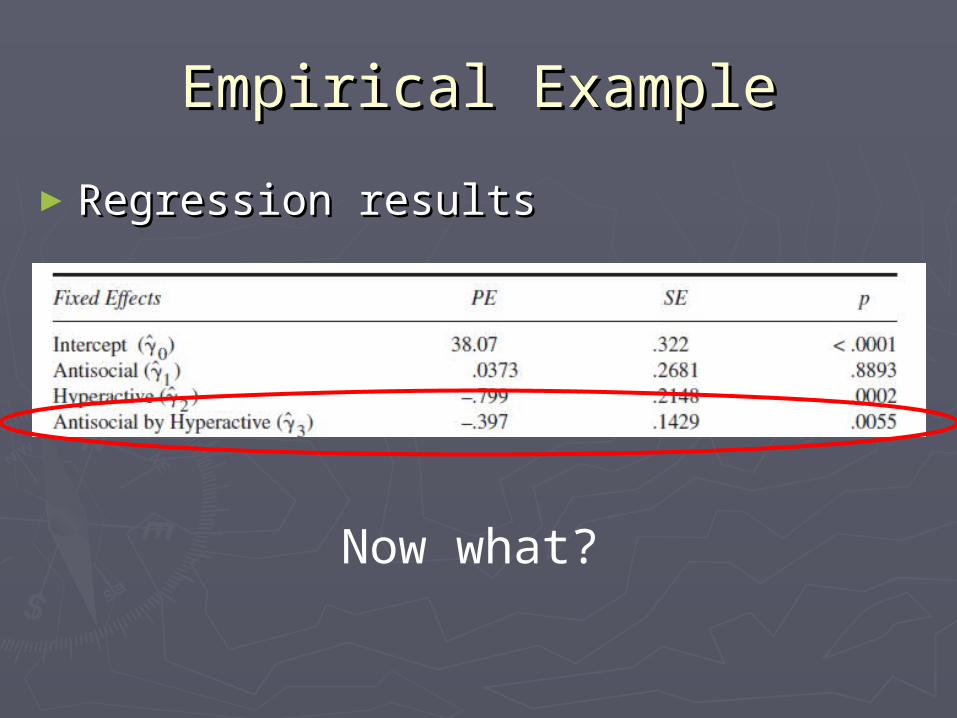
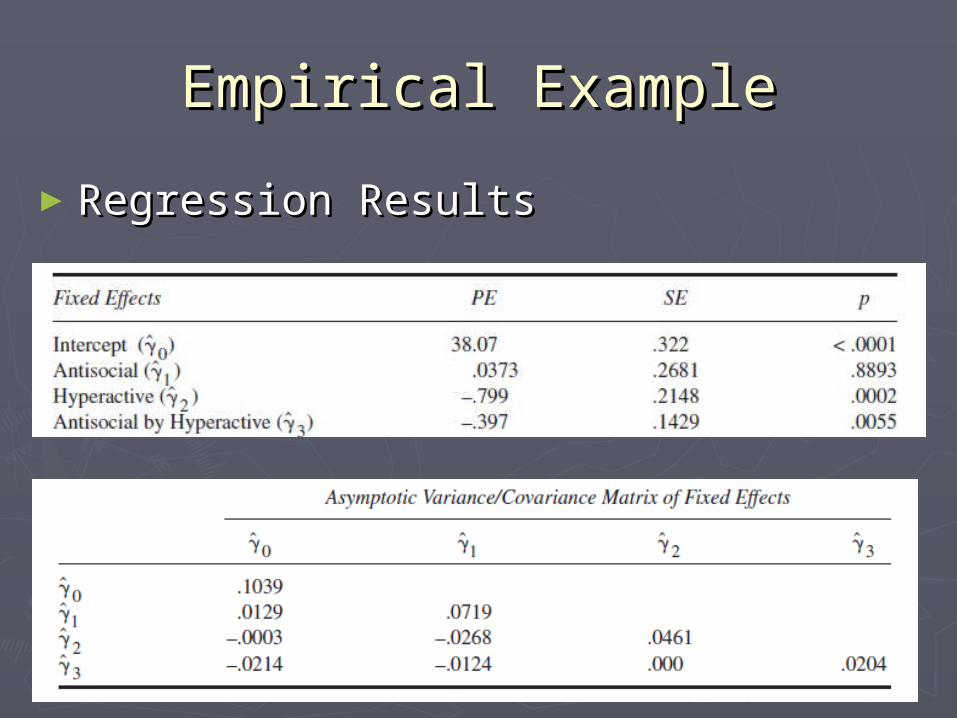
Empirical ExampleEmpirical Example
►Regression resultsRegression results
Now what?
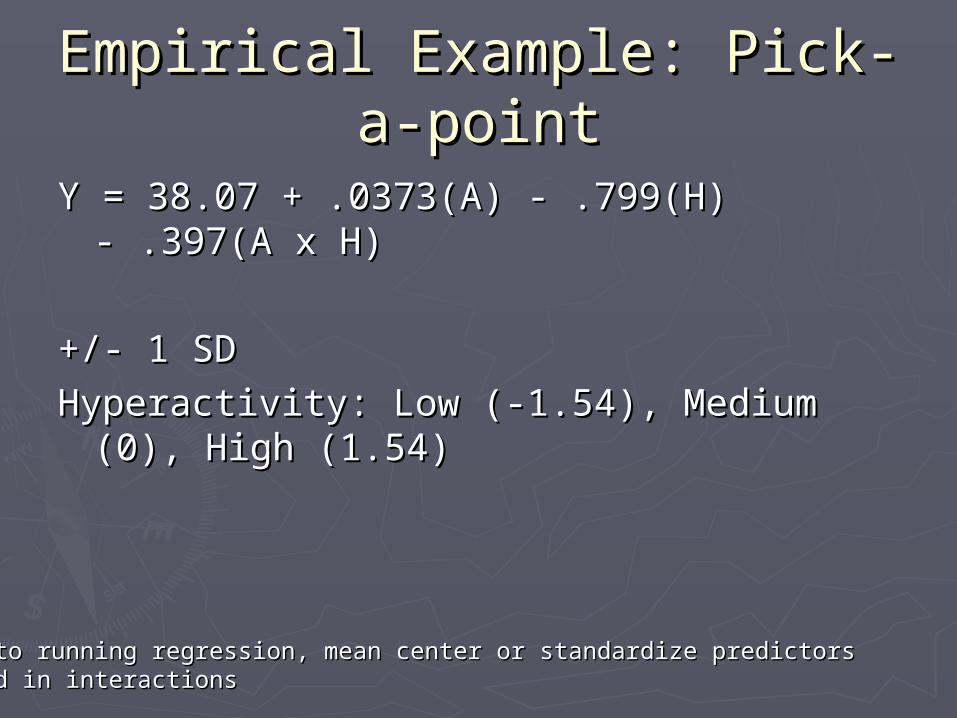
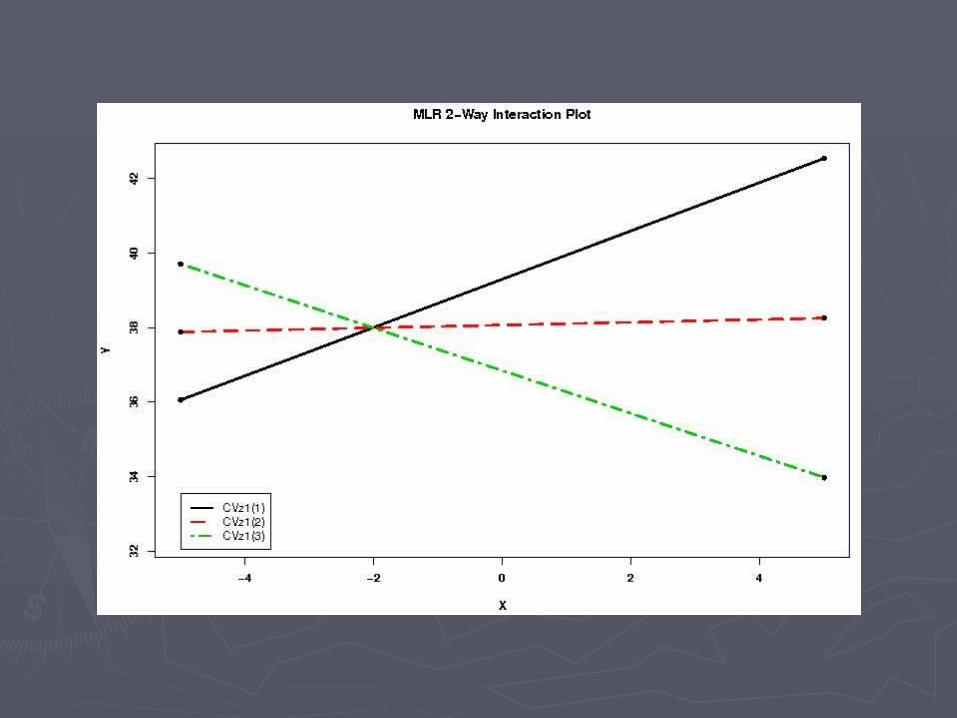
Empirical Example: Pick-a-Empirical Example: Pick-a-pointpoint
Y = 38.07 + .0373(A) - .799(H) - .397(A x H)Y = 38.07 + .0373(A) - .799(H) - .397(A x H)
+/- 1 SD+/- 1 SD
Hyperactivity: Low (-1.54), Medium (0), High Hyperactivity: Low (-1.54), Medium (0), High (1.54)(1.54)
*Prior to running regression, mean center or standardize predictors *Prior to running regression, mean center or standardize predictors involved in interactionsinvolved in interactions
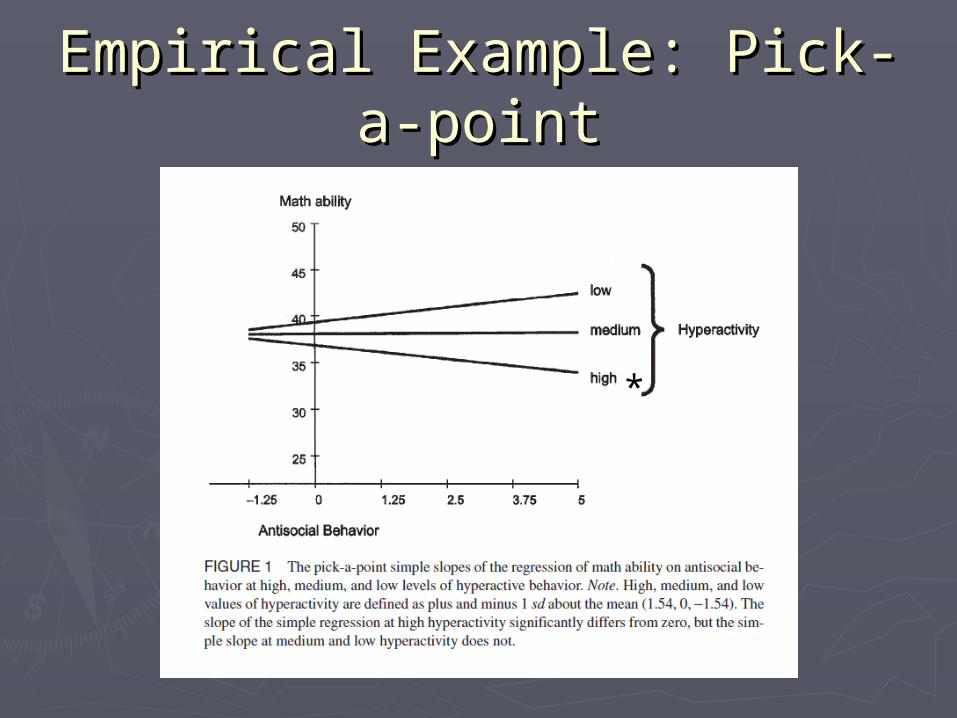
Empirical Example: Pick-a-Empirical Example: Pick-a-pointpoint
*
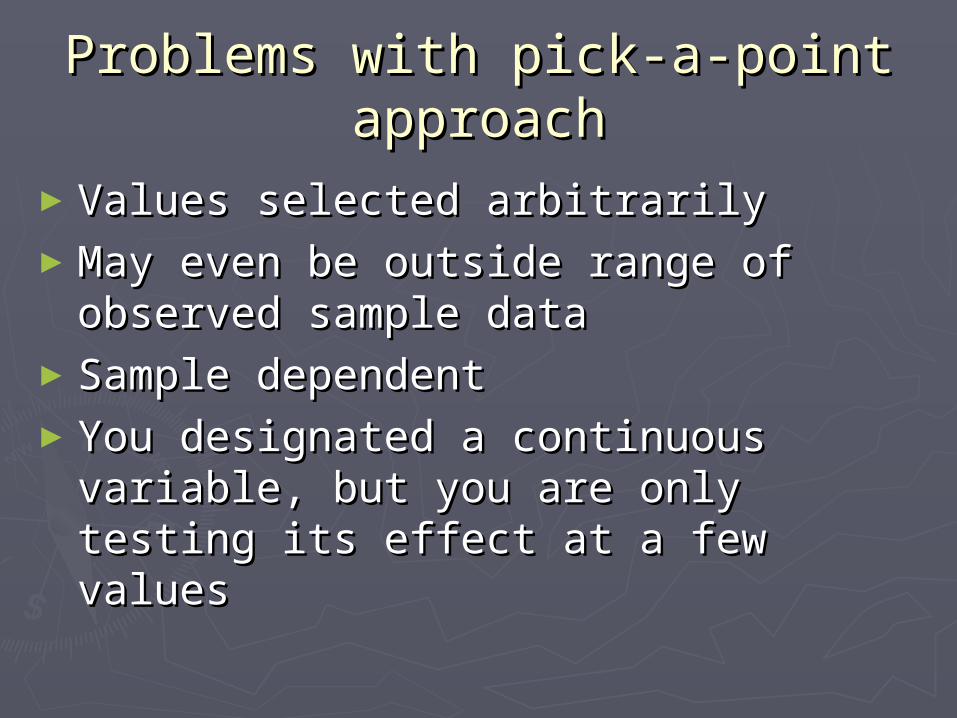
Problems with pick-a-point Problems with pick-a-point approachapproach
►Values selected arbitrarilyValues selected arbitrarily►May even be outside range of May even be outside range of
observed sample dataobserved sample data►Sample dependentSample dependent►You designated a continuous variable, You designated a continuous variable,
but you are only testing its effect at a but you are only testing its effect at a few valuesfew values
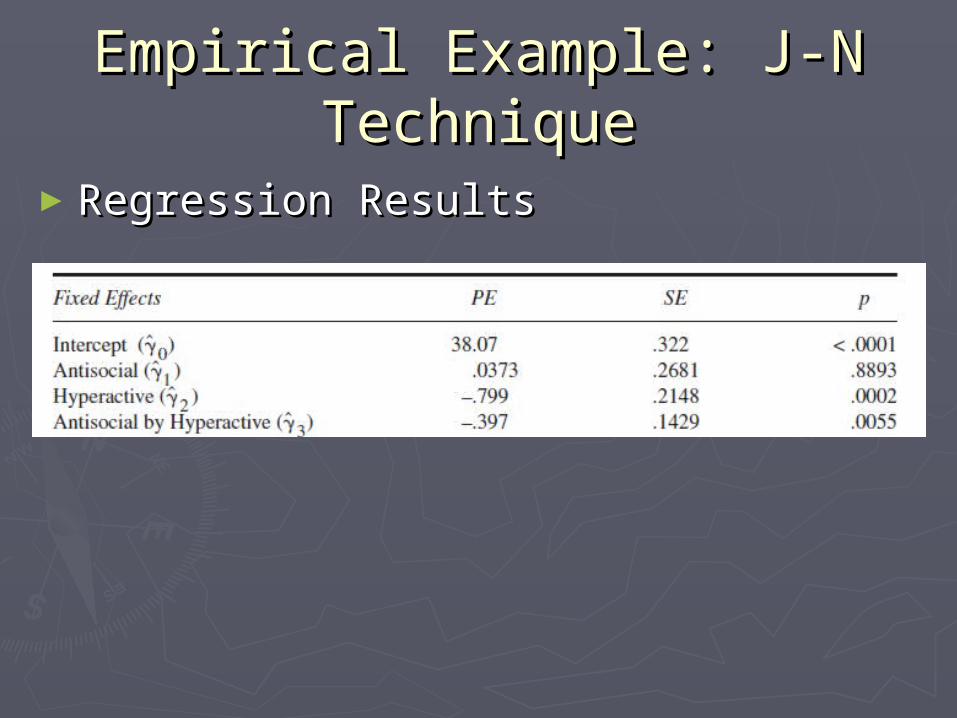
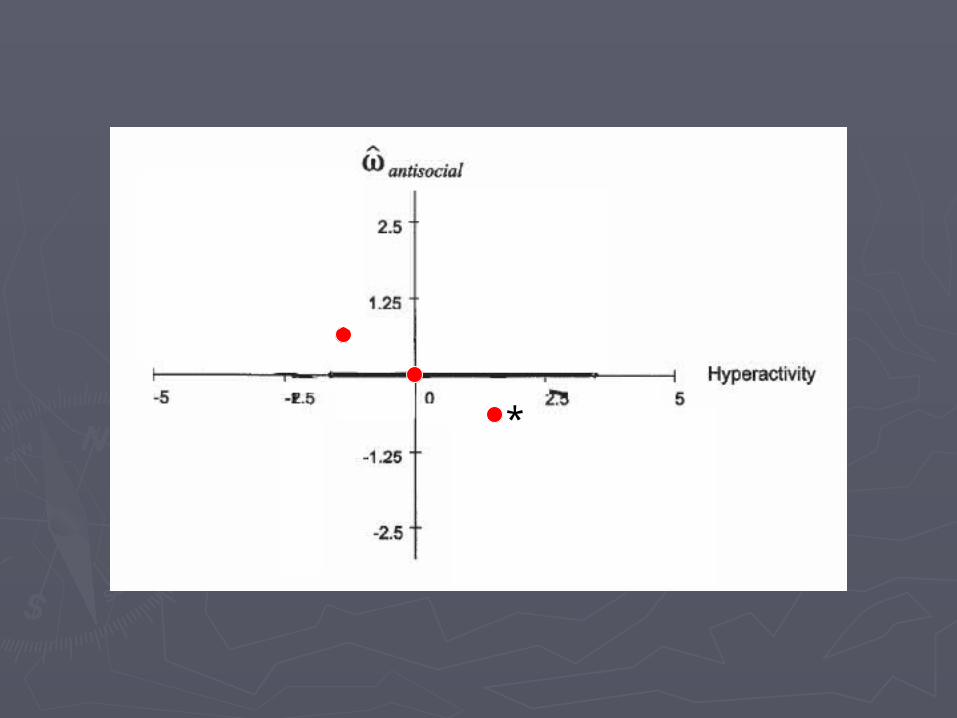
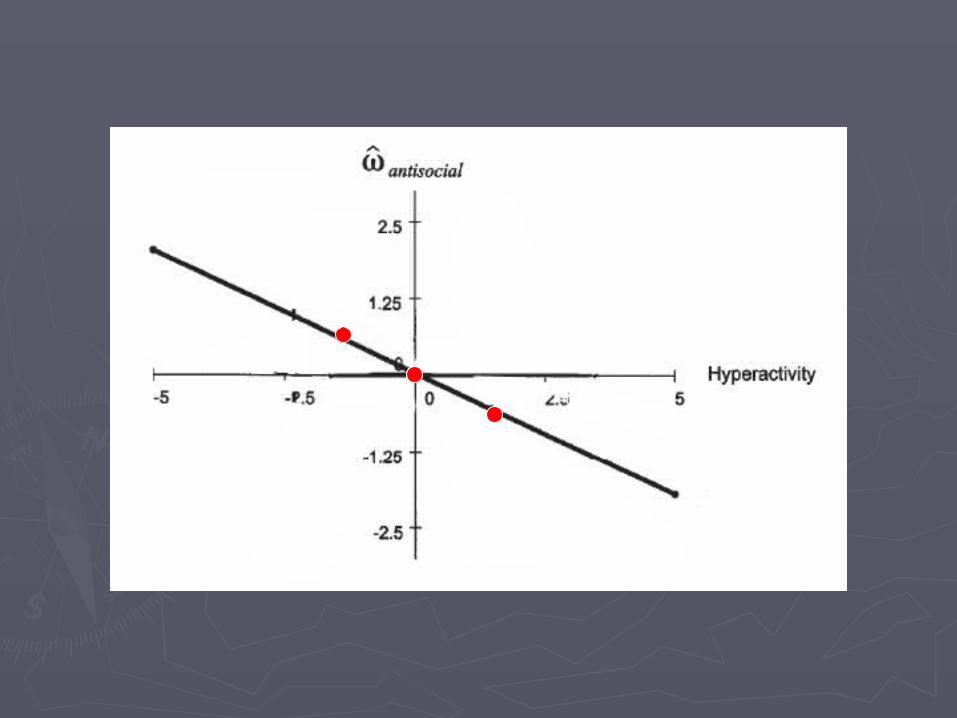
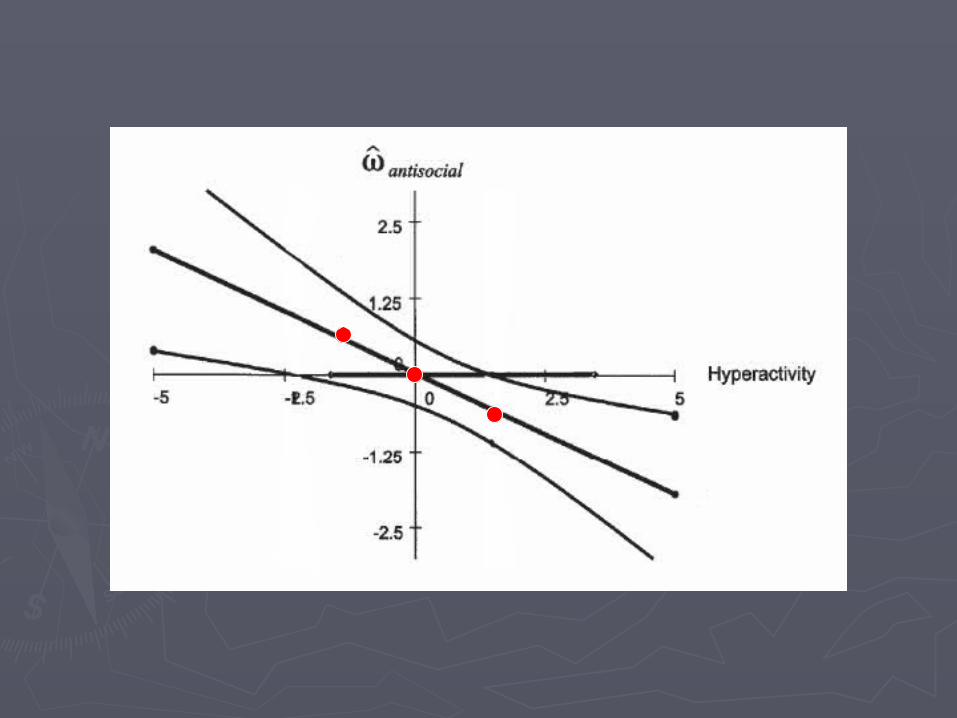
Empirical Example: J-N Empirical Example: J-N TechniqueTechnique
►Regression ResultsRegression Results
*
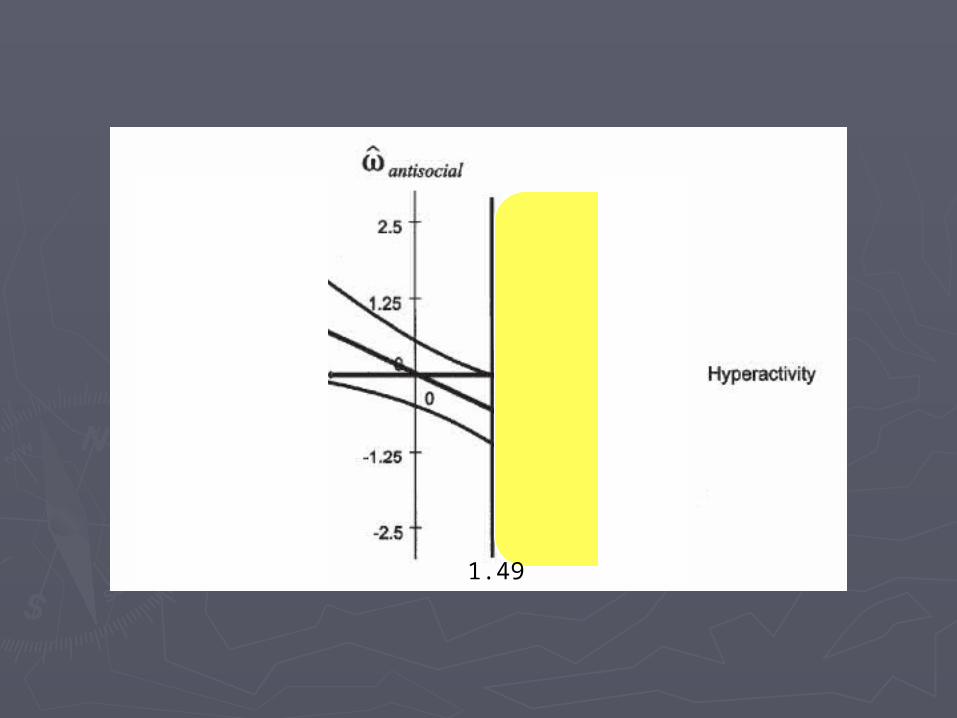
1.49
Empirical ExampleEmpirical Example
►Regression ResultsRegression Results
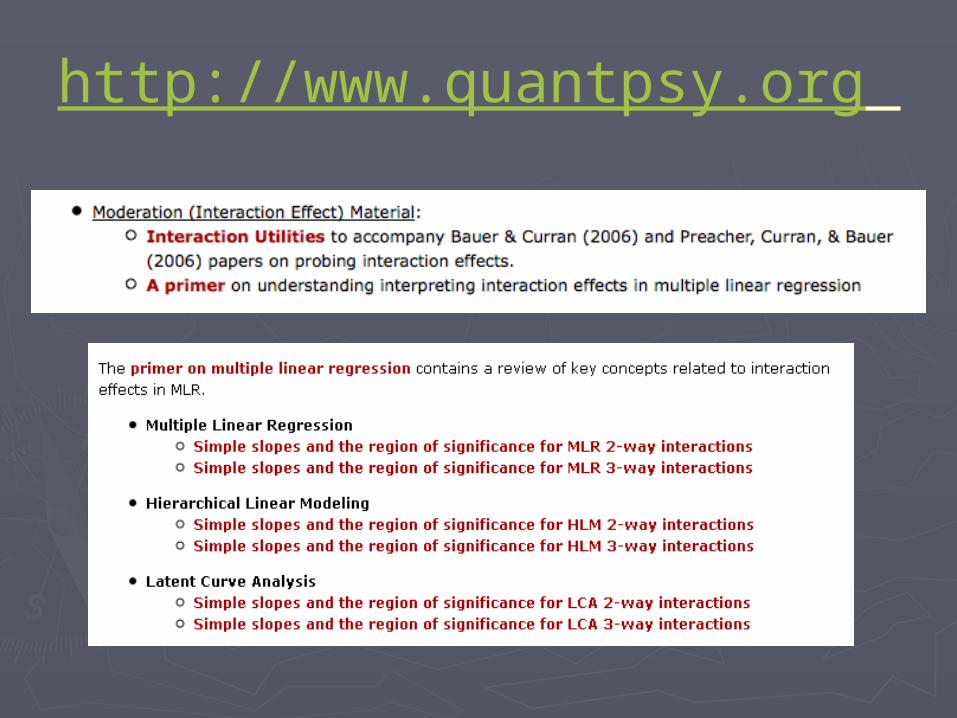
http://www.quantpsy.org
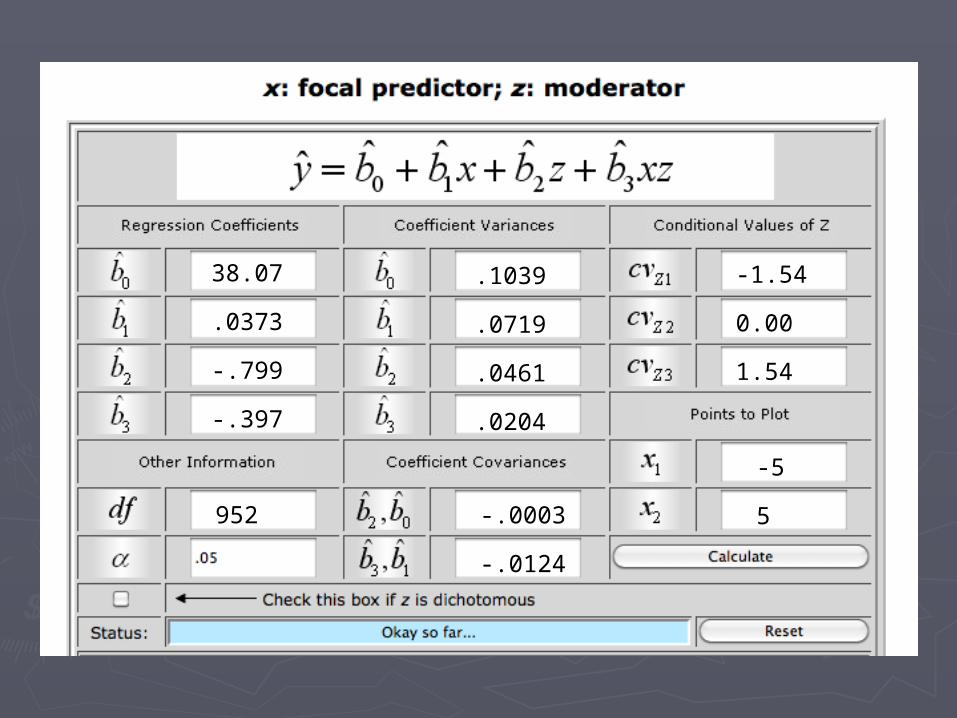
38.07
.0373
-.799
-.397
-1.54
0.00
1.54
-.0003
-.0124
.1039
.0719
.0461
.0204
-5
5952
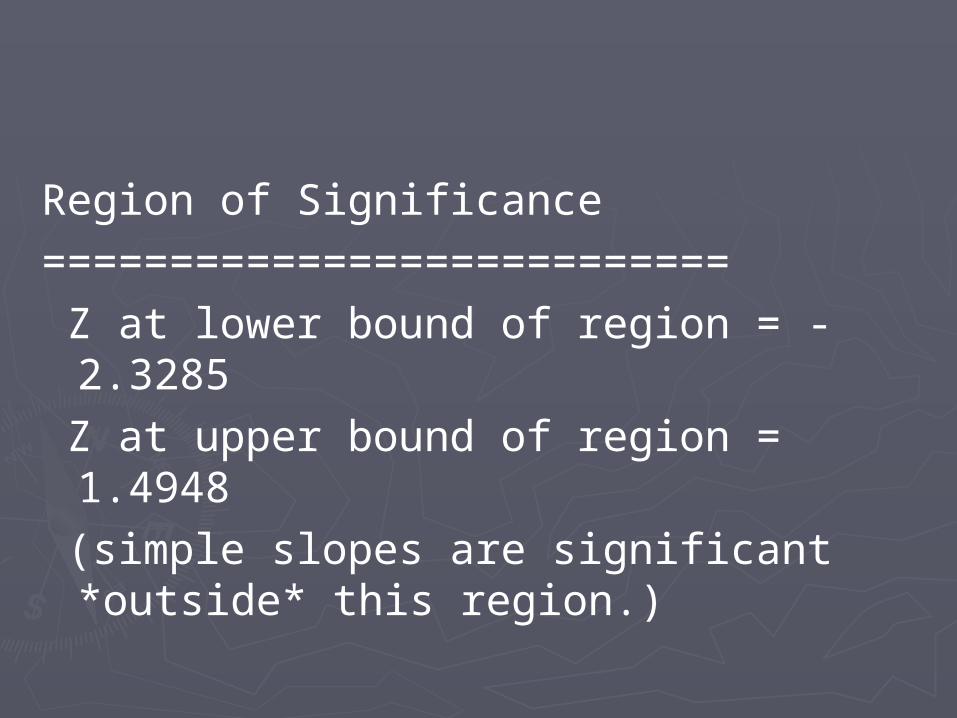
Region of Significance========================
=== Z at lower bound of region = -2.3285 Z at upper bound of region = 1.4948 (simple slopes are significant *outside*
this region.)
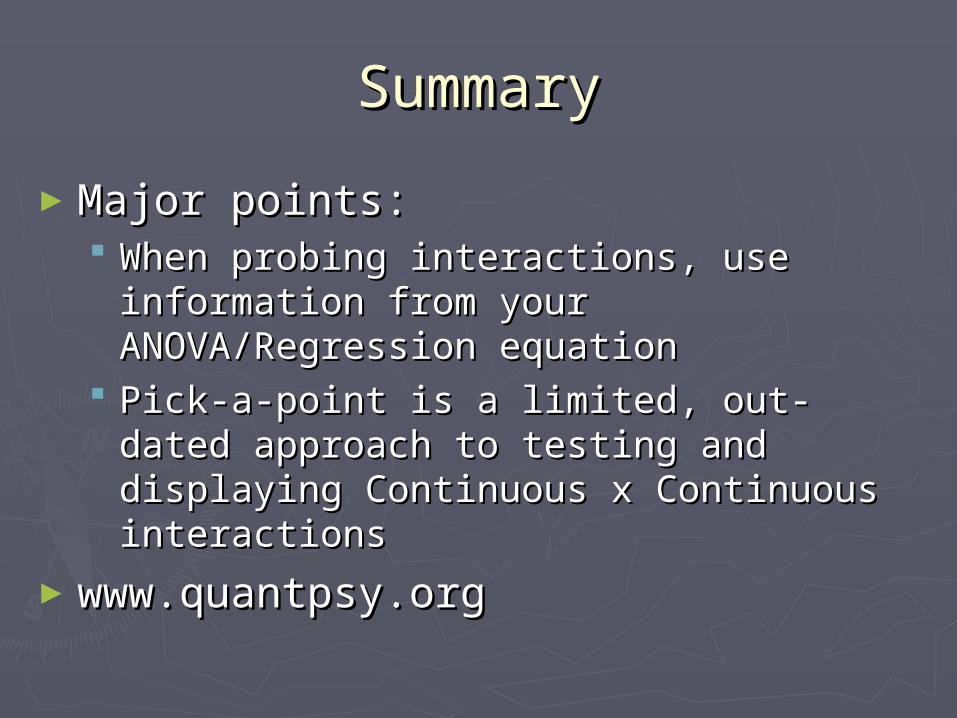
SummarySummary
►Major points: Major points: When probing interactions, use When probing interactions, use
information from your ANOVA/Regression information from your ANOVA/Regression equationequation
Pick-a-point is a limited, out-dated Pick-a-point is a limited, out-dated approach to testing and displaying approach to testing and displaying Continuous x Continuous interactionsContinuous x Continuous interactions
►www.quantpsy.orgwww.quantpsy.org
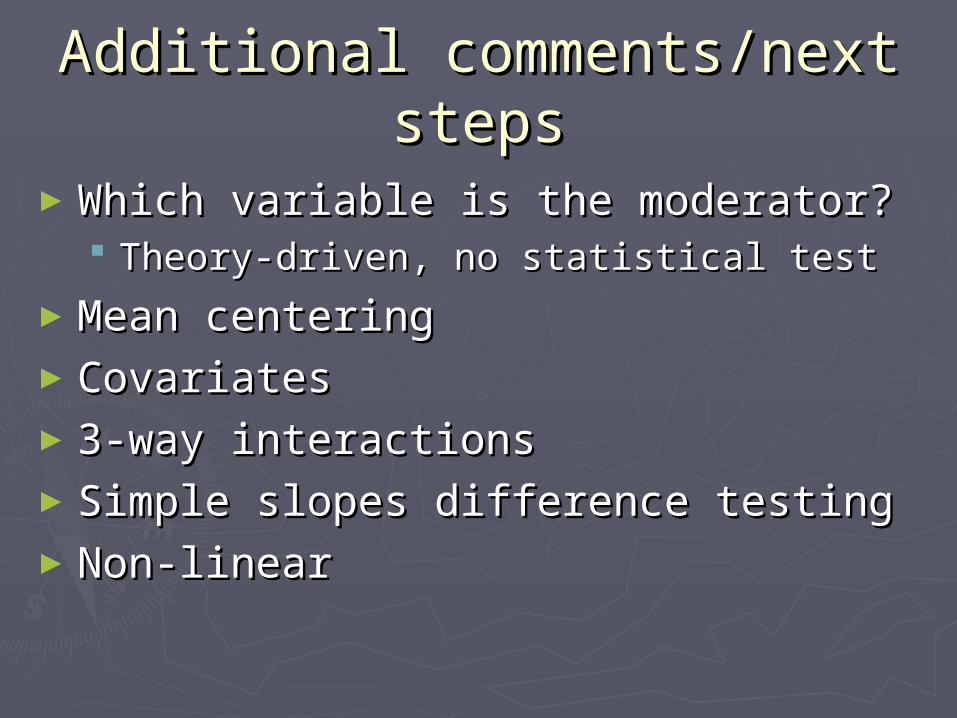
Additional comments/next Additional comments/next stepssteps
►Which variable is the moderator?Which variable is the moderator? Theory-driven, no statistical testTheory-driven, no statistical test
►Mean centeringMean centering►CovariatesCovariates►3-way interactions3-way interactions►Simple slopes difference testingSimple slopes difference testing►Non-linearNon-linear