Embed Size (px)
Citation preview
You Are How You Touch:User Verification on Smartphones via Tapping Behaviors
Nan Zheng*, Kun Bai†, Hai Huang†, and Haining Wang*
*College of William and Mary †IBM T.J. Watson Research CenterWilliamsburg, VA, USA Yorktown Heights, NY, USA
{nzheng,hnw}@cs.wm.edu {kunbai,haih}@us.ibm.com
ABSTRACTSmartphone users have their own unique behavioral pat-terns when tapping on the touch screens. These personalpatterns are reflected on the different rhythm, strength, andangle preferences of the applied force. Since smartphones areequipped with various sensors like accelerometer, gyroscope,and touch screen sensors, capturing a user’s tapping behav-iors can be done seamlessly. Exploiting the combinationof four features (acceleration, pressure, size, and time) ex-tracted from smartphone sensors, we propose a non-intrusiveuser verification mechanism to substantiate whether an au-thenticating user is the true owner of the smartphone or animpostor who happens to know the passcode. Based on thetapping data collected from over 80 users, we conduct a se-ries of experiments to validate the efficacy of our proposedsystem. Our experimental results show that our verifica-tion system achieves high accuracy with averaged equal errorrates of down to 3.65%. As our verification system can beseamlessly integrated with the existing user authenticationmechanisms on smartphones, its deployment and usage aretransparent to users and do not require any extra hardwaresupport.
KeywordsUser verification, tapping behavior, smartphone
1. INTRODUCTIONSmartphones have become ubiquitous computing platforms
allowing users anytime access to the Internet and many on-line services. On one hand, as a personal device, a smart-phone contains important private information, such as textmessages, always-logged-in emails, and contact list. On theother hand, as a portable device, a smartphone is much eas-ier to get lost or stolen than conventional computing plat-forms. Therefore, to prevent the private information storedin smartphones from falling into the hands of adversaries,user authentication mechanisms have been integrated intomobile OSes like Android and iOS.
Due to having a much smaller screen and keyboard on asmartphone than the traditional user input/output devices,PIN-based and pattern-based passcode systems have beenwidely used in smartphones for user authentication. How-ever, many people tend to choose weak passcodes for ease ofmemorization. A 2011 survey on iPhone 4-digit passcode re-veals that the ten most popular passcodes represent 15% ofall 204,508 passcodes and the top three are 1234, 0000, and2580 [1]. Moreover, recent studies show that an attacker can
detect the location of screen taps on smartphones based onaccelerometer and gyroscope readings and then derive theletters or numbers on the screen [5, 21, 26, 31]. An attackercould even exploit the oily residues left on the screen of asmartphone to derive the passcode [2]. Therefore, it is highlydesirable to enhance the smartphone’s user authenticationwith a non-intrusive user verification mechanism, which isuser-transparent and is able to further verify if the success-fully logged-in user is the true owner of a smartphone.
In this paper, we explore the feasibility of utilizing usertapping behaviors for user verification in a passcode-enabledsmartphone. The rationale behind our work is that individ-ual human users have their own unique behavioral patternswhile tapping on the touch screen of a smartphone. In otherwords, you are how you touch on the screen, just like youare how you walk on the street. The rich variety of sen-sors equipped with a smartphone including accelerometer,gyroscope, and touch screen sensors, make it possible to ac-curately characterize an individual user’s tapping behaviorsin a fine-grained fashion. With over 80 smartphone usersparticipated in our study, we quantify the user tapping be-haviors in four different aspects: acceleration, pressure, size,and time. Based on the behavioral metrics extracted fromthese four features, we apply the one-class learning tech-nique for building an accurate classifier, which is the core ofour user verification system.
We evaluate the effectiveness of our system through a se-ries of experiments using the empirical data of both 4-digitand 8-digit PINs. In terms of accuracy, our approach isable to classify the legitimate user and impostors with aver-aged equal error rates of down to 3.65%. Overall, our ver-ification system can significantly enhance the security of asmartphone by accurately identifying impostors. Especiallyfor practical use, our tapping-behavior-based approach isuser-transparent and the usability of traditional passcodeson a smartphone remains intact. As our approach is non-intrusive and does not need additional hardware supportfrom smartphones, it can be seamlessly integrated with theexisting passcode-based authentication systems.
The remainder of the paper is structured as follows. Sec-tion 2 reviews the background of this work. Section 3 de-scribes our data collection and measurement, including ourchoice of metrics. Section 4 details the proposed classifier foruser verification. Section 5 presents our experimental designand results. Section 6 discusses additional issues which arisefrom the details of our approach. Section 7 surveys relatedwork, and finally Section 8 concludes.
1
2. BACKGROUNDThe tapping behaviors of individual users on touchscreen
vary from person to person due to differences in hand ge-ometry and finger agility. Each user has a unique personaltapping pattern, reflected on the different rhythm, strength,and angle preferences of the applied force. As our tapping-behavior-based approach verifies the owner of a smartphonebased on“who you are”– your physical and behavioral traits,instead of “what you know”, it belongs to biometrics-baseduser authentication. In general, a biometrics authentica-tion system authenticates users either by their physiologicaltraits like faces and voices [4, 19] or behavioral patterns likefinger typing and hand movements [24, 33].
While physiological traits can achieve high accuracy in theprocess of user authentication, they have not been widelyused in mobile devices. Recent studies have also shown thatthe physiology-based mechanisms deployed in mobile devicesare sensitive to certain environmental factors, which couldsignificantly diminish their accuracy and reliability. For ex-ample, face recognition may fail due to a different viewingangle and poor illumination [27], and voice recognition de-grades due to background noise [4]. However, given the samemobile device, behavioral biometrics tend to be less sensi-tive to the surrounding environmental factors like darknessor noise.
Exploiting the behavioral information captured by mul-tiple sensors on a smartphone, we can exclusively create adetailed user profile for verifying the owner of the smart-phone. Since our approach works seamlessly with the exist-ing passcode-based user authentication mechanisms in mo-bile devices, it plays a role of implicit authentication. Inother words, our approach can act as a second factor authen-tication method and supplement the passcode systems forstronger authentication in a cost-effective and user-transparentmanner. More recently, seminal works have been proposedto explore the feasibility of user verification employing thebehaviors of pattern-based passwords [18]. However, thefalse reject rate (FRR) of their work is rather high, whichmeans there is a high chance that the owner of a mobiledevice would be mistakenly regarded as an impostor and beblocked from accessing the device.
3. MEASUREMENT AND CHARACTERIZA-TION
For data collection, we invite graduate and undergraduatestudents in our institution to participate in this study. Theexperiment has been filed and approved by the InstitutionalReview Board (IRB) to ensure participants are treated eth-ically. The consent form can be found in the appendix. Werespect user privacy and conform to ethical standards, inspecific to make sure: (1) no data are being collected re-garding personal credentials, e.g., we do not ask for partic-ipants’ personal credentials; (2) the informed consent formindicates that participation will take no more than 5 min-utes. We will ask each participant to be eligible for our studyif he/she plans to perform tasks on a smartphone for at least5 minutes; (3) only raw events from smartphone sensors willbe collected, and no user identities or any other user-relatedinformation will be recorded. The trace data are furtheranonymized if necessary. The collected data will be usedfor academic research only; (4) participants are invited totake part in this tapping behavior study. The consent form
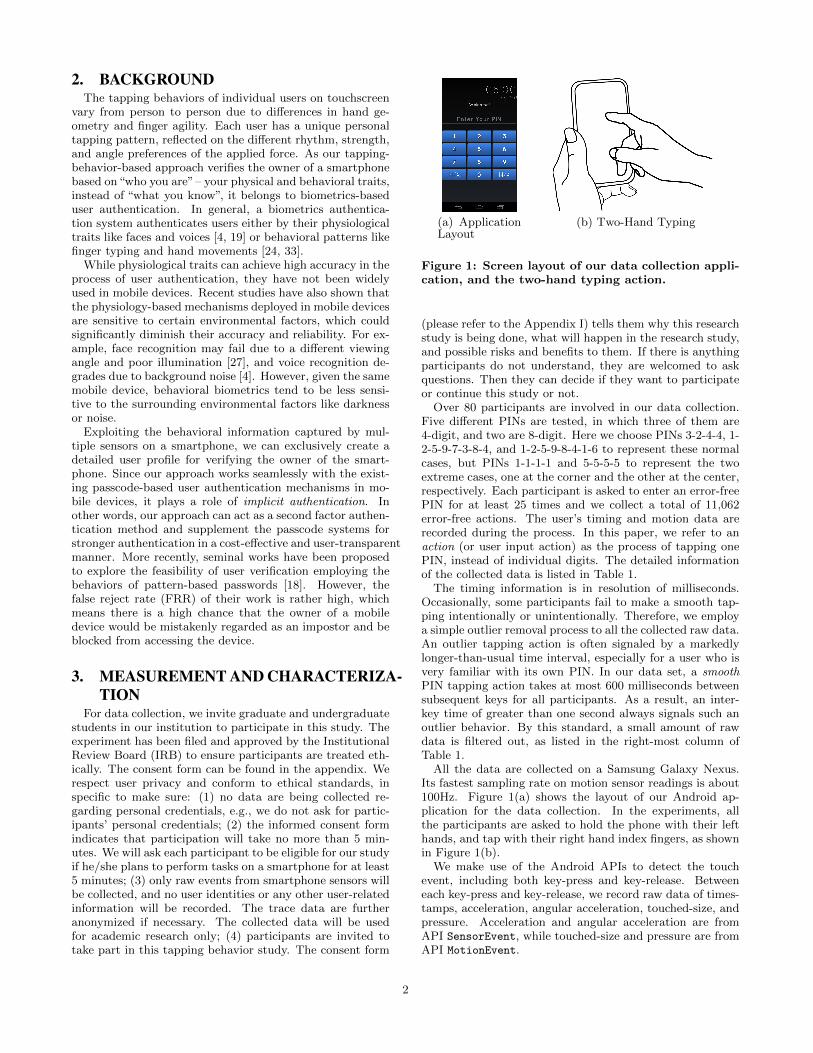
(a) ApplicationLayout
(b) Two-Hand Typing
Figure 1: Screen layout of our data collection appli-cation, and the two-hand typing action.
(please refer to the Appendix I) tells them why this researchstudy is being done, what will happen in the research study,and possible risks and benefits to them. If there is anythingparticipants do not understand, they are welcomed to askquestions. Then they can decide if they want to participateor continue this study or not.
Over 80 participants are involved in our data collection.Five different PINs are tested, in which three of them are4-digit, and two are 8-digit. Here we choose PINs 3-2-4-4, 1-2-5-9-7-3-8-4, and 1-2-5-9-8-4-1-6 to represent these normalcases, but PINs 1-1-1-1 and 5-5-5-5 to represent the twoextreme cases, one at the corner and the other at the center,respectively. Each participant is asked to enter an error-freePIN for at least 25 times and we collect a total of 11,062error-free actions. The user’s timing and motion data arerecorded during the process. In this paper, we refer to anaction (or user input action) as the process of tapping onePIN, instead of individual digits. The detailed informationof the collected data is listed in Table 1.
The timing information is in resolution of milliseconds.Occasionally, some participants fail to make a smooth tap-ping intentionally or unintentionally. Therefore, we employa simple outlier removal process to all the collected raw data.An outlier tapping action is often signaled by a markedlylonger-than-usual time interval, especially for a user who isvery familiar with its own PIN. In our data set, a smoothPIN tapping action takes at most 600 milliseconds betweensubsequent keys for all participants. As a result, an inter-key time of greater than one second always signals such anoutlier behavior. By this standard, a small amount of rawdata is filtered out, as listed in the right-most column ofTable 1.
All the data are collected on a Samsung Galaxy Nexus.Its fastest sampling rate on motion sensor readings is about100Hz. Figure 1(a) shows the layout of our Android ap-plication for the data collection. In the experiments, allthe participants are asked to hold the phone with their lefthands, and tap with their right hand index fingers, as shownin Figure 1(b).
We make use of the Android APIs to detect the touchevent, including both key-press and key-release. Betweeneach key-press and key-release, we record raw data of times-tamps, acceleration, angular acceleration, touched-size, andpressure. Acceleration and angular acceleration are fromAPI SensorEvent, while touched-size and pressure are fromAPI MotionEvent.
2
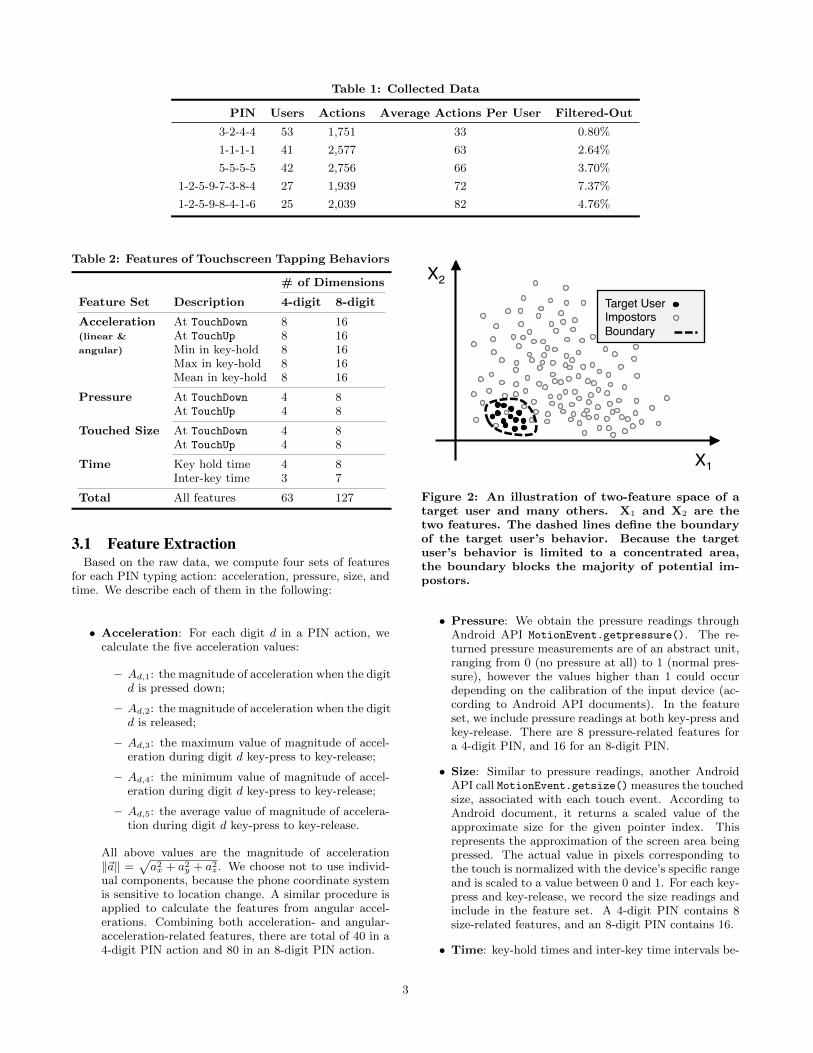
Table 1: Collected Data
PIN Users Actions Average Actions Per User Filtered-Out
3-2-4-4 53 1,751 33 0.80%
1-1-1-1 41 2,577 63 2.64%
5-5-5-5 42 2,756 66 3.70%
1-2-5-9-7-3-8-4 27 1,939 72 7.37%
1-2-5-9-8-4-1-6 25 2,039 82 4.76%
Table 2: Features of Touchscreen Tapping Behaviors
# of Dimensions
Feature Set Description 4-digit 8-digit
Acceleration At TouchDown 8 16(linear & At TouchUp 8 16angular) Min in key-hold 8 16
Max in key-hold 8 16Mean in key-hold 8 16
Pressure At TouchDown 4 8At TouchUp 4 8
Touched Size At TouchDown 4 8At TouchUp 4 8
Time Key hold time 4 8Inter-key time 3 7
Total All features 63 127
3.1 Feature ExtractionBased on the raw data, we compute four sets of features
for each PIN typing action: acceleration, pressure, size, andtime. We describe each of them in the following:
• Acceleration: For each digit d in a PIN action, wecalculate the five acceleration values:
– Ad,1: the magnitude of acceleration when the digitd is pressed down;
– Ad,2: the magnitude of acceleration when the digitd is released;
– Ad,3: the maximum value of magnitude of accel-eration during digit d key-press to key-release;
– Ad,4: the minimum value of magnitude of accel-eration during digit d key-press to key-release;
– Ad,5: the average value of magnitude of accelera-tion during digit d key-press to key-release.
All above values are the magnitude of acceleration‖~a‖ =
√a2x + a2y + a2z. We choose not to use individ-
ual components, because the phone coordinate systemis sensitive to location change. A similar procedure isapplied to calculate the features from angular accel-erations. Combining both acceleration- and angular-acceleration-related features, there are total of 40 in a4-digit PIN action and 80 in an 8-digit PIN action.
X1!
X2!Target User!
Impostors!Boundary!
Figure 2: An illustration of two-feature space of atarget user and many others. X1 and X2 are thetwo features. The dashed lines define the boundaryof the target user’s behavior. Because the targetuser’s behavior is limited to a concentrated area,the boundary blocks the majority of potential im-postors.
• Pressure: We obtain the pressure readings throughAndroid API MotionEvent.getpressure(). The re-turned pressure measurements are of an abstract unit,ranging from 0 (no pressure at all) to 1 (normal pres-sure), however the values higher than 1 could occurdepending on the calibration of the input device (ac-cording to Android API documents). In the featureset, we include pressure readings at both key-press andkey-release. There are 8 pressure-related features fora 4-digit PIN, and 16 for an 8-digit PIN.
• Size: Similar to pressure readings, another AndroidAPI call MotionEvent.getsize() measures the touchedsize, associated with each touch event. According toAndroid document, it returns a scaled value of theapproximate size for the given pointer index. Thisrepresents the approximation of the screen area beingpressed. The actual value in pixels corresponding tothe touch is normalized with the device’s specific rangeand is scaled to a value between 0 and 1. For each key-press and key-release, we record the size readings andinclude in the feature set. A 4-digit PIN contains 8size-related features, and an 8-digit PIN contains 16.
• Time: key-hold times and inter-key time intervals be-
3
0
10
20
0
10
20
0
10
20
0 500 1000 1500 2000
Repetition Index
Time [ms]
User #1
User #2
User #3
3 2 4 4
3 2 4 4
3 2 4 4
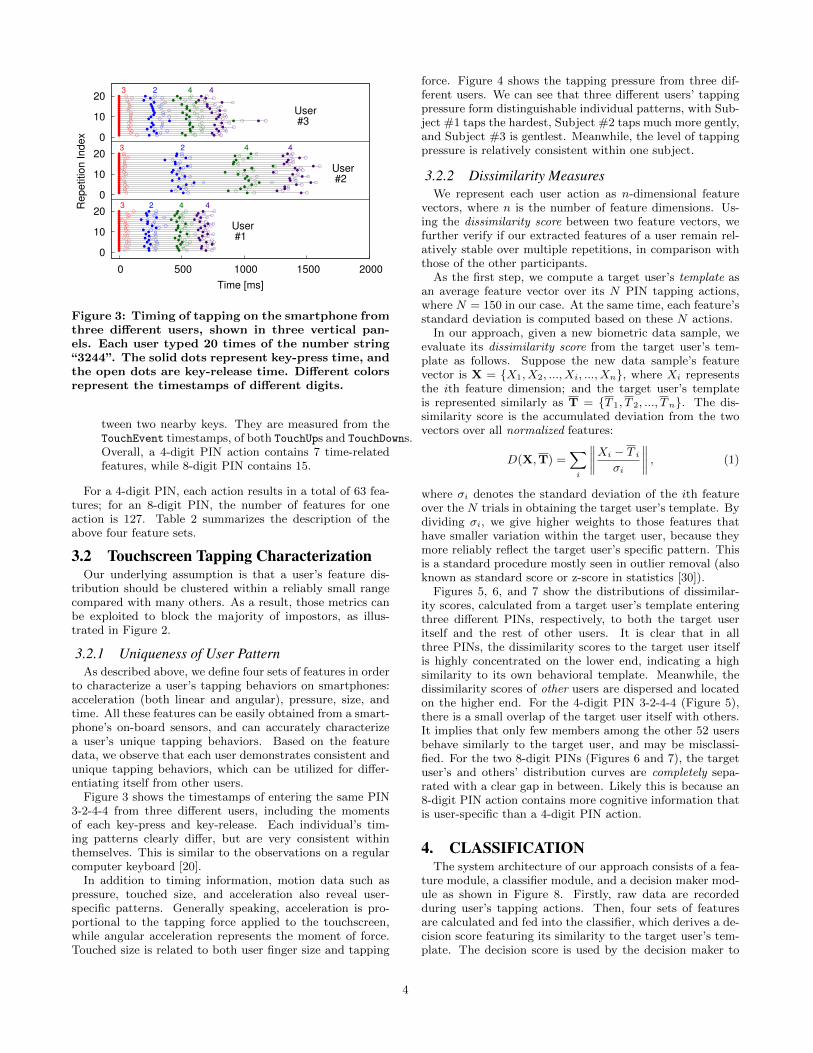
Figure 3: Timing of tapping on the smartphone fromthree different users, shown in three vertical pan-els. Each user typed 20 times of the number string“3244”. The solid dots represent key-press time, andthe open dots are key-release time. Different colorsrepresent the timestamps of different digits.
tween two nearby keys. They are measured from theTouchEvent timestamps, of both TouchUps and TouchDowns.Overall, a 4-digit PIN action contains 7 time-relatedfeatures, while 8-digit PIN contains 15.
For a 4-digit PIN, each action results in a total of 63 fea-tures; for an 8-digit PIN, the number of features for oneaction is 127. Table 2 summarizes the description of theabove four feature sets.
3.2 Touchscreen Tapping CharacterizationOur underlying assumption is that a user’s feature dis-
tribution should be clustered within a reliably small rangecompared with many others. As a result, those metrics canbe exploited to block the majority of impostors, as illus-trated in Figure 2.
3.2.1 Uniqueness of User PatternAs described above, we define four sets of features in order
to characterize a user’s tapping behaviors on smartphones:acceleration (both linear and angular), pressure, size, andtime. All these features can be easily obtained from a smart-phone’s on-board sensors, and can accurately characterizea user’s unique tapping behaviors. Based on the featuredata, we observe that each user demonstrates consistent andunique tapping behaviors, which can be utilized for differ-entiating itself from other users.
Figure 3 shows the timestamps of entering the same PIN3-2-4-4 from three different users, including the momentsof each key-press and key-release. Each individual’s tim-ing patterns clearly differ, but are very consistent withinthemselves. This is similar to the observations on a regularcomputer keyboard [20].
In addition to timing information, motion data such aspressure, touched size, and acceleration also reveal user-specific patterns. Generally speaking, acceleration is pro-portional to the tapping force applied to the touchscreen,while angular acceleration represents the moment of force.Touched size is related to both user finger size and tapping
force. Figure 4 shows the tapping pressure from three dif-ferent users. We can see that three different users’ tappingpressure form distinguishable individual patterns, with Sub-ject #1 taps the hardest, Subject #2 taps much more gently,and Subject #3 is gentlest. Meanwhile, the level of tappingpressure is relatively consistent within one subject.
3.2.2 Dissimilarity MeasuresWe represent each user action as n-dimensional feature
vectors, where n is the number of feature dimensions. Us-ing the dissimilarity score between two feature vectors, wefurther verify if our extracted features of a user remain rel-atively stable over multiple repetitions, in comparison withthose of the other participants.
As the first step, we compute a target user’s template asan average feature vector over its N PIN tapping actions,where N = 150 in our case. At the same time, each feature’sstandard deviation is computed based on these N actions.
In our approach, given a new biometric data sample, weevaluate its dissimilarity score from the target user’s tem-plate as follows. Suppose the new data sample’s featurevector is X = {X1, X2, ..., Xi, ..., Xn}, where Xi representsthe ith feature dimension; and the target user’s templateis represented similarly as T = {T 1, T 2, ..., Tn}. The dis-similarity score is the accumulated deviation from the twovectors over all normalized features:
D(X,T) =∑i
∥∥∥∥Xi − T i
σi
∥∥∥∥ , (1)
where σi denotes the standard deviation of the ith featureover the N trials in obtaining the target user’s template. Bydividing σi, we give higher weights to those features thathave smaller variation within the target user, because theymore reliably reflect the target user’s specific pattern. Thisis a standard procedure mostly seen in outlier removal (alsoknown as standard score or z-score in statistics [30]).
Figures 5, 6, and 7 show the distributions of dissimilar-ity scores, calculated from a target user’s template enteringthree different PINs, respectively, to both the target useritself and the rest of other users. It is clear that in allthree PINs, the dissimilarity scores to the target user itselfis highly concentrated on the lower end, indicating a highsimilarity to its own behavioral template. Meanwhile, thedissimilarity scores of other users are dispersed and locatedon the higher end. For the 4-digit PIN 3-2-4-4 (Figure 5),there is a small overlap of the target user itself with others.It implies that only few members among the other 52 usersbehave similarly to the target user, and may be misclassi-fied. For the two 8-digit PINs (Figures 6 and 7), the targetuser’s and others’ distribution curves are completely sepa-rated with a clear gap in between. Likely this is because an8-digit PIN action contains more cognitive information thatis user-specific than a 4-digit PIN action.
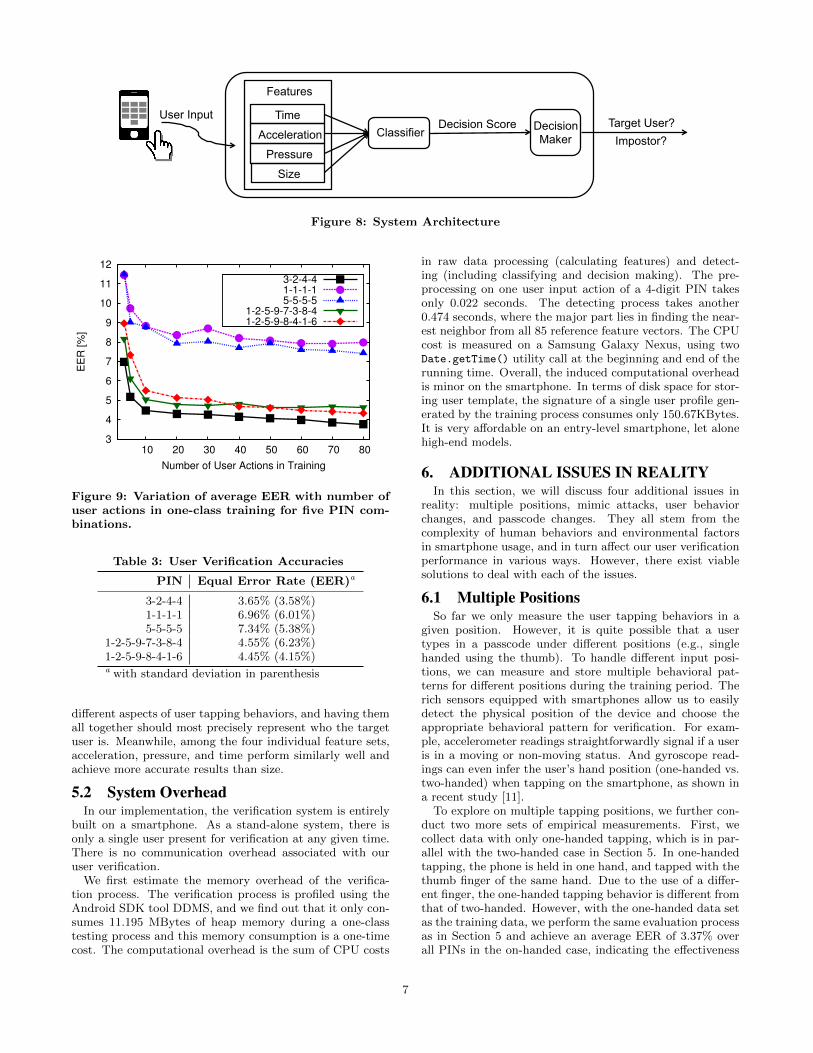
4. CLASSIFICATIONThe system architecture of our approach consists of a fea-
ture module, a classifier module, and a decision maker mod-ule as shown in Figure 8. Firstly, raw data are recordedduring user’s tapping actions. Then, four sets of featuresare calculated and fed into the classifier, which derives a de-cision score featuring its similarity to the target user’s tem-plate. The decision score is used by the decision maker to
4
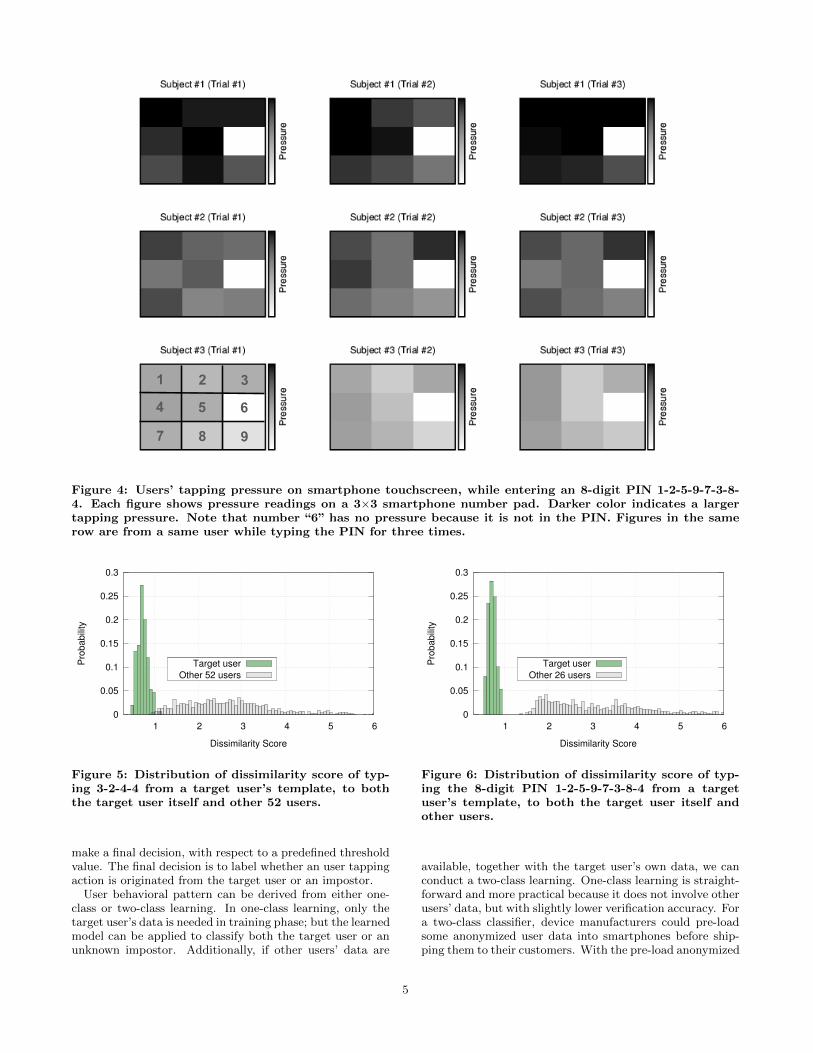
1
4
7
2
5
8
3
6
9
Figure 4: Users’ tapping pressure on smartphone touchscreen, while entering an 8-digit PIN 1-2-5-9-7-3-8-4. Each figure shows pressure readings on a 3×3 smartphone number pad. Darker color indicates a largertapping pressure. Note that number “6” has no pressure because it is not in the PIN. Figures in the samerow are from a same user while typing the PIN for three times.
0
0.05
0.1
0.15
0.2
0.25
0.3
1 2 3 4 5 6
Pro
babi
lity
Dissimilarity Score
Target userOther 52 users
Figure 5: Distribution of dissimilarity score of typ-ing 3-2-4-4 from a target user’s template, to boththe target user itself and other 52 users.
make a final decision, with respect to a predefined thresholdvalue. The final decision is to label whether an user tappingaction is originated from the target user or an impostor.
User behavioral pattern can be derived from either one-class or two-class learning. In one-class learning, only thetarget user’s data is needed in training phase; but the learnedmodel can be applied to classify both the target user or anunknown impostor. Additionally, if other users’ data are
0
0.05
0.1
0.15
0.2
0.25
0.3
1 2 3 4 5 6
Pro
babi
lity
Dissimilarity Score
Target userOther 26 users
Figure 6: Distribution of dissimilarity score of typ-ing the 8-digit PIN 1-2-5-9-7-3-8-4 from a targetuser’s template, to both the target user itself andother users.
available, together with the target user’s own data, we canconduct a two-class learning. One-class learning is straight-forward and more practical because it does not involve otherusers’ data, but with slightly lower verification accuracy. Fora two-class classifier, device manufacturers could pre-loadsome anonymized user data into smartphones before ship-ping them to their customers. With the pre-load anonymized
5
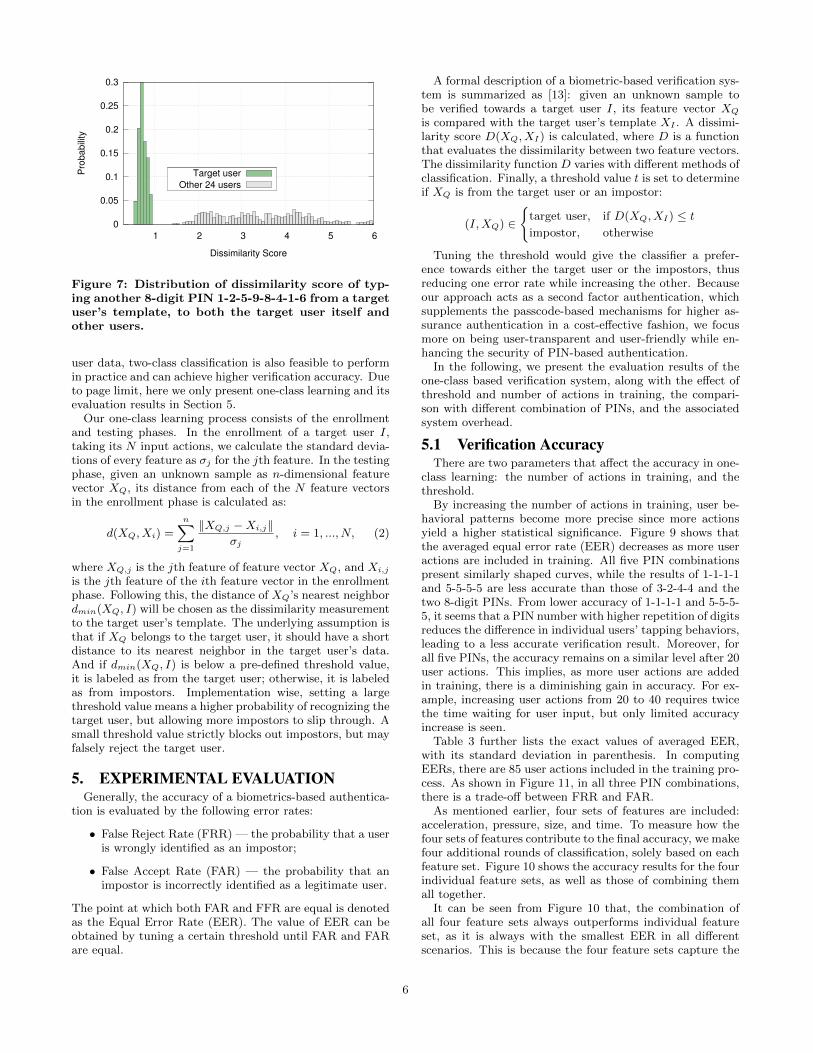
0
0.05
0.1
0.15
0.2
0.25
0.3
1 2 3 4 5 6
Pro
babi
lity
Dissimilarity Score
Target userOther 24 users
Figure 7: Distribution of dissimilarity score of typ-ing another 8-digit PIN 1-2-5-9-8-4-1-6 from a targetuser’s template, to both the target user itself andother users.
user data, two-class classification is also feasible to performin practice and can achieve higher verification accuracy. Dueto page limit, here we only present one-class learning and itsevaluation results in Section 5.
Our one-class learning process consists of the enrollmentand testing phases. In the enrollment of a target user I,taking its N input actions, we calculate the standard devia-tions of every feature as σj for the jth feature. In the testingphase, given an unknown sample as n-dimensional featurevector XQ, its distance from each of the N feature vectorsin the enrollment phase is calculated as:
d(XQ, Xi) =
n∑j=1
‖XQ,j −Xi,j‖σj
, i = 1, ..., N, (2)
where XQ,j is the jth feature of feature vector XQ, and Xi,j
is the jth feature of the ith feature vector in the enrollmentphase. Following this, the distance of XQ’s nearest neighbordmin(XQ, I) will be chosen as the dissimilarity measurementto the target user’s template. The underlying assumption isthat if XQ belongs to the target user, it should have a shortdistance to its nearest neighbor in the target user’s data.And if dmin(XQ, I) is below a pre-defined threshold value,it is labeled as from the target user; otherwise, it is labeledas from impostors. Implementation wise, setting a largethreshold value means a higher probability of recognizing thetarget user, but allowing more impostors to slip through. Asmall threshold value strictly blocks out impostors, but mayfalsely reject the target user.
5. EXPERIMENTAL EVALUATIONGenerally, the accuracy of a biometrics-based authentica-
tion is evaluated by the following error rates:
• False Reject Rate (FRR) — the probability that a useris wrongly identified as an impostor;
• False Accept Rate (FAR) — the probability that animpostor is incorrectly identified as a legitimate user.
The point at which both FAR and FFR are equal is denotedas the Equal Error Rate (EER). The value of EER can beobtained by tuning a certain threshold until FAR and FARare equal.
A formal description of a biometric-based verification sys-tem is summarized as [13]: given an unknown sample tobe verified towards a target user I, its feature vector XQ
is compared with the target user’s template XI . A dissimi-larity score D(XQ, XI) is calculated, where D is a functionthat evaluates the dissimilarity between two feature vectors.The dissimilarity function D varies with different methods ofclassification. Finally, a threshold value t is set to determineif XQ is from the target user or an impostor:
(I,XQ) ∈
{target user, if D(XQ, XI) ≤ timpostor, otherwise
Tuning the threshold would give the classifier a prefer-ence towards either the target user or the impostors, thusreducing one error rate while increasing the other. Becauseour approach acts as a second factor authentication, whichsupplements the passcode-based mechanisms for higher as-surance authentication in a cost-effective fashion, we focusmore on being user-transparent and user-friendly while en-hancing the security of PIN-based authentication.
In the following, we present the evaluation results of theone-class based verification system, along with the effect ofthreshold and number of actions in training, the compari-son with different combination of PINs, and the associatedsystem overhead.
5.1 Verification AccuracyThere are two parameters that affect the accuracy in one-
class learning: the number of actions in training, and thethreshold.
By increasing the number of actions in training, user be-havioral patterns become more precise since more actionsyield a higher statistical significance. Figure 9 shows thatthe averaged equal error rate (EER) decreases as more useractions are included in training. All five PIN combinationspresent similarly shaped curves, while the results of 1-1-1-1and 5-5-5-5 are less accurate than those of 3-2-4-4 and thetwo 8-digit PINs. From lower accuracy of 1-1-1-1 and 5-5-5-5, it seems that a PIN number with higher repetition of digitsreduces the difference in individual users’ tapping behaviors,leading to a less accurate verification result. Moreover, forall five PINs, the accuracy remains on a similar level after 20user actions. This implies, as more user actions are addedin training, there is a diminishing gain in accuracy. For ex-ample, increasing user actions from 20 to 40 requires twicethe time waiting for user input, but only limited accuracyincrease is seen.
Table 3 further lists the exact values of averaged EER,with its standard deviation in parenthesis. In computingEERs, there are 85 user actions included in the training pro-cess. As shown in Figure 11, in all three PIN combinations,there is a trade-off between FRR and FAR.
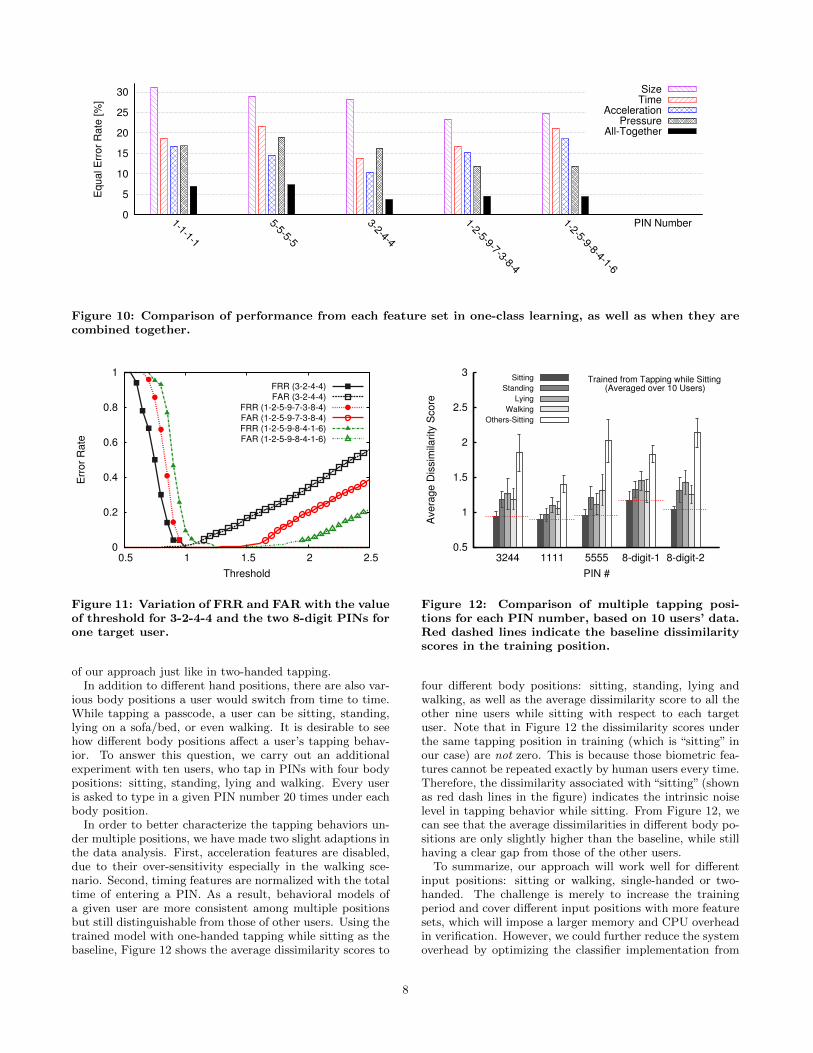
As mentioned earlier, four sets of features are included:acceleration, pressure, size, and time. To measure how thefour sets of features contribute to the final accuracy, we makefour additional rounds of classification, solely based on eachfeature set. Figure 10 shows the accuracy results for the fourindividual feature sets, as well as those of combining themall together.
It can be seen from Figure 10 that, the combination ofall four feature sets always outperforms individual featureset, as it is always with the smallest EER in all differentscenarios. This is because the four feature sets capture the
6
User Input Time
Acceleration
Pressure
Size
Features
Classifier Decision Maker
Decision Score Target User? Impostor?
Figure 8: System Architecture
3
4
5
6
7
8
9
10
11
12
10 20 30 40 50 60 70 80
EE
R [%
]
Number of User Actions in Training
3-2-4-41-1-1-15-5-5-5
1-2-5-9-7-3-8-41-2-5-9-8-4-1-6
Figure 9: Variation of average EER with number ofuser actions in one-class training for five PIN com-binations.
Table 3: User Verification Accuracies
PIN Equal Error Rate (EER)a
3-2-4-4 3.65% (3.58%)1-1-1-1 6.96% (6.01%)5-5-5-5 7.34% (5.38%)
1-2-5-9-7-3-8-4 4.55% (6.23%)1-2-5-9-8-4-1-6 4.45% (4.15%)a with standard deviation in parenthesis
different aspects of user tapping behaviors, and having themall together should most precisely represent who the targetuser is. Meanwhile, among the four individual feature sets,acceleration, pressure, and time perform similarly well andachieve more accurate results than size.
5.2 System OverheadIn our implementation, the verification system is entirely
built on a smartphone. As a stand-alone system, there isonly a single user present for verification at any given time.There is no communication overhead associated with ouruser verification.
We first estimate the memory overhead of the verifica-tion process. The verification process is profiled using theAndroid SDK tool DDMS, and we find out that it only con-sumes 11.195 MBytes of heap memory during a one-classtesting process and this memory consumption is a one-timecost. The computational overhead is the sum of CPU costs
in raw data processing (calculating features) and detect-ing (including classifying and decision making). The pre-processing on one user input action of a 4-digit PIN takesonly 0.022 seconds. The detecting process takes another0.474 seconds, where the major part lies in finding the near-est neighbor from all 85 reference feature vectors. The CPUcost is measured on a Samsung Galaxy Nexus, using twoDate.getTime() utility call at the beginning and end of therunning time. Overall, the induced computational overheadis minor on the smartphone. In terms of disk space for stor-ing user template, the signature of a single user profile gen-erated by the training process consumes only 150.67KBytes.It is very affordable on an entry-level smartphone, let alonehigh-end models.
6. ADDITIONAL ISSUES IN REALITYIn this section, we will discuss four additional issues in
reality: multiple positions, mimic attacks, user behaviorchanges, and passcode changes. They all stem from thecomplexity of human behaviors and environmental factorsin smartphone usage, and in turn affect our user verificationperformance in various ways. However, there exist viablesolutions to deal with each of the issues.
6.1 Multiple PositionsSo far we only measure the user tapping behaviors in a
given position. However, it is quite possible that a usertypes in a passcode under different positions (e.g., singlehanded using the thumb). To handle different input posi-tions, we can measure and store multiple behavioral pat-terns for different positions during the training period. Therich sensors equipped with smartphones allow us to easilydetect the physical position of the device and choose theappropriate behavioral pattern for verification. For exam-ple, accelerometer readings straightforwardly signal if a useris in a moving or non-moving status. And gyroscope read-ings can even infer the user’s hand position (one-handed vs.two-handed) when tapping on the smartphone, as shown ina recent study [11].
To explore on multiple tapping positions, we further con-duct two more sets of empirical measurements. First, wecollect data with only one-handed tapping, which is in par-allel with the two-handed case in Section 5. In one-handedtapping, the phone is held in one hand, and tapped with thethumb finger of the same hand. Due to the use of a differ-ent finger, the one-handed tapping behavior is different fromthat of two-handed. However, with the one-handed data setas the training data, we perform the same evaluation processas in Section 5 and achieve an average EER of 3.37% overall PINs in the on-handed case, indicating the effectiveness
7
0
5
10
15
20
25
30
1-1-1-1
5-5-5-5
3-2-4-4
1-2-5-9-7-3-8-4
1-2-5-9-8-4-1-6
Equal E
rror
Rate
[%
]
PIN Number
SizeTime
AccelerationPressure
All-Together
Figure 10: Comparison of performance from each feature set in one-class learning, as well as when they arecombined together.
0
0.2
0.4
0.6
0.8
1
0.5 1 1.5 2 2.5
Err
or
Rate
Threshold
FRR (3-2-4-4)
FAR (3-2-4-4)
FRR (1-2-5-9-7-3-8-4)
FAR (1-2-5-9-7-3-8-4)
FRR (1-2-5-9-8-4-1-6)
FAR (1-2-5-9-8-4-1-6)
Figure 11: Variation of FRR and FAR with the valueof threshold for 3-2-4-4 and the two 8-digit PINs forone target user.
of our approach just like in two-handed tapping.In addition to different hand positions, there are also var-
ious body positions a user would switch from time to time.While tapping a passcode, a user can be sitting, standing,lying on a sofa/bed, or even walking. It is desirable to seehow different body positions affect a user’s tapping behav-ior. To answer this question, we carry out an additionalexperiment with ten users, who tap in PINs with four bodypositions: sitting, standing, lying and walking. Every useris asked to type in a given PIN number 20 times under eachbody position.
In order to better characterize the tapping behaviors un-der multiple positions, we have made two slight adaptions inthe data analysis. First, acceleration features are disabled,due to their over-sensitivity especially in the walking sce-nario. Second, timing features are normalized with the totaltime of entering a PIN. As a result, behavioral models ofa given user are more consistent among multiple positionsbut still distinguishable from those of other users. Using thetrained model with one-handed tapping while sitting as thebaseline, Figure 12 shows the average dissimilarity scores to
0.5
1
1.5
2
2.5
3
3244 1111 5555 8-digit-1 8-digit-2
Avera
ge D
issim
ilarity
Score
PIN #
Trained from Tapping while Sitting (Averaged over 10 Users)
Sitting
Standing
Lying
Walking
Others-Sitting
Figure 12: Comparison of multiple tapping posi-tions for each PIN number, based on 10 users’ data.Red dashed lines indicate the baseline dissimilarityscores in the training position.
four different body positions: sitting, standing, lying andwalking, as well as the average dissimilarity score to all theother nine users while sitting with respect to each targetuser. Note that in Figure 12 the dissimilarity scores underthe same tapping position in training (which is “sitting” inour case) are not zero. This is because those biometric fea-tures cannot be repeated exactly by human users every time.Therefore, the dissimilarity associated with “sitting” (shownas red dash lines in the figure) indicates the intrinsic noiselevel in tapping behavior while sitting. From Figure 12, wecan see that the average dissimilarities in different body po-sitions are only slightly higher than the baseline, while stillhaving a clear gap from those of the other users.
To summarize, our approach will work well for differentinput positions: sitting or walking, single-handed or two-handed. The challenge is merely to increase the trainingperiod and cover different input positions with more featuresets, which will impose a larger memory and CPU overheadin verification. However, we could further reduce the systemoverhead by optimizing the classifier implementation from
8
different aspects of mobile devices. Note that the currentone-class classifier has not been optimized. We will furtherexplore this direction in our future work.
6.2 Mimic AttacksTheoretically, our behavior-based verification system can
be bypassed if an impostor can precisely mimic the tappingbehaviors of the device’s owner. However, this is extremelydifficult if not impossible in practice. Intuitively, even if theimpostor has overseen how the device’s owner previously en-tered the passcode, it might be able to mimic the timing as-pect. But the other features, such as pressure, acceleration,and size, are much more difficult to observe and reproduce.
We set up an experiment in order to quantitatively mea-sure the effect of mimic by observation. Details of this ex-periment is shown in Appendix II. It shows the robustnessof our approach against a mimic attack, which we believe isdue to the following three aspects.
• There are multiple dimensions in the features we usedand most of them are independent from each other.Although an impostor may mimic one dimension with-out much difficulty, mimicking multiple dimensions si-multaneously is extremely difficult as small physicalmovements like tapping are hard to observe and pre-cisely reproduce. For example, acceleration directlyrelates to tapping force (F = m · a), so if the impos-tor intentionally manages to tap in a gentler or harderfashion, its behavior can get closer to that of the targetuser. However, pressure is harder to mimic because itequals to tapping force divided by touched area. Thesetwo independent factors must be adjusted at the sametime, which is more challenging. Timing (or tappingrhythm) is also hard to mimic, because timing containsmultiple dimensions in our approach: 7 in a 4-digitPIN, and 15 in a 8-digit PIN. Those individual timeintervals (especially key-to-key intervals) are relativelyindependent. An impostor may mimic the target userwith a roughly fast or slow rhythm, but it is hard toreproduce the specific key-to-key dynamics.
• The fine-grained measurement resolution makes ourfeatures hard to mimic. For example, in our experi-ment, timing is measured in order of millisecond. Thistime resolution is much higher than human perception,and hence it is very hard for an impostor to accuratelyand consistently mimic tapping rhythm at such a low-level resolution.
• The physiological differences from the target user setup another barrier for mimic impostors. In our featureset, the touched size is heavily affected by the fingersize, and the tapping rhythms also depend on handagility and geometric shape. In general, it is very dif-ficult for a person with bigger hand/fingers to mimicsomeone with smaller hand/fingers, and vice versa.
As more sensors have been available on mobile devices,more features will be included for more accurate user verifi-cation, and hence mimic attacks will just become less likelyto succeed.
6.3 User Behavior ChangesThis work builds on the assumption that a user’s behav-
ior is consistent and no abrupt change happens over a short
period of time, but the assumption might not always betrue, e.g., due to a physical injury. In such scenarios, thebehavioral-based verification mechanism should stay mini-mally intrusive to the user. One feasible solution is to con-tact with the service providers to disable the verificationfunction remotely and start the re-training. The purposeof our user verification is to provide additional security incommon day-to-day usage while still allowing the user todisable it in rare cases. As we have shown previously, thesensitivity to false positives and negatives are controlled byvarious threshold values. Whether or not exposing the sen-sitivity control, e.g., setting it to Low, Medium, and High,can improve user experience is debatable. On one hand, itallows users to make a conscience choice to trade off betweensecurity and convenience. On the other hand, it is no longeruser-transparent.
6.4 Passcode ChangesIn our approach, only the tapping features of the currently
active passcode are measured and recorded in a user’s smart-phone. One might ask what happens when the user need tochange its passcode? Although people do not frequentlychange their passcodes, updating passcode in a quarterly oryearly basis is recommended or required by most passcode-based systems. When this happens, our verification systemcould automatically remain inactive for a while and start an-other training session to build a new set of tapping featuresbased on the newly created passcode. The characterizationof tapping features are conducted in background till a stablepattern has been successfully compiled after multiple trials.Note that the methodology of our scheme is not boundedto certain passcodes. In other words, our approach can beapplied to any passcode a user chosen in practice.
7. RELATED WORKSThis section reviews related works from three different as-
pects: keystroke dynamics and graphical passwords, infer-ring tapped information from on-board motion sensors, anduser (re-)authentication by their finger movements on touchscreens, approximately in chronological order and with in-creasing closeness to our work.
7.1 Keystroke DynamicsKeystroke dynamics, as one of the behavioral biometrics,
has been extensively studied in distinguishing users by theway they type on a computer keyboard [3, 15, 24, 28]. Mon-rose et al. [22, 23, 24] first developed the concept of passwordhardening based on keystroke dynamics. It has been foundto be a practical solution to enhance the password securityin an unobtrusive way. Research done on the analysis ofkeystroke dynamics for identifying users as they type on amobile phone can be found in [7, 14, 32]. Clarke et al. [7]considered the dynamics of typing 4-digit PIN codes, achiev-ing an average Equal Error Rate (ERR) of 8.5% on physicalkeyboard on a Nokia 5110 handset. Karatzouni et al. [14]carried out another evaluation on a PDA phone with physi-cal keyboard, which yields an average EER of 12.2%. Zahidet al. [32] examined this approach on touchscreen keyboardsand achieved, in one best scenario, a low Equal Error Rateof approximately 2% with training set required a minimumof 250 keystrokes.
Our work differs from the existing works above mainlyin two aspects. First, previous studies are all based on
9
physical keyboards (either in computers or mobile phones),while our work studies user tapping behaviors with on-screentouch-enabled keyboards, which are widely deployed in mostsmartphones today. Second, besides keystroke timings, weinclude additional features (pressure, size, and acceleration)for user verification by exploiting various on-board smart-phone sensors. This allows us to achieve a complete andfine-grained characterization on user tapping behaviors.
7.2 Inferring Tapped Information from On-board Motion Sensors
Several independent researches have found that simply byusing data acquired by smartphone motion sensors, it is suf-ficient to infer which part of the screen users tap on [5, 21,26, 31]. The first effort was done by Cai et al. in 2011 [5].They utilized features from device orientation data on anHTC Evo 4G smartphone, and correctly inferred more than70% of the keys typed on a number-only soft keyboard. Verysoon, Xu et al. further exploited more sensor capabilities onsmartphones, including accelerometer, gyroscope, and ori-entation sensors [31]. Evaluation shows higher accuracies ofgreater than 90% for inferring an 8-digit password within3 trials. Miluzzo et al. demonstrated another key infer-ence method on soft keyboard of both smartphones andtablets [21]. 90% or higher accuracy is shown in identi-fying English letters on smartphones, and 80% on tablets.Owusu et al. [26] infers taps of keys and areas arranged ina 60-region grid, solely based on accelerometer readings onsmartphones. Result showed that they are able to extract6-character passwords in as few as 4.5 trials.
7.3 User Authentication by Their Finger Move-ments on Touch Screens
Research has been done in exploring different biometricapproaches for providing an extra level of security for au-thenticating users into their mobile devices. Guerra-Casanovaet al. [12] proposed a biometric technique based on the ideaof authenticating a person on a mobile device by gesturerecognition, and achieve Equal Error Rate (EER) between2.01% and 4.82% on a 100-users base. Unobtrusive methodsfor authentication on mobile smart phones have emerged asan alternative to typed passwords, such as gait biometrics(achieving an EER of 20.1%) [9, 25], or the unique move-ment users perform when answering or placing a phone call(EER being between 4.5% and 9.5%) [8].
Very recently De Luca et al. [18] introduced an implicitauthentication approach that enhances password patternson android phones, with an additional security layer, whichis transparent to user. The application recorded all dataavailable from the touchscreen: pressure (how hard the fin-ger presses), size (area of the finger touching the screen),x and y coordinates, and time. Evaluation is based on 26participants, with an average accuracy of 77%.
A concurrent work conducted by Sae-Bae et al. [29] makesuse of multi-touch screen sensor on iPad (not phone) to cap-ture the palm movement. They achieved a classification ac-curacy of over 90%. However, palm movements is not suit-able for smartphone screens, since the screen is typically toosmall for palm movements. Citty et al. [6] presented an al-ternative approach to inputting PINs on small touchscreendevices. It uses a sequence of 4 partitions of a selection of16 images, instead of 4-digits PINs, to increase the possi-
ble combination of authentication sequences. However, in-putting the sequence needs extra efforts in memorizing theimages sequences. Kim et al. [16] introduced and evaluateda number of novel tabletop authentication schemes that ex-ploit the features of multi-touch interaction.
There are two recent works close to ours in authenticat-ing smartphone users by continuously monitoring their fin-ger movements on the touchscreen [10, 17]. Frank et al.conducted a study on touch input analysis for smartphoneuser authentication, which is referred to as touch biomet-rics [10]. Based on a set of 30 behavioral features, theauthors built proof-of-concept classifiers that can pinpointa target user among 41 users with very low equal errorrate. Given the non-trivial error rates, this kind of touch-based analysis is qualified as a complementary authentica-tion mechanism. Shortly after, Li et al. conducted anotherdetailed study aiming to provide continuous re-authenticationbased on user touchscreen behaviors [17]. Their systemmonitors and analyzes user interaction with touchscreens inbackground, and achieves a high authentication accuracy ofup to 95.78%. Our work differs from these two studies in thefollowing aspects. First of all, we focus on studying tappingbehaviors exclusively, instead of sliding behaviors—the ma-jor gesture in the two previous works. This is because in ourstudy, users make a constructed sequence of tappings in en-tering PINs at lock screen, which convey rich personal infor-mation. By contrast, Frank’s work solely focuses on slidinggestures; and in Li’s work, their focus is on those randomtouch screen behaviors after screen is unlocked. As randomtappings do not provide much user information, the slidinggestures play a dominate role in Li’s work. Additionally,we focus on studying touch biometrics in order to hardenone-time static authentication (more specifically, passcode-based screen unlock), rather than for continuous authenti-cation. In that sense, our system is complementary to thesetwo works and can be deployed in parallel with them . Fi-nally, unlike these two works, we employ one-class learningfor user verification, which does not require training datafrom other users, but purely depending on the smartphoneowner’s data.
8. CONCLUSIONAs mobile devices are getting widely adopted, ensuring
their physical and data security has become a major chal-lenge. A simple peek over the shoulders of the device ownerwhile the passcode is being entered and a few minutes ofhiatus would allow an attacker to access sensitive informa-tion stored on the device. Using more complex passcodesand/or secondary passcodes can reduce the chance of suchattacks, but it brings significant inconvenience to the users.We have found that a user’s tapping signatures if used inconjunction with the passcode itself can also achieve thesame goal, and moreover, the added security can be ob-tained in a completely user-transparent fashion. Previousworks have shown the feasibility of this approach, but theirhigh error rate makes these mechanisms impractical to useas too many false positives will defeat the purpose of beinguser-transparent. Having collected data of over 80 differ-ent users, explored the one-class machine learning technique,and utilized additional motion sensors on newest generationof mobile devices, we are able to demonstrate accuracieswith equal error rates of down to 3.65%.
10
9. REFERENCES[1] D. Amitay. Most Common iPhone Passcodes.
http://amitay.us/blog/files/most_common_
iphone_passcodes.php. [Accessed: May 2013].
[2] A. J. Aviv et al. Smudge attacks on smartphone touchscreens. In WOOT’10, pages 1–7, 2010.
[3] F. Bergadano, D. Gunetti, and C. Picardi. Userauthentication through keystroke dynamics. ACMTransactions on Information and System Security(TISSEC), 5(4):367–397, 2002.
[4] F. Bimbot et al. A tutorial on text-independentspeaker verification. EURASIP J. Appl. SignalProcess., 2004:430–451, 2004.
[5] L. Cai and H. Chen. Touchlogger: inferring keystrokeson touch screen from smartphone motion. InHotSec’11, 2011.
[6] J. Citty and D. R. Hutchings. TAPI: Touch-screenauthentication using partitioned images. In ElonUniversity Technical Report 2010-1, Tech Report,2010.
[7] N. L. Clarke and S. M. Furnell. Authenticating mobilephone users using keystroke analysis. Int. J. Inf.Secur., 6(1):1–14, 2007.
[8] M. Conti, I. Zachia-Zlatea, and B. Crispo. Mind howyou answer me!: transparently authenticating the userof a smartphone when answering or placing a call. InASIACCS’11, pages 249–259, 2011.
[9] M. Derawi et al. Unobtrusive user-authentication onmobile phones using biometric gait recognition. InIIH-MSP’10, pages 306–311. IEEE, 2010.
[10] M. Frank et al. Touchalytics: On the applicability oftouchscreen input as a behavioral biometric forcontinuous authentication. IEEE Transactions onInformation Forensics and Security, 8(1):136 –148,2013.
[11] M. Goel, J. Wobbrock, and S. Patel. Gripsense: usingbuilt-in sensors to detect hand posture and pressureon commodity mobile phones. In UIST’12, pages545–554, 2012.
[12] J. Guerra-Casanova et al. Authentication in mobiledevices through hand gesture recognition.International Journal of Information Security,11(2):65–83, 2012.
[13] A. Jain, A. Ross, and S. Prabhakar. An introductionto biometric recognition. IEEE Transactions onCircuits and Systems for Video Technology, 14(1):4 –20, 2004.
[14] S. Karatzouni and N. Clarke. Keystroke analysis forthumb-based keyboards on mobile devices. NewApproaches for Security, Privacy and Trust inComplex Environments, pages 253–263, 2007.
[15] K. S. Killourhy and R. A. Maxion. Comparinganomaly-detection algorithms for keystroke dynamics.In IEEE DSN’09, pages 125–134, 2009.
[16] D. Kim et al. Multi-touch authentication on tabletops.In ACM CHI’10, pages 1093–1102, 2010.
[17] L. Li, X. Zhao, and G. Xue. Unobservablere-authentication for smartphones. In NDSS’13, 2013.
[18] D. Luca et al. Touch me once and i know it’s you!:implicit authentication based on touch screenpatterns. In ACM CHI’12, pages 987–996, 2012.
[19] C. Mallauran et al. Online face detection and userauthentication. In MM’05, pages 219–220, 2005.
[20] R. A. Maxion and K. S. Killourhy. Keystrokebiometrics with number-pad input. In IEEE DSN’10,pages 201–210, 2010.
[21] E. Miluzzo et al. Tapprints: your finger taps havefingerprints. In ACM MobiSys’12, pages 323–336,2012.
[22] F. Monrose, M. K. Reiter, and S. Wetzel. Passwordhardening based on keystroke dynamics. In ACMCCS’99, pages 73–82, 1999.
[23] F. Monrose, M. K. Reiter, and S. Wetzel. Passwordhardening based on keystroke dynamics. InternationalJournal of Information Security, 1(2):69–83, 2002.
[24] F. Monrose and A. D. Rubin. Authentication viakeystroke dynamics. In ACM CCS’97, pages 48–56,1997.
[25] C. Nickel et al. Scenario test for accelerometer-basedbiometric gait recognition. In IWSCN’11, 2011.
[26] E. Owusu et al. Accessory: password inference usingaccelerometers on smartphones. In HotMobile’12,pages 9:1–9:6, 2012.
[27] P. Phillips et al. An introduction to the good, the bad,& the ugly face recognition challenge problem. InFG’11, pages 346 –353, 2011.
[28] K. Revett. Behavioral biometrics: a remote accessapproach. Wiley, 2008.
[29] N. Sae-Bae et al. Biometric-rich gestures: a novelapproach to authentication on multi-touch devices. InACM CHI’12, pages 977–986, 2012.
[30] R. C. Sprinthall. Basic Statistial Analysis. PrenticeHall, 2011.
[31] Z. Xu, K. Bai, and S. Zhu. Taplogger: inferring userinputs on smartphone touchscreens using on-boardmotion sensors. In WISEC’12, pages 113–124, 2012.
[32] S. Zahid et al. Keystroke-based user identification onsmart phones. In RAID’09, pages 224–243, 2009.
[33] N. Zheng, A. Paloski, and H. Wang. An efficient userverification system via mouse movements. In ACMCCS’11, pages 139–150, 2011.
Appendix I: Participants Consent Form in DataCollectionThe general nature of this study entitled “User Verificationon Smartphones via Tapping Behaviors” conducted by Dr.(name masked) has been explained to me. I understand thatI will be asked to (1) conduct regular tasks with a smart-phone, like entering a designated 4-digit number; (2) tap-ping on the touchscreen in a regular way during the study;and (3) spend about 5 minutes for the entire process. Nodata are being collected regarding personal credentials —e.g., no tracking on my personal credentials, because I willbe given a designated number to enter. Only the physicalinput data from the touchscreen sensor are recorded, includ-ing taping pressure, contact size, acceleration of the phone,and timing information. I understand that my responseswill be anonymous and that my name will not be associatedwith any results of this study. I am aware that I am freeto discontinue my participation at any time and may reportdissatisfactions with any aspect of this experiment to theChair of the Protection of Human Subjects Committee, Dr.
11
Effect of Mimic Attack
0 0.5 1 1.5 2 2.5 3
Dissmilarity Score
All Features
Target UserImpostor #2 (After Observation)
Impostor #2 (Before Observation)Impostor #1 (After Observation)
Impostor #1 (Before Observation)
0 0.2 0.4 0.6 0.8 1 1.2
Dissmilarity Score
Time
0 0.2 0.4 0.6
Dissmilarity Score
Pressure
0 0.5 1 1.5 2
Dissmilarity Score
Acceleration
0 0.1 0.2 0.3
Dissmilarity Score
Size
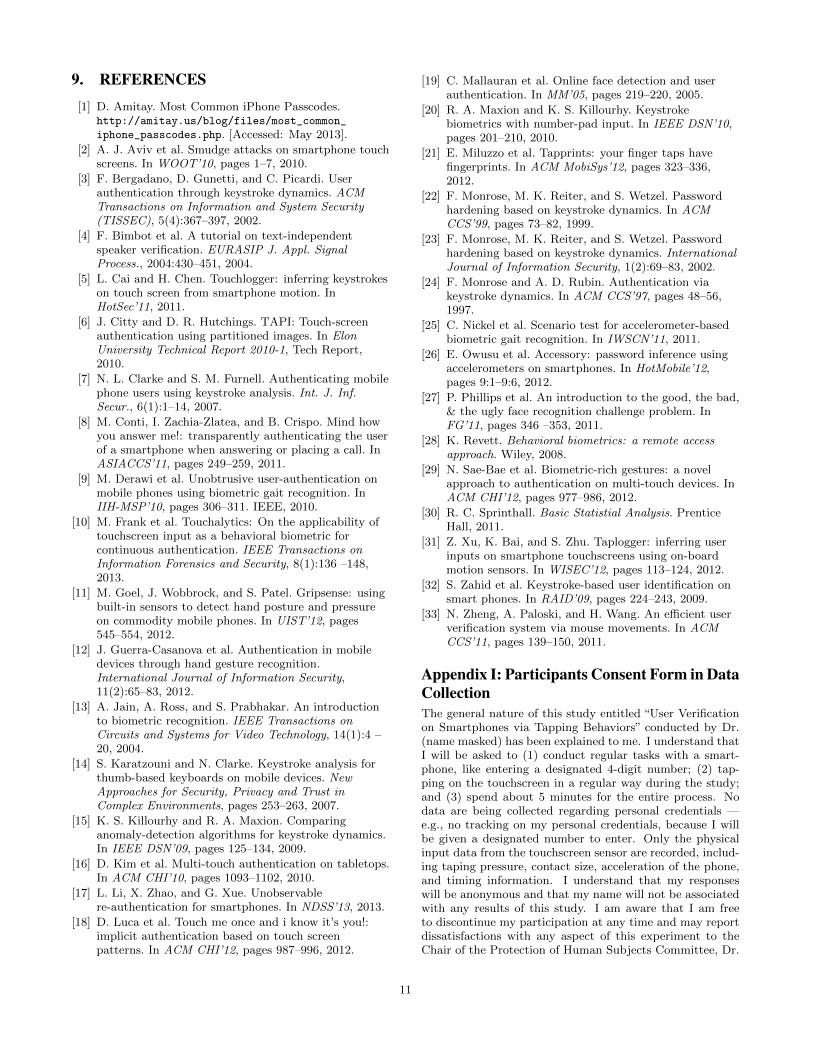
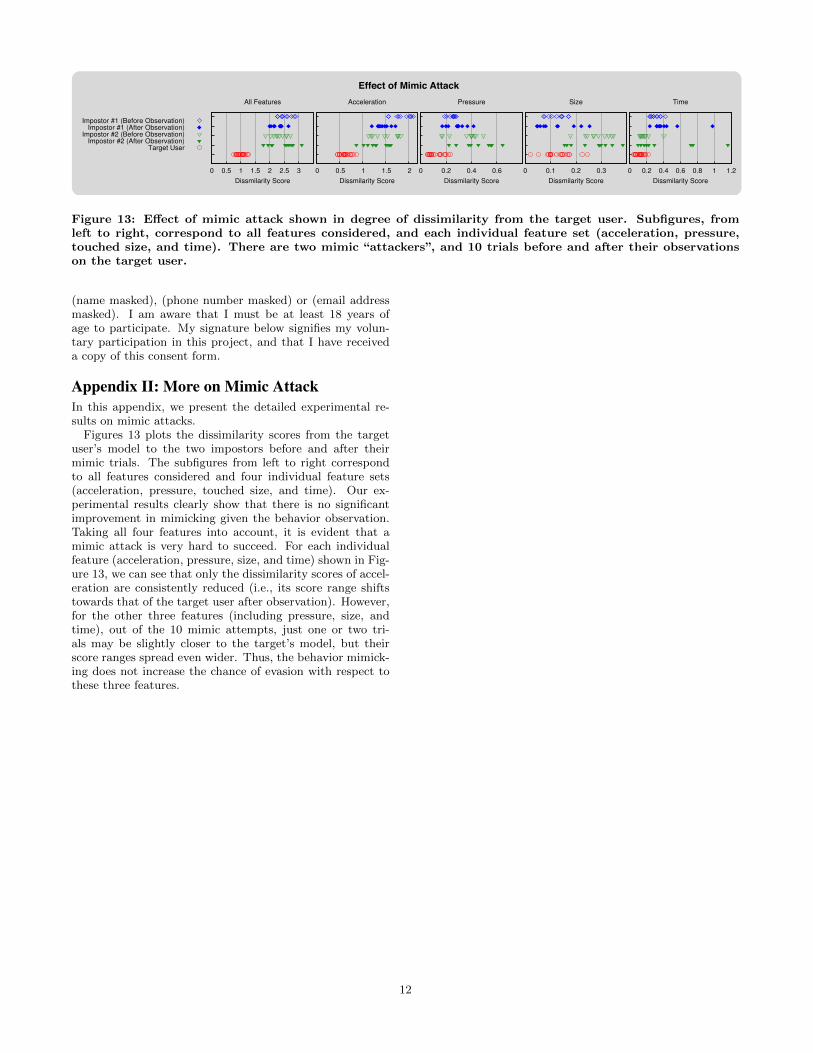
Figure 13: Effect of mimic attack shown in degree of dissimilarity from the target user. Subfigures, fromleft to right, correspond to all features considered, and each individual feature set (acceleration, pressure,touched size, and time). There are two mimic “attackers”, and 10 trials before and after their observationson the target user.
(name masked), (phone number masked) or (email addressmasked). I am aware that I must be at least 18 years ofage to participate. My signature below signifies my volun-tary participation in this project, and that I have receiveda copy of this consent form.
Appendix II: More on Mimic AttackIn this appendix, we present the detailed experimental re-sults on mimic attacks.
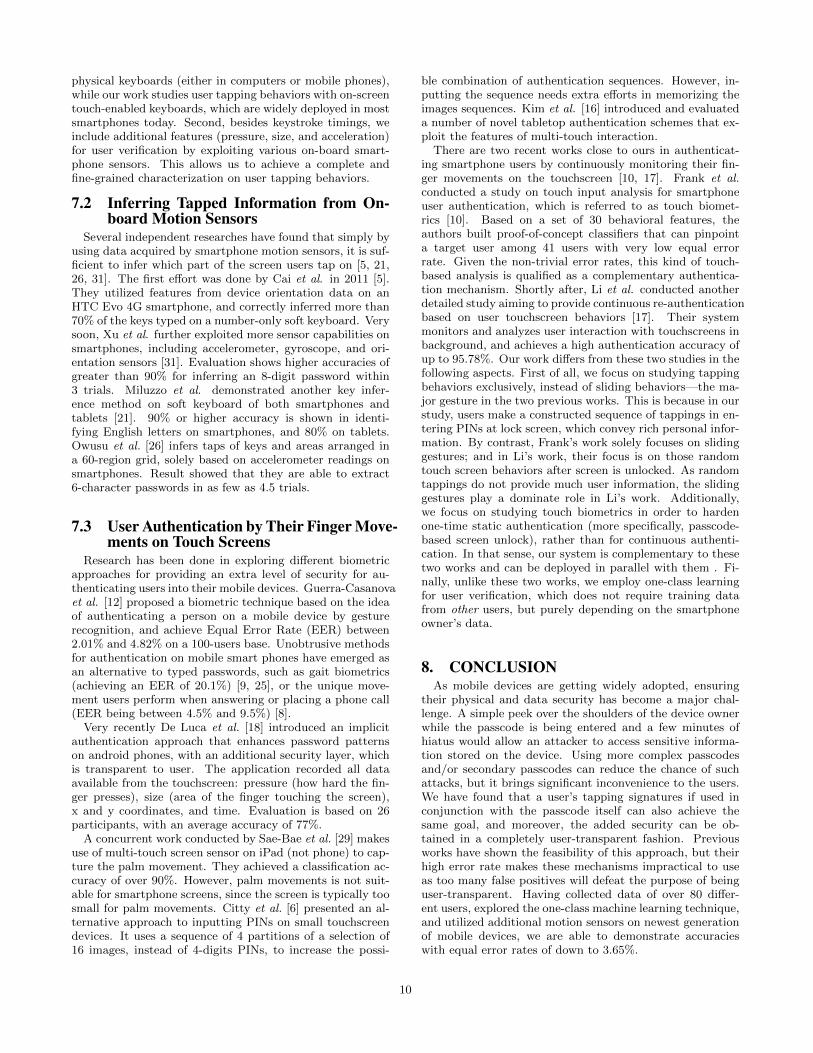
Figures 13 plots the dissimilarity scores from the targetuser’s model to the two impostors before and after theirmimic trials. The subfigures from left to right correspondto all features considered and four individual feature sets(acceleration, pressure, touched size, and time). Our ex-perimental results clearly show that there is no significantimprovement in mimicking given the behavior observation.Taking all four features into account, it is evident that amimic attack is very hard to succeed. For each individualfeature (acceleration, pressure, size, and time) shown in Fig-ure 13, we can see that only the dissimilarity scores of accel-eration are consistently reduced (i.e., its score range shiftstowards that of the target user after observation). However,for the other three features (including pressure, size, andtime), out of the 10 mimic attempts, just one or two tri-als may be slightly closer to the target’s model, but theirscore ranges spread even wider. Thus, the behavior mimick-ing does not increase the chance of evasion with respect tothese three features.
12