Embed Size (px)
Citation preview

Deeds Speak
YORK REGIONAL POLICE
STATISTICAL REPORTJANUARY - DECEMBER 2015
Prepared by the Statistics Section
MARCH 2016

DISCLAIMER:
The information contained in this report is the property of the York Regional Police. Reproduction or distribution of this report in whole or in part is
permitted subject to appropriate source citation and the express prior written consent of the Chief of Police of the York Regional Police.
York Regional Police does not assume any liability for any decision made or action taken in reliance upon any information or data provided.
If you require an accessible version of any publication, please contact extension 7677 or email [email protected].

YYOORRKK RREEGGIIOONNAALL PPOOLLIICCEE
22001155 AANNNNUUAALL SSTTAATTIISSTTIICCAALL RREEPPOORRTT
TTAABBLLEE OOFF CCOONNTTEENNTTSS
About this Report
In this Report.......................................................................................................................1
How are Crimes Counted? ..................................................................................................1
Making Comparisons ..........................................................................................................1
Terminology ........................................................................................................................1
Types of Violations: Incident-based Reporting ..................................................................3
Changes in Reporting Methodology ...................................................................................5
Executive Summary .........................................................................................................................7
Region of York Statistics
Crime Statistics – Five Year Data (2011–2015) ................................................................11
Crimes Against Persons (2014–2015) ...............................................................................12
Crimes Against Property (2014–2015) ..............................................................................13
Five Year Trend – Selected Violations (2011–2015)
Crimes Against Persons .........................................................................................14
Violations Causing Death ......................................................................................15
Attempt Capital Crime ..........................................................................................16
Sexual Violations ..................................................................................................17
Assault ...................................................................................................................18
Robbery .................................................................................................................19
Crimes Against Property .......................................................................................20
Other Criminal Code .............................................................................................21
Total Criminal & Federal Violations (excluding Traffic) .....................................22
Traffic Violations ..................................................................................................23
Crime Statistics (2014–2015) ............................................................................................24
Robbery Statistics (2014–2015) ........................................................................................25
Stolen Vehicle Statistics (2014–2015) ..............................................................................26
Traffic Violations (2014–2015) .........................................................................................27
Fatal Motor Vehicle Collision Statistics (2014–2015) ......................................................28
Clearance Rates (2014–2015)............................................................................................29
Youth Statistics (2014–2015) ............................................................................................30
Hate Crime (2014–2015) ...................................................................................................31
Calls for Service (2014–2015)...........................................................................................32
Call Type Comparison (2014–2015) ................................................................................33
Miscellaneous Statistics (2014–2015) ….. ....................................................................... 35
District 1 Statistics
Map ................................................................................................................................... 36
Crime Statistics (2014–2015) ........................................................................................... 37
Clearance Rate (2014–2015) ............................................................................................. 38
District 2 Statistics
Map ................................................................................................................................... 39
Crime Statistics (2014–2015) ........................................................................................... 40
Clearance Rate (2014–2015) ............................................................................................. 41
District 3 Statistics
Map ................................................................................................................................... 42
Crime Statistics (2014–2015) ........................................................................................... 43
Clearance Rate (2014–2015) ............................................................................................. 44
District 4 Statistics
Map ................................................................................................................................... 45
Crime Statistics (2014–2015) ........................................................................................... 46
Clearance Rate (2014–2015) ............................................................................................. 47
District 5 Statistics
Map ................................................................................................................................... 48
Crime Statistics (2014–2015) ........................................................................................... 49
Clearance Rate (2014–2015) ............................................................................................. 50
Municipality Crime Statistics (2014-2015)
Aurora ............................................................................................................................... 51
East Gwillimbury .............................................................................................................. 52
Georgina ............................................................................................................................ 53
King................................................................................................................................... 54
Markham ........................................................................................................................... 55
Newmarket ........................................................................................................................ 56
Richmond Hill ................................................................................................................... 57
Vaughan ............................................................................................................................ 58
Whitchurch-Stouffville ..................................................................................................... 59

York Regional Police 2015 Annual Statistical Report
Page 1
ABOUT THIS REPORT
IN THIS REPORT
This report contains a summary of crime statistics for York Regional Police
pertaining to incidents reported between January 1 and December 31, 2015. A one- year and five-year comparison is made. Miscellaneous statistics are also included.
HOW ARE CRIMES COUNTED?
York Regional Police publishes crime statistics based on the number of reported violations using the Incident-based Uniform Crime Reporting (UCR2) methodology.
UCR2 classifies incidents according to the four most serious violations in the incident (generally the violations which carry the longest maximum sentences under
the Criminal Code). Violent incidents are classified differently from other types of crime. For violent crime, a separate incident is recorded for each victim. In categorizing incidents, violent violations always take precedence over non-violent
violations. For the purposes of this report, all violations within an incident are included and robbery violations are counted per incident.
All data in this report is based on reported crimes and represents a “snapshot” at
the time of extraction from the records management system at year-end. Unless otherwise noted, any updates or revisions to data for the years previous to 2015 are
not reflected in this report.
MAKING COMPARISONS
Unless otherwise noted, all crime statistics in this report are compiled using the “all
violations” methodology. These statistics should not be compared with those provided by the Canadian Centre for Justice Statistics (CCJS), a division of Statistics Canada. This published data measures only the most serious offence related to an incident. In addition, the CCJS includes the number of offences reported by the
Toronto North Detachment of the Royal Canadian Mounted Police with York Regional Police’s crime statistics.
The CCJS data should be used for comparisons between policing jurisdictions as all data is compiled using the same reporting methodology.
TERMINOLOGY
Actual totals include only those incidents for which an occurrence report was made and have been substantiated through police investigation.
ATM robberies include robberies at ATM machines within financial institutions or at stand-alone locations where the victim is approached and forced to withdraw
money or is robbed as they are leaving the machine.
York Regional Police 2015 Annual Statistical Report
Page 2
Calls to Communications Bureau include all telephone calls, 911 and non-
emergency, made by members of the public.
Car Jacking includes robberies where the intent is to steal a motor vehicle with the use or threat of violence against the person(s) in care or control of that vehicle.
Citizen Generated Calls for service occur when a citizen requests or requires a police response of any kind. Requests are received by, but not limited to, 911 telephone calls, non-emergency telephone calls, walk-in requests, online reports, or
requests via other agencies.
Clearance rates are calculated by the number of violations cleared by charge or otherwise (persons processed by other means) divided by the number of violations. These violations may not necessarily have occurred during the reporting period but
some time prior. Crime rates are expressed as a rate per 100,000 population using year-end
population estimates supplied by the York Region Planning and Development Services Department and have been rounded to two decimals.
Criminal incident refers to a set of connected events which usually constitute an occurrence report. One incident can include more than one violation.
Deposit robberies include robberies where a business deposit is stolen from a
person using force. Fatal Motor Vehicle Collisions Contributing Factors are based on the Major
Collision Investigation Unit’s interpretation of each collision. Distracted driving is counted if there is some physical or witnessed evidence to suggest the collision was linked to distraction. Inattentive is based on witness or physical evidence that would
cause belief that the responsible driver was inattentive and there is no other explanation for the collision. All other categories are self-explanatory.
Financial robberies include robberies occurring at banks, credit unions, or involving armoured cars.
Hate crime means a criminal offence committed against a person or property which
is motivated by the offender’s bias, prejudice or hate based on race, national or ethnic origin, language, colour, religion, sex, age, mental or physical disability, sexual orientation, or any other similar factor.
Home invasion is an intrusion into a residence with the intent of robbing the occupants therein.
Offence is defined as a statistical fact for aggregate-based reporting. This
terminology is not used in incident-based reporting.

York Regional Police 2015 Annual Statistical Report
Page 3
Other robberies include robberies that do not meet the criteria for any of the other categories. Examples include hotel robberies, robberies by uninvited guests at house
parties, and break and enter occurrences that result in a robbery occurring.
Retail robberies include robberies occurring at retail or commercial premises including convenience stores, restaurants/fast food establishments, massage parlours, gas stations, and donut/coffee shops.
Street robberies include muggings and intimidation style robberies and all other robberies by force or threat of force that occurs in a public place.
Violation refers to a contravention of the Criminal Code, Federal, or Provincial Statutes. Young person refers to a person aged 12 - 17 years inclusive (Youth Criminal Justice
Act).
Youth refers to a person under the age of 18 years.
Youth crime rate refers to the number of youths formally charged plus processed by other means for committing a criminal or federal offence per 1,000 youth population. Youth population estimates used are supplied by the York Region
Planning and Development Services Department.
TYPES OF VIOLATIONS: INCIDENT-BASED REPORTING
Crimes Against Persons are crimes involving aggressive action (with the intent to
do harm) or threat of such action by one person against another. These include violations causing death, attempt capital crime, sexual violations, assault, robbery and other violent violations, and violations/deprivation of freedom.
Violations Causing Death include murder 1st degree, murder 2nd degree, manslaughter, infanticide, criminal negligence cause death, and other related
offences causing death.
Attempt Capital Crime violations include attempted murder and conspiracy to commit murder.
Sexual violations include aggravated sexual assault, sexual assault with a weapon or cause bodily harm, and level 1 sexual assault. This category also includes sexual
violations that specifically apply to children such as invitation to sexual touching, sexual exploitation, incest, corrupting morals of a child, voyeurism and luring child via computer. Effective May 2015, this category also includes distribution of
intimate images. Assault violations include aggravated assault, assault with a weapon or cause bodily
harm, assault, unlawfully cause bodily harm, discharge firearm with intent, assault
York Regional Police 2015 Annual Statistical Report
Page 4
peace/public officer, criminal negligence cause bodily harm, use firearm/imitation in commission of offence and point firearm.
Robbery and Other Violent Violations include robbery, extortion, criminal
harassment, uttering threats, explosives causing death/bodily harm, arson disregard for human life, intimidation of a justice system participant, intimidation of a non-justice system participant, and indecent/harassing communications.
Violations/Deprivation of Freedom include kidnapping, forcible confinement, hostage taking, trafficking in persons, and abduction.
Crimes Against Property involve unlawful acts with respect to property but do not
involve the use or threat of violence against an individual. These include arson, break and enter, theft, have stolen goods, fraud, and mischief.
Drug violations include violations under the Controlled Drugs and Substances Act and the Food and Drug Act. These violations are comprised of possession, trafficking,
and importation/exportation or production of various illicit controlled drugs and substances.
Weapons violations include violations under the Criminal Code which involve any thing used, designed to be used or intended for use in causing death or injury to any
person or used for the purpose of threatening or intimidating any person. These include possession, use, trafficking, pointing, unauthorized import/export, firearms documentation and administration, and unsafe storage.
Public Morals violations include prostitution, indecent acts, production/distribution
of child pornography, gaming and betting, and public morals. Other Criminal Code violations include the remaining non-traffic Criminal Code
violations that are classified as neither violent nor property violations. These violations are divided into two parts:
Part A: include bail violations, counterfeiting currency, disturb the peace, escape custody, luring a child via computer (effective April 1, 2008, this category is included in sexual violations), obstruct, unlawfully at large,
trespass at night, fail to appear, breach of probation, and threatening/harassing telephone calls (effective April 1, 2008, this category is
included in robbery and other violent violations).
Part B: include offences against public order, offences relating to terrorist
activity, offences against administration of law and justice, invasion of privacy, offences against the person and reputation, offences against the rights or property, fraudulent transactions/contracts and trade, intimidation of justice
system participant, wilful/forbidden acts/respect of certain property, offences related to currency, proceeds of crime, attempts/conspiracies/accessories,
offences relating to criminal organization, and all other criminal code. Federal Statutes violations include violations under all other federal statutes. They
York Regional Police 2015 Annual Statistical Report
Page 5
include the Bankruptcy Act, Income Tax Act, Canada Shipping Act, Public Health Act, Customs Act, Competition Act, Excise Act, Immigration Act, Firearms Act, National Defence Act, Young Offenders Act, Youth Criminal Justice Act, and Other Federal Statutes. Traffic violations include all traffic violations under the Criminal Code. These
include dangerous operation, evade police, impaired related violations (alcohol and drug), street racing, and other criminal traffic violations including fail to stop or remain and drive while prohibited.
CHANGES IN REPORTING METHODOLOGY
In April 2011, Bill S-9 (Tackling Auto Theft and Trafficking in Property Obtained by
Crime) came into effect amending the Criminal Code. A number of UCR violation codes were introduced by the CCJS which do not impact the statistical comparisons
found within this report. In 2012, the Safe Streets and Communities Act (formally known as Bill C-10) was
created to better protect children and youth from sexual predators. For the purposes of this report, new UCR violation codes are included in the Sexual Violations
category. In July 2013, Bill S-7 came into force amending the Criminal Code bringing changes
in relation to harboring terrorists. For the purposes of this report, a new UCR violation code is included the Other Criminal Code (Part B) category.
In 2013, York Regional Police changed the methodology for calculating calls for service. Calls are now counted as total citizen generated calls for service. Due to the
change in methodology, comparisons cannot be made with calls for service for 2013 and 2014 with previous years.
In 2013, York Regional Police changed the methodology for calculating response time. Due to the change in methodology, comparisons cannot be made with
response times for 2013 and 2014 with previous years. On February 17, 2014, the police district boundaries for 1 District and 5 District
were realigned. Caution to be used in making comparisons with previous years’ statistics.
In December 2014, Bill C-36 came into force amending the Criminal Code to create offences in relation to prostitution. For the purposes of this report, the new UCR
violation codes are included in the Prostitution/Public Morals category.
In 2015, York Regional Police modified the default priorities for some call types. This change in methodology could affect call response time comparisons for 2015 compared to previous years.

York Regional Police 2015 Annual Statistical Report
Page 6
In April 2015, Bill C-10 Tackling Contraband Tobacco Act created the offence of selling, etc. of tobacco products and raw leaf tobacco, previously an offence under
the Excise Act. Incidents of this offence will now be included under the Other Criminal Code Part B category.
In March 2015, Bill C-13 Protecting Canadians from Online Crime Act created a Criminal Code offence for the non-consensual distribution of intimate images and a
new UCR violence code was introduced. For the purposes of this report, this offence is included in the Sexual Violations category.
In June 2015, Bill C-51 Anti-terrorism Act, 2015 was granted royal assent resulting
in the addition of a new UCR Violation Code for advocating or promoting commission of terrorism offences. For the purposes of this report, this offence is included in Other Criminal Code Part B category.
York Regional Police 2015 Annual Statistical Report Page 7
EXECUTIVE SUMMARY
208,211 CITIZEN GENERATED CALLS FOR SERVICE were received in 2015 compared
to 220,546 during the corresponding period in 2014. This represents a decrease of 12,335 calls or 5.6 percent.
33,202 CRIMINAL & FEDERAL violations were reported between January 1 and
December 31, 2015 compared to 30,962 during the corresponding period in 2014. This represents an increase of 2,240 violations or 7.2 percent. The crime rate per 100,000 population in 2015 was 2,846.73 compared to 2,704.67
during the corresponding period in 2014. This represents an increase of 5.3 percent.
6,482 CRIMES AGAINST PERSONS (violent crime) violations were reported between
January 1 and December 31, 2015 compared to 6,108 during the corresponding period in 2014. This represents an increase of 374 violations or 6.1 percent. The violent crime rate per 100,000 population in 2015 was 555.76
compared to 533.56 during the corresponding period in 2014. This represents an increase of 4.2 percent.
8 VIOLATIONS CAUSING DEATH (Homicide and Criminal Negligence Cause Death) were reported in 2015 compared to 14 during the corresponding period in
2014. This represents a decrease of 6 violations or 42.9 percent. Based on the rate of Violations Causing Death per 100,000 population, there has been a
decrease of 43.9 percent.
13 ATTEMPT CAPITAL CRIME violations were reported in 2015 compared to 18
during the corresponding period in 2014. This represents a decrease of 5 violations or 27.8 percent. Based on the rate of Attempt Capital Crime
violations per 100,000 population, there has been a decrease of 29.1 percent.
492 SEXUAL VIOLATIONS were reported in 2015 compared to 408 during the corresponding period in 2014. This represents an increase of 84 violations or
20.6 percent. Based on the rate of Sexual Violations per 100,000 population, there has been an increase of 18.4 percent.
3,347 ASSAULT violations were reported in 2015 compared to 3,273 during the corresponding period in 2014. This represents an increase of 74 violations or
2.3 percent. Based on the rate of Assault violations per 100,000 population, there has been an increase of 0.4 percent.
222 ROBBERY violations were reported in 2015 compared to 205 during the
corresponding period in 2014. This represents an increase of 17 violations or 8.3 percent. Based on the rate of Robbery violations per 100,000 population, there has been an increase of 6.3 percent. Car Jacking incidents represent 2.7
percent of the total Robbery violations while Home Invasions represent 4.5
York Regional Police 2015 Annual Statistical Report Page 8
percent. Street related robberies during this period represent 67.0 percent of all robberies.
4,998 INTIMATE DOMESTIC RELATED occurrences (criminal and non-criminal)
were reported in 2015 compared to 4,652 during the corresponding period in 2014. This represents an increase of 346 occurrences or 7.4 percent. Of the
total occurrences reported, 26.0 percent resulted in charges. In 2015, there was one domestic related homicide that occurred in York Region.
Reported HATE CRIME occurrences in York Region decreased 16.8 percent in 2015 compared to the corresponding period in 2014. There were 89 criminal
occurrences of hate motivated crime reported in 2015 compared to 107 in 2014. The category with the highest number of occurrences was “race/ethnicity” with a total of 45 hate crimes. Of those cases, the Black community was most
targeted at 20 occurrences. The next highest category statistically was “religion” where the total reported hate crimes were 37. Of those cases, the Jewish
community was found to be the most victimized at 19 hate crimes followed by the Muslim community at 11 occurrences. There were 6 hate crimes based on sexual orientation.
20,067 CRIMES AGAINST PROPERTY (property crime) violations were reported
between January 1st and December 31st, 2015 compared to 18,207 during the corresponding period in 2014. This represents an increase of 1,860 violations
or 10.2 percent. The property crime rate per 100,000 population in 2015 was 1,720.54 compared to 1,590.46 during the corresponding period in 2014. This represents an increase of 8.2 percent.
831 STOLEN VEHICLES were reported in 2015 compared to 808 during the
corresponding period in 2014. This represents an increase of 23 vehicles or 2.8 percent. Based on the rate of stolen vehicles per 100,000 population, there has been an increase of 0.9 percent. One half of the vehicles reported stolen in York
Region were trucks (50.0 percent). Honda was the most common make of automobile stolen (19.3 percent) and Toyota was the most frequent make of
truck stolen (18.2 percent).
3,774 OTHER CRIMINAL CODE (INCLUDING WEAPONS & PUBLIC MORALS) violations
were reported in 2015 compared to 3,550 during the corresponding period in 2014. This represents an increase of 224 violations or 6.3 percent. Based on
the rate of Other Criminal Code violations per 100,000 population, there has been an increase of 4.3 percent.
4,291 CRIMINAL TRAFFIC violations were reported in 2015 compared to 4,223
during the corresponding period in 2014. This represents an increase of 68 violations or 1.6 percent. Based on the rate of Criminal Traffic violations per 100,000 population, there has been a decrease of 0.3 percent.
1,255 IMPAIRED OPERATION/RELATED violations were reported in 2015 compared
to 1,108 during the corresponding period in 2014. This represents an increase
York Regional Police 2015 Annual Statistical Report Page 9
of 147 violations or 13.3 percent. Based on the rate of Impaired Operation/Related violations per 100,000 population, there has been an
increase of 11.2 percent.
363 DANGEROUS OPERATION violations were reported in 2015 compared to 314 during the corresponding period in 2014. This represents an increase of 49
violations or 15.6 percent. Based on the rate of Dangerous Operation violations per 100,000 population, there has been an increase of 13.5 percent.
The number of identified YOUTH involved in criminal incidents (formally charged and processed by other means) in York Region decreased 4.8 percent in 2015
compared to the corresponding period in 2014. The number of young persons charged increased 1.5 percent while the number of youths processed by other means decreased 6.7 percent. The Youth Crime rate per 1,000 youth population
decreased 6.8 percent.
In 2015, the CLEARANCE RATE for Crimes Against Persons decreased from 78.6 percent in 2014 to 76.1 percent. The Property Crime clearance rate also
decreased from 44.2 percent to 42.9 percent. The overall clearance rate for Criminal Code & Federal violations decreased from 61.7 percent in 2014 to 59.7 percent during the corresponding period in 2015.
14,697 REPORTABLE MOTOR VEHICLE COLLISION REPORTS were processed in 2015
compared to 15,590 during the corresponding period in 2014. This represents a decrease of 893 reports or 5.7 percent. Based on the rate of reportable motor
vehicle collisions per 100,000 population, there has been a decrease of 7.5 percent.
19 FATAL COLLISIONS occurred on our roadways in 2015 compared to 25 during the corresponding period in 2014. This represents a decrease of 6 collisions or
24.0 percent.
23 PERSONS DIED on our roadways in 2015 compared to 26 during the
corresponding period in 2014. This represents a decrease of 3 persons or 11.5
percent.
In 2015, 216,899 9-1-1 calls were received in the COMMUNICATIONS BUREAU
compared to 233,666 during the corresponding period in 2014. This represents a decrease of 7.2 percent. The number of non-emergency calls increased 1.6
percent (383,306 to 389,255). The total number of calls received decreased 1.8 percent (606,154 from 616,975).
INFORMATION MANAGEMENT processed 8,129 requests for motor vehicle collision/incident summary reports in 2015 compared to 10,889 during the
corresponding period in 2014. This represents a decrease of 2,760 requests or 25.3 percent. The number of police clearance letters processed in 2015
decreased 15.7 percent from the corresponding period in 2014 (28,550 from

York Regional Police 2015 Annual Statistical Report Page 10
33,876) and the number of volunteer screening letters increased 0.2 percent (41,760 to 41,848).
During 2015, a total of 3,634 FREEDOM OF INFORMATION requests were received
compared to 3,405 during the corresponding period in 2014. This represents an increase of 229 requests for information or 6.7 percent. Formal requests
increased 4.1 percent (1,279 to 1,331) and the number of informal requests also increased 8.3 percent (2,126 to 2,303).
The ALARM PROGRAM saw a 17.3 percent decrease in alarm calls received (15,314 from 18,516) in 2015. The number of false alarms continues to be
problematic with 98.6 percent of the calls being false. This decreased slightly from 99.4 percent in 2014.
Tips received by CRIME STOPPERS increased 42.2 percent in 2015 compared to 2014 (1,467 to 2,086). Arrests made as a result of Crime Stoppers tips
increased 39.0 percent (41 to 57). Property recovered decreased by 57.3 percent in 2015 compared to 2014 ($26,422 from $61,830). Drugs seized significantly
decreased 94.3 percent in 2015 ($41,651 from $728,396).
The VICTIM SERVICES OF YORK REGION program increased 65.3 percent in on-
scene occurrences and the number of telephone crisis calls/office visits also increased 10.2 percent. In 2015, female clients represented 59.6 percent of the
total clients served while male clients represented 13.7 percent and children represented 26.7 percent.

York Regional Police 2015 Annual Statistical Report Page 11
STATISTICS
FIVE YEAR DATA (JANUARY - DECEMBER)
2011
2012
2013
2014
2015
Population
1 1,085,588
1,108,570
1,130,386
1,144,760
1,166,321
Citizen Generated Calls for Service N.A.2
251,924
223,918
220,546
208,211
Motor Vehicle Collisions (Reportable) Property Damage 16,220
15,157
14,395
12,340
11,541
Personal Injury 3,422
3,441
3,438
3,225
3,137
Fatal 28
26
19
25
19
Total 19,670
18,624
17,852
15,590
14,697 Fail to Remain 3,100
2,727
3,105
2,849
2,750
Crimes Against Persons
Total 6,585
6,613
6,080
6,108
6,482
Cleared 5,395
5,222
4,914
4,802
4,932
Clearance Rate (%) 81.9
79.0
80.8
78.6
76.1
Rate per 100,000 population 606.58
596.53
537.87
533.56
555.76
Crimes Against Property Total 20,996
20,570
19,283
18,207
20,067
Cleared 9,173
9,643
9,127
8,053
8,609
Clearance Rate (%) 43.7
46.9
47.3
44.2
42.9
Rate per 100,000 population 1,934.07
1,855.54
1,705.88
1,590.46
1,720.54
Other Criminal Code Total 3,307
2,841
2,849
2,955
3,160
Cleared 3,069
2,660
2,570
2,712
2,946
Clearance Rate (%) 92.8
93.6
90.2
91.8
93.2
Rate per 100,000 population 304.63
256.28
252.04
258.13
270.94
Weapons Violations Total 462
394
348
389
423
Cleared 366
313
270
342
331
Clearance Rate (%) 79.2
79.4
77.6
87.9
78.3
Rate per 100,000 population 42.56
35.54
30.79
33.98
36.27
Public Morals Violations Total 141
216
182
206
191
Cleared 92
135
124
140
158
Clearance Rate (%) 65.2
62.5
68.1
68.0
82.7
Rate per 100,000 population 12.99
19.48
16.10
18.00
16.38
Criminal Code - Total Total 31,491
30,634
28,742
27,865
30,323
Cleared 18,095
17,973
17,005
16,049
16,976
Clearance Rate (%) 57.5
58.7
59.2
57.6
56.0
Rate per 100,000 population 2,900.82
2,763.38
2,542.67
2,434.13
2,599.88
Drug Violations Total 2,959
2,704
2,537
2,870
2,644
Cleared 2,928
2,640
2,465
2,843
2,616
Clearance Rate (%) 99.0
97.6
97.2
99.1
98.9
Rate per 100,000 population 272.57
243.92
224.44
250.71
226.70
Other Federal Violations Total 326
257
219
227
235
Cleared 326
251
218
223
238
Clearance Rate (%) 100.0
97.7
99.5
98.2
101.3
Rate per 100,000 population 30.03
23.18
19.37
19.83
20.15
Total Criminal Code & Federal Violations Total 34,776
33,595
31,498
30,962
33,202
Cleared 21,349
20,864
19,688
19,115
19,830
Clearance Rate (%) 61.4
62.1
62.5
61.7
59.7
Rate per 100,000 population 3,203.43
3,030.48
2,786.48
2,704.67
2,846.73
Criminal Code Traffic Violations Total 4,179
3,704
4,040
4,223
4,291
Cleared 1,704
1,422
1,389
1,624
1,863
Clearance Rate (%) 40.8
38.4
34.4
38.5
43.4
Rate per 100,000 population 384.95
334.12
357.40
368.90
367.91
1 year-end population figures supplied by York Region Planning and Development Services Department based on Census Data and CMHC housing completion data.
2 methodology for calculating Calls for Service were in changed in 2013 and 2015. Please refer to page 5.

York Regional Police 2015 Annual Statistical Report Page 12
CRIMES AGAINST PERSONS
JANUARY – DECEMBER (2014 – 2015)
2014
2015
5 Year Average
2014-15 Variation (%)
Actual Rate
Actual Rate
Actual Rate
Actual Rate
Violations Causing Death 14 1.22
8 0.69
10 0.89
-42.9 -43.9
Attempt Capital Crime 18 1.57
13 1.11
17 1.47
-27.8 -29.1
Sexual Violations 408 35.64
492 42.18
456 40.42
20.6 18.4
Assault 3,273 285.91
3,347 286.97
3,252 288.72
2.3 0.4
Violations Deprivation Freedom 107 9.35
118 10.12
106 9.43
10.3 8.2
Robbery & Other Violent Violations 2,288 199.87
2,504 214.69
2,533 225.13
9.4 7.4
Total 6,108 533.56
6,482 555.76
6,374 566.06
6.1 4.2
As indicated above, 6,482 Crimes Against Persons violations were reported in 2015
compared to 6,108 during the
corresponding period in 2014. This
represents an increase of 374 violations or
6.1%.
The Violent Crime rate in 2015 was 555.76 compared to 533.56 during the
corresponding period in 2014. This
represents an increase of 4.2%.
Sexual Violations, Assault, Violations Deprivation Freedom and Robbery & Other Violent Violations saw an increase over the
past year while Violations Causing Death
and Attempt Capital Crime decreased.
Based on rate, most Violent Crime categories were below the five year average
except Sexual Violations and Violations Deprivation Freedom.

York Regional Police 2015 Annual Statistical Report Page 13
CRIMES AGAINST PROPERTY
JANUARY – DECEMBER (2014 – 2015)
2014
2015
5 Year Average
2014-15 Variation (%)
Actual Rate
Actual Rate
Actual Rate
Actual Rate
Arson 56 4.89
65 5.57
81 7.27
16.1 13.9
Break and Enter 1,847 161.34
2,300 197.20
2,111 187.51
24.5 22.2
Theft Over $5000 1,041 90.94
1,104 94.66
1,140 101.35
6.1 4.1
Theft Under $5000 7,623 665.90
8,298 711.47
8,170 725.68
8.9 6.8
Have Stolen Goods 2,316 202.31
2,456 210.58
2,627 233.58
6.0 4.1
Fraud 2,403 209.91
2,919 250.27
2,728 242.33
21.5 19.2
Mischief 2,921 255.16
2,925 250.79
2,967 263.57
0.1 -1.7
Total 18,207 1,590.46
20,067 1,720.54
19,825 1,761.30
10.2 8.2
20,067 Property Crime violations were
reported in 2015 compared to 18,207
during the corresponding period in 2014.
This represents an increase of 1,860
violations or 10.2%.
The Property Crime rate in 2015 was
1,720.54 compared to 1,590.46 during the
corresponding period in 2014. This
represents an increase of 8.2%.
All Property Crime categories saw an
increase in 2015 compared to 2014. Based
on rate, all Property Crime categories
increased except for Mischief.
Based on rate, all Property Crime
categories were below the five year average
except Break and Enter, and Fraud.

York Regional Police 2015 Annual Statistical Report Page 14
CRIMES AGAINST PERSONS
FIVE YEAR TREND JANUARY – DECEMBER (2011 – 2015)
Year Actual
1 Year Comparison
5 Year Comparison
Rate per 100,000
Population
Rate Variance (%)
Variance (%)
Variance (%)
1 Year 5 Year
2011 6,585
-466 -6.6
120 1.9
606.58
-8.6 -7.8
2012 6,613
28 0.4
-320 -4.6
596.53
-1.7 -13.0
2013 6,080
-533 -8.1
-901 -12.9
537.87
-9.8 -20.4
2014 6,108
28 0.5
-943 -13.4
533.56
-0.8 -19.6
2015 6,482
374 6.1
-103 -1.6
555.76
4.2 -8.4
1 Year Comparison:
As indicated above, 6,482 Crimes
Against Persons were reported in
2015 compared to 6,108 during
the corresponding period in
2014. This represents an
increase of 374 violations or 6.1%. Based on the rate of
Crimes Against Persons per
100,000 population, there has
been an increase of 4.2%.
5 Year Comparison:
As indicated above, 6,482 Crimes
Against Persons were reported in
2015 compared to 6,585 during the corresponding period in
2011. This represents a decrease
of 103 violations or 1.6%. Based
on the rate of Crimes Against
Persons per 100,000 population, there has been a decrease of
8.4%.

York Regional Police 2015 Annual Statistical Report Page 15
VIOLATIONS CAUSING DEATH (HOMICIDE & CRIMINAL NEGLIGENCE CAUSING DEATH)
FIVE YEAR TREND JANUARY – DECEMBER (2011 – 2015)
Year Actual
1 Year Comparison
5 Year Comparison
Rate per 100,000
Population
Rate Variance (%)
Variance (%)
Variance (%)
1 Year 5 Year
2011 11
4 57.1
3 37.5
1.01
53.7 24.5
2012 8
-3 -27.3
6 300.0
0.72
-28.8 264.9
2013 9
1 12.5
7 350.0
0.80
10.3 311.1
2014 14
5 55.6
7 100.0
1.22
53.6 85.5
2015 8
-6 -42.9
-3 -27.3
0.69
-43.9 -32.3
Note: Violations Causing Death does not include non-culpable Homicides.
1 Year Comparison:
As indicated above, 8 Violations
Causing Death were reported in
2015 compared to 14 during the
corresponding period in 2014.
This represents a decrease of 6 violations or 42.9%. Based on the
rate of Violations Causing Death
per 100,000 population, there
has been a decrease of 43.9%.
5 Year Comparison:
As indicated above, 8 Violations
Causing Death were reported in
2015 compared to 11 during the corresponding period in 2011.
This represents a decrease of 3
violations or 27.3%. Based on the
rate of Violations Causing Death
per 100,000 population, there
has been a decrease of 32.3%.

York Regional Police 2015 Annual Statistical Report Page 16
ATTEMPT CAPITAL CRIME FIVE YEAR TREND
JANUARY –DECEMBER (2011 – 2015)
Year Actual
1 Year Comparison
5 Year Comparison
Rate per 100,000
Population
Rate Variance (%)
Variance (%)
Variance (%)
1 Year 5 Year
2011 11
-17 -60.7
-1 -8.3
1.01
-61.6 -17.0
2012 18
7 63.6
2 12.5
1.62
60.2 2.6
2013 23
5 27.8
11 91.7
2.03
25.3 75.1
2014 18
-5 -21.7
-10 -35.7
1.57
-22.7 -40.4
2015 13
-5 -27.8
2 18.2
1.11
-29.1 10.0
Note: includes Attempt Murder and Conspiracy to Commit Murder.
1 Year Comparison:
As indicated above, 13 Attempt
Capital Crime violations were
reported in 2015 compared to 18
during the corresponding period
in 2014. This represents a decrease of 5 violations or 27.8%.
Based on the rate of Attempt
Capital Crime violations per
100,000 population, there has
been a decrease of 29.1%.
5 Year Comparison:
As indicated above, 13 Attempt Capital Crime violations were
reported in 2015 compared to 11
during the corresponding period
in 2011. This represents an
increase of 2 violations or 18.2%.
Based on the rate of Attempt Capital Crime violations per
100,000 population, there has
been an decrease of 10.0%.

York Regional Police 2015 Annual Statistical Report Page 17
SEXUAL VIOLATIONS FIVE YEAR TREND
JANUARY – DECEMBER (2011 – 2015)
Year Actual
1 Year Comparison
5 Year Comparison
Rate per 100,000
Population
Rate Variance (%)
Variance (%)
Variance (%)
1 Year 5 Year
2011 421
-7 -1.6
131 45.2
38.78
-3.8 31.5
2012 489
68 16.2
54 12.4
44.11
13.7 2.6
2013 468
-21 -4.3
64 15.8
41.40
-6.1 5.8
2014 408
-60 -12.8
-20 -4.7
35.64
-13.9 -11.6
2015 492
84 20.6
71 16.9
42.18
18.4 8.8
1 Year Comparison:
As indicated above, 492 Sexual
Violations were reported in 2015
compared to 408 during the
corresponding period in 2014. This represents an increase of 84
violations or 20.6%. Based on the
rate of Sexual Assault violations
per 100,000 population, there
has been an increase of 18.4%.
5 Year Comparison:
As indicated above, 492 Sexual Violations were reported in 2015
compared to 421 during the
corresponding period in 2011.
This represents an increase of 71
violations or 16.9%. Based on the rate of Sexual Assault violations
per 100,000 population, there
has been an increase of 8.8%.

York Regional Police 2015 Annual Statistical Report Page 18
ASSAULT FIVE YEAR TREND
JANUARY – DECEMBER (2011 – 2015)
Year Actual
1 Year Comparison
5 Year Comparison
Rate per 100,000
Population
Rate Variance (%)
Variance (%)
Variance (%)
1 Year 5 Year
2011 3,360
-177 -5.0
-328 -8.9
309.51
-7.1 -17.5
2012 3,200
-160 -4.8
-390 -10.9
288.66
-6.7 -18.7
2013 3,081
-119 -3.7
-397 -11.4
272.56
-5.6 -19.1
2014 3,273
192 6.2
-264 -7.5
285.91
4.9 -14.2
2015 3,347
74 2.3
-13 -0.4
286.97
0.4 -7.3
1 Year Comparison:
As indicated above, 3,347
Assault violations were reported in 2015 compared to 3,273
during the corresponding period
in 2014. This represents an
increase of 74 violations or 2.3%.
Based on the rate of Assault violations per 100,000
population, there has been an
increase of 0.4%.
5 Year Comparison:
As indicated above, 3,347
Assault violations were reported
in 2015 compared to 3,360 during the corresponding period
in 2011. This represents a
decrease of 13 violations or 0.4%.
Based on the rate of Assault
violations per 100,000
population, there has been a decrease of 7.3%.

York Regional Police 2015 Annual Statistical Report Page 19
ROBBERY FIVE YEAR TREND
JANUARY – DECEMBER (2011 – 2015)
Year Actual
1 Year Comparison
5 Year Comparison
Rate per 100,000
Population
Rate Variance (%)
Variance (%)
Variance (%)
1 Year 5 Year
2011 401
-13 -3.1
-37 -8.4
36.94
-5.2 -17.1
2012 355
-46 -11.5
-29 -7.6
32.02
-13.3 -15.7
2013 262
-93 -26.2
-126 -32.5
23.18
-27.6 -38.3
2014 205
-57 -21.8
-209 -50.5
17.91
-22.7 -54.1
2015 222
17 8.3
-179 -44.6
19.03
6.3 -48.5
1 Year Comparison:
As indicated above, 222 Robbery
violations were reported in 2015 compared to 205 during the
corresponding period in 2014.
This represents an increase of 17
violations or 8.3%. Based on the
rate of Robbery violations per 100,000 population, there has
been an increase of 6.3%.
5 Year Comparison:
As indicated above, 222 Robbery
violations were reported in 2015
compared to 401 during the
corresponding period in 2011.
This represents a decrease of 179 violations or 44.6%. Based on the
rate of Robbery violations per
100,000 population, there has
been a decrease of 48.5%.
York Regional Police 2015 Annual Statistical Report Page 20
CRIMES AGAINST PROPERTY FIVE YEAR TREND
JANUARY – DECEMBER (2011 – 2015)
Year Actual
1 Year Comparison
5 Year Comparison
Rate per 100,000
Population
Rate Variance (%)
Variance (%)
Variance (%)
1 Year 5 Year
2011 20,996
-914 -4.2
-2,208 -9.5
1,934.07
-6.3 -18.1
2012 20,570
-426 -2.0
-3,322 -13.9
1,855.54
-4.1 -21.5
2013 19,283
-1,287 -6.3
-3,327 -14.7
1,705.88
-8.1 -22.1
2014 18,207
-1,076 -5.6
-3,703 -16.9
1,590.46
-6.8 -22.9
2015 20,067
1,860 10.2
-929 -4.4
1,720.54
8.2 -11.0
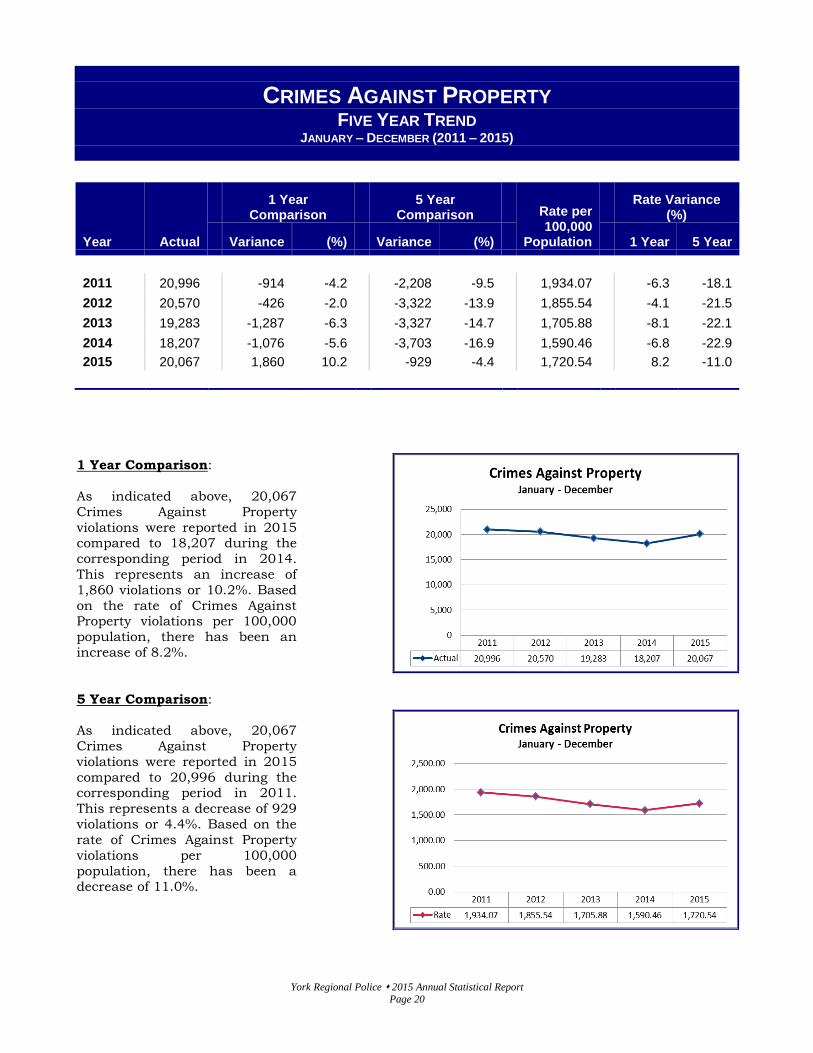
1 Year Comparison:
As indicated above, 20,067
Crimes Against Property
violations were reported in 2015 compared to 18,207 during the
corresponding period in 2014.
This represents an increase of
1,860 violations or 10.2%. Based
on the rate of Crimes Against Property violations per 100,000
population, there has been an
increase of 8.2%.
5 Year Comparison:
As indicated above, 20,067
Crimes Against Property
violations were reported in 2015
compared to 20,996 during the corresponding period in 2011.
This represents a decrease of 929
violations or 4.4%. Based on the
rate of Crimes Against Property
violations per 100,000
population, there has been a decrease of 11.0%.

York Regional Police 2015 Annual Statistical Report Page 21
OTHER CRIMINAL CODE (INCL. OTHER CRIMINAL CODE, WEAPONS, & PUBLIC MORALS)
FIVE YEAR TREND JANUARY – DECEMBER (2011 – 2015)
Year Actual
1 Year Comparison
5 Year Comparison
Rate per 100,000
Population
Rate Variance (%)
Variance (%)
Variance (%)
1 Year 5 Year
2011 3,910
-106 -2.6
-761 -16.3
360.17
-4.8 -24.2
2012 3,451
-459 -11.7
-1,058 -23.5
311.30
-13.6 -30.2
2013 3,379
-72 -2.1
-620 -15.5
298.92
-4.0 -22.8
2014 3,550
171 5.1
-466 -11.6
310.11
3.7 -18.0
2015 3,774
224 6.3
-136 -3.5
323.58
4.3 -10.2
1 Year Comparison:
As indicated above, 3,774 Other
Criminal Code violations were reported in 2015 compared to
3,550 during the corresponding
period in 2014. This represents
an increase of 224 violations or
6.3%. Based on the rate of Other
Criminal Code violations per 100,000 population, there has
been an increase of 4.3%.
5 Year Comparison:
As indicated above, 3,774 Other
Criminal Code violations were
reported in 2015 compared to
3,910 during the corresponding period in 2011. This represents a
decrease of 136 violations or
3.5%. Based on the rate of Other
Criminal Code violations per
100,000 population, there has
been a decrease of 10.2%.

York Regional Police 2015 Annual Statistical Report Page 22
TOTAL CRIMINAL & FEDERAL VIOLATIONS (EXCL. TRAFFIC)
FIVE YEAR TREND JANUARY – DECEMBER (2011 – 2015)
Year Actual
1 Year Comparison
5 Year Comparison
Rate per 100,000
Population
Rate Variance (%)
Variance (%)
Variance (%)
1 Year 5 Year
2011 34,776
-1,636 -4.5
-2,649 -7.1
3,203.43
-6.6 -15.9
2012 33,595
-1,181 -3.4
-5,096 -13.2
3,030.48
-5.4 -20.8
2013 31,498
-2,097 -6.2
-5,311 -14.4
2,786.48
-8.1 -21.8
2014 30,962
-536 -1.7
-5,450 -15.0
2,704.67
-2.9 -21.1
2015 33,202
2,240 7.2
-1,574 -4.5
2,846.73
5.3 -11.1
1 Year Comparison:
As indicated above, 33,202
Criminal & Federal Statute
violations were reported in 2015
compared to 30,962 during the
corresponding period in 2014. This represents an increase of
2,240 violations or 7.2%. Based
on the rate of Criminal & Federal
Statute violations per 100,000
population, there has been an
increase of 5.3%.
5 Year Comparison:
As indicated above, 33,202
Criminal & Federal Statute
violations were reported in 2015
compared to 34,776 during the
corresponding period in 2011.
This represents a decrease of 1,574 violations or 4.5%. Based
on the rate of Criminal & Federal
Statute violations per 100,000
population, there has been a
decrease of 11.1%.

York Regional Police 2015 Annual Statistical Report Page 23
CRIMINAL CODE TRAFFIC VIOLATIONS FIVE YEAR TREND
JANUARY – DECEMBER (2011 – 2015)
Year Actual
1 Year Comparison
5 Year Comparison
Rate per 100,000
Population
Rate Variance (%)
Variance (%)
Variance (%)
1 Year 5 Year
2011 4,179
389 10.3
1,484 55.1
384.95
7.9 40.4
2012 3,704
-475 -11.4
724 24.3
334.12
-13.2 13.4
2013 4,040
336 9.1
-44 -1.1
357.40
7.0 -9.6
2014 4,223
183 4.5
433 11.4
368.90
3.2 3.4
2015 4,291
68 1.6
112 2.7
367.91
-0.3 -4.4
1 Year Comparison:
As indicated above, 4,291
Criminal Code Traffic violations
were reported in 2015 compared
to 4,223 during the
corresponding period in 2014. This represents an increase of 68
violations or 1.6%. Based on the
rate of Criminal Code Traffic
violations per 100,000
population, there has been a
decrease of 0.3%.
5 Year Comparison:
As indicated above, 4,291
Criminal Code Traffic violations
were reported in 2015 compared
to 4,179 during the
corresponding period in 2011.
This represents an increase of 112 violations or 2.7%. Based on
the rate of Criminal Code Traffic
violations per 100,000
population, there has been a
decrease of 4.4%.

York Regional Police 2015 Annual Statistical Report Page 24
CRIME STATISTICS JANUARY – DECEMBER (2014 – 2015)
2014
2015
2014/15
Actual
Percent Cleared
Rate Per 100,000
Population
Actual Percent Cleared
Rate Per 100,000
Population
Variance in Actual
(%)
Variance in Rates
(%)
Crimes Against Persons 6,108 78.6 533.56
6,482 76.1 555.76
6.1 4.2
Violations Causing Death 14 50.0 1.22
8 112.5 0.69
-42.9 -43.9
Attempt Capital Crime 18 66.7 1.57
13 123.1 1.11
-27.8 -29.1
Sexual Violations 408 72.5 35.64
492 70.3 42.18
20.6 18.4
Assault 3,273 85.2 285.91
3,347 84.2 286.97
2.3 0.4
Violations Deprivation Freedom 107 86.0 9.35
118 83.9 10.12
10.3 8.2
Robbery & Other Violent Violations 2,288 70.3 199.87
2,504 65.6 214.69
9.4 7.4
Crimes Against Property 18,207 44.2 1,590.46
20,067 42.9 1,720.54
10.2 8.2
Arson 56 25.0 4.89
65 15.4 5.57
16.1 13.9
Break and Enter 1,847 21.0 161.34
2,300 23.7 197.20
24.5 22.2
Theft Over $5000 1,041 21.0 90.94
1,104 22.4 94.66
6.1 4.1
Theft Under $5000 7,623 39.1 665.90
8,298 39.6 711.47
8.9 6.8
Have Stolen Goods 2,316 100.2 202.31
2,456 100.5 210.58
6.0 4.1
Fraud 2,403 43.4 209.91
2,919 33.9 250.27
21.5 19.2
Mischief 2,921 37.3 255.16
2,925 36.4 250.79
0.1 -1.7
Other Criminal Code 2,955 91.8 258.13
3,160 93.2 270.94
6.9 5.0
Other Criminal Code (Part A) 2,576 92.9 225.03
2,757 94.5 236.38
7.0 5.0
Other Criminal Code (Part B) 379 84.2 33.11
403 84.9 34.55
6.3 4.4
Weapons Violations 389 87.9 33.98
423 78.3 36.27
8.7 6.7
Public Morals Violations 206 68.0 18.00
191 82.7 16.38
-7.3 -9.0
Prostitution/Public Morals 198 70.7 17.30
187 82.9 16.03
-5.6 -7.3
Gaming and Betting 8 0.0 0.70
4 75.0 0.34
-50.0 -50.9
Total Criminal Violations 27,865 57.6 2,434.13
30,323 56.0 2,599.88
8.8 6.8
Drug Violations 2,870 99.1 250.71
2,644 98.9 226.70
-7.9 -9.6
Other Federal Violations 227 98.2 19.83
235 101.3 20.15
3.5 1.6
Total Criminal Code & Federal Violations (excluding traffic)
30,962 61.7 2,704.67
33,202 59.7 2,846.73
7.2 5.3
Traffic Violations 4,223 38.5 368.90
4,291 43.4 367.91
1.6 -0.3
Dangerous Operation 314 92.0 27.43
363 85.7 31.12
15.6 13.5
Impaired Operation/Related Violations 1,108 99.8 96.79
1,255 99.9 107.60
13.3 11.2
Other Criminal Code Traffic Violations 2,797 8.0 244.33
2,664 10.8 228.41
-4.8 -6.5
Street Racing 4 125.0 0.35
9 100.0 0.77
125.0 120.8
1 not calculable

York Regional Police 2015 Annual Statistical Report Page 25
ROBBERY JANUARY – DECEMBER (2014 – 2015)
Robbery Violations - by Type
January - December Variance 2014 2015 Actual %
Retail 19 26 7 36.8
ATM 0 0 0 N.C.1
Deposit 0 2 2 N.C.1
Financial 8 9 1 12.5
Home Invasion 10 10 0 0.0
Car Jacking 2 6 4 200.0
Street 143 148 5 3.5
Other 23 21 -2 -8.7
Total 205 222 17 8.3
1 not calculable
As indicated above, 222 robbery violations were reported in York Region during 2015 compared to 205 during the corresponding period in 2014.
This represents an increase of 17 violations or 8.3%.
Increases were seen in all categories except Other (-2) and no change in ATM and Home Invasion Robberies.
Definitions (see Terminology page 2 for complete list):
Financial – includes banks, credit unions, armoured cars.
Retail – any retail or commercial premise including convenience stores, restaurants/fast food establishments, massage parlours, gas stations, and donut/coffee shops.
Car Jacking – the intent to steal a motor vehicle with the use of violence against the person(s) in care or control of that vehicle.
Home Invasion – intrusion into a residence with the intent of robbing the occupants therein.

York Regional Police 2015 Annual Statistical Report Page 26
STOLEN VEHICLES JANUARY – DECEMBER (2014 – 2015)
2014 2015 Variance (%)
Actual Rate Actual Rate Actual Rate
Automobiles 281 24.55 270 23.15 -3.9 -5.7
Trucks 359 31.36 412 35.32 14.8 12.6
Motorcycles 57 4.98 48 4.12 -15.8 -17.3
Other 53 4.63 26 2.23 -50.9 -51.9
Construction/Farm 33 2.88 55 4.72 66.7 63.6
Tractor Trailers 25 2.18 20 1.71 -20.0 -21.5
Total 808 70.58 831 71.25 2.8 0.9
Note: total includes vehicles taken without owner’s consent. Does not include attempt theft or vehicles obtained by fraud. Trucks include pickup trucks, bus, van, and recreational vehicles. Tractor trailers include tractors with or without a trailer.
831 vehicles were reported stolen in York Region in 2015 compared to 808 during the corresponding
period in 2014. This represents an increase of 23 vehicles or 2.8%. Based on the rate of stolen vehicles per 100,000 population, there has been an increase of 0.9%.
270 automobiles were reported
stolen in 2015 compared to 280 during the corresponding period in 2014. This represents a decrease of 10 automobiles or 3.9%. Based on the rate of stolen automobiles per 100,000 population, there has been a decrease of 5.7%.
412 trucks were reported stolen
in 2015 compared to 359 during the corresponding period in 2014. This represents an increase of 53 trucks or 14.8%. Based on the rate of stolen trucks per 100,000 population, there has been an
increase of 12.6%.
20 tractor trailers were reported
stolen in 2015 compared to 25 during the corresponding period in 2014. This represents a decrease of 5 tractor trailers or 20.0%. Based on the rate of stolen tractor trailers per 100,000 population, there has been a decrease of 21.5%.
Top 5 Stolen Automobile
Makes (2015)
Make Total
Honda 52
Toyota 45
BMW 23
Mercedes 18
Acura 15
Top 5 Stolen Truck Makes (2015)
Make Total
Toyota 75
Lexus 47
GMC 43
Ford 42
Chevrolet 37

York Regional Police 2015 Annual Statistical Report Page 27
TRAFFIC VIOLATIONS JANUARY – DECEMBER (2014 – 2015)
2014
2015
2014/15
Actual
Rate Per 100,000
Population
Actual
Rate Per 100,000
Population
Variance in Actual
(%)
Variance in Rates
(%)
Impaired Operation/Related Violations 1,108 96.79
1,255 107.60
13.3 11.2
Impaired Operation/Over 80 Mgs - Alcohol 940 82.11
1,056 90.54
12.3 10.3
Impaired Operation - Drug 29 2.53
53 4.54
82.8 79.4
Impaired Operation Cause Bodily Harm 8 0.70
5 0.43
-37.5 -38.7
Impaired Operation Cause Death 1 0.09
4 0.34
300.0 292.6
Fail/Refuse Breath/Blood Sample/Drug Test 130 11.36
137 11.75
5.4 3.4
Dangerous Operation 314 27.43
363 31.12
15.6 13.5
Dangerous Operation 247 21.58
260 22.29
5.3 3.3
Cause Bodily Harm 15 1.31
35 3.00
133.3 129.0
Cause Death 4 0.35
7 0.60
75.0 71.8
Evade Police 48 4.19
61 5.23
27.1 24.7
Evade Police Cause Bodily Harm 0 0.00
0 0.00
N.C.1 N.C.
1
Evade Police Cause Death 0 0.00
0 0.00
N.C.1 N.C.
1
Fail to Stop or Remain 2,711 236.82
2,557 219.24
-5.7 -7.4
Drive While Prohibited 86 7.51
107 9.17
24.4 22.1
Other Criminal Code 0 0.00
0 0.00
N.C.1 N.C.
1
Street Racing 4 0.35
9 0.77
125.0 120.8
Criminal Traffic Violations - Total 4,223 368.90
4,291 367.91
1.6 -0.3
Traffic - Provincial Offences Speeding 39,059 3,411.98
38,810 3,327.56
-0.6 -2.5
Red Light 2,136 186.59
2,684 230.13
25.7 23.3
Disobey Stop Sign 10,523 919.23
11,333 971.69
7.7 5.7
Seatbelt Related 1,615 141.08
1,751 150.13
8.4 6.4
Drive Under Suspension 2,073 181.09
2,091 179.28
0.9 -1.0
Careless Driving 4,351 380.08
5,070 434.70
16.5 14.4
Fail to Remain 114 9.96
109 9.35
-4.4 -6.2
Motor Vehicle Collisions - Total (Reportable) 15,590 1,361.86
14,697 1,260.12
-5.7 -7.5
Fatal Collisions 25 2.18
19 1.63
-24.0 -25.4
Personal Injury Collisions 3,225 281.72
3,137 268.97
-2.7 -4.5
Property Damage Collisions 12,340 1,077.96
11,541 989.52
-6.5 -8.2
Persons Injured 4,509 393.88
4,404 377.60
-2.3 -4.1
Persons Killed 26 2.27
23 1.97
-11.5 -13.2
Fail to Remain Collisions 2,849 248.87
2,750 235.78
-3.5 -5.3
1 not calculable
York Regional Police 2015 Annual Statistical Report Page 28
FATAL MOTOR VEHICLE COLLISIONS JANUARY – DECEMBER (2014 – 2015)
2014
2015
2014/15
Actual
Rate Per 100,000
Population
Actual
Rate Per 100,000
Population
Variance in Actual
(%)
Variance in Rates
(%)
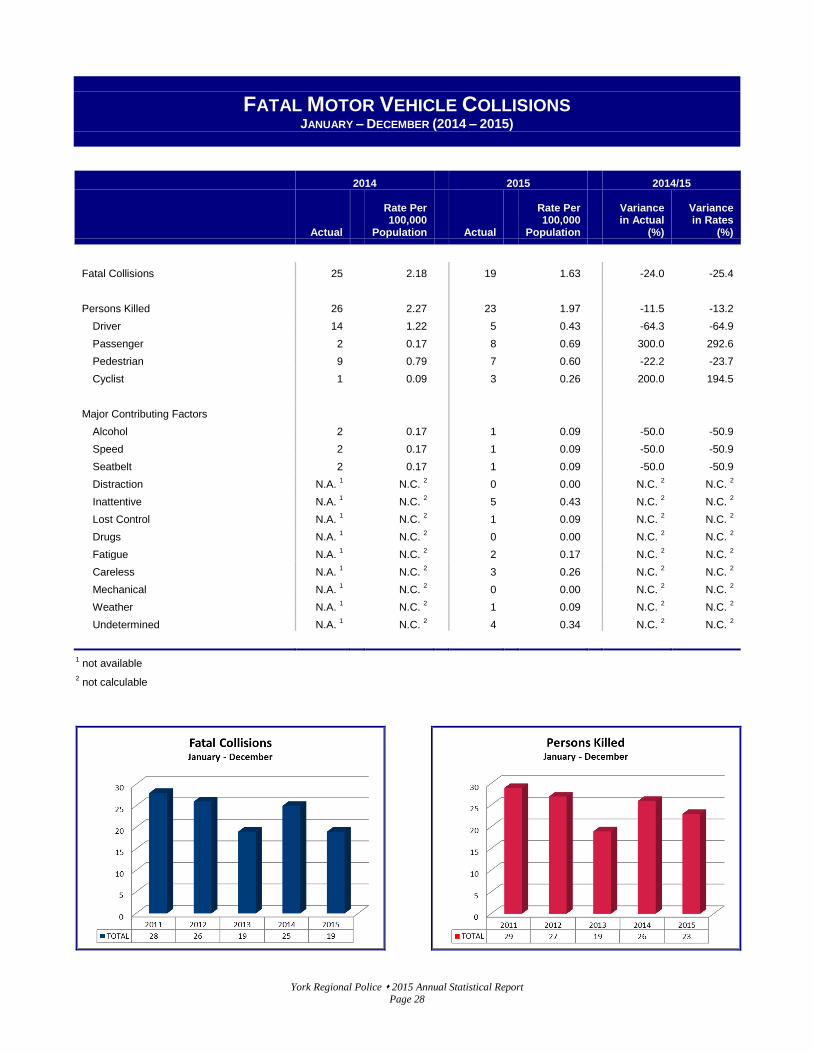
Fatal Collisions 25
2.18
19
1.63
-24.0 -25.4
Persons Killed 26
2.27
23
1.97
-11.5 -13.2
Driver 14
1.22
5
0.43
-64.3 -64.9
Passenger 2
0.17
8
0.69
300.0 292.6
Pedestrian 9
0.79
7
0.60
-22.2 -23.7
Cyclist 1
0.09
3
0.26
200.0 194.5
Major Contributing Factors
Alcohol 2
0.17
1
0.09
-50.0 -50.9
Speed 2
0.17
1
0.09
-50.0 -50.9
Seatbelt 2
0.17
1
0.09
-50.0 -50.9
Distraction N.A. 1
N.C.
2
0
0.00
N.C.
2 N.C.
2
Inattentive N.A. 1
N.C.
2
5
0.43
N.C.
2 N.C.
2
Lost Control N.A. 1
N.C.
2
1
0.09
N.C.
2 N.C.
2
Drugs N.A. 1
N.C.
2
0
0.00
N.C.
2 N.C.
2
Fatigue N.A. 1
N.C.
2
2
0.17
N.C.
2 N.C.
2
Careless N.A. 1
N.C.
2
3
0.26
N.C.
2 N.C.
2
Mechanical N.A. 1
N.C.
2
0
0.00
N.C.
2 N.C.
2
Weather N.A. 1
N.C.
2
1
0.09
N.C.
2 N.C.
2
Undetermined N.A. 1
N.C.
2
4
0.34
N.C.
2 N.C.
2
1 not available
2 not calculable

York Regional Police 2015 Annual Statistical Report Page 29
CLEARANCE RATE JANUARY – DECEMBER (2014 – 2015)
2014
2015
2014/15
Actual
Total Cleared
Cleared (%)
Actual
Total Cleared
Cleared (%)
Variance Cleared (%)
Crimes Against Persons 6,108 4,802 78.6
6,482 4,932 76.1
-2.5
Crimes Against Property 18,207 8,053 44.2
20,067 8,609 42.9
-1.3
Other Criminal Code 2,955 2,712 91.8
3,160 2,946 93.2
1.5
Weapons Violations 389 342 87.9
423 331 78.3
-9.7
Public Morals Violations 206 140 68.0
191 158 82.7
14.8
Total Criminal Violations 27,865 16,049 57.6
30,323 16,976 56.0
-1.6
Drug Violations 2,870 2,843 99.1
2,644 2,616 98.9
-0.1
Other Federal Violations 227 223 98.2
235 238 101.3
3.0
Total Criminal & Federal Violations (excluding Traffic)
30,962 19,115 61.7
33,202 19,830 59.7
-2.0
Traffic Violations 4,223 1,624 38.5
4,291 1,863 43.4
5.0
Note: due to rounding, figures may not subtract exactly to variance cleared.

York Regional Police 2015 Annual Statistical Report Page 30
YOUTH STATISTICS JANUARY – DECEMBER (2014 – 2015)
2014 2015 2014 - 15 Variance (%)
CHGD PBOM Total CHGD PBOM Total CHGD PBOM Total
Violent Crime 211 487 698 207 509 716 -1.9 4.5 2.6
Property Crime 187 851 1,038 170 786 956 -9.1 -7.6 -7.9
All Other 216 637 853 246 547 793 13.9 -14.1 -7.0
Total 614 1,975 2,589 623 1,842 2,465 1.5 -6.7 -4.8
Youth Crime Rate 25.64 23.90 -6.8
Note:
CHGD - Charged youth includes persons aged 12 – 17 years inclusive. Includes criminal, federal, & criminal traffic charges. PBOM – processed by other means. Includes persons under the age of 18 years. Youth Crime rate is expressed as a rate of youths per 1,000 youth population (aged 12 – 17 inclusive), rounded to two decimals. The number of persons aged 12 – 17 inclusive formally charged or processed by other means have been used in this calculation. Youth population estimate supplied by York Region Planning and Development Services Department.

York Regional Police 2015 Annual Statistical Report Page 31
HATE CRIME JANUARY – DECEMBER (2014 - 2015)
Principle Factor that Motivated
2014 2015 Variance
(%) the Hate Crime
Race/Ethnicity 49 45 -8.2
Aboriginal 0 0 N.C.
1
Arab/West Asian 8 7 -12.5
Black 15 20 33.3
East & Southeast Asian 6 2 -66.7
South Asian 4 3 -25.0
White 4 2 -50.0
Multiple Races/Ethnicities 2 5 150.0
Other Race/Ethnicity 9 6 -33.3
Unknown Race/Ethnicity 1 0 -100.0
Religion 52 37 -28.8
Catholic 4 3 -25.0
Jewish 39 19 -51.3
Muslim (Islam) 5 11 120.0
Other Religion 3 4 33.3
Unknown Religion 1 0 -100.0
Sexual Orientation 5 6 20.0
Bisexual 0 0 N.C.
1
Heterosexual 0 0 N.C.
1
Homosexual (Lesbian or Gay) 4 6 50.0
Other Sexual Orientation 0 0 N.C.
1
Unknown Sexual Orientation 1 0 N.C.
1
Language 1 0 -100.0
English 0 0 N.C.
1
French 0 0 N.C.
1
Other Language 1 0 -100.0
Unknown Language 0 0 N.C.
1
Disability 0 0 N.C.1
Mental 0 0 N.C.
1
Physical 0 0 N.C.
1
Other Disability 0 0 N.C.
1
Unknown Disability 0 0 N.C.
1
Gender 0 1 N.C.1
Age 0 0 N.C.1
Other Factors 0 0 N.C.1
Unknown 0 0 N.C.1
Total Hate Crimes 107 89 -16.8
1 not calculable

York Regional Police 2015 Annual Statistical Report Page 32
CALLS FOR SERVICE JANUARY – DECEMBER (2014 - 2015)
2014 2015 Variance (Actual)
Variance (%)
Total Citizen Generated Calls for Service 220,546 208,211 -12,335 -5.6
Dispatched Calls for Service 101,027 102,317 1,290 1.3
Calls Diverted Community Resource Centre and Alternative Reporting Unit
11,944 11,103 -841 -7.0
Calls Diverted to Online Reporting 7,713 8,700 987 12.8
1 Year Comparison: As indicated above, 208,211 Citizen Generated Calls for Service were received in 2015 compared to 220,546 during the corresponding period in 2014. This represents a decrease of 12,335 calls or 5.6%.
Calls to Communications Bureau
2014 2015 Variance (%)
911 Calls 233,666 216,899 -7.2
Non-Emergency Calls 383,306 389,255 1.6
Total 616,972 606,154 -1.8
Call Response Time
1
2014/15
Priority 2014 2015 Variance (%) Emergency
Priority 1 8.8 8.2 -6.8 High Priority
Priority 2 22.9 20.6 -10.0
Medium Priority
Priority 3 46.1 43.3 -6.1
Lowest Priority
Priority 4 56.2 48.2 -14.1
1 the time between the Communicator entering the information and the officers advising that they arrived on scene.
Note: In 2015 YRP modified the default priority for some call types. This change in methodology could affect call response time comparisons for 2015 compared to previous years.
28%
49%
5%
4%8%
6%
2015 Citizen Generated Calls for Service
Advised byCommunications
Dispatched
CRC/ARU
Online
Canceled
Other
York Regional Police 2015 Annual Statistical Report Page 33
CALLS FOR SERVICE JANUARY – DECEMBER (2014 - 2015)
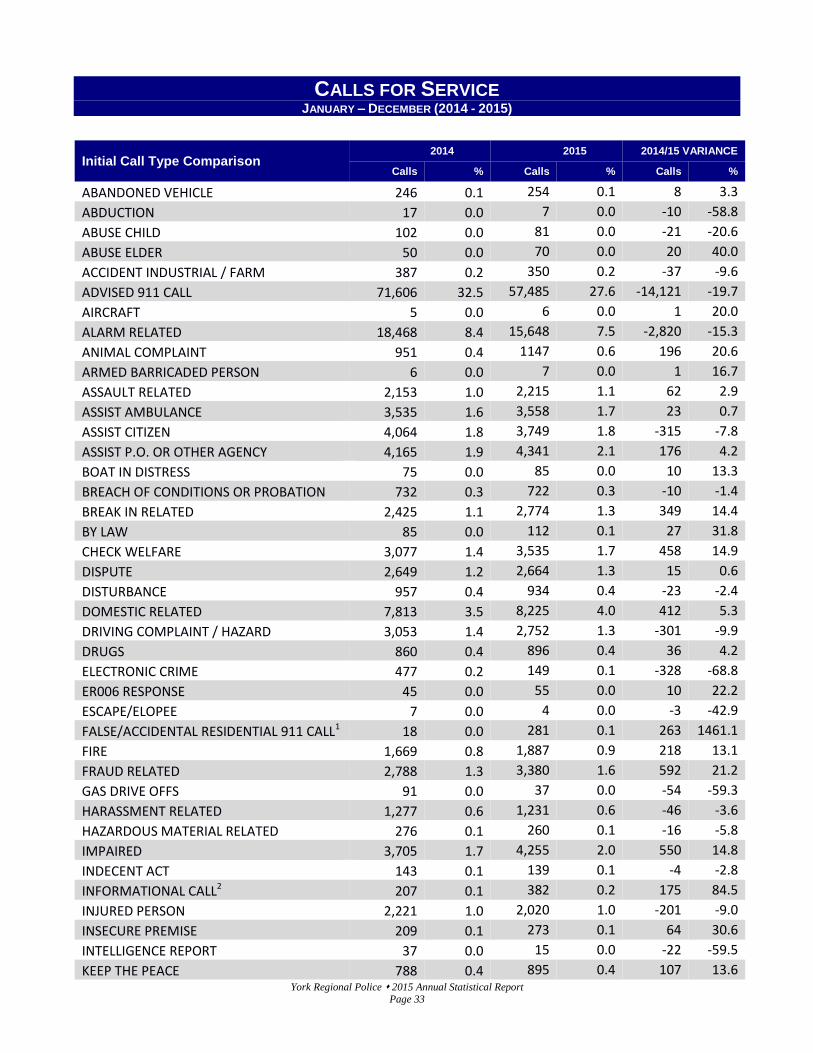
Initial Call Type Comparison 2014 2015 2014/15 VARIANCE
Calls % Calls % Calls %
ABANDONED VEHICLE 246 0.1 254 0.1 8 3.3
ABDUCTION 17 0.0 7 0.0 -10 -58.8
ABUSE CHILD 102 0.0 81 0.0 -21 -20.6
ABUSE ELDER 50 0.0 70 0.0 20 40.0
ACCIDENT INDUSTRIAL / FARM 387 0.2 350 0.2 -37 -9.6
ADVISED 911 CALL 71,606 32.5 57,485 27.6 -14,121 -19.7
AIRCRAFT 5 0.0 6 0.0 1 20.0
ALARM RELATED 18,468 8.4 15,648 7.5 -2,820 -15.3
ANIMAL COMPLAINT 951 0.4 1147 0.6 196 20.6
ARMED BARRICADED PERSON 6 0.0 7 0.0 1 16.7
ASSAULT RELATED 2,153 1.0 2,215 1.1 62 2.9
ASSIST AMBULANCE 3,535 1.6 3,558 1.7 23 0.7
ASSIST CITIZEN 4,064 1.8 3,749 1.8 -315 -7.8
ASSIST P.O. OR OTHER AGENCY 4,165 1.9 4,341 2.1 176 4.2
BOAT IN DISTRESS 75 0.0 85 0.0 10 13.3
BREACH OF CONDITIONS OR PROBATION 732 0.3 722 0.3 -10 -1.4
BREAK IN RELATED 2,425 1.1 2,774 1.3 349 14.4
BY LAW 85 0.0 112 0.1 27 31.8
CHECK WELFARE 3,077 1.4 3,535 1.7 458 14.9
DISPUTE 2,649 1.2 2,664 1.3 15 0.6
DISTURBANCE 957 0.4 934 0.4 -23 -2.4
DOMESTIC RELATED 7,813 3.5 8,225 4.0 412 5.3
DRIVING COMPLAINT / HAZARD 3,053 1.4 2,752 1.3 -301 -9.9
DRUGS 860 0.4 896 0.4 36 4.2
ELECTRONIC CRIME 477 0.2 149 0.1 -328 -68.8
ER006 RESPONSE 45 0.0 55 0.0 10 22.2
ESCAPE/ELOPEE 7 0.0 4 0.0 -3 -42.9
FALSE/ACCIDENTAL RESIDENTIAL 911 CALL1 18 0.0 281 0.1 263 1461.1
FIRE 1,669 0.8 1,887 0.9 218 13.1
FRAUD RELATED 2,788 1.3 3,380 1.6 592 21.2
GAS DRIVE OFFS 91 0.0 37 0.0 -54 -59.3
HARASSMENT RELATED 1,277 0.6 1,231 0.6 -46 -3.6
HAZARDOUS MATERIAL RELATED 276 0.1 260 0.1 -16 -5.8
IMPAIRED 3,705 1.7 4,255 2.0 550 14.8
INDECENT ACT 143 0.1 139 0.1 -4 -2.8
INFORMATIONAL CALL2 207 0.1 382 0.2 175 84.5
INJURED PERSON 2,221 1.0 2,020 1.0 -201 -9.0
INSECURE PREMISE 209 0.1 273 0.1 64 30.6
INTELLIGENCE REPORT 37 0.0 15 0.0 -22 -59.5
KEEP THE PEACE 788 0.4 895 0.4 107 13.6

York Regional Police 2015 Annual Statistical Report Page 34
Initial Call Type Comparison 2014 2015 2014/15 VARIANCE
Calls % Calls % Calls %
LIQUOR OFFENCE 506 0.2 482 0.2 -24 -4.7
MENTAL HEALTH RELATED 3,744 1.7 3,818 1.8 74 2.0
MISSING PERSON RELATED 1,901 0.9 1,780 0.9 -121 -6.4
MVC RELATED 27,901 12.7 27,127 13.0 -774 -2.8
NOISE COMPLAINT 3,132 1.4 3,027 1.5 -105 -3.4
ONLINE REPORTS 7,713 3.5 8,700 4.2 987 12.8
PARKING COMPLAINT 292 0.1 233 0.1 -59 -20.2
PROJECT READY 108 0.0 92 0.0 -16 -14.8
PROPERTY DAMAGE 1,536 0.7 1,671 0.8 135 8.8
PROPERTY FOUND 631 0.3 726 0.3 95 15.1
PROPERTY LOST 740 0.3 340 0.2 -400 -54.1
PROWLER 50 0.0 32 0.0 -18 -36.0
RECOVERED AUTO 189 0.1 200 0.1 11 5.8
ROBBERY RELATED 232 0.1 235 0.1 3 1.3
SEXUAL ASSAULT / SEX OFFENCE RELATED 546 0.2 741 0.4 195 35.7
SHOPLIFTING 1,748 0.8 1,815 0.9 67 3.8
SILENT 911 9,380 4.3 7,261 3.5 -2,119 -22.6
SILENT 911 SECURITY TO CHECK/ALL OK3 1,870 0.8 4,555 2.2 2,685 143.6
SOUND OF GUNSHOTS 199 0.1 183 0.1 -16 -8.0
STALKING 26 0.0 19 0.0 -7 -26.9
STRIKES 8 0.0 22 0.0 14 175.0
SUSPECT APPREHENSION PURSUIT TRAFFIC 2 0.0 1 0.0 -1 -50.0
SUSPICIOUS PERSON 1,977 0.9 2,375 1.1 398 20.1
SUSPICIOUS VEHICLE 1,777 0.8 2,075 1.0 298 16.8
THEFT RELATED 4,481 2.0 4,857 2.3 376 8.4
THEFT OF VEHICLE RELATED 1,087 0.5 1,112 0.5 25 2.3
THREATS 1,600 0.7 1,633 0.8 33 2.1
TRAFFIC CONTROL 40 0.0 70 0.0 30 75.0
TRANSPORT WEAPON 116 0.1 145 0.1 29 25.0
TRESPASSING 300 0.1 328 0.2 28 9.3
UNKNOWN TROUBLE 1,221 0.6 1,173 0.6 -48 -3.9
UNWANTED PERSON 1,528 0.7 1,775 0.9 247 16.2
VITAL SIGNS ABSENT 430 0.2 476 0.2 46 10.7
WANTED PERSON 784 0.4 948 0.5 164 20.9
WEAPONS CALL 622 0.3 667 0.3 45 7.2
YOUTH COMPLAINT 690 0.3 637 0.3 -53 -7.7
Total 220,546 208,211 -12,335 -5.6
NC - not calculable Note: not all calls result in a report. 1 Implemented October, 2014 2 Implemented February, 2014 3
Implemented July, 2014

York Regional Police 2015 Annual Statistical Report Page 35
MISCELLANEOUS STATISTICS JANUARY – DECEMBER (2014 – 2015)
2014
2015
2014/15
Variance (%)
Alarm Program Alarm Calls Received 18,516
15,314
-17.3
False Alarms 18,408
15,099
-18.0 False Alarm (%) 99.4
98.6
-0.8
Suspensions 2,769
N.A.1
N.C.
2 Cautions 932
N.A.
1
N.C.
2
Crime Stoppers Tips Received 1,467 2,086
42.2
Arrests Made 41
57
39.0 Cases Cleared 43
55
27.9
Property Recovered $61,830
$26,422
-57.3 Weapons Seized 10
5
-50.0
Drugs Seized $728,396
$41,651
-94.3 Rewards Authorized $13,660
$19,995
46.4
Information Management Police Clearance Letters 33,876
28,550
-15.7
Volunteer Screening 41,760
41,848
0.2 MVC/Incident Summary Reports 10,889 8,129
-25.3
Warrants Processed 1,036
1,213
17.1
Legal Services Freedom of Information Formal requests 1,279
1,331
4.1
Informal requests 2,126
2,303
8.3 Total 3,405
3,634
6.7
Intimate Domestic Incidents Total Number of Occurrences
3 4,652
4,998
7.4
Occurrences where Charges Laid 3 1,186
1,296
9.3
Occurrences Other/No Probable Grounds for Charges 3 3,466
3,702
6.8
Domestic Violence Homicides (# of Incidents) 1
1
0.0
Victim Services of York Region On-Scene Occurrences 401
663
65.3
Telephone Crisis Calls/Office Visits 8,341
9,192
10.2 Total Clients Served 7,938
6,619
-16.6
Female 5,845
3,947
-32.5 Male 1,025
905
-11.7
Children (0-17 years) 1,068
1,767
65.4 1 Not available. Suspensions and cautions are not applicable as YRP transitioned from the registration model to the cost-recovery model.
2 Not calculable.
3 2014 Figures have been revised.
York Regional Police 2015 Annual Statistical Report Page 36
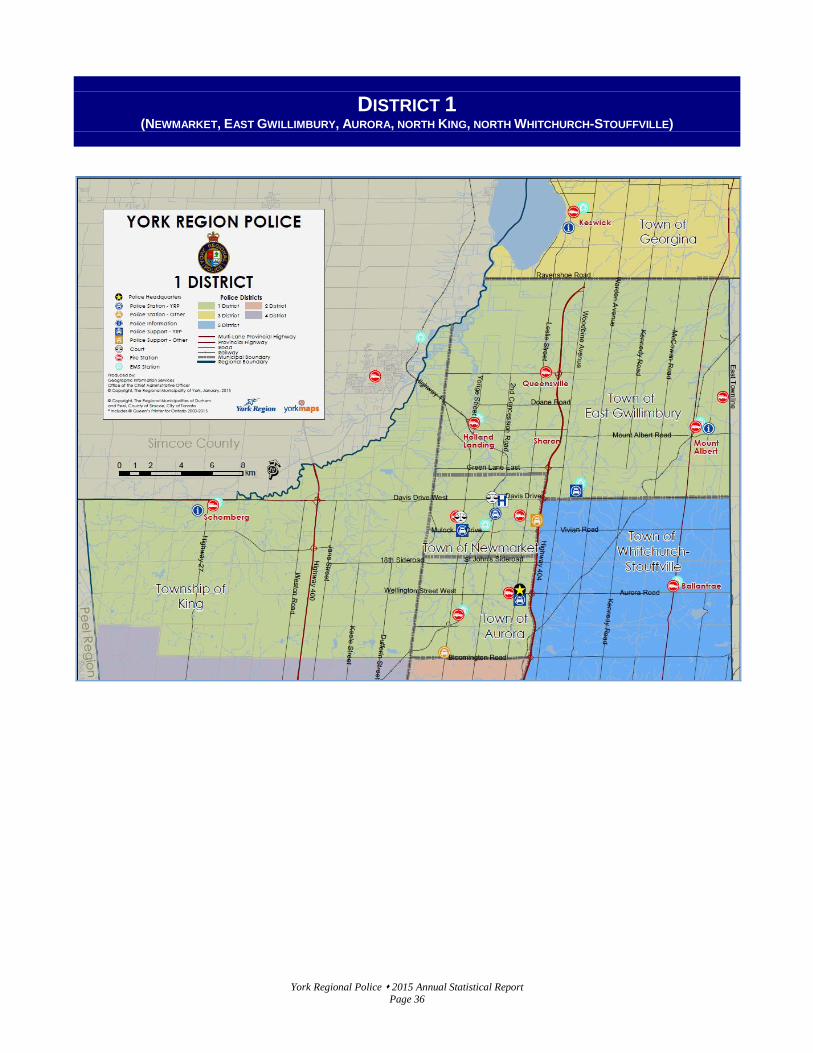
DISTRICT 1 (NEWMARKET, EAST GWILLIMBURY, AURORA, NORTH KING, NORTH WHITCHURCH-STOUFFVILLE)
York Regional Police 2015 Annual Statistical Report Page 37
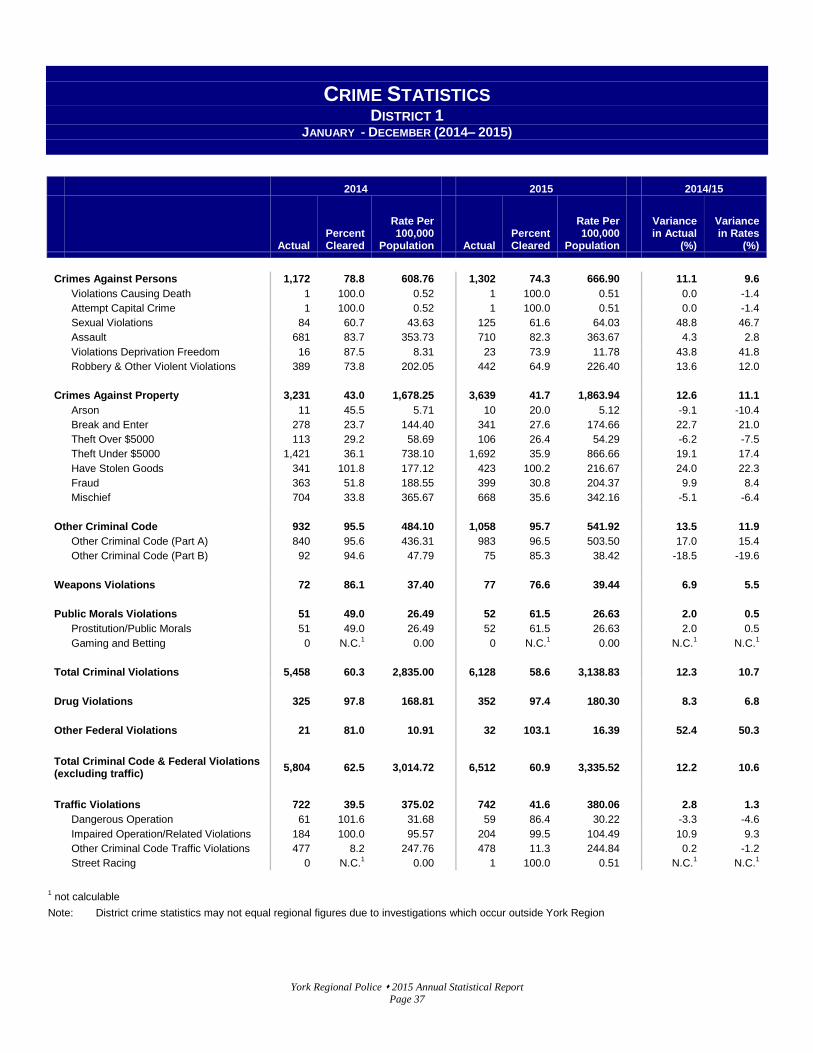
CRIME STATISTICS DISTRICT 1
JANUARY - DECEMBER (2014– 2015)
2014
2015
2014/15
Actual
Percent Cleared
Rate Per 100,000
Population
Actual Percent Cleared
Rate Per 100,000
Population
Variance in Actual
(%)
Variance in Rates
(%)
Crimes Against Persons 1,172 78.8 608.76
1,302 74.3 666.90
11.1 9.6
Violations Causing Death 1 100.0 0.52
1 100.0 0.51
0.0 -1.4
Attempt Capital Crime 1 100.0 0.52
1 100.0 0.51
0.0 -1.4
Sexual Violations 84 60.7 43.63
125 61.6 64.03
48.8 46.7
Assault 681 83.7 353.73
710 82.3 363.67
4.3 2.8
Violations Deprivation Freedom 16 87.5 8.31
23 73.9 11.78
43.8 41.8
Robbery & Other Violent Violations 389 73.8 202.05
442 64.9 226.40
13.6 12.0
Crimes Against Property 3,231 43.0 1,678.25
3,639 41.7 1,863.94
12.6 11.1
Arson 11 45.5 5.71
10 20.0 5.12
-9.1 -10.4
Break and Enter 278 23.7 144.40
341 27.6 174.66
22.7 21.0
Theft Over $5000 113 29.2 58.69
106 26.4 54.29
-6.2 -7.5
Theft Under $5000 1,421 36.1 738.10
1,692 35.9 866.66
19.1 17.4
Have Stolen Goods 341 101.8 177.12
423 100.2 216.67
24.0 22.3
Fraud 363 51.8 188.55
399 30.8 204.37
9.9 8.4
Mischief 704 33.8 365.67
668 35.6 342.16
-5.1 -6.4
Other Criminal Code 932 95.5 484.10
1,058 95.7 541.92
13.5 11.9
Other Criminal Code (Part A) 840 95.6 436.31
983 96.5 503.50
17.0 15.4
Other Criminal Code (Part B) 92 94.6 47.79
75 85.3 38.42
-18.5 -19.6
Weapons Violations 72 86.1 37.40
77 76.6 39.44
6.9 5.5
Public Morals Violations 51 49.0 26.49
52 61.5 26.63
2.0 0.5
Prostitution/Public Morals 51 49.0 26.49
52 61.5 26.63
2.0 0.5
Gaming and Betting 0 N.C.
1 0.00
0 N.C.
1 0.00
N.C.
1 N.C.
1
Total Criminal Violations 5,458 60.3 2,835.00
6,128 58.6 3,138.83
12.3 10.7
Drug Violations 325 97.8 168.81
352 97.4 180.30
8.3 6.8
Other Federal Violations 21 81.0 10.91
32 103.1 16.39
52.4 50.3
Total Criminal Code & Federal Violations (excluding traffic)
5,804 62.5 3,014.72
6,512 60.9 3,335.52
12.2 10.6
Traffic Violations 722 39.5 375.02
742 41.6 380.06
2.8 1.3
Dangerous Operation 61 101.6 31.68
59 86.4 30.22
-3.3 -4.6
Impaired Operation/Related Violations 184 100.0 95.57
204 99.5 104.49
10.9 9.3
Other Criminal Code Traffic Violations 477 8.2 247.76
478 11.3 244.84
0.2 -1.2
Street Racing 0 N.C.1 0.00
1 100.0 0.51
N.C.
1 N.C.
1
1 not calculable
Note: District crime statistics may not equal regional figures due to investigations which occur outside York Region

York Regional Police 2015 Annual Statistical Report Page 38
CLEARANCE RATE DISTRICT 1
JANUARY – DECEMBER (2014 - 2015)
2014
2015
2014/15
Actual
Total Cleared
Cleared (%)
Actual
Total Cleared
Cleared (%)
Variance Cleared (%)
Crimes Against Persons 1,172 924 78.8
1,302 967 74.3
-4.6
Crimes Against Property 3,231 1,390 43.0
3,639 1,517 41.7
-1.3
Other Criminal Code 932 890 95.5
1,058 1,013 95.7
0.3
Weapons Violations 72 62 86.1
77 59 76.6
-9.5
Public Morals Violations 51 25 49.0
52 32 61.5
12.5
Total Criminal Violations 5,458 3,291 60.3
6,128 3,588 58.6
-1.7
Drug Violations 325 318 97.8
352 343 97.4
-0.4
Other Federal Violations 21 17 81.0
32 33 103.1
22.2
Total Criminal & Federal Violations (excluding Traffic)
5,804 3,626 62.5
6,512 3,964 60.9
-1.6
Traffic Violations 722 285 39.5
742 309 41.6
2.2
Note: due to rounding, figures may not subtract exactly to variance cleared.

York Regional Police 2015 Annual Statistical Report Page 39
DISTRICT 2 (RICHMOND HILL, WEST MARKHAM)

York Regional Police 2015 Annual Statistical Report Page 40
CRIME STATISTICS DISTRICT 2
JANUARY – DECEMBER (2014 – 2015)
2014
2015
2014/15
Actual
Percent Cleared
Rate Per 100,000
Population
Actual Percent Cleared
Rate Per 100,000
Population
Variance in Actual
(%)
Variance in Rates
(%)
Crimes Against Persons 1,344 74.8 457.98
1,468 74.2 490.82
9.2 7.2
Violations Causing Death 5 20.0 1.70
2 200.0 0.67
-60.0 -60.8
Attempt Capital Crime 9 77.8 3.07
4 125.0 1.34
-55.6 -56.4
Sexual Violations 106 73.6 36.12
130 78.5 43.47
22.6 20.3
Assault 656 84.0 223.54
746 81.0 249.42
13.7 11.6
Violations Deprivation Freedom 30 73.3 10.22
30 86.7 10.03
0.0 -1.9
Robbery & Other Violent Violations 538 64.3 183.33
556 62.6 185.90
3.3 1.4
Crimes Against Property 3,859 42.2 1,314.98
4,201 44.3 1,404.59
8.9 6.8
Arson 10 10.0 3.41
10 20.0 3.34
0.0 -1.9
Break and Enter 505 21.2 172.08
575 30.6 192.25
13.9 11.7
Theft Over $5000 216 19.0 73.60
220 25.5 73.56
1.9 -0.1
Theft Under $5000 1,492 41.2 508.41
1,636 43.8 546.99
9.7 7.6
Have Stolen Goods 455 100.7 155.04
451 100.4 150.79
-0.9 -2.7
Fraud 559 35.4 190.48
717 33.5 239.73
28.3 25.9
Mischief 622 33.4 211.95
592 36.7 197.93
-4.8 -6.6
Other Criminal Code 635 93.1 216.38
718 92.6 240.06
13.1 10.9
Other Criminal Code (Part A) 538 95.5 183.33
613 92.0 204.96
13.9 11.8
Other Criminal Code (Part B) 97 79.4 33.05
105 96.2 35.11
8.2 6.2
Weapons Violations 78 87.2 26.58
90 74.4 30.09
15.4 13.2
Public Morals Violations 53 69.8 18.06
50 102.0 16.72
-5.7 -7.4
Prostitution/Public Morals 52 71.2 17.72
50 102.0 16.72
-3.8 -5.7
Gaming and Betting 1 0.0 0.34
0 N.C.
1 0.00
-100.0 -100.0
Total Criminal Violations 5,969 55.8 2,033.97
6,527 57.2 2,182.29
9.3 7.3
Drug Violations 599 99.8 204.11
524 99.0 175.20
-12.5 -14.2
Other Federal Violations 9 111.1 3.07
8 100.0 2.67
-11.1 -12.8
Total Criminal Code & Federal Violations (excluding traffic)
6,577 59.8 2,241.15
7,059 60.3 2,360.16
7.3 5.3
Traffic Violations 903 26.2 307.70
868 39.4 290.21
-3.9 -5.7
Dangerous Operation 36 97.2 12.27
67 89.6 22.40
86.1 82.6
Impaired Operation/Related Violations 164 101.2 55.88
219 100.0 73.22
33.5 31.0
Other Criminal Code Traffic Violations 703 5.1 239.55
580 10.5 193.92
-17.5 -19.0
Street Racing 0 N.C.1 0.00
2 100.0 0.67
N.C.
1 N.C.
1
1 not calculable
Note: District crime statistics may not equal regional figures due to investigations which occur outside York Region.

York Regional Police 2015 Annual Statistical Report Page 41
CLEARANCE RATE DISTRICT 2
JANUARY – DECEMBER (2014 – 2015)
2014
2015
2014/15
Actual
Total Cleared
Cleared (%)
Actual
Total Cleared
Cleared (%)
Variance Cleared (%)
Crimes Against Persons 1,344 1,005 74.8
1,468 1,089 74.2
-0.6
Crimes Against Property 3,859 1,627 42.2
4,201 1,860 44.3
2.1
Other Criminal Code 635 591 93.1
718 665 92.6
-0.5
Weapons Violations 78 68 87.2
90 67 74.4
-12.7
Public Morals Violations 53 37 69.8
50 51 102.0
32.2
Total Criminal Violations 5,969 3,328 55.8
6,527 3,732 57.2
1.4
Drug Violations 599 598 99.8
524 519 99.0
-0.8
Other Federal Violations 9 10 111.1
8 8 100.0
-11.1
Total Criminal & Federal Violations (excluding Traffic)
6,577 3,936 59.8
7,059 4,259 60.3
0.5
Traffic Violations 903 237 26.2
868 342 39.4
13.2
Note: due to rounding, figures may not subtract exactly to variance cleared.

York Regional Police 2015 Annual Statistical Report Page 42
DISTRICT 3 (GEORGINA)

York Regional Police 2015 Annual Statistical Report Page 43
CRIME STATISTICS DISTRICT 3
JANUARY – DECEMBER (2014 – 2015)
2014
2015
2014/15
Actual
Percent Cleared
Rate Per 100,000
Population
Actual Percent Cleared
Rate Per 100,000
Population
Variance in Actual
(%)
Variance in Rates
(%)
Crimes Against Persons 483 91.7 1,030.16
489 83.8 1,029.37
1.2 -0.1
Violations Causing Death 1 100.0 2.13
0 N.C.
1 0.00
-100.0 -100.0
Attempt Capital Crime 1 100.0 2.13
1 100.0 2.11
0.0 -1.3
Sexual Violations 27 81.5 57.59
43 58.1 90.52
59.3 57.2
Assault 295 95.3 629.19
258 91.9 543.10
-12.5 -13.7
Violations Deprivation Freedom 6 83.3 12.80
5 100.0 10.53
-16.7 -17.8
Robbery & Other Violent Violations 153 86.9 326.32
182 78.0 383.12
19.0 17.4
Crimes Against Property 1,021 49.9 2,177.62
970 45.3 2,041.89
-5.0 -6.2
Arson 8 50.0 17.06
10 10.0 21.05
25.0 23.4
Break and Enter 122 36.1 260.21
137 30.7 288.39
12.3 10.8
Theft Over $5000 43 34.9 91.71
51 23.5 107.36
18.6 17.1
Theft Under $5000 394 37.6 840.34
340 39.4 715.71
-13.7 -14.8
Have Stolen Goods 125 101.6 266.60
106 98.1 223.13
-15.2 -16.3
Fraud 60 56.7 127.97
84 32.1 176.82
40.0 38.2
Mischief 269 50.9 573.73
242 49.2 509.42
-10.0 -11.2
Other Criminal Code 270 95.9 575.86
212 97.2 446.27
-21.5 -22.5
Other Criminal Code (Part A) 251 96.8 535.34
184 98.4 387.33
-26.7 -27.6
Other Criminal Code (Part B) 19 84.2 40.52
28 89.3 58.94
47.4 45.4
Weapons Violations 29 100.0 61.85
34 91.2 71.57
17.2 15.7
Public Morals Violations 15 93.3 31.99
7 114.3 14.74
-53.3 -53.9
Prostitution/Public Morals 15 93.3 31.99
7 114.3 14.74
-53.3 -53.9
Gaming and Betting 0 N.C.
1 0.00
0 N.C.
1 0.00
N.C.
1 N.C.
1
Total Criminal Violations 1,818 69.0 3,877.49
1,712 63.9 3,603.83
-5.8 -7.1
Drug Violations 172 94.8 366.85
164 100.0 345.23
-4.7 -5.9
Other Federal Violations 183 100.0 390.31
175 100.6 368.38
-4.4 -5.6
Total Criminal Code & Federal Violations (excluding traffic)
2,173 73.6 4,634.65
2,051 69.9 4,317.44
-5.6 -6.8
Traffic Violations 212 62.7 452.16
208 57.2 437.85
-1.9 -3.2
Dangerous Operation 24 87.5 51.19
19 89.5 40.00
-20.8 -21.9
Impaired Operation/Related Violations 97 97.9 206.88
81 101.2 170.51
-16.5 -17.6
Other Criminal Code Traffic Violations 91 18.7 194.09
108 18.5 227.34
18.7 17.1
Street Racing 0 N.C.1 0.00
0 N.C.
1 0.00
N.C.
1 N.C.
1
1 not calculable
Note: District crime statistics may not equal regional figures due to investigations which occur outside York Region.

York Regional Police 2015 Annual Statistical Report Page 44
CLEARANCE RATE DISTRICT 3
JANUARY – DECEMBER (2014 – 2015)
2014
2015
2014/15
Actual
Total Cleared
Cleared (%)
Actual
Total Cleared
Cleared (%)
Variance Cleared (%)
Crimes Against Persons 483 443 91.7
489 410 83.8
-7.9
Crimes Against Property 1,021 509 49.9
970 439 45.3
-4.6
Other Criminal Code 270 259 95.9
212 206 97.2
1.2
Weapons Violations 29 29 100.0
34 31 91.2
-8.8
Public Morals Violations 15 14 93.3
7 8 114.3
21.0
Total Criminal Violations 1,818 1,254 69.0
1,712 1,094 63.9
-5.1
Drug Violations 172 163 94.8
164 164 100.0
5.2
Other Federal Violations 183 183 100.0
175 176 100.6
0.6
Total Criminal & Federal Violations (excluding Traffic)
2,173 1,600 73.6
2,051 1,434 69.9
-3.7
Traffic Violations 212 133 62.7
208 119 57.2
-5.5
Note: due to rounding, figures may not subtract exactly to variance cleared.

York Regional Police 2015 Annual Statistical Report Page 45
DISTRICT 4 (VAUGHAN, SOUTH KING)
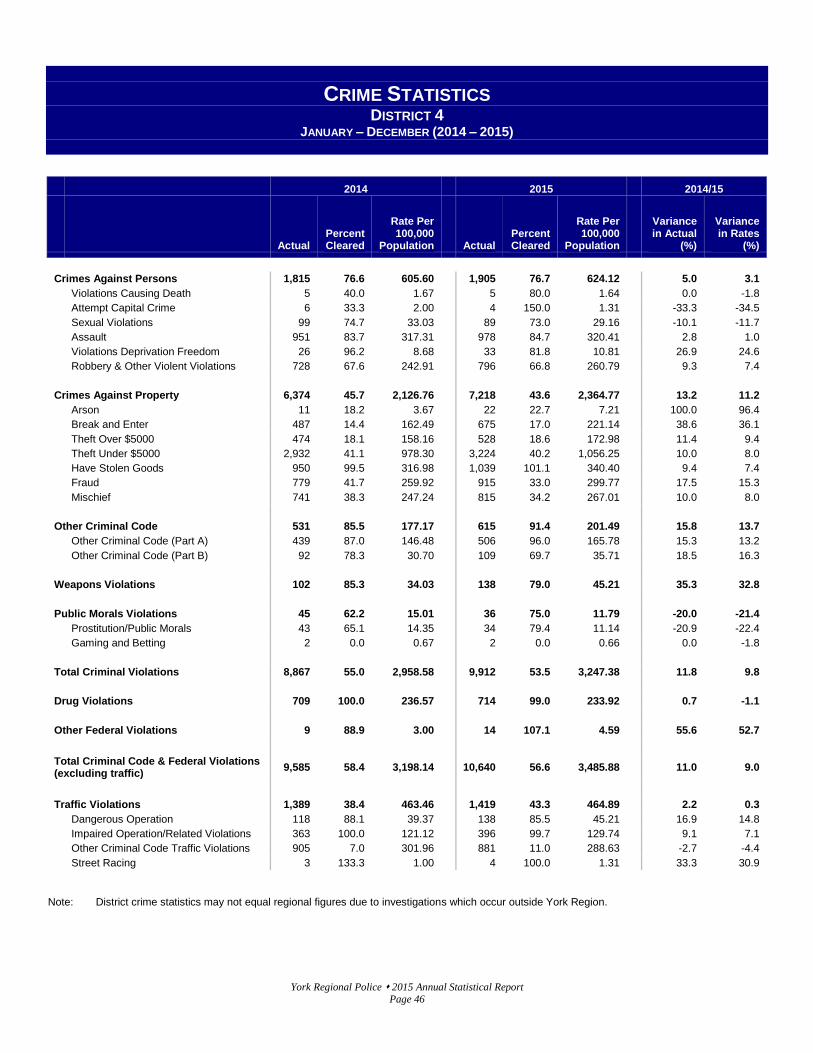
York Regional Police 2015 Annual Statistical Report Page 46
CRIME STATISTICS DISTRICT 4
JANUARY – DECEMBER (2014 – 2015)
2014
2015
2014/15
Actual
Percent Cleared
Rate Per 100,000
Population
Actual Percent Cleared
Rate Per 100,000
Population
Variance in Actual
(%)
Variance in Rates
(%)
Crimes Against Persons 1,815 76.6 605.60
1,905 76.7 624.12
5.0 3.1
Violations Causing Death 5 40.0 1.67
5 80.0 1.64
0.0 -1.8
Attempt Capital Crime 6 33.3 2.00
4 150.0 1.31
-33.3 -34.5
Sexual Violations 99 74.7 33.03
89 73.0 29.16
-10.1 -11.7
Assault 951 83.7 317.31
978 84.7 320.41
2.8 1.0
Violations Deprivation Freedom 26 96.2 8.68
33 81.8 10.81
26.9 24.6
Robbery & Other Violent Violations 728 67.6 242.91
796 66.8 260.79
9.3 7.4
Crimes Against Property 6,374 45.7 2,126.76
7,218 43.6 2,364.77
13.2 11.2
Arson 11 18.2 3.67
22 22.7 7.21
100.0 96.4
Break and Enter 487 14.4 162.49
675 17.0 221.14
38.6 36.1
Theft Over $5000 474 18.1 158.16
528 18.6 172.98
11.4 9.4
Theft Under $5000 2,932 41.1 978.30
3,224 40.2 1,056.25
10.0 8.0
Have Stolen Goods 950 99.5 316.98
1,039 101.1 340.40
9.4 7.4
Fraud 779 41.7 259.92
915 33.0 299.77
17.5 15.3
Mischief 741 38.3 247.24
815 34.2 267.01
10.0 8.0
Other Criminal Code 531 85.5 177.17
615 91.4 201.49
15.8 13.7
Other Criminal Code (Part A) 439 87.0 146.48
506 96.0 165.78
15.3 13.2
Other Criminal Code (Part B) 92 78.3 30.70
109 69.7 35.71
18.5 16.3
Weapons Violations 102 85.3 34.03
138 79.0 45.21
35.3 32.8
Public Morals Violations 45 62.2 15.01
36 75.0 11.79
-20.0 -21.4
Prostitution/Public Morals 43 65.1 14.35
34 79.4 11.14
-20.9 -22.4
Gaming and Betting 2 0.0 0.67
2 0.0 0.66
0.0 -1.8
Total Criminal Violations 8,867 55.0 2,958.58
9,912 53.5 3,247.38
11.8 9.8
Drug Violations 709 100.0 236.57
714 99.0 233.92
0.7 -1.1
Other Federal Violations 9 88.9 3.00
14 107.1 4.59
55.6 52.7
Total Criminal Code & Federal Violations (excluding traffic)
9,585 58.4 3,198.14
10,640 56.6 3,485.88
11.0 9.0
Traffic Violations 1,389 38.4 463.46
1,419 43.3 464.89
2.2 0.3
Dangerous Operation 118 88.1 39.37
138 85.5 45.21
16.9 14.8
Impaired Operation/Related Violations 363 100.0 121.12
396 99.7 129.74
9.1 7.1
Other Criminal Code Traffic Violations 905 7.0 301.96
881 11.0 288.63
-2.7 -4.4
Street Racing 3 133.3 1.00
4 100.0 1.31
33.3 30.9
Note: District crime statistics may not equal regional figures due to investigations which occur outside York Region.

York Regional Police 2015 Annual Statistical Report Page 47
CLEARANCE RATE DISTRICT 4
JANUARY – DECEMBER (2014 – 2015)
2014
2015
2014/15
Actual
Total Cleared
Cleared (%)
Actual
Total Cleared
Cleared (%)
Variance Cleared (%)
Crimes Against Persons 1,815 1,391 76.6
1,905 1,462 76.7
0.1
Crimes Against Property 6,374 2,916 45.7
7,218 3,145 43.6
-2.2
Other Criminal Code 531 454 85.5
615 562 91.4
5.9
Weapons Violations 102 87 85.3
138 109 79.0
-6.3
Public Morals Violations 45 28 62.2
36 27 75.0
12.8
Total Criminal Violations 8,867 4,876 55.0
9,912 5,305 53.5
-1.5
Drug Violations 709 709 100.0
714 707 99.0
-1.0
Other Federal Violations 9 8 88.9
14 15 107.1
18.3
Total Criminal & Federal Violations (excluding Traffic)
9,585 5,593 58.4
10,640 6,027 56.6
-1.7
Traffic Violations 1,389 534 38.4
1,419 614 43.3
4.8
Note: due to rounding, figures may not subtract exactly to variance cleared.

York Regional Police 2015 Annual Statistical Report Page 48
DISTRICT 5 (MARKHAM, SOUTH WHITCHURCH - STOUFFVILLE)

York Regional Police 2015 Annual Statistical Report Page 49
CRIME STATISTICS DISTRICT 5
JANUARY – DECEMBER (2014 – 2015)
2014
2015
2014/15
Actual
Percent Cleared
Rate Per 100,000
Population
Actual Percent Cleared
Rate Per 100,000
Population
Variance in Actual
(%)
Variance in Rates
(%)
Crimes Against Persons 1,227 80.0 393.04
1,259 76.1 394.35
2.6 0.3
Violations Causing Death 2 100.0 0.64
0 N.C.
1 0.00
-100.0 -100.0
Attempt Capital Crime 1 100.0 0.32
3 100.0 0.94
200.0 193.3
Sexual Violations 74 74.3 23.70
95 74.7 29.76
28.4 25.5
Assault 679 85.3 217.50
641 86.3 200.77
-5.6 -7.7
Violations Deprivation Freedom 24 87.5 7.69
22 95.5 6.89
-8.3 -10.4
Robbery & Other Violent Violations 447 72.5 143.19
498 62.2 155.98
11.4 8.9
Crimes Against Property 3,493 40.9 1,118.90
3,815 39.1 1,194.94
9.2 6.8
Arson 16 12.5 5.13
13 0.0 4.07
-18.8 -20.6
Break and Enter 453 21.9 145.11
560 18.9 175.40
23.6 20.9
Theft Over $5000 184 20.1 58.94
190 24.2 59.51
3.3 1.0
Theft Under $5000 1,354 35.7 433.72
1,385 37.8 433.81
2.3 0.0
Have Stolen Goods 379 98.7 121.40
374 101.3 117.14
-1.3 -3.5
Fraud 530 40.6 169.77
691 32.9 216.44
30.4 27.5
Mischief 577 38.0 184.83
602 34.7 188.56
4.3 2.0
Other Criminal Code 512 86.1 164.01
482 90.2 150.97
-5.9 -7.9
Other Criminal Code (Part A) 442 86.7 141.58
411 90.5 128.73
-7.0 -9.1
Other Criminal Code (Part B) 70 82.9 22.42
71 88.7 22.24
1.4 -0.8
Weapons Violations 75 82.7 24.02
77 75.3 24.12
2.7 0.4
Public Morals Violations 35 82.9 11.21
41 85.4 12.84
17.1 14.5
Prostitution/Public Morals 30 96.7 9.61
39 82.1 12.22
30.0 27.1
Gaming and Betting 5 0.0 1.60
2 150.0 0.63
-60.0 -60.9
Total Criminal Violations 5,342 55.1 1,711.18
5,674 52.4 1,777.22
6.2 3.9
Drug Violations 962 99.1 308.15
814 98.9 254.96
-15.4 -17.3
Other Federal Violations 5 100.0 1.60
6 100.0 1.88
20.0 17.3
Total Criminal Code & Federal Violations (excluding traffic)
6,309 61.8 2,020.94
6,494 58.3 2,034.06
2.9 0.6
Traffic Violations 971 42.4 311.04
1,033 44.8 323.56
6.4 4.0
Dangerous Operation 65 87.7 20.82
76 81.6 23.80
16.9 14.3
Impaired Operation/Related Violations 295 99.3 94.50
348 100.0 109.00
18.0 15.3
Other Criminal Code Traffic Violations 610 10.0 195.40
607 8.4 190.13
-0.5 -2.7
Street Racing 1 100.0 0.32
2 100.0 0.63
100.0 95.6
Note: District crime statistics may not equal regional figures due to investigations which occur outside York Region.

York Regional Police 2015 Annual Statistical Report Page 50
CLEARANCE RATE DISTRICT 5
JANUARY – DECEMBER (2014 – 2015)
2014
2015
2014/15
Actual
Total Cleared
Cleared (%)
Actual
Total Cleared
Cleared (%)
Variance Cleared (%)
Crimes Against Persons 1,227 982 80.0
1,259 958 76.1
-3.9
Crimes Against Property 3,493 1,429 40.9
3,815 1,490 39.1
-1.9
Other Criminal Code 512 441 86.1
482 435 90.2
4.1
Weapons Violations 75 62 82.7
77 58 75.3
-7.3
Public Morals Violations 35 29 82.9
41 35 85.4
2.5
Total Criminal Violations 5,342 2,943 55.1
5,674 2,976 52.4
-2.6
Drug Violations 962 953 99.1
814 805 98.9
-0.2
Other Federal Violations 5 5 100.0
6 6 100.0
0.0
Total Criminal & Federal Violations (excluding Traffic)
6,309 3,901 61.8
6,494 3,787 58.3
-3.5
Traffic Violations 971 412 42.4
1,033 463 44.8
2.4
Note: due to rounding, figures may not subtract exactly to variance cleared.

York Regional Police 2015 Annual Statistical Report Page 51
CRIME STATISTICS AURORA
JANUARY – DECEMBER (2014 – 2015)
2014
2015
2014/15
Actual
Percent Cleared
Rate Per 100,000
Population
Actual Percent Cleared
Rate Per 100,000
Population
Variance in Actual
(%)
Variance in Rates
(%)
Crimes Against Persons 287 74.6 510.97
367 73.3 637.15
27.9 24.7
Violations Causing Death 0 N.C.
1 0.00
0 N.C.
1 0.00
N.C.
1 N.C.
1
Attempt Capital Crime 0 N.C.
1 0.00
0 N.C.
1 0.00
N.C.
1 N.C.
1
Sexual Violations 33 48.5 58.75
30 83.3 52.08
-9.1 -11.4
Assault 156 83.3 277.74
197 76.6 342.01
26.3 23.1
Violations Deprivation Freedom 6 83.3 10.68
6 50.0 10.42
0.0 -2.5
Robbery & Other Violent Violations 92 68.5 163.79
134 67.2 232.64
45.7 42.0
Crimes Against Property 824 40.0 1,467.03
886 33.3 1,538.19
7.5 4.9
Arson 5 60.0 8.90
2 0.0 3.47
-60.0 -61.0
Break and Enter 76 34.2 135.31
91 27.5 157.99
19.7 16.8
Theft Over $5000 21 38.1 37.39
23 0.0 39.93
9.5 6.8
Theft Under $5000 346 30.6 616.01
419 26.7 727.43
21.1 18.1
Have Stolen Goods 73 104.1 129.97
79 100.0 137.15
8.2 5.5
Fraud 115 47.0 204.74
109 27.5 189.24
-5.2 -7.6
Mischief 188 30.3 334.71
163 30.1 282.99
-13.3 -15.5
Other Criminal Code 108 88.0 192.28
128 90.6 222.22
18.5 15.6
Other Criminal Code (Part A) 82 90.2 145.99
113 87.6 196.18
37.8 34.4
Other Criminal Code (Part B) 26 80.8 46.29
15 113.3 26.04
-42.3 -43.7
Weapons Violations 22 95.5 39.17
21 81.0 36.46
-4.5 -6.9
Public Morals Violations 25 32.0 44.51
24 66.7 41.67
-4.0 -6.4
Prostitution/Public Morals 25 32.0 44.51
24 66.7 41.67
-4.0 -6.4
Gaming and Betting 0 N.C.
1 0.00
0 N.C.
1 0.00
N.C.
1 N.C.
1
Total Criminal Violations 1,266 52.8 2,253.95
1,426 50.0 2,475.69
12.6 9.8
Drug Violations 91 90.1 162.01
101 96.0 175.35
11.0 8.2
Other Federal Violations 2 100.0 3.56
3 100.0 5.21
50.0 46.3
Total Criminal Code & Federal Violations (excluding traffic)
1,359 55.3 2,419.53
1,530 53.1 2,656.25
12.6 9.8
Traffic Violations 198 46.5 352.51
176 36.9 305.56
-11.1 -13.3
Dangerous Operation 12 116.7 21.36
9 66.7 15.63
-25.0 -26.9
Impaired Operation/Related Violations 69 98.6 122.85
46 102.2 79.86
-33.3 -35.0
Other Criminal Code Traffic Violations 117 8.5 208.30
120 9.2 208.33
2.6 0.0
Street Racing 0 N.C.
1 0.00
1 100.0 1.74
N.C.
1 N.C.
1
1 not calculable
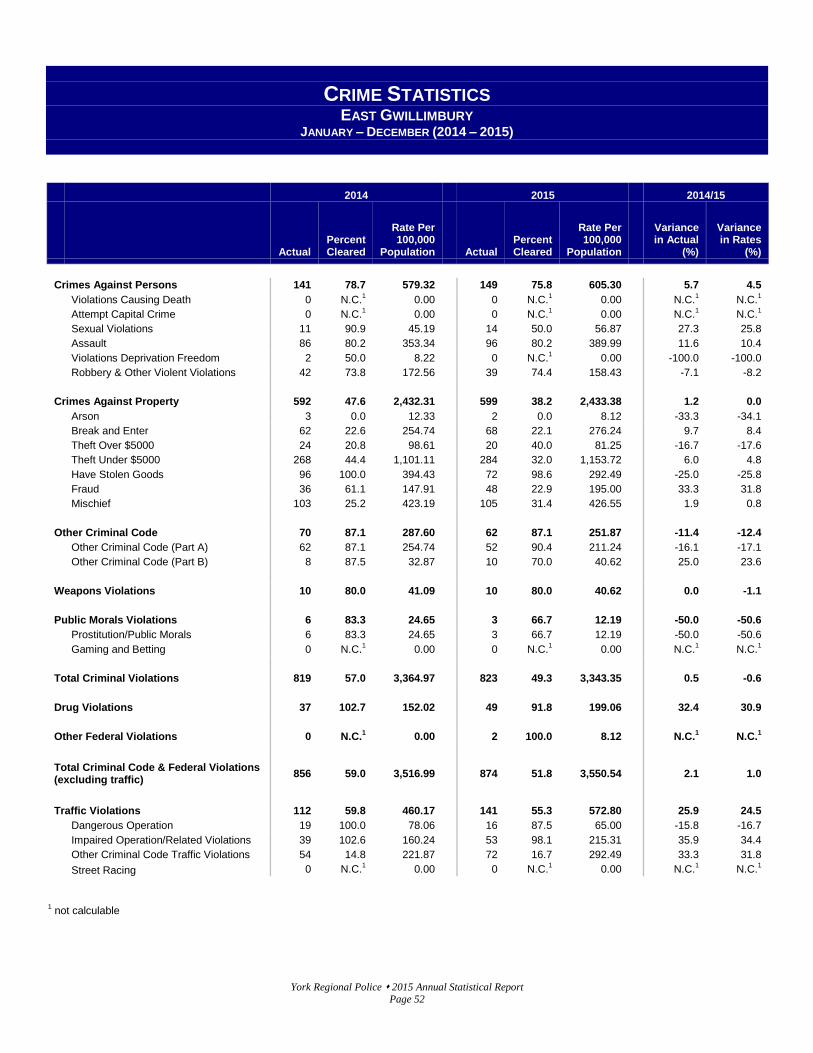
York Regional Police 2015 Annual Statistical Report Page 52
CRIME STATISTICS EAST GWILLIMBURY
JANUARY – DECEMBER (2014 – 2015)
2014
2015
2014/15
Actual
Percent Cleared
Rate Per 100,000
Population
Actual Percent Cleared
Rate Per 100,000
Population
Variance in Actual
(%)
Variance in Rates
(%)
Crimes Against Persons 141 78.7 579.32
149 75.8 605.30
5.7 4.5
Violations Causing Death 0 N.C.
1 0.00
0 N.C.
1 0.00
N.C.
1 N.C.
1
Attempt Capital Crime 0 N.C.
1 0.00
0 N.C.
1 0.00
N.C.
1 N.C.
1
Sexual Violations 11 90.9 45.19
14 50.0 56.87
27.3 25.8
Assault 86 80.2 353.34
96 80.2 389.99
11.6 10.4
Violations Deprivation Freedom 2 50.0 8.22
0 N.C.
1 0.00
-100.0 -100.0
Robbery & Other Violent Violations 42 73.8 172.56
39 74.4 158.43
-7.1 -8.2
Crimes Against Property 592 47.6 2,432.31
599 38.2 2,433.38
1.2 0.0
Arson 3 0.0 12.33
2 0.0 8.12
-33.3 -34.1
Break and Enter 62 22.6 254.74
68 22.1 276.24
9.7 8.4
Theft Over $5000 24 20.8 98.61
20 40.0 81.25
-16.7 -17.6
Theft Under $5000 268 44.4 1,101.11
284 32.0 1,153.72
6.0 4.8
Have Stolen Goods 96 100.0 394.43
72 98.6 292.49
-25.0 -25.8
Fraud 36 61.1 147.91
48 22.9 195.00
33.3 31.8
Mischief 103 25.2 423.19
105 31.4 426.55
1.9 0.8
Other Criminal Code 70 87.1 287.60
62 87.1 251.87
-11.4 -12.4
Other Criminal Code (Part A) 62 87.1 254.74
52 90.4 211.24
-16.1 -17.1
Other Criminal Code (Part B) 8 87.5 32.87
10 70.0 40.62
25.0 23.6
Weapons Violations 10 80.0 41.09
10 80.0 40.62
0.0 -1.1
Public Morals Violations 6 83.3 24.65
3 66.7 12.19
-50.0 -50.6
Prostitution/Public Morals 6 83.3 24.65
3 66.7 12.19
-50.0 -50.6
Gaming and Betting 0 N.C.
1 0.00
0 N.C.
1 0.00
N.C.
1 N.C.
1
Total Criminal Violations 819 57.0 3,364.97
823 49.3 3,343.35
0.5 -0.6
Drug Violations 37 102.7 152.02
49 91.8 199.06
32.4 30.9
Other Federal Violations 0 N.C.
1 0.00
2 100.0 8.12
N.C.
1 N.C.
1
Total Criminal Code & Federal Violations (excluding traffic)
856 59.0 3,516.99
874 51.8 3,550.54
2.1 1.0
Traffic Violations 112 59.8 460.17
141 55.3 572.80
25.9 24.5
Dangerous Operation 19 100.0 78.06
16 87.5 65.00
-15.8 -16.7
Impaired Operation/Related Violations 39 102.6 160.24
53 98.1 215.31
35.9 34.4
Other Criminal Code Traffic Violations 54 14.8 221.87
72 16.7 292.49
33.3 31.8
Street Racing 0 N.C.
1 0.00
0 N.C.
1 0.00
N.C.
1 N.C.
1
1 not calculable

York Regional Police 2015 Annual Statistical Report Page 53
CRIME STATISTICS GEORGINA
JANUARY – DECEMBER (2014 – 2015)
2014
2015
2014/15
Actual
Percent Cleared
Rate Per 100,000
Population
Actual Percent Cleared
Rate Per 100,000
Population
Variance in Actual
(%)
Variance in Rates
(%)
Crimes Against Persons 483 91.7 1,030.16
489 83.8 1,029.37
1.2 -0.1
Violations Causing Death 1 100.0 2.13
0 N.C.
1 0.00
-100.0 -100.0
Attempt Capital Crime 1 100.0 2.13
1 100.0 2.11
0.0 -1.3
Sexual Violations 27 81.5 57.59
43 58.1 90.52
59.3 57.2
Assault 295 95.3 629.19
258 91.9 543.10
-12.5 -13.7
Violations Deprivation Freedom 6 83.3 12.80
5 100.0 10.53
-16.7 -17.8
Robbery & Other Violent Violations 153 86.9 326.32
182 78.0 383.12
19.0 17.4
Crimes Against Property 1,022 49.8 2,179.76
970 45.3 2,041.89
-5.1 -6.3
Arson 8 50.0 17.06
10 10.0 21.05
25.0 23.4
Break and Enter 122 36.1 260.21
137 30.7 288.39
12.3 10.8
Theft Over $5000 43 34.9 91.71
51 23.5 107.36
18.6 17.1
Theft Under $5000 395 37.5 842.47
340 39.4 715.71
-13.9 -15.0
Have Stolen Goods 125 101.6 266.60
106 98.1 223.13
-15.2 -16.3
Fraud 60 56.7 127.97
84 32.1 176.82
40.0 38.2
Mischief 269 50.9 573.73
242 49.2 509.42
-10.0 -11.2
Other Criminal Code 270 95.9 575.86
211 97.2 444.16
-21.9 -22.9
Other Criminal Code (Part A) 251 96.8 535.34
183 98.4 385.22
-27.1 -28.0
Other Criminal Code (Part B) 19 84.2 40.52
28 89.3 58.94
47.4 45.4
Weapons Violations 29 100.0 61.85
34 91.2 71.57
17.2 15.7
Public Morals Violations 15 93.3 31.99
7 114.3 14.74
-53.3 -53.9
Prostitution/Public Morals 15 93.3 31.99
7 114.3 14.74
-53.3 -53.9
Gaming and Betting 0 N.C.
1 0.00
0 N.C.
1 0.00
N.C.
1 N.C.
1
Total Criminal Violations 1,819 68.9 3,879.62
1,711 63.9 3,601.73
-5.9 -7.2
Drug Violations 172 94.8 366.85
164 100.0 345.23
-4.7 -5.9
Other Federal Violations 183 100.0 390.31
175 100.6 368.38
-4.4 -5.6
Total Criminal Code & Federal Violations (excluding traffic)
2,174 73.6 4,636.78
2,050 69.9 4,315.34
-5.7 -6.9
Traffic Violations 212 62.7 452.16
208 57.2 437.85
-1.9 -3.2
Dangerous Operation 24 87.5 51.19
19 89.5 40.00
-20.8 -21.9
Impaired Operation/Related Violations 97 97.9 206.88
81 101.2 170.51
-16.5 -17.6
Other Criminal Code Traffic Violations 91 18.7 194.09
108 18.5 227.34
18.7 17.1
Street Racing 0 N.C.
1 0.00
0 N.C.
1 0.00
N.C.
1 N.C.
1
1 not calculable.

York Regional Police 2015 Annual Statistical Report Page 54
CRIME STATISTICS KING
JANUARY – DECEMBER (2014 – 2015)
2014
2015
2014/15
Actual
Percent Cleared
Rate Per 100,000
Population
Actual Percent Cleared
Rate Per 100,000
Population
Variance in Actual
(%)
Variance in Rates
(%)
Crimes Against Persons 126 79.4 525.28
149 73.2 599.50
18.3 14.1
Violations Causing Death 0 N.C.
1 0.00
0 N.C.
1 0.00
N.C.
1 N.C.
1
Attempt Capital Crime 0 N.C.
1 0.00
0 N.C.
1 0.00
N.C.
1 N.C.
1
Sexual Violations 5 60.0 20.84
15 66.7 60.35
200.0 189.5
Assault 70 80.0 291.82
70 78.6 281.64
0.0 -3.5
Violations Deprivation Freedom 1 100.0 4.17
4 75.0 16.09
300.0 286.0
Robbery & Other Violent Violations 50 80.0 208.45
60 68.3 241.41
20.0 15.8
Crimes Against Property 314 32.8 1,309.04
331 24.8 1,331.78
5.4 1.7
Arson 1 100.0 4.17
2 0.0 8.05
100.0 93.0
Break and Enter 60 16.7 250.14
75 21.3 301.76
25.0 20.6
Theft Over $5000 24 29.2 100.05
31 24.0 124.73
29.2 24.7
Theft Under $5000 109 22.9 454.41
120 17.5 482.82
10.1 6.3
Have Stolen Goods 17 94.1 70.87
9 111.1 36.21
-47.1 -48.9
Fraud 36 63.9 150.08
33 27.3 132.78
-8.3 -11.5
Mischief 67 31.3 279.32
61 27.9 245.43
-9.0 -12.1
Other Criminal Code 38 92.1 158.42
40 92.5 160.94
5.3 1.6
Other Criminal Code (Part A) 29 93.1 120.90
35 94.3 140.82
20.7 16.5
Other Criminal Code (Part B) 9 88.9 37.52
5 80.0 20.12
-44.4 -46.4
Weapons Violations 4 125.0 16.68
9 100.0 36.21
125.0 117.2
Public Morals Violations 2 100.0 8.34
4 50.0 16.09
100.0 93.0
Prostitution/Public Morals 2 100.0 8.34
4 50.0 16.09
100.0 93.0
Gaming and Betting 0 N.C.
1 0.00
0 N.C.
1 0.00
N.C.
1 N.C.
1
Total Criminal Violations 484 50.6 2,017.76
533 44.8 2,144.52
10.1 6.3
Drug Violations 27 96.3 112.56
40 97.5 160.94
48.1 43.0
Other Federal Violations 1 100.0 4.17
0 N.C.
1 0.00
-100.0 -100.0
Total Criminal Code & Federal Violations (excluding traffic)
512 53.1 2,134.49
573 48.5 2,305.46
11.9 8.0
Traffic Violations 80 43.8 333.51
105 55.2 422.47
31.3 26.7
Dangerous Operation 11 81.8 45.86
11 90.9 44.26
0.0 -3.5
Impaired Operation/Related Violations 23 100.0 95.89
40 100.0 160.94
73.9 67.8
Other Criminal Code Traffic Violations 46 6.5 191.77
54 14.8 217.27
17.4 13.3
Street Racing 0 N.C.1 0.00
0 N.C.
1 0.00
N.C.
1 N.C.
1
1 not calculable

York Regional Police 2015 Annual Statistical Report Page 55
CRIME STATISTICS MARKHAM
JANUARY – DECEMBER (2014 – 2015)
2014
2015
2014/15
Actual
Percent Cleared
Rate Per 100,000
Population
Actual Percent Cleared
Rate Per 100,000
Population
Variance in Actual
(%)
Variance in Rates
(%)
Crimes Against Persons 1,307 77.7 382.12
1,340 75.7 382.87
2.5 0.2
Violations Causing Death 2 100.0 0.58
0 N.C.
1 0.00
-100.0 -100.0
Attempt Capital Crime 1 100.0 0.29
4 100.0 1.14
300.0 290.9
Sexual Violations 84 65.5 24.56
125 82.4 35.72
48.8 45.4
Assault 700 84.7 204.66
651 84.5 186.01
-7.0 -9.1
Violations Deprivation Freedom 23 82.6 6.72
27 96.3 7.71
17.4 14.7
Robbery & Other Violent Violations 497 69.4 145.31
533 62.1 152.29
7.2 4.8
Crimes Against Property 3,650 40.0 1,067.14
3,974 39.7 1,135.48
8.9 6.4
Arson 13 15.4 3.80
11 0.0 3.14
-15.4 -17.3
Break and Enter 493 20.5 144.14
599 20.7 171.15
21.5 18.7
Theft Over $5000 200 21.0 58.47
209 24.4 59.72
4.5 2.1
Theft Under $5000 1,432 34.6 418.67
1,456 38.9 416.02
1.7 -0.6
Have Stolen Goods 379 99.2 110.81
375 101.6 107.15
-1.1 -3.3
Fraud 572 39.7 167.23
731 33.1 208.87
27.8 24.9
Mischief 561 38.5 164.02
593 35.8 169.44
5.7 3.3
Other Criminal Code 521 86.4 152.32
473 89.6 135.15
-9.2 -11.3
Other Criminal Code (Part A) 440 87.5 128.64
402 90.5 114.86
-8.6 -10.7
Other Criminal Code (Part B) 81 80.2 23.68
71 84.5 20.29
-12.3 -14.3
Weapons Violations 81 80.2 23.68
91 74.7 26.00
12.3 9.8
Public Morals Violations 43 83.7 12.57
59 94.9 16.86
37.2 34.1
Prostitution/Public Morals 38 94.7 11.11
57 93.0 16.29
50.0 46.6
Gaming and Betting 5 0.0 1.46
2 150.0 0.57
-60.0 -60.9
Total Criminal Violations 5,602 54.0 1,637.83
5,937 52.9 1,696.36
6.0 3.6
Drug Violations 1,036 99.2 302.89
841 99.0 240.30
-18.8 -20.7
Other Federal Violations 6 100.0 1.75
6 100.0 1.71
0.0 -2.3
Total Criminal Code & Federal Violations (excluding traffic)
6,644 61.1 1,942.48
6,784 58.6 1,938.37
2.1 -0.2
Traffic Violations 1,014 41.5 296.46
1,033 43.0 295.16
1.9 -0.4
Dangerous Operation 63 85.7 18.42
77 87.0 22.00
22.2 19.4
Impaired Operation/Related Violations 304 99.7 88.88
323 100.3 92.29
6.3 3.8
Other Criminal Code Traffic Violations 646 9.8 188.87
630 7.9 180.01
-2.5 -4.7
Street Racing 1 100.0 0.29
3 100.0 0.86
200.0 193.2
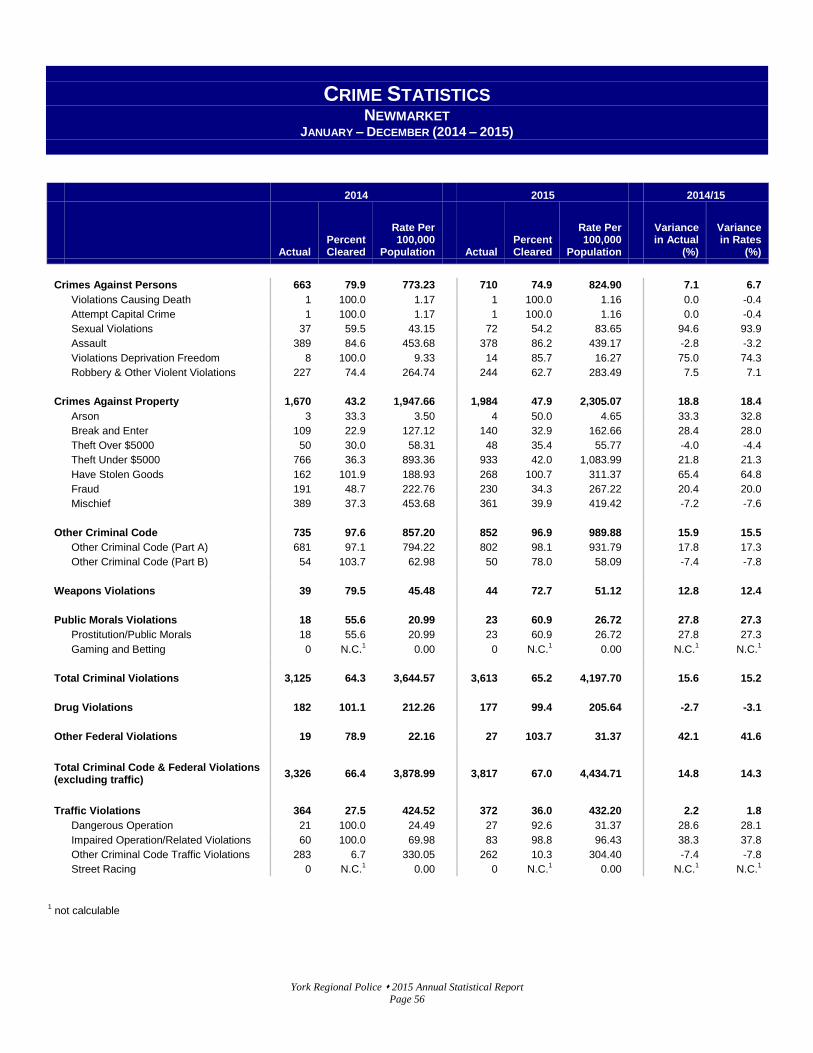
York Regional Police 2015 Annual Statistical Report Page 56
CRIME STATISTICS NEWMARKET
JANUARY – DECEMBER (2014 – 2015)
2014
2015
2014/15
Actual
Percent Cleared
Rate Per 100,000
Population
Actual Percent Cleared
Rate Per 100,000
Population
Variance in Actual
(%)
Variance in Rates
(%)
Crimes Against Persons 663 79.9 773.23
710 74.9 824.90
7.1 6.7
Violations Causing Death 1 100.0 1.17
1 100.0 1.16
0.0 -0.4
Attempt Capital Crime 1 100.0 1.17
1 100.0 1.16
0.0 -0.4
Sexual Violations 37 59.5 43.15
72 54.2 83.65
94.6 93.9
Assault 389 84.6 453.68
378 86.2 439.17
-2.8 -3.2
Violations Deprivation Freedom 8 100.0 9.33
14 85.7 16.27
75.0 74.3
Robbery & Other Violent Violations 227 74.4 264.74
244 62.7 283.49
7.5 7.1
Crimes Against Property 1,670 43.2 1,947.66
1,984 47.9 2,305.07
18.8 18.4
Arson 3 33.3 3.50
4 50.0 4.65
33.3 32.8
Break and Enter 109 22.9 127.12
140 32.9 162.66
28.4 28.0
Theft Over $5000 50 30.0 58.31
48 35.4 55.77
-4.0 -4.4
Theft Under $5000 766 36.3 893.36
933 42.0 1,083.99
21.8 21.3
Have Stolen Goods 162 101.9 188.93
268 100.7 311.37
65.4 64.8
Fraud 191 48.7 222.76
230 34.3 267.22
20.4 20.0
Mischief 389 37.3 453.68
361 39.9 419.42
-7.2 -7.6
Other Criminal Code 735 97.6 857.20
852 96.9 989.88
15.9 15.5
Other Criminal Code (Part A) 681 97.1 794.22
802 98.1 931.79
17.8 17.3
Other Criminal Code (Part B) 54 103.7 62.98
50 78.0 58.09
-7.4 -7.8
Weapons Violations 39 79.5 45.48
44 72.7 51.12
12.8 12.4
Public Morals Violations 18 55.6 20.99
23 60.9 26.72
27.8 27.3
Prostitution/Public Morals 18 55.6 20.99
23 60.9 26.72
27.8 27.3
Gaming and Betting 0 N.C.
1 0.00
0 N.C.
1 0.00
N.C.
1 N.C.
1
Total Criminal Violations 3,125 64.3 3,644.57
3,613 65.2 4,197.70
15.6 15.2
Drug Violations 182 101.1 212.26
177 99.4 205.64
-2.7 -3.1
Other Federal Violations 19 78.9 22.16
27 103.7 31.37
42.1 41.6
Total Criminal Code & Federal Violations (excluding traffic)
3,326 66.4 3,878.99
3,817 67.0 4,434.71
14.8 14.3
Traffic Violations 364 27.5 424.52
372 36.0 432.20
2.2 1.8
Dangerous Operation 21 100.0 24.49
27 92.6 31.37
28.6 28.1
Impaired Operation/Related Violations 60 100.0 69.98
83 98.8 96.43
38.3 37.8
Other Criminal Code Traffic Violations 283 6.7 330.05
262 10.3 304.40
-7.4 -7.8
Street Racing 0 N.C.1 0.00
0 N.C.
1 0.00
N.C.
1 N.C.
1
1 not calculable

York Regional Police 2015 Annual Statistical Report Page 57
CRIME STATISTICS RICHMOND HILL
JANUARY – DECEMBER (2014 – 2015)
2014
2015
2014/15
Actual
Percent Cleared
Rate Per 100,000
Population
Actual Percent Cleared
Rate Per 100,000
Population
Variance in Actual
(%)
Variance in Rates
(%)
Crimes Against Persons 1,006 76.1 495.19
1,075 74.2 519.70
6.9 4.9
Violations Causing Death 5 20.0 2.46
2 200.0 0.97
-60.0 -60.7
Attempt Capital Crime 8 75.0 3.94
3 133.3 1.45
-62.5 -63.2
Sexual Violations 80 81.3 39.38
80 73.8 38.68
0.0 -1.8
Assault 494 84.2 243.17
560 80.5 270.73
13.4 11.3
Violations Deprivation Freedom 27 77.8 13.29
22 81.8 10.64
-18.5 -20.0
Robbery & Other Violent Violations 392 65.6 192.96
408 64.2 197.24
4.1 2.2
Crimes Against Property 2,942 46.7 1,448.17
3,271 48.4 1,581.34
11.2 9.2
Arson 8 12.5 3.94
5 40.0 2.42
-37.5 -38.6
Break and Enter 343 21.0 168.84
407 35.4 196.76
18.7 16.5
Theft Over $5000 150 17.3 73.84
151 29.1 73.00
0.7 -1.1
Theft Under $5000 1,135 47.8 558.69
1,314 47.0 635.24
15.8 13.7
Have Stolen Goods 409 100.5 201.33
412 100.7 199.18
0.7 -1.1
Fraud 419 38.7 206.25
525 37.1 253.81
25.3 23.1
Mischief 478 33.5 235.29
457 36.1 220.93
-4.4 -6.1
Other Criminal Code 536 94.4 263.84
628 93.5 303.60
17.2 15.1
Other Criminal Code (Part A) 464 95.7 228.40
539 92.8 260.58
16.2 14.1
Other Criminal Code (Part B) 72 86.1 35.44
89 97.8 43.03
23.6 21.4
Weapons Violations 59 91.5 29.04
63 73.0 30.46
6.8 4.9
Public Morals Violations 37 73.0 18.21
20 105.0 9.67
-45.9 -46.9
Prostitution/Public Morals 36 75.0 17.72
20 105.0 9.67
-44.4 -45.4
Gaming and Betting 1 0.0 0.49
0 N.C.
1 0.00
-100.0 -100.0
Total Criminal Violations 4,580 59.5 2,254.46
5,057 60.0 2,444.77
10.4 8.4
Drug Violations 420 100.2 206.74
386 98.4 186.61
-8.1 -9.7
Other Federal Violations 7 114.3 3.45
7 100.0 3.38
0.0 -1.8
Total Criminal Code & Federal Violations (excluding traffic)
5,007 63.0 2,464.64
5,450 62.8 2,634.76
8.8 6.9
Traffic Violations 655 22.6 322.42
680 39.3 328.74
3.8 2.0
Dangerous Operation 23 100.0 11.32
49 85.7 23.69
113.0 109.2
Impaired Operation/Related Violations 100 101.0 49.22
175 100.0 84.60
75.0 71.9
Other Criminal Code Traffic Violations 532 4.5 261.87
455 10.8 219.97
-14.5 -16.0
Street Racing 0 N.C.1 0.00
1 100.0 0.48
N.C.
1 N.C.
1
1 not calculable

York Regional Police 2015 Annual Statistical Report Page 58
CRIME STATISTICS VAUGHAN
JANUARY – DECEMBER (2014 – 2015)
2014
2015
2014/15
Actual
Percent Cleared
Rate Per 100,000
Population
Actual Percent Cleared
Rate Per 100,000
Population
Variance in Actual
(%)
Variance in Rates
(%)
Crimes Against Persons 1,869 76.4 587.94
1,946 76.7 601.53
4.1 2.3
Violations Causing Death 5 40.0 1.57
5 80.0 1.55
0.0 -1.7
Attempt Capital Crime 7 42.9 2.20
4 150.0 1.24
-42.9 -43.8
Sexual Violations 105 73.3 33.03
91 70.3 28.13
-13.3 -14.8
Assault 971 83.9 305.45
1,011 85.0 312.51
4.1 2.3
Violations Deprivation Freedom 26 96.2 8.18
34 82.4 10.51
30.8 28.5
Robbery & Other Violent Violations 755 67.0 237.50
801 66.3 247.60
6.1 4.3
Crimes Against Property 6,515 45.0 2,049.46
7,377 43.0 2,280.33
13.2 11.3
Arson 12 16.7 3.77
24 20.8 7.42
100.0 96.5
Break and Enter 519 15.2 163.26
700 16.3 216.38
34.9 32.5
Theft Over $5000 498 18.3 156.66
537 17.7 165.99
7.8 6.0
Theft Under $5000 2,962 40.3 931.77
3,265 40.1 1,009.25
10.2 8.3
Have Stolen Goods 952 99.5 299.48
1,040 101.0 321.48
9.2 7.3
Fraud 820 40.9 257.95
973 31.8 300.77
18.7 16.6
Mischief 752 37.9 236.56
838 34.4 259.04
11.4 9.5
Other Criminal Code 541 84.8 170.19
623 92.0 192.58
15.2 13.2
Other Criminal Code (Part A) 448 87.1 140.93
513 96.3 158.58
14.5 12.5
Other Criminal Code (Part B) 93 74.2 29.26
110 71.8 34.00
18.3 16.2
0.00
Weapons Violations 103 84.5 32.40
139 77.7 42.97
35.0 32.6
Public Morals Violations 47 59.6 14.79
37 70.3 11.44
-21.3 -22.6
Prostitution/Public Morals 45 62.2 14.16
35 74.3 10.82
-22.2 -23.6
Gaming and Betting 2 0.0 0.63
2 0.0 0.62
0.0 -1.7
Total Criminal Violations 9,075 54.4 2,854.77
10,122 53.1 3,128.84
11.5 9.6
Drug Violations 749 99.9 235.62
747 99.3 230.91
-0.3 -2.0
Other Federal Violations 8 87.5 2.52
15 106.7 4.64
87.5 84.2
Total Criminal Code & Federal Violations (excluding traffic)
9,832 57.9 3,092.90
10,884 56.3 3,364.39
10.7 8.8
Traffic Violations 1,446 37.6 454.88
1,443 42.9 446.05
-0.2 -1.9
Dangerous Operation 119 89.9 37.43
142 85.2 43.89
19.3 17.3
Impaired Operation/Related Violations 369 100.0 116.08
400 99.8 123.65
8.4 6.5
Other Criminal Code Traffic Violations 955 6.6 300.42
897 10.6 277.27
-6.1 -7.7
Street Racing 3 133.3 0.94
4 100.0 1.24
33.3 31.0

York Regional Police 2015 Annual Statistical Report Page 59
CRIME STATISTICS WHITCHURCH-STOUFFVILLE
JANUARY – DECEMBER (2014 – 2015)
2014
2015
2014/15
Actual
Percent Cleared
Rate Per 100,000
Population
Actual Percent Cleared
Rate Per 100,000
Population
Variance in Actual
(%)
Variance in Rates
(%)
Crimes Against Persons 159 86.8 356.85
198 75.3 436.75
24.5 22.4
Violations Causing Death 0 N.C.
1 0.00
0 N.C.
1 0.00
N.C.
1 N.C.
1
Attempt Capital Crime 0 N.C.
1 0.00
0 N.C.
1 0.00
N.C.
1 N.C.
1
Sexual Violations 8 125.0 17.95
12 66.7 26.47
50.0 47.4
Assault 101 87.1 226.68
112 89.3 247.05
10.9 9.0
Violations Deprivation Freedom 3 66.7 6.73
1 100.0 2.21
-66.7 -67.2
Robbery & Other Violent Violations 47 80.9 105.48
73 54.8 161.02
55.3 52.7
Crimes Against Property 450 34.9 1,009.94
450 27.8 992.61
0.0 -1.7
Arson 3 0.0 6.73
5 0.0 11.03
66.7 63.8
Break and Enter 61 24.6 136.90
71 9.9 156.61
16.4 14.4
Theft Over $5000 20 15.0 44.89
25 16.0 55.15
25.0 22.9
Theft Under $5000 181 29.3 406.22
146 21.9 322.05
-19.3 -20.7
Have Stolen Goods 37 100.0 83.04
32 93.8 70.59
-13.5 -15.0
Fraud 42 23.8 94.26
72 23.6 158.82
71.4 68.5
Mischief 106 36.8 237.90
99 35.4 218.37
-6.6 -8.2
Other Criminal Code 61 86.9 136.90
67 86.6 147.79
9.8 8.0
Other Criminal Code (Part A) 53 88.7 118.95
57 82.5 125.73
7.5 5.7
Other Criminal Code (Part B) 8 75.0 17.95
10 110.0 22.06
25.0 22.9
Weapons Violations 9 88.9 20.20
5 5.0 11.03
-44.4 -45.4
Public Morals Violations 6 50.0 13.47
9 88.9 19.85
50.0 47.4
Prostitution/Public Morals 6 50.0 13.47
9 88.9 19.85
50.0 47.4
Gaming and Betting 0 N.C.
1 0.00
0 N.C.
1 0.00
N.C.
1 N.C.
1
Total Criminal Violations 685 52.4 1,537.36
729 47.3 1,608.03
6.4 4.6
Drug Violations 53 96.2 118.95
63 98.4 138.97
18.9 16.8
Other Federal Violations 1 100.0 2.24
0 N.C.
1 0.00
-100.0 -100.0
Total Criminal Code & Federal Violations (excluding traffic)
739 55.6 1,658.55
792 51.4 1,746.99
7.2 5.3
Traffic Violations 116 53.4 260.34
112 56.3 247.05
-3.4 -5.1
Dangerous Operation 12 91.7 26.93
9 66.7 19.85
-25.0 -26.3
Impaired Operation/Related Violations 42 100.0 94.26
47 97.9 103.67
11.9 10.0
Other Criminal Code Traffic Violations 62 14.5 139.15
56 19.6 123.52
-9.7 -11.2
Street Racing 0 N.C.1 0.00
0 N.C.
1 0.00
N.C.
1 N.C.
1
1 not calculable