Embed Size (px)
Citation preview
York City Centre Movement and Accessibility Framework:
Background Information and Evidence Base
City of York Council
JMP Consultants with Camlin Lonsdale and PLB
23rd May 2011
York City Centre Movement and Accessibility Framework:
Background Information and Evidence Base
This report presents our background information and evidence for the Movement and Accessibility Framework.
It covers the policy context, information on numbers and characteristics of employees, shoppers and visitors
coming to York and supply and demand for various transport modes.
It reviews drivers for change over the next 20 years, including development proposals.
Finally, it provides an assessment of strengths, weaknesses, opportunities and threats in relation to public
realm, visitor offer, retail offer and transport provision.
Section Page
1 Introduction and Policy Context 3
2 Who Comes to York? 10
3 How people travel to York City Centre 19
4 Drivers of Change 43
5 SWOT analysis 52
6 Consultations and References 58
23/05/2011 2York City Centre Movement and Accessibility Framework:
Background Information and Evidence Base
Issue history:
First Interim draft: 19th November 2010
Second interim draft: 6th January 2011
Draft Final: 5th April 2011
Final: 23rd May 2011

Section One:
Introduction and Policy Context
3
1) Policy context
Introduction
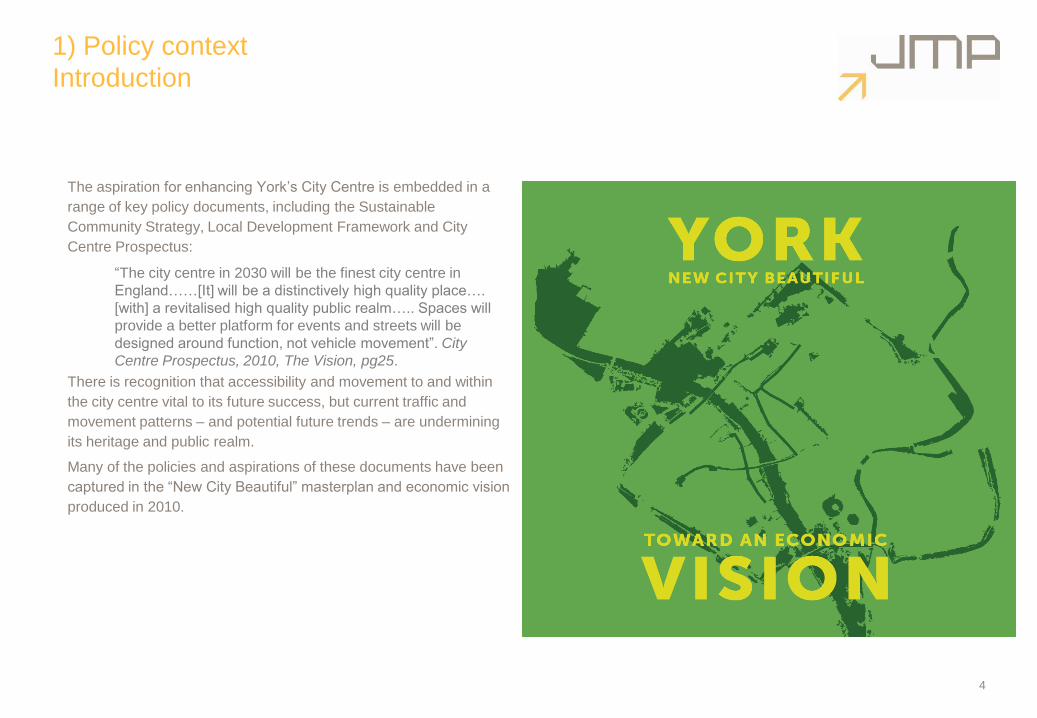
The aspiration for enhancing York‟s City Centre is embedded in a
range of key policy documents, including the Sustainable
Community Strategy, Local Development Framework and City
Centre Prospectus:
“The city centre in 2030 will be the finest city centre in
England……[It] will be a distinctively high quality place….
[with] a revitalised high quality public realm….. Spaces will
provide a better platform for events and streets will be
designed around function, not vehicle movement”. City
Centre Prospectus, 2010, The Vision, pg25.
There is recognition that accessibility and movement to and within
the city centre vital to its future success, but current traffic and
movement patterns – and potential future trends – are undermining
its heritage and public realm.
Many of the policies and aspirations of these documents have been
captured in the “New City Beautiful” masterplan and economic vision
produced in 2010.
4
1) Policy context:
New City Beautiful
5
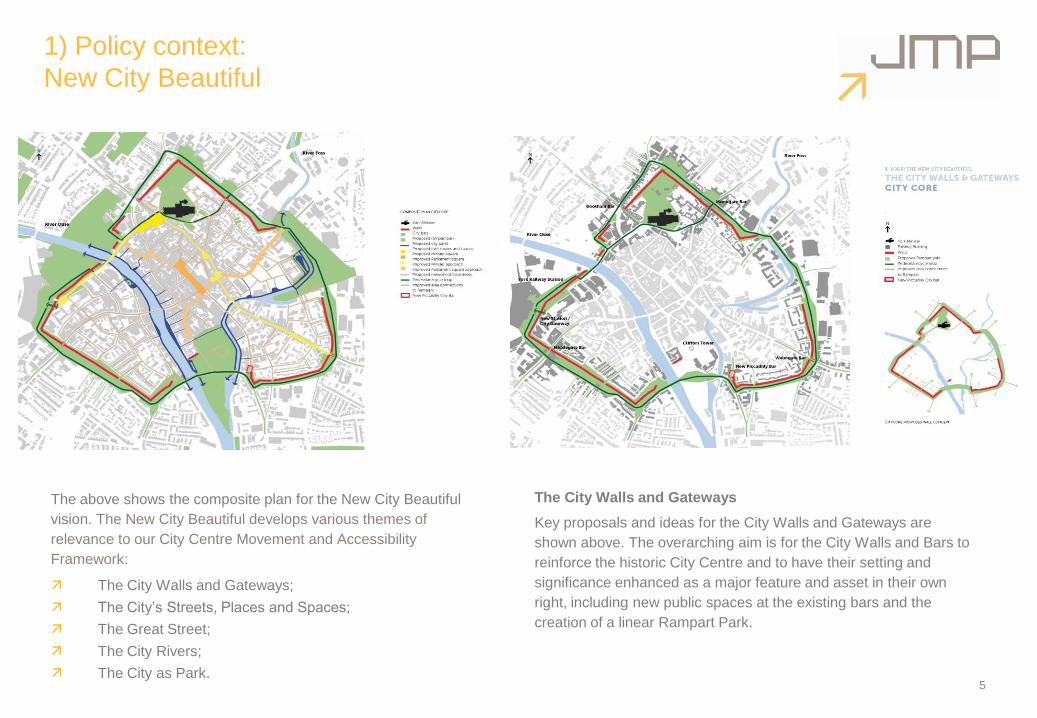
The above shows the composite plan for the New City Beautiful
vision. The New City Beautiful develops various themes of
relevance to our City Centre Movement and Accessibility
Framework:
The City Walls and Gateways;
The City‟s Streets, Places and Spaces;
The Great Street;
The City Rivers;
The City as Park.
The City Walls and Gateways
Key proposals and ideas for the City Walls and Gateways are
shown above. The overarching aim is for the City Walls and Bars to
reinforce the historic City Centre and to have their setting and
significance enhanced as a major feature and asset in their own
right, including new public spaces at the existing bars and the
creation of a linear Rampart Park.
1) Policy context:
New City Beautiful
6
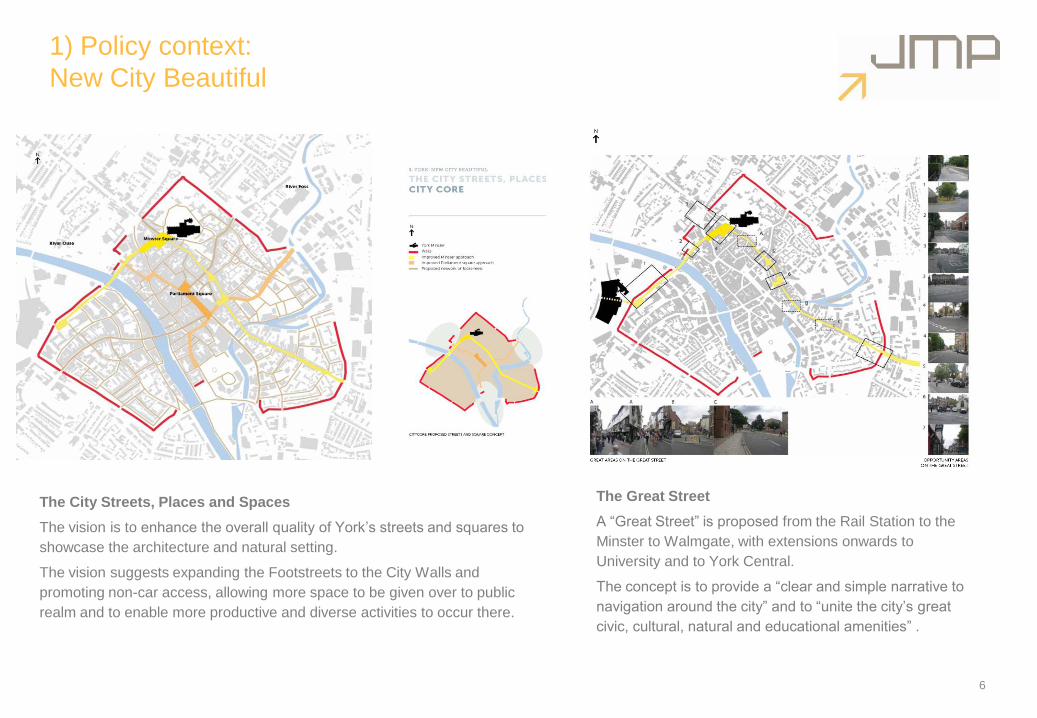
The City Streets, Places and Spaces
The vision is to enhance the overall quality of York‟s streets and squares to
showcase the architecture and natural setting.
The vision suggests expanding the Footstreets to the City Walls and
promoting non-car access, allowing more space to be given over to public
realm and to enable more productive and diverse activities to occur there.
The Great Street
A “Great Street” is proposed from the Rail Station to the
Minster to Walmgate, with extensions onwards to
University and to York Central.
The concept is to provide a “clear and simple narrative to
navigation around the city” and to “unite the city‟s great
civic, cultural, natural and educational amenities” .
1) Policy context:
New City Beautiful
7
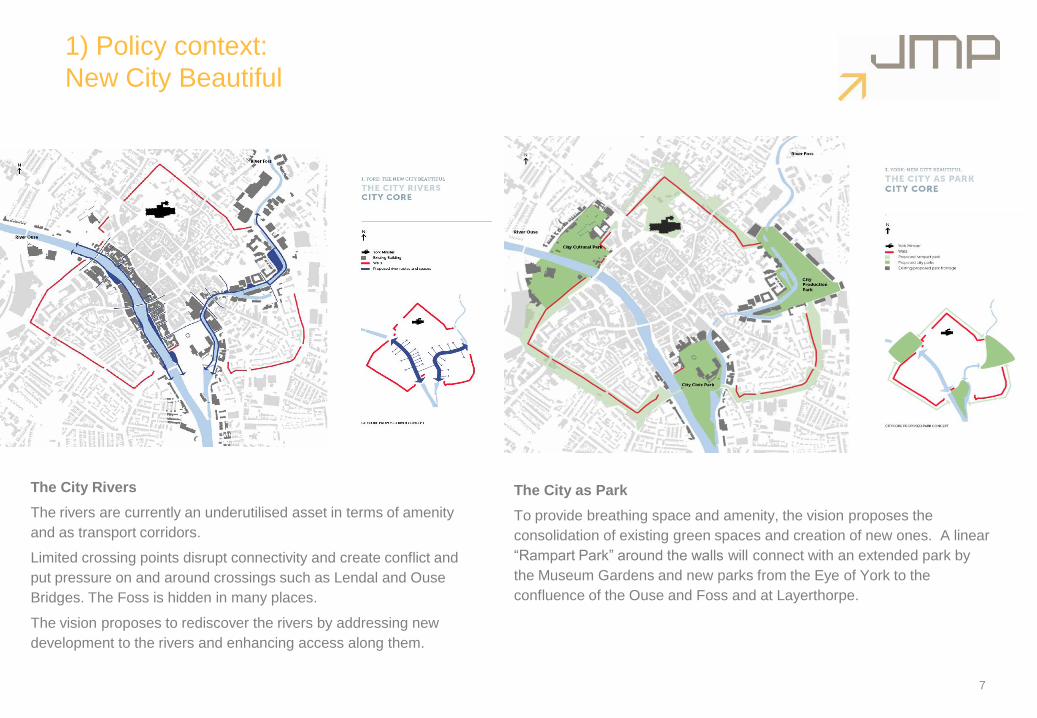
The City Rivers
The rivers are currently an underutilised asset in terms of amenity
and as transport corridors.
Limited crossing points disrupt connectivity and create conflict and
put pressure on and around crossings such as Lendal and Ouse
Bridges. The Foss is hidden in many places.
The vision proposes to rediscover the rivers by addressing new
development to the rivers and enhancing access along them.
The City as Park
To provide breathing space and amenity, the vision proposes the
consolidation of existing green spaces and creation of new ones. A linear
“Rampart Park” around the walls will connect with an extended park by
the Museum Gardens and new parks from the Eye of York to the
confluence of the Ouse and Foss and at Layerthorpe.
1) Policy Context:
City Centre Vision: Areas of Change
8
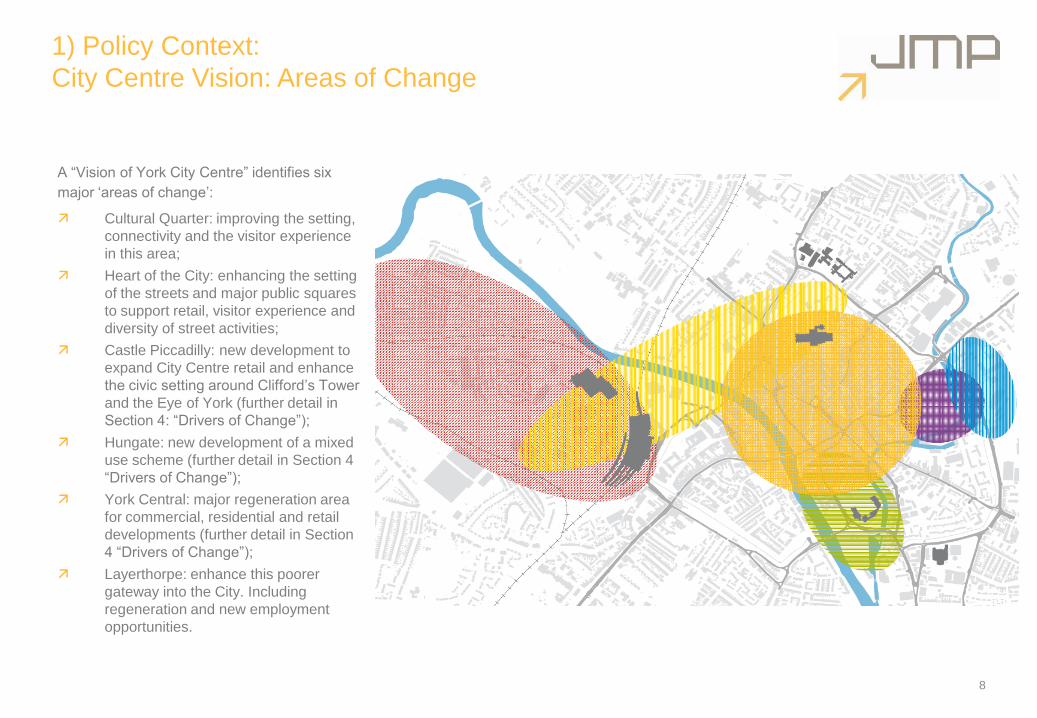
A “Vision of York City Centre” identifies six
major „areas of change‟:
Cultural Quarter: improving the setting,
connectivity and the visitor experience
in this area;
Heart of the City: enhancing the setting
of the streets and major public squares
to support retail, visitor experience and
diversity of street activities;
Castle Piccadilly: new development to
expand City Centre retail and enhance
the civic setting around Clifford‟s Tower
and the Eye of York (further detail in
Section 4: “Drivers of Change”);
Hungate: new development of a mixed
use scheme (further detail in Section 4
“Drivers of Change”);
York Central: major regeneration area
for commercial, residential and retail
developments (further detail in Section
4 “Drivers of Change”);
Layerthorpe: enhance this poorer
gateway into the City. Including
regeneration and new employment
opportunities.
1) Policy context:
LTP3
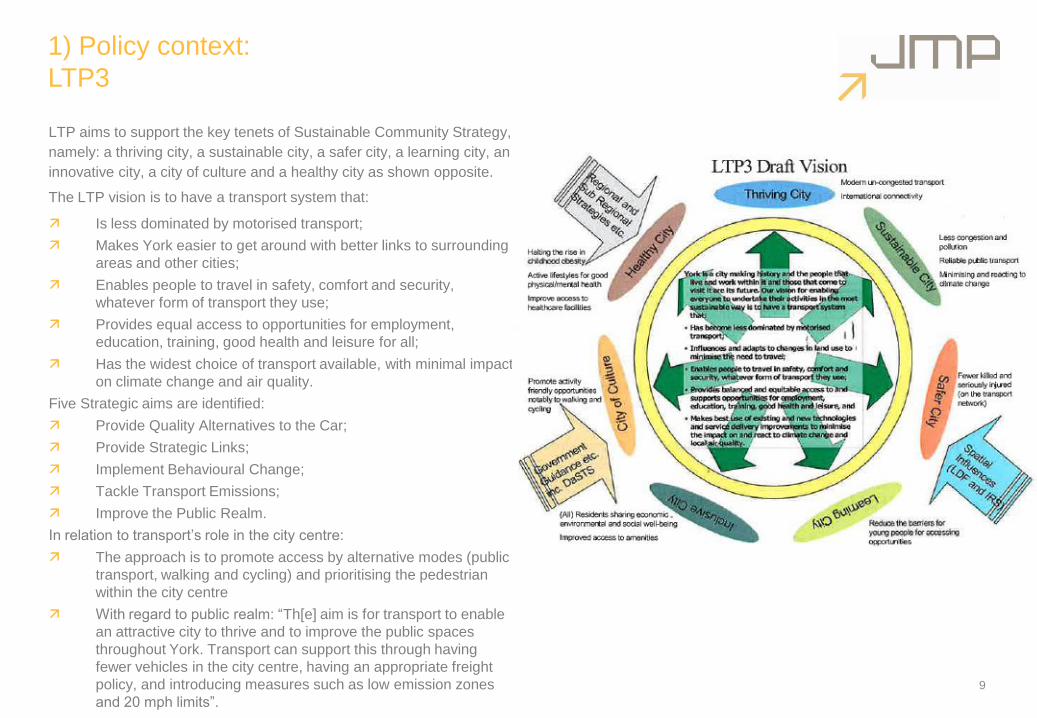
LTP aims to support the key tenets of Sustainable Community Strategy,
namely: a thriving city, a sustainable city, a safer city, a learning city, an
innovative city, a city of culture and a healthy city as shown opposite.
The LTP vision is to have a transport system that:
Is less dominated by motorised transport;
Makes York easier to get around with better links to surrounding
areas and other cities;
Enables people to travel in safety, comfort and security,
whatever form of transport they use;
Provides equal access to opportunities for employment,
education, training, good health and leisure for all;
Has the widest choice of transport available, with minimal impact
on climate change and air quality.
Five Strategic aims are identified:
Provide Quality Alternatives to the Car;
Provide Strategic Links;
Implement Behavioural Change;
Tackle Transport Emissions;
Improve the Public Realm.
In relation to transport‟s role in the city centre:
The approach is to promote access by alternative modes (public
transport, walking and cycling) and prioritising the pedestrian
within the city centre
With regard to public realm: “Th[e] aim is for transport to enable
an attractive city to thrive and to improve the public spaces
throughout York. Transport can support this through having
fewer vehicles in the city centre, having an appropriate freight
policy, and introducing measures such as low emission zones
and 20 mph limits”.
9

Section Two:
Who Comes to York?
10
2) Who comes to York City Centre?
In terms of workers, visitors and shoppers:
33,000 workers in or adjacent to city centre:
30% of all jobs in city;
50% of office space within Walled City.
7.1 million visitors per year (2008): 4.2m tourist visitors,
1.9m visiting friends and relations, 1.1m business visitors
(an average of approximately 20,000 visitors per day);
Difficult to assess number of shoppers, but spend in York
City Centre is £402m and 27% share of comparison good
market;
6,457 residents, living in 3,638 households (Source: City
Centre AAP – 2001 Census).
11
2) Employment and workers:
Key city centre employment sites
12
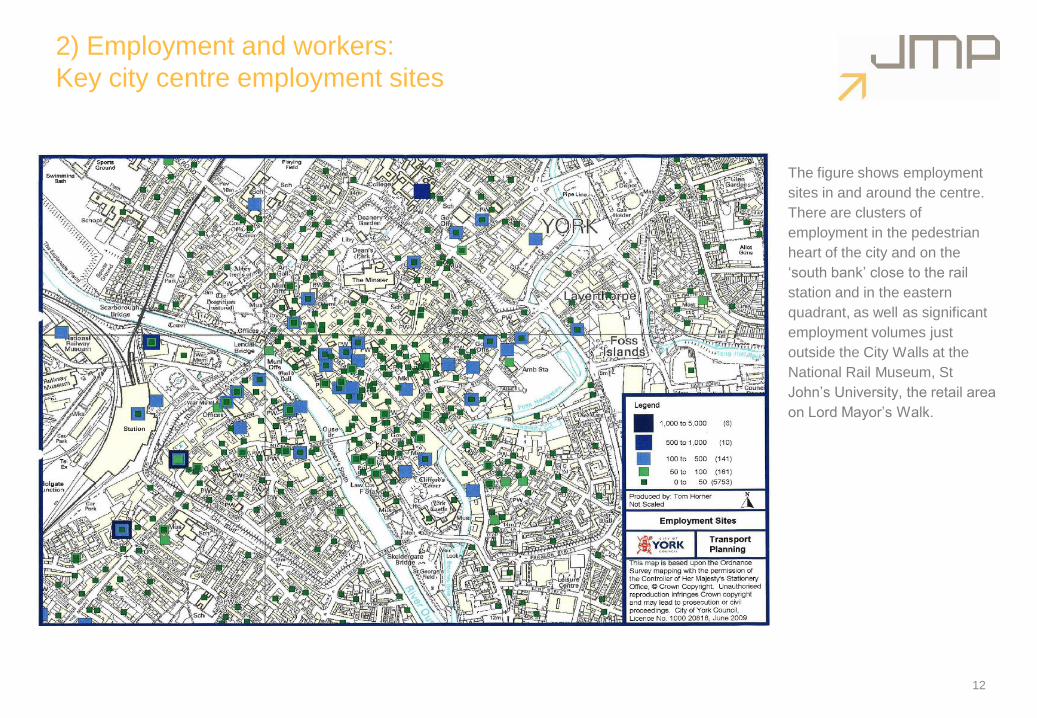
The figure shows employment
sites in and around the centre.
There are clusters of
employment in the pedestrian
heart of the city and on the
„south bank‟ close to the rail
station and in the eastern
quadrant, as well as significant
employment volumes just
outside the City Walls at the
National Rail Museum, St
John‟s University, the retail area
on Lord Mayor‟s Walk.
2) Employment and workers:
Origins of City Centre workers (Census, 2001)
13
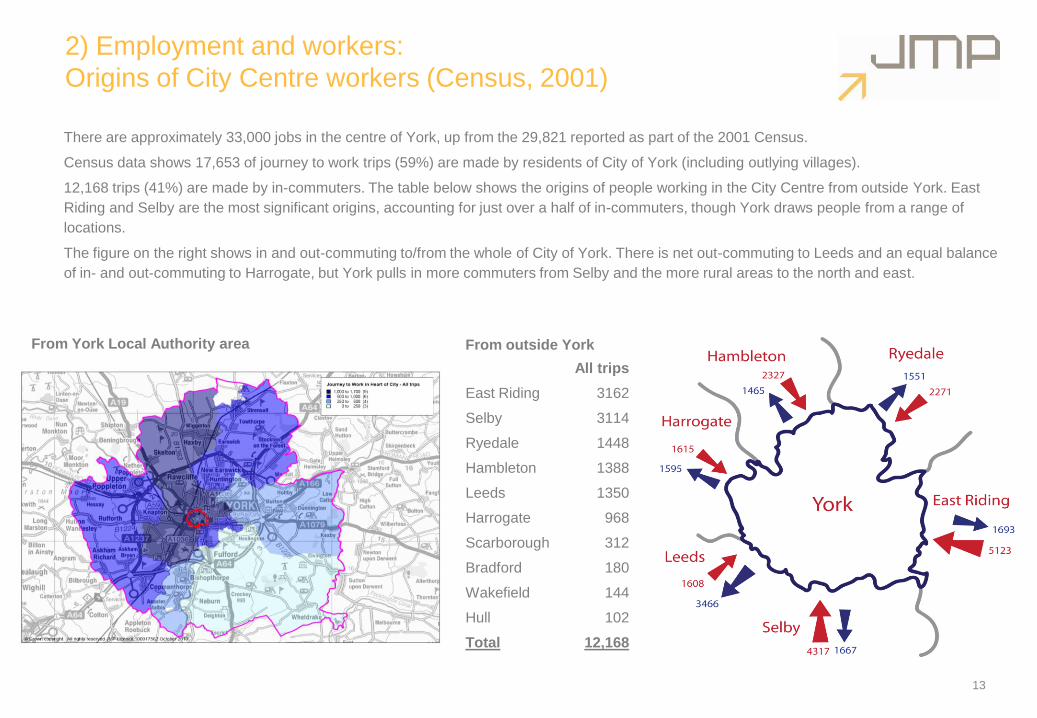
All trips
East Riding 3162
Selby 3114
Ryedale 1448
Hambleton 1388
Leeds 1350
Harrogate 968
Scarborough 312
Bradford 180
Wakefield 144
Hull 102
Total 12,168
From York Local Authority area From outside York
There are approximately 33,000 jobs in the centre of York, up from the 29,821 reported as part of the 2001 Census.
Census data shows 17,653 of journey to work trips (59%) are made by residents of City of York (including outlying villages).
12,168 trips (41%) are made by in-commuters. The table below shows the origins of people working in the City Centre from outside York. East
Riding and Selby are the most significant origins, accounting for just over a half of in-commuters, though York draws people from a range of
locations.
The figure on the right shows in and out-commuting to/from the whole of City of York. There is net out-commuting to Leeds and an equal balance
of in- and out-commuting to Harrogate, but York pulls in more commuters from Selby and the more rural areas to the north and east.
2) Employment and workers:
Mode split and trips and other key destinations (Census 2001)
14
0%
20%
1%
24%
6%
2%
18%
29%
Train
Bus
Taxi
Car driver
Car pass
M'cycle
Cycle
Walk
11%
16%
0%
62%
7%
1% 1% 1%
From York Local Authority area
From outside York Local Authority area
Hospital
Layer-
thorpe
York
Central
York St
John
York
University
Grand
Total
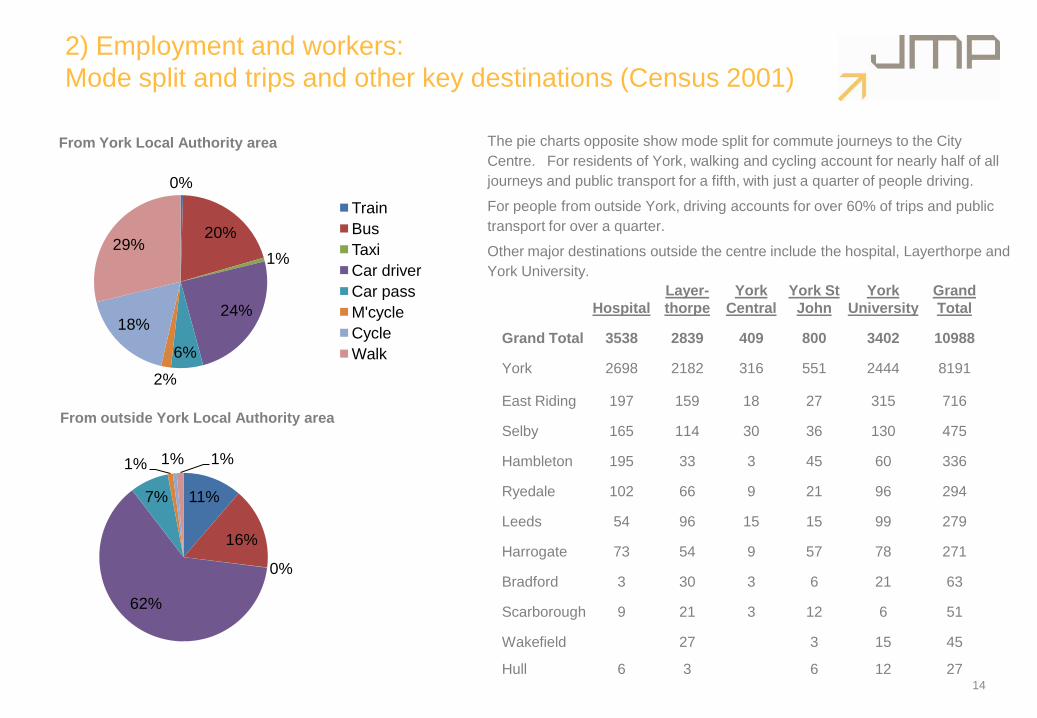
Grand Total 3538 2839 409 800 3402 10988
York 2698 2182 316 551 2444 8191
East Riding 197 159 18 27 315 716
Selby 165 114 30 36 130 475
Hambleton 195 33 3 45 60 336
Ryedale 102 66 9 21 96 294
Leeds 54 96 15 15 99 279
Harrogate 73 54 9 57 78 271
Bradford 3 30 3 6 21 63
Scarborough 9 21 3 12 6 51
Wakefield 27 3 15 45
Hull 6 3 6 12 27
The pie charts opposite show mode split for commute journeys to the City
Centre. For residents of York, walking and cycling account for nearly half of all
journeys and public transport for a fifth, with just a quarter of people driving.
For people from outside York, driving accounts for over 60% of trips and public
transport for over a quarter.
Other major destinations outside the centre include the hospital, Layerthorpe and
York University.
2) Tourism and Visitors
Visitor profile
York welcomes 7.1m visitors annually, of whom:
4.2m are tourist visitors:
13% of these are from overseas;
Total tourist spend circa. £330m p.a.
1.9m are visiting friends and relations;
1m are business visitors.
Total spend of all categories is estimated to be around £443m (2008).
Tourism accounts for 11.8% of employment in city (Leeds City Region and
North Yorkshire and York connectivity evidence base)
80% visitors come back to the city again for more (78% of leisure visitors in
2008-09 are repeat visitors. (Source: Key Facts of Tourism 2010 by Visit
York)
Seasonal Spread of Visitors (A Vision for Tourism)
January – March (20%)
April – June (26%)
July – September (29%)
October – December (25%)
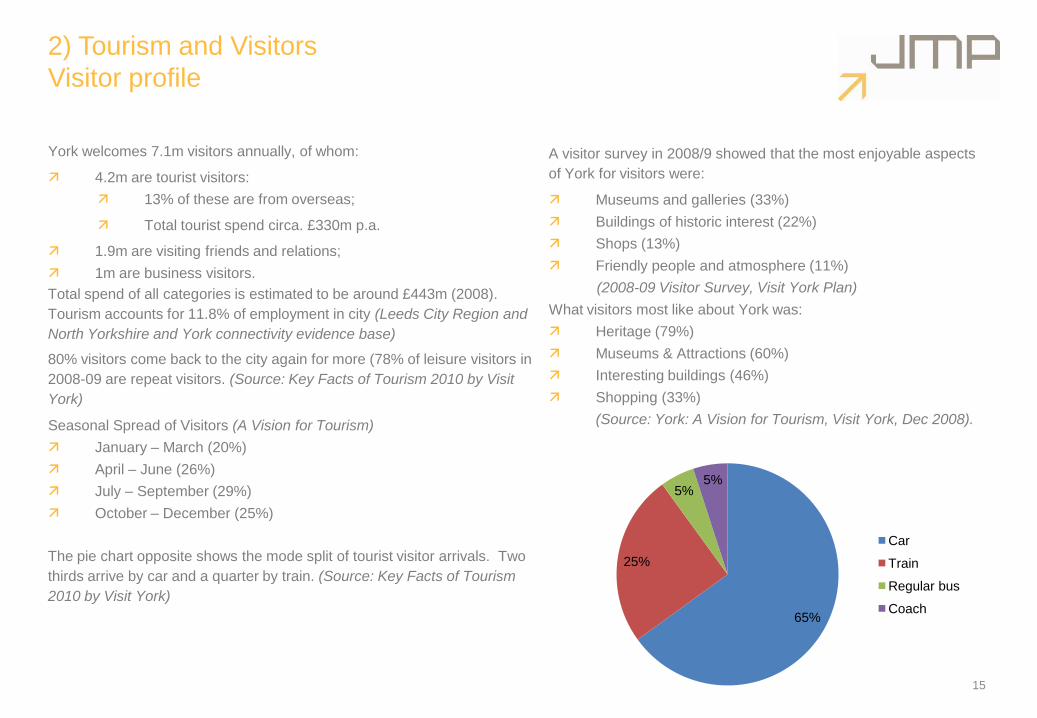
The pie chart opposite shows the mode split of tourist visitor arrivals. Two
thirds arrive by car and a quarter by train. (Source: Key Facts of Tourism
2010 by Visit York)
15
65%
25%
5%5%
Car
Train
Regular bus
Coach
A visitor survey in 2008/9 showed that the most enjoyable aspects
of York for visitors were:
Museums and galleries (33%)
Buildings of historic interest (22%)
Shops (13%)
Friendly people and atmosphere (11%)
(2008-09 Visitor Survey, Visit York Plan)
What visitors most like about York was:
Heritage (79%)
Museums & Attractions (60%)
Interesting buildings (46%)
Shopping (33%)
(Source: York: A Vision for Tourism, Visit York, Dec 2008).
2) Tourism and visitors:
Key attractions
16
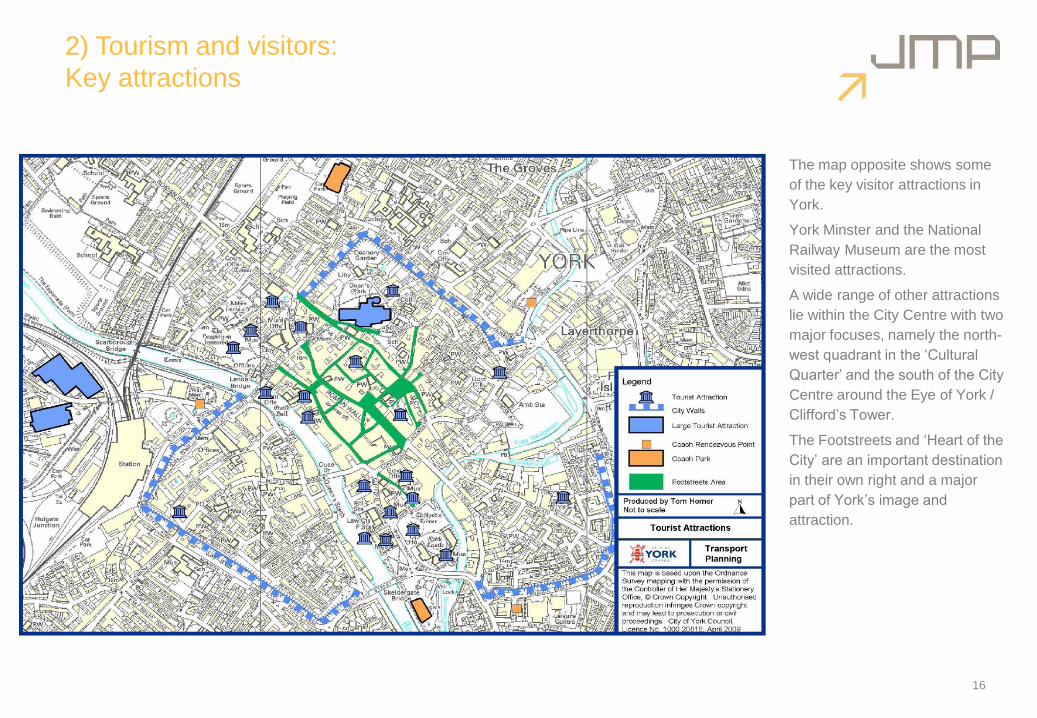
The map opposite shows some
of the key visitor attractions in
York.
York Minster and the National
Railway Museum are the most
visited attractions.
A wide range of other attractions
lie within the City Centre with two
major focuses, namely the north-
west quadrant in the „Cultural
Quarter‟ and the south of the City
Centre around the Eye of York /
Clifford‟s Tower.
The Footstreets and „Heart of the
City‟ are an important destination
in their own right and a major
part of York‟s image and
attraction.
2) Retail and shoppers
City Centre Facilities
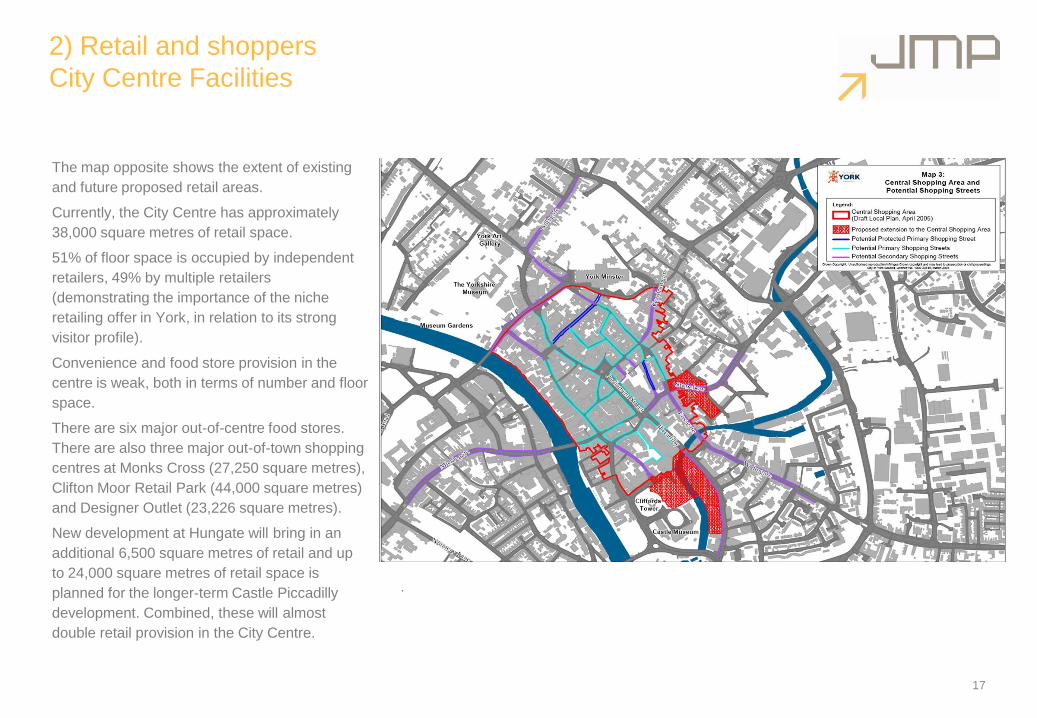
The map opposite shows the extent of existing
and future proposed retail areas.
Currently, the City Centre has approximately
38,000 square metres of retail space.
51% of floor space is occupied by independent
retailers, 49% by multiple retailers
(demonstrating the importance of the niche
retailing offer in York, in relation to its strong
visitor profile).
Convenience and food store provision in the
centre is weak, both in terms of number and floor
space.
There are six major out-of-centre food stores.
There are also three major out-of-town shopping
centres at Monks Cross (27,250 square metres),
Clifton Moor Retail Park (44,000 square metres)
and Designer Outlet (23,226 square metres).
New development at Hungate will bring in an
additional 6,500 square metres of retail and up
to 24,000 square metres of retail space is
planned for the longer-term Castle Piccadilly
development. Combined, these will almost
double retail provision in the City Centre.
17
.
2) Retail and Shoppers:
demand and shopper profile
18
The City Centre has its strongest market shares in personal/luxury
goods category and, as noted previously, has a strong independent
retail offer.
It is estimated that tourist visitors spend about £126m per annum on
shopping (just over a third of total visitor spend).
The City Centre is losing significant market share in clothing and
footwear to Monks Cross and large proportions of furniture / floor,
DIY, domestic appliances and electrical / entertainment to Clifton
Moor. City Centre competition also exists with Leeds and Hull.
Performance of district and local centres has also suffered as a result
of the out of centre food stores and developments at Monks Cross
and Clifton Moor.
A key aim for the City Centre is to halt its loss of market share. A retail
strategy in 2008 advocated that York should not try to compete with
out of town centres but to focus on its strengths which are offering a
multi-dimensional experience – enjoying the historic environment,
restaurants, cafes and open air and making more of the river
frontages, as well as improving the secondary shopping areas of
Fossgate, Walmgate and Micklegate.
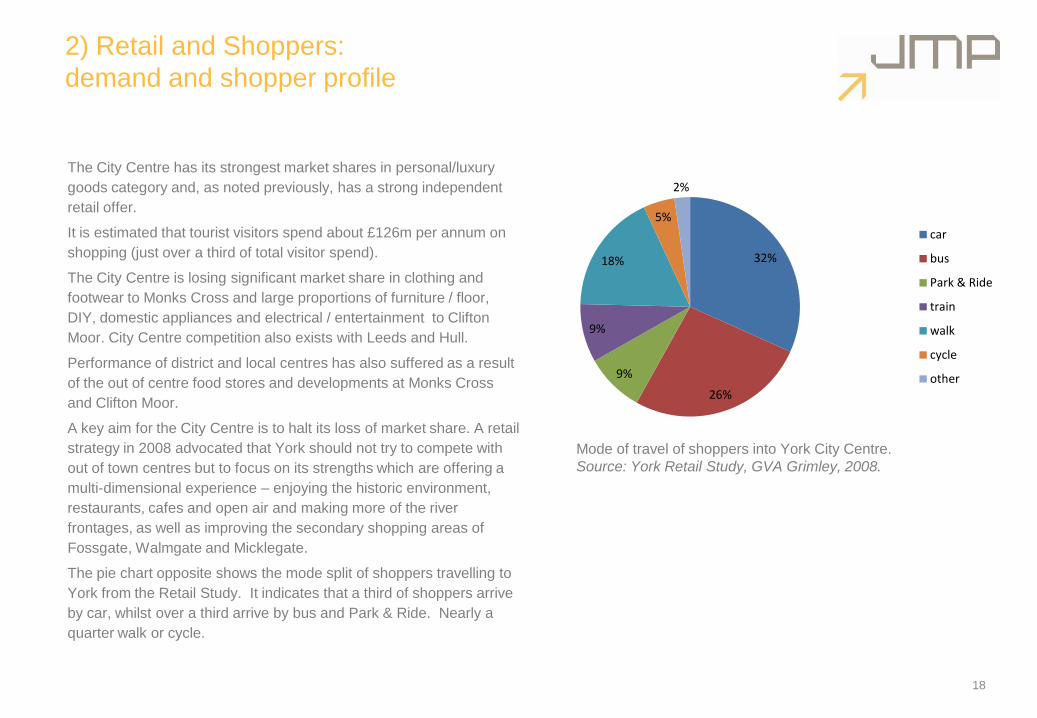
The pie chart opposite shows the mode split of shoppers travelling to
York from the Retail Study. It indicates that a third of shoppers arrive
by car, whilst over a third arrive by bus and Park & Ride. Nearly a
quarter walk or cycle.
32%
26%
9%
9%
18%
5%
2%
car
bus
Park & Ride
train
walk
cycle
other
Mode of travel of shoppers into York City Centre.
Source: York Retail Study, GVA Grimley, 2008.
Section Three:
How people travel to York City Centre
19
3) Arrivals
Approach to York City Centre
20
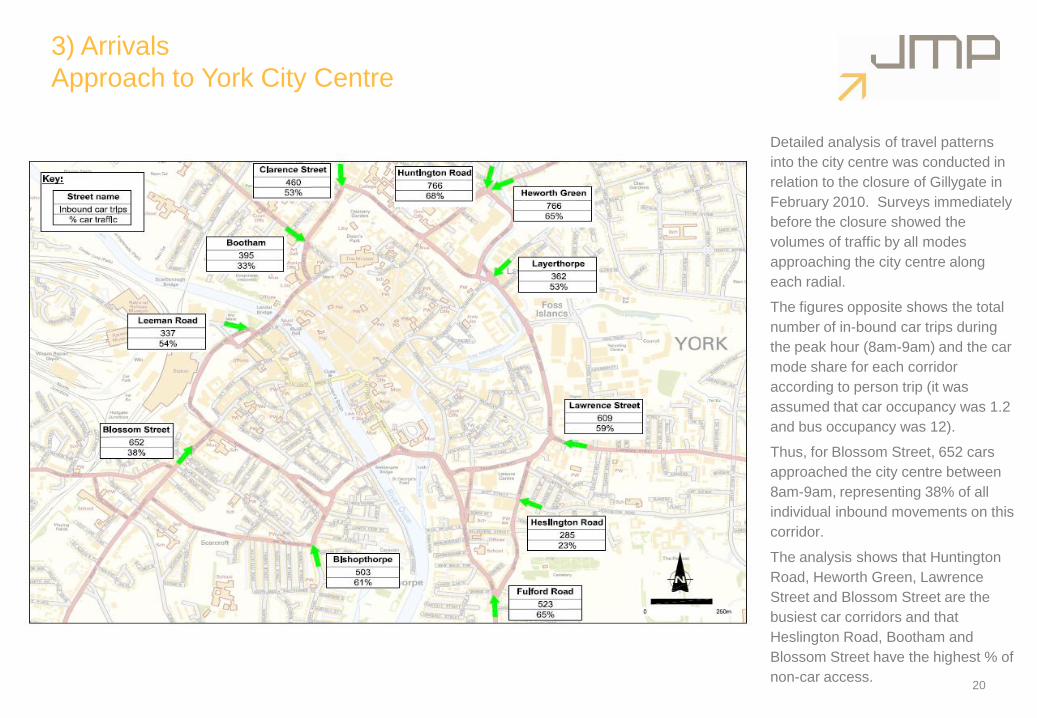
Detailed analysis of travel patterns
into the city centre was conducted in
relation to the closure of Gillygate in
February 2010. Surveys immediately
before the closure showed the
volumes of traffic by all modes
approaching the city centre along
each radial.
The figures opposite shows the total
number of in-bound car trips during
the peak hour (8am-9am) and the car
mode share for each corridor
according to person trip (it was
assumed that car occupancy was 1.2
and bus occupancy was 12).
Thus, for Blossom Street, 652 cars
approached the city centre between
8am-9am, representing 38% of all
individual inbound movements on this
corridor.
The analysis shows that Huntington
Road, Heworth Green, Lawrence
Street and Blossom Street are the
busiest car corridors and that
Heslington Road, Bootham and
Blossom Street have the highest % of
non-car access.
3) Arrivals
Approach to York City Centre
21
0
500
1000
1500
2000
2500
Su
rveyed
tri
ps
8am-9am Inbound Trips by Corridor
Ped
P/cycle
M/cycle
Bus
HGV
LGV
Car
(Assumes car occupancy of 1.2 and bus occupancy of 12)
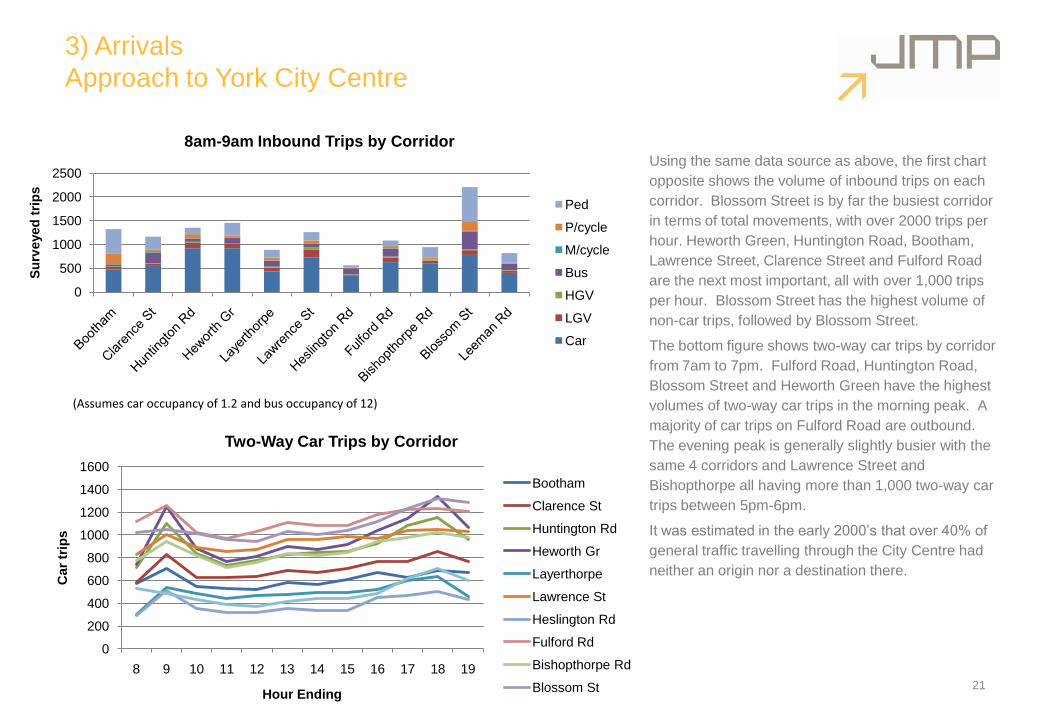
Using the same data source as above, the first chart
opposite shows the volume of inbound trips on each
corridor. Blossom Street is by far the busiest corridor
in terms of total movements, with over 2000 trips per
hour. Heworth Green, Huntington Road, Bootham,
Lawrence Street, Clarence Street and Fulford Road
are the next most important, all with over 1,000 trips
per hour. Blossom Street has the highest volume of
non-car trips, followed by Blossom Street.
The bottom figure shows two-way car trips by corridor
from 7am to 7pm. Fulford Road, Huntington Road,
Blossom Street and Heworth Green have the highest
volumes of two-way car trips in the morning peak. A
majority of car trips on Fulford Road are outbound.
The evening peak is generally slightly busier with the
same 4 corridors and Lawrence Street and
Bishopthorpe all having more than 1,000 two-way car
trips between 5pm-6pm.
It was estimated in the early 2000‟s that over 40% of
general traffic travelling through the City Centre had
neither an origin nor a destination there.
0
200
400
600
800
1000
1200
1400
1600
8 9 10 11 12 13 14 15 16 17 18 19
Car
trip
s
Hour Ending
Two-Way Car Trips by Corridor
Bootham
Clarence St
Huntington Rd
Heworth Gr
Layerthorpe
Lawrence St
Heslington Rd
Fulford Rd
Bishopthorpe Rd
Blossom St
3) Arrivals by car
Parking supply
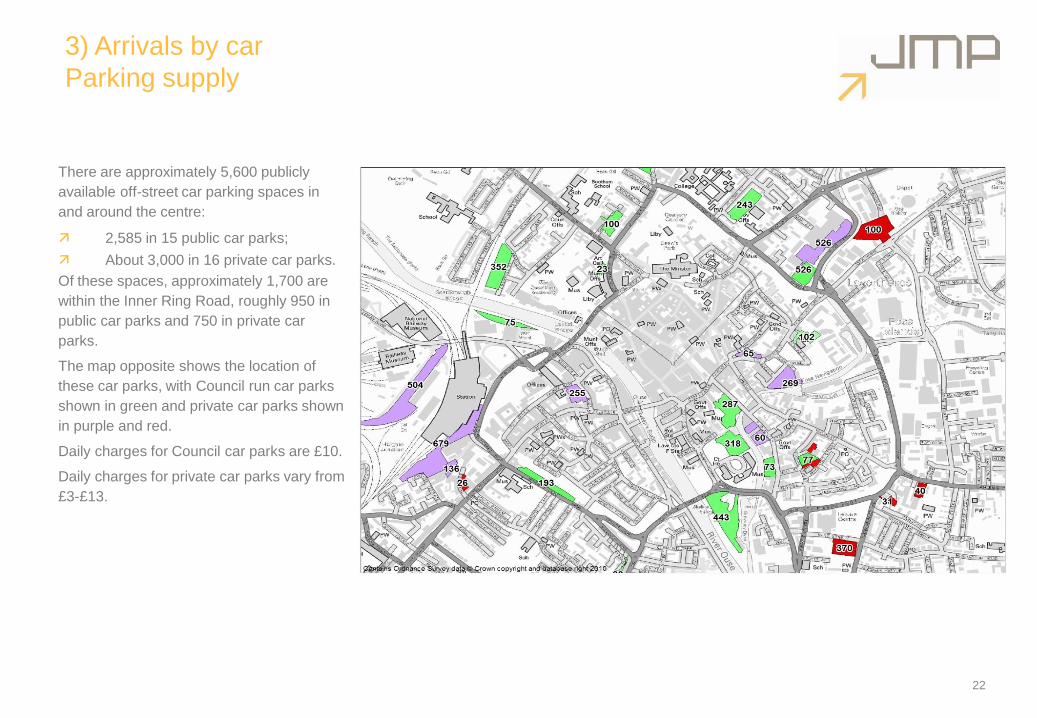
There are approximately 5,600 publicly
available off-street car parking spaces in
and around the centre:
2,585 in 15 public car parks;
About 3,000 in 16 private car parks.
Of these spaces, approximately 1,700 are
within the Inner Ring Road, roughly 950 in
public car parks and 750 in private car
parks.
The map opposite shows the location of
these car parks, with Council run car parks
shown in green and private car parks shown
in purple and red.
Daily charges for Council car parks are £10.
Daily charges for private car parks vary from
£3-£13.
.
22
23
3) Arrivals by car
Demand for parking
4 car parks have over 80% utilisation by 9am (The Crescent, Queen
Street, Piccadilly and the Railway Station (from 2008 data);
18 long-stay car parks have less than 50% utilisation by 9am;
Examination of live car parking utilisation data from CYC website
suggests that levels of use in 8 of the largest public car parks (with 1,840
spaces) is a maximum of approximately 60% on a November weekday.
A car park users survey was conducted by City of York in 2007 (CYC
2007 Car Park Users Survey).
The most popular activity stated by car park users was shopping (47%).
Only 7% of car park users stated that they were working.
47% of users stated that they parked in specific car park due to
convenience, though 37% of York residents chose the car park based
upon cost. Of the all day car parks surveyed (Foss Bank and Union
Terrace), 76% of those using Foss Bank stated that cost was their main
reason.
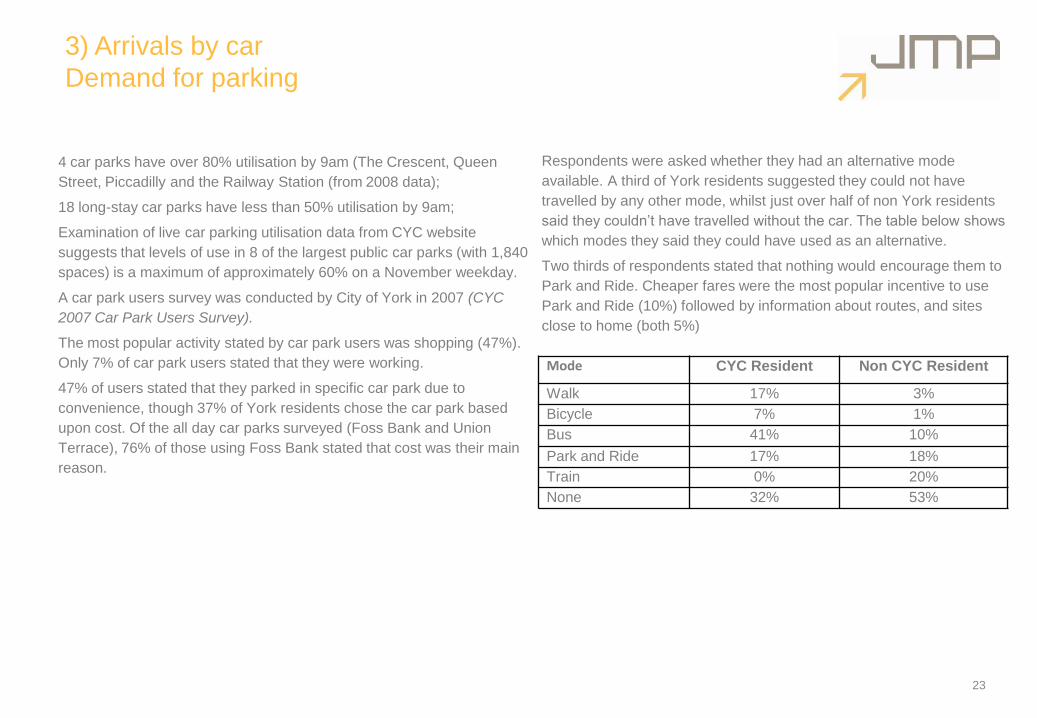
Mode CYC Resident Non CYC Resident
Walk 17% 3%
Bicycle 7% 1%
Bus 41% 10%
Park and Ride 17% 18%
Train 0% 20%
None 32% 53%
Respondents were asked whether they had an alternative mode
available. A third of York residents suggested they could not have
travelled by any other mode, whilst just over half of non York residents
said they couldn‟t have travelled without the car. The table below shows
which modes they said they could have used as an alternative.
Two thirds of respondents stated that nothing would encourage them to
Park and Ride. Cheaper fares were the most popular incentive to use
Park and Ride (10%) followed by information about routes, and sites
close to home (both 5%)
3) Arrivals by car
Demand for parking
24
0
20,000
40,000
60,000
80,000
100,000
120,000
140,000
160,000
180,000
2008/09
2009/10
2010/11
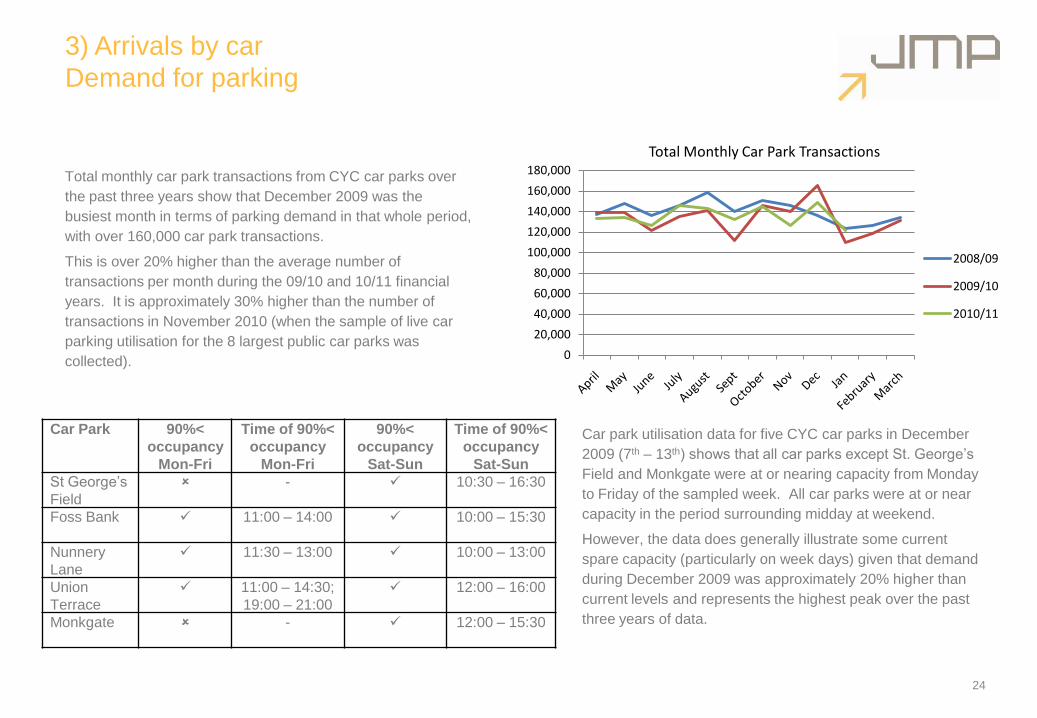
Total Monthly Car Park Transactions
Total monthly car park transactions from CYC car parks over
the past three years show that December 2009 was the
busiest month in terms of parking demand in that whole period,
with over 160,000 car park transactions.
This is over 20% higher than the average number of
transactions per month during the 09/10 and 10/11 financial
years. It is approximately 30% higher than the number of
transactions in November 2010 (when the sample of live car
parking utilisation for the 8 largest public car parks was
collected).
Car Park 90%<
occupancy
Mon-Fri
Time of 90%<
occupancy
Mon-Fri
90%<
occupancy
Sat-Sun
Time of 90%<
occupancy
Sat-Sun
St George‟s
Field
- 10:30 – 16:30
Foss Bank 11:00 – 14:00 10:00 – 15:30
Nunnery
Lane
11:30 – 13:00 10:00 – 13:00
Union
Terrace
11:00 – 14:30;
19:00 – 21:00
12:00 – 16:00
Monkgate - 12:00 – 15:30
Car park utilisation data for five CYC car parks in December
2009 (7th – 13th) shows that all car parks except St. George‟s
Field and Monkgate were at or nearing capacity from Monday
to Friday of the sampled week. All car parks were at or near
capacity in the period surrounding midday at weekend.
However, the data does generally illustrate some current
spare capacity (particularly on week days) given that demand
during December 2009 was approximately 20% higher than
current levels and represents the highest peak over the past
three years of data.
3) Arrivals by bus
Bus network
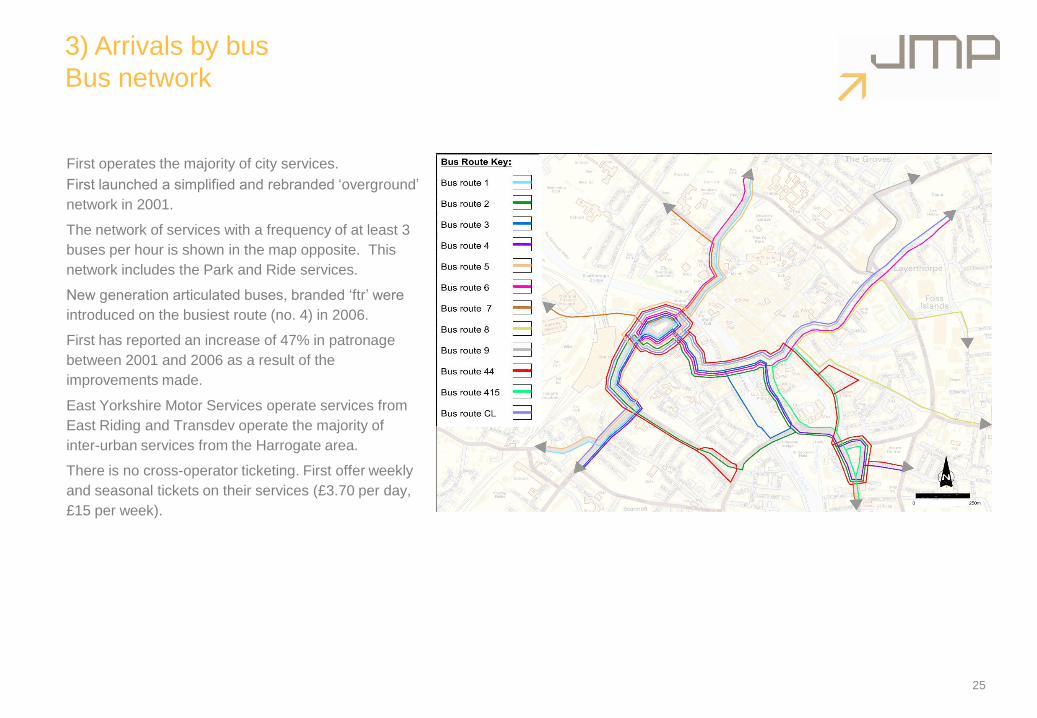
First operates the majority of city services.
First launched a simplified and rebranded „overground‟
network in 2001.
The network of services with a frequency of at least 3
buses per hour is shown in the map opposite. This
network includes the Park and Ride services.
New generation articulated buses, branded „ftr‟ were
introduced on the busiest route (no. 4) in 2006.
First has reported an increase of 47% in patronage
between 2001 and 2006 as a result of the
improvements made.
East Yorkshire Motor Services operate services from
East Riding and Transdev operate the majority of
inter-urban services from the Harrogate area.
There is no cross-operator ticketing. First offer weekly
and seasonal tickets on their services (£3.70 per day,
£15 per week).
25
3) Arrivals by bus
Frequencies by corridor and link
Route No. daytime services
per hour (one way)
Mount Vale 22
Holgate Road 14
Leeman Road 10
Bootham 8
Gillygate 18
Fossbank 10
Layerthorpe 12
Lawrence Street 9
Heslington Road 11
Fulford Road 15
Bishopthorpe Road 2
TOTAL 131
26
Interchange point No. daytime services
per hour (one way)
Railway station 41
St. Leonards Place 20
Rougier Street 49
Low Ousegate 31
Piccadilly 18
The Stonebow 16
Merchant Gate 9
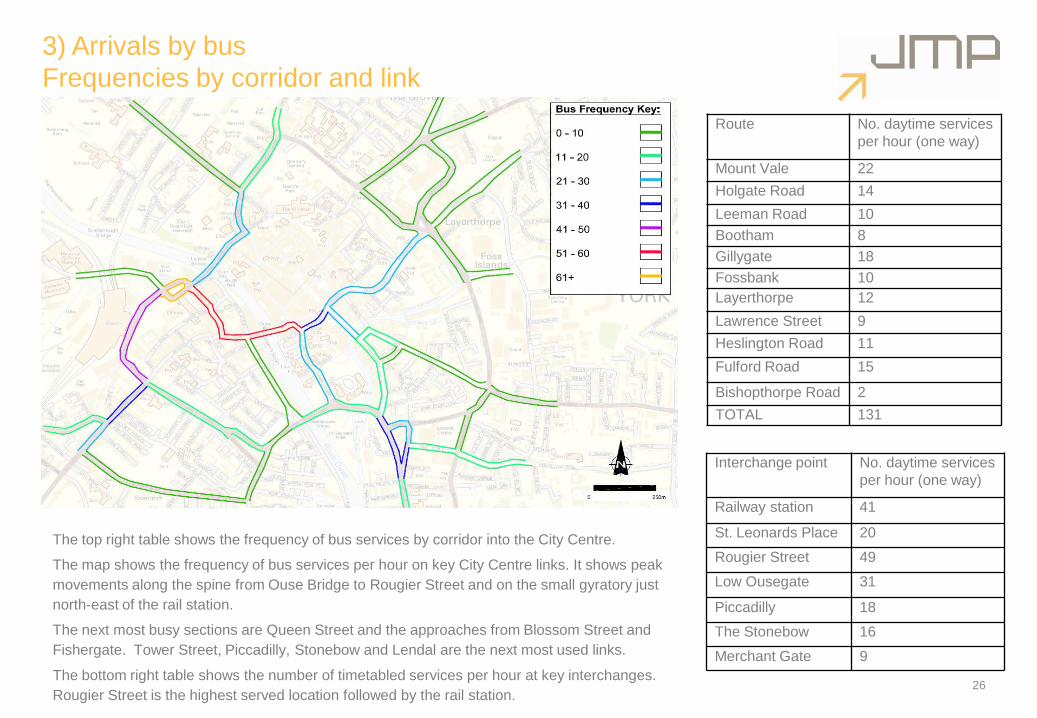
The top right table shows the frequency of bus services by corridor into the City Centre.
The map shows the frequency of bus services per hour on key City Centre links. It shows peak
movements along the spine from Ouse Bridge to Rougier Street and on the small gyratory just
north-east of the rail station.
The next most busy sections are Queen Street and the approaches from Blossom Street and
Fishergate. Tower Street, Piccadilly, Stonebow and Lendal are the next most used links.
The bottom right table shows the number of timetabled services per hour at key interchanges.
Rougier Street is the highest served location followed by the rail station.
3) Arrivals by bus
Bus stop usage
27
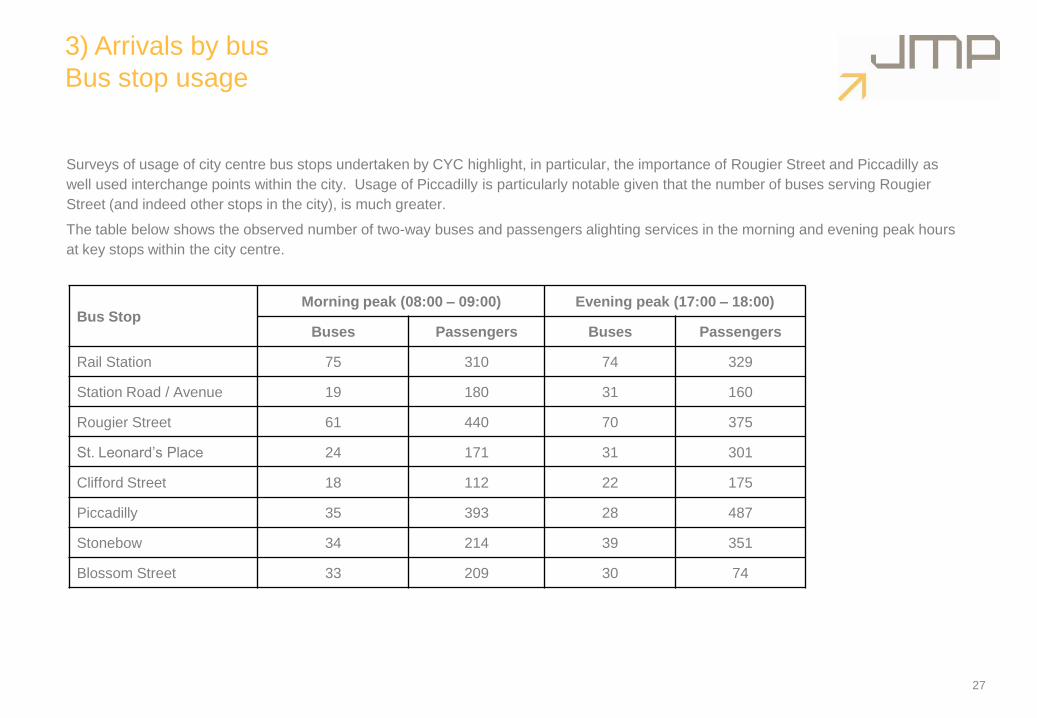
Surveys of usage of city centre bus stops undertaken by CYC highlight, in particular, the importance of Rougier Street and Piccadilly as
well used interchange points within the city. Usage of Piccadilly is particularly notable given that the number of buses serving Rougier
Street (and indeed other stops in the city), is much greater.
The table below shows the observed number of two-way buses and passengers alighting services in the morning and evening peak hours
at key stops within the city centre.
Bus StopMorning peak (08:00 – 09:00) Evening peak (17:00 – 18:00)
Buses Passengers Buses Passengers
Rail Station 75 310 74 329
Station Road / Avenue 19 180 31 160
Rougier Street 61 440 70 375
St. Leonard‟s Place 24 171 31 301
Clifford Street 18 112 22 175
Piccadilly 35 393 28 487
Stonebow 34 214 39 351
Blossom Street 33 209 30 74
28
3) Arrivals by bus
Demand
From Census: includes P&R
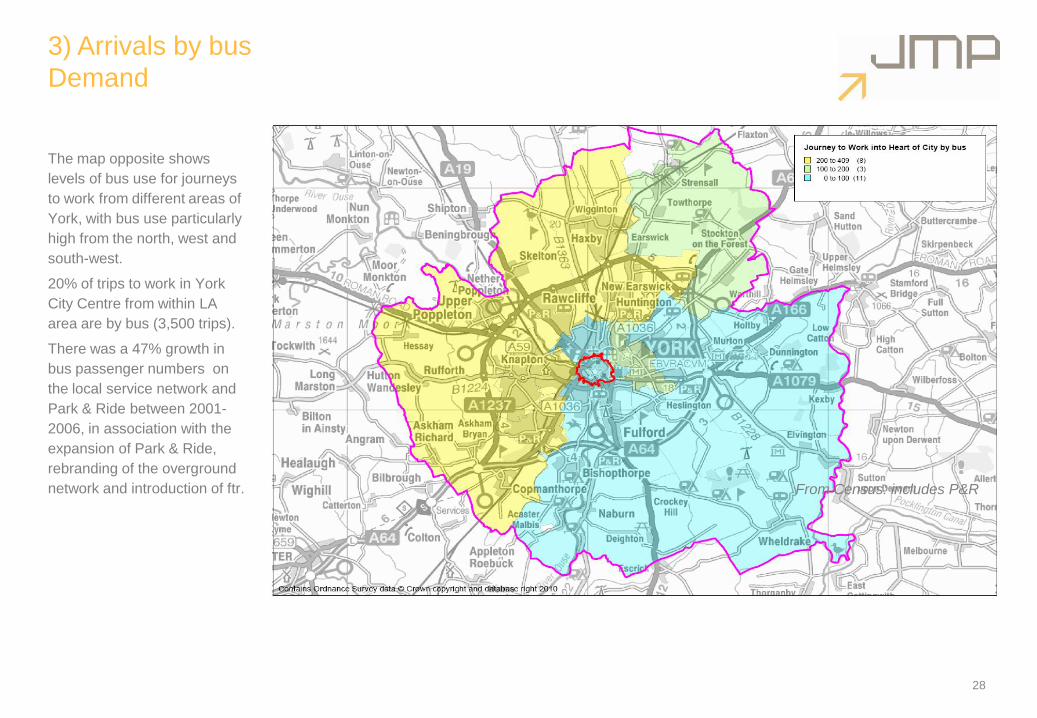
The map opposite shows
levels of bus use for journeys
to work from different areas of
York, with bus use particularly
high from the north, west and
south-west.
20% of trips to work in York
City Centre from within LA
area are by bus (3,500 trips).
There was a 47% growth in
bus passenger numbers on
the local service network and
Park & Ride between 2001-
2006, in association with the
expansion of Park & Ride,
rebranding of the overground
network and introduction of ftr.
3) Arrivals by Park & Ride
Supply
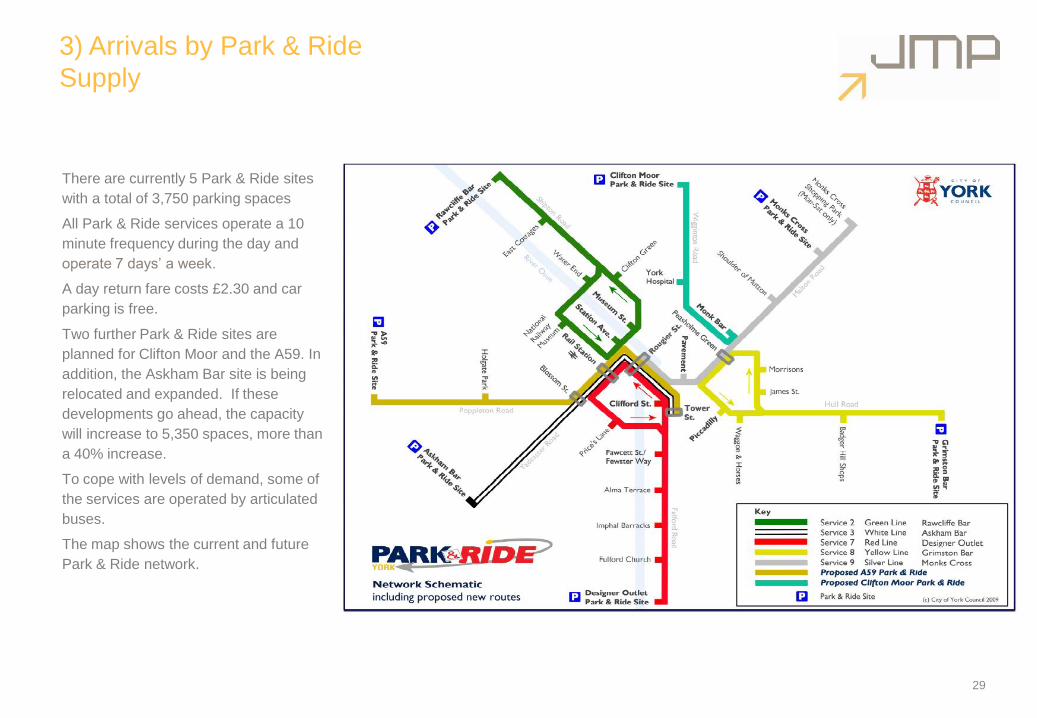
There are currently 5 Park & Ride sites
with a total of 3,750 parking spaces
All Park & Ride services operate a 10
minute frequency during the day and
operate 7 days‟ a week.
A day return fare costs £2.30 and car
parking is free.
Two further Park & Ride sites are
planned for Clifton Moor and the A59. In
addition, the Askham Bar site is being
relocated and expanded. If these
developments go ahead, the capacity
will increase to 5,350 spaces, more than
a 40% increase.
To cope with levels of demand, some of
the services are operated by articulated
buses.
The map shows the current and future
Park & Ride network.
29
3) Park & Ride
Demand
30Source: Access York MSBC. Note: Data excludes any non-P&R
passengers using services on corridors
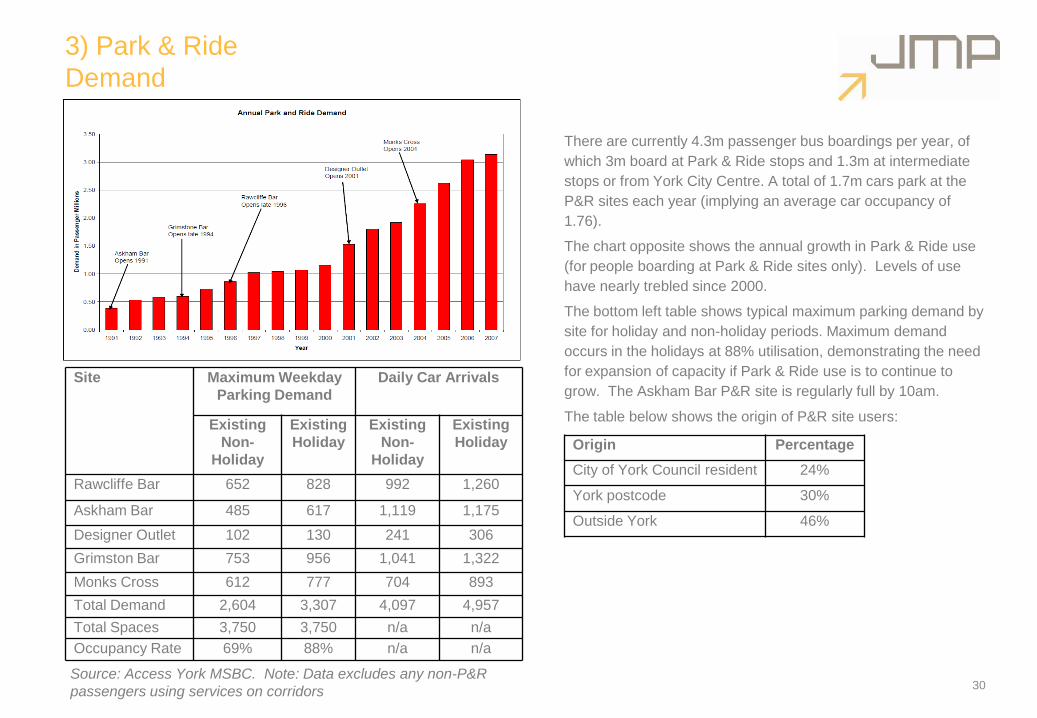
There are currently 4.3m passenger bus boardings per year, of
which 3m board at Park & Ride stops and 1.3m at intermediate
stops or from York City Centre. A total of 1.7m cars park at the
P&R sites each year (implying an average car occupancy of
1.76).
The chart opposite shows the annual growth in Park & Ride use
(for people boarding at Park & Ride sites only). Levels of use
have nearly trebled since 2000.
The bottom left table shows typical maximum parking demand by
site for holiday and non-holiday periods. Maximum demand
occurs in the holidays at 88% utilisation, demonstrating the need
for expansion of capacity if Park & Ride use is to continue to
grow. The Askham Bar P&R site is regularly full by 10am.
The table below shows the origin of P&R site users:
Site Maximum Weekday
Parking Demand
Daily Car Arrivals
Existing
Non-
Holiday
Existing
Holiday
Existing
Non-
Holiday
Existing
Holiday
Rawcliffe Bar 652 828 992 1,260
Askham Bar 485 617 1,119 1,175
Designer Outlet 102 130 241 306
Grimston Bar 753 956 1,041 1,322
Monks Cross 612 777 704 893
Total Demand 2,604 3,307 4,097 4,957
Total Spaces 3,750 3,750 n/a n/a
Occupancy Rate 69% 88% n/a n/a
Origin Percentage
City of York Council resident 24%
York postcode 30%
Outside York 46%
31
3) Park & Ride
Journey Purpose, Frequency of use and Reasons for using
Park & Ride
1%
11%
55%
33%
City of York Council resident
1% 3%
79%
17%
Non-City of York Council resident
Other
Education
Shopping / leisure
Work
Source: CYC 2007 Park and Ride users survey
3
14
8
17
26
32
24
42
8
8
8
12
0 5 10 15 20 25 30 35 40 45
First time
At least once a month
At least once a fortnight
About once a week
Two to three times a week
At least five times a week
Percentage
Non-City of York Council
City of York Council
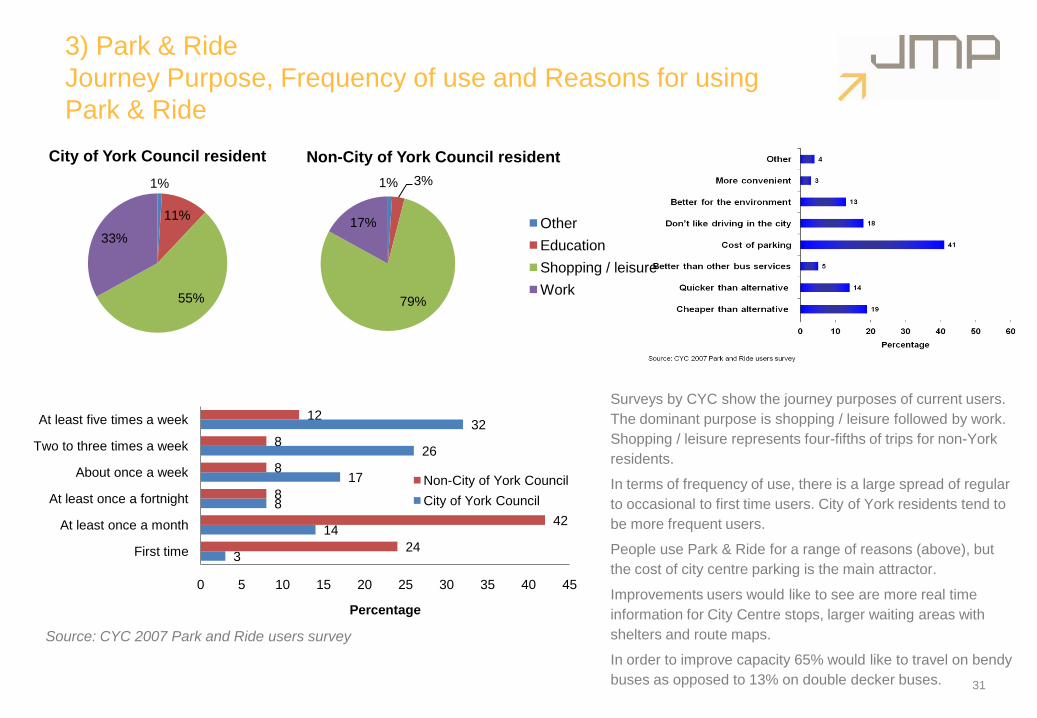
Surveys by CYC show the journey purposes of current users.
The dominant purpose is shopping / leisure followed by work.
Shopping / leisure represents four-fifths of trips for non-York
residents.
In terms of frequency of use, there is a large spread of regular
to occasional to first time users. City of York residents tend to
be more frequent users.
People use Park & Ride for a range of reasons (above), but
the cost of city centre parking is the main attractor.
Improvements users would like to see are more real time
information for City Centre stops, larger waiting areas with
shelters and route maps.
In order to improve capacity 65% would like to travel on bendy
buses as opposed to 13% on double decker buses.
3) Arrivals by coach and tourist bus operations
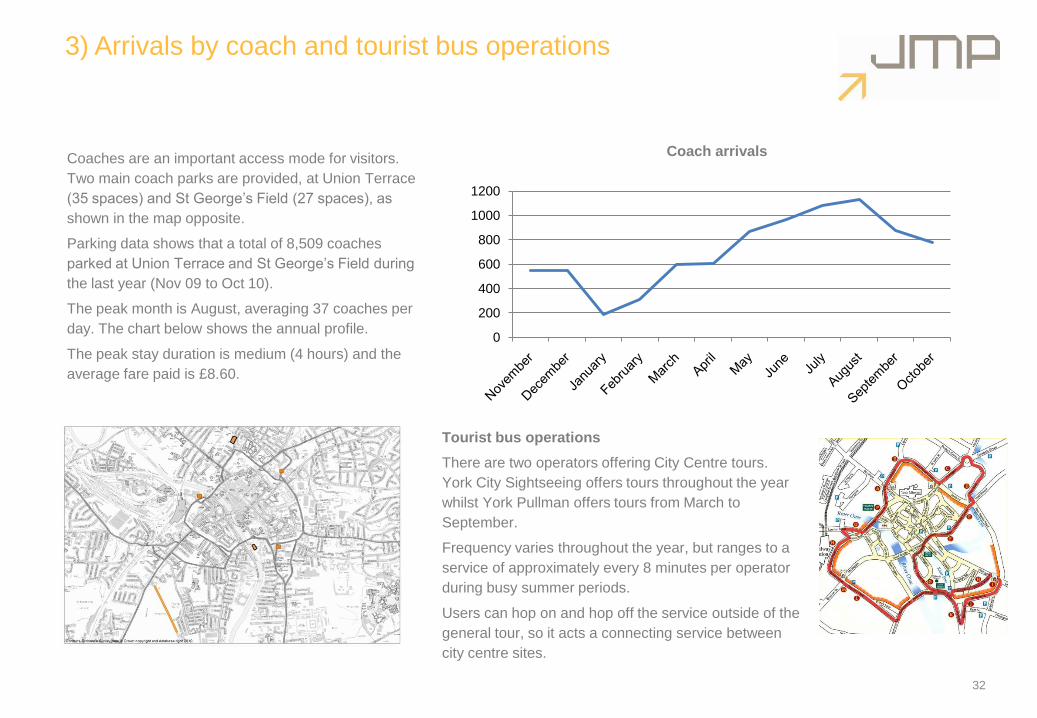
Coaches are an important access mode for visitors.
Two main coach parks are provided, at Union Terrace
(35 spaces) and St George‟s Field (27 spaces), as
shown in the map opposite.
Parking data shows that a total of 8,509 coaches
parked at Union Terrace and St George‟s Field during
the last year (Nov 09 to Oct 10).
The peak month is August, averaging 37 coaches per
day. The chart below shows the annual profile.
The peak stay duration is medium (4 hours) and the
average fare paid is £8.60.
32
0
200
400
600
800
1000
1200
Coach arrivals
Tourist bus operations
There are two operators offering City Centre tours.
York City Sightseeing offers tours throughout the year
whilst York Pullman offers tours from March to
September.
Frequency varies throughout the year, but ranges to a
service of approximately every 8 minutes per operator
during busy summer periods.
Users can hop on and hop off the service outside of the
general tour, so it acts a connecting service between
city centre sites.
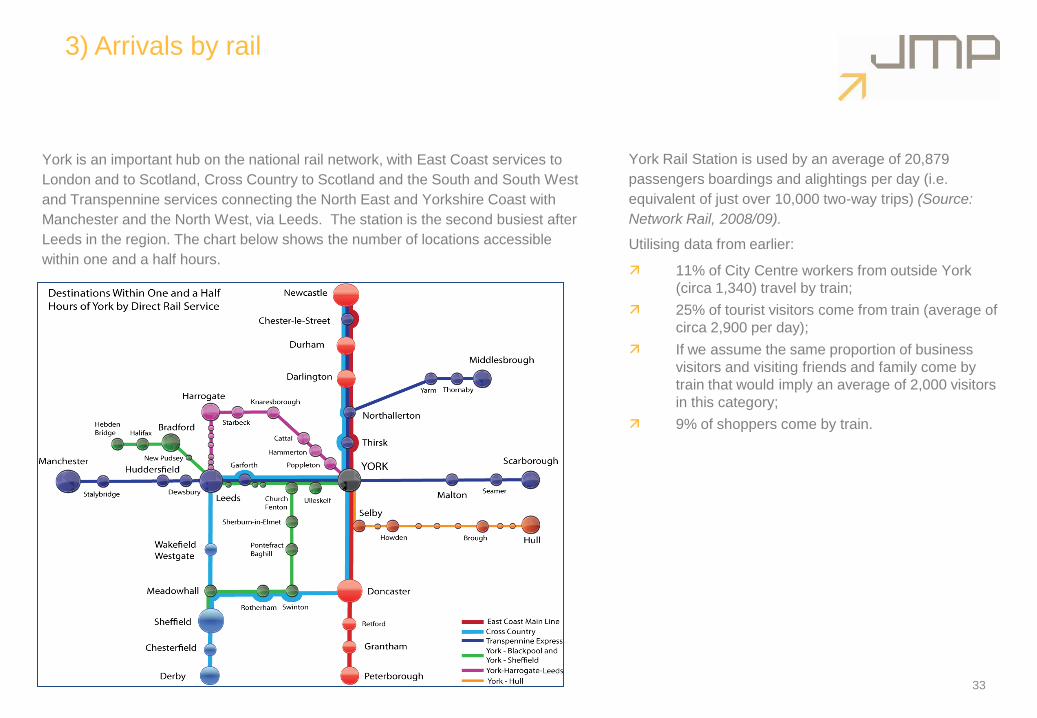
3) Arrivals by rail
York is an important hub on the national rail network, with East Coast services to
London and to Scotland, Cross Country to Scotland and the South and South West
and Transpennine services connecting the North East and Yorkshire Coast with
Manchester and the North West, via Leeds. The station is the second busiest after
Leeds in the region. The chart below shows the number of locations accessible
within one and a half hours.
.
York Rail Station is used by an average of 20,879
passengers boardings and alightings per day (i.e.
equivalent of just over 10,000 two-way trips) (Source:
Network Rail, 2008/09).
Utilising data from earlier:
11% of City Centre workers from outside York
(circa 1,340) travel by train;
25% of tourist visitors come from train (average of
circa 2,900 per day);
If we assume the same proportion of business
visitors and visiting friends and family come by
train that would imply an average of 2,000 visitors
in this category;
9% of shoppers come by train.
33
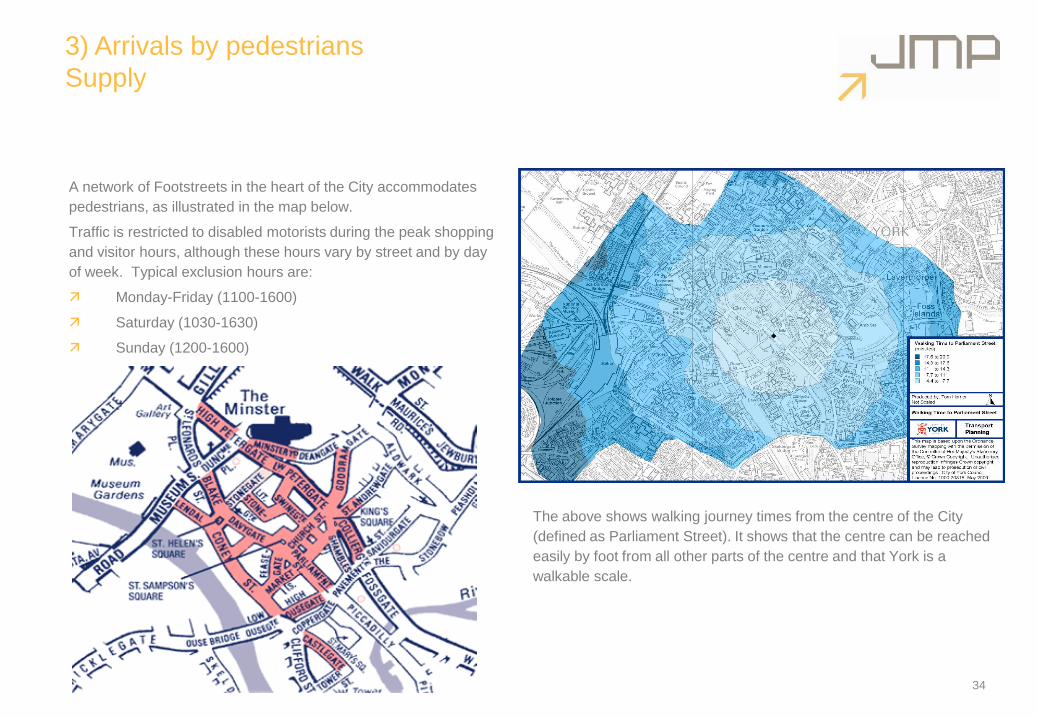
3) Arrivals by pedestrians
Supply
A network of Footstreets in the heart of the City accommodates
pedestrians, as illustrated in the map below.
Traffic is restricted to disabled motorists during the peak shopping
and visitor hours, although these hours vary by street and by day
of week. Typical exclusion hours are:
Monday-Friday (1100-1600)
Saturday (1030-1630)
Sunday (1200-1600)
34
The above shows walking journey times from the centre of the City
(defined as Parliament Street). It shows that the centre can be reached
easily by foot from all other parts of the centre and that York is a
walkable scale.
35
3) Arrivals by pedestrians
Demand
0
200
400
600
800
1000
1200
8 9 10 11 12 13 14 15 16 17 18 19
Tw
o-w
ay p
ed
flo
ws
Hour ending
Bootham
Clarence St
Huntington Rd
Heworth Gr
Layerthorpe
Lawrence St
Heslington Rd
Fulford Rd
Bishopthorpe Rd
Blossom St
Leeman Rd
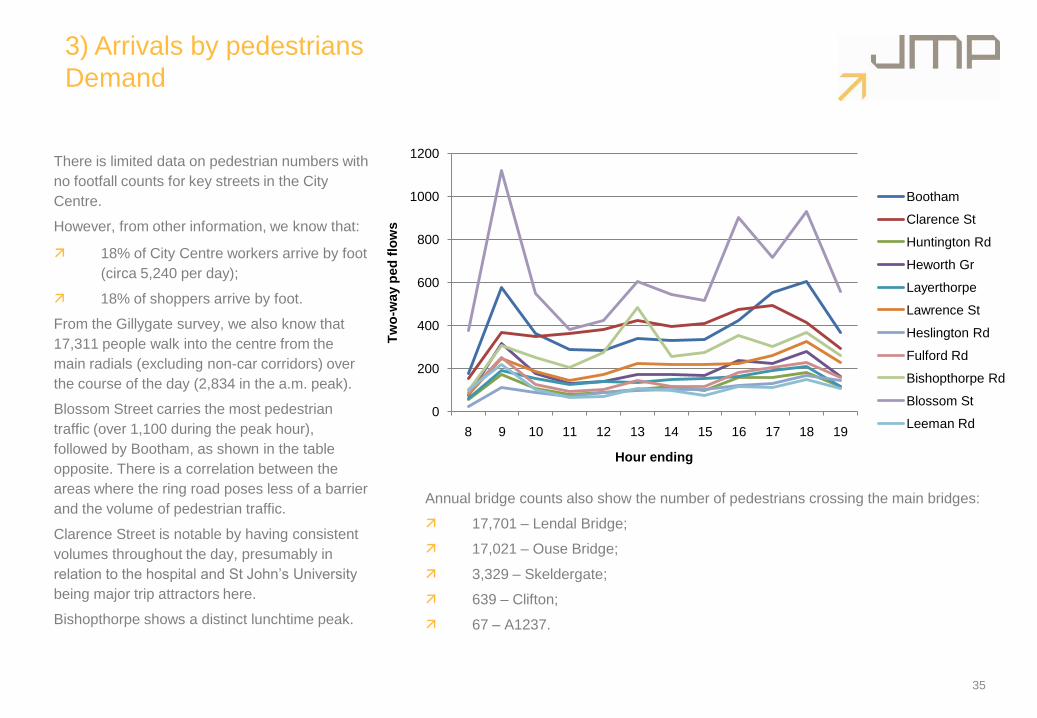
There is limited data on pedestrian numbers with
no footfall counts for key streets in the City
Centre.
However, from other information, we know that:
18% of City Centre workers arrive by foot
(circa 5,240 per day);
18% of shoppers arrive by foot.
From the Gillygate survey, we also know that
17,311 people walk into the centre from the
main radials (excluding non-car corridors) over
the course of the day (2,834 in the a.m. peak).
Blossom Street carries the most pedestrian
traffic (over 1,100 during the peak hour),
followed by Bootham, as shown in the table
opposite. There is a correlation between the
areas where the ring road poses less of a barrier
and the volume of pedestrian traffic.
Clarence Street is notable by having consistent
volumes throughout the day, presumably in
relation to the hospital and St John‟s University
being major trip attractors here.
Bishopthorpe shows a distinct lunchtime peak.
Annual bridge counts also show the number of pedestrians crossing the main bridges:
17,701 – Lendal Bridge;
17,021 – Ouse Bridge;
3,329 – Skeldergate;
639 – Clifton;
67 – A1237.
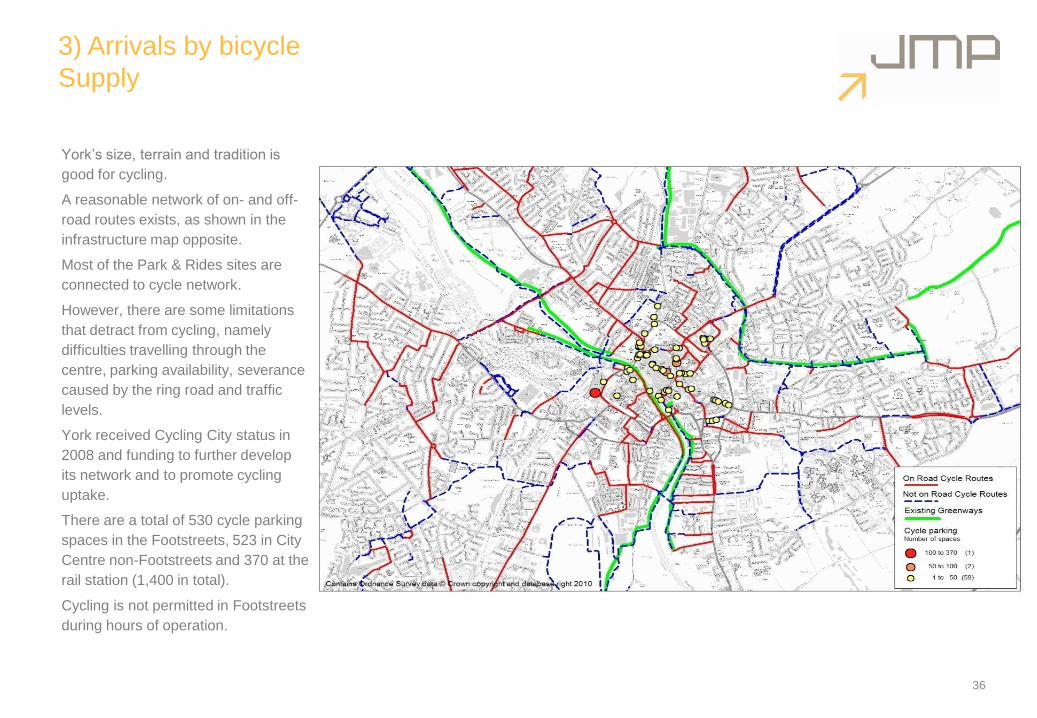
3) Arrivals by bicycle
Supply
36
York‟s size, terrain and tradition is
good for cycling.
A reasonable network of on- and off-
road routes exists, as shown in the
infrastructure map opposite.
Most of the Park & Rides sites are
connected to cycle network.
However, there are some limitations
that detract from cycling, namely
difficulties travelling through the
centre, parking availability, severance
caused by the ring road and traffic
levels.
York received Cycling City status in
2008 and funding to further develop
its network and to promote cycling
uptake.
There are a total of 530 cycle parking
spaces in the Footstreets, 523 in City
Centre non-Footstreets and 370 at the
rail station (1,400 in total).
Cycling is not permitted in Footstreets
during hours of operation.
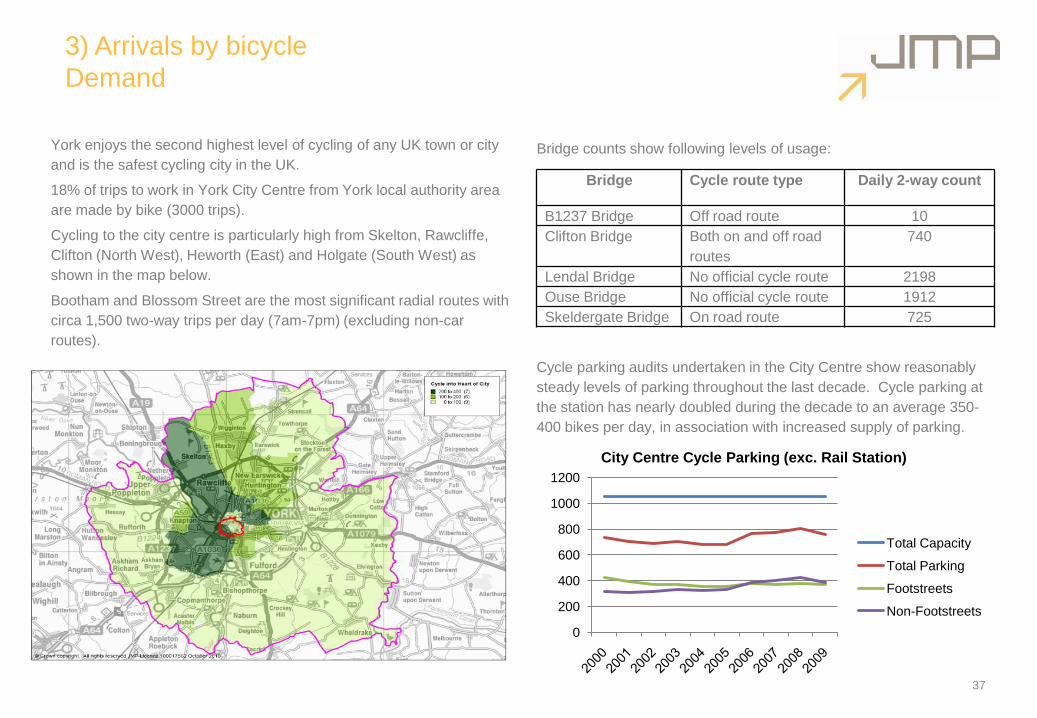
3) Arrivals by bicycle
Demand
Bridge counts show following levels of usage:
Cycle parking audits undertaken in the City Centre show reasonably
steady levels of parking throughout the last decade. Cycle parking at
the station has nearly doubled during the decade to an average 350-
400 bikes per day, in association with increased supply of parking.
Bridge Cycle route type Daily 2-way count
B1237 Bridge Off road route 10
Clifton Bridge Both on and off road
routes
740
Lendal Bridge No official cycle route 2198
Ouse Bridge No official cycle route 1912
Skeldergate Bridge On road route 725
37
York enjoys the second highest level of cycling of any UK town or city
and is the safest cycling city in the UK.
18% of trips to work in York City Centre from York local authority area
are made by bike (3000 trips).
Cycling to the city centre is particularly high from Skelton, Rawcliffe,
Clifton (North West), Heworth (East) and Holgate (South West) as
shown in the map below.
Bootham and Blossom Street are the most significant radial routes with
circa 1,500 two-way trips per day (7am-7pm) (excluding non-car
routes).
0
200
400
600
800
1000
1200
City Centre Cycle Parking (exc. Rail Station)
Total Capacity
Total Parking
Footstreets
Non-Footstreets
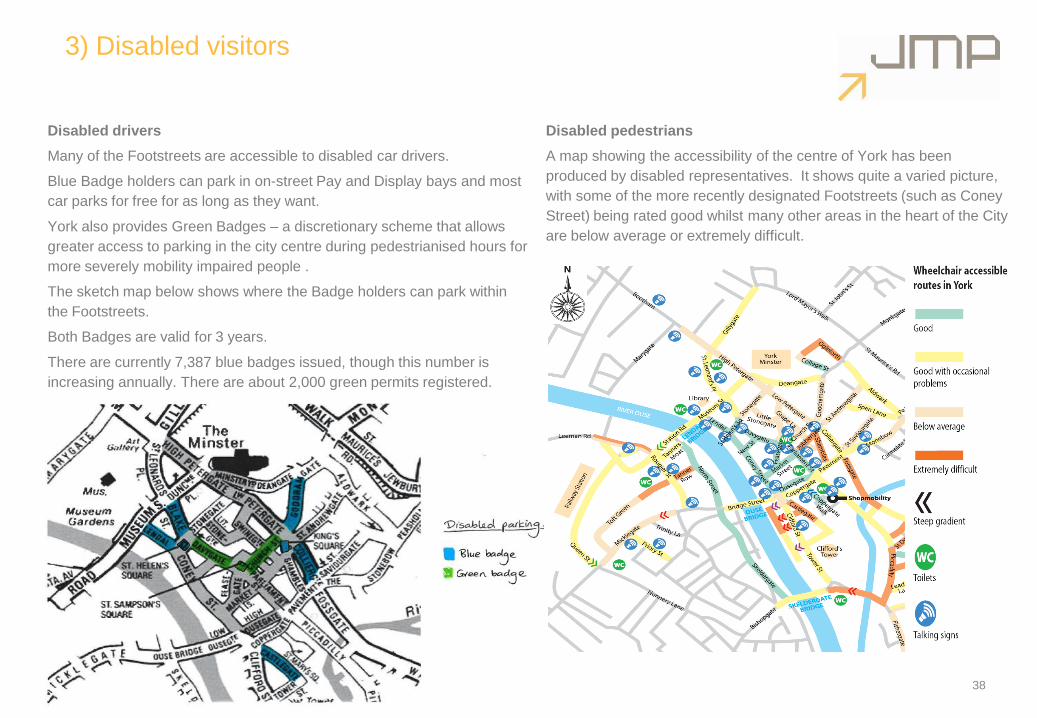
3) Disabled visitors
Disabled drivers
Many of the Footstreets are accessible to disabled car drivers.
Blue Badge holders can park in on-street Pay and Display bays and most
car parks for free for as long as they want.
York also provides Green Badges – a discretionary scheme that allows
greater access to parking in the city centre during pedestrianised hours for
more severely mobility impaired people .
The sketch map below shows where the Badge holders can park within
the Footstreets.
Both Badges are valid for 3 years.
There are currently 7,387 blue badges issued, though this number is
increasing annually. There are about 2,000 green permits registered.
38
Disabled pedestrians
A map showing the accessibility of the centre of York has been
produced by disabled representatives. It shows quite a varied picture,
with some of the more recently designated Footstreets (such as Coney
Street) being rated good whilst many other areas in the heart of the City
are below average or extremely difficult.
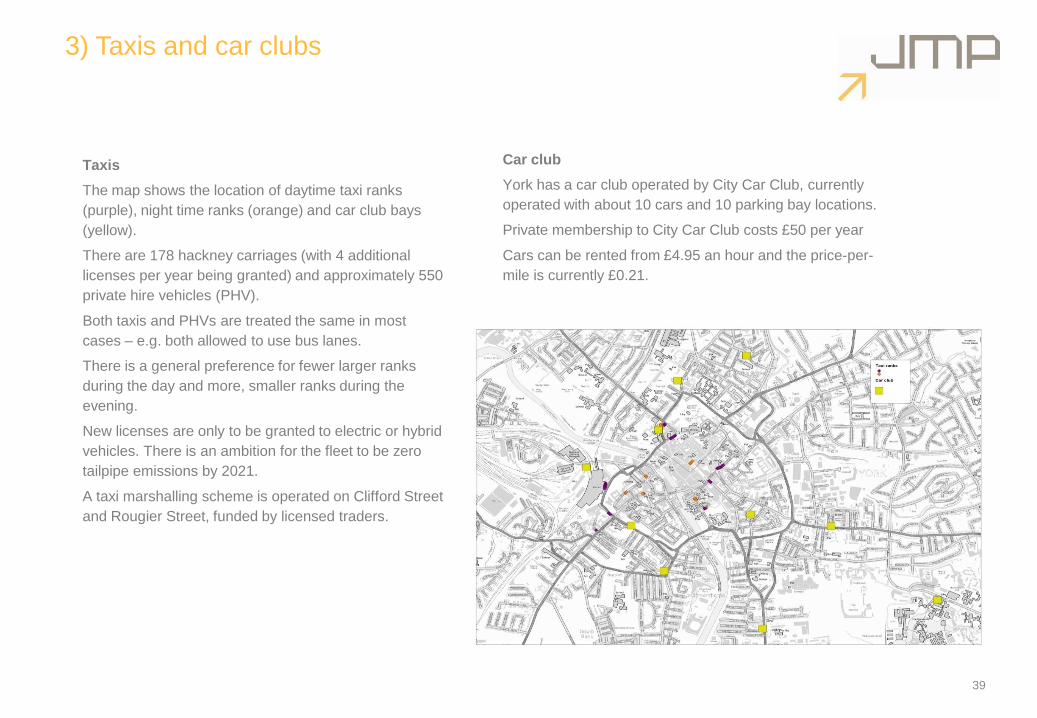
3) Taxis and car clubs
Taxis
The map shows the location of daytime taxi ranks
(purple), night time ranks (orange) and car club bays
(yellow).
There are 178 hackney carriages (with 4 additional
licenses per year being granted) and approximately 550
private hire vehicles (PHV).
Both taxis and PHVs are treated the same in most
cases – e.g. both allowed to use bus lanes.
There is a general preference for fewer larger ranks
during the day and more, smaller ranks during the
evening.
New licenses are only to be granted to electric or hybrid
vehicles. There is an ambition for the fleet to be zero
tailpipe emissions by 2021.
A taxi marshalling scheme is operated on Clifford Street
and Rougier Street, funded by licensed traders.
39
Car club
York has a car club operated by City Car Club, currently
operated with about 10 cars and 10 parking bay locations.
Private membership to City Car Club costs £50 per year
Cars can be rented from £4.95 an hour and the price-per-
mile is currently £0.21.
3) Servicing / deliveries / large vehicles in City Centre and
Air Quality
Servicing and deliveries
Servicing and deliveries are restricted in the Footstreets in line with
their operational hours (see page on Footstreets).
Large volumes of servicing occur immediately before and after the
Footstreets hours, causing some conflict with pedestrian movement
during this period.
Large vehicles in the City Centre
The inner ring road brings many large vehicles through the City
Centre, not necessarily all of which have a City Centre origin or
destination.
Lawrence Street has the greatest HGV flows (700 2-way vehicle
movements from 7am – 7pm).
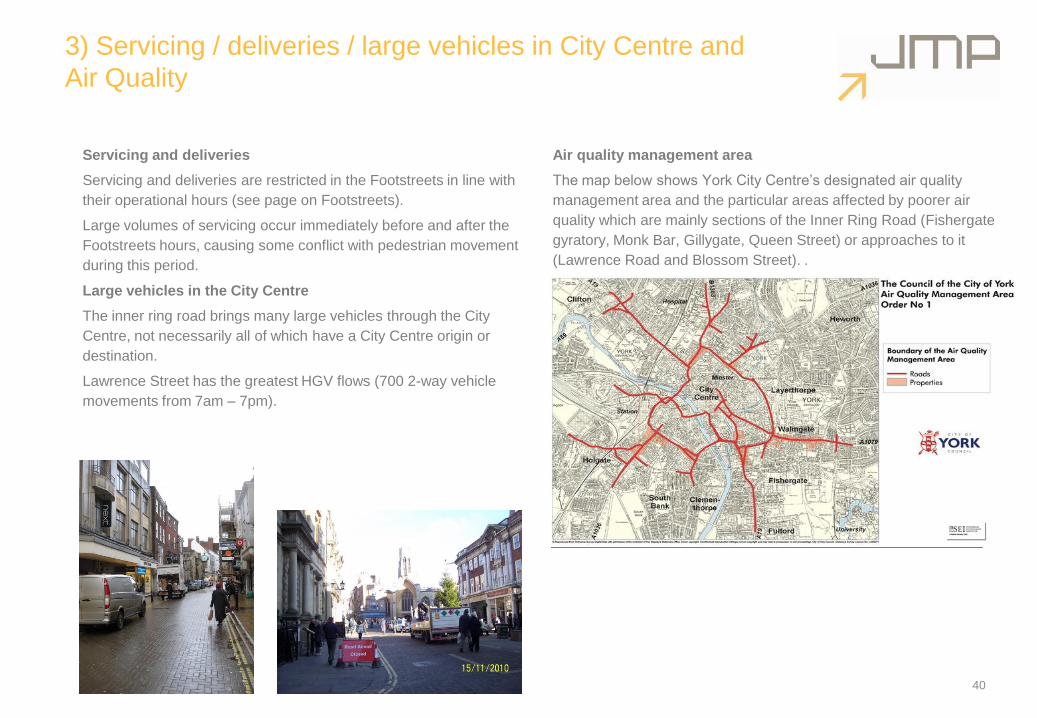
Air quality management area
The map below shows York City Centre‟s designated air quality
management area and the particular areas affected by poorer air
quality which are mainly sections of the Inner Ring Road (Fishergate
gyratory, Monk Bar, Gillygate, Queen Street) or approaches to it
(Lawrence Road and Blossom Street). .
40
3) Summary of overall movements to the city centre:
Arrivals AM peak
41
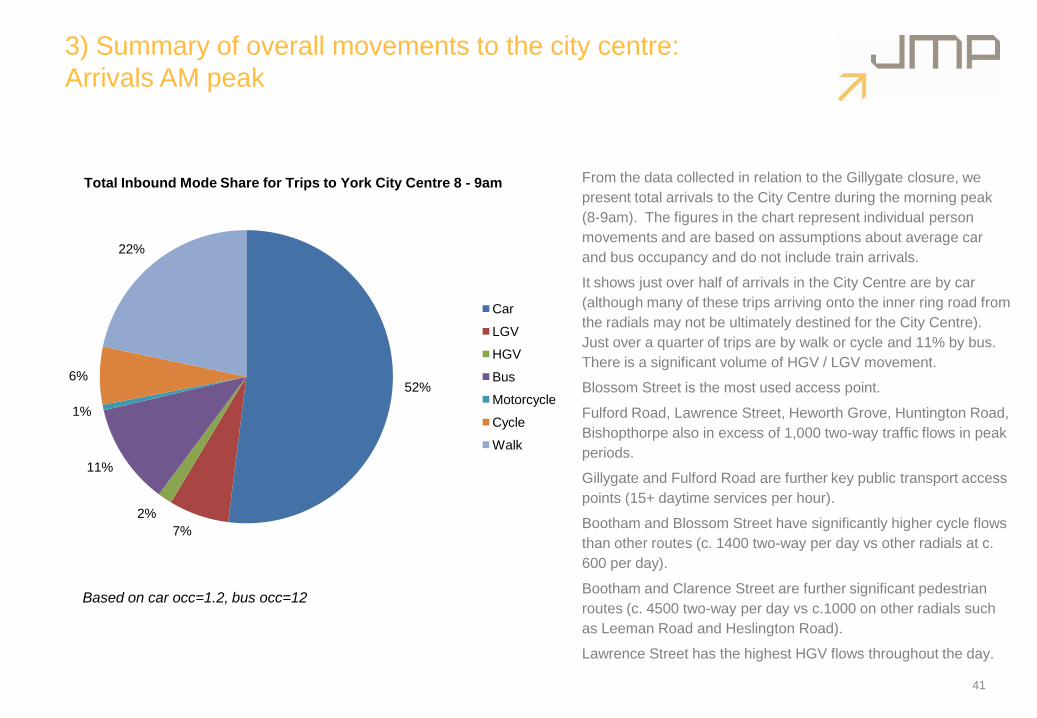
Based on car occ=1.2, bus occ=12
From the data collected in relation to the Gillygate closure, we
present total arrivals to the City Centre during the morning peak
(8-9am). The figures in the chart represent individual person
movements and are based on assumptions about average car
and bus occupancy and do not include train arrivals.
It shows just over half of arrivals in the City Centre are by car
(although many of these trips arriving onto the inner ring road from
the radials may not be ultimately destined for the City Centre).
Just over a quarter of trips are by walk or cycle and 11% by bus.
There is a significant volume of HGV / LGV movement.
Blossom Street is the most used access point.
Fulford Road, Lawrence Street, Heworth Grove, Huntington Road,
Bishopthorpe also in excess of 1,000 two-way traffic flows in peak
periods.
Gillygate and Fulford Road are further key public transport access
points (15+ daytime services per hour).
Bootham and Blossom Street have significantly higher cycle flows
than other routes (c. 1400 two-way per day vs other radials at c.
600 per day).
Bootham and Clarence Street are further significant pedestrian
routes (c. 4500 two-way per day vs c.1000 on other radials such
as Leeman Road and Heslington Road).
Lawrence Street has the highest HGV flows throughout the day.
52%
7%
2%
11%
1%
6%
22%
Total Inbound Mode Share for Trips to York City Centre 8 - 9am
Car
LGV
HGV
Bus
Motorcycle
Cycle
Walk
3) Comparison of daily mode share on bridges
42
25%
4%
1%
17%
1%12%
41%
50%
4%1%6%
0%
9%
30%
Lendal Bridge Ouse Bridge
Skeldergate Bridge
24%
4%
1%
31%1%
9%
31% Car
LGV
HGV
Bus
M/cycle
P/cycle
Ped
Source: from bridge counts. Based on car occ=1.2, bus occ=12
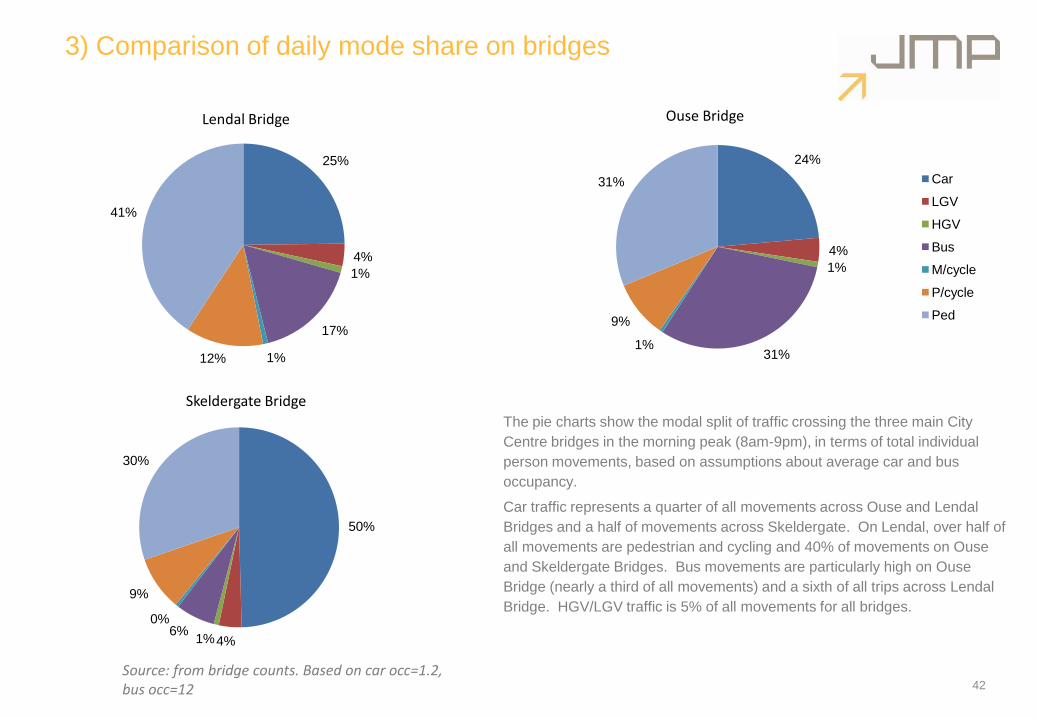
The pie charts show the modal split of traffic crossing the three main City
Centre bridges in the morning peak (8am-9pm), in terms of total individual
person movements, based on assumptions about average car and bus
occupancy.
Car traffic represents a quarter of all movements across Ouse and Lendal
Bridges and a half of movements across Skeldergate. On Lendal, over half of
all movements are pedestrian and cycling and 40% of movements on Ouse
and Skeldergate Bridges. Bus movements are particularly high on Ouse
Bridge (nearly a third of all movements) and a sixth of all trips across Lendal
Bridge. HGV/LGV traffic is 5% of all movements for all bridges.

Section Four:
Drivers of change
43
The Movement and Accessibility Framework
is looking over a twenty year period to 2030
and therefore it is important to identify and
understand the implications of likely
changes that might happen over this period
that may affect the nature of demand for
movement to and within the City Centre.
Most of these drivers provide support and
ratification for improving the quality of the
City Centre and promoting access by
sustainable modes and reducing car
access. For York, economic success
coincides with protecting and enhancing the
City Centre environment and quality of
place.
Major drivers for change include:
Demographic and economic changes
Population growth, with approximately
1,000 new residents per year anticipated;
An ageing population: Old age
dependency ratio will go from 25 in 2005
to 36 in 2030 (ratio of over 65 to 15-64);
Employment growth, with approximately
1,000 new jobs expected every year and
growing importance of knowledge-based
industries and tourism-related jobs;
Ambition to grow tourism: a target of 5%
growth per annum in tourist spend;
Ambition to increase retail floorspace and
market share in the City Centre;
Ambition for University to grow;
Major new developments in and around
the City Centre (see overleaf).
Social and lifestyle changes
Greater leisure time and disposable
income and more discretionary spending;
Renewed interest in local community,
quality of place, local produce and
consumption;
Strengthening awareness of and interest
in maintaining healthy lifestyles.
Environment
Worsening environmental risks of
flooding;
Air quality incidents in the City Centre
associated with extreme weather;
Strengthening concern with
environmental issues and commitment
towards protecting the environment.
Transport and Mobility
An older population, some with more
limited mobility;
Continued growth in walking and cycling,
as a lifestyle and healthy travel choice;
Growing acceptance of need to manage
car use, especially within the City Centre.
Real time network management via
urban traffic management systems fully
harnessed;
Ready access to travel information for all
modes (Real time information for public
transport and in-car; palm-held
applications for cyclists and pedestrians);
Integrated cashless public transport
ticketing through smartcards;
Fuel prices will increase and become
more volatile (Peak oil);
Low / zero emission vehicles significant
part of fleet.
4) Drivers of Change
23/05/2011 44
In 20 years time, people will look back and
say ‘look how funny they were, people
used to drive everywhere!’” Scott Adams,
Urban Design Skills.
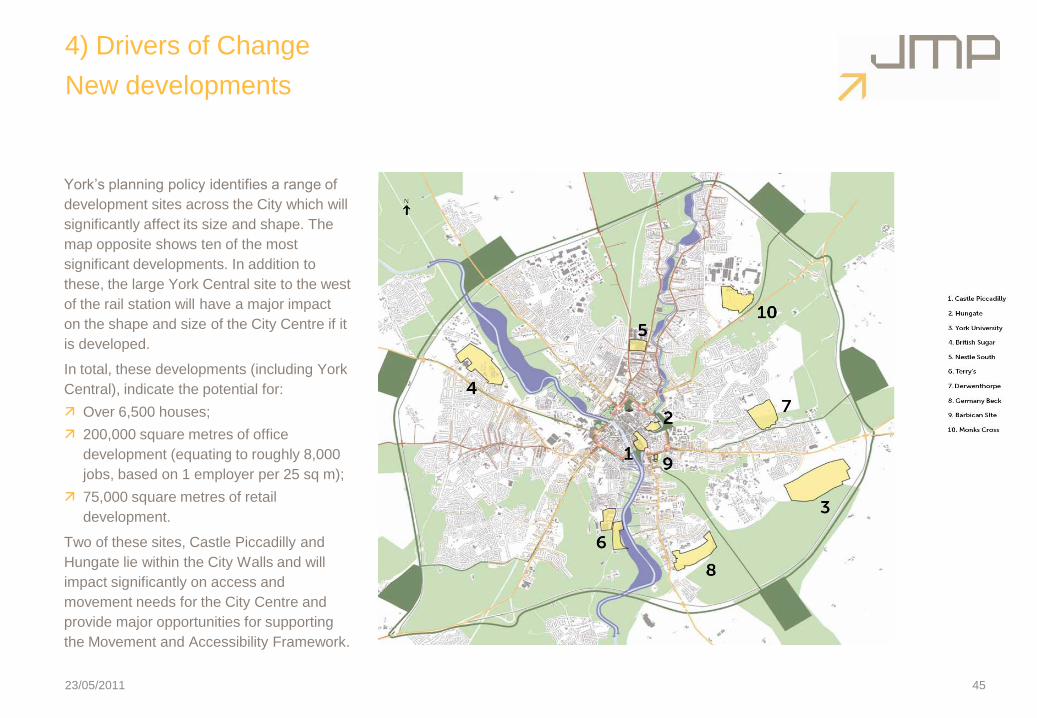
York‟s planning policy identifies a range of
development sites across the City which will
significantly affect its size and shape. The
map opposite shows ten of the most
significant developments. In addition to
these, the large York Central site to the west
of the rail station will have a major impact
on the shape and size of the City Centre if it
is developed.
In total, these developments (including York
Central), indicate the potential for:
Over 6,500 houses;
200,000 square metres of office
development (equating to roughly 8,000
jobs, based on 1 employer per 25 sq m);
75,000 square metres of retail
development.
Two of these sites, Castle Piccadilly and
Hungate lie within the City Walls and will
impact significantly on access and
movement needs for the City Centre and
provide major opportunities for supporting
the Movement and Accessibility Framework.
4) Drivers of Change
New developments
23/05/2011 45
4) Drivers of Change
New developments
46
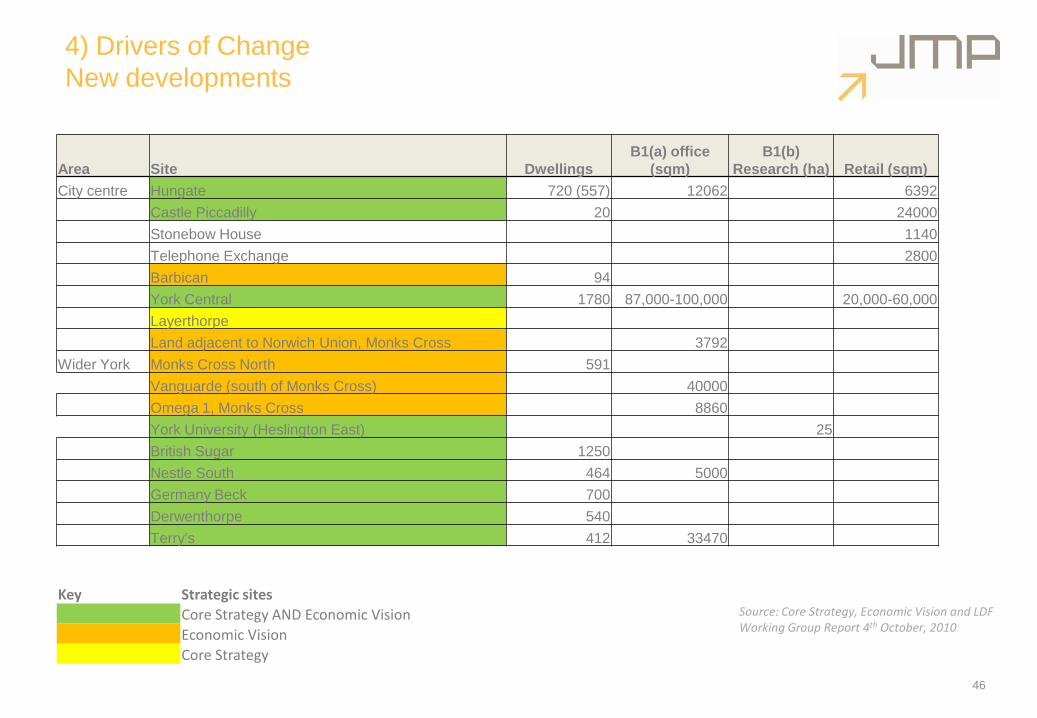
Area Site Dwellings
B1(a) office
(sqm)
B1(b)
Research (ha) Retail (sqm)
City centre Hungate 720 (557) 12062 6392
Castle Piccadilly 20 24000
Stonebow House 1140
Telephone Exchange 2800
Barbican 94
York Central 1780 87,000-100,000 20,000-60,000
Layerthorpe
Land adjacent to Norwich Union, Monks Cross 3792
Wider York Monks Cross North 591
Vanguarde (south of Monks Cross) 40000
Omega 1, Monks Cross 8860
York University (Heslington East) 25
British Sugar 1250
Nestle South 464 5000
Germany Beck 700
Derwenthorpe 540
Terry's 412 33470
Key Strategic sites
Core Strategy AND Economic Vision
Economic Vision
Core Strategy
Source: Core Strategy, Economic Vision and LDF Working Group Report 4th October, 2010
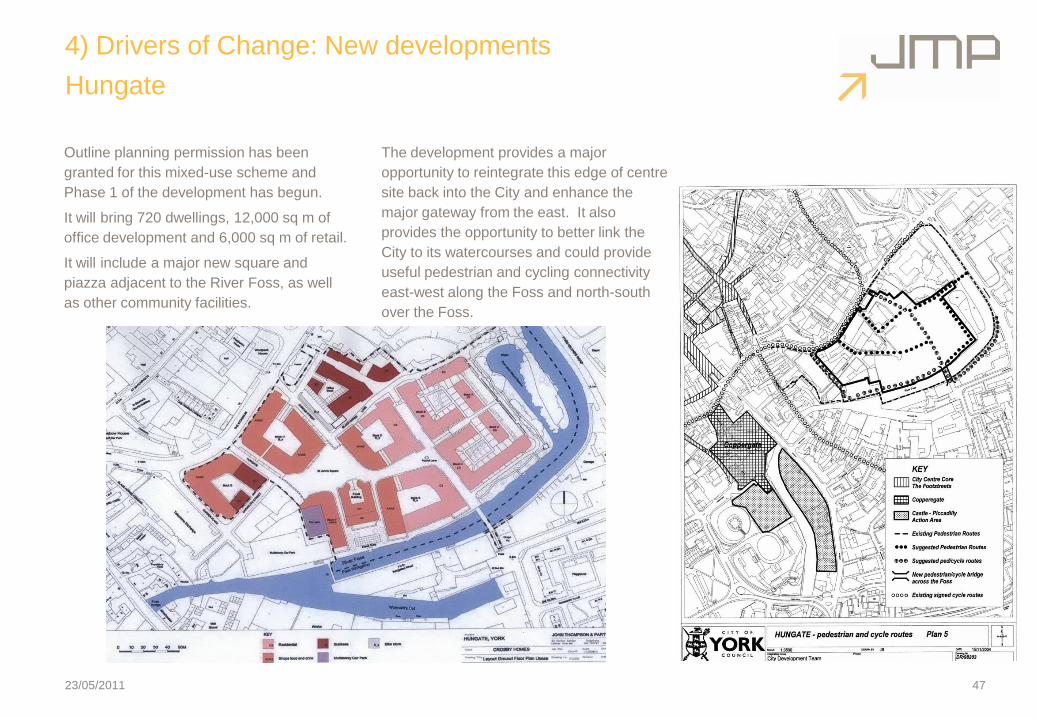
Outline planning permission has been
granted for this mixed-use scheme and
Phase 1 of the development has begun.
It will bring 720 dwellings, 12,000 sq m of
office development and 6,000 sq m of retail.
It will include a major new square and
piazza adjacent to the River Foss, as well
as other community facilities.
The development provides a major
opportunity to reintegrate this edge of centre
site back into the City and enhance the
major gateway from the east. It also
provides the opportunity to better link the
City to its watercourses and could provide
useful pedestrian and cycling connectivity
east-west along the Foss and north-south
over the Foss.
4) Drivers of Change: New developments
Hungate
23/05/2011 47
4) Drivers of Change: New developments
Castle Piccadilly
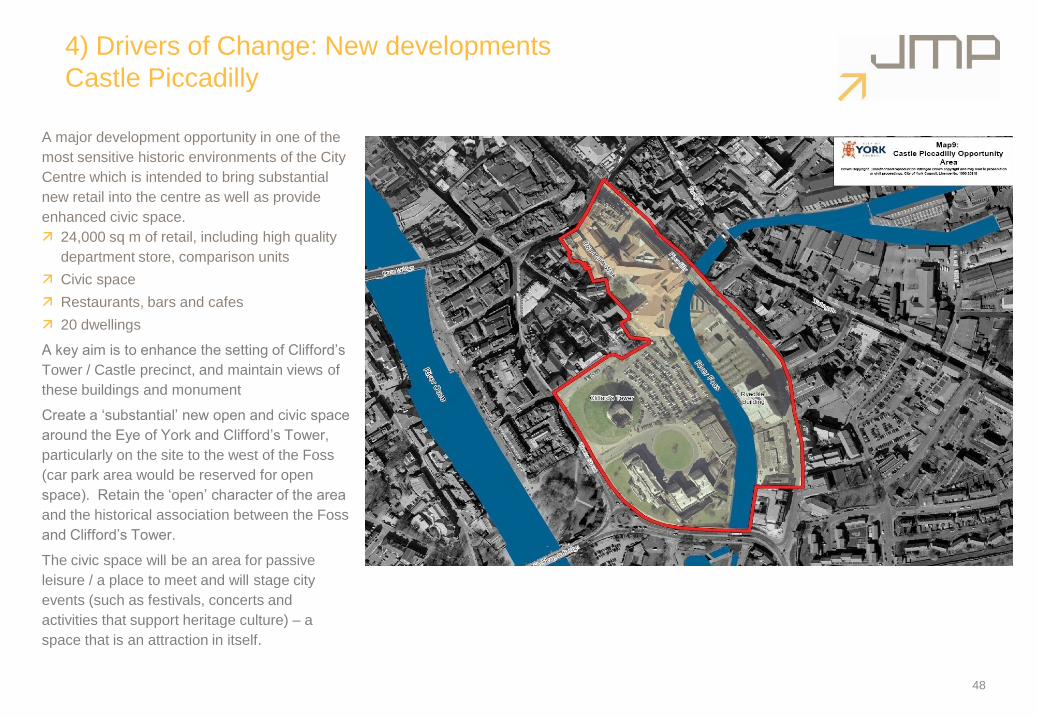
A major development opportunity in one of the
most sensitive historic environments of the City
Centre which is intended to bring substantial
new retail into the centre as well as provide
enhanced civic space.
24,000 sq m of retail, including high quality
department store, comparison units
Civic space
Restaurants, bars and cafes
20 dwellings
A key aim is to enhance the setting of Clifford‟s
Tower / Castle precinct, and maintain views of
these buildings and monument
Create a „substantial‟ new open and civic space
around the Eye of York and Clifford‟s Tower,
particularly on the site to the west of the Foss
(car park area would be reserved for open
space). Retain the „open‟ character of the area
and the historical association between the Foss
and Clifford‟s Tower.
The civic space will be an area for passive
leisure / a place to meet and will stage city
events (such as festivals, concerts and
activities that support heritage culture) – a
space that is an attraction in itself.
48
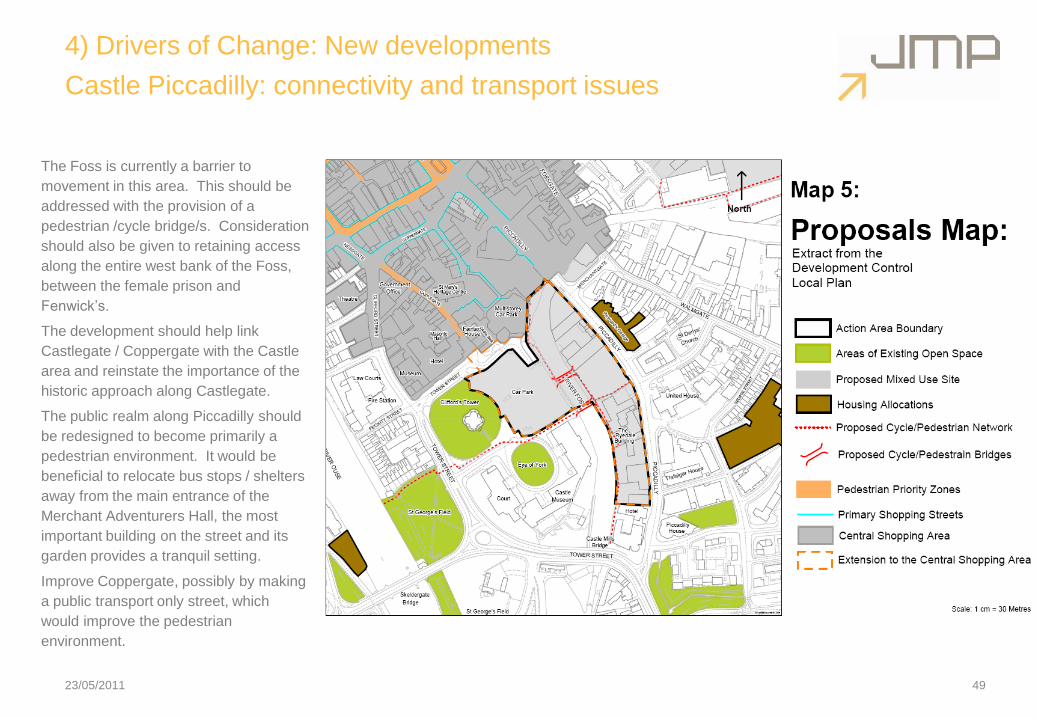
The Foss is currently a barrier to
movement in this area. This should be
addressed with the provision of a
pedestrian /cycle bridge/s. Consideration
should also be given to retaining access
along the entire west bank of the Foss,
between the female prison and
Fenwick‟s.
The development should help link
Castlegate / Coppergate with the Castle
area and reinstate the importance of the
historic approach along Castlegate.
The public realm along Piccadilly should
be redesigned to become primarily a
pedestrian environment. It would be
beneficial to relocate bus stops / shelters
away from the main entrance of the
Merchant Adventurers Hall, the most
important building on the street and its
garden provides a tranquil setting.
Improve Coppergate, possibly by making
a public transport only street, which
would improve the pedestrian
environment.
4) Drivers of Change: New developments
Castle Piccadilly: connectivity and transport issues
23/05/2011 49
4) Drivers of Change: New Developments
York North West
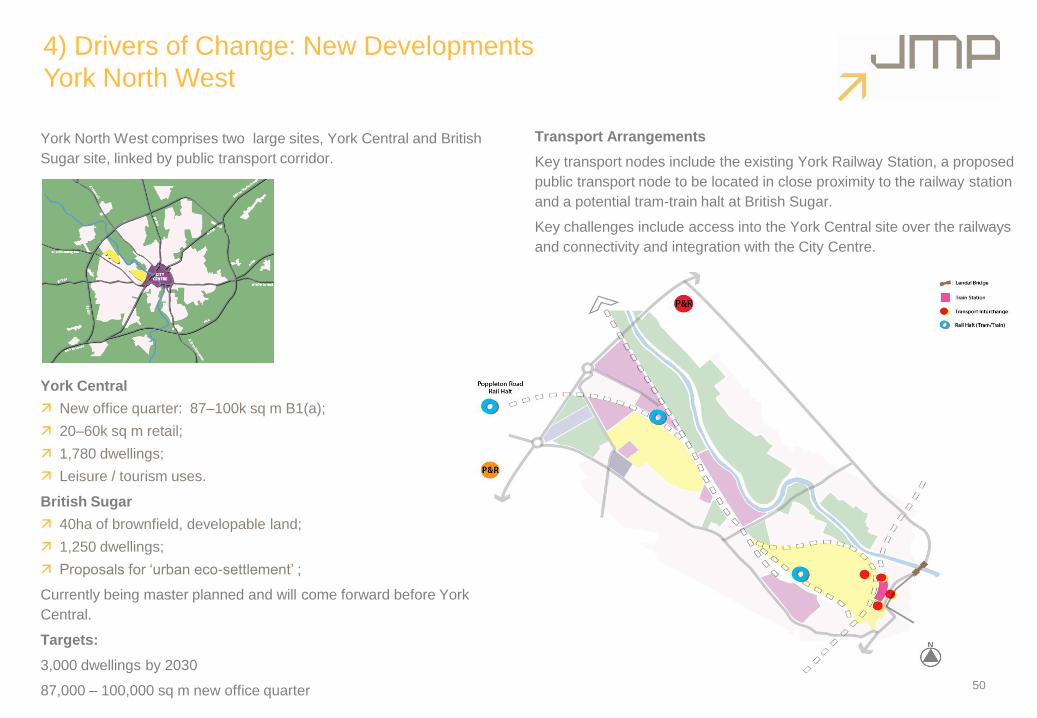
York North West comprises two large sites, York Central and British
Sugar site, linked by public transport corridor.
York Central
New office quarter: 87–100k sq m B1(a);
20–60k sq m retail;
1,780 dwellings;
Leisure / tourism uses.
British Sugar
40ha of brownfield, developable land;
1,250 dwellings;
Proposals for „urban eco-settlement‟ ;
Currently being master planned and will come forward before York
Central.
Targets:
3,000 dwellings by 2030
87,000 – 100,000 sq m new office quarter 50
Transport Arrangements
Key transport nodes include the existing York Railway Station, a proposed
public transport node to be located in close proximity to the railway station
and a potential tram-train halt at British Sugar.
Key challenges include access into the York Central site over the railways
and connectivity and integration with the City Centre.
4) Drivers of Change: New developments
Layerthorpe
There are longer term ambitions to regenerate this poor quality area to
the east of the Centre.
Regeneration opportunities exist for a range of employment uses,
including office (strategic employment site).
2 recent permissions have been given for supermarkets.
0.44 ha has potential for redevelopment in the short-term.
Redevelopment here provides the opportunity to enhance the „gateway‟
into the City Centre.
The New City Beautiful Vision proposes a City Park („The Production
Park‟) here.
There is potential to improve the environmental quality in the James
Street Link Road corridors and Foss Islands, as well as Layerthorpe
itself.
51

Section Five:
SWOT analysis
52
5) SWOT
In this section, we provide a SWOT of the key strengths,
weaknesses, opportunities and threats for York City Centre in
relation to:
The heritage / visitor offer;
The retail offer;
The public realm;
Transport and movement;
Rather than produce a SWOT for each individual transport mode,
we then provide an assessment of the key strengths that York has
in relation to sustainable modes (walking, cycling, bus and train)
and the issues that need to be addressed to improve them.
53
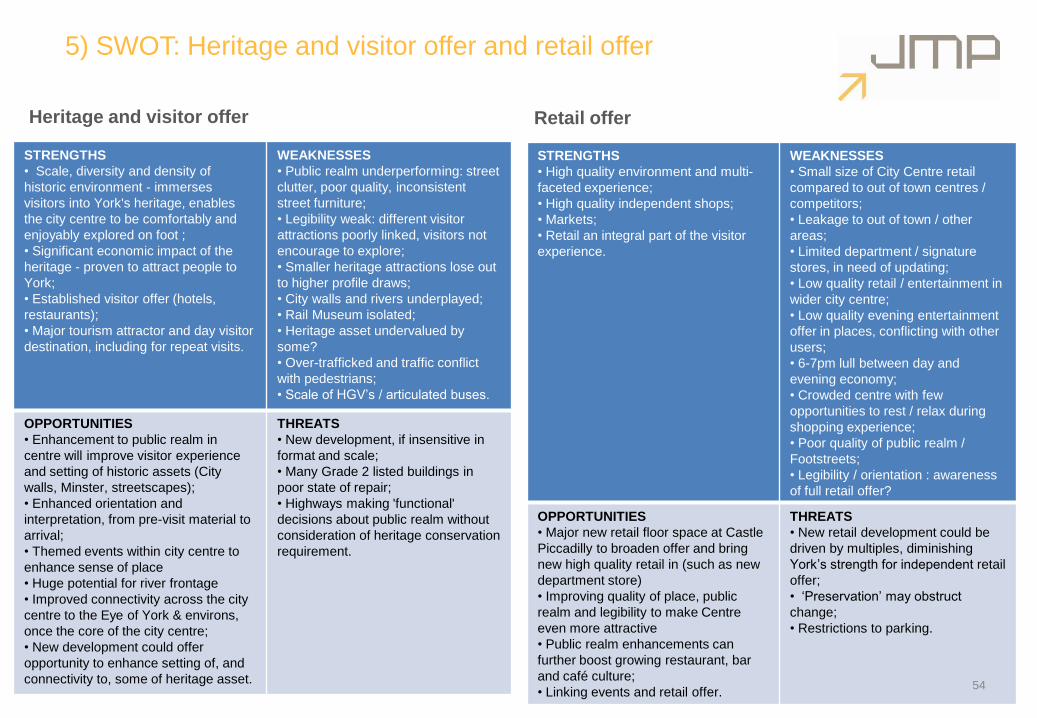
5) SWOT: Heritage and visitor offer and retail offer
STRENGTHS
• High quality environment and multi-
faceted experience;
• High quality independent shops;
• Markets;
• Retail an integral part of the visitor
experience.
WEAKNESSES
• Small size of City Centre retail
compared to out of town centres /
competitors;
• Leakage to out of town / other
areas;
• Limited department / signature
stores, in need of updating;
• Low quality retail / entertainment in
wider city centre;
• Low quality evening entertainment
offer in places, conflicting with other
users;
• 6-7pm lull between day and
evening economy;
• Crowded centre with few
opportunities to rest / relax during
shopping experience;
• Poor quality of public realm /
Footstreets;
• Legibility / orientation : awareness
of full retail offer?
OPPORTUNITIES
• Major new retail floor space at Castle
Piccadilly to broaden offer and bring
new high quality retail in (such as new
department store)
• Improving quality of place, public
realm and legibility to make Centre
even more attractive
• Public realm enhancements can
further boost growing restaurant, bar
and café culture;
• Linking events and retail offer.
THREATS
• New retail development could be
driven by multiples, diminishing
York‟s strength for independent retail
offer;
• „Preservation‟ may obstruct
change;
• Restrictions to parking.
54
STRENGTHS
• Scale, diversity and density of
historic environment - immerses
visitors into York's heritage, enables
the city centre to be comfortably and
enjoyably explored on foot ;
• Significant economic impact of the
heritage - proven to attract people to
York;
• Established visitor offer (hotels,
restaurants);
• Major tourism attractor and day visitor
destination, including for repeat visits.
WEAKNESSES
• Public realm underperforming: street
clutter, poor quality, inconsistent
street furniture;
• Legibility weak: different visitor
attractions poorly linked, visitors not
encourage to explore;
• Smaller heritage attractions lose out
to higher profile draws;
• City walls and rivers underplayed;
• Rail Museum isolated;
• Heritage asset undervalued by
some?
• Over-trafficked and traffic conflict
with pedestrians;
• Scale of HGV‟s / articulated buses.
OPPORTUNITIES
• Enhancement to public realm in
centre will improve visitor experience
and setting of historic assets (City
walls, Minster, streetscapes);
• Enhanced orientation and
interpretation, from pre-visit material to
arrival;
• Themed events within city centre to
enhance sense of place
• Huge potential for river frontage
• Improved connectivity across the city
centre to the Eye of York & environs,
once the core of the city centre;
• New development could offer
opportunity to enhance setting of, and
connectivity to, some of heritage asset.
THREATS
• New development, if insensitive in
format and scale;
• Many Grade 2 listed buildings in
poor state of repair;
• Highways making 'functional'
decisions about public realm without
consideration of heritage conservation
requirement.
Heritage and visitor offer Retail offer
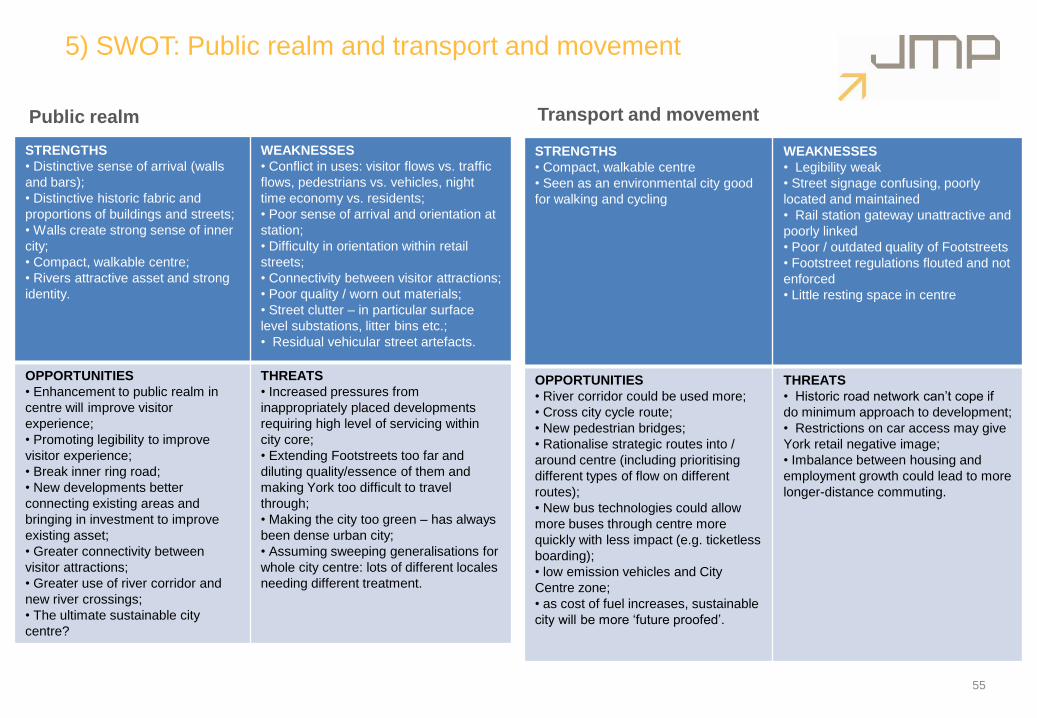
5) SWOT: Public realm and transport and movement
STRENGTHS
• Distinctive sense of arrival (walls
and bars);
• Distinctive historic fabric and
proportions of buildings and streets;
• Walls create strong sense of inner
city;
• Compact, walkable centre;
• Rivers attractive asset and strong
identity.
WEAKNESSES
• Conflict in uses: visitor flows vs. traffic
flows, pedestrians vs. vehicles, night
time economy vs. residents;
• Poor sense of arrival and orientation at
station;
• Difficulty in orientation within retail
streets;
• Connectivity between visitor attractions;
• Poor quality / worn out materials;
• Street clutter – in particular surface
level substations, litter bins etc.;
• Residual vehicular street artefacts.
OPPORTUNITIES
• Enhancement to public realm in
centre will improve visitor
experience;
• Promoting legibility to improve
visitor experience;
• Break inner ring road;
• New developments better
connecting existing areas and
bringing in investment to improve
existing asset;
• Greater connectivity between
visitor attractions;
• Greater use of river corridor and
new river crossings;
• The ultimate sustainable city
centre?
THREATS
• Increased pressures from
inappropriately placed developments
requiring high level of servicing within
city core;
• Extending Footstreets too far and
diluting quality/essence of them and
making York too difficult to travel
through;
• Making the city too green – has always
been dense urban city;
• Assuming sweeping generalisations for
whole city centre: lots of different locales
needing different treatment.
55
STRENGTHS
• Compact, walkable centre
• Seen as an environmental city good
for walking and cycling
WEAKNESSES
• Legibility weak
• Street signage confusing, poorly
located and maintained
• Rail station gateway unattractive and
poorly linked
• Poor / outdated quality of Footstreets
• Footstreet regulations flouted and not
enforced
• Little resting space in centre
OPPORTUNITIES
• River corridor could be used more;
• Cross city cycle route;
• New pedestrian bridges;
• Rationalise strategic routes into /
around centre (including prioritising
different types of flow on different
routes);
• New bus technologies could allow
more buses through centre more
quickly with less impact (e.g. ticketless
boarding);
• low emission vehicles and City
Centre zone;
• as cost of fuel increases, sustainable
city will be more „future proofed‟.
THREATS
• Historic road network can‟t cope if
do minimum approach to development;
• Restrictions on car access may give
York retail negative image;
• Imbalance between housing and
employment growth could lead to more
longer-distance commuting.
Public realm Transport and movement
5) SWOT: Opportunities and issues by mode
56
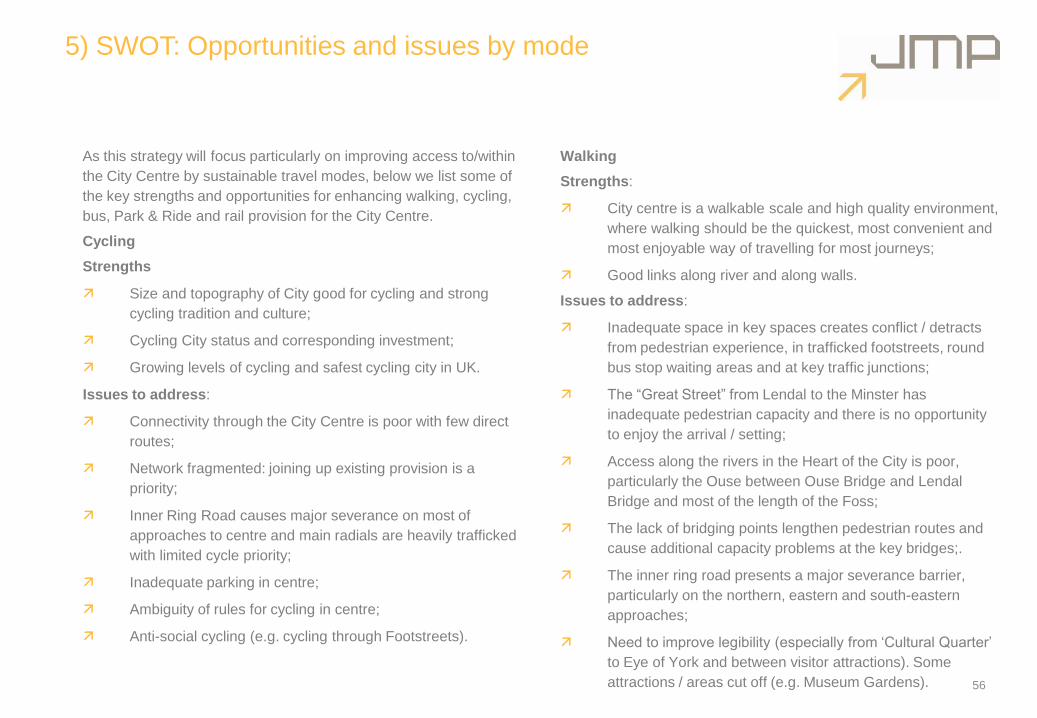
As this strategy will focus particularly on improving access to/within
the City Centre by sustainable travel modes, below we list some of
the key strengths and opportunities for enhancing walking, cycling,
bus, Park & Ride and rail provision for the City Centre.
Cycling
Strengths
Size and topography of City good for cycling and strong
cycling tradition and culture;
Cycling City status and corresponding investment;
Growing levels of cycling and safest cycling city in UK.
Issues to address:
Connectivity through the City Centre is poor with few direct
routes;
Network fragmented: joining up existing provision is a
priority;
Inner Ring Road causes major severance on most of
approaches to centre and main radials are heavily trafficked
with limited cycle priority;
Inadequate parking in centre;
Ambiguity of rules for cycling in centre;
Anti-social cycling (e.g. cycling through Footstreets).
Walking
Strengths:
City centre is a walkable scale and high quality environment,
where walking should be the quickest, most convenient and
most enjoyable way of travelling for most journeys;
Good links along river and along walls.
Issues to address:
Inadequate space in key spaces creates conflict / detracts
from pedestrian experience, in trafficked footstreets, round
bus stop waiting areas and at key traffic junctions;
The “Great Street” from Lendal to the Minster has
inadequate pedestrian capacity and there is no opportunity
to enjoy the arrival / setting;
Access along the rivers in the Heart of the City is poor,
particularly the Ouse between Ouse Bridge and Lendal
Bridge and most of the length of the Foss;
The lack of bridging points lengthen pedestrian routes and
cause additional capacity problems at the key bridges;.
The inner ring road presents a major severance barrier,
particularly on the northern, eastern and south-eastern
approaches;
Need to improve legibility (especially from „Cultural Quarter‟
to Eye of York and between visitor attractions). Some
attractions / areas cut off (e.g. Museum Gardens).
5) SWOT: Opportunities and issues by mode
57
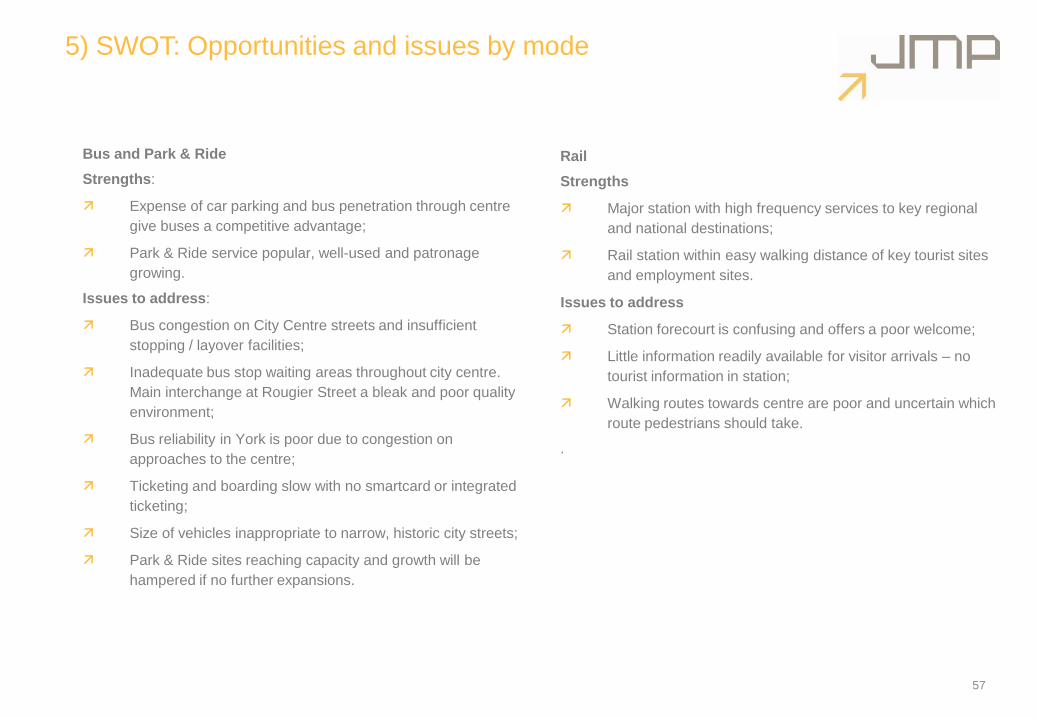
Bus and Park & Ride
Strengths:
Expense of car parking and bus penetration through centre
give buses a competitive advantage;
Park & Ride service popular, well-used and patronage
growing.
Issues to address:
Bus congestion on City Centre streets and insufficient
stopping / layover facilities;
Inadequate bus stop waiting areas throughout city centre.
Main interchange at Rougier Street a bleak and poor quality
environment;
Bus reliability in York is poor due to congestion on
approaches to the centre;
Ticketing and boarding slow with no smartcard or integrated
ticketing;
Size of vehicles inappropriate to narrow, historic city streets;
Park & Ride sites reaching capacity and growth will be
hampered if no further expansions.
Rail
Strengths
Major station with high frequency services to key regional
and national destinations;
Rail station within easy walking distance of key tourist sites
and employment sites.
Issues to address
Station forecourt is confusing and offers a poor welcome;
Little information readily available for visitor arrivals – no
tourist information in station;
Walking routes towards centre are poor and uncertain which
route pedestrians should take.
.

Section Six:
Consultations and References
58
6) Consultations
59
During the study, the following consultations were undertaken:
Transport stakeholders
Dean Maude, First Bus
Matt Page, Paul Hepworth, Tim Pheby – discussion on
cycling proposals
Quality Bus Partnership Meeting - discussion on bus
options (3rd March, 2011)
Business consultees
Adam Sinclair, Chairman Business Forum
Peter Kay, Chair, York Economic Partnership
Heritage / visitor consultees:
John Oxley, City of York Archaeologist
Janet Barnes and Mike Woodward, York Museums Trust
Nicola Bray, National Rail Museum
Peter Brown, York Civic Trust
Bob Sydes, Renaissance York
Ian Tempest, Visit York
Esther Priestley (landscape), Janine Riley (conservation
architecture) and John Oxley (archaeology), City of York
Council
Meeting with English Heritage team
City of York Council Officers
Paul Barrett: Town Centre Manager
Richard Bogg: Highways Network Manager
Andrew Bradley, Paul Brand: bus operations
Russ Broadbent, Parking Manager: parking policies and
provision
Dick Haswell, Taxi licensing officer: consultation on taxi and
private hire proposals
Simon Parrett, Traffic Modeller: Discussion about modelling
of traffic flows
Ian Stokes, Principal Transport Planner (Strategy): LTP
strategy
Ewan Taylor / Dave Caulfield (City Development):
Discussion on links with various planning proposals
Graham Titchener, Cycling City York Programme Manager
Richard Wood, Assistant Director (Development and
Transport)
Stakeholder Workshop
A stakeholder workshop was held on 16th February 2011 to
discuss strategy ideas.
Notes of this workshop are provided in a separate file,
together with a list of attendees and invitees.
6) References
60
Below is provided a list of documents and data examined during the
development of the strategy.
City of York Council, 2006: Castle Piccadilly Planning Brief.
City of York Council, 2006: Castle Piccadilly Conservation
Area Appraisal.
City of York Council, 2007: Access York MSBC.
City of York Council, 2007: Nestle South Development Brief.
City of York Council, 2007: York Northwest Area Action
Plan, Issues and Options Report.
City of York Council, 2008: Allocations DPD.
City of York Council, 2008: City Centre Area Action Plan,
Issues and Options Report.
City of York Council, 2008: Sustainable Community Strategy
2008-2025.
City of York Council, 2009: A Vision of York City Centre –
The Prospectus.
City of York Council, 2009: Core Strategy, Preferred
Options.
City of York Council, 2009: Cultural Quarter – A Report of
the „Cultural Quarter‟ Ad Hoc Scrutiny Committee.
City of York Council, 2009: Development Brief Terry‟s
(revised).
City of York Council, 2009: Local Development Framework
Annual Monitoring Report 2008/09.
City of York Council, 2009: Park and Ride Development
Business Case.
City of York Council, 2009: Preferred Options Topic Paper 3
Transport.
City of York Council, 2010: City Centre Accessibility
Framework.
City of York Council, 2010: City Centre Accessibility
Framework Local Bus Options Report.
City of York Council, 2010: Executive (Calling-in) Report –
Traffic Congestion Ad Hoc Scrutiny Committee
Recommendations.
City of York Council, 2010: Executive Report – Footstreets
Review Progress Report.
City of York Council, 2010: York Northwest Draft Transport
Background Paper.
City of York Council, 2011: Draft Local Transport Plan 3.
City of York Council: Hungate Development Brief.
6) References and Data
61
References contd.
CABE LDF Core Strategy Workshop.
GVA Grimley LLP, 2008: City of York Retail Study.
Halcrow, 2010: York Footstreets Review (Phase 3) Final
Report.
Leeds City Region, North Yorkshire and York Connectivity
Evidence Base.
Ron Cooke, 2009: DownTown York, A Practical Manifesto.
Simpson, Professor Alan J, 2010: York New City Beautiful –
Towards an Economic Vision.
Sheffield University, 2010: York Park and Ride Design
Guide.
Visit York, 2009: Visit York Strategic Plan 2009-2012.
Visit York, 2008: York: A Vision for Tourism.
York Tourism Partnership, 2007: York after Dark – Research
and proposed action plan on the evening economy and the
visitor experience of York in the evening.
Yorkshire Futures, 2006: Yorkshire & the Humber –
Population Projections: age and ethnicity.
Data
City of York Council: Cordon Count Traffic Surveys, Feb
2010.
City of York Council, 2007: Car Park Users‟ Survey.
City of York Council, 2007: Park & Ride Users‟ Survey.
City of York Council, 2007: Non Park & Ride Users‟ Survey.
City of York Council: Annual Bridge Mode Counts, 2009.
City of York Council: Car Park Utilisation Figures, 2008-
2010.
City of York Council: Coach Parking ticket sales figures,
2008-2010.
City of York Council: Cycle parking annual counts, 2009.
City of York Council: Surveys of bus stop usage, 2010.
Leeds City Region and North Yorkshire and York
Connectivity Evidence Base.
Network Rail, York Passenger Number statistics, 2008/09.
Visit York, 2010: Key Facts of Tourism 2010.
Visit York, 2009: 2008-09 Visitor Survey, Visit York Plan.
JMP Consultants Ltd.,
Minerva House,
East Parade
Leeds. LS1 5PS.
0113 244 4347