Embed Size (px)
Citation preview

YOKOGAWA FLUID IMAGING TECHNOLOGIES EBOOK
The Ultimate Guide to Flow Imaging Microscopy

YOKOGAWA FLUID IMAGING TECHNOLOGIES
Flow Imaging Microscopy: Discover a Better Way to Characterize Subvisible Particles
1. What is particle analysis? ............................................................................................................42. A History of Particle Analysis .....................................................................................................5 2.1 Microscopy ..................................................................................................................5 2.2 Volumetric Particle Analysis Techniques ...............................................................6 2.3 Flow Imaging Microscopy (FIM) ..............................................................................73. A Closer Look at Flow Imaging Microscopy ............................................................................9 3.1 How FIM Works ..........................................................................................................9 3.2 Direct Particle Measurements ...............................................................................10 3.3 Data Processing: Sorting & Filtering .....................................................................114. Flow Imaging Microscopy Applications Overview ...............................................................13 4.1 Detection of Protein Aggregates and Contaminants in Parenteral Drug Formulations .............................................................................................................14 4.2IdentificationofAquaticMicroorganisms...........................................................15 4.3 Crop and Soil Sciences ............................................................................................16 4.4 Food and Beverage Characterization ...................................................................16 4.5 Printer Toner Quality Assurance ...........................................................................17 4.6 Microencapsulation Process Analysis ...................................................................18 4.7 Outlier Characterization - Column Packing Material Quality Control .............19 4.8 Additive Manufacturing - Characterizing Metal Powders .................................19 4.9 Particle Differentiation in a Heterogeneous Sample - Wash Water ................20
CONTENTS
2 YOKOGAWA FLUID IMAGING TECHNOLOGIES INC.

InthiseBook,we’llbrieflyreviewdifferentmethodsavailableforanalyzingparticles,including the advantages and drawbacks of each. Then we’ll take a deeper look at flowimagingmicroscopy(FIM)andhowitworks.Finally,we’llfocusonhowFIMis an advantageous technology for many applications including, but not limited to protein therapeutics, aquatic research, food & beverage, printer toner, crop science, microencapsulation processes, column packing materials, and additive manufacturing.
ULTIMATE GUIDE TO FLOW IMAGING MICROSCOPY
Overview
A VisualSpreadsheet®collagefilecontaining images of protein aggregates, glass shards, silicon oil droplets and other particles.
3 YOKOGAWA FLUID IMAGING TECHNOLOGIES, INC.
CHAPTER ONE
What is Particle Analysis?
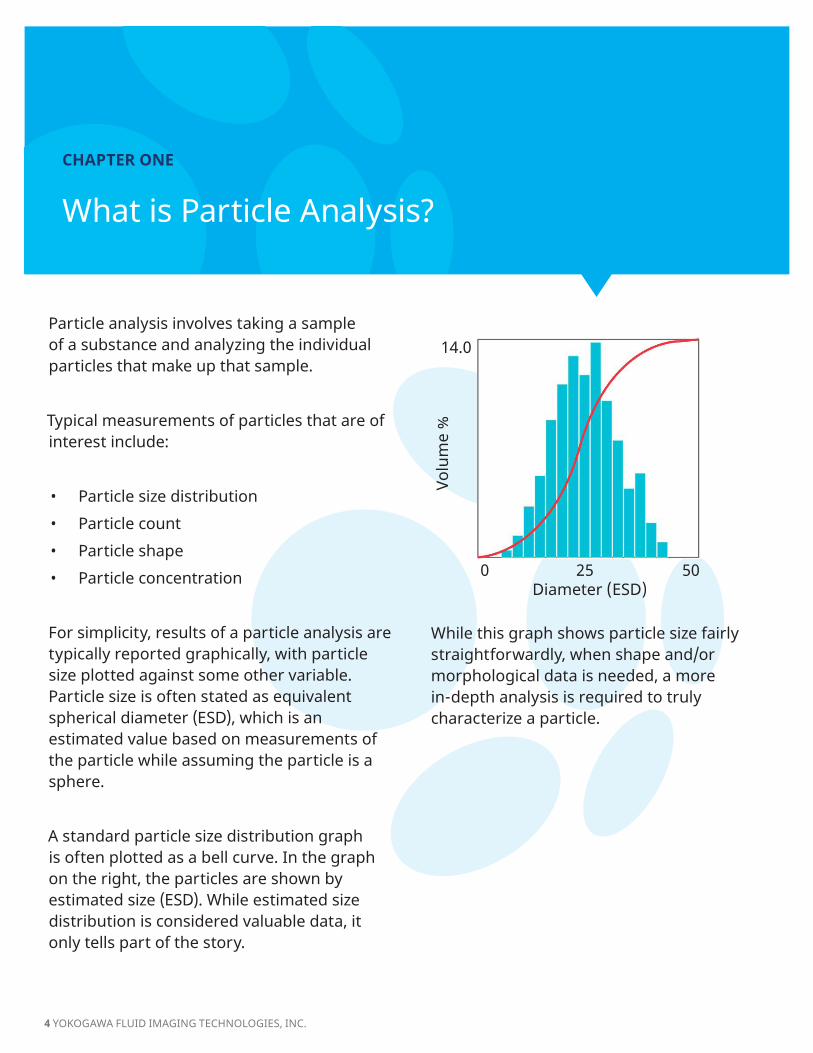
Particle analysis involves taking a sample of a substance and analyzing the individual particles that make up that sample.
Typical measurements of particles that are of interest include:
• Particle size distribution• Particle count• Particle shape• Particle concentration
For simplicity, results of a particle analysis are typically reported graphically, with particle size plotted against some other variable. Particle size is often stated as equivalent spherical diameter (ESD), which is an estimated value based on measurements of the particle while assuming the particle is a sphere.
A standard particle size distribution graph is often plotted as a bell curve. In the graph on the right, the particles are shown by estimated size (ESD). While estimated size distribution is considered valuable data, it only tells part of the story.
0 25 50 Diameter (ESD)
Volu
me
%
14.0
While this graph shows particle size fairly straightforwardly, when shape and/or morphological data is needed, a more in-depth analysis is required to truly characterize a particle.
4 YOKOGAWA FLUID IMAGING TECHNOLOGIES, INC.

CHAPTER TWO
A History of Particle Analysis
SECTION 2.1: MICROSCOPY
The introduction of the microscope in the 1600s changed the world for scientists. For thefirsttime,theycouldobserveandrecordorganisms too small to see with the naked eye.
To this day, microscopy remains the most common method for subvisible particle analysis.
ADVANTAGES OF MANUAL MICROSCOPY Thebenefitofmicroscopesissimple.Itallowsyou to study subvisible particles in great detailunderawiderangeofmagnifications.
Microscopes have improved over time, allowing us to look at increasingly smaller particles, even down to the molecular level.
DRAWBACKS OF MANUAL MICROSCOPYUsing manual microscopy for particle analysis is time-consuming. Depending on the sample, it can take hours to prepare the sample, set up the slides, and measure any particles found.
It’sdifficulttogetresultsthatarestatisticallysignificantusingmanualmicroscopy.Youcan only process one small sample at a time, soit’sdifficult,ifnotimpossible,toknowifwhat you’re looking at is representative of the whole.
Human factors must also be considered using microscopy. Tired eyes, interruptions, and time of day can all have an effect on the operator, and therefore the results.
“Comparing indivudual particle shape using a microscope is cumbersome and slow. It’s difficult to see more than a handful of particles, and certainly not enough to get a statistically significant sample.” — Ross Clark, Distinguished Research Fellow at CP Kelso, a leading producer of specialty hydrocolliods
5 YOKOGAWA FLUID IMAGING TECHNOLOGIES, INC.

EBOOK The Ultimate Guide to Flow Imaging Microscopy
In response to the need for rapid processing of particle data, a variety of volumetric techniques have been developed. Volumetric particle analysis methods include:
• Coulter Counters• Light Obscuration• Laser Diffraction• Light Scattering
These indirect techniques measure a signal that is proportional to the volume of a particle and not the actual physical dimensions of the particle.
The fundamental principle of these indirect techniques is that all particles are assumed to be spherical in shape, and the volume is converted to an equivalent spherical diameter (ESD). In these situations, it is not possible to know the actual shape of the particle, just the size distribution.
SECTION 2.2: VOLUMETRIC PARTICLE ANALYSIS TECHNIQUES
The Coulter Counter, shown here counting cells in solution, is an indirect volumetric particle analysis method.
Time
TargetParticle≈3µmESD
Indirectcalculationofparticlesizebasedonsignalprofile,wheresignalisproportionaltovolume.
=signalproducedfor4µm(ESD)calibrated
= signal produced for target particle
=signalproducedfor2µm(ESD)calibrated
Source: cancer.gov http://visualsonline.cancer.gov/details.cfm?imageid=2714.
6 YOKOGAWA FLUID IMAGING TECHNOLOGIES, INC.

EBOOK The Ultimate Guide to Flow Imaging Microscopy
ADVANTAGES OF VOLUMETRIC METHODSVolumetric methods can rapidly count and sizeastatistically-significantamountofdata—up to tens of thousands of particles per minute.A particle size distribution that shows particle size versus either frequency or volume is easily created. Detailed particle statistics can be recorded for the entire distribution.
DRAWBACKS OF VOLUMETRIC METHODSThemostsignificantdrawbacktovolumetrictechniques is that they must assume all par-ticles are spheres. These methods are limited to particle counting and size distribution only. It is common for samples to be heterogeneous, containing a variety of particle types and shapes. Volumetric techniques cannot characterize different particle types in a mixture due to the assumption that all particles are spherical.
SECTION 2.3: FLOW IMAGING MICROSCOPY (FIM) Aflowimagingparticleanalyzerperformsthe following three functions all in one instrument: • Examinesafluidunderamicroscope• Takesdigitalimagesofthemagnified
particleswithinthefluidstream• Characterizes the particles using a variety
of measurements ADVANTAGES OF FLOW IMAGING MICROSCOPYFIMcombinesthebenefitsofmanualmicroscopy with those of volumetric techniques. Microscopic particle measurements are taken from images quickly enoughtoproducestatisticallysignificantresults. Additionally, multiple measurements are taken for each particle, thereby providing the detailed information often needed for a thorough particle analysis. The addition of specialized software also provides sophisticated post-processing of data to give you an in-depth analysis of your sample and a better understanding of your data.
“After using light-obscuration instruments to count particles in a new parenteral product formulation, a project team at GlaxoSmithKline found that the light obscuration method yields a read-out of particles counted in the sample, but is unable to shed light on the nature of the particles. If the particles are not identified, differentiating the actual number of product-related particles can be a difficult task.”
-Morrone,GregJ.,andWasfiAl-Azzam.“FromSafetySnapshot:Animagingparticleanalyzercangiveresearchers a better picture of particles in parenteral formulations.” Drug Discovery & Development, Volume 14, Issue 5,
7 YOKOGAWA FLUID IMAGING TECHNOLOGIES, INC.

EBOOK The Ultimate Guide to Flow Imaging Microscopy
LIMITATIONS OF FLOW IMAGING MICROSCOPY
The ability of an imaging system to resolve details in a particle is essential for accurate measurement. The optical system and the sensor of the instrument affect its ability to size and characterize subvisible particles.
Because of this, it is important to optimize the settings on these types of instruments specificallyforthesampleyouareanalyzing to ensure accurate results, and to select the correct objective lens for the particles being studied. Flow Imaging Microscopy is currently limited to counting and characterizing particles in the 300nm - 5mm range.
Dr. Cheng Her uses the FlowCam at the University of Colorado Center for Pharmaceutical Biotechnology with Dr. John Carpenter.
8 YOKOGAWA FLUID IMAGING TECHNOLOGIES, INC.

CHAPTER THREE
A Closer Look at Flow Imaging Microscopy
SECTION 3.1: HOW FLOW IMAGING MICROSCOPY WORKS
Flow imaging microscopy uses digital images to measure the size and shape of each particle in a sample. Essentially, the operator in classical microscopy is replaced by a computer to extract the information from the images.
Thesamplecontainingtheparticlesstreamsthroughtheflowcellpastthemicroscopeoptics.Thousands of particle images are captured per second.
Tocapturesharpimagesofmovingparticles,theyare“frozen”inspaceusingastrobedillumination source combined synchronously with a very short shutter speed.
Aseachframeofthecamera’sfieldofviewiscaptured,thesoftware,inrealtime,extractstheparticle images from the background and stores them.
9 YOKOGAWA FLUID IMAGING TECHNOLOGIES, INC.

EBOOK The Ultimate Guide to Flow Imaging Microscopy
In an imaging-based system, particle measurements are made directly from the image of the particle. Since the system’s opticsarefixedandthemagnificationisknown, distance measurements on the image can be directly converted to real distance measurements on the object.
No generalizations are made about a particle’s shape. The user can also view the image to ensure that the data is being properly interpreted.
Common measurements include:• Equivalent spherical diameter (ESD) • Length, width, and aspect ratio• Area and volume• Circularity and elongation
SECTION 3.2: DIRECT PARTICLE MEASUREMENTS
FlowCamscreenduringimagecapture.Themiddlewindowisthefullfield-of-viewofcameraontheflowcell.Redboxes indicate particles found. The right window is the ‘collage window’ of particle images that are saved and stored. The main window (left side) shows particle measurements summary graph and statistics that populate at the end of the sample run. The main window can be customized to show desired properties and display preferences.
“Image quality is extremely important when characterizing protein aggregates. We need to be able to differentiate them from silicone oil and other contaminants in drug formulations early in the process. The FlowCam allows us to do this quickly and easily.”
-Dr. Jeff Schwegman, Founder and CEO AB BioTechnologies, Bloomington, IN
• Edge gradient• Intensity, average intensity, and sigma intensity• Transparency• and more (40+ morphological characteristics)
10 YOKOGAWA FLUID IMAGING TECHNOLOGIES, INC.

EBOOK The Ultimate Guide to Flow Imaging Microscopy
SORTING
The FlowCam system includes VisualSpreadsheet® software, a single program for both acquisition and analysis of data. VisualSpreadsheet provides the ability tosortandfilteryourdatabasedonanyof the measurements (or combination of measurements) acquired for the particles. The results are displayed as particle images as well as in a tabular format, and can also be exported to Excel.
The user can interact with the auto-generated scattergram to quickly select particles of interestfromanyoftheconfigurablegraphs.
SECTION 3.3: DATA PROCESSING - SORTING AND FILTERING MEASUREMENTS
VisualSpreadsheet interactive scattergram: only the largest particles have been selected from the histogram in the left window (red). The right window displays those particles, revealing that they are contaminants, not intrinsic particles.
“You can get more information from the FlowCam than from any other type of instrument. Going to the FlowCam with a particle problem is just the best feeling in the world because it turns data into useful information that you can use to solve a real problem.”
-Dan Berdovich, OwnerMicromeasurement Laboratories, Inc.
11 YOKOGAWA FLUID IMAGING TECHNOLOGIES, INC.

EBOOK The Ultimate Guide to Flow Imaging Microscopy
FILTERING
Youcanalsobuildfiltersbasedonparticleproperties with VisualSpreadsheet to automatically isolate particles of a particular type.
Filters can be created, saved, and applied to future runs, or in post-processing mode of past runs.
Valuefilterscanbeusedtoisolateparticleswithinaspecifiedrangeofanyparticleproperty.Statisticalfilterscanbeusedtoidentify images similar to a population of user-selected images.
AVisualSpreadsheetvaluefilterwasusedtoisolate“longandskinny”particles,limitingthedisplaytoonlyparticleswithanaspectratio(width/length)from0to0.25µm.
“Data is one thing, but having instantaneous information is another... The FlowCam is an integral part of our screening process and enables us to quickly get the answers we need to drive the formulation development”
-Dr Jeff Schwegman, Founder and CEO AB BioTechnologies, Bloomington, Indiana
12 YOKOGAWA FLUID IMAGING TECHNOLOGIES, INC.

CHAPTER FOUR
Flow Imaging Microscopy Applications Overview
SECTION 4.1: Detection of Protein Aggregates and Contaminants in Parenteral Drug Formulations
SECTION 4.2: Identification of Aquatic Microorganisms
SECTION 4.3: Crop and Soil Sciences
SECTION 4.4: Food and Beverage Characterization
SECTION 4.5: Printer Toner Quality Assurance
SECTION 4.6: Microencapsulation Process Analysis
SECTION 4.7: Outlier Characterization - Column Packing Material Quality Control
SECTION 4.8: Additive Manufacturing - Characterizing Metal Powders
SECTION 4.9: Particle Differentiation in a Heterogeneous Sample - Wash Water
13 YOKOGAWA FLUID IMAGING TECHNOLOGIES, INC.

SECTION 4.1: DETECTION OF PROTEIN AGGREGATES AND CONTAMINANTS IN PARENTERAL DRUG FORMULATIONS
EBOOK The Ultimate Guide to Flow Imaging Microscopy
Particulates in parenteral drug development have always been a serious concern. In biopharmaceuticals the issue is compounded by reported impacts of aggregates and contaminant particles ontheproduct’sefficacy,safety,andimmunogenicity. FDA regulations strongly recommend in-depth characterization of particles in protein therapeutics in addition to size and quantity measurements.
In one example, a parenteral formulation sample was analyzed by the FlowCam. A totalof382particlesgreaterthan10µmwere found. When reviewing the images, it was apparent that many of these particles were actually silicone oil droplets. Silicone dropletsareintroducedduringthefillingprocess but are not harmful, so they are permitted.
Using VisualSpreadsheet, silicone oil droplets were eliminated from the statistical analysis to determine a realistic number of particles of concern, like protein aggregates.
Out of the 382 particles originally detected, 195 were found to be silicone droplets, leaving 187 that are actual protein aggregates.Thisrepresentedasignificantchange in the number of particles found thataregreaterthan10µm.
This was important because it could have been the difference between whether the batch was accepted or rejected in quality control.
In this sample it is easy to tell the difference between the microspheres used for drug delivery and the contaminant particles.
AVisualSpreadsheetcollagefilecontainingimagesof protein aggregates, glass shards, silicon oil droplets and various other intrinsic, extrinsic and inherent particles.
NIST protein reference standards imaged by the FlowCam Nano.
14 YOKOGAWA FLUID IMAGING TECHNOLOGIES, INC.

EBOOK The Ultimate Guide to Flow Imaging Microscopy
SECTION 4.2: IDENTIFICATION OF AQUATIC MICROORGANISMS
The FlowCam was developed by biological oceanographers to study marine phytoplankton in the late 1990s. Today, use of the FlowCam in the aquatic sciences includes freshwater research, drinking water monitoring, algae cultivation, harmful algal bloom monitoring, and more.
TheFlowCamcombinesthefluorescencedetectioncapabilitiesofaflowcytometerwith the imaging capabilities of a microscope. The system enables the user to identify and enumerate phytoplankton and zooplankton, and save an image of each particle and/or organism.
FlowCam users build libraries to semi-automatetheidentificationprocesswiththe help of FlowCam example libraries. FlowCammodelswithfluorescencecapabilities can further distinguish organisms containing chlorophyll - including green algae and diatoms - from detritus and cyanobacteria (Figure 1).
Using the FlowCam Cyano, drinking water utilities and monitoring agencies can quickly detect, identify, and quantify cyanobacteria, the primary producers of taste and odor compounds as well as cyanotoxins, allowing them to make informed testing and treatment decisions.
In the marine environment, the FlowCam is used by researchers, educators, and aquaculturists to study primary production and to detect and monitor harmful algal blooms that can produce toxins that cause fishkillsandshellfishclosures(Figure2).
Figure 1. Use the FlowCam Cyano to separate diatoms and green algae (top row) from cyanobacteria (bottom row).
Figure2.TheFlowCamcancapturemarinedinofla-gellates like these from the Gulf of Maine.
Figure 3. The FlowCam can capture zooplankton like the Daphnia and copepods shown here.
For more information, visit the Aquatic Applications page at fluidimaging.com.
15 YOKOGAWA FLUID IMAGING TECHNOLOGIES, INC.

SECTION 4.3: CROP AND SOIL SCIENCES
EBOOK The Ultimate Guide to Flow Imaging Microscopy
FlowCam applications in Agronomy:
• Monitor the microencapsulation process of fertilizer particles
• Determine presence of and monitor health and growth of soil microbes, mites, forest litter invertebrates and nematodes
• Determine seed viability and observe naturally occuring defects in plant development
• Analyze pollen particles and pollen shell capsules
“The worst part of a particle size or shape issue is that it probably never occurs to the processor to check gum particle size or shape or that of any other ingredient. Instead, the recipe or the machinery are blamed.”
-Ross Clark, Distinguished Research Fellow CP Kelco
SECTION 4.4: FOOD AND BEVERAGE CHARACTERIZATION
Ingredients are critical in all facets of the food and beverage industry. The FlowCam allows the user to isolate different particle types from a heterogeneous mixture in order to ensure the contents and detect process flawsearly.
One example is hydrocolloids. Xanthan gum, guar gum, pectin, and other products are used to impart thickening, stabilizing, texturizing, and other properties to foods, beverages, and personal care products. Careful formulation, production, and packing are required to meet dispersability, hydrationrate,powderflow,andotherkeyperformance characteristics. All of these are affected by individual particle size and shape.
Similarly, agglomerated particles and blends such as pectin blended with sugar demand compatible particle sizes to ensure they remain locked together. If they become separated, required characteristics aren’t delivered.
Xanthan gum and cellulose gum particles imaged by the FlowCam
Pollen particles imaged by the FlowCam
16 YOKOGAWA FLUID IMAGING TECHNOLOGIES, INC.
EBOOK The Ultimate Guide to Flow Imaging Microscopy
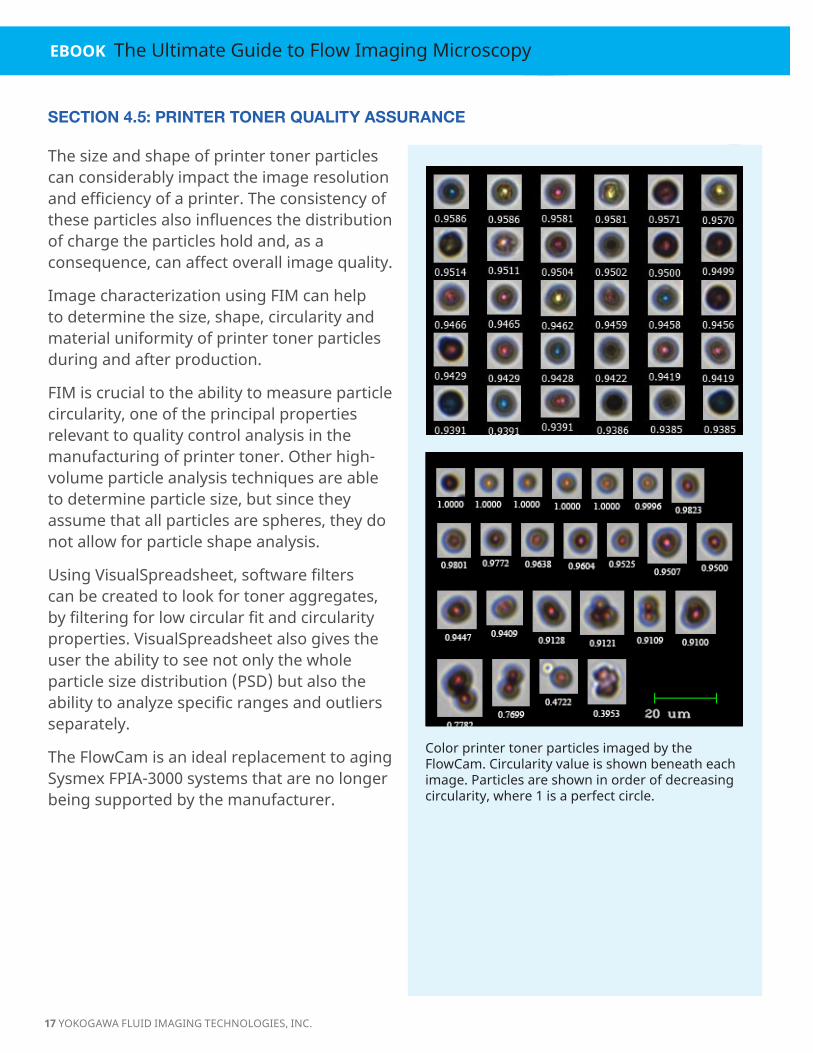
The size and shape of printer toner particles can considerably impact the image resolution andefficiencyofaprinter.Theconsistencyoftheseparticlesalsoinfluencesthedistributionof charge the particles hold and, as a consequence, can affect overall image quality.
Image characterization using FIM can help to determine the size, shape, circularity and material uniformity of printer toner particles during and after production.
FIM is crucial to the ability to measure particle circularity, one of the principal properties relevant to quality control analysis in the manufacturing of printer toner. Other high-volume particle analysis techniques are able to determine particle size, but since they assume that all particles are spheres, they do not allow for particle shape analysis.
UsingVisualSpreadsheet,softwarefilterscan be created to look for toner aggregates, byfilteringforlowcircularfitandcircularityproperties. VisualSpreadsheet also gives the user the ability to see not only the whole particle size distribution (PSD) but also the abilitytoanalyzespecificrangesandoutliersseparately.
The FlowCam is an ideal replacement to aging Sysmex FPIA-3000 systems that are no longer being supported by the manufacturer.
SECTION 4.5: PRINTER TONER QUALITY ASSURANCE
Color printer toner particles imaged by theFlowCam. Circularity value is shown beneath each image. Particles are shown in order of decreasing circularity, where 1 is a perfect circle.
17 YOKOGAWA FLUID IMAGING TECHNOLOGIES, INC.

EBOOK The Ultimate Guide to Flow Imaging Microscopy
Microencapsulation is a process by which small amounts of a substance (an active ingredient) are packaged inside a second substance to shield the active ingredient from the surrounding environment. The process is used extensively for delivering particles in a wide range of applications, from pharmaceuticals to foods to detergents.
Flow Imaging Microscopy provides unique insight into the microencapsulation process. While studying the effects of temperature, concentration, pH or other variables that affect the process, you can monitor capsule formation in real time, optimizing your process and ensuring quality.
In this example, the FlowCam was used to monitor coacervate formation in a test vat as the sample cooled under constant agitation.
Samples were collected and analyzed every 15-30 minutes. Visual examination of particle images and statistical pattern recognition analysisconfirmedthatatt0+ 39 minutes the most clean coacervates were formed. After this point, the gelatin began to attach itself to the capsule walls, causing agglomeration and eventually disintegration of the coacervates.
The FlowCam yields tremendous insight into the process of coacervate formation, and can be an indispensable tool for microencapsulation research & developmnet and quality control applications.
SECTION 4.6: MICROENCAPSULATION PROCESS ANALYSIS
Sample analyzed at 9 minutes. Dark circles are active ingredients.
Sample analyzed at 39 minutes. Coacervates are fully formed.
Sample analyzed at 58 minutes. Coacervates still visible, agglomeration beginning to occur.
18 YOKOGAWA FLUID IMAGING TECHNOLOGIES, INC.

SECTION 4.7: OUTLIER CHARACTERIZATION - COLUMN PACKING MATERIAL QUALITY CONTROL
EBOOK The Ultimate Guide to Flow Imaging Microscopy
In column chromatography the elution rate of different components in a mobile phase is dependent on the size and shape of particles in the stationary phase. Elution rate precision is greatly improved when a stationary phase is made up of uniform particles. The FlowCam provides critical size and shape information which allows for tighter column density control, and in turn, better control of column performance. The FlowCam can help trace damaged (non-spherical) particles that are often present in different lots of column packing material.
Round, acceptable particles vs. irregular, unacceptable particles
SECTION 4.8: ADDITIVE MANUFACTURING - CHARACTERIZING METAL POWDERS
Round, acceptable metal particles
Metal Additive Manufacturing (also known as 3-D printing) requires carefully engineered compound metal powders in order to make high-quality end products. ISO/ASTMprovidesspecificationsforcertaincharacteristics in order to meet quality standards. These include particle size distribution, morphology, contamination, and requirements for used metallic powders.
Sampling metallic powder using the FlowCam can provide all of this information, and determine if the particles are of the required aspect ratio (round), if contamination is present, or if used powders are suitable for reuse. The suitability of the particles has the ability to affect bulk powder performance duringmanufacturingaswellasthefinalqualities of the printed material.
Read more: Farzadfar, S.A. et. al (2020) doi: 10.1016/j.powtec.2020.07.092
Irregular metal particles that could cause problems in the printing process
19 YOKOGAWA FLUID IMAGING TECHNOLOGIES, INC.

EBOOK The Ultimate Guide to Flow Imaging Microscopy
SECTION 4.9: PARTICLE DIFFERENTIATION IN A HETEROGENEOUS SAMPLE - WASH WATER
The FlowCam excels at analyzing heterogeneous samples, where multiple particle types are present. In these situations, imaging particle analysis and pattern recognition techniques can provide an automated method for characterizing the types and quantities of particles present.
In this example, a wash water sample from a manufacturing process for electronic devices was analyzed. These devices are washedtoremovetracesoffibers,metalsand plastics from the manufacturing process. It is important that the wash water contains less than a certain number of each of these particle types, as too many particles could cause failures. Additionally, the types and quantity of particles present in the wash water serves as an indicator for any problems arising in the production process.
Analysis of this sample revealed a diversity ofparticletypes:long,skinnyfiberparticles,semi-transparent metal shavings, and more opaque plastic particles.
A library for each particle type was built based on particle characteristics, and each subsequent run was automatically filteredintothedifferentparticletypes.The corresponding volume percent, particles/mL, and PPM was simultaneously calculated.
The FlowCam allows the user to quickly determine if there is an issue with their manufacturing process in real time and make the necessary adjustments.
Fibers
Metals
Plastics
20 YOKOGAWA FLUID IMAGING TECHNOLOGIES, INC.

Covering the Full Spectrum of Flow Imaging Technology
FlowCam 8000 SeriesParticles2µmto1mm
multiple objectives
FlowCam ALH Integrates with 8000 series for high-throughput processing
FlowCam NanoParticles300nmto10µm
EBOOK The Ultimate Guide to Flow Imaging Microscopy
FlowCam MacroParticles300µmto5mm
FlowCam CyanoDistinguish between
cyanobacteria and other algae
VisualSpreadsheet SoftwareFlowCam’s image analysis
software
Don’tseeyourspecificapplication? Have additional questions? Wondering if the FlowCam will work for you?
Send an email to [email protected] and we can arrange to run one of
your samples for free.
FlowCam 5000Particles2µmto1mm
single objective
FlowCam + LOObtain Flow Imaging and Light
Obscuration data in oneinstrument
21 YOKOGAWA FLUID IMAGING TECHNOLOGIES, INC.

ABOUT YOKOGAWA FLUID IMAGING TECHNOLOGIES Yokogawa Fluid Imaging Technologies, Inc., manufactures industry-leading particle analysis instrumentation based on digital imaging technology. Ourflagshipproduct,theFlowCam®,isthefirstautomated particle analysis instrument to use digital imaging for measuring size and shape of microscopic particlesinafluidmedium. With applications in marine & freshwater research, biopharmaceutical research & development, municipal water, industrial manufacturing, and many other markets, Yokogawa Fluid Imaging Technologies leads the way in imaging particle analysis.