Embed Size (px)
Citation preview

Yoder, C.O. and E.T. Rankin. 1996. Assessing the condition and status of aquaticlife designated uses in urban and suburban watersheds, pp. 201-227. in Roesner,L.A. (ed.). Effects of Watershed Development and Management on AquaticEcosystems, American Society of Civil Engineers, New York, NY.
Assessing the Condition and Status of Aquatic Life Designated Usesin Urban and Suburban Watersheds
Chris O. Yoder and Edward T. Rankin1
AbstractOhio EPA employs biological, chemical, and physical monitoring and assessmenttechniques in biological surveys in order to meet three major objectives: 1) determinethe extent to which use designations assigned in the Ohio Water Quality Standards(WQS) are either attained or not attained; 2) determine if use designations assigned toa given water body are appropriate and attainable; and 3) determine if any changes inkey ambient biological, chemical, or physical indicators have taken place over time,particularly before and after the implementation of point source pollution controls orbest management practices for nonpoint sources. Biological criteria are one of theprincipal assessment tools by which the status of water bodies is determined in Ohio.The results of biological monitoring in selected small urban Ohio watersheds shows atendency towards lower biological index scores with an increasing degree ofurbanization and allied stressors, becoming more severe as other impact types such ascombined sewer overflows (CSOs) and industrial sources coincide. Out of 110sampling sites examined only 23% exhibited good, very good, or exceptional biologicalindex scores. Of the sites classified as being impacted by urban sources, only twosites (4.5%) attained the applicable biological criteria. Poor or very poor scoresoccurred at the majority of the urban impacted sites (85%). More than 40% ofsuburban sites were impaired with many reflecting the impact of new developmentsfor housing and commercial uses. The results demonstrate the degree of degradationwhich exists in most small urban Ohio watersheds and the difficulties involved indealing with these multiple and diffuse sources of stress. Well designed biologicalsurveys using standardized methods and calibrated indicators can contribute essential
1 Ohio EPA, Division of Surface Water, Monitoring and Assessment Section, 1685 Westbelt Drive,Columbus, Ohio 43228
201 Yoder and Rankin

information and capacity to urban watershed management. Because the resident biotarespond to and integrate all of the various factors that affect a watershed theircondition is the cumulative result of what happens within watersheds. It is importantthat ambient monitoring not only be done as part of the overall urban nonpoint sourcemanagement process, but that it is done correctly in terms of timing, methods, anddesign.
IntroductionThe health and well-being of the aquatic biota in surface waters is an importantbarometer of how effectively we are achieving the goals of the Clean Water Act,particularly the maintenance and restoration of biological integrity. Simply statedbiological integrity is the combined result of chemical, physical, and biologicalprocesses in the aquatic environment. The interaction of these factors is especiallyapparent in the effects of nonpoint sources. In order to be successful in achievingClean Water Act goals, ecological concepts, criteria, and assessment tools need to bebetter incorporated into the prioritization and evaluation of watershed managementefforts (Yoder 1995a).
The monitoring of surface waters and evaluation of the biological integrity goal of theClean Water Act have historically been predominated by nonbiological measures suchas chemical/physical water quality (Karr et al. 1986). While this approach may havefostered an impression of empirical validity and legal defensibility it has notsufficiently measured the ecological health and well-being of aquatic resources. Anillustration of this point was demonstrated in a comparison of the abilities of chemicalwater quality criteria and biological criteria to detect aquatic life use impairment inOhio rivers and streams. Out of 645 water body segments analyzed, biologicalimpairment was evident in 49.8% of the cases where no impairments of chemicalwater quality criteria based on ambient chemical monitoring were observed (OhioEPA 1990a). While this discrepancy may at first seem remarkable, the reasons for itare many and lie mostly in the inherent complexity of biological information.Biological communities simultaneously respond to and integrate a wide variety ofchemical, physical, and biological factors in the environment whether they are ofnatural or anthropogenic origin. Simply stated controlling chemical water qualityalone does not assure the ecological integrity of water resources (Karr et al. 1986).
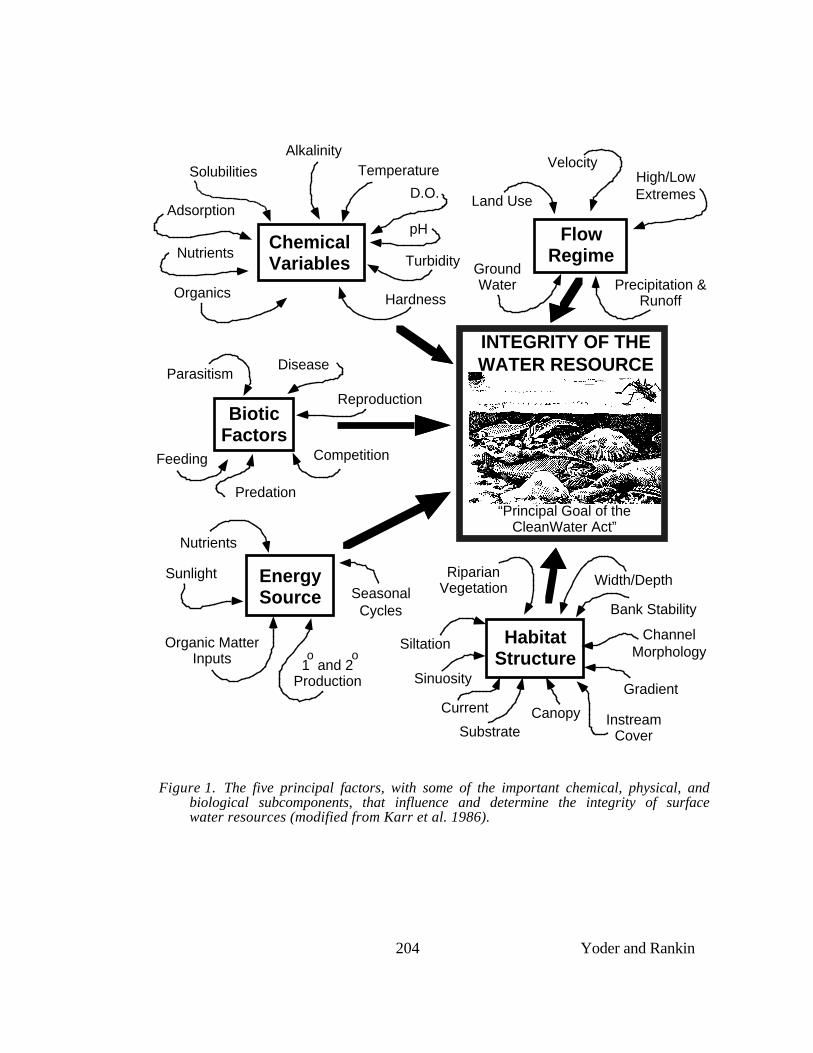
The health and well-being of surface water resources is the combined result ofchemical, physical, and biological processes (Figure 1). To be truly successful inattaining biological integrity goals, monitoring and assessment tools are needed thatmeasure both the interaction of chemical, physical, and biological processes and theintegrated result of these processes (Karr 1991). This is especially true of nonpointsources because many of the effects involve the complex and dynamic interaction of
202 Yoder and Rankin

these factors. Biological criteria offer a way to measure the end result of watershedlevel management efforts and successfully accomplish the protection and restorationof aquatic ecological resources. Biological communities respond predictably togradients of environmental impact which chemical/physical water quality criteriaalone cannot adequately discriminate or sometimes even detect. Habitat degradationand sedimentation are two such widespread impacts of nonpoint source origin thatsimply cannot be measured by chemical/physical assessments alone. As illustratedby Figure 1 it is the cumulative combination of chemical and physical factors thatresult in aquatic life use impairments from nonpoint sources.
Biological CriteriaBiological criteria are narrative and numerical expressions of the health and well-beingof the aquatic biota and are based on measurable attributes of aquatic communitiessuch as fish and macroinvertebrate community structure and function. Ohio EPAadopted numerical biological criteria in the Ohio Water Quality Standards (WQS)regulations in May 1990. Biological criteria are further stratified within aclassification system of aquatic life use designations. Numerical biological criteriawere derived using a regional reference site approach (Ohio EPA 1987a,b; Ohio EPA1989a; Yoder 1989; Yoder and Rankin 1995a). Numerical biological criteria, which areexpressed as biological indices that represent measurable end-points of aquatic life usedesignation attainment and non-attainment, are the end-product of an ecologicallycomplex, but structured derivation process. While numerical biological indices havefrequently been criticized for potentially oversimplifying complex ecologicalprocesses, the need to distill such information to commonly comprehendedexpressions is both practical and necessary. Numerical biological criteria representvalid ecological end-points so long as the underlying development process istheoretically sound and informationally robust.
The availability of new generation evaluation mechanisms such as the Index of BioticIntegrity (IBI; Karr 1981; Fausch et al. 1984; Karr et al. 1986), the Index ofWell-Being (Iwb; Gammon 1976; Gammon et al. 1981), the Invertebrate CommunityIndex (ICI; Ohio EPA 1987b; DeShon 1995), and similar efforts (Plafkin et al. 1989;Lyons 1991; Simon 1991; Kerans and Karr 1992; Fore et al. 1996; Barbour et al.1996) have satisfied important practical and theoretical gaps not always fulfilled bypreviously available single dimension indices (Fore et al. 1996). Multimetricevaluation mechanisms such as the IBI extract ecologically relevant information fromcomplex biological community data while preserving the opportunity to analyze thedata on a multivariate basis. The problem of biological data variability is alsoaddressed within this approach. Variability is controlled by specifying standardizedmethods and procedures (e.g., Ohio EPA 1989b), compressed through the applicationof multimetric evaluation mechanisms (e.g., IBI, ICI), and stratified in accordance
203 Yoder and Rankin
FlowRegime
High/LowExtremes
Precipitation &Runoff
Velocity
Land Use
GroundWater
ChemicalVariables
BioticFactors
EnergySource
HabitatStructure
Hardness
Turbidity
pH
D.O.
TemperatureAlkalinity
Solubilities
Adsorption
Nutrients
Organics
Reproduction
DiseaseParasitism
Feeding
Predation
Competition
Nutrients
Sunlight
Organic MatterInputs 1 and 2
Production
o o
SeasonalCycles
RiparianVegetation
Siltation
Current
Substrate
Sinuosity
Canopy InstreamCover
Gradient
ChannelMorphology
Bank Stability
Width/Depth
INTEGRITY OF THEWATER RESOURCE
“Principal Goal of theCleanWater Act”
Figure 1. The five principal factors, with some of the important chemical, physical, andbiological subcomponents, that influence and determine the integrity of surfacewater resources (modified from Karr et al. 1986).
204 Yoder and Rankin

with regional and physical variability and potential (e.g., watershed size, ecoregions,tiered aquatic life uses) The result are evaluation mechanisms such as the IBI and ICIthat have acceptably low replicate and intra-regional variability (Davis and Lubin1989; Rankin and Yoder 1990; Stevens and Szczytko 1990).
A few states initially led the effort to establish biological criteria by initiatingdevelopment and implementation efforts within their own water quality managementprograms. U.S. EPA effectively endorsed the approach used by some of these statesby first issuing national program, policy, and bioassessment guidance (Plafkin et al.1989; U.S. EPA 1990, 1991) and more recently specific guidance for biological criteriadevelopment in wadeable streams (U.S. EPA 1995). At the same time more states areundertaking biological criteria development and implementation efforts (e.g., Floridaas detailed in Barbour et al. 1996). While outstanding and as yet unresolved issuesremain surrounding the policy applications of biological criteria (Miner and Borton1991; Pihfer 1991; Jackson 1992; Ruffier 1992; Schmidt 1992; Schregardus 1992;Yoder 1991a, 1995b), the concept is becoming firmly embedded in emerging state andfederal monitoring, assessment, and management initiatives (e.g., environmentalindicators, national goals).
Methods and DesignA biological and water quality survey, or “biosurvey”, is an interdisciplinarymonitoring effort conducted on a water body specific, watershed, or basin/subbasinscale. Biosurveys may be relatively simple, focusing on one or two small streams,one or two principal stressors, and a handful of sampling sites or a much morecomplex effort including entire drainage basins, multiple and overlapping stressors,and tens of sites. Each year Ohio EPA conducts biosurveys in 10-15 different areaswith an aggregate total of 250-350 sampling sites.
Ohio EPA employs biological, chemical, and physical monitoring and assessmenttechniques in biosurveys in order to meet three major objectives: 1) determine theextent to which use designations assigned in the Ohio Water Quality Standards(WQS) are either attained or not attained; 2) determine if the use designations assignedto a given water body are appropriate and attainable; and 3) determine if any changesin key ambient biological, chemical, or physical indicators have taken place over time,particularly before and after the implementation of point source pollution controls orbest management practices for nonpoint sources. The data gathered by a biosurvey isprocessed, evaluated, and synthesized in a biological and water quality report2. Eachbiological and water quality report contains a summary of major findings andconclusions, recommendations for revisions to use designations, future monitoring
2 Approximately 150 of these reports have been produced since 1978.
205 Yoder and Rankin

needs, or other actions which may be needed to resolve impairment(s) of designateduses. While the principal focus of a biosurvey is on the status of aquatic life uses, thestatus of other uses such as recreation and water supply, as well as human healthconcerns, are also addressed. These reports are then used to support virtually anyOhio EPA program where the protection of aquatic resources is at issue.
Role of Biological CriteriaThere are a number of areas in water resource management in which biological criteriaand bioassessment methods can and do play a key role. As a criterion for determiningthe extent of any aquatic life use impairments, biocriteria have played a central role inthe biennial Ohio Water Resource Inventory (305[b] report; Ohio EPA 1994), theOhio Nonpoint Source Assessment (Ohio EPA 1990b; 1991), generating variouspriority lists (e.g., 303[d] and 304[l] listings), water quality permit supportdocuments, and comprehensive watershed assessments. Biological criteria representa measurable and tangible criterion against which the effectiveness of state and federalwater pollution abatement and water quality management programs can be judged.However, biological assessments must be accompanied by appropriate programactivity measures, ambient chemical/physical measures, measures of pollutantloadings, habitat quality characterizations, land use statistics, and other sourceinformation necessary to establish linkages between the activities which impact anddegrade aquatic ecosystems (i.e., stressors) and the resultant quality of the ecosystem(as implied by the various exposure and response indicators) to those impacts.
Ohio Water Quality Standards: Designated Aquatic Life UsesThe Ohio Water Quality Standards (WQS; Ohio Administrative Code 3745-1) consistof a classification system of designated uses and chemical, physical, and biologicalcriteria designed to represent measurable properties of the environment that areconsistent with the goals specified by each. Use designations consist of two broadgroupings, aquatic life and non-aquatic life uses. In applications of the Ohio WQS tothe management of water resource issues in Ohio’s rivers and streams, the aquatic lifeuse criteria apply to virtually all surface waters regardless of size and frequentlyresult in the most stringent protection and restoration requirements, hence theiremphasis in biological and water quality reports. The five different aquatic life usescurrently defined in the Ohio WQS are described as follows:
1) Warmwater Habitat (WWH) - this use designation defines the “typical”warmwater assemblage of aquatic organisms for Ohio rivers and streams; this userepresents the principal restoration target for the majority of water resourcemanagement efforts in Ohio.
206 Yoder and Rankin

2) Exceptional Warmwater Habitat (EWH) - this use designation is reserved forwaters which support “unusual and exceptional” assemblages of aquatic organismswhich are characterized by a high diversity of species, particularly those which arehighly intolerant and/or rare, threatened, endangered, or special status (i.e.,declining species); this designation represents a protection goal for water resourcemanagement efforts dealing with Ohio’s best water resources.
3) Coldwater Habitat (CWH) - this use is intended for waters which supportassemblages of cold water organisms and/or those which are stocked withsalmonids with the intent of providing a put-and-take fishery on a year roundbasis.
4) Modified Warmwater Habitat (MWH) - this use applies to streams and riverswhich have been subjected to extensive, maintained, and essentially permanenthydromodifications such that the biocriteria for the WWH use are not attainableand where the activities have been sanctioned and permitted by state or federallaw; the representative aquatic assemblages are generally composed of specieswhich are tolerant to low dissolved oxygen, silt, nutrient enrichment, and poorquality habitat.
5) Limited Resource Water (LRW) - this use applies to small streams (usually <3mi.2 drainage area) and other water courses which have been irretrievably alteredto the extent that no appreciable assemblage of aquatic life can be supported; suchwaterways generally include small streams in extensively urbanized areas, thosewhich lie in watersheds with extensive drainage modifications, those whichcompletely lack water on a recurring annual basis (i.e., true ephemeral streams), orother irretrievably altered waterways (e.g., dredged navigation channels, concretestream channels).
Chemical, physical, and/or biological criteria are generally assigned to each usedesignation in accordance with the narrative goals defined by each. As such thesystem of use designations employed in the Ohio WQS constitutes a “tiered”approach in that a gradient of appropriate levels of protection are afforded by each.This hierarchy is especially apparent in the water quality criteria established forparameters such as dissolved oxygen, ammonia-nitrogen, temperature, and thebiological criteria. For other parameters such as heavy metals, the technology toconstruct an equally graduated set of criteria has been lacking. The specifiedprocedure (Stephan et al. 1985) has not been able to produce different water qualitycriteria for the different aquatic life use designations. Thus the same water qualitycriterion may apply to two or more different use designations. However, we arepresently developing a technique for using ambient chemical data and the biological
207 Yoder and Rankin
criteria to derive tiered water quality criteria for heavy metals and other parameters.
Determination of Aquatic Life Use Attainment StatusBiological criteria in Ohio are based on two principal organism groups, fish andmacroinvertebrates. Numerical biological criteria for rivers and streams were derivedby utilizing the results of sampling conducted at more than 350 reference sites thattypify the range of "least impacted" conditions within each ecoregion (Ohio EPA1987b; 1989a). This information was then used within the existing framework oftiered aquatic life uses in the Ohio WQS to establish attainable, baseline biologicalcommunity performance expectations on a regional basis. Biological criteria vary byecoregion, aquatic life use designation, site type, and biological index. The resultingarray of biological criteria for two of the “fishable, swimmable” use designations,Warmwater Habitat (WWH) and Exceptional Warmwater Habitat (EWH) are shownin Figure 2 which demonstrates the stratification inherent to this process.
The relationship between the aquatic life use designations and narrative ratings ofaquatic community condition (termed hereafter as biological community performance)is described in Figure 3. This figure shows the theoretical range of biological integrity(from lowest to highest) compared to the corresponding scale of measurement offeredby the multimetric biological indices such as the IBI and ICI. The dual role ofbiological criteria to serve both as an indicator of aquatic life use status and biologicalintegrity is also demonstrated by Figure 3. For example, the Modified WarmwaterHabitat (MWH) use designation is assigned to streams which cannot attain theWarmwater Habitat (WWH) use designation due to circumstances (defined in theWQS; see p. 7) which preclude attainment of the WWH biological criteria3. However,the MWH biological criteria, which were derived from a separate set of habitatmodified reference sites, reflects only a fair level of aquatic community performancewhich is not considered to be consistent with the biological integrity goal of the CleanWater Act (CWA). Attainment of the biological criteria for the WWH andExceptional Warmwater Habitat (EWH) use designations reflect increasingly higherlevels of biological integrity which are considered to be consistent with the biologicalintegrity (good and exceptional performance, respectively) goals of the CWA.
3 Use designations such as Modified Warmwater Habitat (MWH) and Limited Resource Waters(LRW) do not meet the biological integrity goal of the Clean Water Act and are assigned on a case-by-case basis and must be based on a use attainability analysis which is performed by the state andapproved by U.S. EPA.
208 Yoder and Rankin

50/9.4
Fish — Wading SitesFish — Boat Sites
Fish — Headwater Sites Macroinvertebrates
34/8.6 40/8.7
42/8.5 40/8.6
38/8.7
32/7.3 38/7.9
40/8.3 44/8.4
40/8.1
28 40
40
40
44
34
30
34
36 36
Huron Erie Lake Plain - HELP
Interior Plateau - IP
Eastern-Ontario Lake Plain - EOLP
Western Allegheny Plateau - WAPEastern Corn Belt Plains - ECBP
50 46
48/9.6
EWH
IBI/Iwb IBI/Iwb
IBI ICI
EWH
EWH
EWH
Figure 2. Numerical biological criteria adopted by the Ohio EPA for the WarmwaterHabitat (WWH) and Exceptional Warmwater Habitat (EWH) use designationsarranged by biological index, site type, and ecoregion. Index values on each map arethe WWH biocriteria that vary by ecoregion as follows: IBI/MIwb for Boat Sites (upperleft), IBI/MIwb for Wading Sites (upper right), IBI for Headwater Sites (lower left), andthe ICI for all sites (lower right). The EWH criterion for each index and site type islocated in the boxes adjacent to each map.
209 Yoder and Rankin

BIOLOGICAL INTEGRITYLOW HIGH
Index Value
Max.
Min.
ExceptionalWarmwater
Habitat (EWH)
WarmwaterHabitat (WWH)
ModifiedWarmwater
Habitat (MWH)
LimitedResourceWaters (LRW)
(Statewide)
(non-HELP Ecoregions)
"Exceptional"
"Good"
"Poor-Very Poor"
(HELP Ecoregion)"Fair"
(Statewide)
(non-HELP Ecoregions)
"Fair"
(HELP Ecoregion)"Poor" MWH
WWH
EWH
LRW
Figure 3. Relationship between the tiered aquatic life uses in the Ohio WQS andnarrative evaluations of aquatic community performance and how thiscorresponds to a theoretical scale of biological integrity and measuredbiological index values (HELP = Huron/Erie Lake Plain ecoregion).
Procedures for determining the use attainment status of Ohio's lotic surface waterswere also developed (Ohio EPA 1987b; Yoder 1991b). Using the numerical biocriteriaas defined by the Ohio WQS, use attainment status is determined as follows:
1) FULL - the aquatic life use attainment status is considered to be full if all of theapplicable numeric indices exhibit attainment of the respective biological criteria;this means that the aquatic life goals of the Ohio WQS are being attained.
2) PARTIAL - at least one organism group exhibits non-attainment of the numericbiocriteria, but no lower than a narrative rating of fair performance, and the othergroup exhibits attainment.
3) NON - neither organism group exhibits attainment of the ecoregional biocriteria, orone organism group reflects a narrative performance rating of poor or very poor,even if the other group exhibits attainment.
210 Yoder and Rankin

Following these rules a use attainment table is constructed for a longitudinal stream orriver reach organized on a watershed basis. Information included in an attainmenttable are sampling location (river mile index), biological index scores, the QualitativeHabitat Evaluation Index (QHEI; Rankin 1989, 1995) score, attainment status, andcomments about important site specific factors such as proximity to pollutionsources. An example is provided by Table 1 for selected small urban and suburbanwatersheds throughout Ohio. This information may also be graphically portrayed in aclassic upstream-to-downstream longitudinal profile comparing the sampling result tolongitudinal position in a river or stream or as a scatter plot of the sampling resultsversus drainage area (an indicator of stream size) at each site. Either techniquepermits a visual examination of the biological sampling results in terms of position in awater body or watershed and the significance of deviations, if any, from the numericalbiological criteria.
Using Biosurveys and Biocriteria to Assess Aquatic Life Use Attainment Status inUrban and Suburban Ohio WatershedsBiological criteria can play an especially important role in nonpoint source assessmentand management since they directly correspond to important environmental goal andregulatory end-points, i.e., the biological integrity goal of the Clean Water Act andaquatic life designated uses in state WQS. Numerous studies have documented thecapability of biological assessments to accurately characterize aquatic ecosystemquality and condition in a wide variety of settings. Yoder and Rankin (1995b)described unique combinations of community response variables they termed“biological response signatures” within which different classes of environmentalstressors (e.g., toxicity, nutrient enrichment, habitat degradation) can be distinguished.Gammon et al. (1983, 1995) documented a “gradient” of compositional and functionalshifts in the fish and macroinvertebrate communities of small, agricultural watershedsin central Indiana. Community responses ranged from an increase in biomass withmild nutrient enrichment to complete shifts in community composition and function(e.g., insectivores replaced by omnivores) with increasingly severe impacts. Impactsfrom animal feedlots had the most pronounced effects. In the latter case the conditionof the immediate riparian zone was correlated with the degree of impairment. Otherwork by Gammon et al. (1990) suggested that nonpoint sources are impeding progressin making further biological improvements which have recently been observed in largerivers primarily in response to reduced point source impacts. Bennet et al. (1993)used the IBI as an endpoint in a GIS modeling exercise where land use characteristicsof agricultural watersheds in Virginia were correlated with the degradation of aquaticcommunities. Their goal was to develop a method for the most effective use oflimited resources in identifying the most critical sources of nonpoint source pollutionfor changes in land management in order to restore degraded water resources.
211 Yoder and Rankin

Table 1. Aquatic life use (ALU) attainment status for selected headwater streambiological sampling locations in urban/suburban areas of central Ohio. Eachline shows sampling location (river mile), index value, the habitat assessmentscore, use attainment status, and other information about the samplinglocation and/or watershed area.
_____________________________________________________________________
RIVER MILE ALU Attain- Fish/Invert. IBI ICIa QHEI ment Statusb Comments_____________________________________________________________________
Rose Run (1991)E. Corn Belt Plain - WWH Use Designation (Existing)
0.6/0.6 38ns MG 72.0 FULL Suburban dev.
Hamilton Ditch (1992)E. Corn Belt Plain - MWH Use Designation (Recommended)
1.3/0.3 28 8* 40.0 NON Channelized
Rush Run (1994)E. Corn Belt Plain - WWH Use Designation (Existing)
0.2/0.2 26* 4* 69.0 NON Residential, sewage
Trabue Run (1991)E. Corn Belt Plain - WWH Use Designation (Existing)
2.4/2.4 20* 8* 62.0 NON Commercial dev. 0.2/0.2 26* 20* 64.0 NON Light urban, spills
Republican Run (1991)E. Corn Belt Plain - WWH Use Designation (Existing)
0.2/0.2 36ns -- 63.0 [FULL] Suburban dev.
Eversole Run (1994)E. Corn Belt Plain - WWH Use Designation (Existing)
1.3/1.3 46 F* 70.0 PARTIAL Rural, intermittent____________________________________________________________________* Significant departure from ecoregion biocriterion; poor and very poor results are underlined.ns Nonsignificant departure from ecoregion biocriterion (<4 IBI or ICI units; <0.5 MIwb units).a The narrative evaluation using the qualitative sample (G-good, MG-marginally good, F-fair, P-poor) is
based on best professional judgment utilizing sample attributes such as taxa richness, EPT taxa richness,and community composition and is used in lieu of the ICI when artificial substrate data are not available.
b Aquatic life use (ALU) attainment status based on one organism group is parenthetically expressed.
Ecoregional Biological Criteria: E. Corn Belt Plain (ECBP)
INDEX - Site Type WWH EWH MWHc
IBI - Headwaters 40 50 24ICI 34 46 22c - Modified Warmwater Habitat for channelized habitats.
212 Yoder and Rankin

Biological responses to urban nonpoint source impacts have also been documented bynumerous investigators. Klein (1979) documented a relationship between increasingurbanization and biological impairment noting that the latter does not become severeuntil urbanization reaches 30% of the watershed area. Steedman (1988) used amodification of the IBI to demonstrate the influence of urban land use and riparianzone integrity in Lake Ontario tributaries. A model relationship between the IBI andthese two environmental factors was developed.
Biological monitoring of nonpoint source impacts and pollution abatement efforts inconcert with the more traditional water quality assessment tools (e.g.,chemical/physical) can produce the type of evaluation needed to determine whereurban nonpoint source management efforts should be focused, what some of themanagement goals should be, and to evaluate the effectiveness (i.e., end-result) of suchefforts (Yoder 1995a). At the same time a well conceived monitoring program canyield multi-purpose information which can be applied to similar situations withoutthe need for site-specific monitoring everywhere. This is best accomplished when alandscape partitioning framework such as ecoregions (Omernik 1987) and theirsubcomponents are used as an initial step in accounting for natural landscapevariability. It is because of landscape variability that uniform and overly simplifiedapproaches to nonpoint source management will fail to produce the desired results(Omernik and Griffith 1991).
Significant uncertainty exists about the link between steady-state water qualitycriteria applications and ecological indicators, particularly in complex urban settings.In many situations we have failed to detect chemical water quality criteria exceedencesat sites where biocriteria impairment is apparent and even severe (Ohio EPA 1990a).Much of the non-attainment that we have observed in urban watersheds is due to non-chemical impacts such as habitat degradation, changes in the flow regime, andsedimentation impacts. However, chemical water quality impacts which frequentlyescape detection or adequate characterization by the grab sampling approachcommonly employed by many local, state, and federal agencies are also thoughtresponsible for a significant portion of the non-attainment (Yoder 1995a). However,reaching this conclusion is made possible only by examining other evidence beyondconventional water column chemical data.
Bioassessments achieve their maximum effective use in the assessment of urbannonpoint sources when a watershed design to sampling and analysis is employed. Anexample of this design is illustrated by the results of Ohio EPA bioassessments ofsmall urban and suburban watersheds in southwest, central, and northeastern Ohio(Figure 4). The watersheds included in these figures include small, headwater streamsthat represent a range of land use from largely rural, agricultural settings to intensive
213 Yoder and Rankin

20
30
40
50
60
0510152025
IND
EX
OF
BIO
TIC
INT
EG
RIT
Y
12
DRAINAGE AREA (SQ. MI.)
WWH IBICriteria(IBI=40)
VERYPOOR
POOR
FAIR
GOOD
EXCEP-TIONAL
Central OhioUrban Streams (16)
0
20
40
60
80
100
0510152025
SUBURBANURBANURBAN/INDUSTRIALRURAL
QU
ALI
TA
TIV
E H
AB
ITA
TE
VA
LUA
TIO
N IN
DE
X (
QH
EI)
DRAINAGE AREA (SQ. MI.)
GOOD
EXCEP-TIONAL
FAIR
POOR
VERYPOOR
MARG-INAL
20
30
40
50
60
05101520
IND
EX
OF
BIO
TIC
INT
EG
RIT
Y
12
DRAINAGE AREA (SQ. MI.)
WWH IBICriteria(IBI=40)
VERYPOOR
POOR
FAIR
GOOD
EXCEP-TIONAL
S.W. Ohio UrbanStreams (19)
0
20
40
60
80
100
05101520
SUBURBANINTERCEPTOR SEWERS
URBAN/CSORURAL
QU
ALI
TA
TIV
E H
AB
ITA
TE
VA
LUA
TIO
N IN
DE
X (
QH
EI)
DRAINAGE AREA (SQ. MI.)
GOOD
EXCEP-TIONAL
FAIR
POOR
VERYPOOR
MARG-INAL
20
30
40
50
60
0510152025
IND
EX
OF
BIO
TIC
INT
EG
RIT
Y
12
DRAINAGE AREA (SQ. MI.)
WWH IBICriteria(IBI=40)
N.E. Ohio UrbanStreams (20)
VERYPOOR
POOR
FAIR
GOOD
EXCEP-TIONAL
0
20
40
60
80
100
0510152025
URBAN/CSOSUBURBAN
RURALURBAN/INDUSTRIAL/CSO
QU
ALI
TA
TIV
E H
AB
ITA
TE
VA
LUA
TIO
N IN
DE
X (
QH
EI)
DRAINAGE AREA (SQ. MI.)
GOOD
EXCEP-TIONAL
FAIR
POOR
VERYPOOR
MARG-INAL
Figure 4. Index of Biotic Integrity (IBI) and Qualitative Habitat Evaluation Index (QHEI)results from 110 biological monitoring locations in small urban and suburbanheadwater streams in central (upper), southwest (middle), and northeast (lower) Ohio.Narrative ratings of both biological performance and habitat quality are indicatedalong the Y2 axis. Each location was designated according to the broad landuse/impact categories that most influenced each watershed area.
214 Yoder and Rankin

urbanization. An attempt was made to exclude sites which were predominantlyimpacted by significant point sources. The land use/impact categories used weredesignated as rural, suburban, urban/industrial, urban with combined sewer overflows(CSO), urban/industrial with CSOs, and interceptor sewer line construction. Thesecategories were assigned to each sampling location based on our general knowledge of
the watershed area upstreamfrom the sampling site and isconsistent with the assignmentof impact types used by Yoderand Rankin (1995b) elsewherein Ohio.
The distribution of IBI scoresin these watersheds shows atendency towards lower IBIscores and a subsequent loss ofbiological integrity with anincreasing degree of urbaniza-tion, becoming more severe asother impact types such asCSOs, industrial, or commercialdevelopment
0
20
40
60
80
100
FULL ATTAINMENTNON-ATTAINMENTPOOR/VERY POOR
RU
RA
L
SU
BU
RB
AN
SE
WE
R L
INE
S
UR
BA
N/
IND
US
TRIA
L
UR
BA
N/C
SO
/IND
US
TRIA
L
UR
BA
N/C
SO
s
FR
EQ
UE
NC
Y (
% O
F S
ITE
S)
0 0
Figure 5. Frequency of biological monitoringlocations in central, southwest, and northeastOhio headwater streams which were in fullattainment or non-attainment of the applicableaquatic life use criteria and the proportion ofsites which reflected poor or very poorperformance as measured by the IBI. The resultsare stratified by the broad land use/impactcategories that most influenced the watershedarea upstream from each sampling location.
coincide. Out ofthe 110 sampling sites examin-ed only 25 exhibited good, verygood, or exceptional biologicalp e r f o r m a n c e w h i c hcorresponds to meeting the
WWH (good) or EWH (very good, exceptional) biocriteria for the IBI (Figure 5). Anadditional 19 sites were marginally good which means the IBI score was in the non-significant range of departure from the WWH IBI biocriterion. Forty-six sites (42%)reflected poor or very poor performance based on IBI values. Of the sites classifiedas being impacted by urban land use and pollution sources, only two sites attained theapplicable IBI biocriterion. Poor or very poor performance was reflected by themajority of the urban impacted sites (85%). More than 40% of the suburban siteswere impaired with many of these reflecting the impact of new developments forhousing and commercial uses. These results demonstrate the degree of degradationwhich exists in most small urbanized watersheds and the difficulty thus far in dealingwith multiple and diffuse sources of stress. Yoder (1995a) showed that the severityof biological impairments within urban areas was also influenced by stream and riversize (as measured by watershed area) with the most severe effects occurring in whatwe define as headwater streams, i.e., watershed areas less than 20 square miles.
215 Yoder and Rankin

While habitat impacts are responsible for some of the observed impairments amongthe 110 sites, most of the biologically impaired sites offered relatively good instreamhabitat (Figure 4). Thus factors other than direct habitat deficiencies as measured bythe QHEI are likely responsible for the majority of the observed impairment. Thisincludes direct chemical effects from permitted discharges, spills, contaminated runoff,and other releases. CSOs are a major source of impairment in urban watersheds and
besides contributing raw sewage, canalso include industrial wastewaterthat is discharged into the sewersystem. In many urban settings inOhio concentrations of chemicals inbottom sediments are frequentlyelevated compared to concentrationsmeasured at site-specific control orregional reference sites. Contaminated sediments generallyresult from releases which enter theaquatic environment during regularand episodic releases from pointsources (includes CSOs and stormsewers) and/or periodic runoff eventsfrom urban nonpoint sources. Thecorrespondence between elevatedconcentrations of toxic heavy metalsand declining aquatic communityperformance as portrayed by the IBIand ICI which is demonstrated byFigure 6. The results show thatincreasing levels of seven toxic heavymetals (arsenic, cadmium, chromium,copper, lead, nickel, and zinc)commonly encountered in urbansettings corresponded to a much
reduced
0
20
40
60
80
100
0-5
0
51
-10
0
10
1-1
50
15
1-2
00
20
1-2
50
25
1-3
00
30
1-3
50
35
1-4
00
40
1-4
50
45
1-5
00
>5
00
ICI >36 (Meets WWH)ICI >46 (Meets EWH)
NU
MB
ER
OF
SIT
ES
TOTAL TOXIC METALS (MG/KG)
0
10
20
30
40
50
60
70
80
0-5
0
51
-10
0
10
1-1
50
15
1-2
00
20
1-2
50
25
1-3
00
30
1-3
50
35
1-4
00
40
1-4
50
45
1-5
00
>5
00
IBI >40 (Meets WWH)IBI >50 (Meets EWH)
NU
MB
ER
OF
SIT
ES
TOTAL TOXIC METALS (MG/KG)
Figure 6. Frequency of biological samplingsites throughout Ohio at which ICI(upper) and IBI (lower) scores consistentwith the WWH and EWH biocriteriaoccurred at corresponding ranges oftotal toxic heavy metals in sediment.
frequency of sites with IBI and ICI scores that meet the typical WWH andEWH values. The frequency of sites meeting the EWH biocriteria declined markedlyat levels greater than 150 mg/kg and WWH attainment declined above 200 mg/kg. It isbelieved that the relationships demonstrated between the indicators of biologicalintegrity and the degree of sediment contamination by heavy metals is an accuratereflection of the history of toxic metals loadings from all sources, something thatfrequently escapes accurate characterization by the type of chemical grab samplingroutinely employed by local and state agencies.
216 Yoder and Rankin

While much attention is generally paid to toxic substances in urban nonpoint sourcerunoff, evidence suggests that non-toxic impacts are also significant, at least in Ohioand the midwest. Sedimentation (or siltation) resulting from urban and other land useactivities is a major impact from urban nonpoint sources and was the second leadingcause of impairment (from all sources) identified by the 1994 Ohio Water ResourceInventory (Ohio EPA 1994). Since 1988, this cause category has surpassed ammoniaand heavy metals, classes of pollutants most commonly associated with pointsources, in rank. Sedimentation is responsible for more impairment (over 1400 milesof stream and rivers and 23,000 acres of lakes, ponds, and reservoirs) than any othercategory except organic enrichment/dissolved oxygen (D.O.), with which it is closelyallied in both urban and agricultural areas.
Watershed impermeability has recently been suggested as an overall indicator of thelevel of “watershed stress” in terms of being correlated with an increasing degradationof aquatic life (Schueler 1994; Arnold and Gibbons 1996). Imperviousness has beencorrelated with an increased risk of impairment not only due to adverse effects onwatershed hydrology, but as a product of other impacts such as contaminated runoff,more frequent spills, and increasingly severe habitat impacts which correspond to thisstressor indicator. In the two papers we reviewed on this subject, watershedimperviousness was negatively correlated with the condition of the aquatic biota withdegradation becoming significant at 25-30% within a watershed. While we did notquantify this factor in our Ohio urban/suburban watershed examples (Figures 4 and 5)it seems plausible that imperviousness would be correlated with the results,particularly for small watersheds.
Use Attainability Issues in Urban and Suburban Ohio WatershedsAn emerging issue of increasing importance related to the preceding discussion and tothe restoration and management of small urban watersheds is that of use attainability.An important objective of the biosurveys conducted by Ohio EPA is to determine theappropriate and attainable aquatic life use designation. If the results of the samplingand data analysis suggest that an existing use designation is inappropriate (or thestream is presently unclassified) an appropriate use is then recommended. Theserecommendations are proposed in a WQS rulemaking procedure and adopted afterconsideration of public input.
The issue of urban and suburban development and the effects of each on aquatic lifeuse attainment in rivers and streams has increased in importance within the surfacewater programs at Ohio EPA. Small watersheds in established, older urban settingsare particularly at issue because of regulatory concerns such as CSOs and stormwatermanagement. As was amply demonstrated by our Ohio examples (Figures 4 and 5),
217 Yoder and Rankin

small streams in historically developed urban areas are not only impaired, but severelyso. This is generally due to multiple factors including chemical effects, physicalhabitat modifications, lack of sustained flows during normally recurring dry weatherperiods, higher peak flows during wet weather periods, and watershed scalemodifications of land use characteristics. Overlapping regulatory programs such asNPDES permits for point sources, CSO and sanitary sewer overflow (SSO) controland remediation, stormwater management, and construction site management arecommonplace throughout Ohio. The regulatory and/or management requirementsassociated with each are driven, in part, by the Ohio WQS. In our efforts to developstrategies to protect and restore designated uses the question of use attainabilityfrequently arises. It is widely perceived that the restoration of designated aquatic lifeuses consistent with the goals of the CWA (i.e., WWH) in intensively urbanized areasis neither practical nor attainable. This in itself can present a premature barrier to themanagement goal of restoring full use attainment or upgrading use designations forwaters now classified for less than CWA goal uses.
The assignment of appropriate and attainable aquatic life uses is a challenge that OhioEPA has dealt with over the past 20 years. Our approach has relied heavily onexperience with observing biological responses to different types of impacts and thehabitat assessment provided with the QHEI. Generally speaking if the QHEI revealsthat instream habitat is sufficient on a watershed or reach length scale to support anassemblage of aquatic life consistent with the WWH use, that use is adopted.Classification of waters to a less than CWA goal use designation such as MWH orLRW requires a showing that the WWH biocriteria are not attained and that habitat isan overriding and precluding factor in the non-attainment. In effect it must bedemonstrated that the WWH use is not attainable in the foreseeable future. Rankin(1995) has shown at what point habitat becomes a precluding factor by examining thevarious attributes of the QHEI which correlate with WWH attainment and non-attainment at sites where non-habitat impacts are minimal. Figure 7 exemplifies thisphenomenon by contrasting ranges of IBI values that correspond to the five narrativecategories with the ratio of modified:warmwater habitat attributes (as defined byRankin 1989) which increases as habitat becomes deficient in terms of being able tosupport an assemblage of aquatic life consistent with the WWH biocriteria. As thepredominance of modified habitat attributes increase to a modified:warmwater ratio ofgreater than 1.0-1.5 the likelihood of having IBI scores consistent with the WWH usedeclines. This relationship bears out better where the QHEI score and attributesratios are analyzed on a reach length or watershed scale (Rankin 1995).
The decision to assign a less than CWA goal use (e.g., MWH or LRW) must also meetthe conditions prescribed by the U.S. EPA WQS regulations (40 CFR, Part 131) thatrestoring to a higher designated use would result in widespread, adverse social and
218 Yoder and Rankin

economic impacts or the higher use is not attainable due to irretrievable effects ofanthropogenic origin or natural conditions. The most frequently used reason forassigning either the MWH or LRW uses in Ohio is due to irretrievable physicaleffects. For example, the MWH use designation applies in situations of wide-spreadstream habitat modifications for agricultural drainage purposes (e.g., channelization)
and where that activity issanctioned by state and/or federallaw. Less frequently
RA
TIO
OF
MO
DIF
IED
:WA
RM
-W
AT
ER
HA
BIT
AT
AT
TR
IBU
TE
S
N = 666 Sites
0
2
4
6
8
1 0
1 2
1 4
1 6
12-19(VERY
POOR)
20-29(POOR)
30-39(FAIR)
40-49(GOOD)
50-60(EXCEP- TIONAL)
Figure 7. Relationship between the ratio ofmodified:warmwater habitat attributes andranges of the IBI corresponding to the fivenarrative categories of biological communityperformance. The data is from a set of leastimpacted and habitat modified reference sitesthroughout Ohio. This analysis employs abox-and-whisker plot showing the median,interquartile, maximum, minimum, 90th and10th percentile, and outlier IBI values.
encounteredhabitat modifications include run-of-river impoundment by low headdams, or heavy sedimentation dueto non-acidic mine drainage andwhere reclamation activities are notexpected. The LRW use applies tocases of severe, watershed-widedrainage modifications and acidicmine drainage where reclamationactivities are not expected. Withthe exception of isolated instancesof direct channelization, the mostfrequently encountered situationwith small urban streams is thesevere disruption of local habitatsuch as riparian encroachment andremoval, replacement of the naturalsubstrate with artificial materials
(e.g., concrete, rock-basket gabions), and broad scale watershed modifications. Insuch cases the QHEI scores are frequently reflective of poor or very poor habitatquality yielding extremely high modified:warmwater habitat ratios (Fig. 7). In suchcases flow conditions may also be ephemeral or inadequate to support any except themost tolerant forms of aquatic life, or the stream is virtually eliminated by culverting.Such situations are relatively easy to diagnose and assignment of the LRW use is theresult.
The situation is different when the habitat evaluation indicates that sufficientwarmwater attributes are present to suggest attainment of WWH is possible. In suchcases WWH is viewed as attainable (as the data from several of our smallurban/suburban watersheds suggest) even though the aquatic communities onlyperform in the poor or very poor ranges. As previously mentioned the impairmentmay be due to sources which theoretically could be abated or sufficiently controlled,thus resulting in the full restoration of the WWH use. The key point here is that uses
219 Yoder and Rankin

are based on potential, not the present-day biological attainment status. However, thechallenges of managing stressors such as spills, runoff, and CSOs is daunting becauseof the diffuse nature of these sources and the periodicity of their influence. In someof our urbanized watersheds the attainability of the WWH use has recently come intoquestion even when the QHEI data suggests that WWH is attainable. This issue hasbecome more complicated in light of the recent information about the potential ofimperviousness to influence biological performance in urban watersheds (Schueler1994; Arnold and Gibbons 1996).
Managing CSOs is a growing challenge for Ohio EPA and other local, state, and federalagencies. Current policy involves the establishment of a state-specific strategy andimplementation of nine minimum controls by major CSO entities. In some of themajor CSO communities of Ohio, questions have been raised about the attainability ofthe WWH biological criteria and how this might eventually affect CSO abatementstrategies. While these questions may have merit in light of the recent literatureconcerning imperviousness and our own findings about the extent of aquatic lifeimpairment in small urban watersheds, it would be premature to in effect “give up” onWWH attainment without first implementing the nine minimum CSO controls. Inaddition, resolving this issue will involve an examination of many other factors inaddition to imperviousness on a broad geographic scale. Until this type ofexploratory research is completed making fundamental changes to the use designationprocess would be premature.
Applications to the Management of Urban WatershedsSteedman (1988) observed the IBI to be negatively correlated with urban land use.The land use within the 10-100 km2 of a site was the most important in predicting theIBI which suggests that “extraneous” information was likely included if wholewatershed land use information was used. Thus, scale will be another importantconsideration in the assessment of urban watersheds. Steedman (1988) alsodiscovered that the condition of the riparian zone was an important covariate withland use, in addition to other factors such as sedimentation and nutrient enrichment.A model relationship between land use and riparian zone quantity and the IBI wasdeveloped. This relationship provided the basis to predict when the IBI woulddecline below a certain threshold level based on combinations of riparian zonequantity and percent of urbanization. In the Steedman (1988) study the domain ofdegradation for Toronto area streams ranged from 75% riparian removal at 0%urbanization to 0% riparian removal at 55% urbanization. These results indicate thatit is possible to establish the bounds within which the combination of watershed landuse and riparian zone quantity must be maintained in order to attain a target level ofbiological community performance as measured by the IBI. It seems plausible thatsuch relationships could be established for many other watersheds provided the
220 Yoder and Rankin

baseline database is sufficiently developed not only for biological communities, butfor land use stressors and riparian condition as well. Additionally including theconcept of ecoregions and sub-ecoregions should lead to the development ofmanagement criteria for land use, riparian zones, and other important covariates whichwould assure the maintenance of aquatic life uses in streams and rivers over fairlybroad areas without the need to develop a site-specific database everywhere.
ConclusionsWell designed biological surveys and biological criteria can contribute essentialinformation and capacity to urban and suburban watershed management. Because thebiota respond to and integrate all of the various factors that affect a particular waterbody they are essentially the end-product of what happens within watersheds. Theimportant issue is that ambient monitoring be done as part of the overall watershedmanagement and assessment process and be done correctly in terms of timing,methods, and design. However, monitoring alone is not enough. Federal, state, local,and private efforts to remediate impaired watersheds must include an interdisciplinaryapproach that includes the range of factors responsible for the type of ecosystemdegradation that has been documented in urban and suburban watersheds throughoutNorth America. Effective protection and rehabilitation strategies will require thetargeting of large areas and individual sites (Schaefer and Brown 1992), as well as theincorporation of ecological concepts in the status quo of land use and water qualitymanagement practices and policies.
Urban watershed management and protection strategies will continue to develop asnew information is revealed and relationships between instream biological communityperformance and watershed factors are better developed and understood. However,there are some things which we know now that should become part of our currentmanagement strategies. Urban and suburban development must become proactive,i.e., the design of such developments must accommodate the features of the naturallandscape and include common sense practices such as minimum widths for riparianzones and the attenuation of peak runoff events. Regulatory agencies also share theresponsibility particularly in resolving the difficult use attainability questions.Watersheds which exhibit attainment of aquatic life use biocriteria should be protectedto maintain current conditions as new development represents an almost certainthreat. Strategies should also include the restoration of degraded watersheds wherethe potential for recovery actually exists. In systems where the degree of degradationis so severe that the damage is essentially irretrievable, minimal enhancement measurescould still be considered even though full recovery is not to be expected. Biocriteriaand bioassessments have an important and central role to play in this process nowand into the future.
221 Yoder and Rankin

AcknowledgementsRoger Bannerman, Marc Smith, and Jeff DeShon reviewed an original draft and providedhelpful comments.
ReferencesArnold, C.L. And C. J. Gibbons. 1996. Impervious surface coverage: the emergence of a key
environmental indicator. J. Am. Planning Assoc. 62(2): 243-258.
Barbour, M.T. and others. 1996. A framework for biological criteria for Florida streamsusing benthic macroinvertebrates. J. N. Am. Benth. Soc. 15(2): 185-211.
Benke, A.C. 1990. A perspective on America’s vanishing streams. J. N. Am. Benth. Soc., 9(1): 77-88.
Bennet, M.R., J.W. Kleene, and V.O. Shanholtz. 1993. Total maximum daily load nonpointsource allocation pilot project. File Report, Dept. of Agricultural Engineering,Blacksburg, VA. 49 pp.
Davis, W.S. and A. Lubin. 1989. Statistical validation of Ohio EPA's invertebratecommunity index, pp. 23-32. in Davis, W.S. and T.P. Simon (eds.). Proc. 1989Midwest Poll. Biol. Mtg., Chicago, Ill. EPA 905/9-89/007.
DeShon, J.D. 1995. Development and application of the invertebrate community index(ICI), pp. 217-243. in W.S. Davis and T. Simon (eds.). Biological Assessment andCriteria: Tools for Risk-based Planning and Decision Making. Lewis Publishers,Boca Raton, FL.
Fausch, K. D., J. R. Karr, and P. R. Yant. 1984. Regional application of an index of bioticintegrity based on stream fish communities. Transactions of the American FisherySociety 113:39-55.
Fore, L. S., J.R. Karr, and R.W. Wisseman. 1996. Assessing invertebrate responses tohuman activities: evaluating alternative approaches. J. N. Am. Benth. Soc. 15(2): 212-231.
Hill, M. T. , W. S. Platts, and R. L. Beschta. 1991. Ecological and geomorphological conceptsfor instream and out-of-channel flow requirements. Rivers 2: 198-210.
Gammon, J.R., Spacie, A., Hamelink, J.L., and R.L. Kaesler. 1981. Role of electrofishing inassessing environmental quality of the Wabash River, pp. 307-324. in Ecologicalassessments of effluent impacts on communities of indigenous aquatic organisms, inBates, J. M. and Weber, C. I., Eds., ASTM STP 730.
222 Yoder and Rankin

Gammon, J.R., M.D. Johnson, C.E. Mays, D.A. Schiappa, W.L. Fisher, and B.L. Pearman.1983. Effects of agriculture on stream fauna in central Indiana. EPA-600/S3-83-020,5 pp.
Gammon, J.R. 1976. The fish populations of the middle 340 km of the Wabash River,Purdue University, Water Resources Res. Cen. Tech. Rep. 86. 73 p.
Gammon, J.R., C.W. Gammon, and M.K. Schmid. 1990. Land use influence on fishcommunities in central Indiana streams. Proc. 1990 Midwest Poll. Biol. Conf., EPA905/R-92/003. 111-120.
Gammon, J.R. 1995. An environmental assessment of the streams of Putnam County,Indiana and vicinity with special emphasis on the effects of animal feedlots. Reportto Indiana Dept. Nat. Res., DePauw University, Greencastle, IN. 124 pp.
Jackson, S. 1992. Re-examining independent applicability: agency policy and current issues.Water Quality Standards for the 21st Century, Proceedings of the Third NationalConference. U.S. EPA, Offc. Science and Technology, Washington, D.C. 823-R-92-009, 135-138.
Karr, J. R. 1981. Assessment of biotic integrity using fish communities. Fisheries 6(6): 21-27.
Karr, J. R. 1991. Biological integrity: A long-neglected aspect of water resource management.Ecological Applications 1(1): 66-84.
Karr, J. R., K. D. Fausch, P. L. Angermeier. P. R. Yant, and I. J. Schlosser. 1986. Assessingbiological integrity in running waters: A method and its rationale. Illinois NaturalHistory Survey Special Publication No. 5, 28 pp. Champaign, Illinois
Karr, J. R., L. A. Toth, and D. R. Dudley. 1985. Fish communities of midwest rivers: Ahistory of degradation. BioScience 35 (2): 90-95.
Kelly, M.H. and R.L. Hite. 1984. Evaluation of Illinois stream sediment data: 1974-1980.Illinois EPA, Div. Water Poll. Contr., Springfield, Ill.
Kerans, B. L., and Karr, J. R. 1992. An evaluation of invertebrate attributes and a benthicindex of biotic integrity for Tennessee Valley rivers, Proc. 1991 Midwest Poll. Biol.Conf., EPA 905/R-92/003.
Klein, R.D. 1979. Urbanization and stream quality impairment. Water Res. Bull. 15(4):948-963.
223 Yoder and Rankin

Lyons, J. 1992. Using the index of biotic integrity (IBI) to measure environmental quality inwarmwater streams of Wisconsin. Gen. Tech. Rep. NC-149. St. Paul, MN: USDA,Forest Serv., N. Central Forest Exp. Sta. 51 pp.
Miner R. and D. Borton. 1991. Considerations in the development and implementation ofbiocriteria, Water Quality Standards for the 21st Century,, Washington, D.C., 115.
Ohio Environmental Protection Agency. 1987a. Biological criteria for the protection ofaquatic life: Volume I. The role of biological data in water quality assessment.Division of Water Quality Monitoring and Assessment, Surface Water Section,Columbus, Ohio.
Ohio Environmental Protection Agency. 1987b. Biological criteria for the protection ofaquatic life: Volume II. Users manual for biological field assessment of Ohio surfacewaters. Division of Water Quality Monitoring and Assessment, Surface WaterSection, Columbus, Ohio.
Ohio Environmental Protection Agency. 1988. Water Quality Inventory - 1988 305(b)report. Volume I. E.T. Rankin, editor. Division of Water Quality Monitoring andAssessment, Surface Water Section, Columbus, Ohio .
Ohio Environmental Protection Agency. 1989a. Biological criteria for the protection ofaquatic life: Volume III. Standardized biological field sampling and laboratorymethods for assessing fish and macroinvertebrate communities. Division of WaterQuality Monitoring and Assessment, Columbus, Ohio.
Ohio Environmental Protection Agency. 1989b. Addendum to Biological criteria for theprotection of aquatic life: Volume II. Users manual for biological field assessment ofOhio surface waters. Division of Water Quality Monitoring and Assessment, SurfaceWater Section, Columbus, Ohio.
Ohio Environmental Protection Agency. 1990a. Ohio Water Resource Inventory, Volume I:Summary, Status and Trends, 1990. E. T. Rankin, C. O. Yoder, and D.S. Mishne,(editors). Division of Water Quality Planning and Assessment, EcologicalAssessment Section. Columbus, Ohio.
Ohio Environmental Protection Agency. 1990b. Ohio's nonpoint source pollutionassessment. Division of Water Quality Planning and Assessment.. Columbus, Ohio.
Ohio Environmental Protection Agency. 1991. 1991 Ohio nonpoint source assessment. OhioEPA. Division of Water Quality Planning and Assessment. Columbus, Ohio.
224 Yoder and Rankin

Ohio Environmental Protection Agency. 1994. 1994 Ohio Water Resource Inventory,Volume I: Summary, Status and Trends. E. T. Rankin, C. O. Yoder, and D.Mishne,(eds). Division of Surface Water, Monitoring & Assessment Section, Columbus,Ohio.
Omernik, J. M. 1987. Ecoregions of the conterminous United States. Ann. Assoc. Amer.Geogr. 77(1):118-125.
Omernik, J. M., and G. E. Griffith 1991. Ecological regions versus hydrologic units:frameworks for managing water quality, Journal of Soil and Water Conservation, 46,334.
Pihfer, M. T. 1991. Biocriteria: just when you thought it was safe to go back into the water.Environment Reporter, Bureau of National Affairs, 0013-9211.
Plafkin, J. L. and others. 1989. Rapid Bioassessment Protocols for use in rivers and streams:benthic macroinvertebrates and fish. EPA/444/4-89-001. U.S. EPA. Washington, D.C.
Rankin, E. T. and C. O.Yoder. 1990. The nature if sampling variability in the Index of BioticIntegrity (IBI)in Ohio streams. Pages 9-18. In: W. S. Davis (editor). Proceedings ofthe 1990 Midwest Pollution Control Biologists Conference, U. S. EPA, Region V,Env. Sci. Div., Chicago, IL. EPA-905-9-90/005.
Rankin, E. T. 1989. The Qualitative Habitat Evaluation Index (QHEI). Rationale, methods,and applications. Division of Water Quality Planning and Assessment, EcologicalAnalysis Section. Columbus, Ohio.
Rankin, E. T. 1995. The use of habitat assessments in water resource management programs,pp. 181-208. in W. Davis and T. Simon (eds.). Biological Assessment and Criteria:Tools for Water Resource Planning and Decision Making. Lewis Publishers, BocaRaton, FL.
Ruffier, P.J. 1992. Re-examining independent applicability: regulatory policy should reflecta weight of evidence approach. Water Quality Standards for the 21st Century,Proceedings of the Third National Conference, U.S. EPA, Offc. Science andTechnology, Washington, D.C. 823-R-92-009, 139-147.
Schmidt, W.A. 1992. Water quality protection requires independent application of criteria.Water Quality Standards for the 21st Century, Proceedings of the Third NationalConference, U.S. EPA, Offc. Science and Technology, Washington, D.C. 823-R-92-009, 157-164.
225 Yoder and Rankin
Schaefer, J.M. and M.T. Brown. 1992. Designing and protecting river corridors for wildlife.Rivers, 3(1): 14-26.
Schregardus, D.R. 1992. Re-examining independent applicability: biological criteria are thebest measure of the integrity of a water body and should control when there is aconflict. Water Quality Standards for the 21st Century, Proceedings of the ThirdNational Conference, U.S. EPA, Offc. Science and Technology, Washington, D.C.823-R-92-009, 149-156.
Schueler, T.R. 1994. The importance of imperviousness. Watershed Protection Techniques,1(3): 100-111.
Simon, T. 1991. Development of index of biotic integrity expectations for the ecoregions ofIndiana. I. Central corn belt plain. EPA-905/9-91/025. 93 pp.
Steedman, R.J. 1988. Modification and assessment of an index of biotic integrity to quantifystream quality in southern Ontario. Can. J. Fish. Aquatic Sci. 45: 492-501.
Stephan, C. E., and others. 1985. Guidelines for deriving numerical National water qualitycriteria for the protection of aquatic organisms and their uses. National TechnicalInformation Service, Springfield, VA.
Stevens, J.C. and S.W. Szczytko. 1990. The use and variability of the biotic index tomonitor changes in an effluent stream following wastewater treatment plant upgrades,pp. 33-46. in Davis, W.S. (ed.). Proc. 1990 Midwest Poll. Biol. Mtg., Chicago, Ill.EPA-905-9-90/005.
Trautman, M. B. 1981. The fishes of Ohio. (2nd edition). Ohio State University Press.Columbus, Ohio. 782 pp.
U. S. Environmental Protection Agency. 1990. Biological Criteria: national program guidancefor surface waters. U. S. EPA, Office of Water Regulations and Standards,Washington, D. C. EPA-440/5-90-004.
U.S. Environmental Protection Agency. 1991. Policy on the use of biological assessments andcriteria in the water quality program. Offc. Science and Technology, Washington,D.C.
Yoder, C. O. 1989. The development and use of biocriteria for Ohio surface waters. In:Gretchin H. Flock, editor. Water quality standards for the 21st century. Proceedingsof a National Conference, U. S. EPA, Office of Water, Washington, D.C.
226 Yoder and Rankin

Yoder, C. O. 1991a. Answering some concerns about biological criteria based on experiencesin Ohio. In: Gretchin H. Flock, editor. Water quality standards for the 21st century.Proceedings of a National Conference, U. S. EPA, Office of Water, Washington, D.C.
Yoder, C. O. 1991b. The integrated biosurvey as a tool for evaluation of aquatic life useattainment and impairment in Ohio surface waters. Biological Criteria: Research andRegulation. Proceedings of a National Conference, U. S. EPA, Office of Water,Washington, D.C.
Yoder, C. O. 1995a. Incorporating ecological concepts and biological criteria in the assessmentand management of urban nonpoint source pollution. National Conference on UrbanRunoff Management: Enhancing Urban Watershed Management at the Local, County,and State Levels. EPA/625/R-95/003. pp. 183-197.
Yoder, C.O. 1995b. Policy issues and management applications for biological criteria, pp.327-344. in W. Davis and T. Simon (eds.). Biological Assessment and Criteria: Toolsfor Water Resource Planning and Decision Making. Lewis Publishers, Boca Raton,FL.
Yoder, C.O. and E.T. Rankin. 1995a. Biological criteria program development andimplementation in Ohio, pp. 109-144. in W. Davis and T. Simon (eds.). BiologicalAssessment and Criteria: Tools for Water Resource Planning and Decision Making.Lewis Publishers, Boca Raton, FL.
Yoder, C.O. and E.T. Rankin. 1995b. Biological response signatures and the area ofdegradation value: new tools for interpreting multimetric data, pp. 263-286. in W.Davis and T. Simon (eds.). Biological Assessment and Criteria: Tools for WaterResource Planning and Decision Making. Lewis Publishers, Boca Raton, FL.
227 Yoder and Rankin