Embed Size (px)
Citation preview

25 YMFG Annual Report 2017
1. BASIS OF PRESENTATION
Yamaguchi Financial Group, Inc. (“YMFG”) is a holding
company for The Yamaguchi Bank, Ltd. (“Yamaguchi
Bank”), Momiji Bank, Ltd. (“Momiji Bank”), The Kitakyushu
Bank, Ltd. (“Kitakyushu Bank”) and other subsidiaries.
YMFG and its consolidated subsidiaries (“the Group”)
maintain their accounts and records in accordance with
the provisions set forth in the Financial Instruments and
Exchange Law and its related accounting regulation and
in conformity with accounting principles and practices
generally accepted in Japan (“Japanese GAAP”). Japanese
GAAP are different in certain respects as to application
and disclosure requirements of International Financial
Reporting Standards.
The accompanying consolidated fi nancial statements
are a translation of the audited consolidated fi nancial
statements of YMFG which were prepared in accordance
with Japanese GAAP and were fi led with the appropriate
Local Finance Bureau of the Ministry of Finance as required
by the Financial Instruments and Exchange Law.
In preparing the accompanying consolidated fi nancial
statements, certain restructuring and reclassifi cations have
been made in the consolidated fi nancial statements issued
domestically in order to present them in a form which is
more familiar to readers outside Japan.
The consolidated fi nancial statements are stated in
Japanese yen. The translations of the Japanese yen
amounts into U.S. dollars are included solely for the
convenience of readers, using the prevailing exchange rate
at March 31, 2017, which was ¥112.19 to U.S.$1.00. Such
translations should not be construed as representations
that the Japanese yen amounts have been, could have
been, or could in the future be, converted into U.S. dollars
at this or any other rate of exchange.
2. SIGNIFICANT ACCOUNTING POLICIES
Consolidation and equity method(1) Scope of consolidation
Japanese accounting standards on consolidated
fi nancial statements require a company to consolidate
any subsidiaries of which the company substantially
controls the operations, even if it is not a majority
owned subsidiary. Control is defi ned as the power to
govern the decision making body of an enterprise.
(i) 16 consolidated subsidiaries at March 31, 2017
and 14 at March 31, 2016.
The names of the main consolidated subsidiaries
are listed on page 1.
The scope of consolidation includes YM Life
Planning Co., Ltd., due to its establishment in the
fi scal year ended March 31, 2017. In addition,
the newly established YM Life Planning Co., Ltd.
acquired all shares in HOKEN HIROBA Co., Ltd.
Accordingly, HOKEN HIROBA is included in YMFG’s
scope of consolidation from the current fi scal year.
(ii) Five unconsolidated subsidiaries at March 31, 2017
and 2016.
Name of major subsidiary:
Yamaguchi Capital 2nd Investment Business
Limited Liability Association
The unconsolidated subsidiaries are excluded
from the scope of consolidation because their total
assets, ordinary income, net income (in proportion
to ownership), retained earnings (in proportion to
ownership) and accumulated other comprehensive
income are so immaterial that they do not hinder a
rational judgment of YMFG’s consolidated fi nancial
position and results of operations when excluded
from the scope of consolidation.
(2) Application of the equity methodJapanese accounting standards also require any
unconsolidated subsidiaries and affi liates with fi nancial
and operating policies over which YMFG is able to
exercise material infl uence to be accounted for by the
equity method.
(i) No unconsolidated subsidiaries were accounted for
by the equity method at March 31, 2017 and 2016.
(ii) As at March 31, 2017 and 2016, three affi liates
accounted for by the equity method, and these
affi liates at March 31, 2017 and 2016 were as follows:
Years ended March 31, 2017 and 2016
Notes to Consolidated Financial Statements
YMFG Annual Report 2017 26
YM Saison Co., Ltd.
Yamaguchi Capital Co., Ltd.
Momiji Card Co., Ltd.
(iii) As at March 31, 2017 and 2016, fi ve
unconsolidated subsidiaries were not accounted for
by the equity method.
Name of major subsidiary:
Yamaguchi Capital 2nd Investment Business
Limited Liability Association
The unconsolidated subsidiaries that are not
accounted for by the equity method are also
excluded from the scope of application of equity
method because their net income (in proportion
to ownership), retained earnings (in proportion to
ownership) and accumulated other comprehensive
income (in proportion to ownership) are so
immaterial that they do not hinder a rational
judgment of YMFG’s consolidated fi nancial position
and results of operations when excluded from the
scope of equity method.
(iv) There were no affi liates that were not accounted
for by the equity method as at March 31, 2017
and 2016.
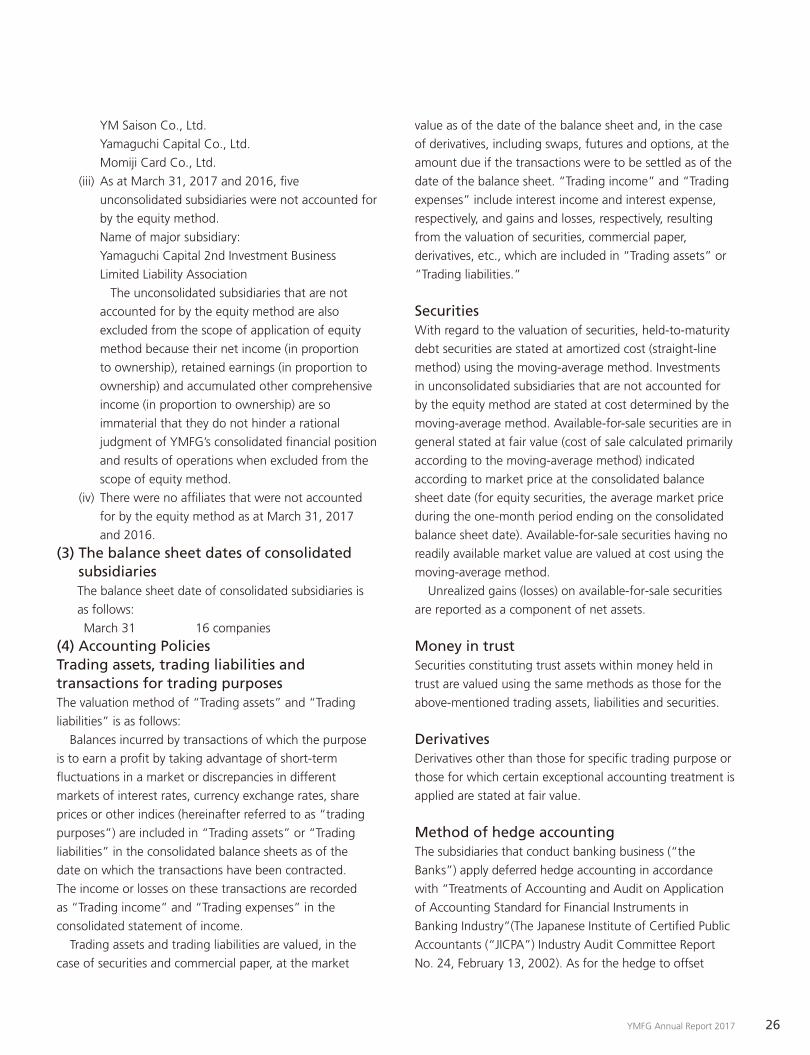
(3) The balance sheet dates of consolidated subsidiaries The balance sheet date of consolidated subsidiaries is
as follows:
March 31 16 companies
(4) Accounting PoliciesTrading assets, trading liabilities and transactions for trading purposesThe valuation method of “Trading assets” and “Trading
liabilities” is as follows:
Balances incurred by transactions of which the purpose
is to earn a profi t by taking advantage of short-term
fl uctuations in a market or discrepancies in different
markets of interest rates, currency exchange rates, share
prices or other indices (hereinafter referred to as “trading
purposes”) are included in “Trading assets” or “Trading
liabilities” in the consolidated balance sheets as of the
date on which the transactions have been contracted.
The income or losses on these transactions are recorded
as “Trading income” and “Trading expenses” in the
consolidated statement of income.
Trading assets and trading liabilities are valued, in the
case of securities and commercial paper, at the market
value as of the date of the balance sheet and, in the case
of derivatives, including swaps, futures and options, at the
amount due if the transactions were to be settled as of the
date of the balance sheet. “Trading income” and “Trading
expenses” include interest income and interest expense,
respectively, and gains and losses, respectively, resulting
from the valuation of securities, commercial paper,
derivatives, etc., which are included in “Trading assets” or
“Trading liabilities.”
SecuritiesWith regard to the valuation of securities, held-to-maturity
debt securities are stated at amortized cost (straight-line
method) using the moving-average method. Investments
in unconsolidated subsidiaries that are not accounted for
by the equity method are stated at cost determined by the
moving-average method. Available-for-sale securities are in
general stated at fair value (cost of sale calculated primarily
according to the moving-average method) indicated
according to market price at the consolidated balance
sheet date (for equity securities, the average market price
during the one-month period ending on the consolidated
balance sheet date). Available-for-sale securities having no
readily available market value are valued at cost using the
moving-average method.
Unrealized gains (losses) on available-for-sale securities
are reported as a component of net assets.
Money in trustSecurities constituting trust assets within money held in
trust are valued using the same methods as those for the
above-mentioned trading assets, liabilities and securities.
DerivativesDerivatives other than those for specifi c trading purpose or
those for which certain exceptional accounting treatment is
applied are stated at fair value.
Method of hedge accountingThe subsidiaries that conduct banking business (“the
Banks”) apply deferred hedge accounting in accordance
with “Treatments of Accounting and Audit on Application
of Accounting Standard for Financial Instruments in
Banking Industry”(The Japanese Institute of Certifi ed Public
Accountants (“JICPA”) Industry Audit Committee Report
No. 24, February 13, 2002). As for the hedge to offset

27 YMFG Annual Report 2017
market fl uctuation, the Banks assess the effectiveness of
the hedge by grouping the hedged items such as deposits
and loans and the hedging instruments such as interest rate
swaps by their maturity.
Also, the Banks apply deferred hedge accounting to
hedge foreign exchange risks associated with various
foreign currency denominated monetary assets and
liabilities as stipulated in “Treatment of Accounting and
Auditing Concerning Accounting for Foreign Currency
Transactions in Banking Industry” (JICPA Industry
Audit Committee Report No. 25, July 29, 2002). The
effectiveness of the currency swap transactions, exchange
swap transactions and similar transactions hedging the
foreign exchange risks of monetary assets and liabilities
denominated in foreign currencies is assessed based on
comparison of the foreign currency position of the hedged
monetary assets and liabilities and the hedging instruments.
The Banks apply an exceptional treatment, as permitted
if certain conditions are met, for certain interest rate swaps
utilized as hedging instrument. In that treatment, the
interest swap contracts are not recorded at fair values but
the net interest to be paid or received under the contracts is
added or deducted to the interest arising from their related
hedged assets or liabilities.
Allowance for loan lossesThe Banks provide allowance for loan losses according to the following write-off and provisioning standards. For loans to borrowers who are legally bankrupt (due to bankruptcy, composition, suspension of transactions with banks by the rules of clearinghouses, etc.) or substantially bankrupt, an allowance is provided in the amount of loans, net of amounts expected to be collected through disposition of collateral or through execution of guarantees. For loans to borrowers in danger of bankruptcy, an allowance is provided in the amount considered uncollectible based on the amount of loans, net of amounts expected to be collected through disposition of collateral or through execution of guarantees, and other sources. Loans to normal borrowers and borrowers requiring caution are classifi ed into certain groups, and an allowance is provided for each group using the rate of loan losses experienced for the Banks during certain reference periods in the past.
Each branch as well as the credit supervision department evaluates all loans in accordance with the self-assessment rule. Other consolidated subsidiaries provide an allowance for an amount calculated using the rate of collection losses in the past for loans of normal borrowers in addition to amounts estimated based on collectability analysis for borrowers in danger of bankruptcy and certain other borrowers.
Tangible fi xed assets (excluding lease assets)Depreciation of tangible fi xed assets of YMFG and its
consolidated subsidiaries that conduct banking business
are computed by using the declining-balance method
except for buildings (excluding fi xtures) acquired after April
1, 1998 and fi xtures and buildings acquired after April
1, 2016, which are depreciated using the straight-line
method.
The estimated useful lives of the assets are primarily as
follows:
Buildings: 7 to 50 years
Others: 3 to 15 years
Other consolidated subsidiaries depreciate their tangible
fi xed assets using mainly the declining-balance method
over the useful lives of the respective assets provided by
the tax act in Japan.
Intangible fi xed assets (excluding lease assets)Amortization of intangible fi xed assets is computed by
using the straight-line method. Software costs for internal
uses are amortized over the estimated useful life (5 years).
Lease assetsLease assets included within tangible and intangible fi xed
assets related to fi nance lease transactions that do not
transfer ownership are depreciated over the lease term
using the straight-line method. For lease assets with a
guaranteed residual value stated in their lease agreements,
the residual value is set at the guaranteed amount.
Otherwise, the residual value is assumed to be zero.
Income taxesIncome taxes comprise corporate, enterprise and inhabitant
taxes. The Group recognizes tax effects of temporary
differences between the fi nancial statement basis and the
tax basis of assets and liabilities. The asset and liability

YMFG Annual Report 2017 28
approach is used to recognize deferred tax assets and
liabilities for the expected future tax consequences of
temporary differences.
Foreign currency translationForeign currency assets and liabilities and the accounts of
overseas branches of YMFG and consolidated subsidiaries
are translated into yen at the rates prevailing at the
consolidated balance sheet date.
Provision for bonusesProvision for bonuses is provided for payment of bonuses
to employees, in the amount of estimated bonuses that are
attributable to the fi scal year.
Method of accounting for retirement benefi tsWhen calculating retirement benefi t obligations, the
benefi t formula method is used for attributing expected
retirement benefi ts to periods through the year-end. The
methods for recognizing past service cost and actuarial
gains or losses are as follows:
Past service cost: Recognition of past service cost
is apportioned by the straight-
line method over a fi xed number
of years (2 years) within the
employees’ average remaining
service period from the time of
their occurrence
Actuarial gains or losses: Recognition of actuarial gains
or losses are apportioned by the
straight-line method over a fi xed
number of years (Mainly 10 to
11 years) within the employees’
average remaining service period
at the time of their occurrence in
each fi scal year, starting from the
following fi scal year
Some consolidated subsidiaries employ the simplifi ed
method for calculating retirement benefi t obligations
and periodic benefi t costs, stating retirement benefi t
obligations at the amounts required as if all employees
voluntarily terminate their employment as of the year-end.
Provision for directors’ retirement benefi tsThe provision for directors’ retirement benefi ts for
consolidated subsidiaries outside the banking business
is provided for the estimated amount corresponding to
accrued retirement benefi t payments to directors as of the
end of the fi scal year.
Standards for recording provision for directors’ stock benefi tsTo prepare for the provision of YMFG’s shares distributed
to directors of the Banks (excluding directors who are
also Audit and Supervisory Committee members, part-
time directors and outside directors; hereinafter, “Subject
Directors”), the provision for directors’ stock benefi ts is
recorded based on the expected value of stock benefi t
obligations as of the balance sheet date, in accordance with
directors’ stock benefi t regulations formulated by the Banks.
Provision for loss on interest repaymentProvision for loss on interest repayment is provided for
possible losses on reimbursements of excess interest
payments and loan losses related to consumer fi nance
loans extended at interest rates in excess of the maximum
interest rate prescribed in the Interest Rate Restriction Law.
In accordance with “Audit Guidelines on Consumer
Finance Companies’ Provisions for Possible Losses on
Reimbursements of Excess Interest Payments,” issued
by JICPA in 2012, the amount of such provision is
rationally estimated and booked based on actual historical
repayment claims by debtors.
Provision for reimbursement of depositsProvision for reimbursement of deposits is provided for in
order to meet depositor requests for reimbursement on
deposits already derecognized as liabilities, in an amount
deemed necessary by estimating the losses corresponding
to the expected requests for reimbursements in the future.
Provision for customer point servicesProvision for customer point services is provided in
conjunction with a point system to promote credit card
use. The provision is recorded for the expected cost to be
incurred when credit card members use points they have
received as of the balance sheet date.

29 YMFG Annual Report 2017
Reserves under special lawsReserves under special laws consist of the fi nancial
instruments transaction responsibility reserve posted by
YM Securities Co., Ltd., which were calculated according
to the specifi ed formula of Article 46-5 of the Financial
Instruments and Exchange Act and Article 175 of the
Cabinet Offi ce Order Related to the Financial Instruments
Business, to prepare for future eventual losses originating
from incidents relating to the purchase and sale of
securities or other transactions.
Amounts per share of common stockComputations of net income per share of common stock
are based on the weighted-average number of shares
outstanding during each year.
Cash dividends per share represent the cash dividends
declared as applicable to each year.
Amortization of goodwill Goodwill is amortized mainly over a 10-year period using
the straight-line method.
Consumption taxesYMFG and its consolidated subsidiaries employ the
tax exclusion method for consumption tax and local
consumption taxes, meaning that transaction amounts
and consumption tax amounts are treated separately for
accounting purposes.
However, non-deductible consumption taxes for
purchase of property, plant and equipment are recognized
as expenses for the year of the purchase.
Adoption of Consolidated Tax Payment SystemYMFG and certain of its consolidated subsidiaries adopted
the consolidated tax payment system as provided under the
Corporation Tax Act.
Changes in Accounting Principles For the year ended March 31, 2017
(Adoption of the “Practical Solution on a Change in
Depreciation Method Due to Tax Reform 2016”)
In line with revisions to the Corporation Tax Act, from
the current fi scal year YMFG has adopted the “Practical
Solution on a Change in Depreciation Method Due to Tax
Reform 2016” (ASBJ PITF No. 32, June 17, 2016), changing
the method for the depreciation of fi xtures and buildings
acquired on or after April 1, 2016, from the declining-
balance method to the straight-line method.
As a result, ordinary income and income before income
taxes for the year ended March 31, 2017, each increased
by ¥18 million.
For the year ended March 31, 2016
(Adoption of the “Accounting Standard for Business
Combinations”)
YMFG has adopted the “Accounting Standard for Business
Combinations” (ASBJ Statement No. 21, September 13,
2013), the “Accounting Standard for Consolidated Financial
Statements” (ASBJ Statement No. 22, September 13,
2013), the “Accounting Standard for Business Divestitures”
(ASBJ Statement No. 7, September 13, 2013), and other
related standards from the fi scal year ended March 31,
2016. As a result, the accounting method has been
changed to record the difference caused by changes in
equity in subsidiaries YMFG continues to control as capital
surplus, and to record acquisition-related costs for the fi scal
year in which the costs were incurred. Furthermore, for
business combinations carried out on or after the beginning
of the current fi scal year, the accounting method was
changed to refl ect the revised acquisition cost allocation
resulting from the fi nalization of the provisional accounting
treatment in the consolidated fi nancial statements of the
year in which the business combination occurs. In addition,
YMFG has changed its presentation of net income and
related items, and renamed “minority interests” as “non-
controlling interests.” The consolidated fi nancial statements
for the fi scal year ended March 31, 2015, have been
reclassifi ed to refl ect this change.
In the consolidated statements of cash fl ows for the
fi scal year under review, cash fl ows for the purchase
or sale of shares in subsidiaries without changing the
scope of consolidation are listed under “cash fl ows from
fi nancing activities.” Cash fl ows for expenses related to
the purchase of shares in subsidiaries resulting in changes
in the scope of consolidation and expenses related to the
purchase or sale of shares in subsidiaries without changing
the scope of consolidation are listed under “Cash fl ows
from operating activities.”
Adoption of the “Accounting Standard for Business
Combinations” and other related standards is in
accordance with the transitional measures provided for in
Article 58-2 (4) of the “Accounting Standard for Business
Combinations,” Article 44-5 (4) of the “Accounting
Standard for Consolidated Financial Statements,”

YMFG Annual Report 2017 30
and Article 57-4 (4) of the “Accounting Standard for
Business Divestitures.” YMFG has applied the standards
prospectively from the beginning of the fi scal year ended
March 31, 2016.
As a result, income before income taxes for the fi scal
year ended March 31, 2016 decreased by ¥1,086 million.
In addition, capital surplus as of March 31, 2016 increased
by ¥1,084 million.
The ending balance of capital surplus in the consolidated
statements of changes in net assets for the fi scal year
ended March 31, 2016 increased by ¥1,084 million.
Information on the impact per share is provided in the
relevant sections.
Additional Information(Adoption of the “Guidance on Recoverability of Deferred
Tax Assets”)
YMFG adopted the “Guidance on Recoverability of
Deferred Tax Assets” (ASBJ Guidance No. 26, March 28,
2016) from the fi scal year ended March 31, 2017.
(ESOP Trust)
To enhance its welfare benefi ts, YMFG has introduced the
ESOP Trust for Group employees (hereinafter, “Employees”)
1. ESOP Trust for Employees introduced in September 2011
(1) Overview of Transactions
Of those Employees enrolled in the Yamaguchi Financial
Group Employee Stock Ownership Plan (hereinafter,
“YMFG’s ESOP”), YMFG has established the trust for
those benefi ciaries satisfying certain conditions. This trust
acquired as a lump sum certain number of shares of YMFG
corresponding to the number expected to be acquired
by YMFG’s ESOP over the fi ve-year period beginning in
September 2011. Thereafter, the trust has sold YMFG’s
shares to YMFG’s ESOP each month on a specifi c date.
(2) Company Shares Residing in the Trust
YMFG’s shares residing in the trust are recorded in treasury
stock in the net assets section based on the book value of
the trust (excluding ancillary expenses). During the current
fi scal year, the trust sold all its holdings of YMFG’s shares,
so the trust held no shares as of March 31, 2017.
(3) Book Value of Borrowings Recorded by Applying the
Gross Price Method
The book value of borrowings recorded by applying the
gross price method was ¥210 million on March 31, 2016,
and zero on March 31, 2017.
2. ESOP Trust for Employees introduced in March 2017
(1) Overview of Transactions
Of those Employees enrolled in YMFG’s ESOP, YMFG has
established a trust for those benefi ciaries satisfying certain
conditions. This trust acquired as a lump sum certain
number of shares of YMFG corresponding to the number
expected to be acquired by YMFG’s ESOP over the fi ve-
year period beginning in March 2017. Thereafter, the trust
will sell YMFG’s shares to YMFG’s ESOP each month on a
specifi c date.
(2) Company Shares Residing in the Trust
YMFG’s shares residing in the trust are recorded in treasury
stock in the net assets section based on the book value of
the trust (excluding ancillary expenses).
The book value and the number of shares of this treasury
stock amounted to ¥2,084 million ($19 million) and 1,619
thousand shares on March 31, 2017.
(3) Book Value of Borrowings Recorded by Applying the
Gross Price Method
The book value of borrowings recorded by applying the
gross price method was ¥2,099 million ($19 million) on
March 31, 2017.
(Board Benefi t Trust (BBT))
YMFG has introduced a Board Benefi t Trust (“BBT”) to
raise awareness among Subject Directors of Banks within
YMFG toward raising operating performance at YMFG over
the medium to long term and contributing to increases in
corporate value.
(1) Overview of Transactions
Via the trust, YMFG acquires YMFG’s common shares
using funds provided by YMFG. YMFG’s share and cash
equivalent to fair value of YMFG’s stock measured at
the time of retirement are granted to be distributed via
the trust to Subject Directors of Banks within YMFG
according to Subject Directors’ positions, and the level of
achievement of operating performance in accordance with
directors’ stock benefi t regulations established by Banks
within YMFG.
(2) Company Shares Residing in the Trust
YMFG’s shares residing in the trust are recorded as treasury
stock in the net assets section based on the book value of
the trust (excluding ancillary expenses).
The book value and the number of shares of this treasury
stock amounted to ¥610 million ($5 million) and 633
thousand shares on March 31, 2017.
31 YMFG Annual Report 2017
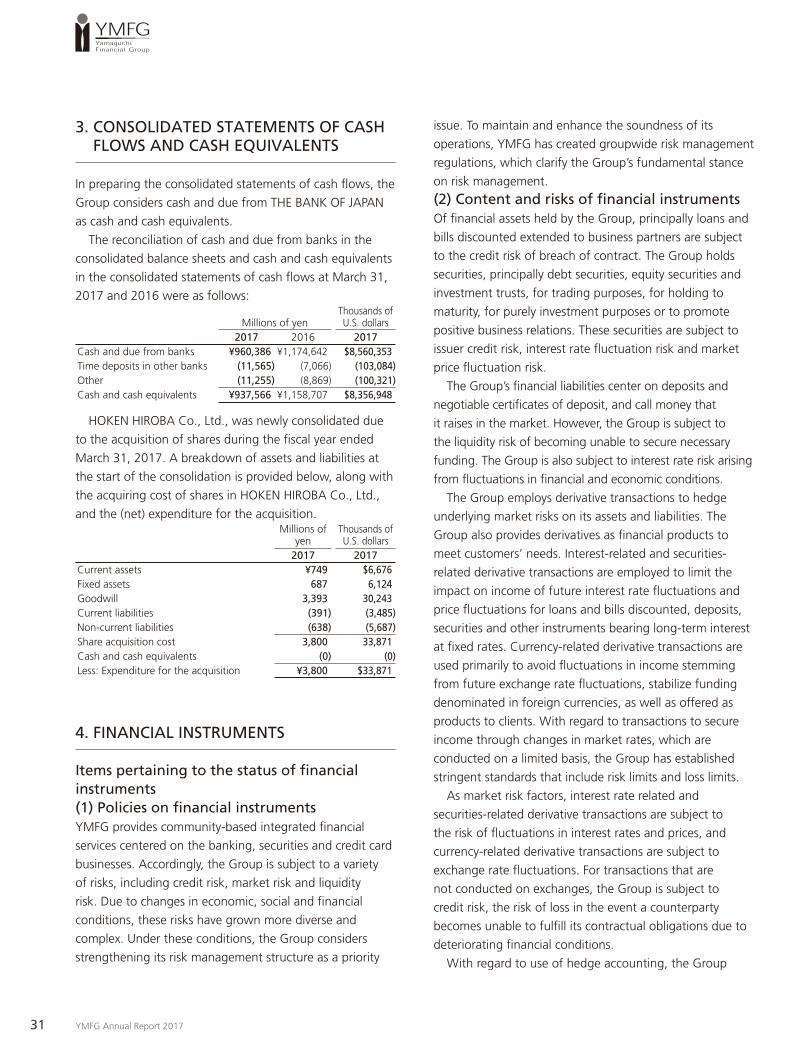
3. CONSOLIDATED STATEMENTS OF CASH FLOWS AND CASH EQUIVALENTS
In preparing the consolidated statements of cash fl ows, the
Group considers cash and due from THE BANK OF JAPAN
as cash and cash equivalents.
The reconciliation of cash and due from banks in the
consolidated balance sheets and cash and cash equivalents
in the consolidated statements of cash fl ows at March 31,
2017 and 2016 were as follows:
Millions of yenThousands of U.S. dollars
2017 2016 2017Cash and due from banks ¥960,386 ¥1,174,642 $8,560,353Time deposits in other banks (11,565) (7,066) (103,084)Other (11,255) (8,869) (100,321)Cash and cash equivalents ¥937,566 ¥1,158,707 $8,356,948
HOKEN HIROBA Co., Ltd., was newly consolidated due
to the acquisition of shares during the fi scal year ended
March 31, 2017. A breakdown of assets and liabilities at
the start of the consolidation is provided below, along with
the acquiring cost of shares in HOKEN HIROBA Co., Ltd.,
and the (net) expenditure for the acquisition.Millions of
yenThousands of U.S. dollars
2017 2017Current assets ¥749 $6,676Fixed assets 687 6,124Goodwill 3,393 30,243Current liabilities (391) (3,485)Non-current liabilities (638) (5,687)Share acquisition cost 3,800 33,871Cash and cash equivalents (0) (0)Less: Expenditure for the acquisition ¥3,800 $33,871
4. FINANCIAL INSTRUMENTS
Items pertaining to the status of fi nancial instruments(1) Policies on fi nancial instrumentsYMFG provides community-based integrated fi nancial
services centered on the banking, securities and credit card
businesses. Accordingly, the Group is subject to a variety
of risks, including credit risk, market risk and liquidity
risk. Due to changes in economic, social and fi nancial
conditions, these risks have grown more diverse and
complex. Under these conditions, the Group considers
strengthening its risk management structure as a priority
issue. To maintain and enhance the soundness of its
operations, YMFG has created groupwide risk management
regulations, which clarify the Group’s fundamental stance
on risk management.
(2) Content and risks of fi nancial instrumentsOf fi nancial assets held by the Group, principally loans and
bills discounted extended to business partners are subject
to the credit risk of breach of contract. The Group holds
securities, principally debt securities, equity securities and
investment trusts, for trading purposes, for holding to
maturity, for purely investment purposes or to promote
positive business relations. These securities are subject to
issuer credit risk, interest rate fl uctuation risk and market
price fl uctuation risk.
The Group’s fi nancial liabilities center on deposits and
negotiable certifi cates of deposit, and call money that
it raises in the market. However, the Group is subject to
the liquidity risk of becoming unable to secure necessary
funding. The Group is also subject to interest rate risk arising
from fl uctuations in fi nancial and economic conditions.
The Group employs derivative transactions to hedge
underlying market risks on its assets and liabilities. The
Group also provides derivatives as fi nancial products to
meet customers’ needs. Interest-related and securities-
related derivative transactions are employed to limit the
impact on income of future interest rate fl uctuations and
price fl uctuations for loans and bills discounted, deposits,
securities and other instruments bearing long-term interest
at fi xed rates. Currency-related derivative transactions are
used primarily to avoid fl uctuations in income stemming
from future exchange rate fl uctuations, stabilize funding
denominated in foreign currencies, as well as offered as
products to clients. With regard to transactions to secure
income through changes in market rates, which are
conducted on a limited basis, the Group has established
stringent standards that include risk limits and loss limits.
As market risk factors, interest rate related and
securities-related derivative transactions are subject to
the risk of fl uctuations in interest rates and prices, and
currency-related derivative transactions are subject to
exchange rate fl uctuations. For transactions that are
not conducted on exchanges, the Group is subject to
credit risk, the risk of loss in the event a counterparty
becomes unable to fulfi ll its contractual obligations due to
deteriorating fi nancial conditions.
With regard to use of hedge accounting, the Group
YMFG Annual Report 2017 32
applies deferred hedge accounting after it ensured in
advance that the established conditions are satisfi ed. As
for hedging methods, the Group employs the portfolio
hedge where certain group of assets with similar risk is
identifi ed and such risk is hedged comprehensively. In
addition, for certain interest swap contracts, exceptional
treatments are applied.
(3) Risk management structure related to fi nancial instruments
(i) Management of credit risk
Through the appropriate operation of a credit rating
system, the Group endeavors to determine the fi nancial
conditions of business partners and accurately evaluate
their credit risk. The Group has enhanced the precision
of its credit evaluations, reviewing business partner credit
ratings swiftly and appropriately for each fi nancial period
and each time their credit conditions change.
The Group conducts self assessments according to
stringent standards that are consistent throughout the
Group. The Group performs write-off and provisions
based on the results of its self assessments. The Group’s
authentication departments verify the content of such self
assessments. Independence is maintained through internal
audits conducted by audit departments. In addition,
the Group undergoes external audits conducted by its
independent external auditors.
With regard to the screening of individual transactions,
the Group employs a screening system suited to each
subsidiary bank’s size of the business and characteristics
to conduct detailed screenings that take individual sector
and regional characteristics into consideration. In terms of
portfolio management, the Group strives to enhance its
risk management by fi rst measuring credit risk, and then
managing risk by category, sector and geographic area.
Risk management departments periodically obtain
credit information and fair value as a part of managing
credit risks on securities issuers and counterparty risks on
derivative transactions.
(ii) Management of market risk
Qualitative information on the management of market risk
The Group has formulated a market risk management
process that identifi es and quantitatively measures market
risks. An asset-liability management (ALM) system is
employed to control market risk within allowable limits, and
the Group ALM Committee is periodically held to respond to
such risks.
YMFG periodically evaluates market risk conditions and
verifi es the appropriateness of risk controls.
Quantitative information on the management of market risk
The market risk (estimated loss amount) of the loans,
securities, deposits and derivatives transactions of Yamaguchi
Bank, Momiji Bank and Kitakyushu Bank of the Group are
calculated according to value at risk (VaR). Furthermore,
the covariance method is used to calculate VaR.
As of March 31, 2017, the market risk (estimated loss
amount) of Yamaguchi Bank was ¥80,793 million ($720
million), the market risk (estimated loss amount) of Momiji
Bank was ¥25,142 million ($224 million) and the market
risk (estimated loss amount) of Kitakyushu Bank was
¥17,293 million ($154 million). Also, as of March 31, 2016,
the market risk (estimated loss amount) of Yamaguchi
Bank was ¥69,017 million, the market risk (estimated loss
amount) of Momiji Bank was ¥17,205 million and the
market risk (estimated loss amount) of Kitakyushu Bank
was ¥14,574 million.
Assumptions used in calculating VaR include a holding
period of three months (however, one year for a holding
period for shares held for the purpose of strategic
investment), a confi dence interval of 99.9% and an
observation period of fi ve years. However, the observation
period for foreign bond funds is one year.
Yamaguchi Bank, Momiji Bank and Kitakyushu Bank
conduct back-testing to compare the VaR calculated by
the model with the actual losses. However, because of
relatively large fl uctuations in Japanese stock and foreign
exchange market prices this year, instances arose in which
they were unable to capture the risk on Japanese stocks
and foreign bond funds. Consequently, the method for
determining the amount of risk on Japanese stocks and
foreign bond funds was revised beginning in fi scal 2016.
Specifi cally, VaR is measured for observation periods of
both one year and fi ve years, with the larger number taken
as the risk amount. Based on this revision, the observation
period on VaR for foreign bond funds as of the end of
fi scal 2016 was one year. However, as the practice of
measuring market risk amount with a set risk probability
calculated statistically on the basis of historical market
fl uctuations remains unchanged even after revising the
measurement method to appropriately capture the market
risk amount, in some cases it is not possible to capture
market risk in the event of sudden changes in the market
environment outside the normally expected scope.

33 YMFG Annual Report 2017
(iii) Management of liquidity risk related to fundraising
The majority of funds is raised through deposits, which
constitute a stable base for procuring funds. The Group
manages funds on the basis of elaborate forecasts,
confi rming cash fl ows primarily through the management
of fi nancial balances using short-term fi nancial markets.
For cash fl ow management, the Group strives to
manage the liquidity risk by ensuring stability, preparing for
unexpected events, and maintaining highly liquid assets.
(4) Supplementary explanation of items pertaining to the fair value of fi nancial instruments
The fair values of some fi nancial instruments are based
on market prices. The fair values of other instruments, for
which market prices are not readily available, are based
on rational calculation. However, as assumptions are used
in these calculations, different assumptions can yield
different values.
Items pertaining to the fair value of fi nancial instrumentsThe table below indicates the consolidated balance sheet
amounts of fi nancial instruments, as well as their fair values
and the differences between the two. Line items with little
signifi cance to balance sheet amounts have been omitted.
Unlisted equity securities and other instruments for which
fair value is not easily determinable are not included in the
table below. (Refer to (Note 2).)Millions of yen
2017Consolidated balance sheet
amountFair value Difference
(1) Cash and due from banks ¥ 960,386 ¥ 960,386 ¥ —(2) Call loans and bills purchased 278,732 278,732 —(3) Money held in trust 46,953 46,953 —(4) Securities Held-to-maturity debt
securities6,081 6,213 132
Available-for-sale securities 1,882,319 1,882,319 —(5) Loans and bills discounted 6,751,378 Allowance for loan losses (* 1) (51,930)
6,699,448 6,772,806 73,358Total assets ¥9,873,919 ¥9,947,409 ¥73,490(1) Deposits ¥8,453,837 ¥8,454,828 ¥ 991(2) Negotiable certifi cates
of deposit775,958 775,958 0
Total liabilities ¥9,229,795 ¥9,230,786 ¥991Derivative transactions (* 2) Hedge accounting not applied ¥ 469 ¥ 469 ¥ —Hedge accounting applied (693) (693) —Total derivative transactions ¥ (224) ¥ (224) ¥ —
Millions of yen2016
Consolidated balance sheet
amountFair value Difference
(1) Cash and due from banks ¥ 1,174,642 ¥ 1,174,642 ¥ —(2) Call loans and bills purchased 356,719 356,719 —(3) Money held in trust 47,655 47,655 —(4) Securities Held-to-maturity debt
securities5,129 5,291 162
Available-for-sale securities 2,104,752 2,104,752 —(5) Loans and bills discounted 6,448,887 Allowance for loan losses (* 1) (64,931)
6,383,956 6,492,550 108,594Total assets ¥10,072,853 ¥10,181,609 ¥108,756(1) Deposits ¥ 8,703,691 ¥ 8,705,754 ¥ 2,063(2) Negotiable certifi cates
of deposit806,399 806,399 0
Total liabilities ¥ 9,510,090 ¥ 9,512,153 ¥ 2,063Derivative transactions (* 2) Hedge accounting not applied ¥ 6,605 ¥ 6,605 ¥ —Hedge accounting applied 983 983 —Total derivative transactions ¥ 7,588 ¥ 7,588 ¥ —
Thousands of U.S. dollars2017
Consolidated balance sheet
amountFair value Difference
(1) Cash and due from banks $ 8,560,353 $ 8,560,353 $ —(2) Call loans and bills purchased 2,484,464 2,484,464 —(3) Money held in trust 418,513 418,513 —(4) Securities Held-to-maturity debt
securities54,203 55,379 1,176
Available-for-sale securities 16,777,957 16,777,957 —(5) Loans and bills discounted 60,178,073 Allowance for loan losses (* 1) (462,876)
59,715,197 60,369,071 653,874Total assets $88,010,687 $88,665,737 $655,050(1) Deposits $75,352,857 $75,361,690 $ 8,833(2) Negotiable certifi cates
of deposit6,916,463 6,916,463 —
Total liabilities $82,269,320 $82,278,153 $ 8,833Derivative transactions (* 2) Hedge accounting not applied $ 4,180 $ 4,180 $ —Hedge accounting applied (6,177) (6,177) —Total derivative transactions $ (1,997) $ (1,997) $ —
(* 1) The general allowance for loan losses and specifi c allowance for loan losses are deducted.(* 2) The amount collectively represents derivative transactions that are recorded as trading
assets and liabilities, and other assets and liabilities. This indicates the net amount of rights and obligations under derivative transactions. Parentheses, ( ), indicate that the net amount is negative.

YMFG Annual Report 2017 34
(Note 1) Methods of calculating the fair value of fi nancial
instruments
(1) Assets
(i) Cash and due from banks
As the settlement term of these instruments is short
(within one year) and their fair values and book values are
approximately the same, their book values are taken as
their fair values.
(ii) Call loans and bills purchased
As the settlement term of these instruments is short
(within one year) and their fair values and book values are
approximately the same, their book values are taken as
their fair values.
(iii) Money held in trust
As for the securities held as trusted assets in money held
in trust established independently for the purpose of
investing mainly in the securities of the Group, the value
on stock exchanges is taken as fair value for the equity
securities, and either the value on exchanges or a price
indicated by other fi nancial institutions dealing with the
specifi c instruments is taken as fair value.
Notes pertaining to money held in trust exchanges for
the purpose of holding are indicated within “Money held
in trust.”
(iv) Securities
For equity securities, fair value is determined by stock
exchange prices; the fair value of debt securities is
determined by exchange prices or prices received from
information vendors. Fair values of investment trusts are
determined by exchange prices or standard prices disclosed
by investment trust management companies.
The fair value of private placement bonds guaranteed
by Yamaguchi Bank and Momiji Bank is determined for
each internal rating category and period by discounting to
present value the total amount of interest and principal,
using as the discount rate the risk-free rate plus the
credit cost determined for each internal rating category.
However, fair value of bonds of legally bankrupt debtors,
substantially bankrupt debtors and debtors in danger
of bankruptcy is determined by deducting the expected
amount of loss on the bond by using the same method
applied to loans from the bond’s face value.
(v) Loans and bills discounted
For loans and bills discounted with fl oating interest rates,
as in the short term their values refl ect market interest
rates, unless the credit status of the obligor has changed
signifi cantly since the loans were extended, their fair value
is similar to their book value, so their book value is taken as
their fair value.
For loans and bills discounted bearing fi xed interest
rates, fair value is determined for each internal rating
category and period by discounting to present value
the total amount of interest and principal, using as the
discount rate the risk-free rate for operating loans and
bills discounted plus the credit cost for each internal
rating category. For consumer loans and bills discounted,
fair value is determined by discounting the total amount
of interest and principal to their present value using the
assumed interest rate on new loans of the same type. For
instruments having a short settlement period (within one
year), as their fair values and book values are approximately
the same, their book value is taken as their fair value.
With regard to loans to legally bankrupt obligors,
substantially bankrupt obligors or obligors who are in
danger of bankruptcy, the estimated collectible amount
is based on either the present value of estimated future
cash fl ows or the expected amounts recoverable from
the disposal of collateral and/or under guarantees. As
the fair value is essentially equivalent to the amount after
deducting the allowance for possible loan losses from the
book value as of the consolidated balance sheet date, this
amount is taken as fair value.
For loans that have no specifi c repayment period, as the
fair value is assumed to be equivalent with the book value
according to the expected payment dates and interest
rates, book value is taken as the fair value.
(2) Liabilities
(i) Deposits and (ii) Negotiable certifi cates of deposit
The fair value of demand deposits is determined as
the payment amount if payment were required on the
consolidated balance sheet date (book value). The fair
value of time deposits is determined by discounting future
cash fl ows to their present value by certain time periods.
The discount rate employed is the interest rate required for
newly accepted deposits. For deposits having a short period
(within one year), as their fair values and book values are
approximately the same, their book value is taken as their
fair value.
(3)Derivative transactions
The fair value of derivative transactions, comprising
interest-rate-related transactions (such as interest rate
futures, interest rate options and interest rate swaps)
currency-related transactions (such as currency futures,
currency options and currency swaps), bond-related

35 YMFG Annual Report 2017
transactions (such as bond futures and bond options) is
taken as their value on exchanges, discounted present
value or price as calculated using option pricing models.
Interest rates swaps that employ exceptional accounting
treatment are accounted for as part of the loans and bills
discounted that are hedged. Therefore, their fair value is
included in the fair value of loans and bills discounted.
(Note 2) The consolidated balance sheet amounts of
fi nancial instruments for which market prices are not
readily available
Financial instruments for which market prices are not
readily available are not included in “Assets (4) Available-
for-sale securities.”
Millions of yenThousands of U.S. dollars
2017 2016 2017Category Consolidated balance sheet amount(1) Unlisted equity securities
(*1, *2)¥ 7,650 ¥ 6,832 $ 68,188
(2) Investments in partnerships, etc. (*3)
4,221 3,939 37,623
Total ¥11,871 ¥10,771 $105,811
(*1) As unlisted equity securities have no market prices and their fair value is not readily available, they are not included in the scope of fair value disclosures.
(*2) During the fi scal year ended March 31, 2016 and 2017, impairment losses of ¥15 million and ¥21 million ($187 thousand) were recorded on unlisted equity securities.
(*3) Of investments in partnerships, those partnership assets comprising unlisted equity securities, which have no readily available fair value, are not included in the scope of fair value disclosure.
(Note 3) Expected maturity amount of monetary claims and
securities with maturities after the consolidated balance
sheet dateMillions of yen
2017
Within one year
More than one year
and within three years
More than three years and within fi ve years
More than fi ve years
and within seven years
More than seven years
(1) Due from banks
¥ 862,527 ¥ — ¥ — ¥ — ¥ —
(2) Call loans and bills purchased
278,732 — — — —
(3) Securities 263,661 384,169 178,659 157,397 651,511Held-to- maturity debt securities
416 894 610 1,380 2,781
Local government bond
— — 100 500 1,200
Corporate bond
416 894 510 880 1,581
Others — — — — —Available-for- sale securities with maturities
263,245 383,275 178,049 156,017 648,730
Japanese government bond
68,224 120,931 13,174 9,433 301,624
Local government bond
1,420 4,511 13,834 156 17,042
Corporate bond
157,124 213,034 130,612 111,533 238,315
Others 36,477 44,799 20,429 34,895 91,749(4) Loans and
bills dis- counted (*)
2,077,007 918,513 841,537 599,167 2,315,154
Total ¥3,481,927 ¥1,302,682 ¥1,020,196 ¥756,564 ¥2,966,665

YMFG Annual Report 2017 36
Millions of yen2016
Within one year
More than one year
and within three years
More than three years and within fi ve years
More than fi ve years
and within seven years
More than seven years
(1) Due from banks
¥1,079,667 ¥ — ¥ — ¥ — ¥ —
(2) Call loans and bills purchased
356,719 — — — —
(3) Securities 278,134 549,979 328,786 171,503 551,170Held-to- maturity debt securities
476 772 289 230 3,362
Local government bond
— — — — 1,400
Corporate bond
190 772 289 230 1,962
Others 286 — — — —Available-for- sale securities with maturities
277,658 549,207 328,497 171,273 547,808
Japanese government bond
58,209 169,310 114,541 33,081 239,983
Local government bond
2,731 3,362 6,856 7,300 10,411
Corporate bond
202,719 315,843 176,263 100,993 258,165
Others 13,999 60,692 30,837 29,899 39,249(4) Loans and
bills dis- counted (*)
2,230,165 1,099,315 818,895 553,191 1,747,321
Total ¥3,944,685 ¥1,649,294 ¥1,147,681 ¥724,694 ¥2,298,491
Thousands of U.S. dollars2017
Within one year
More than one year
and within three years
More than three years and within fi ve years
More than fi ve years
and within seven years
More than seven years
(1) Due from banks
$ 7,688,092 $ — $ — $ — $ —
(2) Call loans and bills purchased
2,484,464 — — — —
(3) Securities 2,350,129 3,424,271 1,592,468 1,402,951 5,807,211Held-to- maturity debt securities
3,708 7,969 5,437 12,301 24,788
Local government bond
— — 891 4,457 10,696
Corporate bond
3,708 7,969 4,546 7,844 14,092
Others — — — — —Available-for- sale securities with maturities
2,346,421 3,416,302 1,587,031 1,390,650 5,782,423
Japanese government bond
608,111 1,077,912 117,426 84,081 2,688,511
Local government bond
12,657 40,209 123,309 1,390 151,903
Corporate bond
1,400,517 1,898,868 1,164204 994,144 2,124,209
Others 325,136 399,313 182,092 311,035 817,800(4) Loans and
bills dis- counted (*)
18,513,299 8,187,120 7,500,988 5,340,645 20,636,021
Total $31,035,984 $11,611,391 $9,093,466 $6,743,596 $26,443,232
(*) Loans and bills discounted for which no period is specifi ed are included in “within one year.”
(Note 4) Estimated repayment amounts of deposits, negotiable
certifi cates of deposit and other interest-bearing liabilities to be
repaid after the consolidated balance sheet dateMillions of yen
2017
Within one year
More than one year
and within two years
More than two years and within three years
Three years or
more
Deposits (*) ¥7,815,897 ¥464,555 ¥140,370 ¥33,015Negotiable certifi cates of deposit
775,278 680 — —
Total ¥8,591,175 ¥465,235 ¥140,370 ¥33,015
Millions of yen2016
Within one year
More than one year
and within two years
More than two years and within three years
Three years or
more
Deposits (*) ¥7,783,476 ¥690,244 ¥192,698 ¥37,273Negotiable certifi cates of deposit
806,119 280 — —
Total ¥8,589,595 ¥690,524 ¥192,698 ¥37,273

37 YMFG Annual Report 2017
Thousands of U.S. dollars2017
Within one year
More than one year
and within two years
More than two years and within three years
Three years or
more
Deposits (*) $69,666,610 $4,140,788 $1,251,181 $294,278Negotiable certifi cates of deposit
6,910,402 6,061 — —
Total $76,577,012 $4,146,849 $1,251,181 $294,278
(*) Within deposits, demand deposits are included in “within one year.”
5. SECURITIES
Securities held at March 31, 2017 include shares of
unconsolidated subsidiaries and affi liates amounting to ¥92
million ($1 million) and investments of ¥1,107 million ($10
million). Corresponding fi gures at March 31, 2016, were
¥90 million and ¥1,078 million.
The amount of guarantee obligations for private
placement bonds (Financial Instruments and Exchange
Law, Article 2, Item 3), out of bonds included in securities,
amounted to ¥7,907 million ($70 million) and ¥6,180 million
as of March 31, 2017 and March 31, 2016 respectively.
Bonds included in securities also include securities
lent through unsecured loan agreements (bond lending
transactions) of ¥5,040 million ($45 million) and ¥5,065
million, at March 31, 2017 and 2016 respectively.
6. FAIR VALUE INFORMATION
SecuritiesThe following tables summarize book values, fair value and
acquisition cost of securities with available fair values as of
March 31, 2017 and 2016:
(a) Trading securities
Amount of unrealized gain (loss) on trading securities
included in the consolidated statement of income
— ¥(31) million ($(276) thousand) and ¥17 million as at
March 31, 2017 and 2016, respectively.
(b) Held-to-maturity debt securities:Millions of yen
2017Type Book value Fair value Difference
Securities with fair value exceeding book value
Local government bonds
¥1,400 ¥1,446 ¥ 46
Corporate bonds
3,972 4,062 90
Others — — —Subtotal 5,372 5,508 136
Securities with fair value not exceeding book value
Local government bonds
400 399 (1)
Corporate bonds
309 306 (3)
Others — — —Subtotal 709 705 (4)Total ¥6,081 ¥6,213 ¥132
Millions of yen2016
Type Book value Fair value DifferenceSecurities with fair value exceeding book value
Local government bonds
¥1,400 ¥1,455 ¥ 55
Corporate bonds
3,337 3,441 104
Others 286 289 3 Subtotal 5,023 5,185 162
Securities with fair value not exceeding book value
Local government bonds
— — —
Corporate bonds
106 106 (0)
Others — — —Subtotal 106 106 (0)Total ¥5,129 ¥5,291 ¥162
Thousands of U.S. dollars2017
Type Book value Fair value DifferenceSecurities with fair value exceeding book value
Local government bonds
$12,479 $12,898 $ 419
Corporate bonds
35,404 36,197 793
Others — — —Subtotal 47,883 49,095 1,212
Securities with fair value not exceeding book value
Local government bonds
3,565 3,556 (9)
Corporate bonds
2,755 2,728 (27)
Others — — —Subtotal 6,320 6,284 (36)Total $54,203 $55,379 $1,176

YMFG Annual Report 2017 38
(c) Available-for-sale securitiesMillions of yen
2017
Type Book value Acquisition cost Difference
Securities with book value exceeding acquisition cost
Shares ¥ 129,583 ¥ 47,106 ¥ 82,477Japanese government bonds
284,413 281,698 2,715
Local government bonds
28,340 27,641 699
Corporate bonds
740,235 726,320 13,915
Others 50,534 49,522 1,012Subtotal 1,233,105 1,132,287 100,818
Securities with book value not exceeding acquisition cost
Shares 10,549 11,876 (1,327)Japanese government bonds
228,973 234,852 (5,879)
Local government bonds
8,623 8,675 (52)
Corporate bonds
110,385 111,832 (1,447)
Others 290,684 303,431 (12,747)Subtotal 649,214 670,666 (21,452)Total ¥1,882,319 ¥1,802,953 ¥ 79,366
Millions of yen2016
Type Book value Acquisition cost Difference
Securities with book value exceeding acquisition cost
Shares ¥ 108,872 ¥ 49,024 ¥ 59,848Japanese government bonds
600,562 588,705 11,857
Local government bonds
29,371 28,405 966
Corporate bonds
1,031,214 1,011,984 19,230
Others 117,964 116,084 1,880Subtotal 1,887,983 1,794,202 93,781
Securities with book value not exceeding acquisition cost
Shares 12,514 13,899 (1,385)Japanese government bonds
14,562 14,630 (68)
Local government bonds
1,288 1,290 (2)
Corporate bonds
22,760 22,853 (93)
Others 165,645 180,808 (15,163)Subtotal 216,769 233,480 (16,711)Total ¥2,104,752 ¥2,027,682 ¥ 77,070
Thousands of U.S. dollars2017
Type Book value Acquisition cost Difference
Securities with book value exceeding acquisition cost
Shares $ 1,155,032 $ 419,877 $ 735,155Japanese government bonds
2,535,101 2,510,901 24,200
Local government bonds
252,607 246,377 6,230
Corporate bonds
6,598,048 6,474,017 124,031
Others 450,432 441,412 9,020Subtotal 10,991,220 10,092,584 898,636
Securities with book value not exceeding acquisition cost
Shares 94,028 105,856 (11,828)Japanese government bonds
2,040,939 2,093,342 (52,403)
Local government bonds
76,861 77,324 (463)
Corporate bonds
983,911 996,809 (12,898)
Others 2,590,998 2,704,617 (113,619)Subtotal 5,786,737 5,977,948 (191,211)Total $16,777,957 $16,070,532 $ 707,425
(d) Held-to-maturity debt securities sold during the fi scal yearThere were no held-to-maturity securities sold during the fi scal year ended March 31, 2017 and 2016.
(e) Available-for-sale securities sold during the fi scal yearMillions of yen
2017Sale
amountTotal gain
on saleTotal loss on sale
Shares ¥ 15,719 ¥10,191 ¥ 68Japanese government bonds 917,543 9,255 2,608Local government bonds — — —Corporate bonds 103,890 1,668 —Others 289,024 3,624 1,691Total ¥1,326,176 ¥24,738 ¥4,367
Millions of yen2016
Sale amount
Total gain on sale
Total loss on sale
Shares ¥ 6,724 ¥ 3,575 ¥ 115Japanese government bonds 1,050,859 8,774 582Local government bonds — — —Corporate bonds 161,673 2,074 4Others 359,283 9,395 2,227Total ¥1,578,539 ¥23,818 ¥2,928

39 YMFG Annual Report 2017
Thousands of U.S. dollars2017
Sale amount
Total gain on sale
Total loss on sale
Shares $ 140,111 $ 90,837 $ 606Japanese government bonds 8,178,474 82,494 23,246Local government bonds — — —Corporate bonds 926,018 14,868 —Others 2,576,201 32,302 15,073Total $11,820,804 $220,501 $38,925
(f) Securities for which purpose of holding changed
There were no securities for which the purpose of holding
changed at March 31, 2017 and 2016.
Impairment losses on securitiesRegarding securities (excluding those for which market
prices are not readily available) other than trading securities,
if their market values have fallen substantially below their
acquisition price and are not expected to recover to the
acquisition price, such market values are recorded in the
consolidated balance sheets. The valuation difference
is recorded as a loss for the fi scal year in which such
difference is realized (hereinafter, “impairment losses”).
During the fi scal year ended March 31, 2017,
impairment losses were ¥103 million ($918 thousand) on
equity securities and during the fi scal year ended March
31, 2016, impairment losses totaled ¥682 million on equity
securities. The basis for determining whether the market
value has fallen signifi cantly is as follows.
If the market value of the securities in general has
fallen by 30% or more compared with the acquisition
cost, the value of the securities is determined to have
“fallen signifi cantly.” However in the case of shares and
equivalent securities, if their market value has fallen
by 30% or more but less than 50% of the acquisition
cost, the determination of whether the value has “fallen
signifi cantly” takes into consideration other factors such
as the issuing company’s credit risk (independent debtor
classifi cation, external ratings, etc.) and previous percentage
decreases over a specifi c period of time in the past.
Money held in trust Information on money held in trust as of March 31, 2017
and 2016 is as follows:
(a) Money held in trust classifi ed as trading purposesMillions of yen
2017
Consolidated balance sheet
amount
Unrealized gains (losses) included in profi t (loss) for
the fi scal yearMoney held in trust classifi ed as trading purposes
¥9,873 ¥—
Millions of yen2016
Consolidated balance sheet
amount
Unrealized gains (losses) included in profi t (loss) for
the fi scal yearMoney held in trust classifi ed as trading purposes
¥— ¥—
Thousands of U.S. dollars2017
Consolidated balance sheet
amount
Unrealized gains (losses) included in profi t (loss) for
the fi scal yearMoney held in trust classifi ed as trading purposes
$88,002 $—
(b) Money held in trust classifi ed as held-to-maturity
There are no corresponding transactions as at March
31, 2017 and 2016.
(c) Available-for-sale money held in trustMillions of yen
2017Consolidated balance sheet
amount
Acquisition cost
Unrealizedgains
(losses)Available-for-sale money held in trust
¥37,080 ¥37,559 ¥(479)
Millions of yen2016
Consolidated balance sheet
amount
Acquisition cost
Unrealizedgains
(losses)Available-for-sale money held in trust
¥47,655 ¥47,642 ¥13
YMFG Annual Report 2017 40
Thousands of U.S. dollars2017
Consolidated balance sheet
amount
Acquisition cost
Unrealizedgains
(losses)Available-for-sale money held in trust
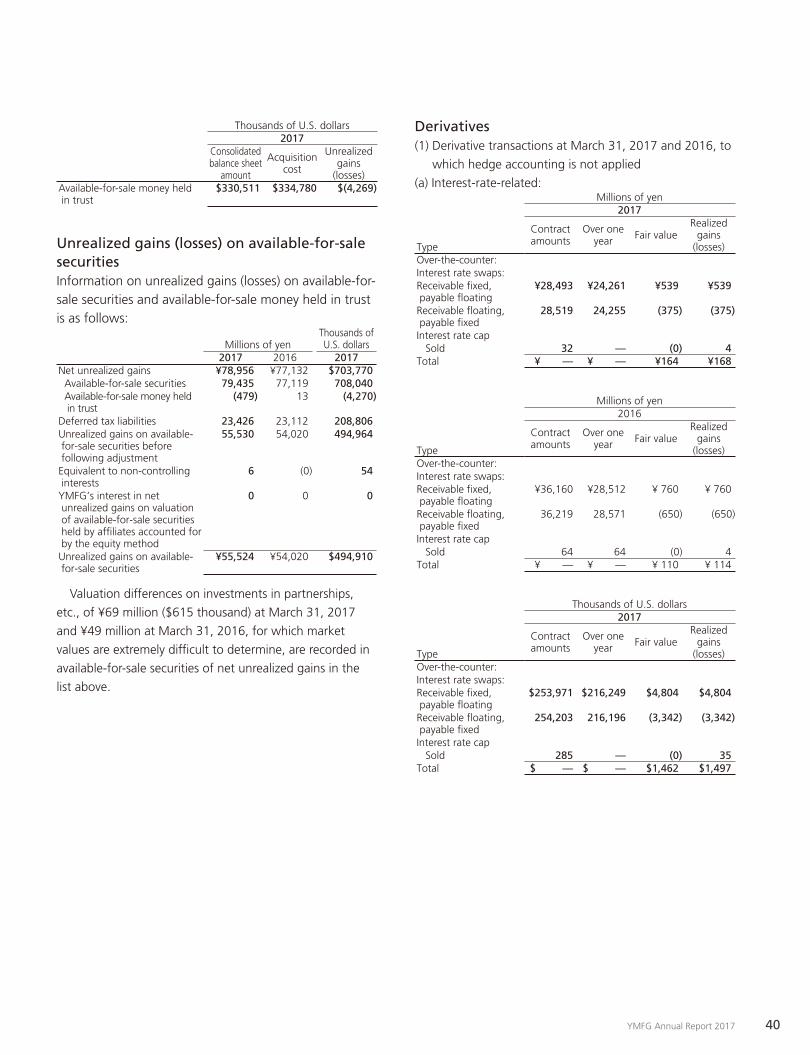
$330,511 $334,780 $(4,269)
Unrealized gains (losses) on available-for-sale securitiesInformation on unrealized gains (losses) on available-for-sale securities and available-for-sale money held in trust is as follows:
Millions of yenThousands of U.S. dollars
2017 2016 2017Net unrealized gains ¥78,956 ¥77,132 $703,770 Available-for-sale securities 79,435 77,119 708,040 Available-for-sale money held in trust
(479) 13 (4,270)
Deferred tax liabilities 23,426 23,112 208,806Unrealized gains on available- for-sale securities before following adjustment
55,530 54,020 494,964
Equivalent to non-controlling interests
6 (0) 54
YMFG’s interest in net unrealized gains on valuation of available-for-sale securities held by affi liates accounted for by the equity method
0 0 0
Unrealized gains on available- for-sale securities
¥55,524 ¥54,020 $494,910
Valuation differences on investments in partnerships,
etc., of ¥69 million ($615 thousand) at March 31, 2017
and ¥49 million at March 31, 2016, for which market
values are extremely diffi cult to determine, are recorded in
available-for-sale securities of net unrealized gains in the
list above.
Derivatives (1) Derivative transactions at March 31, 2017 and 2016, to
which hedge accounting is not applied
(a) Interest-rate-related:Millions of yen
2017
Type
Contract amounts
Over one year Fair value
Realizedgains
(losses)Over-the-counter:Interest rate swaps:Receivable fi xed, payable fl oating
¥28,493 ¥24,261 ¥539 ¥539
Receivable fl oating, payable fi xed
28,519 24,255 (375) (375)
Interest rate cap Sold 32 — (0) 4Total ¥ — ¥ — ¥164 ¥168
Millions of yen2016
Type
Contract amounts
Over one year Fair value
Realizedgains
(losses)Over-the-counter:Interest rate swaps:Receivable fi xed, payable fl oating
¥36,160 ¥28,512 ¥ 760 ¥ 760
Receivable fl oating, payable fi xed
36,219 28,571 (650) (650)
Interest rate cap Sold 64 64 (0) 4 Total ¥ — ¥ — ¥ 110 ¥ 114
Thousands of U.S. dollars2017
Type
Contract amounts
Over one year Fair value
Realizedgains
(losses)Over-the-counter:Interest rate swaps:Receivable fi xed, payable fl oating
$253,971 $216,249 $4,804 $4,804
Receivable fl oating, payable fi xed
254,203 216,196 (3,342) (3,342)
Interest rate cap Sold 285 — (0) 35Total $ — $ — $1,462 $1,497
41 YMFG Annual Report 2017
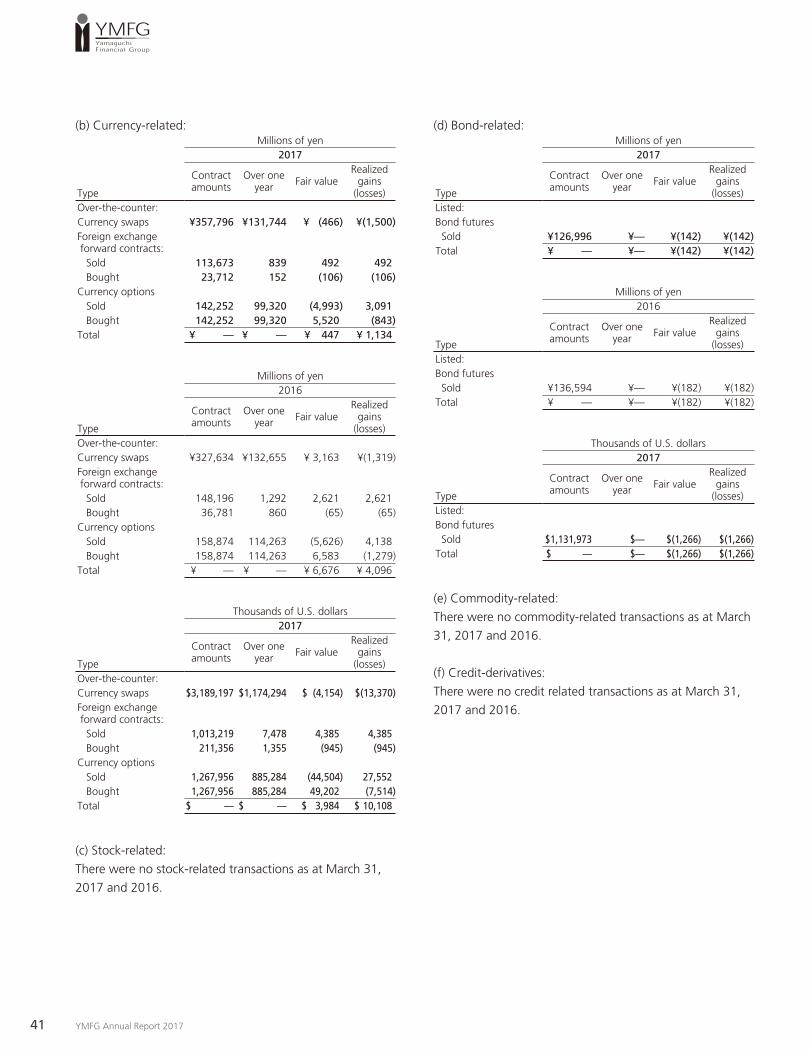
(b) Currency-related:Millions of yen
2017
Type
Contract amounts
Over one year Fair value
Realizedgains
(losses)Over-the-counter:Currency swaps ¥357,796 ¥131,744 ¥ (466) ¥(1,500)Foreign exchange forward contracts: Sold 113,673 839 492 492 Bought 23,712 152 (106) (106)Currency options Sold 142,252 99,320 (4,993) 3,091 Bought 142,252 99,320 5,520 (843)Total ¥ — ¥ — ¥ 447 ¥ 1,134
Millions of yen2016
Type
Contract amounts
Over one year Fair value
Realizedgains
(losses)Over-the-counter:Currency swaps ¥327,634 ¥132,655 ¥ 3,163 ¥(1,319)Foreign exchange forward contracts: Sold 148,196 1,292 2,621 2,621 Bought 36,781 860 (65) (65)Currency options Sold 158,874 114,263 (5,626) 4,138 Bought 158,874 114,263 6,583 (1,279)Total ¥ — ¥ — ¥ 6,676 ¥ 4,096
Thousands of U.S. dollars2017
Type
Contract amounts
Over one year Fair value
Realizedgains
(losses)Over-the-counter:Currency swaps $3,189,197 $1,174,294 $ (4,154) $(13,370)Foreign exchange forward contracts: Sold 1,013,219 7,478 4,385 4,385 Bought 211,356 1,355 (945) (945)Currency options Sold 1,267,956 885,284 (44,504) 27,552 Bought 1,267,956 885,284 49,202 (7,514)Total $ — $ — $ 3,984 $ 10,108
(c) Stock-related:
There were no stock-related transactions as at March 31,
2017 and 2016.
(d) Bond-related:Millions of yen
2017
Type
Contract amounts
Over one year Fair value
Realizedgains
(losses)Listed:Bond futures Sold ¥126,996 ¥— ¥(142) ¥(142)Total ¥ — ¥— ¥(142) ¥(142)
Millions of yen2016
Type
Contract amounts
Over one year Fair value
Realizedgains
(losses)Listed:Bond futures Sold ¥136,594 ¥— ¥(182) ¥(182)Total ¥ — ¥— ¥(182) ¥(182)
Thousands of U.S. dollars2017
Type
Contract amounts
Over one year Fair value
Realizedgains
(losses)Listed:Bond futures Sold $1,131,973 $— $(1,266) $(1,266)Total $ — $— $(1,266) $(1,266)
(e) Commodity-related:
There were no commodity-related transactions as at March
31, 2017 and 2016.
(f) Credit-derivatives:
There were no credit related transactions as at March 31,
2017 and 2016.
YMFG Annual Report 2017 42
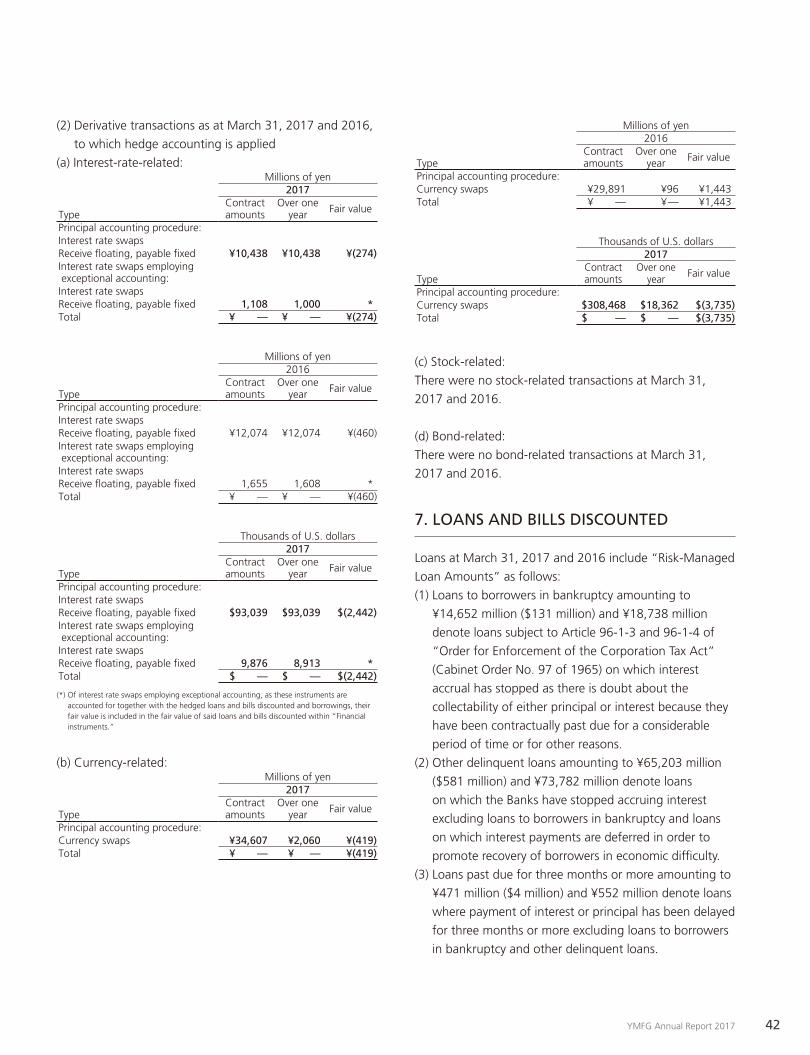
(2) Derivative transactions as at March 31, 2017 and 2016,
to which hedge accounting is applied
(a) Interest-rate-related:Millions of yen
2017
TypeContract amounts
Over one year Fair value
Principal accounting procedure:Interest rate swapsReceive fl oating, payable fi xed ¥10,438 ¥10,438 ¥(274)Interest rate swaps employing exceptional accounting:Interest rate swapsReceive fl oating, payable fi xed 1,108 1,000 *Total ¥ — ¥ — ¥(274)
Millions of yen2016
TypeContract amounts
Over one year Fair value
Principal accounting procedure:Interest rate swapsReceive fl oating, payable fi xed ¥12,074 ¥12,074 ¥(460)Interest rate swaps employing exceptional accounting:Interest rate swapsReceive fl oating, payable fi xed 1,655 1,608 *Total ¥ — ¥ — ¥(460)
Thousands of U.S. dollars2017
TypeContract amounts
Over one year Fair value
Principal accounting procedure:Interest rate swapsReceive fl oating, payable fi xed $93,039 $93,039 $(2,442)Interest rate swaps employing exceptional accounting:Interest rate swapsReceive fl oating, payable fi xed 9,876 8,913 *Total $ — $ — $(2,442)
(*) Of interest rate swaps employing exceptional accounting, as these instruments are accounted for together with the hedged loans and bills discounted and borrowings, their fair value is included in the fair value of said loans and bills discounted within “Financial instruments.”
(b) Currency-related:Millions of yen
2017
TypeContract amounts
Over one year Fair value
Principal accounting procedure:Currency swaps ¥34,607 ¥2,060 ¥(419)Total ¥ — ¥ — ¥(419)
Millions of yen2016
TypeContract amounts
Over one year Fair value
Principal accounting procedure:Currency swaps ¥29,891 ¥96 ¥1,443Total ¥ — ¥— ¥1,443
Thousands of U.S. dollars2017
TypeContract amounts
Over one year Fair value
Principal accounting procedure:Currency swaps $308,468 $18,362 $(3,735)Total $ — $ — $(3,735)
(c) Stock-related:
There were no stock-related transactions at March 31,
2017 and 2016.
(d) Bond-related:
There were no bond-related transactions at March 31,
2017 and 2016.
7. LOANS AND BILLS DISCOUNTED
Loans at March 31, 2017 and 2016 include “Risk-Managed
Loan Amounts” as follows:
(1) Loans to borrowers in bankruptcy amounting to
¥14,652 million ($131 million) and ¥18,738 million
denote loans subject to Article 96-1-3 and 96-1-4 of
“Order for Enforcement of the Corporation Tax Act”
(Cabinet Order No. 97 of 1965) on which interest
accrual has stopped as there is doubt about the
collectability of either principal or interest because they
have been contractually past due for a considerable
period of time or for other reasons.
(2) Other delinquent loans amounting to ¥65,203 million
($581 million) and ¥73,782 million denote loans
on which the Banks have stopped accruing interest
excluding loans to borrowers in bankruptcy and loans
on which interest payments are deferred in order to
promote recovery of borrowers in economic diffi culty.
(3) Loans past due for three months or more amounting to
¥471 million ($4 million) and ¥552 million denote loans
where payment of interest or principal has been delayed
for three months or more excluding loans to borrowers
in bankruptcy and other delinquent loans.

43 YMFG Annual Report 2017
(4) Restructured loans amounting to ¥10,039 million
($89 million) and ¥12,286 million denote loans to
borrowers for which the repayment terms have been
modifi ed to more favorable terms including reduction
of interest rate, deferral of interest payments, extension
of principal payments and debt forgiveness with
the objective of promoting recovery of borrowers in
economic diffi culty excluding loans to borrowers in
bankruptcy, other delinquent loans, and past-due loans.
(5) The total of loans to borrowers in bankruptcy, other
delinquent loans, past-due loans, and restructured
loans amounted to ¥90,365 million ($805 million) and
¥105,358 million.
The loan amounts disclosed from (1) to (5) above are
amounts before deducting an allowance for loan losses.
Commercial bills Bills discounted are accounted for as fi nancing transactions
in accordance with the Industry Audit Committee Report
No. 24, February 13, 2002, of the JICPA, although the
Banks have the right to sell or pledge them without
restrictions. The total face value of commercial bills and
purchased foreign exchange bills obtained as a result of
discounting was ¥40,304 million ($359 million) at March
31, 2017 and ¥41,223 million at March 31, 2016.
8. COMMITMENT LINES
Loan agreements and commitment line agreements
relating to loans are agreements that oblige the
consolidated subsidiaries to lend funds up to a certain limit
agreed in advance. The consolidated subsidiaries make
the loans upon the request of an obligor to draw down
funds under such loan agreements as long as there is no
breach of the various terms and conditions stipulated in the
relevant loan agreement. The unused commitment balance
relating to these loan agreements amounted to ¥917,600
million ($8,179 million) at March 31, 2017 and ¥923,165
million at March 31, 2016. Of this amount, ¥834,969
million ($7,442 million) at March 31, 2017, and ¥847,805
million at March 31, 2016, relates to loans for which the
term of the agreement is one year or less, or unconditional
cancellation of the agreement is allowed at any time.
In many cases the term of the agreement runs its course
without the loan ever being drawn down. Therefore,
the unused loan commitment will not necessarily affect
future cash fl ows. Conditions are included in certain loan
agreements that allow the consolidated subsidiaries either
to decline the request for a loan draw-down or to reduce
the agreed limit amount when there is due cause to do
so, such as when there is a change in fi nancial condition
or when it is necessary to protect the consolidated
subsidiaries’ credit. Consolidated subsidiaries take various
measures to protect their credit. Such measures include
having the obligor pledge collateral to the consolidated
subsidiaries in the form of real estate, securities, etc., at
entering into a loan agreement or in accordance with the
consolidated subsidiaries’ established internal procedures
for confi rming the obligor’s fi nancial condition, etc., at
regular intervals.
9. PLEDGED ASSETS
At March 31, 2017 and 2016, the following assets were
pledged as collateral for certain liabilities of the Banks.
Millions of yenThousands of U.S. dollars
2017 2016 2017Cash and due from banks ¥ 18 ¥ 18 $ 160Securities 247,444 235,549 2,205,580
The collateral was pledged to secure the following:
Millions of yenThousands of U.S. dollars
2017 2016 2017Deposits ¥36,332 ¥38,656 $323,843Call money 11,219 — 100,000Payables under securities lending transactions
32,861 32,001 292,905
Borrowed money — 901 —
In addition, securities not included in the above
schedules were pledged as collateral for operating
transactions, such as foreign exchange contracts and
forward exchange contracts. These securities amounted
to ¥104,578 million ($932 million) and cash and due from
banks ¥3 million ($27 thousand) at March 31, 2017. The
corresponding fi gures at March 31, 2016, were ¥104,750
million and ¥3 million.
Also, other assets included security deposits, collateral
pledged for transactions involving public funds, collateral
pledged for fi nancial instruments and collateral pledged for
YMFG Annual Report 2017 44
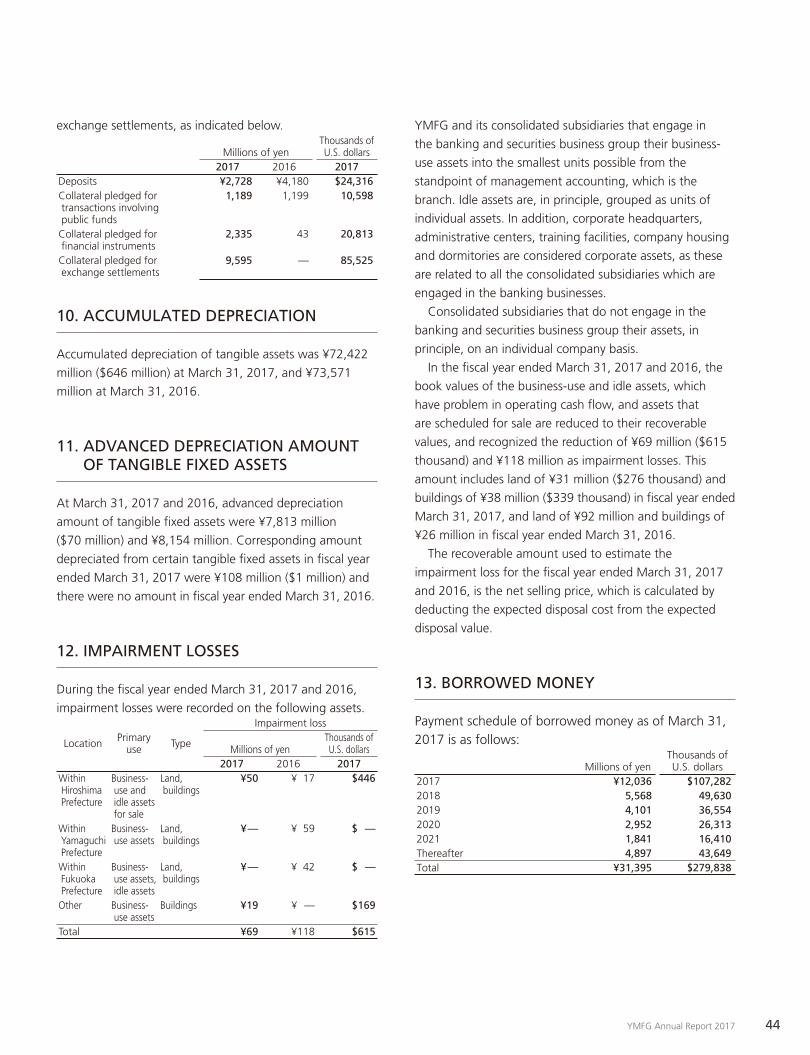
exchange settlements, as indicated below.
Millions of yenThousands of U.S. dollars
2017 2016 2017Deposits ¥2,728 ¥4,180 $24,316Collateral pledged for transactions involving public funds
1,189 1,199 10,598
Collateral pledged for fi nancial instruments
2,335 43 20,813
Collateral pledged for exchange settlements
9,595 — 85,525
10. ACCUMULATED DEPRECIATION
Accumulated depreciation of tangible assets was ¥72,422
million ($646 million) at March 31, 2017, and ¥73,571
million at March 31, 2016.
11. ADVANCED DEPRECIATION AMOUNT OF TANGIBLE FIXED ASSETS
At March 31, 2017 and 2016, advanced depreciation
amount of tangible fi xed assets were ¥7,813 million
($70 million) and ¥8,154 million. Corresponding amount
depreciated from certain tangible fi xed assets in fi scal year
ended March 31, 2017 were ¥108 million ($1 million) and
there were no amount in fi scal year ended March 31, 2016.
12. IMPAIRMENT LOSSES
During the fi scal year ended March 31, 2017 and 2016,
impairment losses were recorded on the following assets.
Location Primary use Type
Impairment loss
Millions of yenThousands of U.S. dollars
2017 2016 2017Within Hiroshima Prefecture
Business- use and idle assets for sale
Land, buildings
¥50 ¥ 17 $446
Within Yamaguchi Prefecture
Business- use assets
Land, buildings
¥— ¥ 59 $ —
Within Fukuoka Prefecture
Business- use assets, idle assets
Land, buildings
¥— ¥ 42 $ —
Other Business- use assets
Buildings ¥19 ¥ — $169
Total ¥69 ¥118 $615
YMFG and its consolidated subsidiaries that engage in
the banking and securities business group their business-
use assets into the smallest units possible from the
standpoint of management accounting, which is the
branch. Idle assets are, in principle, grouped as units of
individual assets. In addition, corporate headquarters,
administrative centers, training facilities, company housing
and dormitories are considered corporate assets, as these
are related to all the consolidated subsidiaries which are
engaged in the banking businesses.
Consolidated subsidiaries that do not engage in the
banking and securities business group their assets, in
principle, on an individual company basis.
In the fi scal year ended March 31, 2017 and 2016, the
book values of the business-use and idle assets, which
have problem in operating cash fl ow, and assets that
are scheduled for sale are reduced to their recoverable
values, and recognized the reduction of ¥69 million ($615
thousand) and ¥118 million as impairment losses. This
amount includes land of ¥31 million ($276 thousand) and
buildings of ¥38 million ($339 thousand) in fi scal year ended
March 31, 2017, and land of ¥92 million and buildings of
¥26 million in fi scal year ended March 31, 2016.
The recoverable amount used to estimate the
impairment loss for the fi scal year ended March 31, 2017
and 2016, is the net selling price, which is calculated by
deducting the expected disposal cost from the expected
disposal value.
13. BORROWED MONEY
Payment schedule of borrowed money as of March 31, 2017 is as follows:
Millions of yenThousands of U.S. dollars
2017 ¥12,036 $107,2822018 5,568 49,6302019 4,101 36,5542020 2,952 26,3132021 1,841 16,410Thereafter 4,897 43,649Total ¥31,395 $279,838
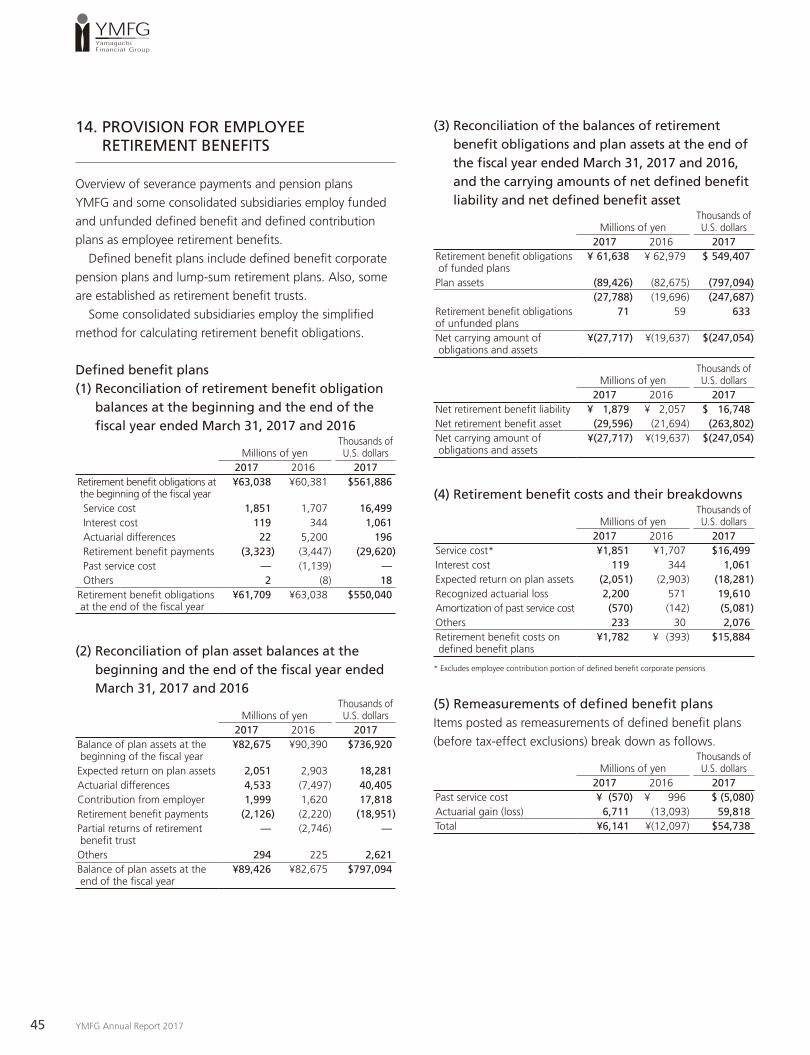
45 YMFG Annual Report 2017
14. PROVISION FOR EMPLOYEE RETIREMENT BENEFITS
Overview of severance payments and pension plans
YMFG and some consolidated subsidiaries employ funded
and unfunded defi ned benefi t and defi ned contribution
plans as employee retirement benefi ts.
Defi ned benefi t plans include defi ned benefi t corporate
pension plans and lump-sum retirement plans. Also, some
are established as retirement benefi t trusts.
Some consolidated subsidiaries employ the simplifi ed
method for calculating retirement benefi t obligations.
Defi ned benefi t plans(1) Reconciliation of retirement benefi t obligation
balances at the beginning and the end of the fi scal year ended March 31, 2017 and 2016
Millions of yenThousands of U.S. dollars
2017 2016 2017Retirement benefi t obligations at the beginning of the fi scal year
¥63,038 ¥60,381 $561,886
Service cost 1,851 1,707 16,499 Interest cost 119 344 1,061 Actuarial differences 22 5,200 196 Retirement benefi t payments (3,323) (3,447) (29,620) Past service cost — (1,139) — Others 2 (8) 18Retirement benefi t obligations at the end of the fi scal year
¥61,709 ¥63,038 $550,040
(2) Reconciliation of plan asset balances at the beginning and the end of the fi scal year ended March 31, 2017 and 2016
Millions of yenThousands of U.S. dollars
2017 2016 2017Balance of plan assets at the beginning of the fi scal year
¥82,675 ¥90,390 $736,920
Expected return on plan assets 2,051 2,903 18,281Actuarial differences 4,533 (7,497) 40,405Contribution from employer 1,999 1,620 17,818Retirement benefi t payments (2,126) (2,220) (18,951)Partial returns of retirement benefi t trust
— (2,746) —
Others 294 225 2,621Balance of plan assets at the end of the fi scal year
¥89,426 ¥82,675 $797,094
(3) Reconciliation of the balances of retirement benefi t obligations and plan assets at the end of the fi scal year ended March 31, 2017 and 2016, and the carrying amounts of net defi ned benefi t liability and net defi ned benefi t asset
Millions of yenThousands of U.S. dollars
2017 2016 2017Retirement benefi t obligations of funded plans
¥ 61,638 ¥ 62,979 $ 549,407
Plan assets (89,426) (82,675) (797,094)(27,788) (19,696) (247,687)
Retirement benefi t obligations of unfunded plans
71 59 633
Net carrying amount of obligations and assets
¥(27,717) ¥(19,637) $(247,054)
Millions of yenThousands of U.S. dollars
2017 2016 2017Net retirement benefi t liability ¥ 1,879 ¥ 2,057 $ 16,748Net retirement benefi t asset (29,596) (21,694) (263,802)Net carrying amount of obligations and assets
¥(27,717) ¥(19,637) $(247,054)
(4) Retirement benefi t costs and their breakdowns
Millions of yenThousands of U.S. dollars
2017 2016 2017Service cost* ¥1,851 ¥1,707 $16,499Interest cost 119 344 1,061Expected return on plan assets (2,051) (2,903) (18,281)Recognized actuarial loss 2,200 571 19,610Amortization of past service cost (570) (142) (5,081)Others 233 30 2,076Retirement benefi t costs on defi ned benefi t plans
¥1,782 ¥ (393) $15,884
* Excludes employee contribution portion of defi ned benefi t corporate pensions
(5) Remeasurements of defi ned benefi t plansItems posted as remeasurements of defi ned benefi t plans
(before tax-effect exclusions) break down as follows.
Millions of yenThousands of U.S. dollars
2017 2016 2017Past service cost ¥ (570) ¥ 996 $ (5,080)Actuarial gain (loss) 6,711 (13,093) 59,818Total ¥6,141 ¥(12,097) $54,738

YMFG Annual Report 2017 46
(6) Cumulative remeasurements of defi ned benefi t plans
Items posted as cumulative remeasurements of defi ned
benefi t plans (before tax-effect exclusions) break down
as follows.
Millions of yenThousands of U.S. dollars
2017 2016 2017Unrecognized past service cost ¥ (427) ¥ (997) $ (3,806)Unrecognized actuarial gain (loss)
(978) 5,732 (8,717)
Total ¥(1,405) ¥4,735 $(12,523)
(7) Plan assets(i) Percentages of major asset categories to total plan assets
are as follows.2017 2016
Bonds 19% 21%Shares 66% 65%Others 15% 14%Total 100% 100%
(Note) Plan assets include 46% of corporate pension plans established as retirement benefi t trusts at the end of the fi scal year ended March 31, 2017, and 25% at March 31, 2016.
(ii) Method of establishing expected long-term return on
plan assets
(Corporate pensions)
Based on the weighted average rate according to the policy
asset mix (medium- to long portfolio) of the expected rate
of return for individual investment fi duciary institutions, net
of investment cost.
(Retirement benefi t trusts)
Past dividend performance is converted to yield.
(8) Basis of actuarial calculationThe basis of actuarial calculations as of March 31, 2017
and 20162017 2016
Discount rate 0.00%—1.21% 0.00%—0.63%
Expected long-term rate of return on plan assets
1.60%—3.10% 1.20%—3.00%
Expected rate of salary increase 0.80%—4.65% 0.80%—4.65%
Defi ned contribution plansThe required contribution to the consolidated subsidiaries’
defi ned contribution plans at the end of the fi scal year
ended March 31, 2017 and 2016 were ¥263 million ($2
million) and ¥153 million, respectively.
15. REVALUATION RESERVE FOR LAND
Pursuant to the Law concerning Revaluation of Land
(Law No. 34, promulgated March 31, 1998, the “Law”),
YMFG revalued certain land used for banking operations
by consolidated subsidiaries. The tax-equivalent portion of
this revaluation amount was recorded in liabilities under
“deferred tax liabilities for revaluation reserve for land,”
and the reminder under net assets as “revaluation reserve
for land.”
Revaluation date: March 31, 1998
Item 3, Article 3, of the Law establishes the evaluation
method as that prescribed by Article 2-4 of the Order for
Enforcement of Law on Revaluation of Land (Enforcement
Order No. 119, promulgated March 31, 1998), and the
amount of land tax is calculated on the basis of the land
tax amount specifi ed under Article 16 of the Land-holding
Tax Act, adjusted rationally in accordance with the basis of
calculation announced offi cially by the Director General of
the National Tax Administration Agency.
Total difference between market value of land for
business use revalued in accordance with Article 10 of the
Law and the total post-revaluation book value of land at
March 31, 2017 and 2016 were ¥22,589 million ($201
million) and ¥23,245 million, respectively.
16. CONTINGENT LIABILITIES — ACCEPTANCES AND GUARANTEES
All contingent liabilities, including letters of credit,
acceptances and guarantees are refl ected in acceptances
and guarantees. As a contra account, customers’
liabilities for acceptances and guarantees are shown
on the asset side, which represent the Banks’ right of
indemnity from customers.
47 YMFG Annual Report 2017
17. OTHER INCOME
Other income for the fi scal year ended March 31, 2017
and 2016 included the gains on sale of stock of ¥11,802
million ($105 million) and ¥10,392 million, respectively.
18. GENERAL AND ADMINISTRATIVE EXPENSES
Items included operating expenses for the year ended
March 31, 2017 and 2016 were as follows:
Millions of yenThousands of U.S. dollars
2017 2016 2017Salary and allowance ¥31,944 ¥31,417 $284,731Depreciation 5,675 7,093 50,584
19. OTHER EXPENSES
Other expenses included ¥921 million ($8,209 thousand)
in loss on sale of stock, ¥124 million ($1,105 thousand)
devaluation of stock and ¥1,119 million ($9,974 thousand)
loss on investment in money held in trust for the year
ended March 31, 2017. For the year ended March 31,
2016, other expenses included ¥1,779 million loss on sale
of stock, ¥697 million devaluation of stock.
20. LEASE TRANSACTIONS
1. Finance lease transactions
Finance lease transactions that do not transfer ownership
(i) Content of lease assets
Tangible fi xed assets
Mainly offi ce equipment
Intangible fi xed assets
Software
(ii) Depreciation method for lease assets
As described in “Lease assets under” (5) Accounting
Policies, in “2. SIGNIFICANT ACCOUNTING POLICIES.”
2. Operating leases
Future minimum lease payments at March 31, 2017 and
2016 were as follows:
At March 31, 2017
Millions of yenThousands of U.S. dollars
2018 ¥ 98 $ 8742019 and thereafter 930 8,289Total minimum lease payments ¥1,028 $9,163
At March 31, 2016Millions of yen
2017 ¥ 942018 and thereafter 1,003Total minimum lease payments ¥1,097
21. INCOME TAXES
1. Signifi cant components of the deferred tax assets and
liabilities as of March 31, 2017 and 2016 were as follows:
Millions of yenThousands of U.S. dollars
2017 2016 2017
Deferred tax assets: Allowance for loan losses ¥ 14,360 ¥ 17,314 $ 127,997 Net defi ned benefi t liability 2,639 5,312 23,523 Losses on devaluation of securities
1,575 1,523 14,039
Provision for bonuses 1,100 1,118 9,805 Depreciation 636 752 5,669 Net operating losses carryforwards
269 304 2,407
Other 2,595 3,820 23,129 Deferred tax assets 23,174 30,143 206,569 Valuation allowance (2,387) (2,377) (21,276) Total deferred tax assets 20,787 27,766 185,293Deferred tax liabilities: Unrealized gains on available-for-sale securities
(23,426) (23,166) (208,806)
Securities contributed to retirement benefi t trusts
(4,243) (4,243) (37,820)
Other (1,350) (2,077) (12,042) Total deferred tax liabilities (29,019) (29,486) (258,668)Net deferred tax assets (liabilities)
¥ (8,232) ¥ (1,720) $ (73,375)
YMFG Annual Report 2017 48
2. Signifi cant differences between the statutory effective
tax rate and the actual income tax rate after application
of deferred income tax accounting for the year ended
March 31, 2017 and 2016 were as follows:%
2017 2016Effective statutory tax rate — 32.83(Adjustments) Revision of valuation allowances — (2.61)Items permanently exempted from income such as dividend income
— (0.42)
Non-deductable goodwill amortization — 3.15Inhabitant tax on per capita basis — 0.26Items permanently excluded from expense such as entertainment expenses
— 0.27
Downward revision in deferred tax assets at the end of the fi scal year due to changes in tax rate
— 1.83
Consolidation adjustment — 0.07Others — 0.35Actual tax rate after application of deferred income tax accounting
— 35.73
(Note) Information for the year ended March 31, 2017 was omitted, as the difference between the effective statutory tax rate and the actual tax rate after application of deferred income tax accounting is 5% or less of the effective statutory tax rate.
3. Revisions in amounts of deferred tax assets and liabilities due to changes in the corporate tax rate
For the year ended March 31, 2017
The “Act for Partial Revision of Acts, Including Partial
Revision of the Consumption Tax Act for the Fundamental
Reform of the Taxation System to Achieve a Stable Source
of Revenue for Social Security” and the “Act for Partial
Revision of Acts, Including Partial Revision of the Local Tax
Act and the Local Allocation Tax Act for the Fundamental
Reform of the Taxation System to Achieve a Stable
Source of Revenue for Social Security” were enacted by
the Japanese government on November 18, 2016. In
conjunction with these acts, the effective statutory rate
used in calculating deferred tax assets and liabilities for the
fi scal year ended March 31, 2017, has changed from that
used for the fi scal year ended March 31, 2016.
As a result, deferred tax assets increased by ¥37 million
and deferred income taxes decreased by the same amount.
For the year ended March 31, 2016
The “Act on Partial revision of Income Tax Act” (Law No.
15 of 2016) and the “Act on Partial Revision of the Local
Tax Act” (Law No. 13 of 2016) were passed on March
29, 2016, lowering the corporate tax rate from the fi scal
years beginning on or after April 1, 2016. Accordingly, the
statutory effective tax rate used for calculating deferred
tax assets and liabilities was reduced from 32.38%
to 30.69% applied for temporary differences that are
expected to be deductible in the fi scal year beginning
April 1, 2016 and 2017, and further to 30.46% applied
for temporary differences that are expected to be
deductible in the fi scal year beginning April 1, 2018.
This change in the tax rate had the effect of reducing
deferred tax liabilities by ¥210 million, increasing
unrealized gains on available-for-sale securities by ¥1,222
million, reducing deferred gains or losses on hedges by
¥7 million, decreasing remeasurements of defi ned benefi t
plans by ¥72 million and increasing deferred income taxes
by ¥933 million. Deferred tax liabilities for land revaluation
decreased by ¥571 million, and revaluation reserve for land
increased by the same amount.
22. NET ASSETS
Under the Companies Act of Japan (“the Act”), the entire
amount paid for new shares is in principle required to be
designated as common stock. However, a company may,
by a resolution of the Board of Directors, designate an
amount not exceeding one-half of the price of the new
shares as additional paid-in capital, which is included in
capital surplus.
Under the Act, in cases where dividend distribution of
surplus is made, the smaller of an amount equal to 10%
of the dividend or the excess, if any, of 25% of common
stock over the total of additional paid-in capital and legal
earnings reserve must be set aside as additional paid-in
capital or legal earnings reserve. Legal earnings reserve
is included in retained earnings in the accompanying
Consolidated Balance Sheets.
49 YMFG Annual Report 2017
Under the Act, legal earnings reserve and additional
paid-in capital may be used to eliminate or reduce a defi cit,
or may be capitalized, by a resolution of the shareholders’
meeting.
Under the Act, additional paid-in capital and legal
earnings reserve may not be distributed as dividends,
however all of these may be transferred to other capital
surplus and retained earnings, respectively, which are
potentially available for dividends.
The maximum amount that YMFG can distribute as
dividends is calculated based on the Non-Consolidated
Financial Statements of YMFG in accordance with the Act.
At the annual shareholders’ meeting, held on June 28,
2017, the shareholders approved cash dividends amounting
to ¥1,989 million ($18 million). Such appropriations have
not been accrued in the Consolidated Financial Statements
as of March 31, 2017 and to be recognized in the period in
which they are approved by the shareholders.
At the annual shareholders’ meeting, held on June
29, 2016, the shareholders approved cash dividends
amounting to ¥1,970 million. Such appropriations have not
been accrued in the Consolidated Financial Statements as
of March 31, 2016 and to be recognized in the period in
which they are approved by the shareholders.
23. CHANGES IN NET ASSETS
1. Type and number of shares issued and treasury shares
were as follows:Number of shares (in thousand)
March 31, 2016 Increase Decrease March 31,
2017Shares issued Common stock 264,353 — — 264,353 Total 264,353 — — 264,353Treasury stock Common stock*1, *2, *3 19,472 2,284 3,202 18,554 Total 19,472 2,284 3,202 18,554
*1 The increase in the number of shares is due to the acquisition of 1,631 thousand of YMFG’s shares by the ESOP Trust for Employees, the acquisition of 633 thousand of YMFG’s shares by the Board Benefi t Trust (BBT), and 19 thousand shares were due to purchases of shares constituting less than one trading unit. Of the decreases in the number of shares, 1,631 thousand shares were due to allocation to the ESOP Trust for Employees, 793 thousand shares were due to the sale of shares to the Group’s employee stock ownership program, 663 thousand shares were due to allocation to the Board Benefi t Trust (BBT), 144 thousand shares were due to the exercise of stock options, and 0 thousand shares were in response to demand for the purchase of fractional shares.
*2 Treasury stock as of beginning and ending of fi scal year ended March 31, 2017 include 781 thousand shares and 1,619 thousand shares held by the ESOP Trust for Employee Shareholders.
*3 Treasury stock held by the Board Benefi t Trust (BBT) includes 633 thousand shares held as of March 31, 2017.
Number of shares (in thousand)March 31,
2015 Increase Decrease March 31, 2016
Shares issued Common stock 264,353 — — 264,353 Total 264,353 264,353Treasury stock Common stock*1, *2 20,857 27 1,412 19,472 Total 20,857 27 1,412 19,472
*1 The increase in the number of shares is due to purchases of shares constituting less than one trading unit. Of the decreases in the number of shares, 1,037 thousand shares were due to a share exchange between YMFG and an affi liated company, 266 thousand shares were due to the sale of shares to the Group’s employee stock ownership program, 103 thousand shares were due to the exercise of stock options, 3 thousand shares were due to the changes in ownership of YMFG’s subsidiaries, and 1 thousand shares were in response to demand for the purchase of fractional shares.
*2 Treasury stock as of beginning and ending of fi scal year ended March 31, 2016 include 1,047 thousand shares and 781 thousand shares held by the ESOP Trust for Employee Shareholders.
2. Stock options
Stock options at March 31, 2017 and 2016 were ¥513
million ($5 million) and ¥601 million, respectively.
3. Information on dividends is as follows:
(a) Dividends paid in the fi scal year ended March 31, 2017
and 2016.
Type of shares
Aggregate amount of dividends (Millions of yen)
Cash dividends per share
(Yen)
Record date
Effective date
Resolved at the board of directors meeting on May 13, 2016Common stock ¥1,970*1 ¥8.00 Mar. 31,
2016Jun. 30,
2016Resolved at the board of directors meeting on November 11, 2016Common stock ¥2,471*2 ¥10.00 Sep. 30,
2016Dec. 9, 2016
*1 The total amount of dividend on common stock includes ¥6 million in dividends to ESOP Trust for employee shareholders.
*2 The total amount of dividend on common stock includes ¥12 million in dividends to ESOP Trust for employee shareholders and Board Benefi t Trust (BBT).
Type of shares
Aggregate amount of dividends (Millions of yen)
Cash dividends per share
(Yen)
Record date
Effective date
Resolved at the board of directors meeting on May 8, 2015Common stock ¥1,712*1 ¥7.00 Mar. 31,
2015Jun. 29,
2015Resolved at the board of directors meeting on November 6, 2015Common stock ¥1,713*2 ¥7.00 Sep. 30,
2015Dec. 10,
2015
*1 The total amount of dividend on common stock includes ¥7 million in dividends to ESOP Trust for employee shareholders.
*2 The total amount of dividend on common stock includes ¥6 million in dividends to ESOP Trust for employee shareholders.
YMFG Annual Report 2017 50
Type of shares
Aggregate amount of dividends
(Thousands of U.S. dollars)
Cash dividends per share
(U.S. dollars)
Record date
Effective date
Resolved at the board of directors meeting on May 13, 2016Common stock $17,559*1 $0.07 Mar. 31,
2016Jun. 30,
2016Resolved at the board of directors meeting on November 11, 2016Common stock $22,025*2 $0.09 Sep. 30,
2016Dec. 9, 2016
*1 The total amount of dividend on common stock includes $53 thousand in dividends to ESOP Trust for employee shareholders.
*2 The total amount of dividend on common stock includes $107 thousand in dividends to ESOP Trust for employee shareholders and Board Benefi t Trust (BBT).
(b) Dividends to be paid in the fi scal year ending March 31,
2018 and 2017 are as follows:(Millions of yen, except per share amount)
Type of shares
Aggregate amount of dividends
(Millions of yen)
Source of
dividends
Cashdividendsper share
(Yen)
Recorddate
Effectivedate
Resolved at the board of directors meeting on May 12, 2017Common stock ¥1,989* Retained
earnings¥8.00 Mar. 31,
2017Jun. 28,
2017
* The total amount of dividend on common stock includes ¥18 million in dividends to ESOP Trust and for employee shareholders and Board Benefi t Trust (BBT).
(Millions of yen, except per share amount)
Type of shares
Aggregate amount of dividends
(Millions of yen)
Source of
dividends
Cashdividendsper share
(Yen)
Recorddate
Effectivedate
Resolved at the board of directors meeting on May 13, 2016Common stock ¥1,970* Retained
earnings¥8.00 Mar. 31,
2016Jun. 30,
2016
* The total amount of dividend on common stock includes ¥6 million in dividends to ESOP Trust for employee shareholders.
(Thousands of U.S. dollars, except per share amount)
Type of shares
Aggregate amount of dividends
(Thou-sands of U.S. dol-
lars)
Source of
dividends
Cashdividendsper share(U.S. dol-
lars)
Recorddate
Effectivedate
Resolved at the board of directors meeting on May 12, 2017Common stock $17,729* Retained
earnings$0.07 Mar. 31,
2017Jun. 28,
2017
* The total amount of dividend on common stock includes $160 thousand in dividends to ESOP Trust for employee shareholders and Board Benefi t Trust (BBT).
24. STOCK OPTIONS
At a Board of Directors meeting, resolutions were passed
with regard to subscription requirements for the allotment
of stock options as compensation to directors of YMFG’s
banking subsidiaries, Yamaguchi Bank, Momiji Bank and
Kitakyushu Bank. The details of these resolutions are
described below.
1. Recording of expenses related to stock options and the
name of line items
Millions of yenThousands of U.S. dollars
2017 2016 2017General and administrative expenses
¥42 ¥172 $374
2. The content of the stock options is as outlined below.2016
Category and number of persons to be granted stock options
27 directors (excluding directors who are members of the Audit and Supervi-sory Committee, part-time directors and outside directors) of YMFG’s subsidiar-ies, Yamaguchi Bank, Momiji Bank and Kitakyushu Bank.
Number of stock options by class of stock*
122,000 shares of YMFG’s common stock
Grant date August 25, 2015
Vesting conditions No vesting conditions set
Target length of service period
No target length of service period set
Period for exercise of rights August 26, 2015—August 25, 2045

51 YMFG Annual Report 2017
2015
Category and number of persons to be granted stock options
27 directors (excluding outside directors) of YMFG’s subsidiaries, Yamaguchi Bank, Momiji Bank and Kitakyushu Bank.
Number of stock options by class of stock*
182,900 shares of YMFG’s common stock
Grant date July 29, 2014
Vesting conditions No vesting conditions set
Target length of service period
No target length of service period set
Period for exercise of rights July 30, 2014—July 29, 2044
2014
Category and number of persons to be granted stock options
27 directors (excluding outside directors) of YMFG’s subsidiaries, Yamaguchi Bank, Momiji Bank and Kitakyushu Bank.
Number of stock options by class of stock*
225,100 shares of YMFG’s common stock
Grant date July 23, 2013
Vesting conditions No vesting conditions set
Target length of service period
No target length of service period set
Period for exercise of rights July 24, 2013—July 23, 2043
2013
Category and number of persons to be granted stock options
27 directors (excluding outside directors) of YMFG’s subsidiaries, Yamaguchi Bank, Momiji Bank and Kitakyushu Bank.
Number of stock options by class of stock*
294,900 shares of YMFG’s common stock
Grant date July 30, 2012
Vesting conditions No vesting conditions set
Target length of service period
No target length of service period set
Period for exercise of rights July 31, 2012—July 30, 2042
2012
Category and number of persons to be granted stock options
27 directors (excluding outside directors) of YMFG’s subsidiaries, Yamaguchi Bank, Momiji Bank and Kitakyushu Bank.
Number of stock options by class of stock*
192,600 shares of YMFG’s common stock
Grant date October 31, 2011
Vesting conditions No vesting conditions set
Target length of service period
No target length of service period set
Period for exercise of rights November 1, 2011—October 31, 2041
Note: Stated as the equivalent number of shares.
From the fi scal year ended March 31, 2016, the issuance
of stock options to directors of the YMFG subsidiaries
Yamaguchi Bank, Momiji Bank and Kitakyushu Bank
(excluding directors who are Audit and Supervisory
Committee members, part-time directors and outside
directors) was discontinued.
3. The summary of stock option activity is as indicated below.
(a) Number of stock options2016 2015 2014 2013 2012
Prior to vesting As of the end of the previous consolidated fi scal year
122,000 — — — —
Granted — — — — — Expired — — — — —Vested 122,000 — — — —Rights not yet determined
— — — — —
After vesting As of the end of the previous consolidated fi scal year
— 160,400 144,400 170,800 99,400
Rights determined 122,000 — — — — Rights exercised 21,700 32,300 28,600 37,200 24,500 Expiry — — — — — Amount unexercised
100,300 128,100 115,800 133,600 74,900
(b) Price information
Yen2016 2015 2014 2013 2012
Exercise price ¥ 1 ¥ 1 ¥ 1 ¥ 1 ¥ 1Average share price at time of exercise
964 964 964 964 964
Fair value on date granted
1,377 1,015 973 619 660

YMFG Annual Report 2017 52
4. Method of estimating the fair value of stock options
The method employed to estimate the fair value of stock
options granted during the consolidated fi scal year ended
March 31, 2016 is as follows:
(a) Valuation method employed: Black-Scholes method
(b) Main base fi gures and estimation method2016
Volatility of stock price*1 27.87%Expected number of years remaining*2 3.40 yearsForecast dividend*3 ¥14/shareRisk-free interest rate*4 0.015%
*1 Calculated on the basis of stock price performance during a period (March 2012 to August 2015) corresponding to the expected number of years remaining (3.40 years).
*2 The number of remaining years in service of current directors is estimated on the basis of the average number of years of service of directors retiring, excluding the current service period.
*3 Based on the actual dividend for the fi scal year ended March 31, 2015.*4 Japanese government bond yields for the expected number of years remaining.
5. Method for estimating the number of rights determined
for stock options
Due to the diffi culty of rationally estimating the future
number of rights that will expire, in general a method is
employed that refl ects only the number of rights that have
actually expired.
25. INVESTMENT AND RENTAL PROPERTY
This note is omitted, as the total amount of investment and
rental property is immaterial.
26. CONSOLIDATED STATEMENTS OF COMPREHENSIVE INCOME
Amounts of reclassifi cation adjustments and tax effect
amounts related to other comprehensive income in the
consolidated fi scal year ended March 31, 2017 and 2016
were as follows.
Millions of YenThousands of U.S. dollars
2017 2016 2017Unrealized gains (losses) on available- for-sale securitiesAmount generated during the year
¥13,692 ¥(7,920) $122,043
Reclassifi cation adjustments (11,381) (18,371) (101,444)Before tax effect adjustment 2,311 (26,291) 20,599Tax effect amount (801) 9,155 (7,139)Unrealized gains (losses) on available-for-sale securities
1,510 (17,136) 13,460
Deferred gains on hedgesAmount generated during the year
(503) (352) (4,483)
Reclassifi cation adjustments 631 376 5,624Before tax effect adjustment 128 24 1,141Tax effect amount (38) (15) (339)Deferred gains on hedges 90 9 802Revaluation reserve for landAmount generated during the year
— — —
Reclassifi cation adjustment — — —Before adjustment for tax effects
— — —
Tax effect amount — 571 —Revaluation reserve for land — 571 —Remeasurements of defi ned benefi t plansAmount generated during the year
4,511 (11,558) 40,209
Reclassifi cation adjustment 1,630 (539) 14,529Before adjustment for tax effects
6,141 (12,097) 54,738
Tax effect amount (1,871) 3,805 (16,678)Remeasurements of defi ned benefi t plans
4,270 (8,292) 38,060
Share of other comprehensive income in affi liated companies accounted for using the equity method Amount generated during the year
0 (0) 0
Reclassifi cation adjustments — — —Before tax effect adjustment 0 (0) 0Tax effect amount — — —Share of other comprehensive income in affi liated companies accounted for using the equity method
0 (0) 0
Total other comprehensive income
5,870 (24,848) 52,322

53 YMFG Annual Report 2017
27. SEGMENT INFORMATION
Business segment information is not presented, as the
Group’s business is predominantly consisted of the banking
business, and the securities brokerage, credit card, leasing
and other businesses conducted by the Group collectively
is limited.
Geographic segment information is not presented, as
domestic income of the Bank and consolidated subsidiaries
and their consolidated assets located substantially in Japan
represent more than 90% of the Group’s consolidated
income and assets.
Overseas sales information is not presented, as overseas
sales are less than 10% of the Group’s consolidated income.
28. RELATED PARTY TRANSACTIONS
Details of the transactions between the consolidated
subsidiaries of YMFG submitting the consolidated fi nancial
statements and related parties are as follows:
Executives and major shareholders of YMFG submitting the
consolidated fi nancial statements (only for individuals), etc.
For the year ended March 31, 2017
Category: Executive
Name: Kazuo Tsukuda
Occupation or title: Director and Audit and
Supervisory Committee
Member of YMFG
Relationship with related party: Lender of funds
Content of transaction: Lending of funds*
Transaction amount: ¥86 million (average
balance)
Account name: Loan
Year-end balance: ¥223 million* Conditions for this transaction and for method of deciding this transaction conditions were
the same as general transactions.
For the year ended March 31, 2016
Nothing to report.
29. PER SHARE DATA
Yen U.S. dollars2017 2016 2017
Net assets per share ¥2,486.35 ¥2,357.89 $22.16Net income per share 128.70 132.43 1.15Net income per share (diluted) ¥ 106.64 ¥ 109.39 $ 0.95
Net assets per share are calculated based on the following:Millions of yen
except number of shares
Thousands of U.S. dollars
2017 2016 2017Net assets ¥617,053 ¥583,168 $5,500,071Amounts excluded from net assets
¥ 5,910 ¥ 5,765 $ 52,678
Stock options 513 601 4,573 Non-controling interests 5,397 5,164 48,105Net assets attributable to common stock at the fi scal year-end
611,143 577,403 5,447,393
Number of common stock at the fi scal year-end used for the calculation of net assets per share (in thousands)*
245,800 244,881
* Shares of YMFG held by the ESOP trust and the Board Benefi t Trust (BBT) are shown on the balance sheets as treasury stock, so are not included in the above number of common stock at the fi scal year-end used for the calculation of net assets per share. This number of shares held by the ESOP and the Board Benefi t Trust (BBT) was 781 thousand as of March 31, 2016, and 2,252 thousand as of March 31, 2017.
(Note) As previously described in Changes in Accounting Principles, YMFG’s adoption of the “Accounting Standard for Business Combinations” and other standards is in accordance with the transitional measures provided for in Article 58-2 (4) of the “Accounting Standard for Business Combinations, ”Article 44-5 (4) of the “Accounting Standard for Consolidated Financial Statements, “and Article 57-4 (4) of the “Accounting Standard for Business Divestitures.
As a result, net income per share and diluted net income per share decreased ¥4.44 ($0.04) and ¥3.65 ($0.03) respectively in the fi scal year ended March 31 2016. The impact on net assets per share was slight.
Net income per share is calculated based on the following:Millions of yen
except number of shares
Thousands of U.S. dollars
2017 2016 2017Net income attributable to owners of the parent
¥ 31,587 ¥ 32,296 $281,549
Amount not attributable to common shareholders
— — —
Net income attributable to owners of the parent for common stock
31,587 32,296 281,549
Average shares of common stock during the year* (in thousands)
245,428 243,872 —

YMFG Annual Report 2017 54
Diluted net income per share is calculated based on
the following:Millions of yen
except number of shares
Thousands of U.S. dollars
2017 2016 2017Net income adjustment attributable to owners of the parent
¥ 68 ¥ 6 $606
Interest expenses (excluding tax amount)
68 6 606
Increase of shares of common stock
51,423 51,427 —
Bonds with warrant 50,826 50,728 — Warrant 597 698 —Dilutive shares not including calculation due to no dilutive effect
— — —
* Shares of YMFG held by the ESOP trust and the Board Benefi t Trust (BBT) are shown on the balance sheets as treasury stock, so are not included in the above average shares of common stock during the year. The average number of shares was 907 thousand in the fi scal year ended March 31, 2016, and 893 thousand in the fi scal year ended March 31, 2017.
30. SUBSEQUENT EVENTS
There were no signifi cant subsequent events. Dividends
were made in June 2017 and 2016. Please refer to “23.
NET ASSETS.”
31. BUSINESS COMBINATIONS
For the year ended March 31, 2017
Business Combination due to Acquisition
1 Overview of the business combination
(1) Name and businesses of the acquired company
Name: HOKEN HIROBA Co., Ltd.
Business: Life insurance solicitation, non-life insurance
agency business
(2) Principal reason for conducting the business combination
In order to provide one-stop fi nancial services based on
life planning
(3) Date of the business combination
October 3, 2016
(4) Legal form of the business combination
Conversion to subsidiary through the acquisition of shares
(5) Name of the company following the combination
The name of the company is unchanged following the
combination.
(6) Percentage of voting rights acquired
100%
(7) Main reasons for deciding to acquire the company
YMFG’s consolidated subsidiary, YM Life Planning Co., Ltd.,
acquired all shares of HOKEN HIROBA Co., Ltd., for cash
consideration.
2 Period of the fi nancial results of the acquired company
included in the consolidated fi nancial statements
From October 3, 2016, to March 31, 2017
3 Acquisition cost of the acquired company and
breakdown thereof
Acquisition price Cash ¥3,800 million
Acquisition cost ¥3,800 million
4 Content and amounts of principal acquisition-related
expenses
Due diligence expenses of ¥8 million
5 Amount of goodwill, reasons for the goodwill and period
of amortization
(1) Amount of goodwill
¥3,393 million
(2) Reasons for the goodwill
Mainly because of anticipation of excess earning power to
be generated through future business development
(3) Method and period of amortization
Amortization over 10 years using the straight-line method
6 Amounts of assets received and liabilities assumed on the
day of the business combination and breakdown thereof
Current assets ¥749 million
Fixed assets ¥687 million
Total assets ¥1,436 million
Current liabilities ¥391 million
Non-current liabilities ¥638 million
Total liabilities ¥1,029 million

55 YMFG Annual Report 2017
7 Estimated impact on the consolidated fi nancial
statements in the fi scal year ended March 31, 2017, if
the business combination had been concluded at the
beginning of the fi scal year and method of calculation
Total income ¥2,159 million
Ordinary profi t ¥347 million
(Method of calculating the estimated impact)
Calculated using information on ordinary income and
profi t and loss as if the business combination had been
concluded at the beginning of the fi scal year
This note has not received an audit certifi cation from
KMPG AZCA LLC.
For the year ended March 31, 2016
Transaction under common control
Acquisition of additional shares in subsidiary
1 Overview of the transaction
(1) Name and business of combined company
Name: YM Guarantee Co., Ltd.
(hereinafter, “YM Guarantee”)
Business: Credit guarantee business
(2) Date of the business combination
February 1, 2016
(3) Legal form of the business combination
Share exchange in which YMFG is the wholly owning
parent company and YM Guarantee is the wholly owned
subsidiary company
(4) Company name following the combination
No change
(5) Overview of other matters related to the transaction
The objective is to strengthen YMFG’s internal control
function of the Group.
2 Overview of accounting standards employed
The transaction is handled under common control
transactions, based on the “Accounting Standard for
Business Combinations” (ASBJ Statement No. 21,
September 13, 2013) and the “Guidance on Accounting
Standard for Business Combinations and Accounting
Standard for Business Divestures (ASBJ Guidance No. 10,
September 13, 2013).”
3 Matters related to acquisition of additional shares
in subsidiary
(1) Acquisition cost and breakdown
Acquisition consideration Treasury stock
¥603 million
Acquisition cost ¥603 million
The above-mentioned transaction is a transaction with
non-controlling owners, and total amount being eliminated
as transactions between consolidated companies.
Expenses directly required for the transaction were ¥2
million.
(2) Exchange ratio by type of shares, calculation method
and number of shares delivered
1) Exchange ratio by type of shares 1,237 shares of
YMFG’s common stock: 1 share of YM Guarantee’s
common stock
2) Exchange ratio calculation method
To ensure the fairness and appropriateness of the share
exchange ratio, YMFG selected Daiwa Institute of Research
Ltd. as an independent calculation agent to calculate the
share exchange ratio. Based on prudent negotiations and
deliberations between YMFG and YM Guarantee of the
share exchange ratio, referring to these calculation results,
the above-stated share exchange ratio was judged to be
appropriate, agreed and determined.
3) Number of shares delivered 466 thousand shares
4 Changes in YMFG’s equity related to transaction with
non-controlling owners
(1) Principal reason for changes in capital surplus
Acquisition of additional shares in subsidiary
(2) Amount of increase in capital surplus due to transaction
with non-controlling owners
¥1,194 million