Embed Size (px)
Citation preview
Yield response to water of fruit trees and vines:
guidelines
CROP YIELD RESPONSE TO WATER246
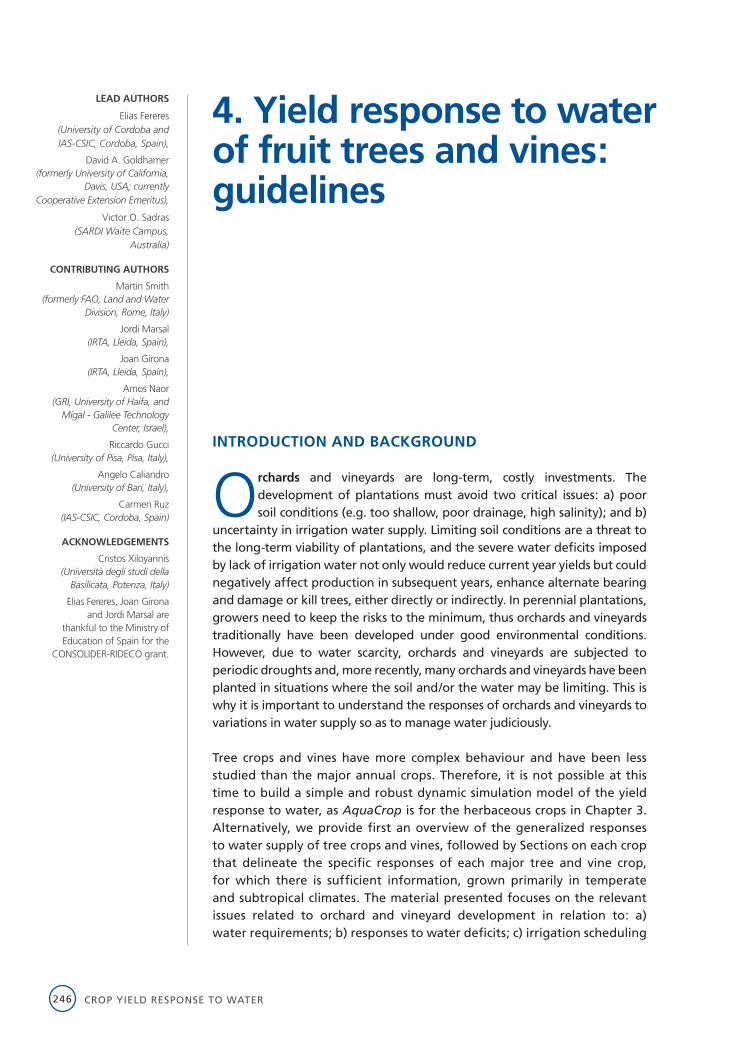
INTRODUCTION AND BACKGROUND
Orchards and vineyards are long-term, costly investments. The development of plantations must avoid two critical issues: a) poor soil conditions (e.g. too shallow, poor drainage, high salinity); and b)
uncertainty in irrigation water supply. Limiting soil conditions are a threat to the long-term viability of plantations, and the severe water deficits imposed by lack of irrigation water not only would reduce current year yields but could negatively affect production in subsequent years, enhance alternate bearing and damage or kill trees, either directly or indirectly. In perennial plantations, growers need to keep the risks to the minimum, thus orchards and vineyards traditionally have been developed under good environmental conditions. However, due to water scarcity, orchards and vineyards are subjected to periodic droughts and, more recently, many orchards and vineyards have been planted in situations where the soil and/or the water may be limiting. This is why it is important to understand the responses of orchards and vineyards to variations in water supply so as to manage water judiciously.
Tree crops and vines have more complex behaviour and have been less studied than the major annual crops. Therefore, it is not possible at this time to build a simple and robust dynamic simulation model of the yield response to water, as AquaCrop is for the herbaceous crops in Chapter 3. Alternatively, we provide first an overview of the generalized responses to water supply of tree crops and vines, followed by Sections on each crop that delineate the specific responses of each major tree and vine crop, for which there is sufficient information, grown primarily in temperate and subtropical climates. The material presented focuses on the relevant issues related to orchard and vineyard development in relation to: a) water requirements; b) responses to water deficits; c) irrigation scheduling
4. Yield response to water of fruit trees and vines: guidelines
LEAD AUTHORS
Elias Fereres (University of Cordoba and IAS-CSIC, Cordoba, Spain),
David A. Goldhamer (formerly University of California,
Davis, USA; currently Cooperative Extension Emeritus),
Victor O. Sadras (SARDI Waite Campus,
Australia)
CONTRIBUTING AUTHORS
Martin Smith (formerly FAO, Land and Water
Division, Rome, Italy)
Jordi Marsal (IRTA, Lleida, Spain),
Joan Girona (IRTA, Lleida, Spain),
Amos Naor (GRI, University of Haifa, and
Migal - Galilee Technology Center, Israel),
Riccardo Gucci (University of Pisa, Pisa, Italy),
Angelo Caliandro (University of Bari, Italy),
Carmen Ruz (IAS-CSIC, Cordoba, Spain)
ACKNOWLEDGEMENTS
Cristos Xiloyannis (Università degli studi della
Basilicata, Potenza, Italy)
Elias Fereres, Joan Girona and Jordi Marsal are
thankful to the Ministry of Education of Spain for the
CONSOLIDER-RIDECO grant.
YIELD RESPONSE TO WATER OF FRUIT TREES AND VINES 247
techniques; d) relations between yield and water use; and e) water management strategies suggested under limited water supply.
World trends in fruit tree and vine productionThe rapid rate of world economic development in recent decades has been accompanied by many transformations; an important one is the change in human diet, such as the increase in demand for animal products in many emerging economies. In most countries, health-related concerns have led to a renewed interest and increased consumption of fruit and vegetables. Strong consumer demand has resulted in the production of high-quality horticultural products; a very high priority of both public and private institutions worldwide. This increased demand for fruit is expected to continue and presents an incentive for growers to develop efficient horticultural industries, which in most areas will be dependent on irrigation.
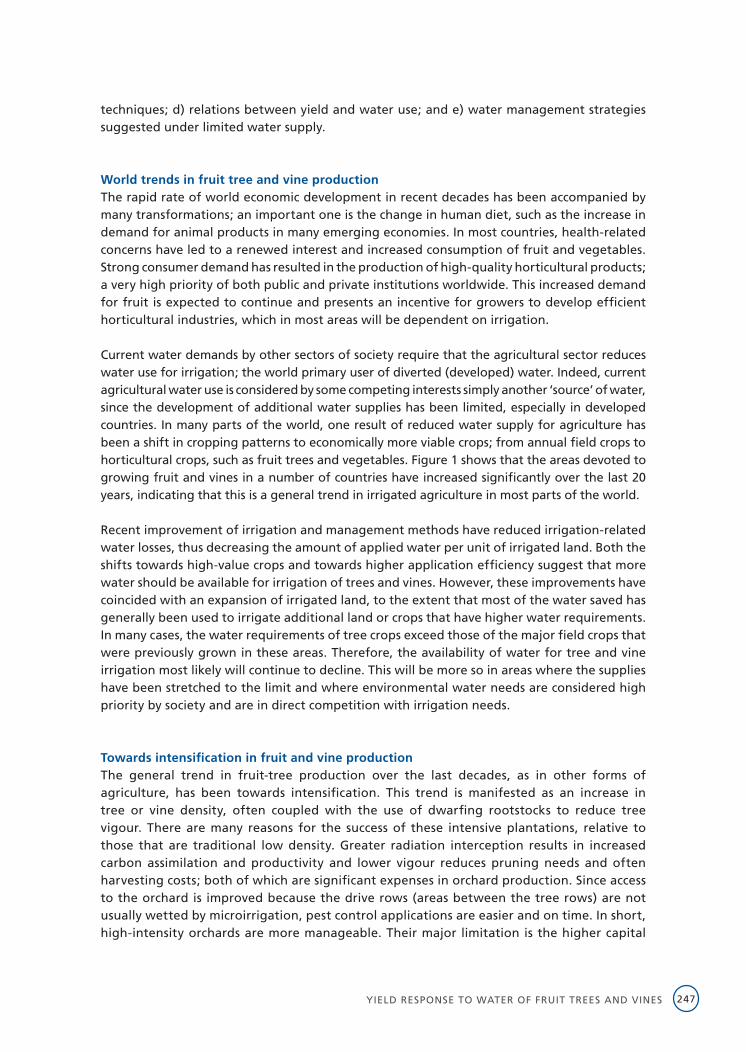
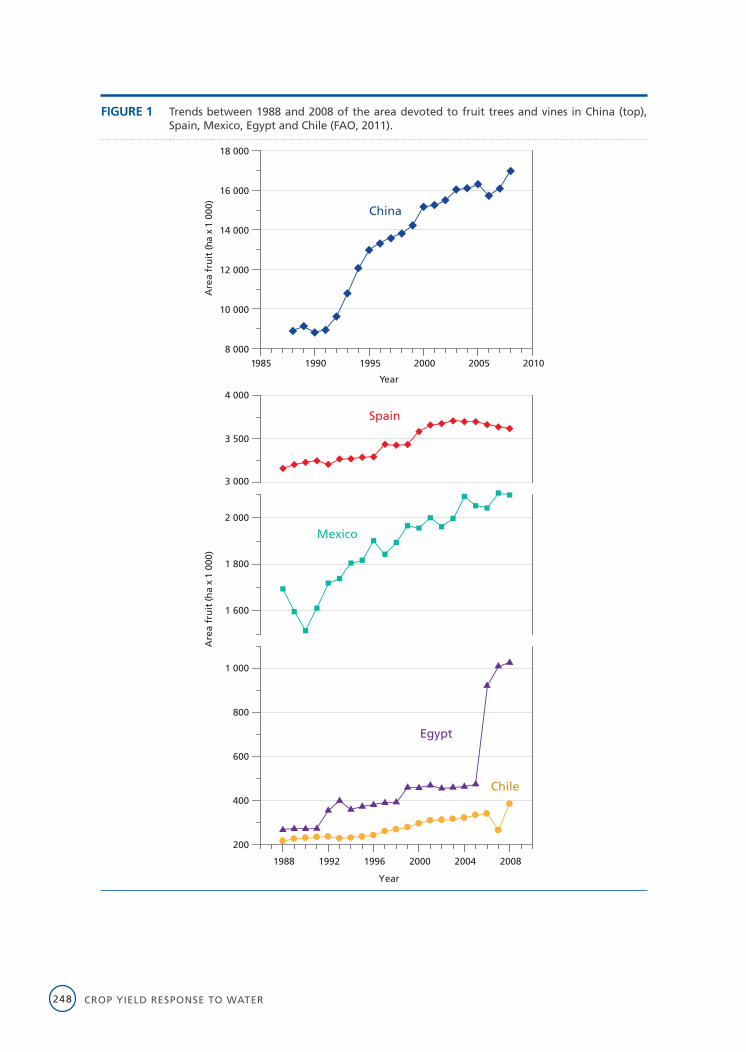
Current water demands by other sectors of society require that the agricultural sector reduces water use for irrigation; the world primary user of diverted (developed) water. Indeed, current agricultural water use is considered by some competing interests simply another ‘source’ of water, since the development of additional water supplies has been limited, especially in developed countries. In many parts of the world, one result of reduced water supply for agriculture has been a shift in cropping patterns to economically more viable crops; from annual field crops to horticultural crops, such as fruit trees and vegetables. Figure 1 shows that the areas devoted to growing fruit and vines in a number of countries have increased significantly over the last 20 years, indicating that this is a general trend in irrigated agriculture in most parts of the world.
Recent improvement of irrigation and management methods have reduced irrigation-related water losses, thus decreasing the amount of applied water per unit of irrigated land. Both the shifts towards high-value crops and towards higher application efficiency suggest that more water should be available for irrigation of trees and vines. However, these improvements have coincided with an expansion of irrigated land, to the extent that most of the water saved has generally been used to irrigate additional land or crops that have higher water requirements. In many cases, the water requirements of tree crops exceed those of the major field crops that were previously grown in these areas. Therefore, the availability of water for tree and vine irrigation most likely will continue to decline. This will be more so in areas where the supplies have been stretched to the limit and where environmental water needs are considered high priority by society and are in direct competition with irrigation needs.
Towards intensification in fruit and vine productionThe general trend in fruit-tree production over the last decades, as in other forms of agriculture, has been towards intensification. This trend is manifested as an increase in tree or vine density, often coupled with the use of dwarfing rootstocks to reduce tree vigour. There are many reasons for the success of these intensive plantations, relative to those that are traditional low density. Greater radiation interception results in increased carbon assimilation and productivity and lower vigour reduces pruning needs and often harvesting costs; both of which are significant expenses in orchard production. Since access to the orchard is improved because the drive rows (areas between the tree rows) are not usually wetted by microirrigation, pest control applications are easier and on time. In short, high-intensity orchards are more manageable. Their major limitation is the higher capital
CROP YIELD RESPONSE TO WATER248
FIGURE 1 Trends between 1988 and 2008 of the area devoted to fruit trees and vines in China (top), Spain, Mexico, Egypt and Chile (FAO, 2011).
8 000
10 000
12 000
14 000
16 000
18 000
Are
a fr
uit
(ha
x 1
000)
1985 1990 1995 2000 2005 2010
Year
China
200
400
600
800
1 000
1 600
1 800
2 000
Are
a fr
uit
(ha
x 1
000)
3 000
3 500
4 000
1988 1992 1996 2000 2004 2008
Year
Spain
Mexico
Egypt
Chile
YIELD RESPONSE TO WATER OF FRUIT TREES AND VINES 249
requirements per unit land area for orchard establishment, but smaller orchards can be economically sustainable if they are adequately designed for intensive production. Another drawback is the higher water requirements associated with greater radiation interception, especially during the first years of the orchards (Box 1).
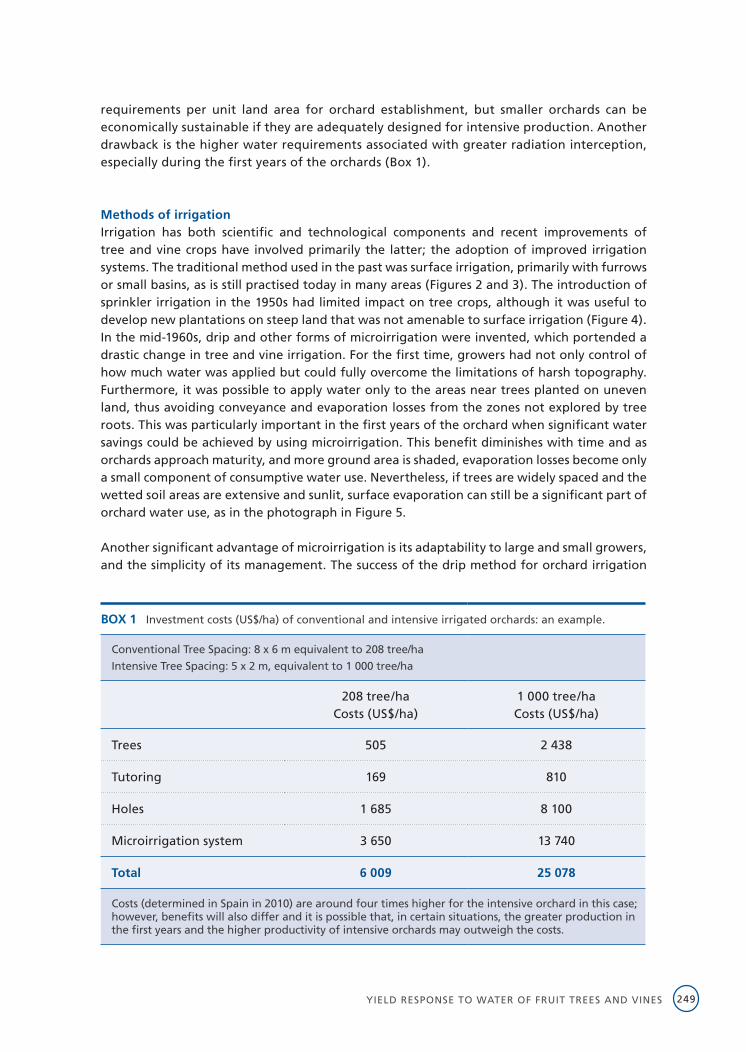
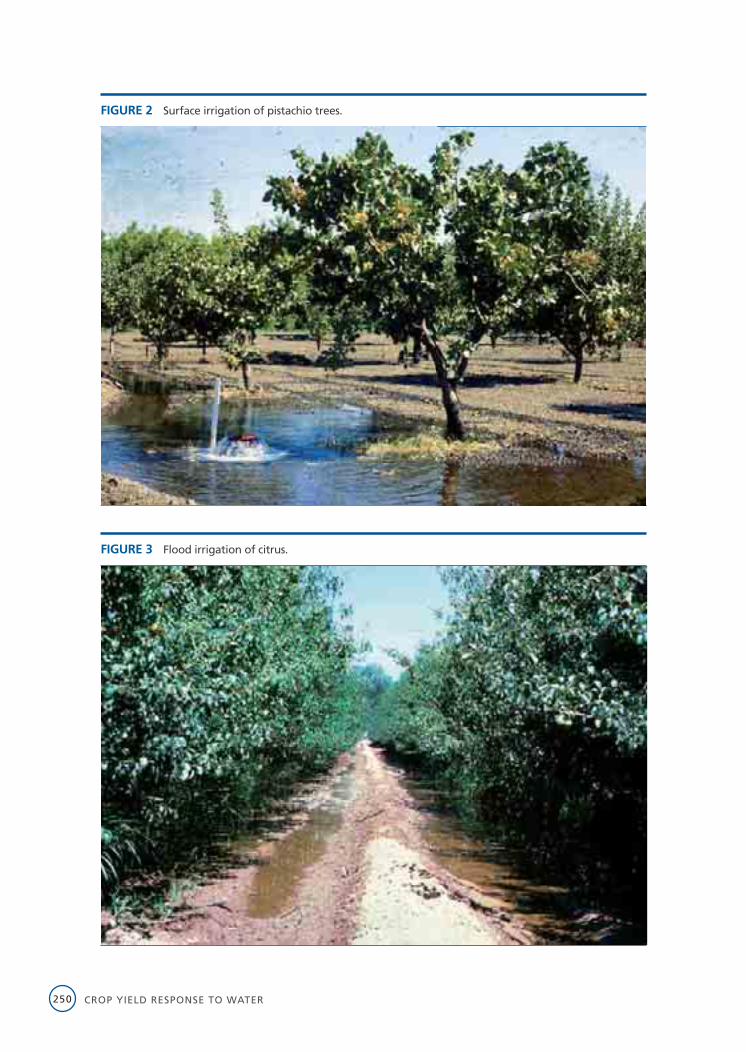
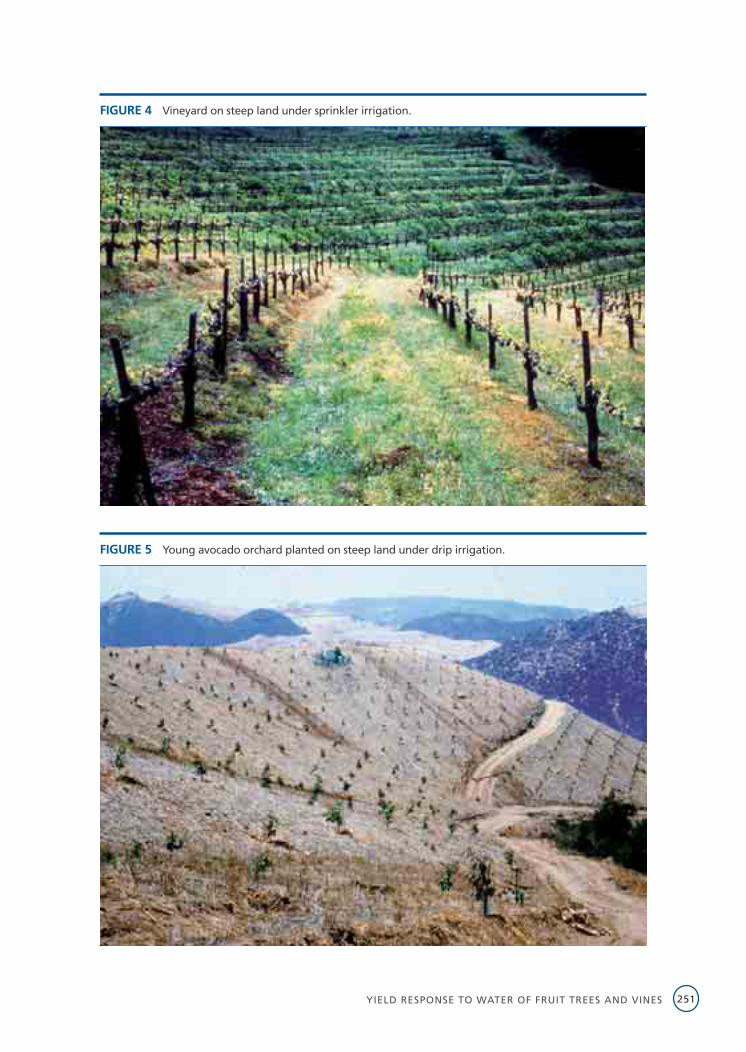
Methods of irrigation Irrigation has both scientific and technological components and recent improvements of tree and vine crops have involved primarily the latter; the adoption of improved irrigation systems. The traditional method used in the past was surface irrigation, primarily with furrows or small basins, as is still practised today in many areas (Figures 2 and 3). The introduction of sprinkler irrigation in the 1950s had limited impact on tree crops, although it was useful to develop new plantations on steep land that was not amenable to surface irrigation (Figure 4). In the mid-1960s, drip and other forms of microirrigation were invented, which portended a drastic change in tree and vine irrigation. For the first time, growers had not only control of how much water was applied but could fully overcome the limitations of harsh topography. Furthermore, it was possible to apply water only to the areas near trees planted on uneven land, thus avoiding conveyance and evaporation losses from the zones not explored by tree roots. This was particularly important in the first years of the orchard when significant water savings could be achieved by using microirrigation. This benefit diminishes with time and as orchards approach maturity, and more ground area is shaded, evaporation losses become only a small component of consumptive water use. Nevertheless, if trees are widely spaced and the wetted soil areas are extensive and sunlit, surface evaporation can still be a significant part of orchard water use, as in the photograph in Figure 5.
Another significant advantage of microirrigation is its adaptability to large and small growers, and the simplicity of its management. The success of the drip method for orchard irrigation
BOX 1 Investment costs (US$/ha) of conventional and intensive irrigated orchards: an example.
Conventional Tree Spacing: 8 x 6 m equivalent to 208 tree/ha
Intensive Tree Spacing: 5 x 2 m, equivalent to 1 000 tree/ha
208 tree/haCosts (US$/ha)
1 000 tree/ha Costs (US$/ha)
Trees 505 2 438
Tutoring 169 810
Holes 1 685 8 100
Microirrigation system 3 650 13 740
Total 6 009 25 078
Costs (determined in Spain in 2010) are around four times higher for the intensive orchard in this case; however, benefits will also differ and it is possible that, in certain situations, the greater production in the first years and the higher productivity of intensive orchards may outweigh the costs.
CROP YIELD RESPONSE TO WATER250
FIGURE 2 Surface irrigation of pistachio trees.
FIGURE 3 Flood irrigation of citrus.
YIELD RESPONSE TO WATER OF FRUIT TREES AND VINES 251
FIGURE 4 Vineyard on steep land under sprinkler irrigation.
FIGURE 5 Young avocado orchard planted on steep land under drip irrigation.
CROP YIELD RESPONSE TO WATER252
has been such that wherever farmers can afford to purchase such systems, they are very much preferred for use in new plantations worldwide. As with other permanent irrigation systems, the most important management issue is to determine the amount of water to apply, while the frequency of application is much less important. While irrigation is applied to meet the sum of transpiration loss from the leaves and evaporation from the soil surface, some losses normally take place in the process of irrigation, even though these should be relatively small with well-designed and managed microirrigation systems.
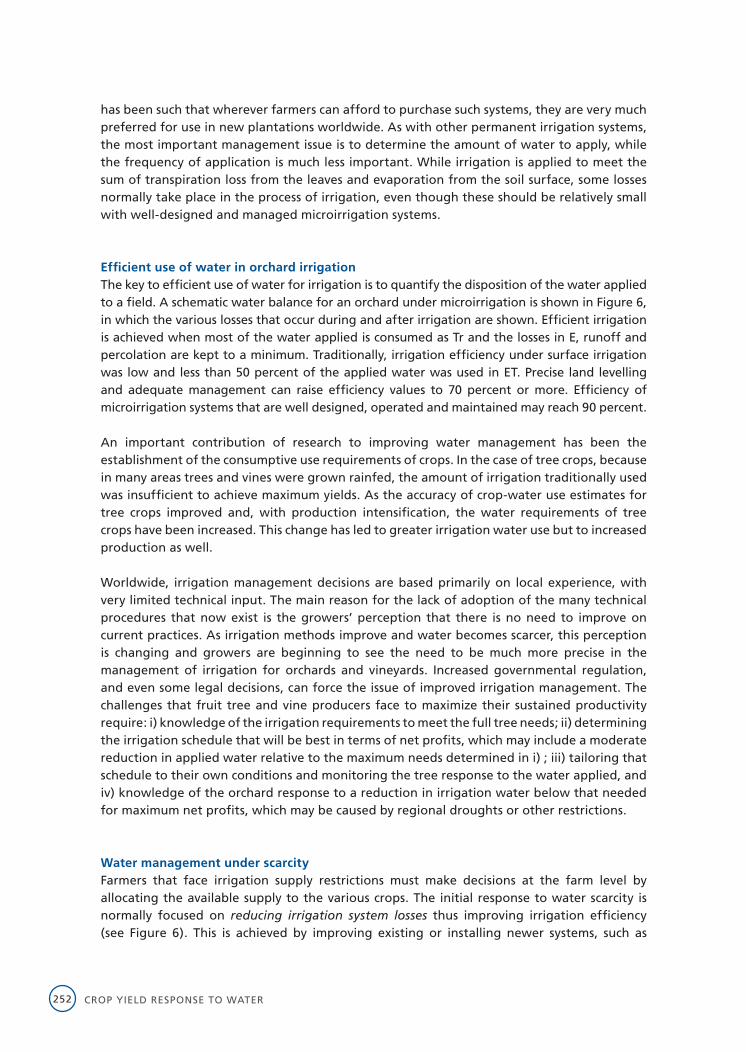
Efficient use of water in orchard irrigationThe key to efficient use of water for irrigation is to quantify the disposition of the water applied to a field. A schematic water balance for an orchard under microirrigation is shown in Figure 6, in which the various losses that occur during and after irrigation are shown. Efficient irrigation is achieved when most of the water applied is consumed as Tr and the losses in E, runoff and percolation are kept to a minimum. Traditionally, irrigation efficiency under surface irrigation was low and less than 50 percent of the applied water was used in ET. Precise land levelling and adequate management can raise efficiency values to 70 percent or more. Efficiency of microirrigation systems that are well designed, operated and maintained may reach 90 percent.
An important contribution of research to improving water management has been the establishment of the consumptive use requirements of crops. In the case of tree crops, because in many areas trees and vines were grown rainfed, the amount of irrigation traditionally used was insufficient to achieve maximum yields. As the accuracy of crop-water use estimates for tree crops improved and, with production intensification, the water requirements of tree crops have been increased. This change has led to greater irrigation water use but to increased production as well.
Worldwide, irrigation management decisions are based primarily on local experience, with very limited technical input. The main reason for the lack of adoption of the many technical procedures that now exist is the growers’ perception that there is no need to improve on current practices. As irrigation methods improve and water becomes scarcer, this perception is changing and growers are beginning to see the need to be much more precise in the management of irrigation for orchards and vineyards. Increased governmental regulation, and even some legal decisions, can force the issue of improved irrigation management. The challenges that fruit tree and vine producers face to maximize their sustained productivity require: i) knowledge of the irrigation requirements to meet the full tree needs; ii) determining the irrigation schedule that will be best in terms of net profits, which may include a moderate reduction in applied water relative to the maximum needs determined in i) ; iii) tailoring that schedule to their own conditions and monitoring the tree response to the water applied, and iv) knowledge of the orchard response to a reduction in irrigation water below that needed for maximum net profits, which may be caused by regional droughts or other restrictions.
Water management under scarcityFarmers that face irrigation supply restrictions must make decisions at the farm level by allocating the available supply to the various crops. The initial response to water scarcity is normally focused on reducing irrigation system losses thus improving irrigation efficiency (see Figure 6). This is achieved by improving existing or installing newer systems, such as
YIELD RESPONSE TO WATER OF FRUIT TREES AND VINES 253
microirrigation, that have high potential application efficiency. Also, technical irrigation scheduling procedures that match water applications close to the water-use rates, are used more often when irrigation water is scarce. However, there are practical limits to reducing water losses associated with irrigation. Once these losses are nearly eliminated, further reductions in water supply will unavoidably result in crop-water deficits. When this occurs, it is important to understand the species-specific physiological responses to water deficits.
Water deficits that reduce plant transpiration also decrease the production of biomass in all crops. If the crop is being grown for its biomass, such as alfalfa or corn silage, there will be a reduction in farmers’ income. For the main annual crops such as wheat, maize, and rice, a reduction in transpiration also decreases grain yield and gross income. However, for many tree crops and vines (and for some annual crops, such as cotton) where the fruit is the economic product, a reduction in biomass production does not always result in a parallel reduction in fruit production. Nevertheless, some quality parameters, such as fruit size or appearance, may be negatively affected.
The other distinctive feature of the response of perennial crops to water deficits is the carryover effects of water deficits that affect production in subsequent years. It is not known if the longevity of plantations may be affected by long-term water deficits; in some species, such as peach or some citrus, shorter longevity may not be too important, as new cultivars with better market opportunities are replacing older ones well ahead of full orchard maturity. In other species, however, it may have important economic consequences that must be considered.
Further, there may be cases of water deficits having beneficial effects on the production of trees and vines. It has long been known that fruit from trees grown under water deficits
FIGURE 6 The water balance of an orchard showing the disposition of irrigation water. E: Evaporation from soil; Tr: Transpiration; RO: Runoff; DP: Deep percolation, and, ±SW: Changes in water content of the root zone. Note that irrigation system losses in RO and DP may be recovered if the return flows are used elsewhere.
CROP YIELD RESPONSE TO WATER254
tasted better than those from fully irrigated trees. Much research in recent years has shown that water deficits affect many fruit quality features, and that they can also positively impact on the quality of products derived from fruit juices, such as wine. Therefore, in addition to saving water, there may be other incentives to applying and managing water stress in perennial crops in terms of improving product quality and growers’ revenues.
EVAPOTRANSPIRATION AND IRRIGATION REQUIREMENTS OF FRUIT TREES AND VINES
BackgroundWater evaporates from soils (E) and from inside plant leaves, a process that is called transpiration (Tr). The sum of evaporation from soil and plant transpiration (Box 2) from a field is termed evapotranspiration (ET; Figure 6) and is equivalent to the consumptive water use of that field. Evaporation of water requires energy that is provided by solar radiation, the primary energy source and the driving force for the ET process. The ET is the result of the interception of solar radiation by the wet soil surfaces and by the vegetation. Other meteorological factors that influence the rate of ET are temperature, humidity and wind.
Because the ET process is complex, very dynamic and is affected by local environmental conditions, researchers have developed equations to estimate ET using meteorological parameters. The FAO Penman-Monteith equation, currently accepted worldwide as the standard method, calculates the water loss from a theoretical grass surface that fully shades the ground and is never short of water, providing the reference ET (ETo). The procedures to calculate ETo from radiation, wind, humidity and temperature data are presented in the FAO I&D No. 56. The ETo is a measure of the evaporative demand of a given environment. There are many other methods to calculate ETo, some of them use temperature data only and are useful in locations where other climatic data are not available. In any case, they should not be used unless there is insufficient information to calculate ETo with the FAO Penman-Monteith equation.
The ETo provides a reference that is useful for calculating the maximum ET (ETc) from any given crop. Past research has generated information on the ratio between ET and ETo, defined as a crop coefficient, Kc. Thus, if Kc is known, the ETc is calculated as:
(1) ETc = Kc ETo
This is the standard procedure for estimating the crop consumptive use requirements as shown in FAO I&D No. 56, where a list of Kc values for each crop and developmental stage is provided. This Kc approach may also be used to obtain the ETc for the various tree crops and vines, as shown below.
The FAO I&D No. 56 publication also offers the option of differentiating E from Tr by using a dual crop coefficient approach, according to the equation:
(2) ETc = (Kcb + Ke) ETo
Where Kcb is a transpiration coefficient and Ke is an evaporation coefficient.
YIELD RESPONSE TO WATER OF FRUIT TREES AND VINES 255
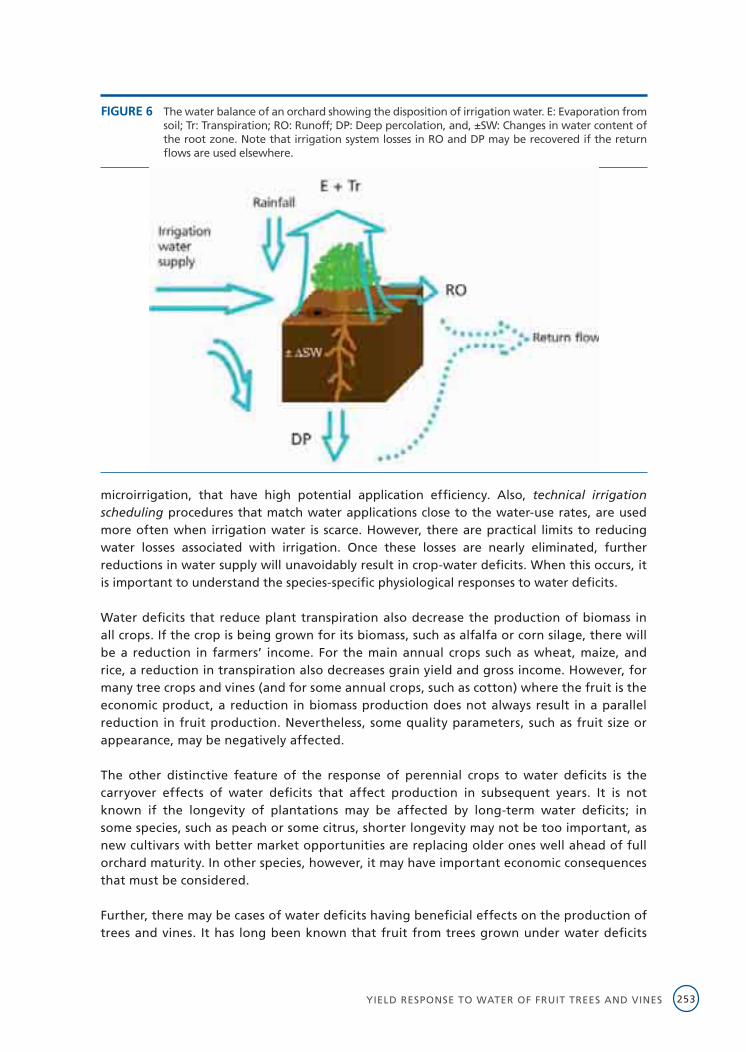
BOX 2 Understanding the transpiration process.
Water loss from plant leaves takes place primarily through pores called stomata that are opened during daylight hours and close at night. Stomata are also the path for the entrance of carbon dioxide into the leaves, the necessary input for photosynthesis. Transpiration losses from leaves trigger a sequence of events in the soil tree system; water moves from the shoots into the leaves to compensate for leaf losses, drawing water from the trunk into the shoots; this in turn, draws water from the roots to the trunk, and finally, from the soil to the roots. Thus, liquid water flows from the soil to the sites in the leaves where it evaporates before diffusing through the stomata to the atmosphere. Water moves passively through this path following a gradient in potential energy, from the soil to the leaves. In any location along this path, such energy level may be determined and is called water potential. Furthermore, the water flow encounters resistance all along the pathway from the soil to the atmosphere (see diagram). The tree exerts some control on this water flow, which is needed to match the transpirational loss to the evaporative demand of the environment. When there are imbalances between supply and demand, the tree controls its water loss through the adjustment of the degree of stomatal opening and by other means.
The water flow from soil through tree to the atmosphere.
CROP YIELD RESPONSE TO WATER256
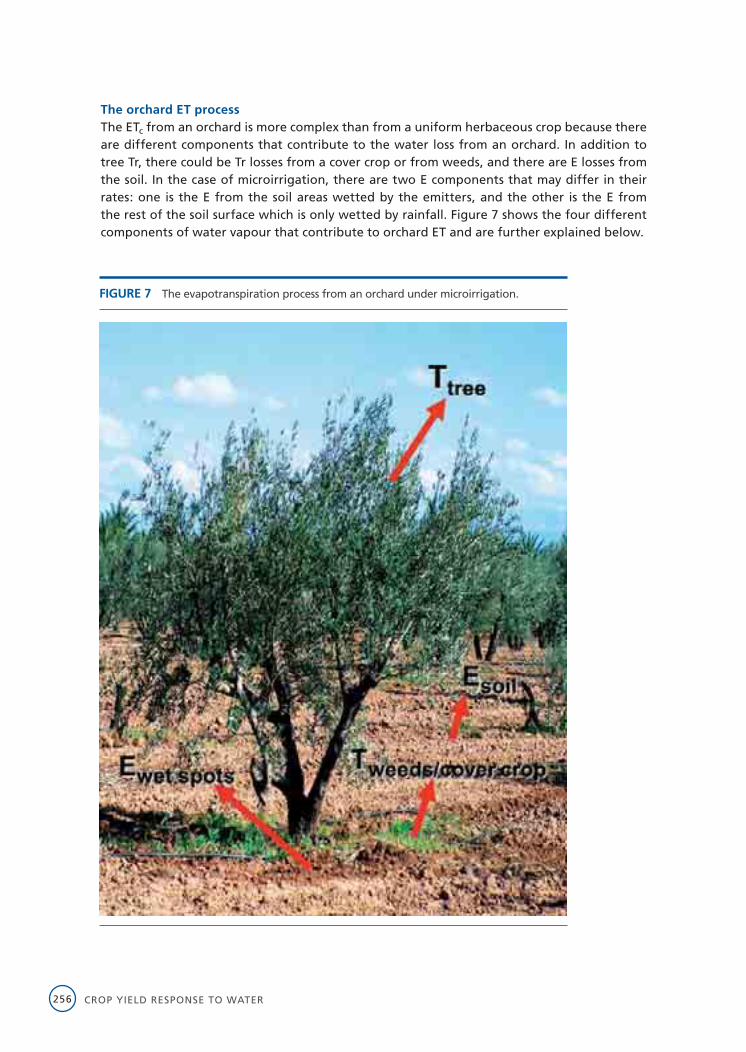
The orchard ET processThe ETc from an orchard is more complex than from a uniform herbaceous crop because there are different components that contribute to the water loss from an orchard. In addition to tree Tr, there could be Tr losses from a cover crop or from weeds, and there are E losses from the soil. In the case of microirrigation, there are two E components that may differ in their rates: one is the E from the soil areas wetted by the emitters, and the other is the E from the rest of the soil surface which is only wetted by rainfall. Figure 7 shows the four different components of water vapour that contribute to orchard ET and are further explained below.
FIGURE 7 The evapotranspiration process from an orchard under microirrigation.
YIELD RESPONSE TO WATER OF FRUIT TREES AND VINES 257
Orchard transpirationTree Tr is determined by the amount of radiation intercepted by the tree canopy and by the behaviour of stomata. The degree of stomatal aperture is influenced by the climate drivers mentioned before: radiation, temperature, humidity and wind. The stomatal behaviour of tree leaves is complex; it reflects a trade-off between maximizing the uptake of carbon dioxide and minimizing Tr loss, and is affected not only by environmental, but by internal tree factors as well. While individual leaf Tr depends on its stomatal conductance and on the environment around it, tree Tr depends on the number and behaviour of all individual leaves and on their disposition in relation to the incoming radiation. The integration of the conductance of individual leaves over the whole tree canopy, yields the canopy conductance, a useful concept to understand the Tr process. In herbaceous crops, the canopy may be considered as a ‘big leaf’; for trees and vines, while the canopies are more complex because of their three dimensional nature and the gaps between individual trees, the concept of canopy conductance is also valid to represent the behaviour of the whole tree. It is important to characterize canopy size because it determines the amount of solar radiation that is intercepted, which is directly related to Tr. Box 3 shows how to estimate some parameters that relate to canopy size.
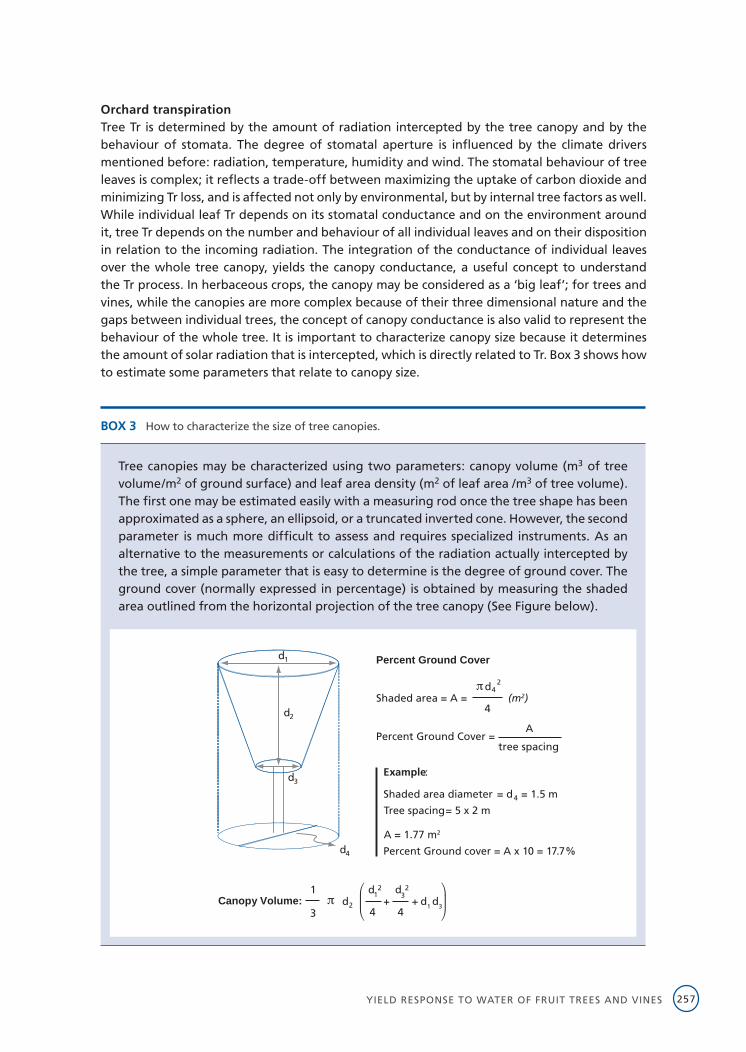
BOX 3 How to characterize the size of tree canopies.
Tree canopies may be characterized using two parameters: canopy volume (m3 of tree volume/m2 of ground surface) and leaf area density (m2 of leaf area /m3 of tree volume). The first one may be estimated easily with a measuring rod once the tree shape has been approximated as a sphere, an ellipsoid, or a truncated inverted cone. However, the second parameter is much more difficult to assess and requires specialized instruments. As an alternative to the measurements or calculations of the radiation actually intercepted by the tree, a simple parameter that is easy to determine is the degree of ground cover. The ground cover (normally expressed in percentage) is obtained by measuring the shaded area outlined from the horizontal projection of the tree canopy (See Figure below).
d4
d 2
d 1
d 3 Example :
Shaded area diameter = d 4 = 1.5 m
Tree spacing= 5 x 2 m
A = 1.77 m2
Percent Ground cover = A x 10 = 17.7%
1 12 d 3
2
Canopy Volume: d2 + + d1 d33 4 4
Percent Ground Cover
d42
Shaded area = A = (m2)4
APercent Ground Cover =
tree spacing
d
CROP YIELD RESPONSE TO WATER258
Canopy size and stomatal conductance are the two main parameters determining tree Tr. When orchards and vineyards approach maturity, they intercept much of the incoming radiation, although for most species the horizontal projection of their canopies seldom covers more than 70-75 percent of the ground. This is because their growth is often controlled by pruning to allow mechanization and to achieve a more even distribution of direct solar radiation to fruiting branches. For the same level of intercepted radiation, tree Tr differs among species depending on their growth habit (evergreen vs. deciduous), canopy size and architecture, developmental stage, and on their stomatal behaviour. Therefore, the models needed for calculating Tr in different orchards as a function of the size and conductance of the tree canopy must be specific for each tree species.
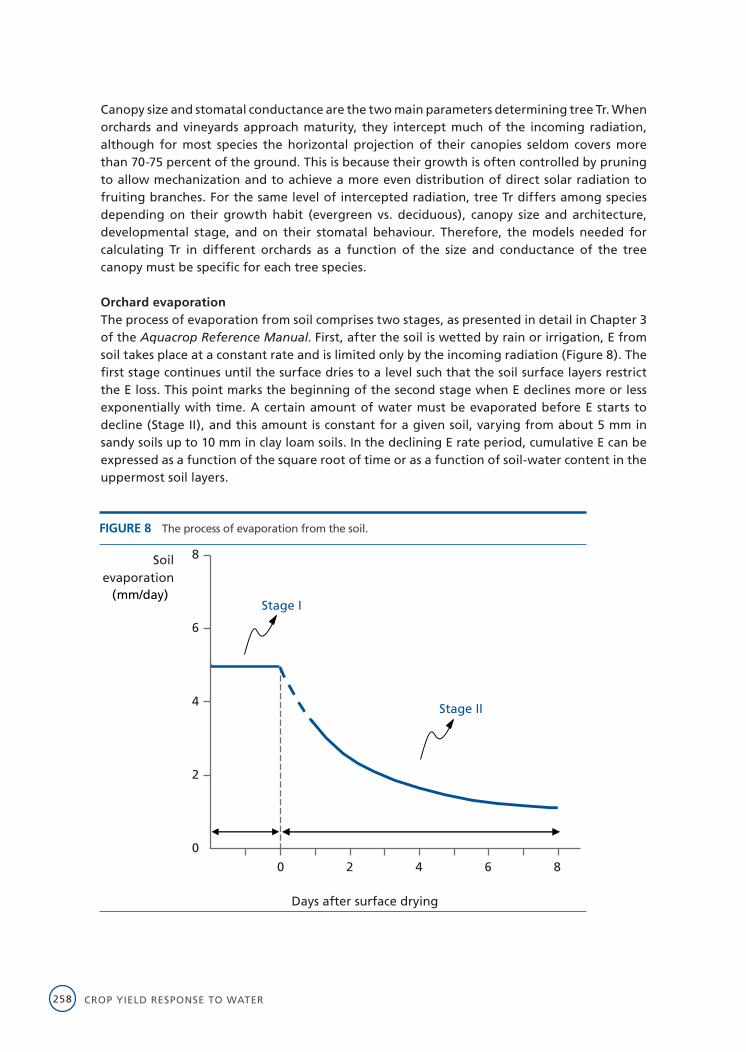
Orchard evaporationThe process of evaporation from soil comprises two stages, as presented in detail in Chapter 3 of the Aquacrop Reference Manual. First, after the soil is wetted by rain or irrigation, E from soil takes place at a constant rate and is limited only by the incoming radiation (Figure 8). The first stage continues until the surface dries to a level such that the soil surface layers restrict the E loss. This point marks the beginning of the second stage when E declines more or less exponentially with time. A certain amount of water must be evaporated before E starts to decline (Stage II), and this amount is constant for a given soil, varying from about 5 mm in sandy soils up to 10 mm in clay loam soils. In the declining E rate period, cumulative E can be expressed as a function of the square root of time or as a function of soil-water content in the uppermost soil layers.
FIGURE 8 The process of evaporation from the soil.
0
2
4
6
8
0 2 4 6 8
(mm/day)
Days after surface drying
Soilevaporation
Stage I
Stage II
YIELD RESPONSE TO WATER OF FRUIT TREES AND VINES 259
The model AquaCrop computes E for the two stages according to the equations:
EStage I=(1-CC*)KexETo
(3)EStage II=Kr(1-CC*)KexETo
Where, CC is canopy cover, (1-CC*) is the non-shaded, exposed soil from which evaporation takes place, corrected with an advection coefficient; Kex is a coefficient set at 1.1, and Kr is a reduction coefficient, which is calculated as a function of the soil-water content of the upper soil surface layers.
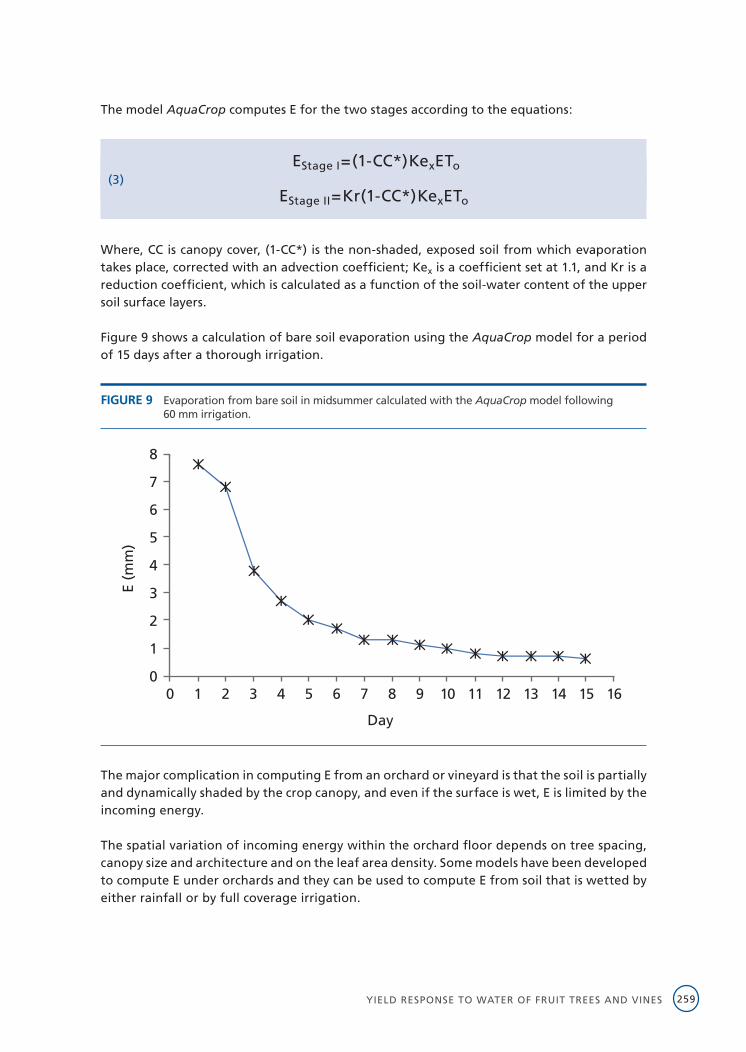
Figure 9 shows a calculation of bare soil evaporation using the AquaCrop model for a period of 15 days after a thorough irrigation.
The major complication in computing E from an orchard or vineyard is that the soil is partially and dynamically shaded by the crop canopy, and even if the surface is wet, E is limited by the incoming energy.
The spatial variation of incoming energy within the orchard floor depends on tree spacing, canopy size and architecture and on the leaf area density. Some models have been developed to compute E under orchards and they can be used to compute E from soil that is wetted by either rainfall or by full coverage irrigation.
FIGURE 9 Evaporation from bare soil in midsummer calculated with the AquaCrop model following 60 mm irrigation.
0
1
2
3
4
5
6
7
8
0 1 2 3 4 5 6 7 8 9 10 11 12 13 14 15 16
Day
E (m
m)
CROP YIELD RESPONSE TO WATER260
With microirrigation, there are spatial variations in the degree of wetting within the orchard, as some areas are frequently wetted by the emitters while the rest of the soil surface remains dry in the absence of rainfall. Because the drip lines are placed near the trees, the wet areas are generally shaded by the crop canopy, although they are wetted frequently enough to be considered to have radiation-limited E. Measurements and models suggest that the E from the soil areas in orchards, which are wetted frequently (every 1-2 days) by the emitters is equivalent to about 60 percent of the ETo from the wet areas, as a first approximation. More accurate quantification of the E from the wetted spots in a drip-irrigated orchard is available using a semi-empirical model (Bonachela, 2001).
Orchard evapotranspirationGross irrigation requirements have two components: orchard ET, which is considered the net irrigation requirement, and inefficiency losses, as discussed in the next section. In well-managed irrigation, ET is the major component of the irrigation requirements and losses are small. Orchard ET may be calculated using crop coefficients and ETo, or by estimating its individual components, namely transpiration and evaporation from soil. Crop coefficients are used when lack of data, particularly tree transpiration, precludes the application of the component approach.
A CALCULATING ETc FROM ITS COMPONENTS
Based on Figure 7, orchard or vineyard ET may be calculated as the sum of four components:
(4) ETc = Tr + Trcc + Ewz + Edz
Where: Tr is tree transpirationTrcc is cover crop (or actively growing weeds) transpirationEwz is surface evaporation from the soil wetted by the emitters, andEdz is surface evaporation from the rest of the soil surface outside the emitter wetting pattern.
This method needs to estimate the four ETc components and is not yet widely used. However, as there are now methods available to measure tree Tr independently of ETc, it will become the standard method in the future when the models used for estimation of the ETc components, such as the one presented here (Testi et al., 2006) will be thoroughly tested. (See Box 4 for sample calculations).
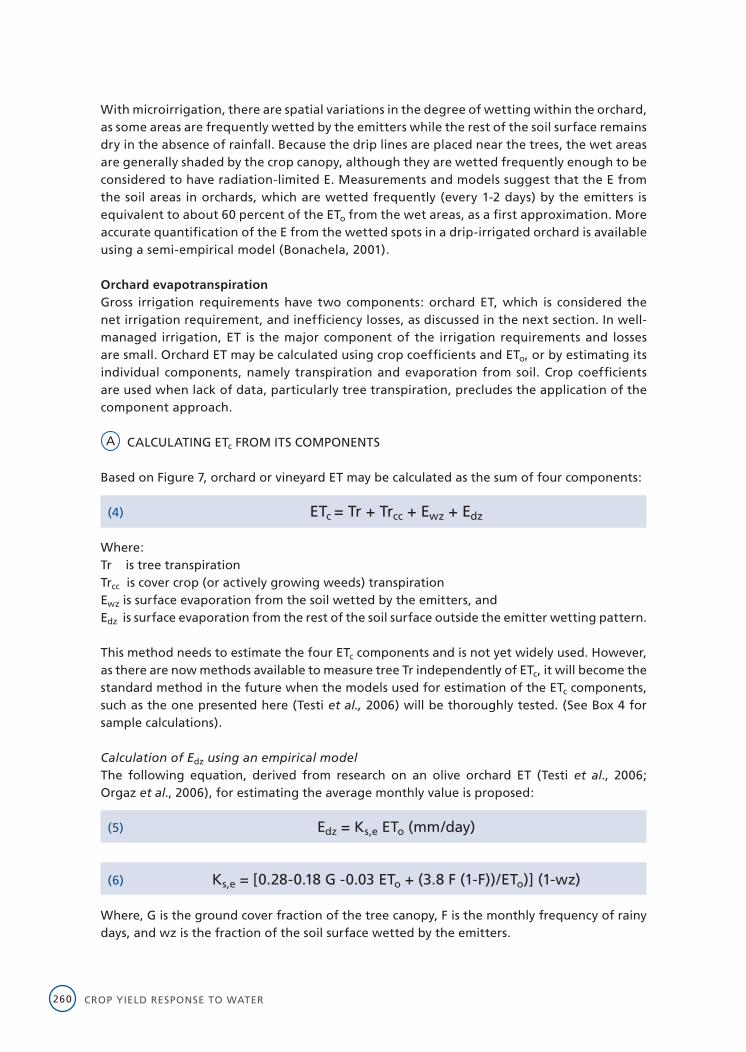
Calculation of Edz using an empirical modelThe following equation, derived from research on an olive orchard ET (Testi et al., 2006; Orgaz et al., 2006), for estimating the average monthly value is proposed:
(5) Edz = Ks,e ETo (mm/day)
(6) Ks,e = [0.28-0.18 G -0.03 ETo + (3.8 F (1-F))/ETo)] (1-wz)
Where, G is the ground cover fraction of the tree canopy, F is the monthly frequency of rainy days, and wz is the fraction of the soil surface wetted by the emitters.
YIELD RESPONSE TO WATER OF FRUIT TREES AND VINES 261
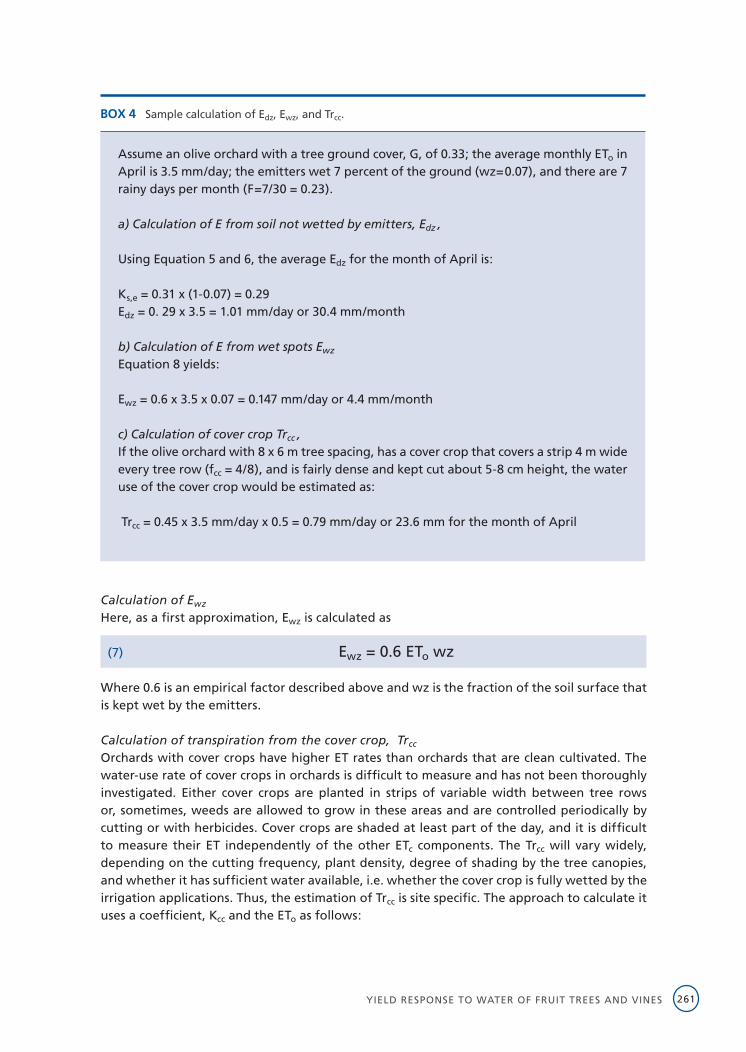
Calculation of Ewz
Here, as a first approximation, Ewz is calculated as
(7) Ewz = 0.6 ETo wz
Where 0.6 is an empirical factor described above and wz is the fraction of the soil surface that is kept wet by the emitters.
Calculation of transpiration from the cover crop, Trcc
Orchards with cover crops have higher ET rates than orchards that are clean cultivated. The water-use rate of cover crops in orchards is difficult to measure and has not been thoroughly investigated. Either cover crops are planted in strips of variable width between tree rows or, sometimes, weeds are allowed to grow in these areas and are controlled periodically by cutting or with herbicides. Cover crops are shaded at least part of the day, and it is difficult to measure their ET independently of the other ETc components. The Trcc will vary widely, depending on the cutting frequency, plant density, degree of shading by the tree canopies, and whether it has sufficient water available, i.e. whether the cover crop is fully wetted by the irrigation applications. Thus, the estimation of Trcc is site specific. The approach to calculate it uses a coefficient, Kcc and the ETo as follows:
BOX 4 Sample calculation of Edz, Ewz, and Trcc.
Assume an olive orchard with a tree ground cover, G, of 0.33; the average monthly ETo in April is 3.5 mm/day; the emitters wet 7 percent of the ground (wz=0.07), and there are 7 rainy days per month (F=7/30 = 0.23).
a) Calculation of E from soil not wetted by emitters, Edz ,
Using Equation 5 and 6, the average Edz for the month of April is:
Ks,e = 0.31 x (1-0.07) = 0.29Edz = 0. 29 x 3.5 = 1.01 mm/day or 30.4 mm/month
b) Calculation of E from wet spots Ewz Equation 8 yields:
Ewz = 0.6 x 3.5 x 0.07 = 0.147 mm/day or 4.4 mm/month c) Calculation of cover crop Trcc ,If the olive orchard with 8 x 6 m tree spacing, has a cover crop that covers a strip 4 m wide every tree row (fcc = 4/8), and is fairly dense and kept cut about 5-8 cm height, the water use of the cover crop would be estimated as:
Trcc = 0.45 x 3.5 mm/day x 0.5 = 0.79 mm/day or 23.6 mm for the month of April
CROP YIELD RESPONSE TO WATER262
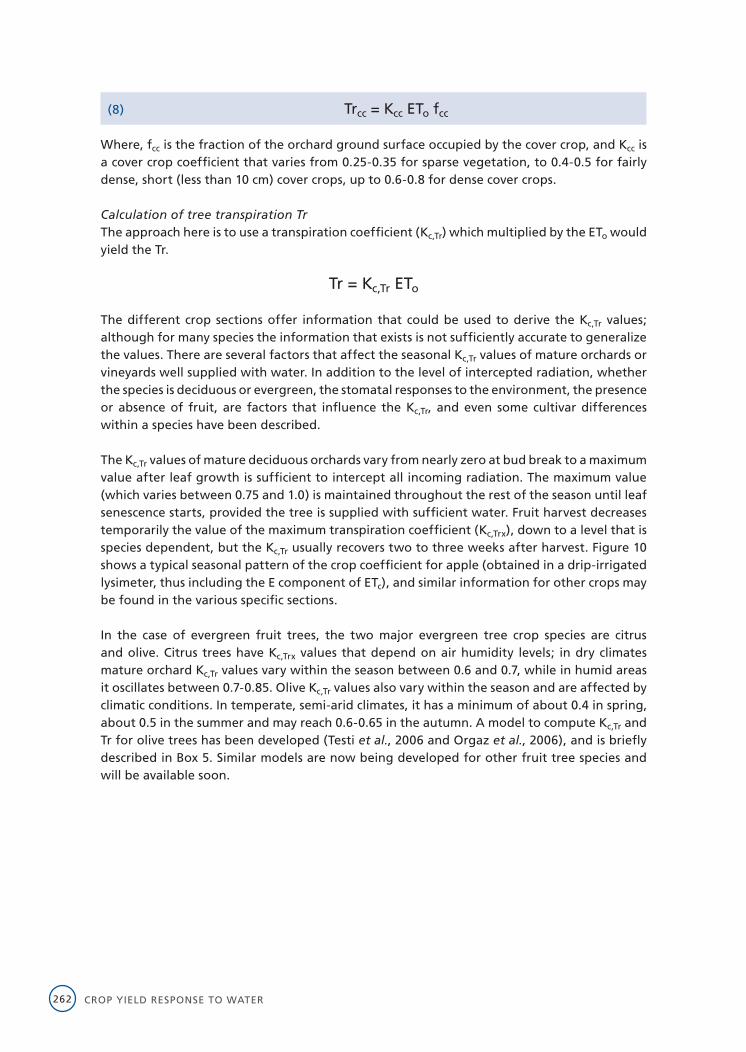
(8) Trcc = Kcc ETo fcc
Where, fcc is the fraction of the orchard ground surface occupied by the cover crop, and Kcc is a cover crop coefficient that varies from 0.25-0.35 for sparse vegetation, to 0.4-0.5 for fairly dense, short (less than 10 cm) cover crops, up to 0.6-0.8 for dense cover crops.
Calculation of tree transpiration TrThe approach here is to use a transpiration coefficient (Kc,Tr) which multiplied by the ETo would yield the Tr.
Tr = Kc,Tr ETo
The different crop sections offer information that could be used to derive the Kc,Tr values; although for many species the information that exists is not sufficiently accurate to generalize the values. There are several factors that affect the seasonal Kc,Tr values of mature orchards or vineyards well supplied with water. In addition to the level of intercepted radiation, whether the species is deciduous or evergreen, the stomatal responses to the environment, the presence or absence of fruit, are factors that influence the Kc,Tr, and even some cultivar differences within a species have been described.
The Kc,Tr values of mature deciduous orchards vary from nearly zero at bud break to a maximum value after leaf growth is sufficient to intercept all incoming radiation. The maximum value (which varies between 0.75 and 1.0) is maintained throughout the rest of the season until leaf senescence starts, provided the tree is supplied with sufficient water. Fruit harvest decreases temporarily the value of the maximum transpiration coefficient (Kc,Trx), down to a level that is species dependent, but the Kc,Tr usually recovers two to three weeks after harvest. Figure 10 shows a typical seasonal pattern of the crop coefficient for apple (obtained in a drip-irrigated lysimeter, thus including the E component of ETc), and similar information for other crops may be found in the various specific sections.
In the case of evergreen fruit trees, the two major evergreen tree crop species are citrus and olive. Citrus trees have Kc,Trx values that depend on air humidity levels; in dry climates mature orchard Kc,Tr values vary within the season between 0.6 and 0.7, while in humid areas it oscillates between 0.7-0.85. Olive Kc,Tr values also vary within the season and are affected by climatic conditions. In temperate, semi-arid climates, it has a minimum of about 0.4 in spring, about 0.5 in the summer and may reach 0.6-0.65 in the autumn. A model to compute Kc,Tr and Tr for olive trees has been developed (Testi et al., 2006 and Orgaz et al., 2006), and is briefly described in Box 5. Similar models are now being developed for other fruit tree species and will be available soon.
YIELD RESPONSE TO WATER OF FRUIT TREES AND VINES 263
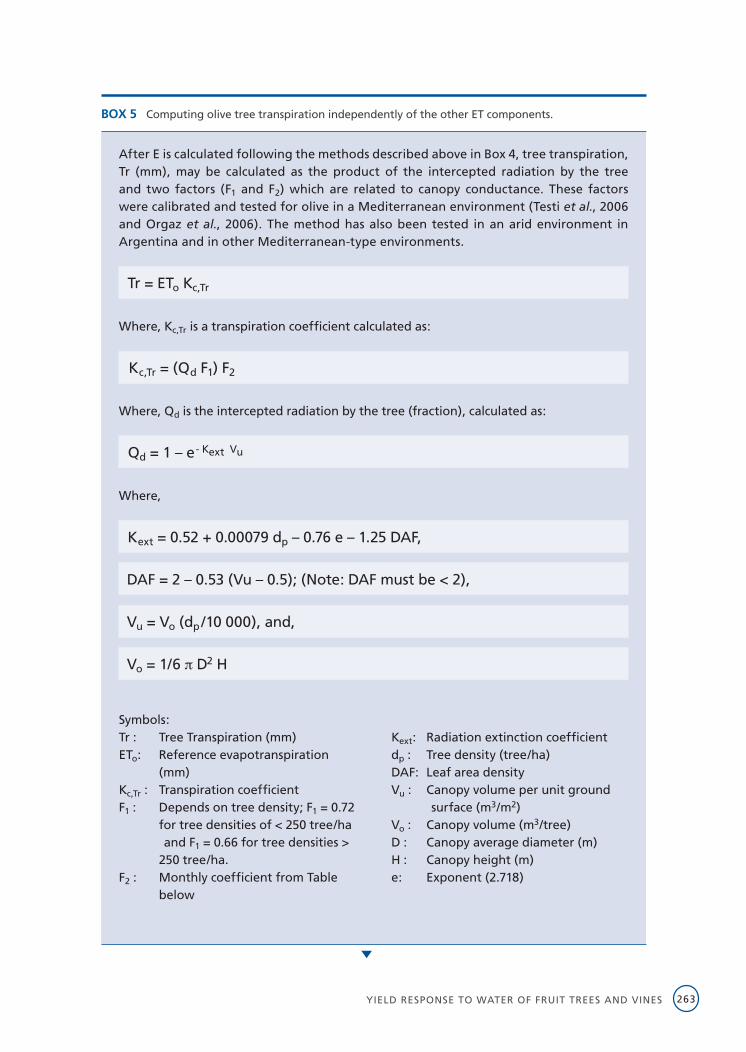
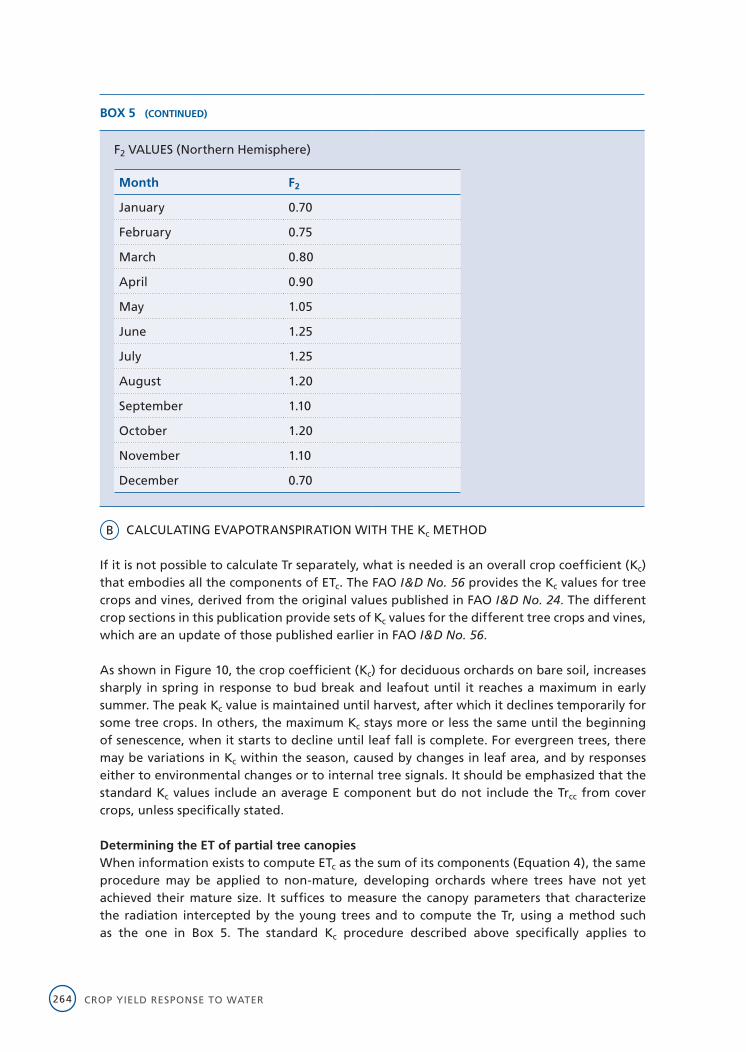
BOX 5 Computing olive tree transpiration independently of the other ET components.
After E is calculated following the methods described above in Box 4, tree transpiration, Tr (mm), may be calculated as the product of the intercepted radiation by the tree and two factors (F1 and F2) which are related to canopy conductance. These factors were calibrated and tested for olive in a Mediterranean environment (Testi et al., 2006 and Orgaz et al., 2006). The method has also been tested in an arid environment in Argentina and in other Mediterranean-type environments.
Tr = ETo Kc,Tr
Where, Kc,Tr is a transpiration coefficient calculated as:
Kc,Tr = (Qd F1) F2
Where, Qd is the intercepted radiation by the tree (fraction), calculated as:
Qd = 1 – e- Kext Vu
Where,
Kext = 0.52 + 0.00079 dp – 0.76 e – 1.25 DAF,
DAF = 2 – 0.53 (Vu – 0.5); (Note: DAF must be < 2),
Vu = Vo (dp /10 000), and,
Vo = 1/6 D2 H
Symbols:Tr : Tree Transpiration (mm)ETo: Reference evapotranspiration
(mm)Kc,Tr : Transpiration coefficientF1 : Depends on tree density; F1 = 0.72
for tree densities of < 250 tree/ha and F1 = 0.66 for tree densities > 250 tree/ha.
F2 : Monthly coefficient from Table below
Kext: Radiation extinction coefficient dp : Tree density (tree/ha)DAF: Leaf area density Vu : Canopy volume per unit ground
surface (m3/m2)Vo : Canopy volume (m3/tree)D : Canopy average diameter (m)H : Canopy height (m)e: Exponent (2.718)
CROP YIELD RESPONSE TO WATER264
BOX 5 (CONTINUED)
F2 VALUES (Northern Hemisphere)
Month F2
January 0.70
February 0.75
March 0.80
April 0.90
May 1.05
June 1.25
July 1.25
August 1.20
September 1.10
October 1.20
November 1.10
December 0.70
B CALCULATING EVAPOTRANSPIRATION WITH THE Kc METHOD
If it is not possible to calculate Tr separately, what is needed is an overall crop coefficient (Kc) that embodies all the components of ETc. The FAO I&D No. 56 provides the Kc values for tree crops and vines, derived from the original values published in FAO I&D No. 24. The different crop sections in this publication provide sets of Kc values for the different tree crops and vines, which are an update of those published earlier in FAO I&D No. 56.
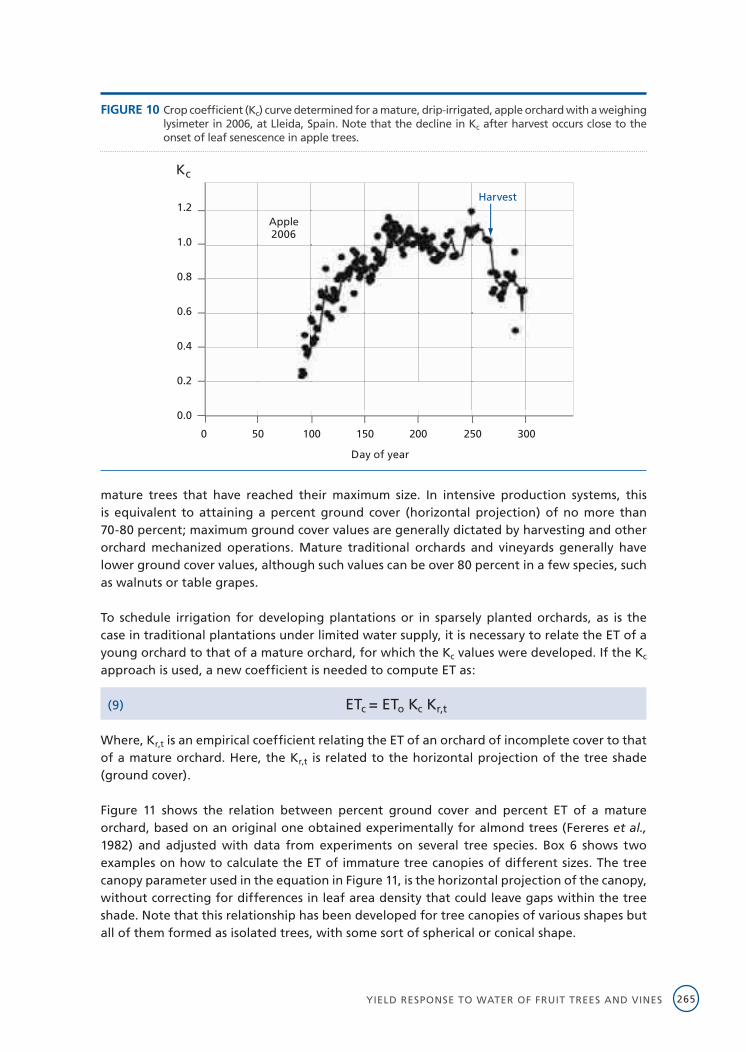
As shown in Figure 10, the crop coefficient (Kc) for deciduous orchards on bare soil, increases sharply in spring in response to bud break and leafout until it reaches a maximum in early summer. The peak Kc value is maintained until harvest, after which it declines temporarily for some tree crops. In others, the maximum Kc stays more or less the same until the beginning of senescence, when it starts to decline until leaf fall is complete. For evergreen trees, there may be variations in Kc within the season, caused by changes in leaf area, and by responses either to environmental changes or to internal tree signals. It should be emphasized that the standard Kc values include an average E component but do not include the Trcc from cover crops, unless specifically stated.
Determining the ET of partial tree canopiesWhen information exists to compute ETc as the sum of its components (Equation 4), the same procedure may be applied to non-mature, developing orchards where trees have not yet achieved their mature size. It suffices to measure the canopy parameters that characterize the radiation intercepted by the young trees and to compute the Tr, using a method such as the one in Box 5. The standard Kc procedure described above specifically applies to
YIELD RESPONSE TO WATER OF FRUIT TREES AND VINES 265
mature trees that have reached their maximum size. In intensive production systems, this is equivalent to attaining a percent ground cover (horizontal projection) of no more than 70-80 percent; maximum ground cover values are generally dictated by harvesting and other orchard mechanized operations. Mature traditional orchards and vineyards generally have lower ground cover values, although such values can be over 80 percent in a few species, such as walnuts or table grapes.
To schedule irrigation for developing plantations or in sparsely planted orchards, as is the case in traditional plantations under limited water supply, it is necessary to relate the ET of a young orchard to that of a mature orchard, for which the Kc values were developed. If the Kc approach is used, a new coefficient is needed to compute ET as:
(9) ETc = ETo Kc Kr,t
Where, Kr,t is an empirical coefficient relating the ET of an orchard of incomplete cover to that of a mature orchard. Here, the Kr,t is related to the horizontal projection of the tree shade (ground cover).
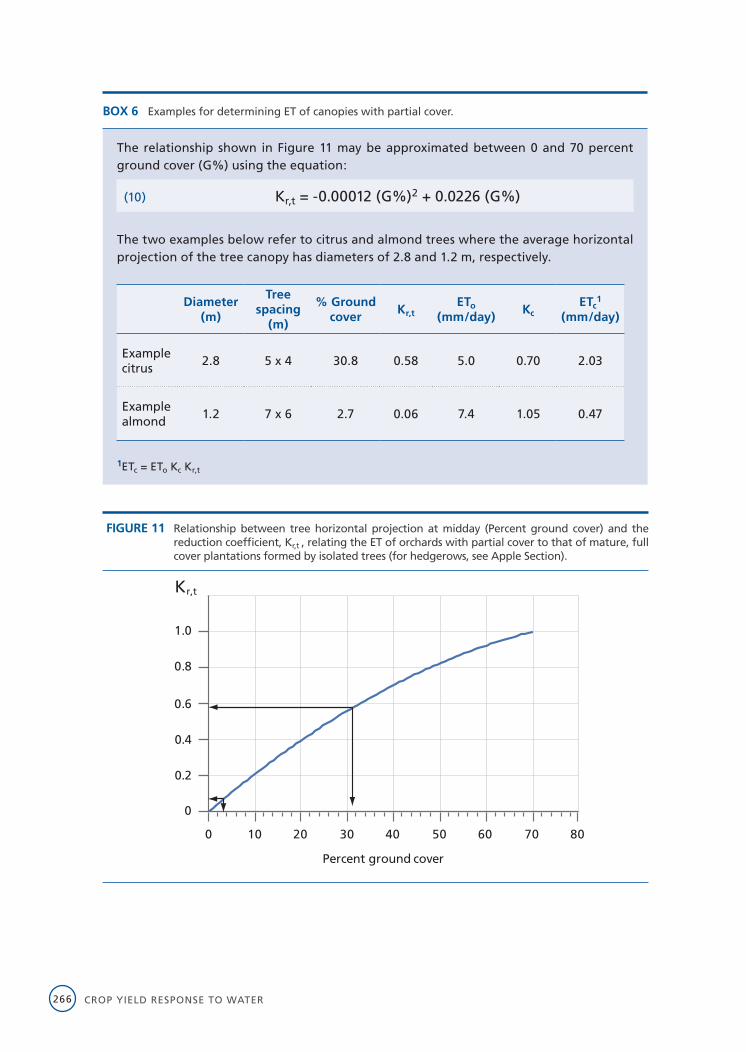
Figure 11 shows the relation between percent ground cover and percent ET of a mature orchard, based on an original one obtained experimentally for almond trees (Fereres et al., 1982) and adjusted with data from experiments on several tree species. Box 6 shows two examples on how to calculate the ET of immature tree canopies of different sizes. The tree canopy parameter used in the equation in Figure 11, is the horizontal projection of the canopy, without correcting for differences in leaf area density that could leave gaps within the tree shade. Note that this relationship has been developed for tree canopies of various shapes but all of them formed as isolated trees, with some sort of spherical or conical shape.
FIGURE 10 Crop coefficient (Kc) curve determined for a mature, drip-irrigated, apple orchard with a weighing lysimeter in 2006, at Lleida, Spain. Note that the decline in Kc after harvest occurs close to the onset of leaf senescence in apple trees.
Apple2006
Harvest
0 50 100 150 200 250 300
1.2
1.0
0.8
0.6
0.4
0.2
0.0
Day of year
Kc
CROP YIELD RESPONSE TO WATER266
BOX 6 Examples for determining ET of canopies with partial cover.
The relationship shown in Figure 11 may be approximated between 0 and 70 percent ground cover (G%) using the equation:
(10) Kr,t = -0.00012 (G%)2 + 0.0226 (G%)
The two examples below refer to citrus and almond trees where the average horizontal projection of the tree canopy has diameters of 2.8 and 1.2 m, respectively.
Diameter(m)
Tree spacing
(m)
% Groundcover
Kr,tETo
(mm/day)Kc
ETc1
(mm/day)
Example citrus
2.8 5 x 4 30.8 0.58 5.0 0.70 2.03
Example almond
1.2 7 x 6 2.7 0.06 7.4 1.05 0.47
1ETc = ETo Kc Kr,t
FIGURE 11 Relationship between tree horizontal projection at midday (Percent ground cover) and the reduction coefficient, Kr,t , relating the ET of orchards with partial cover to that of mature, full cover plantations formed by isolated trees (for hedgerows, see Apple Section).
Kr,t
0
0.8
1.0
0.6
0.4
0.2
Percent ground cover
0 10 20 30 40 50 60 70 80
YIELD RESPONSE TO WATER OF FRUIT TREES AND VINES 267
For training systems on a vertical plane, such as many trellis systems used for winegrapes, pears and apples, a different relation from that of Figure 11 between percent ground cover or intercepted radiation at noon and percent of ET would apply. This is because, as these canopies expand, they grow vertically with little increase in percent ground cover or noon intercepted radiation but their Tr increases nevertheless. This is because of the vertical growth (wall) intercepting more radiation in the morning and afternoon and also to more advective energy transfer to the trellis rows. The apple and pear Sections describe specific relations between intercepted radiation and percent mature ET for such crops, which should be used for hedgerows and other types of canopies.
Another aspect specific to young plantations is that their canopies grow and expand as time advances until close to leaf fall. Therefore, the seasonal evolution of Kc is different in young orchards than in mature orchards. Thus, estimates of ground cover should be updated on a monthly or bimonthly basis in young orchards/vineyards to adjust the estimation of ET and the resulting irrigation rates.
Variations in the E and Tr of orchards and vineyardsSite specificity affects the ETc of orchards and vineyards more than that of herbaceous crops. In perennial crops, tree or vine canopy size and leaf area density determine the Tr rate, while rainfall and irrigation frequency determine the E rate. In arboriculture, canopy size may be manipulated by pruning, and hence Tr can vary depending on pruning practices. In intensive production systems, however, pruning is kept to a minimum and Tr is not subjected to wide year-to-year variations, other than those caused by changes in evaporative demand or by internal tree controls, often related to crop load.
The E losses from an orchard or vineyard are somewhat easier to manipulate. Evaporation from soil is minimized when irrigation applications are as infrequent as possible (without causing tree-water deficits). If trees have small canopies and a significant fraction of the soil is exposed to direct solar radiation, E can be an important ET component, in particular if the irrigation method wets a significant portion of the soil surface. In these cases, irrigation frequency should be managed to minimize E loss. Under microirrigation, E losses are comparatively much less, because the wetted areas of soil are smaller and normally located under the canopy shade. Nevertheless, high (daily) irrigation frequency is common for drip systems, and the areas wetted by the emitters always stay wet. If the number of emitters per tree is high and the wetted areas are exposed, significant E losses may occur from these spots. In situations where water is in short supply, microirrigation frequency should be decreased to the longest interval compatible with having an optimal soil water regime, such as a week or even more in extreme cases of very low supply. In these cases, subsurface drip systems that eliminate E from irrigation applications should be considered.
Since Tr and E, do not occur independently, it is important to understand their interactions that are related to the energy balance of the orchard. Adjective energy transfer from the hot, dry soil surfaces in the rows towards the trees will increase Tr. On the other hand, Tr will decrease when E is high following an irrigation or rain. These interactions have not been fully documented, and thus, cannot be included in current procedures for calculating orchard or vineyard ET. However, they need to be considered at least qualitatively.
CROP YIELD RESPONSE TO WATER268
Determining irrigation requirementsThere are a number of losses from irrigated agriculture, often unavoidable, associated with the application of irrigation water that the grower must consider when determining the actual water requirements of an orchard or vineyard. It should be noted that in this context, the term ‘losses’ does not apply to E and Tr, which are consumptive uses of water rather than losses.
Until now, when determining the ETc, a situation has been considered in which the calculation applies to an ideal, uniform orchard with all the trees having the same ETc. However, the uniformity of irrigation water application over a field is not perfect and some areas get more water than others. To adequately irrigate areas that get less, the system must apply more water than required to meet the overall needs of the field. Thus, some areas of the field will receive water in excess of ET and this can result in the deep percolation (loss) of water below the root zone. Additionally, some irrigation water may inadvertently run off the field and this is also considered a loss, at least for that particular field.
Whether deep percolation and runoff are true losses depend on the scale under consideration (field, farm, district, basin), and whether any or all of these losses can be recovered. For example, if runoff from one field is collected and then applied to the same or an adjacent field, it is not a true loss. The same applies to deep percolation that enters a groundwater table and is eventually pumped and reused, although its quality may be degraded. If water enters a saline sink, such as a perched saline water table or the ultimate saline sink, the ocean, it is a true loss.
To maintain a favourable salt balance, some deep percolation of water is needed to transport the salt introduced by the irrigation water out of the root zone. The amount of deep percolation required is referred to as the ‘leaching fraction’ and depends on irrigation water quality as well as the crop sensitivity to salinity. Methods have been established to estimate appropriate leaching fractions and can be obtained in FAO I&D No. 29. Leaching of excess salts is a requisite for the sustainabiliy of irrigated agriculture.
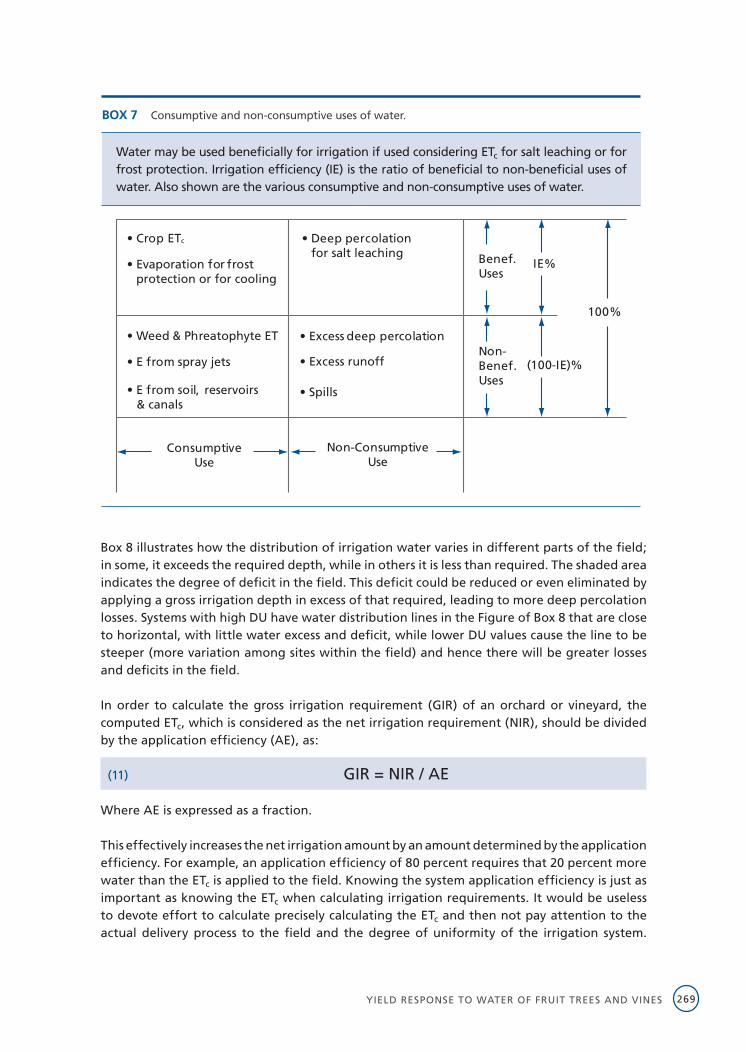
Application efficiency is used to express irrigation efficacy and is described as the percentage of applied water that is available for tree use. Variations depend on the irrigation system and skill of the irrigator and on whether an individual field, series of fields, entire farm or region is considered. The chart in Box 7 indicates the disposition of irrigation water into consumptive and non-consumptive uses, and into beneficial and non-beneficial uses. It is important for the grower to understand that some irrigation losses are unavoidable, but that they should be minimized.
For the grower, it is important to have high application efficiency and as good distribution uniformity of applied water as possible. Distribution uniformity (DU) for surface and sprinkler irrigation methods applied to systems operating with trees and vines can be determined using farm-system evaluation techniques. With microirrigation systems, it is relatively easy to measure DU by checking either emitter flow rates or operating pressures throughout the system. In orchards or vineyards under microirrigation, it is possible to attain DU values of 80 to 90 percent and thus, equally high application efficiencies if the systems are well designed, maintained and managed.
YIELD RESPONSE TO WATER OF FRUIT TREES AND VINES 269
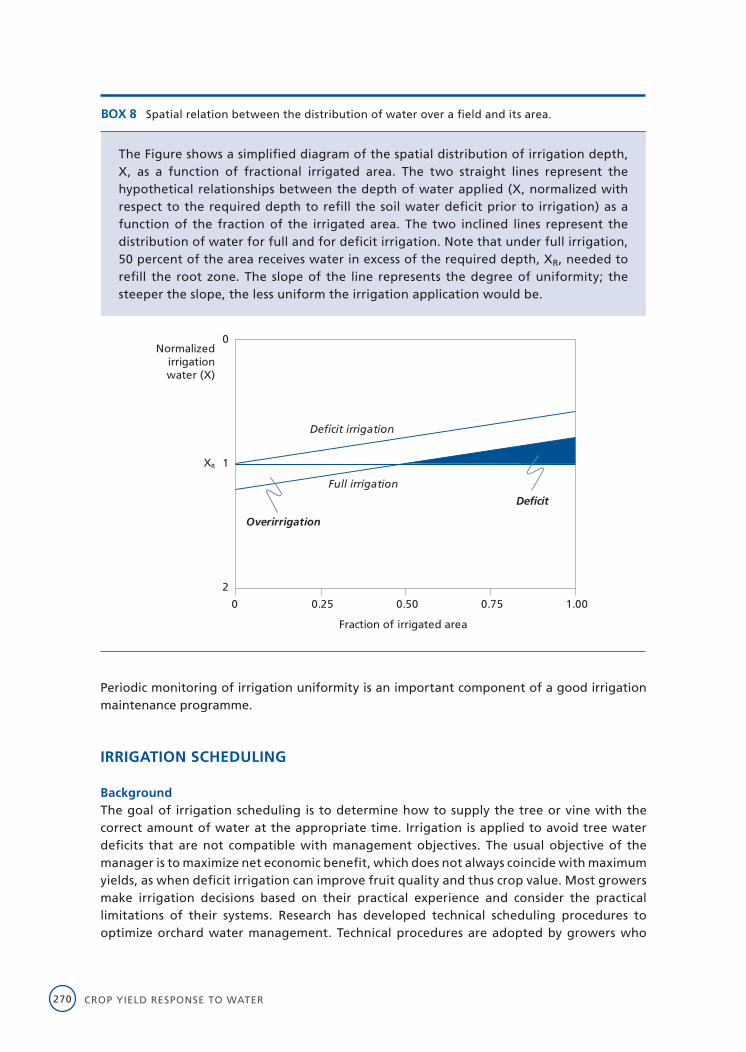
Box 8 illustrates how the distribution of irrigation water varies in different parts of the field; in some, it exceeds the required depth, while in others it is less than required. The shaded area indicates the degree of deficit in the field. This deficit could be reduced or even eliminated by applying a gross irrigation depth in excess of that required, leading to more deep percolation losses. Systems with high DU have water distribution lines in the Figure of Box 8 that are close to horizontal, with little water excess and deficit, while lower DU values cause the line to be steeper (more variation among sites within the field) and hence there will be greater losses and deficits in the field.
In order to calculate the gross irrigation requirement (GIR) of an orchard or vineyard, the computed ETc, which is considered as the net irrigation requirement (NIR), should be divided by the application efficiency (AE), as:
(11) GIR = NIR / AE
Where AE is expressed as a fraction.
This effectively increases the net irrigation amount by an amount determined by the application efficiency. For example, an application efficiency of 80 percent requires that 20 percent more water than the ETc is applied to the field. Knowing the system application efficiency is just as important as knowing the ETc when calculating irrigation requirements. It would be useless to devote effort to calculate precisely calculating the ETc and then not pay attention to the actual delivery process to the field and the degree of uniformity of the irrigation system.
BOX 7 Consumptive and non-consumptive uses of water.
Water may be used beneficially for irrigation if used considering ETc for salt leaching or for frost protection. Irrigation efficiency (IE) is the ratio of beneficial to non-beneficial uses of water. Also shown are the various consumptive and non-consumptive uses of water.
Benef.Uses
IE%
Non-Benef.Uses
(100-IE)%
100%
Excess deep percolation
Excess runoff
Spills
Weed & Phreatophyte ET
E from spray jets
E from soil, reservoirs & canals
Crop ETc
Evaporation for frostprotection or for cooling
Non-ConsumptiveUse
ConsumptiveUse
Deep percolation for salt leaching
CROP YIELD RESPONSE TO WATER270
Periodic monitoring of irrigation uniformity is an important component of a good irrigation maintenance programme.
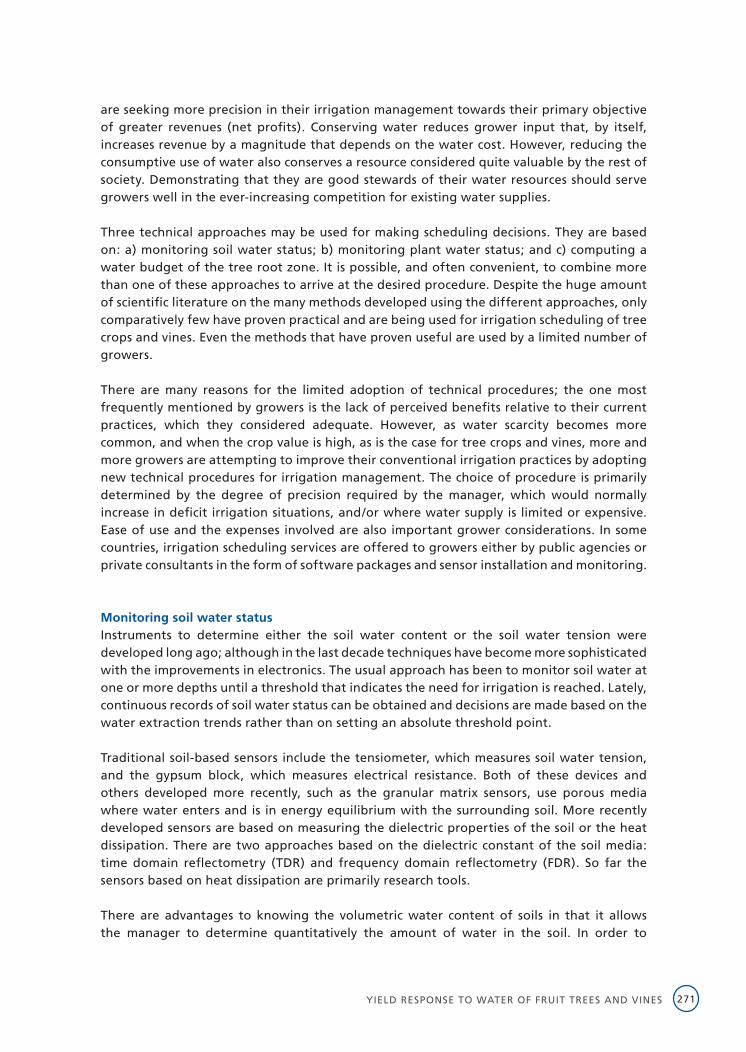
IRRIGATION SCHEDULING
BackgroundThe goal of irrigation scheduling is to determine how to supply the tree or vine with the correct amount of water at the appropriate time. Irrigation is applied to avoid tree water deficits that are not compatible with management objectives. The usual objective of the manager is to maximize net economic benefit, which does not always coincide with maximum yields, as when deficit irrigation can improve fruit quality and thus crop value. Most growers make irrigation decisions based on their practical experience and consider the practical limitations of their systems. Research has developed technical scheduling procedures to optimize orchard water management. Technical procedures are adopted by growers who
BOX 8 Spatial relation between the distribution of water over a field and its area.
The Figure shows a simplified diagram of the spatial distribution of irrigation depth, X, as a function of fractional irrigated area. The two straight lines represent the hypothetical relationships between the depth of water applied (X, normalized with respect to the required depth to refill the soil water deficit prior to irrigation) as a function of the fraction of the irrigated area. The two inclined lines represent the distribution of water for full and for deficit irrigation. Note that under full irrigation, 50 percent of the area receives water in excess of the required depth, XR, needed to refill the root zone. The slope of the line represents the degree of uniformity; the steeper the slope, the less uniform the irrigation application would be.
0.25 0.50 1.000.750
0
1
2
Normalizedirrigationwater (X)
XR
Deficit
Deficit irrigation
Full irrigation
Overirrigation
Fraction of irrigated area
YIELD RESPONSE TO WATER OF FRUIT TREES AND VINES 271
are seeking more precision in their irrigation management towards their primary objective of greater revenues (net profits). Conserving water reduces grower input that, by itself, increases revenue by a magnitude that depends on the water cost. However, reducing the consumptive use of water also conserves a resource considered quite valuable by the rest of society. Demonstrating that they are good stewards of their water resources should serve growers well in the ever-increasing competition for existing water supplies.
Three technical approaches may be used for making scheduling decisions. They are based on: a) monitoring soil water status; b) monitoring plant water status; and c) computing a water budget of the tree root zone. It is possible, and often convenient, to combine more than one of these approaches to arrive at the desired procedure. Despite the huge amount of scientific literature on the many methods developed using the different approaches, only comparatively few have proven practical and are being used for irrigation scheduling of tree crops and vines. Even the methods that have proven useful are used by a limited number of growers.
There are many reasons for the limited adoption of technical procedures; the one most frequently mentioned by growers is the lack of perceived benefits relative to their current practices, which they considered adequate. However, as water scarcity becomes more common, and when the crop value is high, as is the case for tree crops and vines, more and more growers are attempting to improve their conventional irrigation practices by adopting new technical procedures for irrigation management. The choice of procedure is primarily determined by the degree of precision required by the manager, which would normally increase in deficit irrigation situations, and/or where water supply is limited or expensive. Ease of use and the expenses involved are also important grower considerations. In some countries, irrigation scheduling services are offered to growers either by public agencies or private consultants in the form of software packages and sensor installation and monitoring.
Monitoring soil water status Instruments to determine either the soil water content or the soil water tension were developed long ago; although in the last decade techniques have become more sophisticated with the improvements in electronics. The usual approach has been to monitor soil water at one or more depths until a threshold that indicates the need for irrigation is reached. Lately, continuous records of soil water status can be obtained and decisions are made based on the water extraction trends rather than on setting an absolute threshold point.
Traditional soil-based sensors include the tensiometer, which measures soil water tension, and the gypsum block, which measures electrical resistance. Both of these devices and others developed more recently, such as the granular matrix sensors, use porous media where water enters and is in energy equilibrium with the surrounding soil. More recently developed sensors are based on measuring the dielectric properties of the soil or the heat dissipation. There are two approaches based on the dielectric constant of the soil media: time domain reflectometry (TDR) and frequency domain reflectometry (FDR). So far the sensors based on heat dissipation are primarily research tools.
There are advantages to knowing the volumetric water content of soils in that it allows the manager to determine quantitatively the amount of water in the soil. In order to
CROP YIELD RESPONSE TO WATER272
accurately determine volumetric soil water content, all the previously-mentioned sensors must be calibrated for a particular soil, with the exception of TDR. Soil water content may be measured gravimetrically or with the neutron probe. A recent study comparing the neutron probe, against many other devices developed more recently, revealed that there is no suitable replacement technology for the neutron probe for measuring volumetric soil water content. The main advantage of the new sensors is that they provide continuous soil water records that can be useful for adjusting the irrigation schedule and they lend themselves to automated irrigation control. One limitation of many of the newer sensors is the very small soil volume that they explore, leading to large variability among replications.
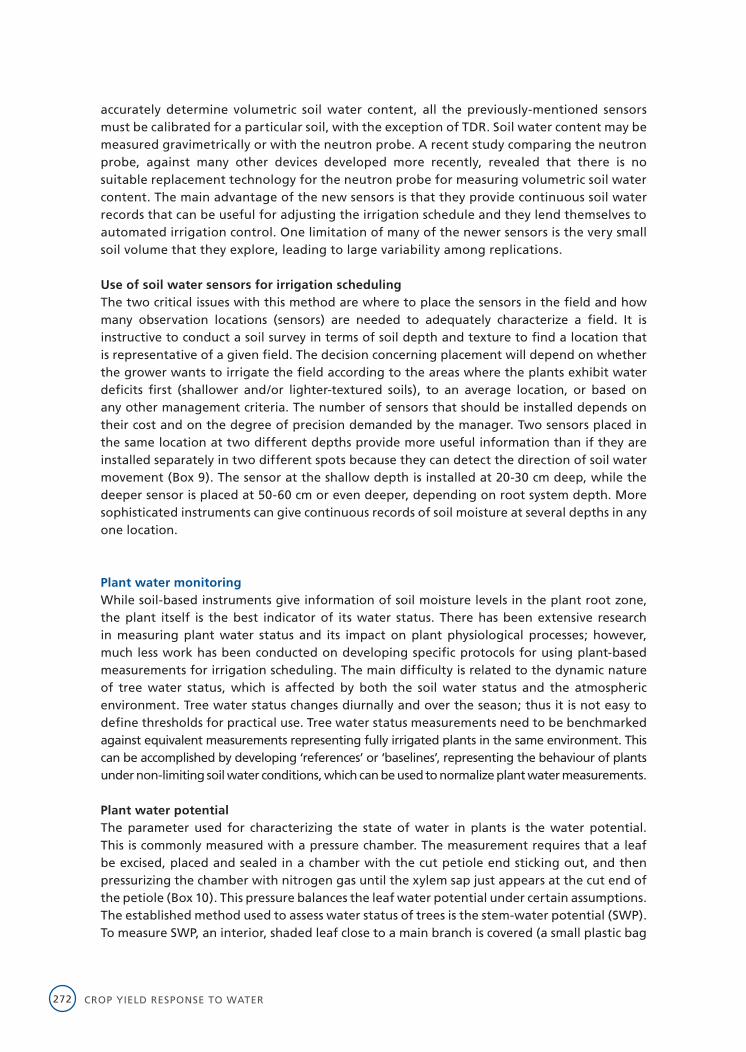
Use of soil water sensors for irrigation scheduling The two critical issues with this method are where to place the sensors in the field and how many observation locations (sensors) are needed to adequately characterize a field. It is instructive to conduct a soil survey in terms of soil depth and texture to find a location that is representative of a given field. The decision concerning placement will depend on whether the grower wants to irrigate the field according to the areas where the plants exhibit water deficits first (shallower and/or lighter-textured soils), to an average location, or based on any other management criteria. The number of sensors that should be installed depends on their cost and on the degree of precision demanded by the manager. Two sensors placed in the same location at two different depths provide more useful information than if they are installed separately in two different spots because they can detect the direction of soil water movement (Box 9). The sensor at the shallow depth is installed at 20-30 cm deep, while the deeper sensor is placed at 50-60 cm or even deeper, depending on root system depth. More sophisticated instruments can give continuous records of soil moisture at several depths in any one location.
Plant water monitoringWhile soil-based instruments give information of soil moisture levels in the plant root zone, the plant itself is the best indicator of its water status. There has been extensive research in measuring plant water status and its impact on plant physiological processes; however, much less work has been conducted on developing specific protocols for using plant-based measurements for irrigation scheduling. The main difficulty is related to the dynamic nature of tree water status, which is affected by both the soil water status and the atmospheric environment. Tree water status changes diurnally and over the season; thus it is not easy to define thresholds for practical use. Tree water status measurements need to be benchmarked against equivalent measurements representing fully irrigated plants in the same environment. This can be accomplished by developing ‘references’ or ‘baselines’, representing the behaviour of plants under non-limiting soil water conditions, which can be used to normalize plant water measurements.
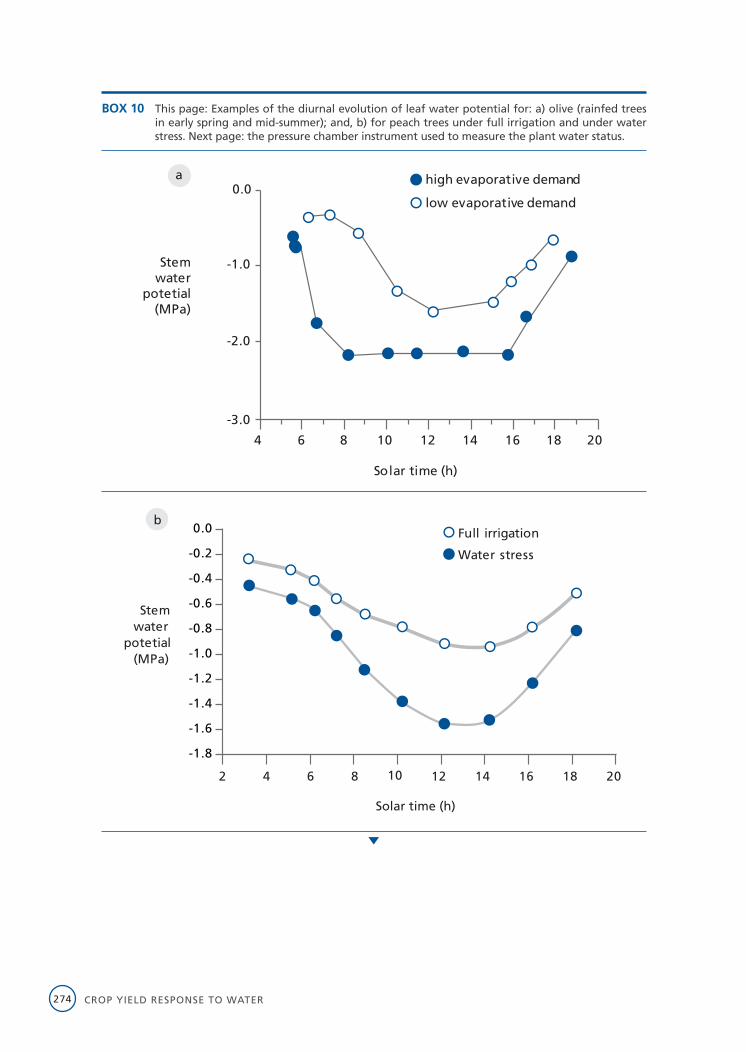
Plant water potential The parameter used for characterizing the state of water in plants is the water potential. This is commonly measured with a pressure chamber. The measurement requires that a leaf be excised, placed and sealed in a chamber with the cut petiole end sticking out, and then pressurizing the chamber with nitrogen gas until the xylem sap just appears at the cut end of the petiole (Box 10). This pressure balances the leaf water potential under certain assumptions. The established method used to assess water status of trees is the stem-water potential (SWP). To measure SWP, an interior, shaded leaf close to a main branch is covered (a small plastic bag
YIELD RESPONSE TO WATER OF FRUIT TREES AND VINES 273
overlaid with aluminum foil or any opaque, sealed bag) for a period of time (around 20 min) prior to excision. The practical elimination of transpiration by enclosing the leaf equilibrates its water status with that of the adjacent stem and presumably, the trunk. The SWP is less affected by evaporative demand (and by leaf-to-leaf variations in stomatal opening) and is more representative of the water status of the whole tree than the water potential of an exposed leaf. In some species, measurements of the water potential of uncovered, shaded leaves inside the canopy have proven to be closely correlated with SWP. Thus, taking the measurement on shaded leaves may be a viable, faster alternative to having to bag the leaves.
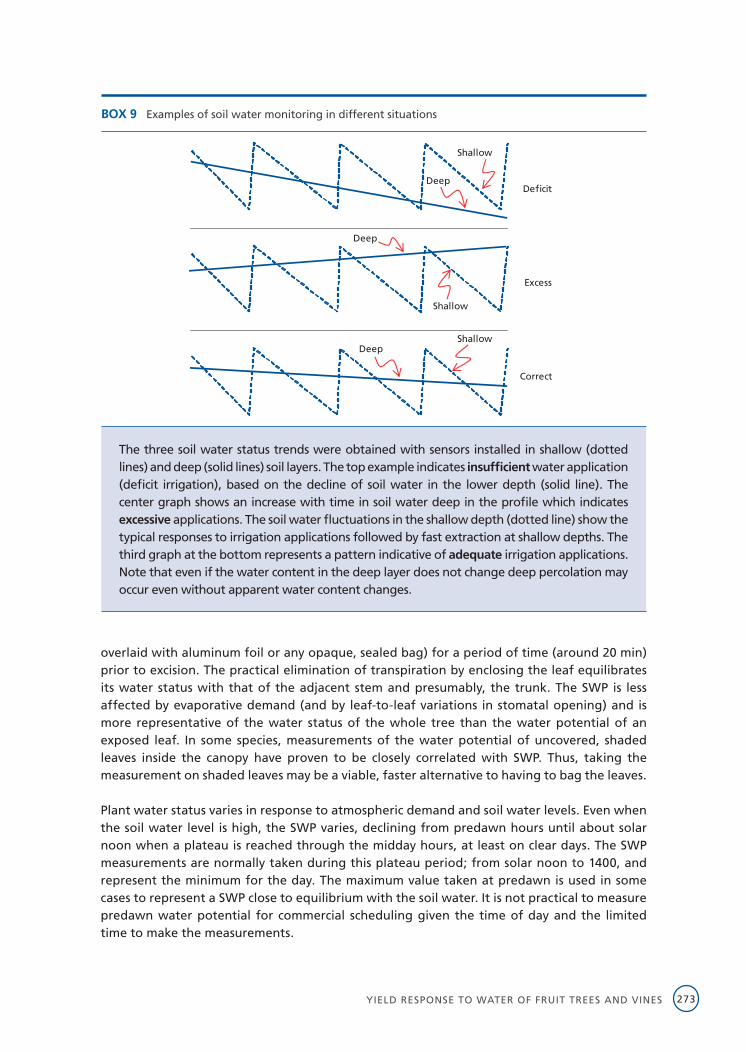
Plant water status varies in response to atmospheric demand and soil water levels. Even when the soil water level is high, the SWP varies, declining from predawn hours until about solar noon when a plateau is reached through the midday hours, at least on clear days. The SWP measurements are normally taken during this plateau period; from solar noon to 1400, and represent the minimum for the day. The maximum value taken at predawn is used in some cases to represent a SWP close to equilibrium with the soil water. It is not practical to measure predawn water potential for commercial scheduling given the time of day and the limited time to make the measurements.
BOX 9 Examples of soil water monitoring in different situations
Shallow
Deep
Shallow
Deep
ShallowDeep
Deficit
Excess
Correct
The three soil water status trends were obtained with sensors installed in shallow (dotted lines) and deep (solid lines) soil layers. The top example indicates insufficient water application (deficit irrigation), based on the decline of soil water in the lower depth (solid line). The center graph shows an increase with time in soil water deep in the profile which indicates excessive applications. The soil water fluctuations in the shallow depth (dotted line) show the typical responses to irrigation applications followed by fast extraction at shallow depths. The third graph at the bottom represents a pattern indicative of adequate irrigation applications. Note that even if the water content in the deep layer does not change deep percolation may occur even without apparent water content changes.
CROP YIELD RESPONSE TO WATER274
BOX 10 This page: Examples of the diurnal evolution of leaf water potential for: a) olive (rainfed trees in early spring and mid-summer); and, b) for peach trees under full irrigation and under water stress. Next page: the pressure chamber instrument used to measure the plant water status.
4 206 8 10 12 14 16 18
Stemwater
potetial(MPa)
0.0
-1.0
-2.0
-3.0
high evaporative demand
low evaporative demand
Solar time (h)
a
Solar time (h)
b
4 206 8 10 12 14 16 182
Water stress
Full irrigation
Stemwater
potetial(MPa)
-1.8
-1.6
-1.4
-1.2
-1.0
-0.8
-0.6
-0.4
-0.2
0.0
YIELD RESPONSE TO WATER OF FRUIT TREES AND VINES 275
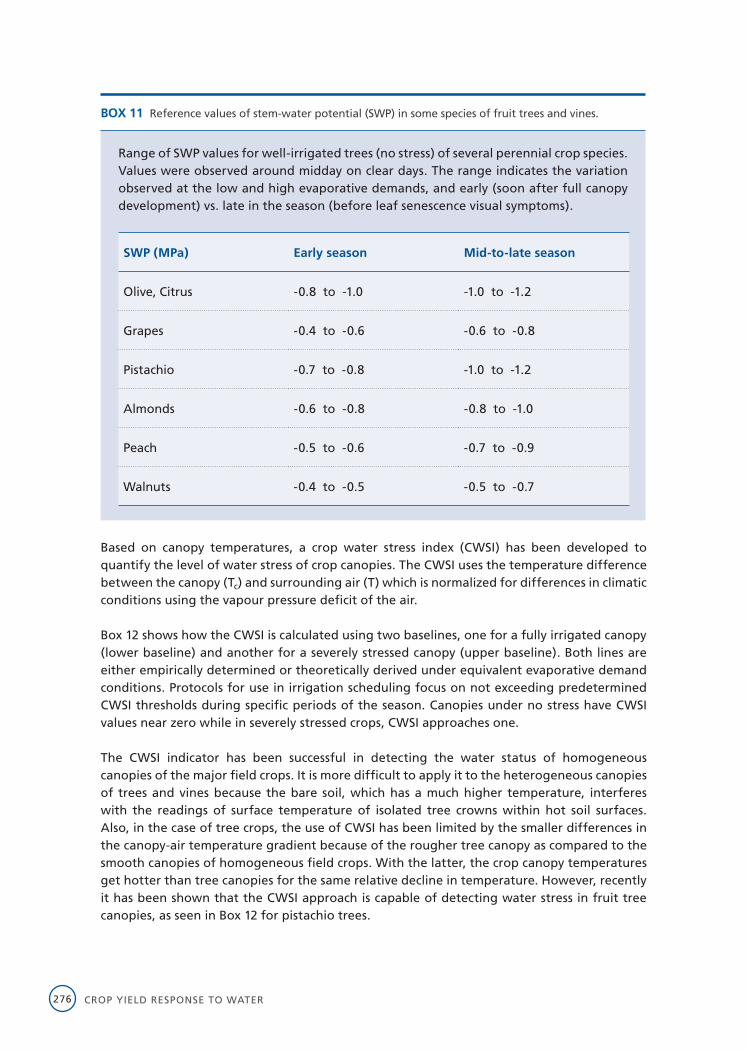
The major limitation of using SWP for irrigation management is its labor requirement, a limitation that greatly increases for the predawn measurements, because the measurements require trips to the fields, and they cannot be automated. Alternative techniques to the pressure chamber have been proposed, such as measuring the diurnal trunk diameter changes with dendrometers. This technique provides continuous records automatically and it has been tested in a few species, although it is not widely used outside research activities. Another shortcoming of plant-based scheduling approaches is that they do not provide quantitative information on how much water should be applied, as the soil water monitoring and the water budget methods offer. Research information on SWP of the various tree and vine species is available to diagnose the relative level of water status in an orchard, and this is one of the most useful applications of SWP measurements. Box 11 provides indicative values for some tree species and further details are given in the specific crop chapters. Both evaporative demand and time of the season may affect the reference SWP values.
Canopy temperatureTree canopy temperature is another indicator of water stress. The underlying mechanism is that the closure of stomata induced by water deficits causes an increase in canopy temperature because of a lower transpirational cooling. On a clear day, plant canopies well supplied with water are cooler than the surrounding air by several degrees. As water supply is restricted and water stress is imposed, the canopies warm up as transpiration is reduced, and their temperatures can be equal or higher than that of the air. In a given environment, canopy temperature increases with the severity of water stress. The development of the infrared thermometer (IRT) made it possible to measure canopy temperature remotely, without physical contact with the plant and this made it possible to use canopy temperatures for irrigation management. As an example, the difference between canopy and air temperature may range from -3 ºC when canopies are well watered to +3 ºC under significant stress, which offers a wide window to detect stress.
BOX 10 (CONTINUED)
CROP YIELD RESPONSE TO WATER276
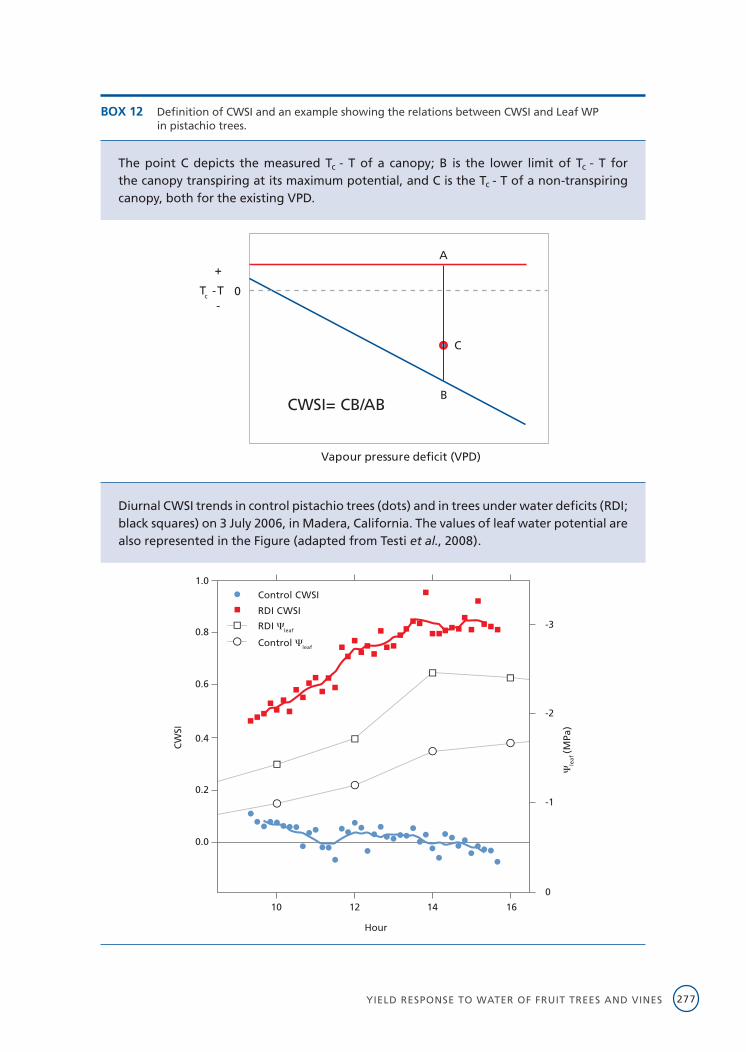
Based on canopy temperatures, a crop water stress index (CWSI) has been developed to quantify the level of water stress of crop canopies. The CWSI uses the temperature difference between the canopy (Tc) and surrounding air (T) which is normalized for differences in climatic conditions using the vapour pressure deficit of the air.
Box 12 shows how the CWSI is calculated using two baselines, one for a fully irrigated canopy (lower baseline) and another for a severely stressed canopy (upper baseline). Both lines are either empirically determined or theoretically derived under equivalent evaporative demand conditions. Protocols for use in irrigation scheduling focus on not exceeding predetermined CWSI thresholds during specific periods of the season. Canopies under no stress have CWSI values near zero while in severely stressed crops, CWSI approaches one.
The CWSI indicator has been successful in detecting the water status of homogeneous canopies of the major field crops. It is more difficult to apply it to the heterogeneous canopies of trees and vines because the bare soil, which has a much higher temperature, interferes with the readings of surface temperature of isolated tree crowns within hot soil surfaces. Also, in the case of tree crops, the use of CWSI has been limited by the smaller differences in the canopy-air temperature gradient because of the rougher tree canopy as compared to the smooth canopies of homogeneous field crops. With the latter, the crop canopy temperatures get hotter than tree canopies for the same relative decline in temperature. However, recently it has been shown that the CWSI approach is capable of detecting water stress in fruit tree canopies, as seen in Box 12 for pistachio trees.
BOX 11 Reference values of stem-water potential (SWP) in some species of fruit trees and vines.
Range of SWP values for well-irrigated trees (no stress) of several perennial crop species. Values were observed around midday on clear days. The range indicates the variation observed at the low and high evaporative demands, and early (soon after full canopy development) vs. late in the season (before leaf senescence visual symptoms).
SWP (MPa) Early season Mid-to-late season
Olive, Citrus -0.8 to -1.0 -1.0 to -1.2
Grapes -0.4 to -0.6 -0.6 to -0.8
Pistachio -0.7 to -0.8 -1.0 to -1.2
Almonds -0.6 to -0.8 -0.8 to -1.0
Peach -0.5 to -0.6 -0.7 to -0.9
Walnuts -0.4 to -0.5 -0.5 to -0.7
YIELD RESPONSE TO WATER OF FRUIT TREES AND VINES 277
BOX 12 Definition of CWSI and an example showing the relations between CWSI and Leaf WP in pistachio trees.
The point C depicts the measured Tc - T of a canopy; B is the lower limit of Tc - T for the canopy transpiring at its maximum potential, and C is the Tc - T of a non-transpiring canopy, both for the existing VPD.
Vapour pressure deficit (VPD)
+
Tc -T-
0
A
B
C
CWSI= CB/AB
Diurnal CWSI trends in control pistachio trees (dots) and in trees under water deficits (RDI; black squares) on 3 July 2006, in Madera, California. The values of leaf water potential are also represented in the Figure (adapted from Testi et al., 2008).
Control CWSI
RDI CWSI
RDI leaf
Control leaf
leaf
(MPa
)
1.0
0.8
0.6
0.4
CW
SI
Hour
0.2
0.0
0
-1
-2
-3
10 12 14 16
CROP YIELD RESPONSE TO WATER278
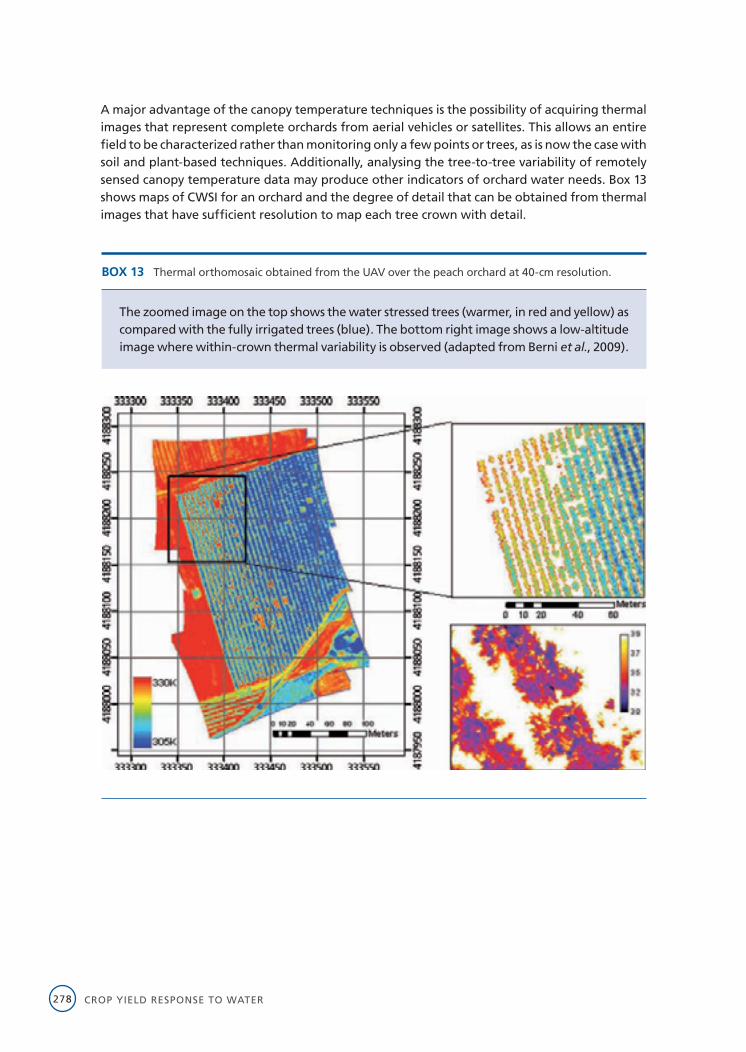
A major advantage of the canopy temperature techniques is the possibility of acquiring thermal images that represent complete orchards from aerial vehicles or satellites. This allows an entire field to be characterized rather than monitoring only a few points or trees, as is now the case with soil and plant-based techniques. Additionally, analysing the tree-to-tree variability of remotely sensed canopy temperature data may produce other indicators of orchard water needs. Box 13 shows maps of CWSI for an orchard and the degree of detail that can be obtained from thermal images that have sufficient resolution to map each tree crown with detail.
BOX 13 Thermal orthomosaic obtained from the UAV over the peach orchard at 40-cm resolution.
The zoomed image on the top shows the water stressed trees (warmer, in red and yellow) as compared with the fully irrigated trees (blue). The bottom right image shows a low-altitude image where within-crown thermal variability is observed (adapted from Berni et al., 2009).
YIELD RESPONSE TO WATER OF FRUIT TREES AND VINES 279
The water budget methodWith this method, the tree root zone is considered a reservoir of soil water that is depleted as E and Tr take place. The soil reservoir of available water that the tree depletes through ET is allowed to lose water until a soil water threshold (allowable depletion) is reached, below which water stress is detrimental to crop production, quality or both. At this point, irrigation must be applied to refill the soil profile and the amount needed is equivalent to the ETc losses since last irrigation. Box 14 describes the process of how to schedule irrigation with the water budget for tree crops.
BOX 14 Applying the water budget method of irrigation scheduling.
Information needed
Available soil water holding capacity or total available water (TAW) Defined as the difference between field capacity and permanent wilting point, it varies according to soil texture between 50 mm/m to 200 mm/m.
Rooting depth Tree roots extend deeply into open soils and can reach several metres, but their depth may be much more limited by mechanical restrictions in the soil profile.
The allowable depletion(AD) This is the threshold level of the root zone storage capacity below which the level of water deficit in the tree is undesirable. At this point, an irrigation is applied. Usual AD levels vary between 50-70 percent of TAW.
The ETc rate The ETc losses are accumulated until the allowable depletion level is reached.
Practical considerations
Although tree roots may reach several metres, the effective depth of rooting for irrigation purposes is considered much less for practical reasons. Even in deep, open soils, 1.5 to 2 m is the maximum depth considered for water budget calculations. A 2 m soil profile can hold up to 400 mm of H2O, and if the AD is 50 percent of the TAW, the crop can extract 200 mm before the next irrigation is applied. At an ETc rate of 5 mm/day, the next irrigation would be applied after 40 days! This is not practical for many reasons; for example, it would be difficult to replenish that deficit in a reasonable time period, as it is very difficult to infiltrate 200 mm of water into most soils within the standard irrigation time. Therefore, what is commonly done is to fix a certain depth of water to be applied, often much less than the AD, (between 50 and 100 mm of water), and vary the irrigation intervals according to the ETc loss. Thus, setting the AD is primarily a management decision, and must consider all practical aspects of the farm irrigation processes.
CROP YIELD RESPONSE TO WATER280
The water budget technique is very useful when significant labour is needed to irrigate, because it permits water to be applied as infrequently as possible, minimizing the number of irrigations per season and thus, labour costs. This is the case for the surface and portable sprinkler methods. When the irrigation system is permanent and covers the whole orchard or vineyard, such as for microirrigation, the issue of irrigation frequency is much less relevant, and the grower should irrigate as frequently as desired, taking into account the potential E losses. Nevertheless, it is important to keep some account of the water budget for seasonal planning, even under high-frequency irrigation.
Under microirrigation, the goal is not to refill the entire profile but only to replace the water consumed by ETc since the previous application. Thus, the primary role of the water budget using microirrigation is to determine the amount of water that needs to be applied. However, it can also be used to keep track of the soil moisture depletion of the root zone. This can be beneficial if deficit irrigation is practised or, in the event of a water delivery problem, because it can be used to determine how much available water is left in the profile. It is therefore a good planning tool, as shown in Box 15.
RESPONSES TO WATER DEFICITS OF TREE CROPS AND VINES
In every diurnal cycle, water evaporates from the leaves, internal water deficits develop and water flows from the bulk soil towards the leaves to replace the losses. For water to move from the soil to the leaves, the trees must experience some water deficits during the course of the day. However, when the soil cannot supply water at a sufficient rate to replenish the losses, or when Tr is very high because of the evaporative demand, the tree dehydrates partially and experiences water deficits that may be excessive and may affect important physiological processes that result in lower yields, fruit quality deterioration or both.
Effects on phenological developmentWater deficits affect the development of fruit trees and vines. Flower bud formation, floral development and fruit set are the main processes relevant to fruit production. For deciduous trees, fruit evolves from bud differentiation that occurs in the previous year. Thus, water deficits in one year may affect the return bloom and production of the following year. For some tree crops, water deficits negatively affect floral viability the following year, but there are also reports of enhanced return bloom following water stress in the previous summer. This response is critical for determining fruit load and therefore yield in relation to water. Since this response is species-dependent it is presented in the specific crop sections. However, a general truism is that periods of floral development and fruit set are very sensitive to water deficits, and thus, damaging water stress should be avoided. Nevertheless, occurrence of water stress during these developmental events is relatively rare for deciduous species since Tr is very low early in the season because of lack of leaf area and the generally low evaporative demand in temperate climates. In subtropical climates and for evergreen species, the likelihood of stress at flowering and fruit set is greater and should be managed accordingly.
Effects on vegetative growth and CO2 assimilationGrowth is among the first processes that are affected by water deficits. When a water deficit
YIELD RESPONSE TO WATER OF FRUIT TREES AND VINES 281
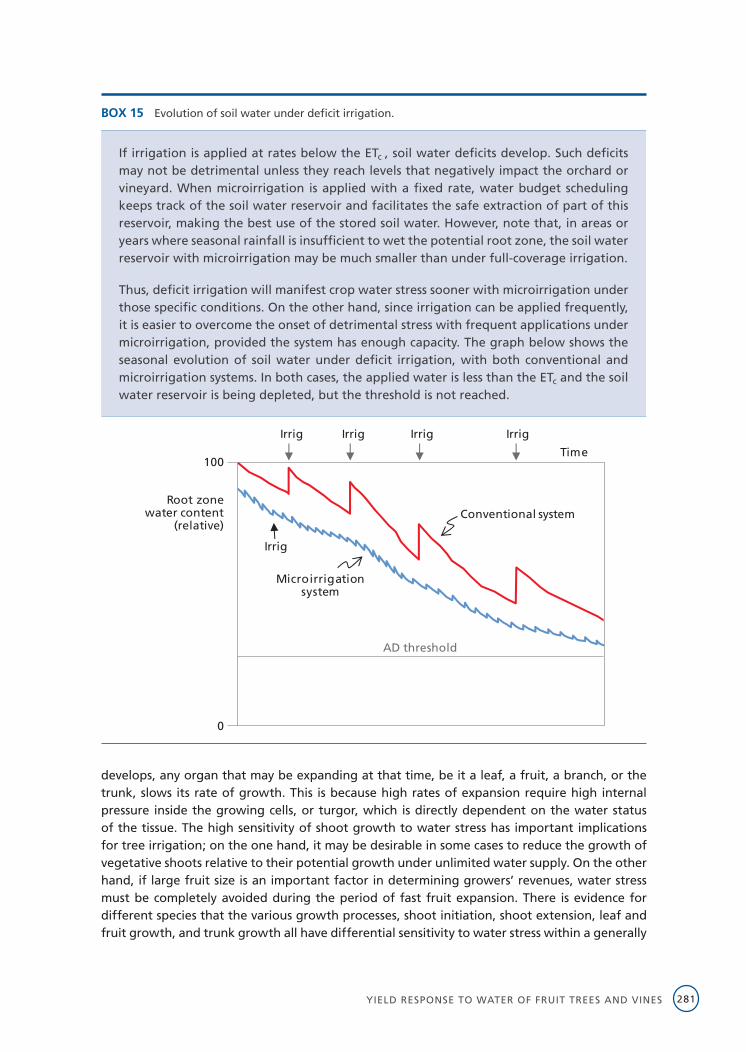
BOX 15 Evolution of soil water under deficit irrigation.
If irrigation is applied at rates below the ETc , soil water deficits develop. Such deficits may not be detrimental unless they reach levels that negatively impact the orchard or vineyard. When microirrigation is applied with a fixed rate, water budget scheduling keeps track of the soil water reservoir and facilitates the safe extraction of part of this reservoir, making the best use of the stored soil water. However, note that, in areas or years where seasonal rainfall is insufficient to wet the potential root zone, the soil water reservoir with microirrigation may be much smaller than under full-coverage irrigation.
Thus, deficit irrigation will manifest crop water stress sooner with microirrigation under those specific conditions. On the other hand, since irrigation can be applied frequently, it is easier to overcome the onset of detrimental stress with frequent applications under microirrigation, provided the system has enough capacity. The graph below shows the seasonal evolution of soil water under deficit irrigation, with both conventional and microirrigation systems. In both cases, the applied water is less than the ETc and the soil water reservoir is being depleted, but the threshold is not reached.
Irrig IrrigIrrig Irrig
AD threshold
100
0
Root zonewater content
(relative)
Time
Conventional system
Microirrigationsystem
Irrig
develops, any organ that may be expanding at that time, be it a leaf, a fruit, a branch, or the trunk, slows its rate of growth. This is because high rates of expansion require high internal pressure inside the growing cells, or turgor, which is directly dependent on the water status of the tissue. The high sensitivity of shoot growth to water stress has important implications for tree irrigation; on the one hand, it may be desirable in some cases to reduce the growth of vegetative shoots relative to their potential growth under unlimited water supply. On the other hand, if large fruit size is an important factor in determining growers’ revenues, water stress must be completely avoided during the period of fast fruit expansion. There is evidence for different species that the various growth processes, shoot initiation, shoot extension, leaf and fruit growth, and trunk growth all have differential sensitivity to water stress within a generally
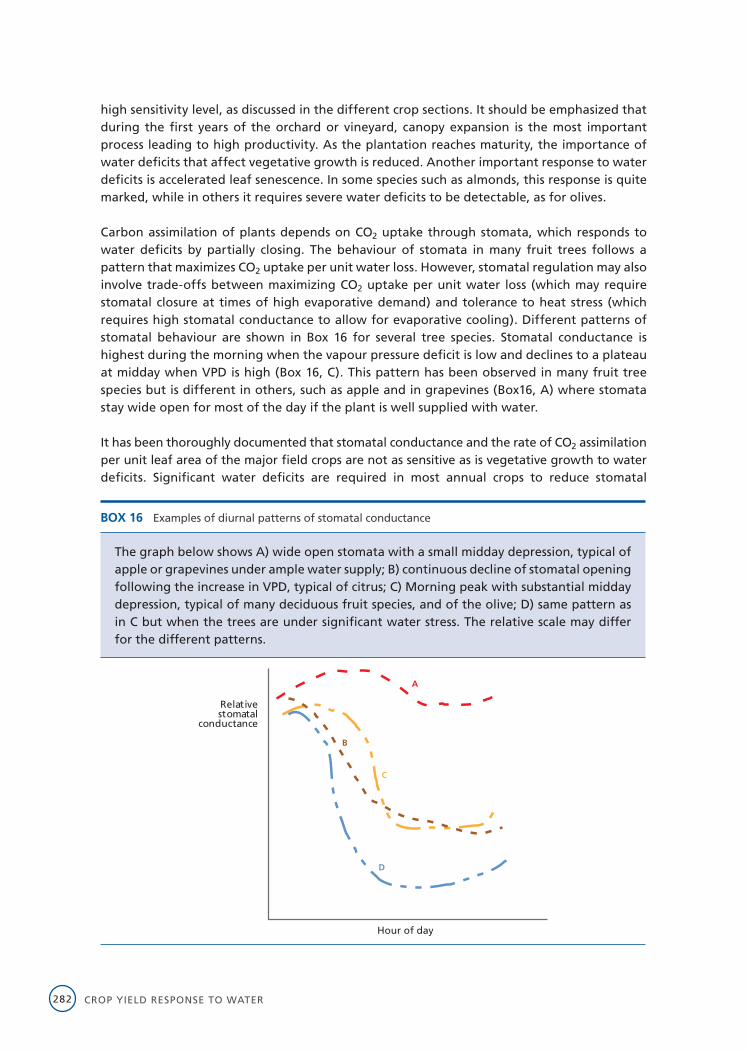
CROP YIELD RESPONSE TO WATER282
high sensitivity level, as discussed in the different crop sections. It should be emphasized that during the first years of the orchard or vineyard, canopy expansion is the most important process leading to high productivity. As the plantation reaches maturity, the importance of water deficits that affect vegetative growth is reduced. Another important response to water deficits is accelerated leaf senescence. In some species such as almonds, this response is quite marked, while in others it requires severe water deficits to be detectable, as for olives.
Carbon assimilation of plants depends on CO2 uptake through stomata, which responds to water deficits by partially closing. The behaviour of stomata in many fruit trees follows a pattern that maximizes CO2 uptake per unit water loss. However, stomatal regulation may also involve trade-offs between maximizing CO2 uptake per unit water loss (which may require stomatal closure at times of high evaporative demand) and tolerance to heat stress (which requires high stomatal conductance to allow for evaporative cooling). Different patterns of stomatal behaviour are shown in Box 16 for several tree species. Stomatal conductance is highest during the morning when the vapour pressure deficit is low and declines to a plateau at midday when VPD is high (Box 16, C). This pattern has been observed in many fruit tree species but is different in others, such as apple and in grapevines (Box16, A) where stomata stay wide open for most of the day if the plant is well supplied with water.
It has been thoroughly documented that stomatal conductance and the rate of CO2 assimilation per unit leaf area of the major field crops are not as sensitive as is vegetative growth to water deficits. Significant water deficits are required in most annual crops to reduce stomatal
BOX 16 Examples of diurnal patterns of stomatal conductance
The graph below shows A) wide open stomata with a small midday depression, typical of apple or grapevines under ample water supply; B) continuous decline of stomatal opening following the increase in VPD, typical of citrus; C) Morning peak with substantial midday depression, typical of many deciduous fruit species, and of the olive; D) same pattern as in C but when the trees are under significant water stress. The relative scale may differ for the different patterns.
Hour of day
Relativestomatal
conductance
A
B
C
D
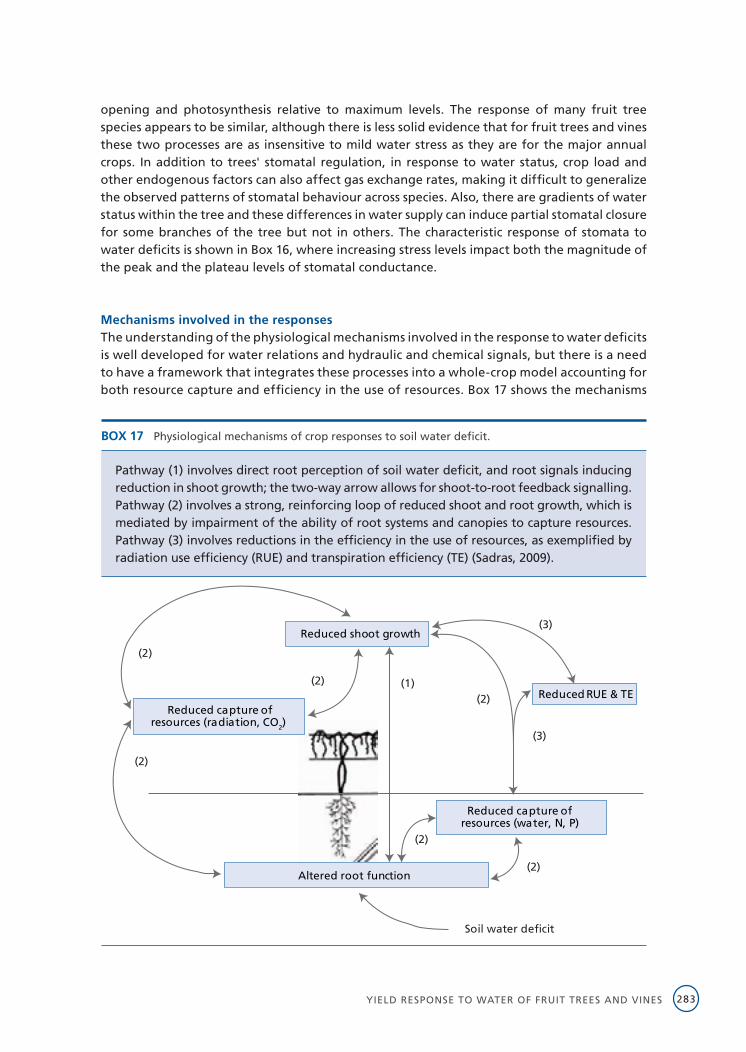
YIELD RESPONSE TO WATER OF FRUIT TREES AND VINES 283
opening and photosynthesis relative to maximum levels. The response of many fruit tree species appears to be similar, although there is less solid evidence that for fruit trees and vines these two processes are as insensitive to mild water stress as they are for the major annual crops. In addition to trees' stomatal regulation, in response to water status, crop load and other endogenous factors can also affect gas exchange rates, making it difficult to generalize the observed patterns of stomatal behaviour across species. Also, there are gradients of water status within the tree and these differences in water supply can induce partial stomatal closure for some branches of the tree but not in others. The characteristic response of stomata to water deficits is shown in Box 16, where increasing stress levels impact both the magnitude of the peak and the plateau levels of stomatal conductance.
Mechanisms involved in the responsesThe understanding of the physiological mechanisms involved in the response to water deficits is well developed for water relations and hydraulic and chemical signals, but there is a need to have a framework that integrates these processes into a whole-crop model accounting for both resource capture and efficiency in the use of resources. Box 17 shows the mechanisms
BOX 17 Physiological mechanisms of crop responses to soil water deficit.
Pathway (1) involves direct root perception of soil water deficit, and root signals inducing reduction in shoot growth; the two-way arrow allows for shoot-to-root feedback signalling. Pathway (2) involves a strong, reinforcing loop of reduced shoot and root growth, which is mediated by impairment of the ability of root systems and canopies to capture resources. Pathway (3) involves reductions in the efficiency in the use of resources, as exemplified by radiation use efficiency (RUE) and transpiration efficiency (TE) (Sadras, 2009).
Reduced shoot growth
Reduced capture of resources (radiation, CO2)
Reduced capture of resources (water, N, P)
Reduced RUE & TE
Altered root function(2)
(2)
(2)
(2)
(3)
(3)
(2)
(2)
(1)
Soil water deficit
CROP YIELD RESPONSE TO WATER284
of crop responses to water deficits grouped into three classes. Pathway (1) involves root-to-shoot and shoot-to-root hydraulic and chemical signals, which have attracted profuse attention. Pathway (2) contains a very strong reinforcing loop, whereby initial reduction in growth of shoot, root or both, forms a loop that may eventually override other processes. Pathway (3) involves changes in radiation- and transpiration-efficiency; these efficiencies are stable except for conditions of severe stress. This model illustrates the interactions and interdependence of the multitude of physiological processes involved in water relations and plant growth and, as such, is an integral part of understanding crop responses to water deficits. This understanding is fundamental and forms the basis for the development of improved irrigation practices.
Effects on yieldKnowledge of yield and fruit quality responses to water deficits is required to predict the orchard response to reductions in water supply in water-short years or in areas of water scarcity, where it is not possible to supply the amounts needed to meet maximum ETc. Normally, the prospect of water deficits increases the risk of yield reductions and these fears are often realized if the water deficits are severe enough and occur at critical stages when some of the components of yield are determined. However, it is sometimes possible to avoid the negative impacts of reduced irrigation supplies by confining the plant water deficits to stress-tolerant periods of the season. Moreover, there are some cases where it is possible to actually exploit the positive responses to water deficits to improve fruit quality and thus, enhance crop value with reduced consumptive use. Thus, growers would profit from both higher gross revenue and reduced water costs.
To assess the response of fruit trees and vines to water deficits, multiyear trials are necessary because perennial plants require time to acclimatize to a new water regime and because there may be carryover affects of water deficits on subsequent season(s)' productivity. In other words, stress history is an important aspect of permanent crop deficit irrigation. Normally, stored soil water, shoot, leaf, root, and fruit development are all affected by the first season of water deficits and all that influences the results of that year. After the first year, a minimum of two additional years are needed to evaluate the response, primarily is the result of both carryover impacts of stress and the alternate bearing tendency of many tree species that would affect the yield, regardless of the water deficits. To characterize the yield response to water for perennial crops it is necessary to conduct experiments for 3-4 years minimum, and preferably more. The tree-to-tree variability increases the number of replicate plots needed to detect statistically significant differences in both physiological processes and yield components among treatments. All these make tree and vine irrigation experiments very time consuming and expensive and thus scarce, particularly those that are long term.
Fruit and product qualityMany fruit quality features may be affected by water deficits and it is ultimately the cumulative impact on yield and quality of a product that will inform deficit irrigation strategies. Thus, only those quality factors that influence product prices should be considered when evaluating the effects of water deficits on quality. The size of fresh fruit is one of the most important quality aspects affecting orchard revenue. Fruit size is generally reduced by water deficits
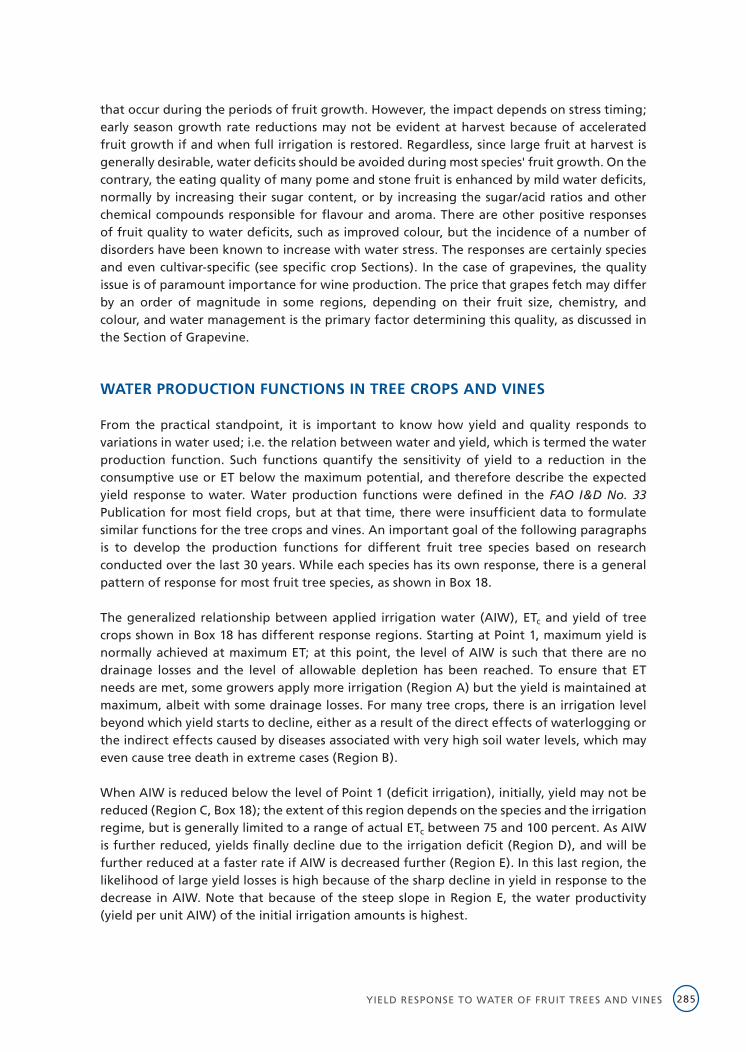
YIELD RESPONSE TO WATER OF FRUIT TREES AND VINES 285
that occur during the periods of fruit growth. However, the impact depends on stress timing; early season growth rate reductions may not be evident at harvest because of accelerated fruit growth if and when full irrigation is restored. Regardless, since large fruit at harvest is generally desirable, water deficits should be avoided during most species' fruit growth. On the contrary, the eating quality of many pome and stone fruit is enhanced by mild water deficits, normally by increasing their sugar content, or by increasing the sugar/acid ratios and other chemical compounds responsible for flavour and aroma. There are other positive responses of fruit quality to water deficits, such as improved colour, but the incidence of a number of disorders have been known to increase with water stress. The responses are certainly species and even cultivar-specific (see specific crop Sections). In the case of grapevines, the quality issue is of paramount importance for wine production. The price that grapes fetch may differ by an order of magnitude in some regions, depending on their fruit size, chemistry, and colour, and water management is the primary factor determining this quality, as discussed in the Section of Grapevine.
WATER PRODUCTION FUNCTIONS IN TREE CROPS AND VINES
From the practical standpoint, it is important to know how yield and quality responds to variations in water used; i.e. the relation between water and yield, which is termed the water production function. Such functions quantify the sensitivity of yield to a reduction in the consumptive use or ET below the maximum potential, and therefore describe the expected yield response to water. Water production functions were defined in the FAO I&D No. 33 Publication for most field crops, but at that time, there were insufficient data to formulate similar functions for the tree crops and vines. An important goal of the following paragraphs is to develop the production functions for different fruit tree species based on research conducted over the last 30 years. While each species has its own response, there is a general pattern of response for most fruit tree species, as shown in Box 18.
The generalized relationship between applied irrigation water (AIW), ETc and yield of tree crops shown in Box 18 has different response regions. Starting at Point 1, maximum yield is normally achieved at maximum ET; at this point, the level of AIW is such that there are no drainage losses and the level of allowable depletion has been reached. To ensure that ET needs are met, some growers apply more irrigation (Region A) but the yield is maintained at maximum, albeit with some drainage losses. For many tree crops, there is an irrigation level beyond which yield starts to decline, either as a result of the direct effects of waterlogging or the indirect effects caused by diseases associated with very high soil water levels, which may even cause tree death in extreme cases (Region B).
When AIW is reduced below the level of Point 1 (deficit irrigation), initially, yield may not be reduced (Region C, Box 18); the extent of this region depends on the species and the irrigation regime, but is generally limited to a range of actual ETc between 75 and 100 percent. As AIW is further reduced, yields finally decline due to the irrigation deficit (Region D), and will be further reduced at a faster rate if AIW is decreased further (Region E). In this last region, the likelihood of large yield losses is high because of the sharp decline in yield in response to the decrease in AIW. Note that because of the steep slope in Region E, the water productivity (yield per unit AIW) of the initial irrigation amounts is highest.
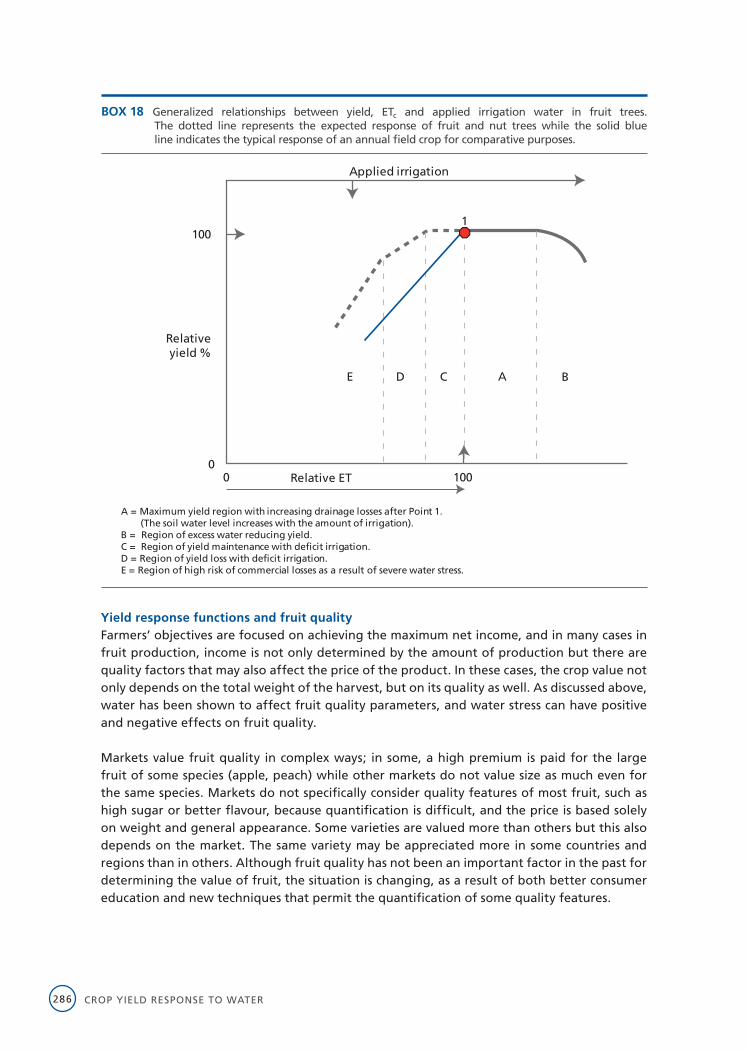
CROP YIELD RESPONSE TO WATER286
Yield response functions and fruit qualityFarmers’ objectives are focused on achieving the maximum net income, and in many cases in fruit production, income is not only determined by the amount of production but there are quality factors that may also affect the price of the product. In these cases, the crop value not only depends on the total weight of the harvest, but on its quality as well. As discussed above, water has been shown to affect fruit quality parameters, and water stress can have positive and negative effects on fruit quality.
Markets value fruit quality in complex ways; in some, a high premium is paid for the large fruit of some species (apple, peach) while other markets do not value size as much even for the same species. Markets do not specifically consider quality features of most fruit, such as high sugar or better flavour, because quantification is difficult, and the price is based solely on weight and general appearance. Some varieties are valued more than others but this also depends on the market. The same variety may be appreciated more in some countries and regions than in others. Although fruit quality has not been an important factor in the past for determining the value of fruit, the situation is changing, as a result of both better consumer education and new techniques that permit the quantification of some quality features.
BOX 18 Generalized relationships between yield, ETc and applied irrigation water in fruit trees. The dotted line represents the expected response of fruit and nut trees while the solid blue line indicates the typical response of an annual field crop for comparative purposes.
AC BE D
Relativeyield %
100
100
0Relative ET 0
1
Applied irrigation
A = Maximum yield region with increasing drainage losses after Point 1. (The soil water level increases with the amount of irrigation).B = Region of excess water reducing yield.C = Region of yield maintenance with deficit irrigation.D = Region of yield loss with deficit irrigation.E = Region of high risk of commercial losses as a result of severe water stress.
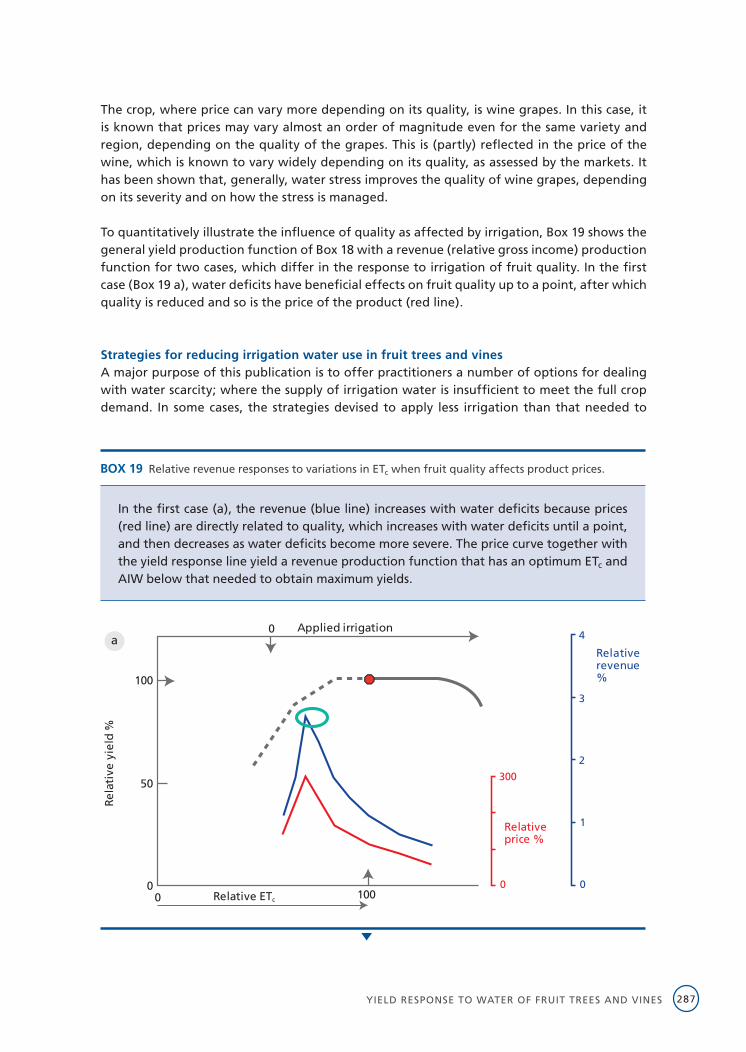
YIELD RESPONSE TO WATER OF FRUIT TREES AND VINES 287
The crop, where price can vary more depending on its quality, is wine grapes. In this case, it is known that prices may vary almost an order of magnitude even for the same variety and region, depending on the quality of the grapes. This is (partly) reflected in the price of the wine, which is known to vary widely depending on its quality, as assessed by the markets. It has been shown that, generally, water stress improves the quality of wine grapes, depending on its severity and on how the stress is managed.
To quantitatively illustrate the influence of quality as affected by irrigation, Box 19 shows the general yield production function of Box 18 with a revenue (relative gross income) production function for two cases, which differ in the response to irrigation of fruit quality. In the first case (Box 19 a), water deficits have beneficial effects on fruit quality up to a point, after which quality is reduced and so is the price of the product (red line).
Strategies for reducing irrigation water use in fruit trees and vinesA major purpose of this publication is to offer practitioners a number of options for dealing with water scarcity; where the supply of irrigation water is insufficient to meet the full crop demand. In some cases, the strategies devised to apply less irrigation than that needed to
BOX 19 Relative revenue responses to variations in ETc when fruit quality affects product prices.
In the first case (a), the revenue (blue line) increases with water deficits because prices (red line) are directly related to quality, which increases with water deficits until a point, and then decreases as water deficits become more severe. The price curve together with the yield response line yield a revenue production function that has an optimum ETc and AIW below that needed to obtain maximum yields.
Rela
tive
yie
ld %
100
0
100
50
0Relative ETc 0
Applied irrigation
300
Relativeprice %
0
2
3
4
0
1
Relativerevenue%
a
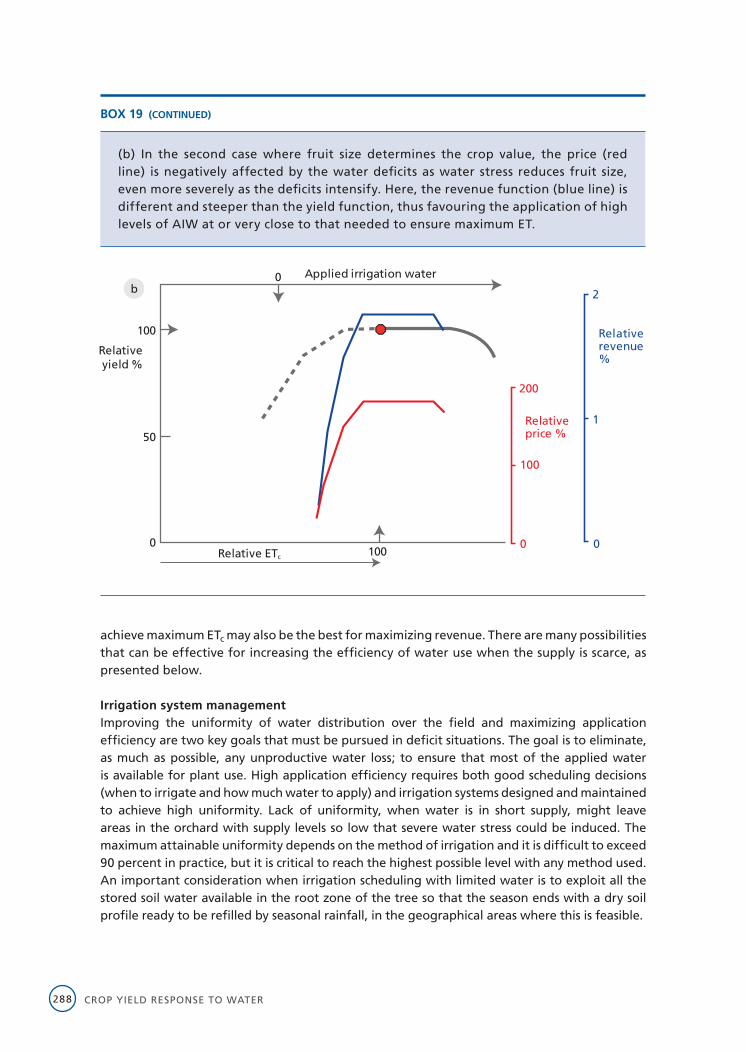
CROP YIELD RESPONSE TO WATER288
achieve maximum ETc may also be the best for maximizing revenue. There are many possibilities that can be effective for increasing the efficiency of water use when the supply is scarce, as presented below.
Irrigation system management Improving the uniformity of water distribution over the field and maximizing application efficiency are two key goals that must be pursued in deficit situations. The goal is to eliminate, as much as possible, any unproductive water loss; to ensure that most of the applied water is available for plant use. High application efficiency requires both good scheduling decisions (when to irrigate and how much water to apply) and irrigation systems designed and maintained to achieve high uniformity. Lack of uniformity, when water is in short supply, might leave areas in the orchard with supply levels so low that severe water stress could be induced. The maximum attainable uniformity depends on the method of irrigation and it is difficult to exceed 90 percent in practice, but it is critical to reach the highest possible level with any method used. An important consideration when irrigation scheduling with limited water is to exploit all the stored soil water available in the root zone of the tree so that the season ends with a dry soil profile ready to be refilled by seasonal rainfall, in the geographical areas where this is feasible.
BOX 19 (CONTINUED)
(b) In the second case where fruit size determines the crop value, the price (red line) is negatively affected by the water deficits as water stress reduces fruit size, even more severely as the deficits intensify. Here, the revenue function (blue line) is different and steeper than the yield function, thus favouring the application of high levels of AIW at or very close to that needed to ensure maximum ET.
Relativeyield %
100
0
100
50
0Relative ETc
Applied irrigation water
200
Relativeprice %
0
100
1
2
0
Relativerevenue%
b
YIELD RESPONSE TO WATER OF FRUIT TREES AND VINES 289
Modify horticultural practices Pruning – More severe pruning may be effective in reducing water use since Tr is related to canopy size and leaf area density. However, the relationships between canopy size and Tr are not linear (see Figure 11) and significant pruning may be needed to change Tr. When the reduction in water supply is going to be drastic (a small fraction of tree Tr), a mature plantation can be saved for later years by heavy pruning (sometimes called ‘dehorning’ or ‘stumping’). The objective is to remove most of the canopy, leaving only short primary scaffolds. This effectively eliminates any yield for that season but it permits the tree to survive the drought. Full production may not resume for several years.
Fruit thinning – Heavy fruit thinning under limited water allows the grower to produce fruit of marketable sizes, thus increasing crop value relative to normal thinning. This practice is common and achieves higher grower revenue, even though yields are lower. Also, because the presence of fruit enhances Tr, heavy thinning can reduce Tr rates somewhat in many tree species and decrease the level of water stress in the trees, leading to an acceptable commercial size for the remaining fruit. As a general conclusion, it must be said that there is not much evidence that these measures are very effective, relative to others discussed in this Section, except in extreme, very low water supply situations. Further, because the reduction in transpiration associated with fruit thinning is mediated by reduced stomatal conductance, this practice might increase heat damage where water deficit and high temperatures occur at the same time.
Reduce evaporation from soil – If runoff is avoided and deep percolation is minimized, the only option left to decrease unproductive water use is to reduce or even eliminate E loss. In full coverage systems, irrigating as infrequently as possible would also minimize E. Evaporation losses from drip irrigation are low but they can be reduced further if the systems are not run daily, but every few days. The optimum interval would depend on the depth of water required and on soil type, as deep percolation must also be avoided. Because the depth of applied water is reduced under deficit, the irrigation set (duration of irrigation) should not be changed, but the interval between applications should be expanded (irrigation frequency lowered). Having the drip lines under the canopy will contribute to the E reduction because of both the shade and the mulch layer of dead leaves over the wetted soil. Buried drip networks can theoretically eliminate E. However, some surface wetting has been reported with many buried drip systems, even with line placement 45 cm deep. The magnitude of this problem seems to depend on soil transport properties, the installation depth, the method used for line installation, and the duration of the irrigation. Moreover, these systems are relatively expensive and more difficult to maintain. Thus, the installation of buried drip systems for the purpose of reducing E is generally not justified, as the savings relative to surface drip would be small in absolute terms. In cases where the amount of water applied is very low, the relative importance of E increases, and the small E savings from buried drip may pay off.
Deficit irrigationOnce all the measures described above have been considered and adopted as needed, the only option left to cope with water scarcity is to reduce the application of irrigation water. Deficit irrigation (DI) is defined as a regime where the irrigation water applied is less than the orchard ET requirements. When the irrigation rate is below the ET rate, there will be a net extraction of water from the soil reservoir. Two situations may then develop. In one case, if sufficient water is stored in the soil and transpiration is not limited by soil water, the consumptive use (ET)
CROP YIELD RESPONSE TO WATER290
is unaffected even though the volume of irrigation water was reduced. However, if the soil water supply is insufficient to meet the ET demand, crop water deficits lead to a reduction in growth and transpiration. In the latter situation, DI reduces ET below its maximum potential. It is important to consider the sensitivity of the specific crop to water deficits. As described in the specific sections, some crops are very sensitive to water deficits and are not amenable to DI, such as walnut, avocado and kiwi. Others ranked from moderately sensitive to somewhat tolerant and, therefore, are amenable to DI strategies of variable intensity.
Deficit irrigation strategies There are many approaches in designing a DI programme but they follow two different strategies. In one, called continuous or sustained DI (SDI), a constant fraction of the crop ET is applied at regular intervals. If the soil profile is full at the start of the season, the trees take up soil water to compensate for the deficits; as the season progresses, the soil is progressively depleted and the water deficits increase with time in the absence of rainfall. The other approach is called regulated DI (RDI), and is defined as a regime that purposely stresses the trees or vines at specific developmental stages of the crop that are considered to be the least sensitive to water deficits. The goal of RDI, when water supplies are relatively high, is to have little, if any, negative impact on the yield of marketable products and on gross profits. It should be emphasized that under RDI, the trees are subjected to irrigation deficits only at certain stages of development but they generally receive full irrigation outside these periods. The water stress is normally imposed in RDI at stages when reproductive growth is relatively low. Water deficits imposed at these stages also generally reduce vegetative growth (and thus pruning costs and agricultural burning potential problems) and may impact on other plant processes, often improving fruit quality. Figure 12 shows graphically one example of the two SDI and RDI strategies in relation to full ETc.
With plentiful water supplies, RDI is designed to reduce consumptive use without negatively impacting, and in the cases where water deficits enhance fruit quality, improving grower income and hopefully net profits. However, the RDI concept can also be used in drought years, where available irrigation supplies are limited. In practice, the manager must decide whether to impose more severe water deficits during the stress-tolerant periods or begin to expand the stress into the less stress-tolerant stages of the season or a combination of both. Thus, the timing, magnitude, and duration of the stress periods will depend on the water supply with the goal being maximum grower profit; both in the current and subsequent season(s).
One form of deficit irrigation is to irrigate alternatively either side of the tree or vine, to generate wet-dry cycles on both sides of the root system. Thus, only half the root system is irrigated at any one time while the other dries out. After some time (every two weeks or so), the system is shifted and the dry side is irrigated; this technique is called Partial Root Drying (PRD). Even though one side of the root system is always in a drying cycle, plant water deficits may not occur under PRD since the other side of the root zone can be irrigated to meet the ET requirements. Experiments and commercial practice has shown that under PRD, less irrigation water can be applied than under full irrigation resulting in higher production per unit water used. The hypothesis is that the drying cycle induces the production of chemical signals in the roots, which are translocated to the leaves and result in partial stomatal closure and the regulation of growth. This, in turn, reduces vegetative growth and enhances fruit cell turgor, resulting in positive impacts on yield and/or quality. In practice, most of the PRD experiments to date have also imposed DI, making it impossible to distinguish impacts of the water deficit
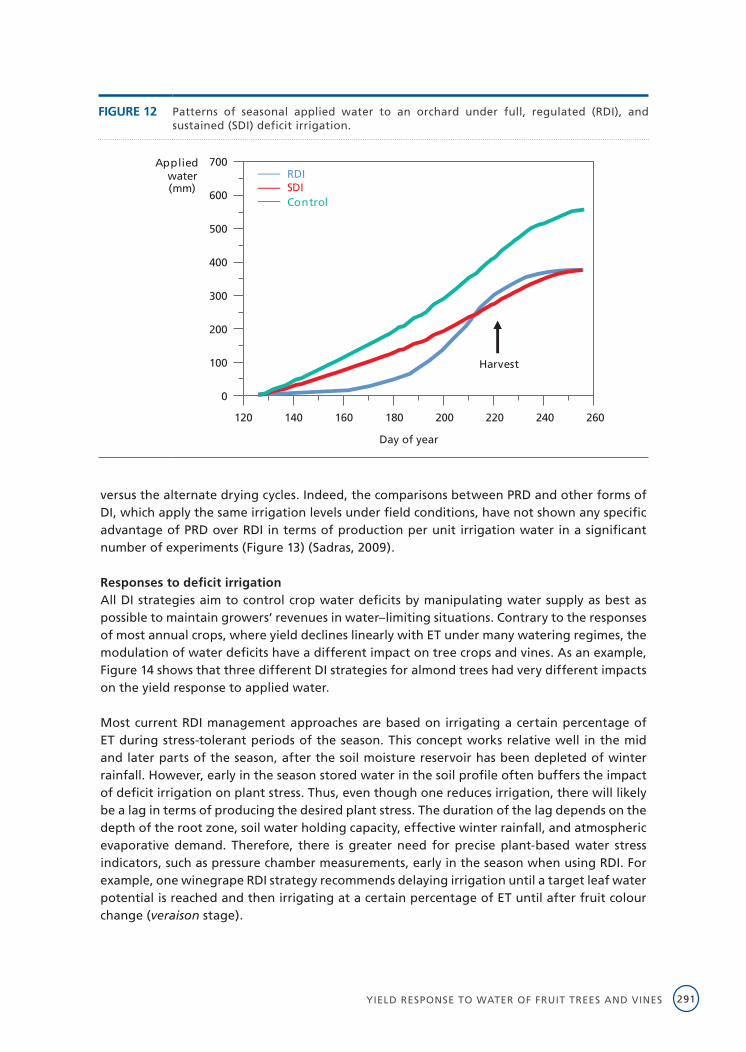
YIELD RESPONSE TO WATER OF FRUIT TREES AND VINES 291
versus the alternate drying cycles. Indeed, the comparisons between PRD and other forms of DI, which apply the same irrigation levels under field conditions, have not shown any specific advantage of PRD over RDI in terms of production per unit irrigation water in a significant number of experiments (Figure 13) (Sadras, 2009).
Responses to deficit irrigationAll DI strategies aim to control crop water deficits by manipulating water supply as best as possible to maintain growers’ revenues in water–limiting situations. Contrary to the responses of most annual crops, where yield declines linearly with ET under many watering regimes, the modulation of water deficits have a different impact on tree crops and vines. As an example, Figure 14 shows that three different DI strategies for almond trees had very different impacts on the yield response to applied water.
Most current RDI management approaches are based on irrigating a certain percentage of ET during stress-tolerant periods of the season. This concept works relative well in the mid and later parts of the season, after the soil moisture reservoir has been depleted of winter rainfall. However, early in the season stored water in the soil profile often buffers the impact of deficit irrigation on plant stress. Thus, even though one reduces irrigation, there will likely be a lag in terms of producing the desired plant stress. The duration of the lag depends on the depth of the root zone, soil water holding capacity, effective winter rainfall, and atmospheric evaporative demand. Therefore, there is greater need for precise plant-based water stress indicators, such as pressure chamber measurements, early in the season when using RDI. For example, one winegrape RDI strategy recommends delaying irrigation until a target leaf water potential is reached and then irrigating at a certain percentage of ET until after fruit colour change (veraison stage).
FIGURE 12 Patterns of seasonal applied water to an orchard under full, regulated (RDI), and sustained (SDI) deficit irrigation.
Applied water (mm)
0
100
200
300
400
500
600
700
120 140 160 180 200 220 240 260
Day of year
Harvest
RDISDIControl
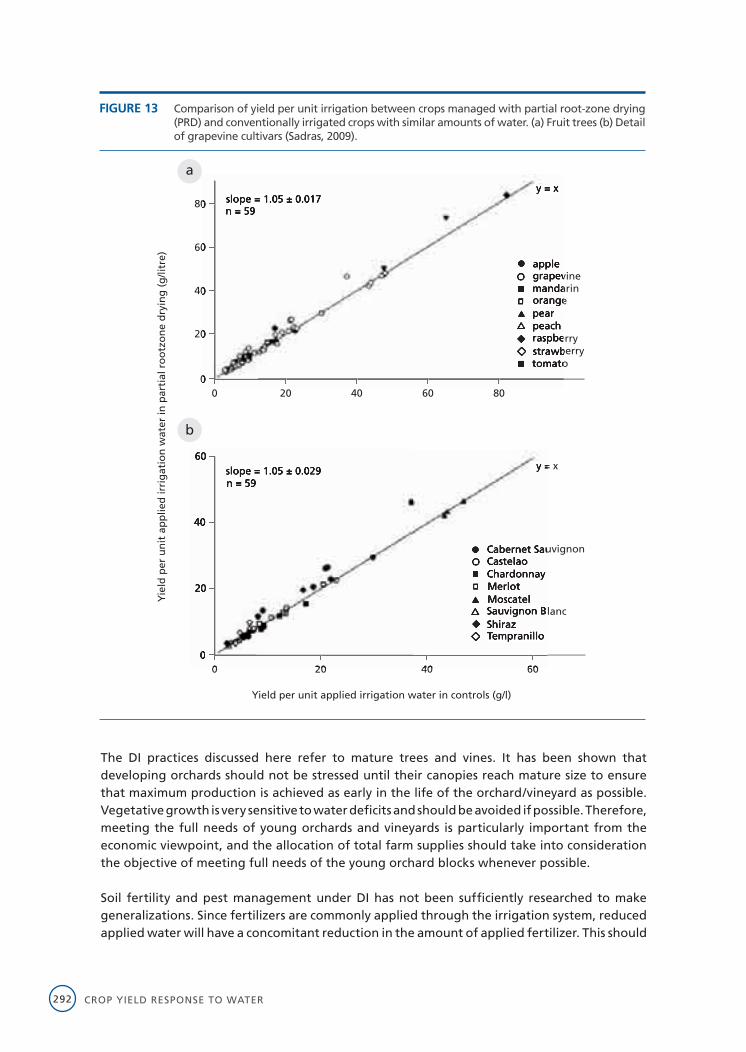
CROP YIELD RESPONSE TO WATER292
FIGURE 13 Comparison of yield per unit irrigation between crops managed with partial root-zone drying (PRD) and conventionally irrigated crops with similar amounts of water. (a) Fruit trees (b) Detail of grapevine cultivars (Sadras, 2009).
Yie
ld p
er u
nit
ap
plie
d ir
rig
atio
n w
ater
in p
arti
al r
oo
tzo
ne
dry
ing
(g
/litr
e)
80
60
40
20
00 20 40 60 80
slope = 1.05 ± 0.017n = 59
60
40
20
00 20 40 60
slope = 1.05 ± 0.029n = 59
y = x
y = x
applegrapevinemandarin
raspberrystrawberry
orangepear
tomato
peach
Cabernet SauvignonCastelaoChardonnay
ShirazTempranillo
MerlotMoscatelSauvignon Blanc
Yield per unit applied irrigation water in controls (g/l)
a
b
The DI practices discussed here refer to mature trees and vines. It has been shown that developing orchards should not be stressed until their canopies reach mature size to ensure that maximum production is achieved as early in the life of the orchard/vineyard as possible. Vegetative growth is very sensitive to water deficits and should be avoided if possible. Therefore, meeting the full needs of young orchards and vineyards is particularly important from the economic viewpoint, and the allocation of total farm supplies should take into consideration the objective of meeting full needs of the young orchard blocks whenever possible.
Soil fertility and pest management under DI has not been sufficiently researched to make generalizations. Since fertilizers are commonly applied through the irrigation system, reduced applied water will have a concomitant reduction in the amount of applied fertilizer. This should
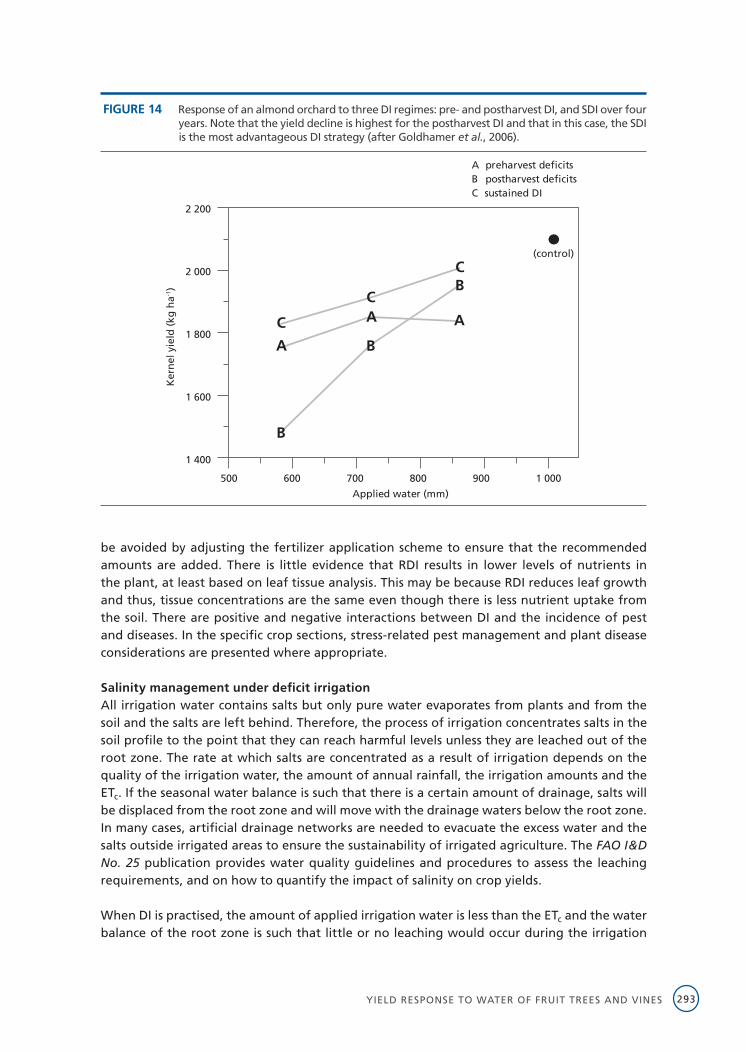
YIELD RESPONSE TO WATER OF FRUIT TREES AND VINES 293
be avoided by adjusting the fertilizer application scheme to ensure that the recommended amounts are added. There is little evidence that RDI results in lower levels of nutrients in the plant, at least based on leaf tissue analysis. This may be because RDI reduces leaf growth and thus, tissue concentrations are the same even though there is less nutrient uptake from the soil. There are positive and negative interactions between DI and the incidence of pest and diseases. In the specific crop sections, stress-related pest management and plant disease considerations are presented where appropriate.
Salinity management under deficit irrigationAll irrigation water contains salts but only pure water evaporates from plants and from the soil and the salts are left behind. Therefore, the process of irrigation concentrates salts in the soil profile to the point that they can reach harmful levels unless they are leached out of the root zone. The rate at which salts are concentrated as a result of irrigation depends on the quality of the irrigation water, the amount of annual rainfall, the irrigation amounts and the ETc. If the seasonal water balance is such that there is a certain amount of drainage, salts will be displaced from the root zone and will move with the drainage waters below the root zone. In many cases, artificial drainage networks are needed to evacuate the excess water and the salts outside irrigated areas to ensure the sustainability of irrigated agriculture. The FAO I&D No. 25 publication provides water quality guidelines and procedures to assess the leaching requirements, and on how to quantify the impact of salinity on crop yields.
When DI is practised, the amount of applied irrigation water is less than the ETc and the water balance of the root zone is such that little or no leaching would occur during the irrigation
FIGURE 14 Response of an almond orchard to three DI regimes: pre- and postharvest DI, and SDI over four years. Note that the yield decline is highest for the postharvest DI and that in this case, the SDI is the most advantageous DI strategy (after Goldhamer et al., 2006).
Applied water (mm)
A preharvest deficitsB postharvest deficitsC sustained DI
(control)
500 600 700 800 900 1 000
2 200
2 000
1 800
1 600
1 400
C
C
CB
B
B
A
A
A
Ker
nel
yie
ld (
kg h
a-1)
CROP YIELD RESPONSE TO WATER294
season. Thus the risks of salinity buildup are higher under DI than under full irrigation. When reductions in water supply last only a year or two, it is possible to use mild to moderate DI with limited impact on yield and net income and with little salt accumulation. This is because normally, there is sufficient stored soil water to contribute to ET from the previous, normal year, and the salinity risks are limited if full irrigation resumes one or two years after the imposition of DI.
If DI is practised over the long term, a strategy for salinity management under DI must be devised to make DI sustainable. In areas where annual rainfall is significant (average, above 300 mm) and drainage is feasible, salinity buildup is controlled by the annual rainfall for waters of good to medium quality. Poor quality water may require some additional leaching in dry years, depending on the rainfall patterns. When annual rainfall is insufficient to leach the salts and microirrigation is practised, salts will accumulate and remain at the boundaries of the wetted zones by the emitters, and they may be harmful to the crop. Light rainfall may move these salts into the active root zones, and this is why in some dry areas drip irrigation systems are turned on when light rainfall is predicted. Sometimes, full coverage irrigation systems are used to leach the salts after leaf fall in deciduous tree plantations. Monitoring salinity is essential to anticipate possible problems, more so in dry areas and poor quality irrigation waters.
An important consideration in the case of salinity is that it is a gradual problem that in most cases takes time to build up. The limited experience with DI is that salts may be periodically controlled, even in dry areas, in the high-rainfall years or when irrigation supply conditions permit the return to full irrigation once every several years. Nevertheless, to sustain the plantations throughout their normal life cycle under DI, salinity monitoring and a sound management strategy for salinity control will be critical.
REFERENCESBerni, J.A.J., Zarco-Tejada, P.J., Suárez, L., & Fereres, E. 2009. Thermal and narrowband multispectral remote sensing
for vegetation monitoring from an unmanned aerial vehicle. IEEE Transactions on Geoscience and Remote Sensing 47: 722 – 738.
Bonachela, S., Orgaz, F., Villalobos, F.J. & Fereres, E. 2001. Soil evaporation from drip-irrigated olive orchards. Irrigation Science 20:65-71.
FAO. 2011. FAOSTAT online database, available at link http://faostat.fao.org/. Accessed on December 2011.
Fereres, E., Martinich, D.A., Aldrich, T.M., Castel, J.R., Holzapfel, E. & Schulbach, H.1982. Drip irrigation saves money in young almond orchards. California Agriculture 36:12–13.
Goldhamer, D.A., Viveros, M. & Salinas, M. 2006. Regulated deficit irrigation in almonds: effects of variations in applied water and stress timing on yield and yield components. Irrigation Science 24(2):101-114.
Orgaz, F., Testi, L., Villalobos, F.J. & Fereres, E. 2006. Water requirements of olive orchards II: determination of crop coefficients for irrigation scheduling. Irrigation Science 24:77-84.
Sadras, V.O. 2009. Does partial root-zone drying improve irrigation water productivity in the field? A meta-analysis. Irrigation Science 27: 183-190.
Testi, L., Villalobos, F.J., Orgaz, F. & Fereres, E. 2006. Water requirements of olive orchards: I simulation of daily evapotranspiration for scenario analysis. Irrigation Science 24:69-76.
Testi, L., Goldhamer, D.A., Iniesta, F. & Salinas, M. 2008. Crop Water Stress Index Is a Sensitive Water Stress Indicator in Pistachio Trees. Irrigation Science, 26: 395-405.
YIELD RESPONSE TO WATER OF FRUIT TREES AND VINES 295
ADDITIONAL READING Following are a number of general references on irrigation of fruit trees and vines that provide additional background and information to this Section.
Allen, R.G., Pereira, L.S., Raes, D. & Smith, M. 1998. Crop Water Requirements. FAO Irrigation and Drainage. Paper No. 56, Rome, FAO.
Ayers, R.S. & Westcot, D.W. 1985. Water quality for agriculture. FAO Irrigation and Drainage. Paper No. 29, Rome, FAO.
Behboudian, M.H., Girona, J., Marsal, J. & Lopez, G. 2010. Quality and yield responses of deciduous fruit to reduced irrigation. Horticultural Reviews. 21: 149-188.
Charlesworth, P. 2005. Soil water monitoring. Irrigation Insights No.1. Second Edition 96p. Available at: http://www.irrigationfutures.org.au/imagesDB/news/soilwatermonitoring2ed.pdf
Doorenbos, J. & Kassam, A.H. 1979. Yield Response to Water. FAO Irrigation Drainage. Paper No. 33, Rome, FAO.
Fereres, E., Goldhamer, D. & Parsons, L.R. 2003. Irrigation water management of horticultural crops. Historical Review Compiled for the American Society of Horticultural Science's Hundredth Anniversary. Horticultural Science 38(5):1036-1042.
Fereres, E. & Soriano, M.A. 2007. Deficit irrigation for reducing agricultural water use. Journal of Experimental Botany 58:147-159.
Fereres, E. & Goldhamer, D.A. 1990. Deciduous fruit and nut trees. In: Stewart, B.A. & Nielsen, D.R., eds. Irrigation of agricultural crops, American Society of Agronomy Monograph. No. 30, Madison, Wisconsin. pp. 987-1017. (Monograph)
Fereres, E. & Evans, R.G. (eds). 2006. Irrigation of Fruit Trees and Vines. Special Issue of Irrigation Science, 24:55
Girona, J., del Campo, J., Mata, M., Lopez, G. & Marsal, J. 2011. A comparative study of apple and pear tree water consumption measured with two weighing lysimeters. Irrigation Science. 29:55-63.
Jones, H. G. 2004. Irrigation Scheduling: advantages and pitfalls of plant-based methods. Journal of Experimental Botany, 55:2427-2436.
Lamm, F.R., Ayars, J.E. & Nakayama, F.S. 2007. Microirrigation for Crop Production. Volume 13: Design, Operation and Management. Elsevier Publications. 642p.
Marsal, J., Lopez, G. & Girona, J. 2008. Recent advances in regulated deficit irrigation (RDI) in woody perennials and future perspectives. Acta Horticulturae 792:429-439
Naor, A. 2006. Irrigation scheduling and evaluation of tree water status in deciduous orchards. Horticultural Reviews 32:111-166.
Shaffer, B. & Anderson, P.C. 1994. Handbook of Environmental Physiology of Fruit Crops: Temperate Crops, Volume I. Boca Raton, FL, USA, CRC Press.
White, S. & Raine, S.R. 2008. A growers guide for plant based sensing for irrigation scheduling. National Centre for
Engineering for Agriculture Publication 1001574/6, USQ, Toowoomba, Australia. 52 pp.