Embed Size (px)
Citation preview

The authors are solely responsible for the content of this technical presentation. The technical presentation does not necessarily reflect the official position of the American Society of Agricultural and Biological Engineers (ASABE), and its printing and distribution does not constitute an endorsement of views which may be expressed. Technical presentations are not subject to the formal peer review process by ASABE editorial committees; therefore, they are not to be presented as refereed publications. Citation of this work should state that it is from an ASABE meeting paper. EXAMPLE: Author's Last Name, Initials. 2012. Title of Presentation. ASABE Paper No. 12----. St. Joseph, Mich.: ASABE. For information about securing permission to reprint or reproduce a technical presentation, please contact ASABE at [email protected] or 269-932-7004 (2950 Niles Road, St. Joseph, MI 49085-9659 USA).
An ASABE Meeting Presentation Paper Number: 121338243
Yield Editor 2.0: Software for Automated Removal of Yield Map Errors
Kenneth A. Sudduth, Agricultural Engineer
Scott T. Drummond, IT Specialist
D. Brenton Myers, Soil Scientist
USDA-ARS Cropping Systems and Water Quality Research Unit, 269 Agricultural Engineering Bldg., University of Missouri, Columbia, MO 65211; contact email: [email protected]
Written for presentation at the 2012 ASABE Annual International Meeting
Sponsored by ASABE Hilton Anatole Dallas, Texas
July 29 – August 1, 2012
Abstract. Yield maps provide important information for developing and evaluating precision management strategies. The high-quality yield maps needed for decision-making require screening raw yield monitor datasets for errors and removing them before maps are made. To facilitate this process, we developed the Yield Editor interactive software which has been widely used by producers, consultants and researchers. Some of the most difficult and time consuming issues involved in cleaning yield maps include determination of combine delay times, and the removal of “overlapped” data, especially near end rows. Our new Yield Editor 2.0 automates these and other tasks, significantly increasing the reliability and reducing the difficulty of creating accurate yield maps. This paper describes this new software, with emphasis on the Automated Yield Cleaning Expert (AYCE) module. Application of Yield Editor 2.0 is illustrated through comparison of automated AYCE cleaning to the interactive approach available in Yield Editor 1.x. On a test set of fifty grain yield maps, AYCE cleaning was not significantly different than interactive cleaning by an expert user when examining field mean yield, yield standard deviation, and number of yield observations remaining after cleaning. Yield Editor 2.0 provides greatly improved efficiency and equivalent accuracy compared to the interactive methods available in Yield Editor 1.x.
Keywords. grain yield, combine delay time, yield map errors, precision agriculture
2
Introduction
Yield maps are a key component of precision agriculture, needed for both development and evaluation of precision management strategies. Development of yield maps that accurately represent actual field variation is complicated by the fact that raw yield data contain a variety of inherent errors (Blackmore and Marshall, 1996). Proper removal of these errors is critical, since they are present in a relatively large proportion of the data observations. For example, Blackmore and Moore (1999) reported that as many as 32% of the observations in one research field were removed when using their filtering algorithm, Thylén et al. (2000) removed from 10 to 50%, depending on the filtering technique applied, Simbahan et al. (2004) removed from 13 to 20%, and Sudduth and Drummond (2007) removed from 13 to 27%, Erroneous yield data can have a strong effect on the resulting yield distribution (Thylén et al., 2000; Sudduth and Drummond, 2007). If errors are not addressed, the user of the yield map may reach invalid conclusions, resulting in flawed management decisions.
Most common error sources have been well defined and described in the literature (i.e. Blackmore and Marshall, 1996; Moore, 1998; Blackmore and Moore, 1999, Thylén et al., 2000; Sudduth and Drummond, 2007). The error sources they noted included unknown header width, combine filling/emptying times, time lag of grain flow through the combine, positional errors, rapid velocity changes, and others. These researchers also noted the importance of addressing the errors and suggested different methods for removing them or minimizing their effects.
Currently, no standard method exists for cleaning raw yield data, although many different filtering or screening techniques have been suggested to address specific error types (e.g., Han et al., 1997;Blackmore and Moore, 1999; Drummond et al., 1999; Thylén et al., 2000; Beal and Tian, 2001; Beck et al., 2001; Arslan and Colvin, 2002; Chung et al., 2002; Yang et al., 2002; Simbahan et al., 2004; Lee et al., 2012). While many of these techniques could be implemented in a spreadsheet or in simple programming code, some would require a more sophisticated mapping or GIS application. Further, optimum selection of numerical parameters for the various filters often requires iterative manual interaction with map views of the changed dataset.
With the need for a map-based yield data cleaning application in mind, we developed a software tool called Yield Editor to simplify the process of applying filtering techniques for yield data outlier detection and removal (Sudduth and Drummond, 2007). Yield Editor includes a map view of the yield data, allowing the user to interactively set, assess the effects of, and refine a number of previously reported automated filtering methods. Additionally, Yield Editor allows manual selection of erroneous points, transects, or regions for investigation and possible deletion. This software was first released for public use in 2004, and over 3000 copies have been downloaded by users from many different countries. Many users provided positive feedback on how Yield Editor has improved their processing of yield data. In a case-study approach, Griffin et al. (2008) compared data cleaned by Yield Editor and by farm-level mapping software for evaluating different management scenarios. They reported that the two cleaning methods would support a different management recommendation over half the time, with the assumption that the more thorough cleaning done by Yield Editor was the more accurate approach.
One recurring comment received from users of Yield Editor 1.x (YE1) was their desire for a more automated yield data cleaning solution. In response, we developed Yield Editor 2.0 (YE2), which includes a module for automated selection of many yield filter values along with enhanced data visualization and a new command line interface that allows batch processing of data in

3
both automated and interactive modes. This paper describes YE2, with focus on the automated yield cleaning enhancements, followed by a comparison of the performance of automated and interactive yield data cleaning on a number of datasets.
Yield Editor Software Features
Interactive Data Filtering Methods
The core purpose of Yield Editor is to implement a suite of yield data filtering techniques. A brief description of each is given below. More information about each filter can be found in Sudduth and Drummond (2007).
Grain flow delay (DELAY) – This corrects for the transport time between the location where the crop is harvested and the location where flow rate is sensed. Because delay time can be affected by design of harvesting equipment, speed, ground slope, load, and other factors, it is best to determine the DELAY parameter value for the harvest conditions within a particular field.
Start pass delay (START) and End pass delay (END) – The START filter removes observations when entering each transect and the END filter removes data when exiting each transect. These filters eliminate points with low and unreliable yield estimates that are obtained as the harvester fills at the beginning and then empties at the end of each transect. If the START and END delay parameters are too small, the points with erroneously low yields that remain in the dataset will deflate the yield estimate and exaggerate the yield standard deviation.
Maximum velocity (MAXV) – This filter removes data points collected at velocities greater than the specified limit. It is particularly useful for removing partial swaths and observations where the operator may have kept the separator running and the header down without harvesting.
Minimum velocity (MINV) – The MINV filter removes points collected at velocities less than the specified limit. It assists in removing unrealistically high instantaneous spikes in the calculated yield that can occur as velocity approaches zero.
Smooth velocity (SMV) – This filter eliminates data where rapid velocity changes have occurred. The SMV parameter represents an allowable ratio of velocities from one point to the next point along a transect.
Minimum swath (MINS) – This filter removes data points with swath width readings smaller than the minimum such as in point rows or in partial swaths. The effectiveness of the MINS filter depends on the operator manually adjusting the swath indicator on the yield monitor; an action that the operator may not be willing or remember to do.
Maximum yield (MAXY) and minimum yield (MINY) – These filters set yield thresholds above (MAXY) and below (MINY) which points will be deleted.
Standard deviation of yield (STDY) – The STDY filter removes yield data that are more than a certain number of standard deviations from the field mean.
Position (POS) – This filter removes positional “flyers,” consisting of single points or data segments that lie outside the boundaries of the field of interest. If data points are within the field, but exhibit positional error, they can be deleted using the MAN filter described below.
Manual (MAN) – Due to the complex nature of the problems that can occur with equipment and sensors in the field, yield data will often include some data points which are clearly in error, yet are not easily captured by any of the above filters. The manual filter allows the user to select individual points, transects or regions for removal, addressing the case where other filters fail to recognize errors that are visually obvious.

4
Applying Interactive Data Filters
Yield Editor implements the filters described above with a map-based graphical user interface, making it simpler to iteratively determine and set parameters for the filters. The software includes several tools to assist the user with this process. The effects of individual filters can be highlighted and displayed via the on-screen map (fig. 1) at any time to indicate how effective the current filter settings were at removing errors and where these removals occurred. Statistics to indicate the number of points removed by each of the filters, as well as the effect on the yield mean, standard deviation, coefficient of variation, range, and number of observations are included and that data is updated with each new filter application.
Figure 1. User interface screens of Yield Editor. Both YE1 and YE2 incorporate the main “Yield Editor” map-based filtering screen, while YE2 adds the “Legend” dialog box and the “AYCE-
Automated Yield Cleaning Expert” screen.
In addition, Yield Editor provides the user a set of graphical selection tools to remove other points that can be identified as erroneous, but are not easily captured by any filter (see MAN

5
above). Once defined, the selection can be queried for basic statistics, histograms of input variables can be viewed, and the points can be deleted using the MAN filter. Advanced editing techniques also allow a selection of points that has been deleted by MAN (or by any other filter) to be reinstated if desired. A suggested sequence for applying interactive Yield Editor filters is given in figure 2. Interactive filtering is available in both YE1 and YE2.
Largeposit iona l
errors?
ApplyPOS
ApplyMAXY
Minimumyield > 0
reasonable?ApplyMINY
ApplyDELAY
ApplySTART/END
Varie dswaths
recorded?
U nreliablepasses
evident ?
ApplyMINS
Velocitye rrat ic?
St art s/st opscommon ?
ApplyMINV, SMV
Areas ofh igh-speed
harvest ?
ApplyMAXV
ApplySMV
Apply MAN
Start
End
Yes
Yes
Yes Yes
Yes Yes
Yes
No
No
No
No
No
No
No
Figure 2. Suggested sequence for applying Yield Editor filters in interactive mode. Shaded filters are required for all datasets, while others may or may not be needed in specific instances.
Automated Data Filtering Methods in Yield Editor 2.0
The main addition to YE2 is the “automated yield cleaning expert” (AYCE) module for automated selection of many yield filter values. The AYCE module consists of methods to automatically select parameters for several filters implemented in the original YE1, as well as several new techniques developed and/or implemented based upon previous research. With respect to previous filters, there are now options for automated selection of delay times (for grain flow and moisture) as well as automated selection of reasonable parameter ranges for the POS, MINY, MAXY, MINV and MAXV filters described above. Additionally, a new overlap filter removes partial swaths and areas where a significant percentage of the swath had been previously harvested in an earlier combine pass. Finally, a localized standard deviation (SD) filter helps remove abrupt, local outliers in the yield data sets.

6
Automated delay time determination is based upon the phase correlation delay identification (PCDI) method developed by Lee et al. (2012), which successfully selects an appropriate value for delay time in most cases. The PCDI method is very computationally efficient compared to other methods of delay time determination such as the geostatistical method of Chung et al. (2002), providing results in a reasonable period of time, even for large datasets. Furthermore, if it is unsuccessful in determining a delay time, either default or manual settings can be used to override the automated result. Figure 3 shows the YE2 AYCE results for grain flow and moisture delay determination by PCDI on two test fields. The PCDI method is executed ten times for both the grain flow and moisture delay data, with a different randomization of the Gaussian white noise mask (Lee et al., 2012) each time. The red dots in figure 3 show the normalized relative spatial consistency (RSC) of each possible delay time, for each of the ten iterations. The blue lines represent an average of the results across these iterations, with the optimum delay given by the maximum average RSC. For the top two panels, the data is somewhat noisy between iterations; however, the averages are much less noisy, indicating that a grain flow delay of 0 s and a moisture delay of 2 s would be optimum. For the bottom two panels, the results are a bit different. In the left panel grain flow delay is well behaved across all ten iterations, giving a high degree of confidence that the actual delay time should be approximately 15 s. However, the moisture delay results are extremely variable across iterations, and as a result the computed 17 s moisture delay is somewhat suspect as noted by the yellow “caution” border in figure 3. This is an example of one of the poorest fits that would still be accepted by AYCE, albeit with a warning to the user. Results having greater variability among individual predictions would be rejected by AYCE, and manual or default delay parameters would need to be used instead.
Figure 3. Results from PCDI method grain flow and moisture delay time computations for two test fields. Optimum flow delay and moisture delay for field 1 (top) were 0 s and 2 s,
respectively. Optimum flow delay and moisture delay for field 2 (bottom) were 15 s and 17 s, respectively; however the moisture delay accuracy was suspect due to high variability.

7
Automated parameters for the POS, MINV, MAXV, MINY, and MAXY filters were determined by analysis of the histograms of these variables in the raw data. Figure 4 demonstrates the automated procedure that was used for determining how to set the limits for the MINY and MAXY parameters. First, upper [Q(YUlim)] and lower [Q(YLlim)] quantiles of the yield distribution were computed at values indicated by parameters YUlim and YLlim. Next, the inter-quantile range was computed. To compute MINY and MAXY, the upper and lower quantile values were expanded outward by a percentage of the inter-quantile range indicated by Yscale. One last parameter, MINYabs was the absolute smallest value to be allowed for MINY, and computations which resulted in a MINY value smaller than this limit were assigned this value.
Figure 4. Sample yield distribution and method for computing automated MINY and MAXY filter parameter values.
The same method was used for computing the MINV and MAXV filter settings, although different parameter names (VLlim, VUlim, Vscale and MINVabs) and values were used for computing the velocity filter parameters. For the POS filter, a similar, slightly simpler procedure was used. Parameters GLlim and GUlim were used to find the inter-quantile ranges for both the easting and northing distributions. However, once those limiting coordinates were found, a single buffering distance Gbuffer was extended in all four directions from this inter-quantile bounding box. This had the desired effect of removing major positional “flyers” as well as small sections of data that might have been created outside the field (e.g., in transit, at another field, etc.).
The overlap filter, used to remove observations where the combine was travelling over a previously harvested area was based on the bitmap method of Han et al. (1997). The method produces a bitmap with a cellsize (Csize) that can be user selected, with each cell in the bitmap initialized to a value of “unharvested”. If high-quality GPS position data are available, small values for Csize could potentially provide higher accuracy for the method, but at the cost of additional memory and processing time. We found a value for Csize of 30 cm to be suitable, and this is the current default setting in YE2. Figure 5 illustrates the basics of the bitmap method. During a given time interval, the combine header moves forward a discrete distance, creating a “harvested” polygon P. Each of the grid cell centers that falls inside P is checked to see

8
whether it is already marked (e.g. harvested) or unmarked. The ratio of marked cells to total cells inside P, termed the overlap ratio, is computed, and then all of the cells inside P are flagged as marked. If a polygon has an overlap ratio above a certain threshold parameter (MAXratio), indicating that a significant portion of the area has already been harvested, then the yield data point associated with that polygon is flagged for removal by the bitmap filter. We found this method to be extremely effective at removing overlapped data on fields harvested with a single combine, assuming reasonably good GPS data and that the harvest data were properly sorted in chronological order. Data from fields harvested with multiple combines would need to be chronologically sorted across all combines before the overlap filter could be applied. Poor GPS accuracy will limit overlap filter utility.
Figure 5. Illustration of the YE2 implementation of the bitmap method developed by Han et al. (1997) for removal of overlapped harvest areas. See text for details.
The localized SD filter helps to catch spikes and fliers that are obviously out of place compared to their neighbors. This filter operates by producing a square grid of resolution equal to an integer multiple (LSDhdrs) of combine header widths after implementing the POS filter which defines the field extent. Within each grid cell, the mean and standard deviation of the yield are computed. Observations outside of the range of plus or minus LSDlim standard deviations are removed by this filter. The localized SD filter is effective at catching fliers missed by the SMV, MINV, MAXV, MINY, and MAXY filters, as well as reducing the effect of ramping at the border between end rows and the interior field passes.
Functionally, the new features of the YE2 AYCE can greatly reduce the time spent cleaning yield data. However, the interactive nature of the original YE1 is still retained. Figure 6 shows the basic flow of operation for YE2. The automated filters, if selected, can provide a high level of rapid, hands-free error removal. Additionally, the user can explore interactive filtering as described in figure 2. If both filtering methods are to be used, we recommend first using the automated AYCE methods and then following that with any interactive filtering that is desired.

9
Figure 6. Sequence for applying Yield Editor 2.0 automated and interactive filtering methods. Interactive methods are described in more detail in figure 2.
Legend Features
The legend tool was implemented in YE2 to help the user set filter parameters more accurately, as well as to make exploration of the data more informative. Data which can be displayed by the legend tool include yield, moisture, velocity, grain flow, swath width and overlap ratio (if the automated bitmap method was run). This makes it much easier for the user to find “oddities” in the data, and to help diagnose possible problems within the data. There is also an option to select equal intervals for the ten color classes, which divide the data range up into 10 equal width intervals, or to select equal observations, which places 10% of the data observations within each of the ten color classes. The first method is useful to help find individual spikes and flyers, while the second is often useful for accentuating the structure of spatial trends when the yield of the field is relatively uniform. This can highlight thresher delay lags across linear and areal features, assisting in the interactive selection of delay times.
Data Import and Export
There are several options available in YE1 and YE2 for importing data into a Yield Editor session. The most straightforward method is to import data in either AgLeader1 (AgLeader
1 Mention of trade names or commercial products is solely for the purpose of providing specific
information and does not imply recommendation or endorsement by the USDA.

10
Technologies, Ames, IA) advanced format or Greenstar (Deere & Co., Moline, IL) text format. If the yield monitor data is not in one of these formats, a spreadsheet application can be used to rearrange the data, saving in a tab, space, or comma delimited format. Yield Editor requires position, grain flow, logging interval, distance, swath width, and pass number to be included in the column locations corresponding to the AgLeader advanced or Greenstar text formats. A second import option allows accessing yield data in the native binary format present on the data card used by the yield monitor for storage. This is accomplished by opening the binary card image in a freeware package called FOViewer (MapShots, Inc., Cumming, GA). FOViewer “field operation device drivers” (FODD) are available for all major yield monitoring systems to interpret the binary data records. It then provides a map of the data on the card and allows the user to select any desired subset. Once a dataset is selected, Yield Editor can be launched from within FOViewer with that dataset ready for analysis. Another import option is provided by the Yield Editor session file described in the next paragraph.
Data can be exported from Yield Editor in three ways. The native file format for saving a Yield Editor session is the session file (*.yes). These files allow the user to store the current or final state of each data point as well as the current or final state of each filter and associated parameter settings. Session files also include metadata regarding file I/O and include provision for user notes. Session files were designed to package the settings and results of the entire data filtering process to facilitate easy sharing of the information among multiple individuals working with the same dataset. A second option is to export the data in a user-defined text format. Finally, FOViewer also provides output options if Yield Editor was launched from within FOViewer, including text, database (.dbf), and shapefile formats.
Command Line Interface and Batch Processing Modes
The new command line interface in YE2 allows the user to execute YE2 with specific options and to perform automated processing of multiple yield data files as defined in a Yield Editor batch file (*.bat). The user can direct the import of AgLeader advanced text, Greenstar text, or *.yes files. The command syntax includes settings or a settings file(s) that include the default filters to be run and the associated parameter settings for each yield data file. Users can choose for YE2 to run in completely automated mode, completely interactive mode, or in a combination mode where the user can choose to accept or reject the automated results, modify parameters, and/or interactively clean the data to suit their needs. They can specify the export format and path, as well as whether a finished *.yes file should be retained. A logging facility allows review of batch cleaning processes and archiving of metadata such as processing time-stamps, the success or failure of PCDI filters, file paths, and pre- and post-cleaning yield statistics. Complete details of the command line interface syntax are included in the latest manual.
To implement several of these new features, the *.yes file format was modified in a largely backwards compatible manner. YE1 files can still be read by YE2 and vice-versa. However, when reading YE2 files that include application of new filter types into YE1 some of the functionality (e.g. data previously removed by the overlap filter in YE2) will be lost.
Comparing Interactive and Automated Yield Data Cleaning
Methods
Interactive and automated yield data cleaning procedures were compared on a set of 50 yield maps. These were sampled from a data warehouse of yield maps stratified by producer (n = 7), year (variable per producer), and crop (corn or soybean). This selection ensured a variety of

11
field configurations and harvest patterns; multiple combines, operators, and yield monitors; variability in crop harvesting conditions; and a range in the required delay corrections.
For the automated filters, the parameter values used in the AYCE methods described above are listed in table 1. These are the default values currently implemented in YE2. While perhaps not optimal for every field, these values work reasonably well over a wide variety of field sizes, shapes and harvest complexities. Interactive yield data cleaning was done by an expert user, who had previously used YE1 to process many yield maps.
Table 1. Parameter values used for automated yield cleaning by AYCE module.
Filter Parameter Value Units
POS GLlim 0.005 GUlim 0.995 Gbuffer 40 m
MAXY, MINY YLlim 0.100 YUlim 0.990 Yscale 0.25 MINYabs 1 bu/a
MAXV, MINV VLlim 0.080 VUlim 0.990 Vscale 0.18 MINVabs 0.5 mph
Overlap Csize 0.3 m MAXratio 0.5 headers
LSD LSDhdrs 5 SDs LSDlim 3 SDs
Results and Discussion
Statistics for uncleaned and cleaned datasets are given in table 2. One can readily see that the overall effect of interactive and automated cleaning on the fifty test datasets was similar. Yield mean, standard deviation, and number of points remaining were not significantly different between the two methods. The range of yield values was slightly larger for interactive cleaning, as was the CV. Overall, of the yield observations retained by the two cleaning methods, 95% were in common, giving further evidence that the two methods behaved similarly.
Table 2. Yield statistics for uncleaned, interactively cleaned and automatically cleaned yield data sets. Within a column entries with the same letters are not significantly different at α = 0.05.
Mean SD N Min Max CV
Uncleaned 69.4a 34.3a 10065a 1.2a 1387.2a 0.52a Interactive cleaning 75.5b 18.0b 8750b 11.6b 135.2b 0.25b Automated cleaning 75.4b 17.4b 8757b 20.9c 131.4c 0.24c
12
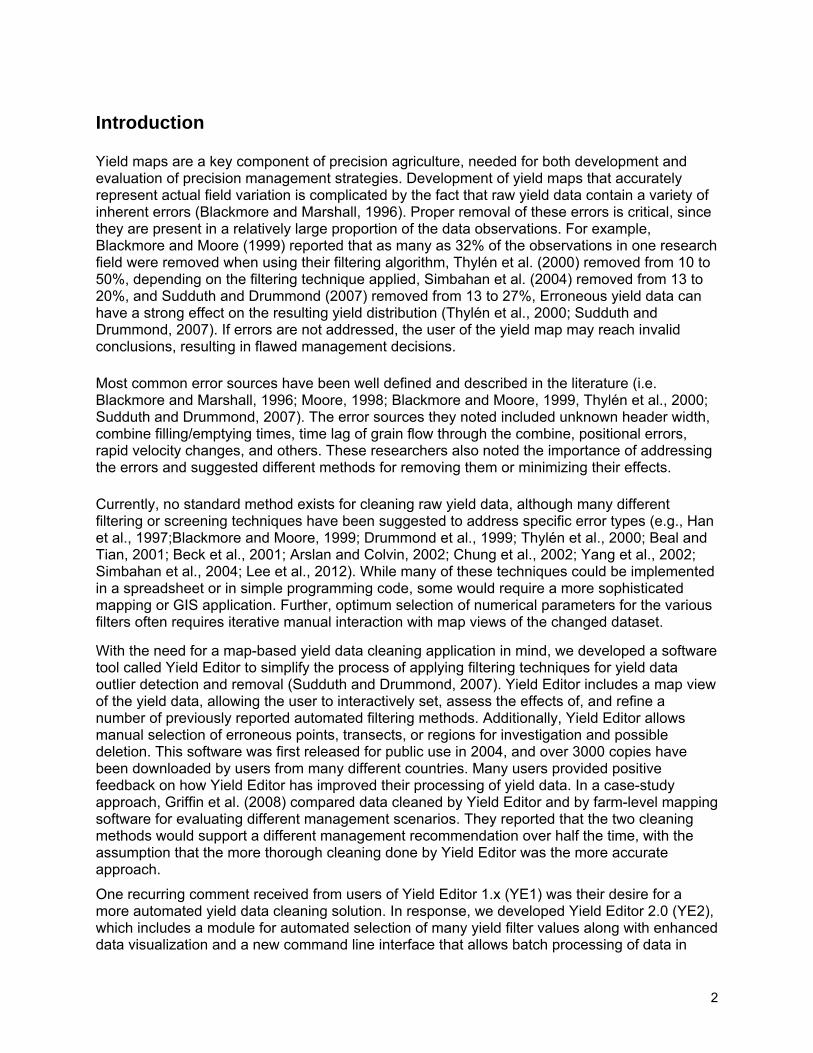
The relationships between interactively-cleaned and AYCE-cleaned data were examined in more detail by plotting cleaned vs. uncleaned mean yield and yield standard deviation (fig. 7). The regression of cleaned on uncleaned mean yield was almost identical between the two cleaning methods, and mean yields by the two cleaning methods were very similar on a field-by-field basis. The amount of reduction in yield standard deviation after cleaning varied considerably between fields, but again the interactive and automated methods behaved similarly, resulting in by-field standard deviations that were generally very similar. Figure 8 shows the number of yield observations for each field in the test set. Again the regression relationship between cleaned and uncleaned numbers was almost identical for the two cleaning methods.
Figure 7. Comparison of mean yield (left) and yield standard deviation (right) among uncleaned, interactively cleaned, and AYCE-cleaned yield maps.
Figure 8. Comparison of number of yield data observations remaining after interactive and AYCE cleaning of test set yield maps.

13
Summary
The new Yield Editor 2.0 software provides a major upgrade to our previous Yield Editor 1.x. The main improvement is the addition of the Automated Yield Cleaning Expert (AYCE) module that selects appropriate filter parameter values and applies yield data filters without operator intervention. Additionally, a batch mode allows queuing up multiple yield data files for AYCE automated cleaning, interactive cleaning, or a combination of both.
Performance of automated AYCE filtering was compared to the interactive filtering available in Yield Editor 1.x on a test set of fifty grain yield maps. AYCE cleaning was not significantly different than interactive cleaning by an expert user when examining field mean yield, yield standard deviation, and number of yield observations remaining after cleaning. Yield Editor 2.0 provides greatly improved efficiency and equivalent accuracy compared to Yield Editor 1.x.
References Arslan, S., and T. S. Colvin. 2002. Grain yield mapping: Yield sensing, yield reconstruction, and
errors. Precision Agric. 3(2): 135-154.
Beal, J. P., and L. F. Tian. 2001. Time shift evaluation to improve yield map quality. Applied Eng. Agric. 17(3): 385-390.
Beck, A.D., S.W. Searcy, and J.P. Roades. 2001. Yield data filtering techniques for improved map accuracy. Appl. Eng. Agric. 17(4):423-431.
Blackmore, B. S., and C. J. Marshall. 1996. Yield mapping: Errors and algorithms. In Proc. 3rd Intl. Conf. Precision Agriculture, 403-416. P. C. Robert, R. H. Rust, and W. E. Larson, eds. Madison, Wisc.: ASA, CSSA, and SSSA.
Blackmore, B.S., and M. Moore. 1999. Remedial correction of yield map data. Precision Agric. 1:53-66.
Chung, S. O., K. A. Sudduth, and S. T. Drummond. 2002. Determining yield monitoring system delay time with geostatistical and data segmentation approaches. Trans. ASAE 45(4): 915-926.
Drummond, S.T., C.W. Fraisse, and K.A. Sudduth. 1999. Combine harvest area determination by vector processing of GPS position data. Trans. ASAE 42(5):1221-1227.
Griffin, T.W., C.L. Dobbins, T.J. Vyn, R.J.G.M. Florax, and J.M. Lowenberg-DeBoer. 2008. Spatial analysis of yield monitor data: case studies of on-farm trials and farm management decision making. Precision Agric. 9: 269-283.
Han, S., S.M. Schneider, S.L. Rawlins, and R.G. Evans. 1997. A bitmap method for determining effective combine cut width in yield mapping. Trans. ASAE 40(2): 485-490.
Lee, D. H., K. A. Sudduth, S. T. Drummond, S. O. Chung, and D. B. Myers. 2012. Automated yield map delay identification using phase correlation methodology. Trans. ASABE 55(3): (in press).
Moore, M. 1998. An investigation into the accuracy of yield maps and their subsequent use in crop management. PhD diss. Silsoe, U.K.: Cranfield University, Silsoe College.
Simbahan, G.C., A. Dobermann, and J.L. Ping. 2004. Screening yield monitor data improves grain yield maps. Agron. J. 96:1091-1102.
Sudduth, K. A., and S. T. Drummond. 2007. Yield editor: Software for removing errors from crop yield maps. Agron. J. 99(6): 1471-1482.

14
Thylén, L., P.A. Algerbo, and A. Giebel. 2000. An expert filter removing erroneous yield data. In Proc. 5th Intl. Conf. on Precision Agriculture [CDROM]. P. C. Robert, R. H. Rust, and W. E. Larson, eds. Madison, Wisc.: ASA, CSSA, and SSSA.
Yang, C., J. H. Everitt, and J. M. Bradford. 2002. Optimum time lag determination for yield monitoring with remotely sensed imagery. Trans. ASAE 45(6): 1737-1745.