Embed Size (px)
Citation preview

53
CHAPTER 3
FIELD SITES, MONITORING AND MODELLING
3.1 Introduction
In this Chapter, a detailed description of the field sites, the monitoring undertaken and
modelling and data processing, is presented. For the field site description, the location and
experimental layout, the soil conditions, irrigation water qualities and cropping systems are
also described. This will highlight the wide range of conditions investigated in this study.
Under monitoring, the equipment used and the measurements taken on atmospheric
evaporative demand, crop growth and nutritional status, soil water balance components and
salt balance measurements are described. Finally, in the brief description of the modelling
section, the approach taken to process the data and model the root zone soil water and salt
balance, is given.
3.2 Field site locations and experimental layout
The study was carried out at four mines: Kleinkopjé Colliery near Witbank, New Vaal
Colliery near Vereeniging, Syferfontein near Secunda and Waterberg CBM pilot project near
Lephalale. Two irrigation systems were designed for the Waterberg CBM irrigation trial: drip
and sprinkler that were set up on separate blocks. The remaining sites were centre pivot
irrigated.
3.2.1 Kleinkopjé
This Anglo Coal-mine is located in Mpumalanga Province (Latitude 26o28’S, Longitude
28o75’E, Altitude 1570 m). Pivot Major (30 ha) and Pivot Tweefontein (20 ha), abbreviated
as TWF, is on rehabilitated open cast soils. These two fields have been irrigated with mine
water since 1997. Pivot Four (30 ha) is a virgin site that has been irrigated since the winter
season of 1999. Figure 3.1 shows the position of the pivots (Pivot Major, Pivot TWF and
Pivot Four) and Figure 3.2 shows the experimental layout of Pivot Major, Pivot Four and
Pivot TWF. Figure 3.2 includes the position of intensive monitoring sites and runoff weirs.
During the 2000/01summer season at Kleinkopjé, two adjacent intensive monitoring stations
were installed in the maize fields of all three pivots. Two adjacent intensive monitoring

54
stations were also installed during the 2001/02 season in Pivot Four, which was planted to
potatoes at the time. In all other seasons at Kleinkopjé, as well as the other sites, a single
intensive monitoring station was installed in each field.
Figure 3.1 Topographic map of the Kleinkopjé area, indicating the position of Pivot Major,
Pivot Four and Pivot TWF
17000 18000 19000 20000 21000 22000 23000 24000 25000
-2873000
-2874000
-2875000
-2876000
-2877000
-2878000
-2879000
LEGENDPivot 1
Pivo t 4
Pivot TWF
Pivot Major
Pivot Four
55
a) Pivot Major (30ha) b) Pivot Four (30ha)
c) Pivot TWF (20ha)
Wheel tracks
Intensive monitoring station and plant and soil sampling sites
Areas occasionally waterlogged during summer
Main direction of slope
Figure 3.2 Experimental layout of the irrigated fields at Kleinkopjé

56
88000 90000 92000 94000 96000 98000
-2952000
-2954000
-2956000
-2958000
Pivot New Vaal
3.2.2 New Vaal
This Anglo Coal-mine is in Free State Province (Latitude 26o42’ S, Longitude 27o55’ E,
Altitude 1432 m), and is located on the Southern bank of the Vaal River. The 10 ha field is
placed close to the river in an area that had been mined in the past by underground mining
method. Figure 3.3 shows the position of the field and Figure 3.4 shows the experimental
layout of the Pivot. Monitoring at this site started in November 2001. This site was already
erected before by the mines before the experiment was started. Unfortunately, the positioning
of this site was inappropriate, as internal drainage problems plagued the research.
Figure 3.3 Topographic map of the New Vaal area

57
Wheel tracks
Intensive monitoring station and plant and soil sampling sites
Areas occasionally waterlogged during summer
Main direction of slope
Figure 3.4 Experimental layout of the irrigated fields at New Vaal

58
3.2.3 Syferfontein
This Sasol Coal-mine is in Mpumalanga Province (Latitude 23o64’ S, Longitude 29o20’E,
Altitude 1570 m). The 20.6 ha field had received some irrigation with mine water before the
trial commenced, so the research did not begin with pristine conditions. Figure 3.5 shows the
regional setting of the irrigation site and Figure 3.6 shows experimental layout of this field,
which includes intensively monitored plots.
Figure 3.5 Regional setting of Syferfontein irrigation site
Tr ichardt
E van der
P iv ot Sy fer f on te in
Is ibonelo O ffices
10000 12 500 15000 1 7500 2000 0 22 500 2500
-291750 0
-292000 0
-292250 0
-292500 0
-292750 0
-293000 0
-293250 0

59
Wheel tracks
Intensive monitoring station and plant and soil sampling sites
Main direction of slope
Figure 3.6 Experimental layout of the irrigated fields at Syferfontein.
3.2.4 Waterberg
The Waterberg CBM pilot project is in the Limpopo Province (Latitude 23o68’N, Longitude
27o70’S and Altitude 839 m), located 30 km North West of Lephalale (Ellisras). The
irrigation site selected was in the natural veld approximately 100 m from the CBM production
water reservoir. The total area of the site was 1440 m2. Figures 3.7 to 3.10 show a schematic
diagram and experimental layout of the drip and sprinkler irrigation systems.

60
46B1
FCR1
23R2
23B1
FCB2
46R3
FCB1
FCR4
46B2
FCR2
FCR2
46R4
46R1
23R1
FCB4
23B2
46R2
23B3
FCB3
23R4
46B3
23B4
46B4
23R3
FC irrigation to field capacity (FC)
23 leaching fraction of 23% that applies 30% more water than that
needed to return the profile to FC
46 leaching fraction of 46% that applies 85% more water than that
needed to return the profile to FC
R Ryegrass/rye
B Barley
The subscript indicates replicate number.
Figure 3.7 Schematic layout of the drip irrigation trial treatment (winter 2005) at Waterberg
Figure 3.8 Drip irrigation system layout for the CBM irrigation trial at Waterberg
24 m
30 m

61
Sprinklers R Ryegrass/rye
B Barley
Figure 3.9 Schematic presentation of the line source Sprinkler irrigation system layout (winter,
2005) at Waterberg
Figure 3.10 Line source irrigation system layout for the CBM water irrigation trial at Waterberg
R
R
R
R
R
R
R
R
R
R
R
R
B
B
B
B
B
B
B
B
B
B
B
B
36 m
20 m

62
3.3 Cropping systems
The cropping systems include 18 growing seasons for TWF, 17 growing season for Major and
15 seasons of different cropping systems at Pivot Four, 7 growing seasons at New Vaal and
nine harvests at Syferfontein. In the Waterberg, two irrigation trials were carried out in the
winter season 2005 and summer 2005/06 seasons. Each growing period included records of
leaf area index (LAI), dry matter (DM), plant chemical analysis, and volumetric water content
measurements with a neutron water meter (NWM) and soil solution chemical analysis results.
3.3.1 Kleinkopjé
The fields at Kleinkopjé were cropped to annual cash crops, and these included maize, wheat,
sugarbeans and potatoes. The yields of maize and wheat are expressed as air-dry grain masses,
whilst potato and sugarbeans are fresh mass. An example of maize irrigated with gypsum rich
mine water is in Figure 3.11.
Figure 3.11 Maize irrigated with gypsiferous mine water at Pivot Major
3.3.2 New Vaal
At first wheat and maize were the crops of choice, and then an attempt was made to produce
vegetables such as peas, sweetcorn, pumpkin and soybean. An example of Sweet corn grown
at New Vaal is shown in Figure 3.12.
63
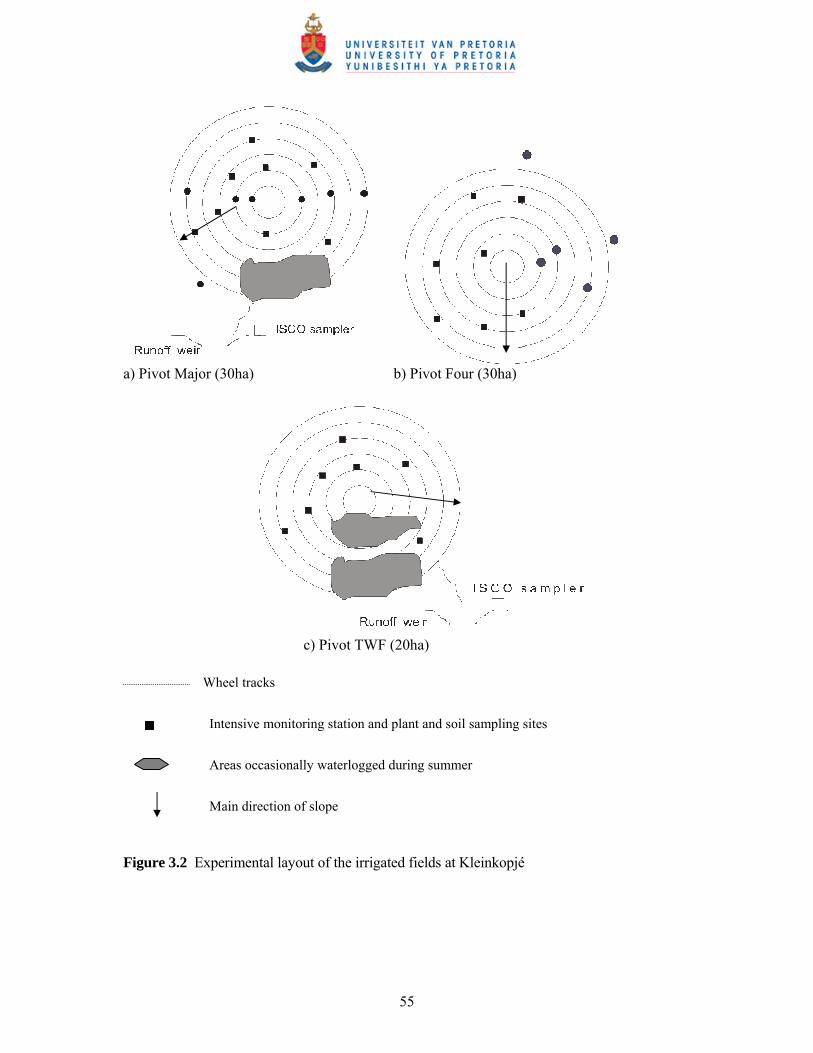
Figure 3.12 Sweetcorn irrigated with gypsiferous mine water at Pivot New Vaal
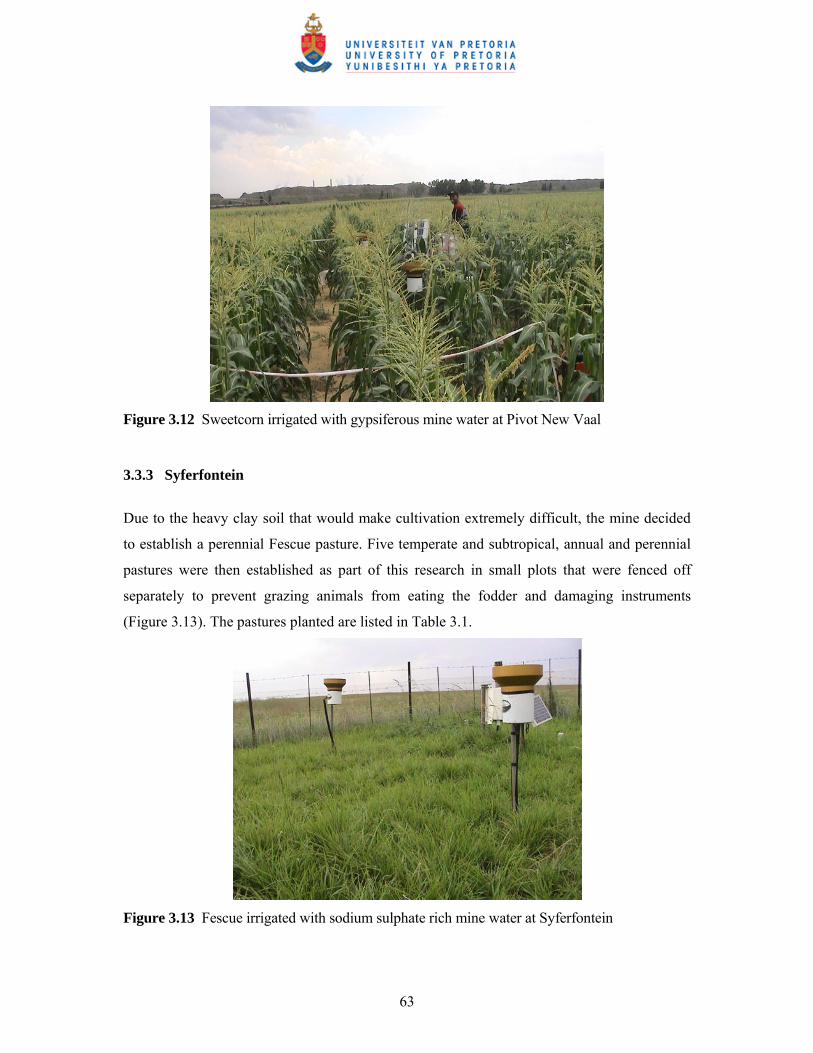
3.3.3 Syferfontein
Due to the heavy clay soil that would make cultivation extremely difficult, the mine decided
to establish a perennial Fescue pasture. Five temperate and subtropical, annual and perennial
pastures were then established as part of this research in small plots that were fenced off
separately to prevent grazing animals from eating the fodder and damaging instruments
(Figure 3.13). The pastures planted are listed in Table 3.1.
Figure 3.13 Fescue irrigated with sodium sulphate rich mine water at Syferfontein

64
Table 3.1 Annual and perennial, temperate and subtropical pasture crops planted (Syferfontein)
Planted pastures (Common name)
Scientific name
Classification
Fescue (cv. Iewag)
Festuca arundinaceae
Perennial Temperate
Lucerne (cv. SA standard)
Medicago sativa Perennial Temperate
Fescue (cv. Demeter) Festuca arundinaceae Perennial Temperate
Eragrostis Eragrostis curvula Perennial Subtropical
Kikuyu Pennisetum clandestinum Perennial Subtropical
Ryegrass (cv. Midmar) Lolium multiflorum cv. Midmar Perennial Temperate
3.3.4 Waterberg
Salt tolerant crops of barley (Hordeum vulgare cv. Puma), and a mixture of an Italian ryegrass
(Lolium multiforum cv. Agriton (Diploid)) and stooling rye (Secale cereale cv. Echo) were
planted in the 2005 winter season (Figure 3.14), whereas cotton (Gossypium hirsutum cv.
Opal) and Bermuda grass (Cynodon dactylon cv. K11) were planted in the summer 2005/06
season (Figure 3.15).
Harvests for the Waterberg CBM trial are presented for the winter 2005 and summer 2005/06
experiments. Barley and ryegrass were harvested before they reached maturity, as infiltration
became problematic and ponding occurred. Bermuda grass was harvested when it reached the
flowering stage and yield was determined. Cotton was harvested three times by hand from
April to May 2006, and lint quality (uniformity (%), length (cm), micronaire (µg cm2),
strength (grams per tex)), seed cotton mass (g) were determined using a laboratory gin by
Cotton South Africa, in Pretoria. Uniformity (%) shows the degree to which the fibres in a
sample are uniform based on the ratio of mean length to the upper half mean length. Length
(cm) describes the average length of cotton fibres after the ginning process. Micronaire (µg
cm-2) quantifies the mass of an individual cotton fibre taken in cross-section. Strength
expresses the force required to break a bundle of fibres in grams per tex (a tex unit is equal to
the weight in grams of 1,000 meters of fibre). Seed cotton (g) represents the mass of unginned
cotton.

65
Figure 3.14 Barley irrigated with sodium bicarbonate rich CBM deep aquifer water at
Waterberg (winter 2005)
Figure 3.15 Cotton and Bermuda grass irrigated with sodium bicarbonate rich CBM deep aquifer
water at Waterberg (summer 2005/06)
3.4 Soil
This section discusses the soil classification, depth, texture and initial soil salinity of the
irrigated fields at the different mines, summarised in Table 3.2.

66
Table 3.2 Soil classification, depth, texture and initial saturated soil salinity (ECe) of the
irrigated fields on the different mines.
All the fields except Pivot Four and Waterberg CBM irrigation trial, experienced poor internal
drainage problems, which reduces yields. Pivot TWF showed a marked reduction in hydraulic
conductivity at the soil-spoil interface, and this has resulted in regions of waterlogging,
especially in the summer when we had less control over the water balance. The Syferfontein
pivot was on a very heavy clay soil that naturally limits drainage, and therefore did not
present an ideal site for irrigation. The Waterberg soil was a coarse sand with low percentage
of clay and silt in the 0-20 cm. The clay percentage increased to 11% in the 60-80 cm depths.
The biggest problems, however, were found on the site with the lightest texture of all, New
Vaal. This was due to clay lenses and the level of the buffer dam next to the field (Figure
3.16).
Colliery and field Soil classification
Soil depth (m)
Texture (%)
Initial ECe
(mS m-1) Major Bainsvlei,
Clovelly ~ 1.0 Loamy sand
(Clay 12%) 60 (1997/98)
TWF Witbank/rehab. ~ 0.9 Sandy loam (Clay 17%)
40 (1997/98)
Kleinkopjé
Pivot Four Hutton > 2.0 Sandy loam (Clay 14%)
50 (1999/00)
Syferfontein Arcadia ~ 0.5 Clay (64%) 160 (2001/02) New Vaal Clovelly,
Dundee, Oakleaf
> 1.4 Sand (98%) 10 (2001)
Waterberg CBM
Hutton 1.4 Loamy sand Clay (9%)
42 (2005)

67
Figure 3.16 Waterlogging at New Vaal during the early growth stage of Pumpkins
3.5 Water qualities
3.5.1 Kleinkopjé and New Vaal
The EC of New Vleishaft Dam water, which irrigates Pivot Major started off at around 250
mS m-1 in 1997, but climbed steadily to a value of 320 mS m-1 by the end of 2005 (Figure
3.17a). Sulphate levels over this period climbed from 1500 mg ℓ-1 to 3000 mg ℓ-1 (Figure
3.17d) whilst pH remained around 6.5, within the range that could favour good crop growth
(Figure 3.17b). K, Na and Cl fluctuated between 5 and 30 mg ℓ-1 and Mg between 150 and
300 mg ℓ-1 over the growing period. Ca, however, remained quite stable at 500 mg ℓ-1, during
the trial period. Ca, SO4 and Mg clearly dominated this water.
At Tweefontein pan, a dam which irrigates Pivot Four and Pivot TWF, the EC of the water
started off a little higher than that of New Vleishaft Dam water in 1998, which was around
300 mS m-1 and was fairly stable for several years until 2001 (Figure 3.17a). A rapid increase
in EC to a level of 500 mS m-1 was observed by the end of 2005 and decreased to 450 mS m-1
in 2006. pH remained around 7.5 and was higher than that of New Vleishaft Dam (Figure
3.17b). Sulphate levels over this period increased from 2500 mg ℓ-1 to 4000 mg ℓ-1 (Figure
3.17c). Ca increased from 400 mg ℓ-1 to 600 mg ℓ-1. Mg fluctuated between 200 and 300 mg
ℓ-1 over the growing period. Na, K and Cl, however, remained quite stable-with Na at 80 mg
ℓ-1, K at 25 mg ℓ-1 and Cl around 50 mg ℓ-1 during the trial period. The deterioration of water

68
quality resulted from the increase of Ca, Mg and SO4 concentrations in the water.
The dam, which irrigates pivot New Vaal, contains water with EC of around 130 mS m-1 and
TDS around 1000 mg ℓ-1 (Figures 3.17a and 3.17e), and this water is predominantly rich in
NaCl with some Ca and Mg. Na fluctuated between 15 and 300 mg ℓ-1 Cl between 6 and 132
mg ℓ-1, Ca between 26 and 250 mg ℓ-1, and Mg between 6 and 94 mg ℓ-1. K was only present
in small quantities in the irrigation water.

69
A
0
100
200
300
400
500
600
1998 1999 2001 2002 2004 2005 2006 2008Year
EC (m
S m
-1)
Tweefontein Pan N ew Vleishaft dam New Vaal
B
3
4
5
6
7
8
9
10
1998 1999 2000 2001 2002 2004 2005 2006 2007Year
pH
Tweefontein Pan New Vleishaft dam New Vaal
C
Tweefontein Pan
010002000
3000400050006000
70008000
1999 2001 2003 2005 2007
Year
mg
l-1
TDSSO4
D
New Vleishaft dam
0
10002000
3000
4000
50006000
7000
8000
1998 2001 2004 2007
Year
mg
l-1
TDS
SO4
E
New Vaal
0250500750
10001250150017502000
1997 1999 2001 2003
Year
mg
l-1
TDSSO4
Figure 3.17 Irrigation mine water qualities of Kleinkopie and New Vaal

70
3.5.2 Syferfontein
At Syferfontein, water quality did not change during the experimental period (October 2001-
May 2004) (Table 3.3).
Table 3.3 Typical irrigation water quality of the Syferfontein coal-mine
3.5.3 Waterberg
The CBM deep aquifer water had highly elevated levels of salinity and sodicity, relative to
water resources routinely used for irrigation. TDS is very high (5.1 g ℓ-1) and rich in sodium
bicarbonate with low chloride levels and high sulphate. Concentrations of most trace elements
are low (< 1 mg ℓ-1). Crops vary in their response to irrigation water salinity. According to
FAO irrigation water quality guideline, the EC of the CBM water is higher than the threshold
level specified for severe restriction to crop growth (300 mS m-1). The degree of restriction on
use for this water is, therefore, severe for sensitive and moderately sensitive crops. For
moderately tolerant and tolerant crops, the severity is related to the yield reduction.
The normal range of pH of irrigation water is 6.5-8.4. A pH value outside this range could
cause a nutritional imbalance. pH of the CBM water remained around 7.5 during the trial
period, which is in the range that could favour good crop growth.
Chemical analysis
mg l-1
mmol l-1
Ca 32 0.8
Mg 87.6 3.7
Na 795.8 34.6
K 16.4 0.4
SO4 1647 17.2
Cl 17.8 0.5
pH 8.9 -
EC mS m-1 372
SAR (mmol l-1)0.5 16.32
71
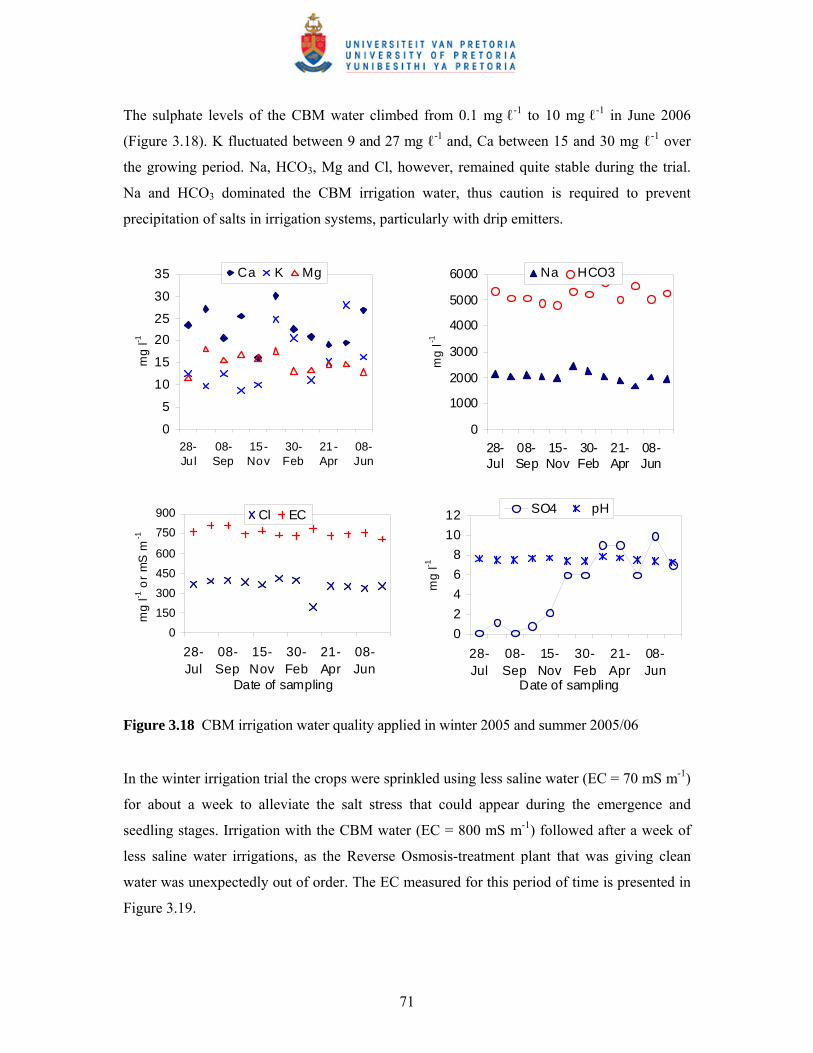
The sulphate levels of the CBM water climbed from 0.1 mg ℓ-1 to 10 mg ℓ-1 in June 2006
(Figure 3.18). K fluctuated between 9 and 27 mg ℓ-1 and, Ca between 15 and 30 mg ℓ-1 over
the growing period. Na, HCO3, Mg and Cl, however, remained quite stable during the trial.
Na and HCO3 dominated the CBM irrigation water, thus caution is required to prevent
precipitation of salts in irrigation systems, particularly with drip emitters.
0
5
10
15
2025
30
35
28-Ju l
08-Sep
15-Nov
30-Feb
21-Apr
08-Jun
mg
l-1
Ca K Mg
0
1000
2000
3000
4000
5000
6000
28-Jul
08-Sep
15-Nov
30-Feb
21-Apr
08-Jun
mg
l-1
Na HCO3
0
150
300
450
600
750
900
28-Jul
08-Sep
15-Nov
30-Feb
21-Apr
08-Jun
Date of sampling
mg
l-1 o
r m
S m
-1
Cl EC
02468
1012
28-Jul
08-Sep
15-Nov
30-Feb
21-Apr
08-Jun
Date of sampling
mg
l-1
SO4 pH
Figure 3.18 CBM irrigation water quality applied in winter 2005 and summer 2005/06
In the winter irrigation trial the crops were sprinkled using less saline water (EC = 70 mS m-1)
for about a week to alleviate the salt stress that could appear during the emergence and
seedling stages. Irrigation with the CBM water (EC = 800 mS m-1) followed after a week of
less saline water irrigations, as the Reverse Osmosis-treatment plant that was giving clean
water was unexpectedly out of order. The EC measured for this period of time is presented in
Figure 3.19.

72
0100200300400500600700800900
23/07/2005 31/07/2009 27/08/2005 14/09/2005 30/09/2005DOY
EC
(mS
m-1)
Less saline water
CBM water
Figure 3.19 EC of the less saline water and CBM water irrigated in winter 2005
In the summer experiment, crops were also irrigated with less saline water for about 8 weeks,
whereafter CBM water was applied for the rest of the growing period (Figure 3.20).
0100200
300400500
600700800
900
22/11/2005 15/12/2005 15/01/2006 10/02/2006 05/03/2006
Date of sampling
EC
(m
S m
-1) CBM water
Less saline water
Figure 3.20 EC of the less saline water and CBM water irrigated in summer 2005/06
3.6 Monitoring the field water and salt balance
In all the fields intensive monitoring stations were installed to monitor the soil water and salt
balance during the cropping seasons. The intensive monitoring station’s instrumentation and
measurements made are described here.
73
3.6.1 Atmospheric Evaporative Demand
An automatic weather station was set up close to the cropped areas for each site. At all the
sites where weather stations were set up, they were surrounded by grass and was on a slight
slope (Figure 2.20). The sites were assumed to be representative for the area where each pivot
was located.
The following metrological data were recorded with the weather stations:
• Temperature and relative humidity with a CS-500 Vaisala temperature and humidity
probe;
• Solar radiation with a Li-Cor LI-200 pyranometer (LiCor, Lincoln, Nebraska, USA);
• Wind speed with an R.M. Young cup anemometer (R.M.Young, Michigan, USA); and
• Rainfall amount and intensity with a tipping bucket (Texas Electronics Inc.) rain
gauge.
Weather data were recorded every 10 s with a Campbell Scientific CR10X data logger.
Temperatures were averaged hourly.. Daily average, maximum and minimum data were also
recorded. The datalogger program was set up to calculate and output hourly and daily average
vapour pressure and saturation vapour pressure. Solar irradiance was averaged hourly and
total daily radiant flux density calculated. Wind speed was averaged, maximized and
minimized daily.
3.6.2 Crop growth and nutritional status
During the field trial period, growth analysis was done at various stages of crop development
for each site. Plant samples were taken from 1 m2 areas at representative places, with 3
replications every 10-14 days. Two essential measurements were made, namely, leaf area
index and above-ground dry matter (DM) accumulation. Leaf area index (LAI) was calculated
from leaf area determined with a leaf area meter (LI-3100, LiCor, Lincoln, Nebraska, USA)
and dry matter of partitioned plant parts (leaf, stem, flower and seed) was determined after
four to five days of oven drying at 60 oC. The DM was used in the investigations of nutrient

74
imbalances. When plants senesced, they were harvested and final yield determined. The yield
was compared with the results obtained from dry land farming in the region.
Leaf samples were taken at critical crop growth stages (for example for maize 40-60 cm tall,
tasseling and silking) to determine nutritional and possible imbalances. The samples were
taken above the ear from three different plants, using hand cuttings. Two to three handfuls of
plant leaves replicated three times were collected. No samples were taken within a week after
fertilizer has been applied to the crops as fertilizers or herbicides could contaminate the
sample and invalidate analytical results. Diseased or dead plant material in a sample was
avoided. Sampling plants which have been damaged by insects and stressed extensively by
cold, heat, high water content or by waterlogging were also avoided. The frequency of
sampling was aimed at monitoring the nutrient status during the growing season.
3.6.3 Soil water balance
Irrigation and rainfall
Amounts of irrigation and rainfall were recorded with tipping bucket raingauges connected to
CR10X (Camp bell Scientific Inc, Utah, USA) dataloggers in order to calculate the salt loads
on the soil. Manual raingauges were also used as a backup at every site for each pivot and also
used to separate the rain from irrigation. There were two electronic and two manual
raingauges for each site. Irrigation water samples were collected in 100 mℓ containers over
the course of each irrigation season in order to determine the water quality. Water analysis
was conducted using established laboratory procedures at the Soil Science Laboratory,
Department of Plant Production and Soil Science, University of Pretoria.
In the Waterberg CBM irrigation trial, irrigation amounts were recorded using water meters
installed with the irrigation systems. Six water meters were used to measure the flow (m3) of
water to each treatment in the drip system, whereas only one was needed for the sprinkler
system. Water was applied based on the envisaged irrigation treatments. The three irrigation
amounts envisaged were :
• irrigation to FC (FC);

75
• a leaching fraction of 23% that applied 30% more water than that needed to return the
profile to FC (LF-23%); and
• a leaching fraction of 46% that applied 85% more water than that needed to return the
profile to FC (LF-46%)
Soil water content
Volumetric soil water content at each site was monitored with a neutron water meter (NWM)
Model 503DR CPN Hydroprobe (Campbell Pacific Nuclear, California, USA). Two NWM
access tubes to a depth of 1.2 m were installed in Major and Pivot Four, and at a depth of 1.0
m in TWF due to the shallower depth of this soil. Two NWM access tubes to depth of 1.4 m
were installed at New Vaal. Soil water contents were measured at six depth increments of 0.2
m at Pivot Major and Pivot Four, and at five depth increments of 0.2 m at Pivot TWF.
Measurements were made every 10-14 days. Two NWM access tubes to a depth of 0.80 m
were installed in Syferfontein, due the shallow depth of the soil. There were five plots and a
total of 12 NWM access tubes. Soil water contents were measured at two depth increments of
0.2 m every 10-14 days. The NWM was calibrated for the soils on each site. The calibration
equation developed for the site was used to calculate the soil water content in the profile.
Surface runoff
Contour and waterways were designed so that the runoff could leave the pivot over a weir
(Figure 3.21a). The weirs were built at the lowest points of fields Major and TWF in 1998
(Kleinkopjé Colliery). A weir was also built at Syferfontein during the winter of 2003.
A pressure transducer measured the water level above the weir, and an EC sensor (CS 247
conductivity and temperature probe) determined water quality. The instruments were
connected to a CR-510 data logger (Campbell Scientific Inc., Logan, Utah, USA).

76
a)
b) c)
Figure 3.21 a) Runoff weir layout and b) ISCO sampler at Pivot Major and c) Top view of
ISCO sampler with 24 sample bottles
At Pivot Four (Kleinkopjé Colliery), New Vaal Colliery and Waterberg CBM irrigation trial,
runoff weirs were not built as no runoff was expected to occur from these fairly flat fields on
well-drained, high infiltration capacity soils.
3.6.4 Salt balance
Soil sampling and analysis
At planting, and at the end of the season soils were sampled for each field trial. The sampling
was done at 20 cm depth intervals to the bottom of the profile and determinations were made
of bulk density, pH, soil saturated electrical conductivity (ECe), and ion concentrations (Ca,
Runoff weir
77
Mg, K, Na, CO3, HCO3, Cl, SO4). The analyses were conducted by the Soil Science
Laboratory of the University of Pretoria.
Soil water sampling and analyses
Ceramic cup water samplers at depths of 0.30, 0.60 and 90 m, and an electronic wetting front
detector at a depth of 0.40 m were installed in each field at Kleinkopjé and New Vaal. Manual
wetting front detectors (WFDs) were also installed at a later stage on depths of 0.30, 0.60 and
0.90 m to get more soil water samples. Due to the shallow depth of the Syferfontein soil,
ceramic cups were placed at depths of 0.30 and 0.60 m, and an electronic WFD at a depth of
0.40 m.
Water redistributing in the irrigated profiles after rain or irrigation, was collected about every
two weeks from the soil water samplers. The water samples from each field trial were
analysed for concentrations of Ca, Mg, K, Na, CO3, HCO3, Cl, SO4 and EC of the soil
solution. Sodium Adsorption Ratio (SAR) of the soil solution was calculated for Syferfontein,
as Na2SO4 dominates the water. SAR for the other fields was not calculated, as the waters
were gypsiferous, with negligible amounts of Na. During the trial period, no water could be
collected from ceramic cups at Syferfontein. This could be due to high suction or low matric
potential of the soil and cracking or swelling of the soil, which resulted in poor contact
between soil and ceramic cups.
In the CBM irrigation trial, water infiltrated after rain or irrigation was sampled using wetting
front detectors (WFDs) installed at 0.3 m and 0.6 m soil depth, which acted as passive
lysimeters (Stirzaker, 2003). Water samples collected from each treatment were analysed for
electrical conductivity (EC) of the soil solution. The aim was to see if the EC of the soil
solution was above the EC tolerance levels of the crops
Surface runoff water quality
In the winter season (2003) an ISCO 3700 portable water sampler (ISCO, Inc., Lincoln, NE,
USA) was installed at the weirs of TWF (Kleinkopjé Colliery) (Figure 3.21b&c) and
Syferfontein to sample runoff for detailed analyses. In September 2004 the field trial at
Syferfontein was concluded and the sampler was moved to pivot Major. CR10X Campbell
78
loggers, (Campbell Scientific Inc., Logan, Utah, USA) (at TWF and Major), were used to
trigger the ISCO sampler for measurement. The dataloggers determined the height of water
above the weir every second and converted it to flow using the following equation:
Q = 1.585 x 5x h2.5
where Q is the flow in m3s-1, h is the water level above the weir in m and 1.585, 5 and 2.5 are
coefficients dependent on the shape and size of the weir. This weir was designed by Prof
Simon Lorentz, University of Kwa-Zulu Natal, South Africa, who also determined the values
of the coefficients for the equation.
The bottle number, date and time of sampling were stored by the data logger. The ISCO was
programmed to stop sampling when water samples had been deposited in all the 24 available
bottles. The download of data from the datalogger and collection of water samples from the
ISCO sampler were usually carried out fortnightly. Runoff samples were then analyzed for
pH, cations, anions, TDS and EC by the University of Pretoria, Soil Science Laboratory.
Runoff from rain or irrigation events was measured during the entire period of the study.
3.7 Modelling
3.7.1 Soil Water Balance modelling
The data collected with the intensive monitoring systems were used to determine the
components of the soil water and salt balance for each field. For the soil water balance,
irrigation and rainfall were measured with automatic raingauges, evapotranspiration was
estimated from soil water measurements with a neutron water meter (NWM) and runoff was
measured at weirs built at the lowest points of the irrigated fields. Water intercepted by the
crop canopy and drainage were estimated with the SWB model. The SWB model was also
used to split evapotranspiration into soil evaporation and crop transpiration. For the salt
balance, the mass of salts added was determined from irrigation amounts and chemical
analyses, salt runoff was measured at the weirs with salinity sensors and laboratory analyses
of soil samples were carried out to measure salts in the soil solution. The SWB model was
79
used to estimate the mass of salts precipitated in the soil profile in the form of gypsum and
salt leaching.
3.7.2 Modelling, data processing and validations
The data collected in the experimental sites from 1997/98-2006 were used for improvement,
development, calibration and validation of the SWB model. Daily weather data such as
minimum and maximum temperatures, relative humidity, radiation, wind speed and directions
collected with the automatic weather station were used as inputs into the model.
SWB needs initial soil solution chemical properties, irrigation and rainwater chemical
characteristics as inputs to determine the quantity of salts in the soil solution of a given layer
in a soil profile. The model has eleven soil layers and is set by the user. The actual dates of
irrigation and amounts, and water qualities were, therefore, used as inputs into the model. The
water quality analyses were done at the University of Pretoria, Soil Science Lab.
SWB calculates the mass of incoming ions diluted in irrigation water, assuming complete
mixing of water present in the topsoil layer with the incoming irrigation water. The new
concentration of ions in this soil layer is assumed to be the concentration of water penetrating
the deep soil layer. The quantity of water penetrating the deeper soil layer is the amount of
water that remains after filling the top layer up to field capacity. The same procedure is
repeated for each layer. The ionic concentration in each soil layer is updated on a daily basis
after crop water uptake is calculated. The salt concentration in the soil solution is controlled
by the solubility product of gypsum. A salt will be precipitated from solution once the
solubility product is exceeded. The crop growth reduction due to salinity is also related to the
osmotic potential of the soil solution in the root zone.
The soil analysis of 1997/98 was used as initial soil chemical property for site TWF and
Major. Site Pivot Four and New Vaal started off irrigation in the winter season of 1999 and
summer season of 2002, and the chemical properties analysed at this time were used as an
initial input to the model. Each of the experimental sites showed large variation in soil
properties within the pivots and it was decided to use mean values per depth. The field
capacity and permanent wilting point for these sites were also taken mean values per depth.

80
Specific crop growth parameters already included in the database of SWB (Annandale et al.,
1999), were refined in order to account for the specific conditions and cultivars used in these
field trials. Improvements of SWB were made to simulate multiple crop rotations. The crop
rotation cycle and other pertinent dates required were used as inputs to the model. The
maximum rooting depth required by each crop was also compared to the measurements made
in the experimental site.
The variables used to evaluate the model were crop growth (top dry matter (TDM),
harvestable dry matter (HDM) and leaf area index (LAI)), soil water deficit, soil solution
concentrations. Soil water deficit to field capacity determined from NWM measurements,
soil solution taken from the ceramic cups and wetting front detectors, and results of crop
growth analyses were also entered in the SWB database and compared to simulations.
Simulated graphs of leaf area index (LAI), top dry matter (TDM) and harvestable dry matter
(HDM), as well as the soil water deficit to field capacity are presented in Chapter 6. All data
used for calibration and validation is available in the SWB database.
Conclusions
The study considered different cropping systems, soils, weather and water qualities to assess
the environmental impact and sustainability of irrigation with mine water. Intensive
monitoring stations in representative sites of all fields were installed to monitor the soil water
and salt balances during the cropping seasons. Crops, soils, weather, irrigation water qualities
and surface runoff were monitored for several seasons and the measurements taken were used
to validate the SWB model.


![1-S3=Y$2=S YG]H $GY,S%YG]H $GY3HSG Q]$ …](https://img.pdfslide.us/doc/110x75/620680590c66c662951a4918/1-s3y2s-ygh-gysygh-gy3hsg-q-.jpg)