Embed Size (px)
Citation preview
cleaningtimes
The theme of this issue is testing,measurement, and controls.
With all due respect for thoseessential activities, no matter whatthey produce (estimates of surfacecleanliness, for example, or some-thing else), we have to answer ques-tions such as:
• Are these data any good relative to the purpose for which they were intended?
• Are they accurate? • Are they precise?
Even before we start makingmeasurements, we have to answerquestions such as:
• How will we do this testing? If wehave a meter we like, just how often should we do this testing (surely once is enough [and don’t call me Shirley!]), and
• Are these measurements exposingany differences in the areas where the testing is being done?
In other words, this column cov-ers a few aspects of statistics, sothose who do testing and measure-ment don’t waste their time andmoney producing numbers withoutmeaning.1
ACCURACY VS. PRECISIONMeasurements can be worthwhile—or a waste of time and resources. Formeasurements to be useful, theyshould be both precise and accurate.But measurements that are precisearen’t necessarily accurate, and vice-versa.
It’s important to understand thedistinction between precision andaccuracy because the actionsrequired to correct imprecision andinaccuracy are different.
Accuracy is related to some pointof aim, or target.
Precision is how consistently some-thing was done.
• Precise measurements are tightly “grouped.” Successive measurements always give essentially the same outcome. That’s precision.
• Accurate measurements are thosewhich measure the thing of interest, or “hit the target.”
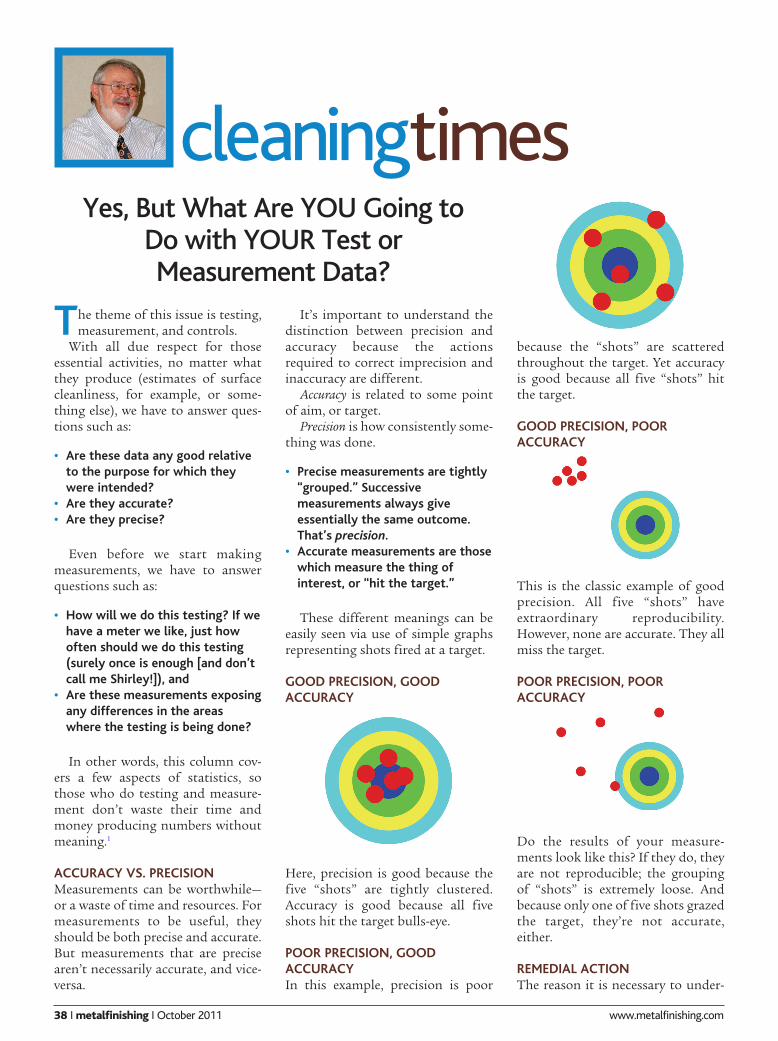
These different meanings can beeasily seen via use of simple graphsrepresenting shots fired at a target.
GOOD PRECISION, GOODACCURACY
Here, precision is good because thefive “shots” are tightly clustered.Accuracy is good because all fiveshots hit the target bulls-eye.
POOR PRECISION, GOODACCURACYIn this example, precision is poor
because the “shots” are scatteredthroughout the target. Yet accuracyis good because all five “shots” hitthe target.
GOOD PRECISION, POORACCURACY
This is the classic example of goodprecision. All five “shots” haveextraordinary reproducibility.However, none are accurate. They allmiss the target.
POOR PRECISION, POORACCURACY
Do the results of your measure-ments look like this? If they do, theyare not reproducible; the groupingof “shots” is extremely loose. Andbecause only one of five shots grazedthe target, they’re not accurate,either.
REMEDIAL ACTIONThe reason it is necessary to under-
Yes, But What Are YOU Going to Do with YOUR Test or Measurement Data?
38 I metalfinishing I October 2011 www.metalfinishing.com
www.metalfinishing.com October 2011 I metalfinishing I 39
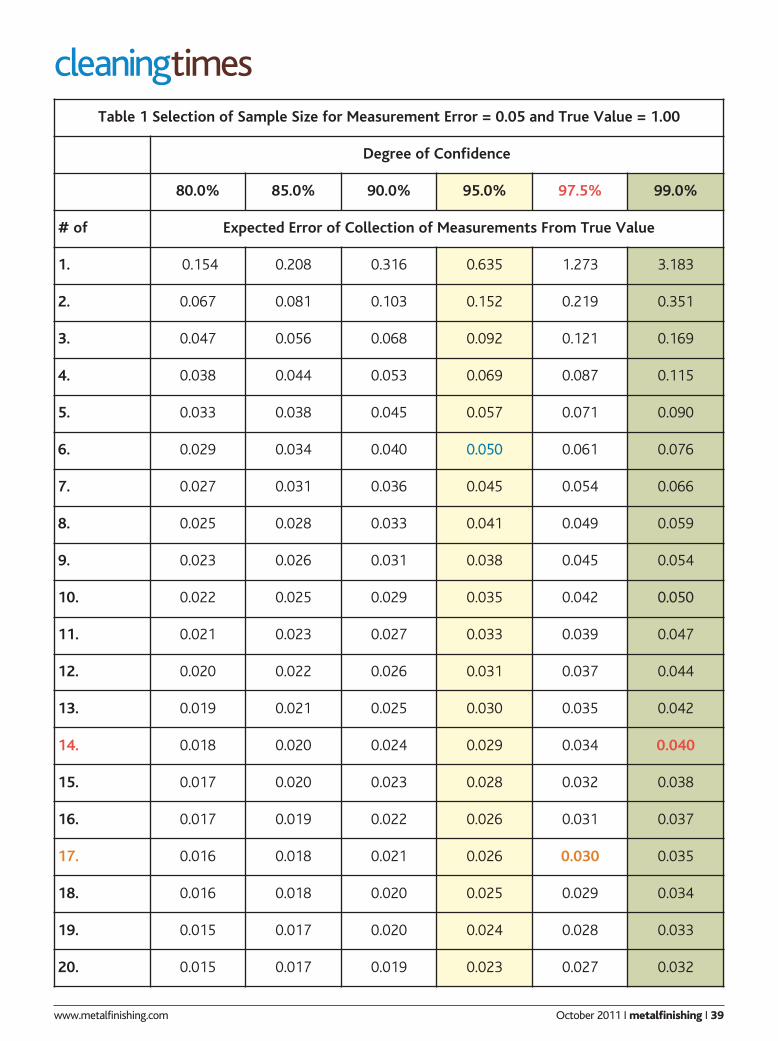
cleaningtimesTable 1 Selection of Sample Size for Measurement Error = 0.05 and True Value = 1.00
Degree of Confidence
80.0% 85.0% 90.0% 95.0% 97.5% 99.0%
# of Expected Error of Collection of Measurements From True Value
1. 0.154 0.208 0.316 0.635 1.273 3.183
2. 0.067 0.081 0.103 0.152 0.219 0.351
3. 0.047 0.056 0.068 0.092 0.121 0.169
4. 0.038 0.044 0.053 0.069 0.087 0.115
5. 0.033 0.038 0.045 0.057 0.071 0.090
6. 0.029 0.034 0.040 0.050 0.061 0.076
7. 0.027 0.031 0.036 0.045 0.054 0.066
8. 0.025 0.028 0.033 0.041 0.049 0.059
9. 0.023 0.026 0.031 0.038 0.045 0.054
10. 0.022 0.025 0.029 0.035 0.042 0.050
11. 0.021 0.023 0.027 0.033 0.039 0.047
12. 0.020 0.022 0.026 0.031 0.037 0.044
13. 0.019 0.021 0.025 0.030 0.035 0.042
14. 0.018 0.020 0.024 0.029 0.034 0.040
15. 0.017 0.020 0.023 0.028 0.032 0.038
16. 0.017 0.019 0.022 0.026 0.031 0.037
17. 0.016 0.018 0.021 0.026 0.030 0.035
18. 0.016 0.018 0.020 0.025 0.029 0.034
19. 0.015 0.017 0.020 0.024 0.028 0.033
20. 0.015 0.017 0.019 0.023 0.027 0.032
cleaningtimesstand these differences is becausethe remedial action is different foreach outcome.
• Precision in anything is improved by training and practice.
• Accuracy may be difficult to improve because it requires adjustment of the testing apparatus (point of aim).2
WHY TAKE MORE THAN ONE“SHOT?”This question has been shocking tosome in cleaning courses I havetaught. The response I get asksanother question in reply: Whymake more than one measurement?”
My answer is in the four imagescited on the previous page. Withoutmultiple measurements, the testerdoesn’t know whether their meas-urements are precise or accurate, orworthwhile.
TEST FREQUENCYThe test frequency depends upon:
• How often you want to know if a certain amount of cleaning work has been done well. This refers to the work schedule. Choices might be once per hour, shift, day, gradeor type of material being cleaned,or significant change in operation of the cleaning process. For continuous operation, once per day or shift is often adequate. Where the cleaning work is valued more highly, a manager would want to know about performance more often.
• How well the measurements of cleanliness correctly represent the true cleanliness condition of the parts. This refers to the error of measurement.
• How sure you want to be that themeasured results correctly represent the true cleanliness condition of the parts. This refers to confidence limits.
SIMPLE ANSWERThe number of samples to be takenand tested is given in Table 1 3 forany choice of how often it is desiredto know about the performance ofthe cleaning machine. The answer isalmost always 6.
Testers can almost always make5% measurements (0.05 measure-ment error with a true value of 1.00),and want to know with 95% confi-dence that they are right. So, withTable 1, the number of samples perdata point is 6.
IT’S THE DIFFERENCES THATMATTERThe reason this issue is about testingand measuring is that users want toknow something—relative to some-thing else.
Only rarely do we want to knowthe absolute value of something andnot compare it to something else tosee how we’re doing.
So, if we have made accurate andprecise measurements, and are soconfident that they are known with-in some level of error, how do wecompare our measurements to that“something else?”
The answer is to use the “t” test.Fortunately, one doesn’t need a
course in statistics to do the “t’ test.All one needs is a spreadsheet. Thespreadsheet command for Excel is:
=TTEST(Data Set #1, Data Set #2,2, 2)4
When converted to a percent, theoutput of =TTEST is the % chancethat Data Set #1 came from thesame population as did Data Set #2.
In other words, this calculationidentifies the probability that the sec-ond data set (not a single measure-ment) came from the same popula-tion which produced the first data set(not a single measurement, either).Neither data set represents the entirepopulation; both are samples.
A value of 0.95 is a good minimumvalue for this calculation—it meansthat the probability is at least 95%that the two sets of measurements
came from the same population.
SUMMARYMeasuring and testing are necessaryactivities for an enterprise. But theyare worthwhile only if a little statis-tical “grease” is applied to thembefore and after they are produced.
BIOJohn Durkee is the author of the book,Management of Industrial CleaningTechnology and Processes, published byElsevier (ISBN 0-0804-48887). He is anindependent consultant specializing inmetal and critical cleaning. You can con-tact him at PO Box 847, Hunt, TX 78024or 122 Ridge Road West, Hunt, TX78024; 830-238-7610; Fax 612-677-3170; or [email protected].
REFERENCES1. Don’t worry, this column is not a
short course in statistics. Forthose who want to know just alittle more about practical statis-tics applied to measurements ofanything, you can find that inChapter 4 of the book written inthe author’s biography. Table 1and the “t’ test is covered as well.
2. The above presentation is bothabstracted from and a tribute tothe late Dr. Joseph J. Carr, whowas a widely published authorand teacher of management ofcleaning systems.
3.Table 1 Selection of Sample Sizefor Measurement Error = 0.05and True Value = 1.00 Degreeof Confidence
4. The number of data points mustbe the same in both data sets, orthe routine will return ERR. Thefirst value 2 means that bothplus and minus deviation fromthe mean should be considered (a“two-tailed test”). The secondvalue 2 means that the two datasets are to be treated as if they dohave the same variability.
40 I metalfinishing I October 2011 www.metalfinishing.com