Embed Size (px)
Citation preview

UNITED STATES
SECURITIES AND EXCHANGE COMMISSIONWashington, D.C. 20549
FORM 10-Q☒ QUARTERLY REPORT PURSUANT TO SECTION 13 OR 15(d) OF THE SECURITIES EXCHANGE ACT OF 1934
For the quarterly period ended June 30, 2019
or
☐ TRANSITION REPORT PURSUANT TO SECTION 13 OR 15(d) OF THE SECURITIES EXCHANGE ACT OF 1934
For the transition period from ______________ to _______________
Commission file number: 1-2207
THE WENDY ' S COMPANY(Exact name of registrant as specified in its charter)
Delaware 38-0471180(State or other jurisdiction ofincorporation or organization)
(I.R.S. Employer Identification No.)
One Dave Thomas Blvd.
Dublin, Ohio 43017(Address of principal executive offices) (Zip Code)
( 614 ) 764-3100(Registrant’s telephone number, including area code)
Securities registered pursuant to Section 12(b) of the Act:
Title of each class Trading Symbol(s) Name of each exchange on which registeredCommon Stock, $.10 par value WEN The Nasdaq Stock Market LLC
Indicate by check mark whether the registrant (1) has filed all reports required to be filed by Section 13 or 15(d) of the Securities Exchange Act of 1934 duringthe preceding 12 months (or for such shorter period that the registrant was required to file such reports), and (2) has been subject to such filing requirements for thepast 90 days. Yes ☒ No ☐
Indicate by check mark whether the registrant has submitted electronically and posted on its corporate Web site, if any, every Interactive Data File required tobe submitted and posted pursuant to Rule 405 of Regulation S-T (section 232.405 of this chapter) during the preceding 12 months (or for such shorter period thatthe registrant was required to submit and post such files). Yes ☒ No ☐
Indicate by check mark whether the registrant is a large accelerated filer, an accelerated filer, a non-accelerated filer, a smaller reporting company, or anemerging growth company. See the definitions of “large accelerated filer,” “accelerated filer,” “smaller reporting company,” and “emerging growth company” inRule 12b-2 of the Exchange Act.
Large accelerated filer ☒ Accelerated filer ☐
Non-accelerated filer ☐ Smaller reporting company ☐
Emerging growth company ☐
If an emerging growth company, indicate by check mark if the registrant has elected not to use the extended transition period for complying with any new orrevised financial accounting standards provided pursuant to Section 13(a) of the Exchange Act. ☐

Indicate by check mark whether the registrant is a shell company (as defined in Rule 12b-2 of the Exchange Act).Yes ☐ No ☒
There were 230,603,094 shares of The Wendy’s Company common stock outstanding as of July 31, 2019 .
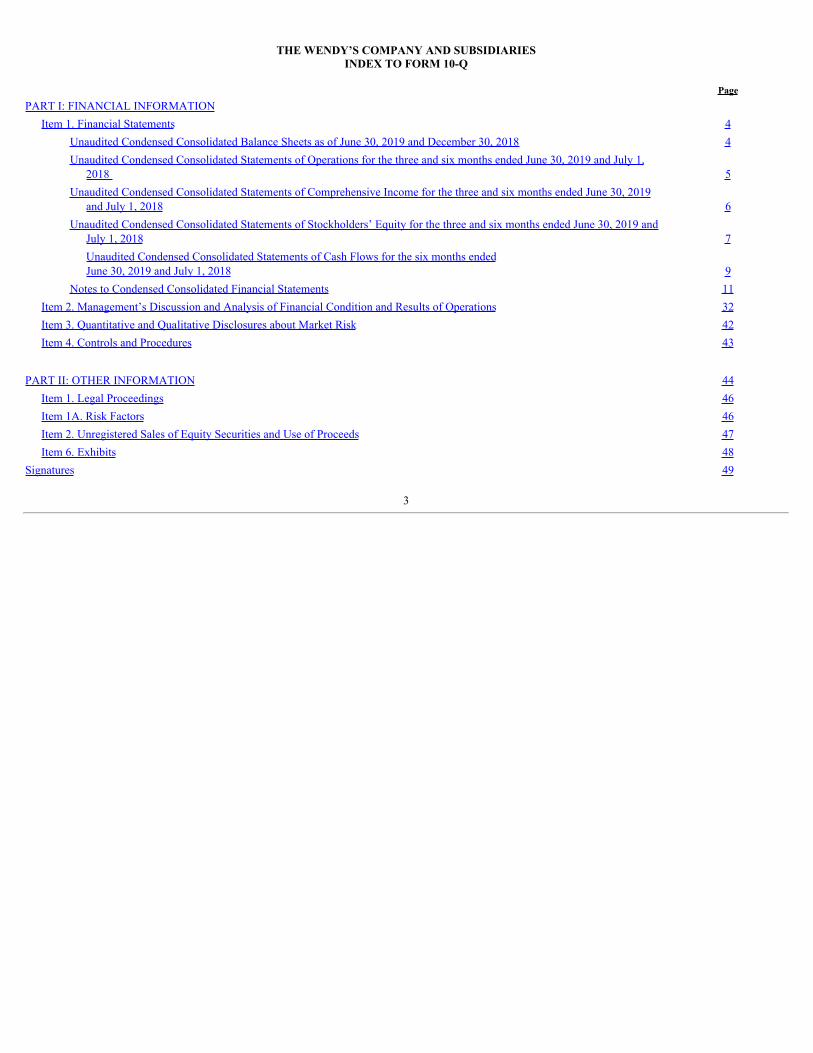
THE WENDY’S COMPANY AND SUBSIDIARIESINDEX TO FORM 10-Q
PagePART I: FINANCIAL INFORMATION
Item 1. Financial Statements 4Unaudited Condensed Consolidated Balance Sheets as of June 30, 2019 and December 30, 2018 4Unaudited Condensed Consolidated Statements of Operations for the three and six months ended June 30, 2019 and July 1,
2018 5Unaudited Condensed Consolidated Statements of Comprehensive Income for the three and six months ended June 30, 2019
and July 1, 2018 6Unaudited Condensed Consolidated Statements of Stockholders’ Equity for the three and six months ended June 30, 2019 and
July 1, 2018 7Unaudited Condensed Consolidated Statements of Cash Flows for the six months endedJune 30, 2019 and July 1, 2018 9
Notes to Condensed Consolidated Financial Statements 11Item 2. Management’s Discussion and Analysis of Financial Condition and Results of Operations 32Item 3. Quantitative and Qualitative Disclosures about Market Risk 42Item 4. Controls and Procedures 43
PART II: OTHER INFORMATION 44Item 1. Legal Proceedings 46Item 1A. Risk Factors 46Item 2. Unregistered Sales of Equity Securities and Use of Proceeds 47Item 6. Exhibits 48
Signatures 49
3

PART I. FINANCIAL INFORMATION
Item 1. Financial Statements.THE WENDY’S COMPANY AND SUBSIDIARIES
CONDENSED CONSOLIDATED BALANCE SHEETS(In Thousands Except Par Value)
June 30, 2019
December 30, 2018
ASSETS (Unaudited)Current assets:
Cash and cash equivalents $ 426,216 $ 431,405Restricted cash 29,494 29,860Accounts and notes receivable, net 101,083 109,805Inventories 3,546 3,687Prepaid expenses and other current assets 18,622 14,452Advertising funds restricted assets 93,422 76,509
Total current assets 672,383 665,718Properties 992,302 1,023,267Finance lease assets 197,691 189,969Operating lease assets 895,280 —Goodwill 755,887 747,884Other intangible assets 1,257,323 1,294,153Investments 47,920 47,660Net investment in sales-type and direct financing leases 241,584 226,477Other assets 103,523 96,907
Total assets $ 5,163,893 $ 4,292,035
LIABILITIES AND STOCKHOLDERS’ EQUITY Current liabilities:
Current portion of long-term debt $ 22,750 $ 23,250Current portion of finance lease liabilities 9,917 8,405Current portion of operating lease liabilities 43,321 —Accounts payable 17,315 21,741Accrued expenses and other current liabilities 148,852 150,636Advertising funds restricted liabilities 99,120 80,153
Total current liabilities 341,275 284,185Long-term debt 2,274,967 2,305,552Long-term finance lease liabilities 465,226 447,231Long-term operating lease liabilities 931,033 —Deferred income taxes 271,283 269,160Deferred franchise fees 91,588 92,232Other liabilities 140,473 245,226
Total liabilities 4,515,845 3,643,586Commitments and contingencies Stockholders’ equity:
Common stock, $0.10 par value; 1,500,000 shares authorized; 470,424 shares issued; 231,092 and 231,233 shares outstanding, respectively 47,042 47,042Additional paid-in capital 2,883,484 2,884,696Retained earnings 163,249 146,277Common stock held in treasury, at cost; 239,332 and 239,191 shares, respectively (2,393,914) (2,367,893)Accumulated other comprehensive loss (51,813) (61,673)
Total stockholders’ equity 648,048 648,449
Total liabilities and stockholders’ equity $ 5,163,893 $ 4,292,035See accompanying notes to condensed consolidated financial statements.
4

Table of ContentsTHE WENDY’S COMPANY AND SUBSIDIARIES
CONDENSED CONSOLIDATED STATEMENTS OF OPERATIONS(In Thousands Except Per Share Amounts)
Three Months Ended Six Months Ended
June 30, 2019
July 1, 2018
June 30, 2019
July 1, 2018
(Unaudited)Revenues:
Sales $ 181,050 $ 167,344 $ 348,747 $ 320,993Franchise royalty revenue and fees 109,125 107,559 211,078 205,467Franchise rental income 58,561 51,529 117,013 101,636Advertising funds revenue 86,612 84,570 167,093 163,470
435,348 411,002 843,931 791,566Costs and expenses:
Cost of sales 151,092 138,154 293,671 270,373Franchise support and other costs 4,066 7,031 10,084 13,204Franchise rental expense 28,027 24,306 60,478 47,569Advertising funds expense 88,667 84,570 169,148 163,470General and administrative 50,784 49,163 100,097 99,519Depreciation and amortization 31,484 33,427 64,669 65,579System optimization (gains) losses, net (110) (92) (122) 478Reorganization and realignment costs 3,570 3,124 4,368 5,750Impairment of long-lived assets 198 1,603 1,684 1,809Other operating income, net (3,003) (1,767) (6,985) (2,930)
354,775 339,519 697,092 664,821Operating profit 80,573 71,483 146,839 126,745
Interest expense, net (29,931) (30,136) (59,013) (60,314)Loss on early extinguishment of debt (7,150) — (7,150) (11,475)Other income, net 2,247 917 4,947 1,661
Income before income taxes 45,739 42,264 85,623 56,617Provision for income taxes (13,353) (12,388) (21,343) (6,582)
Net income $ 32,386 $ 29,876 $ 64,280 $ 50,035
Net income per share Basic $ .14 $ .13 $ .28 $ .21Diluted $ .14 $ .12 $ .27 $ .20
See accompanying notes to condensed consolidated financial statements.
5

Table of ContentsTHE WENDY’S COMPANY AND SUBSIDIARIES
CONDENSED CONSOLIDATED STATEMENTS OF COMPREHENSIVE INCOME(In Thousands)
Three Months Ended Six Months Ended
June 30, 2019
July 1, 2018
June 30, 2019
July 1, 2018
(Unaudited)Net income $ 32,386 $ 29,876 $ 64,280 $ 50,035Other comprehensive income (loss), net:
Foreign currency translation adjustment 3,835 (4,325) 9,860 (10,369)Change in unrecognized pension loss:
Unrealized gains arising during the period — — — 156Income tax provision — — — (39)
— — — 117 Other comprehensive income (loss), net 3,835 (4,325) 9,860 (10,252)
Comprehensive income $ 36,221 $ 25,551 $ 74,140 $ 39,783
See accompanying notes to condensed consolidated financial statements.
6

Table of ContentsTHE WENDY’S COMPANY AND SUBSIDIARIES
CONDENSED CONSOLIDATED STATEMENTS OF STOCKHOLDERS’ EQUITY(In Thousands)
Common Stock
Additional Paid-In Capital
Retained Earnings(Accumulated
Deficit)
Common StockHeld in Treasury
Accumulated OtherComprehensive Loss
Total
(Unaudited)
Balance at December 30, 2018 $ 47,042 $ 2,884,696 $ 146,277 $ (2,367,893) $ (61,673) $ 648,449
Net income — — 31,894 — — 31,894
Other comprehensive income, net — — — — 6,025 6,025
Cash dividends — — (23,069) — — (23,069)
Repurchases of common stock — — — (29,370) — (29,370)
Share-based compensation — 5,022 — — — 5,022Common stock issued upon exercises
of stock options — (205) — 9,053 — 8,848Common stock issued upon vesting of
restricted shares — (8,874) — 2,819 — (6,055)Cumulative effect of change in
accounting principle — — (1,105) — — (1,105)
Other — 24 (6) 37 — 55
Balance at March 31, 2019 $ 47,042 $ 2,880,663 $ 153,991 $ (2,385,354) $ (55,648) $ 640,694
Net income — — 32,386 — — 32,386
Other comprehensive income, net — — — — 3,835 3,835
Cash dividends — — (23,124) — — (23,124)
Repurchases of common stock — — — (20,391) — (20,391)
Share-based compensation — 4,986 — — — 4,986Common stock issued upon exercises
of stock options — (339) — 10,830 — 10,491Common stock issued upon vesting of
restricted shares — (1,852) — 964 — (888)
Other — 26 (4) 37 — 59
Balance at June 30, 2019 $ 47,042 $ 2,883,484 $ 163,249 $ (2,393,914) $ (51,813) $ 648,048
See accompanying notes to condensed consolidated financial statements.
7

Table of ContentsTHE WENDY’S COMPANY AND SUBSIDIARIES
CONDENSED CONSOLIDATED STATEMENTS OF STOCKHOLDERS’ EQUITY—CONTINUED(In Thousands)
Common Stock
Additional Paid-In Capital
Retained Earnings(Accumulated
Deficit)
Common StockHeld in Treasury
Accumulated OtherComprehensive Loss
Total
(Unaudited)
Balance at December 31, 2017 $ 47,042 $ 2,885,955 $ (163,289) $ (2,150,307) $ (46,198) $ 573,203
Net income — — 20,159 — — 20,159
Other comprehensive loss, net — — — — (5,927) (5,927)
Cash dividends — — (20,355) — — (20,355)
Repurchases of common stock — — — (39,407) — (39,407)
Share-based compensation — 4,458 — — — 4,458Common stock issued upon exercises
of stock options — (7,460) — 11,038 — 3,578Common stock issued upon vesting of
restricted shares — (4,170) — 1,620 — (2,550)Cumulative effect of change in
accounting principle — — (70,210) — — (70,210)
Other — 21 (5) 32 — 48
Balance at April 1, 2018 $ 47,042 $ 2,878,804 $ (233,700) $ (2,177,024) $ (52,125) $ 462,997
Net income — — 29,876 — — 29,876
Other comprehensive loss, net — — — — (4,325) (4,325)
Cash dividends — — (20,290) — — (20,290)
Repurchases of common stock — — — (45,787) — (45,787)
Share-based compensation — 5,133 — — — 5,133Common stock issued upon exercises
of stock options — 396 — 2,840 — 3,236Common stock issued upon vesting of
restricted shares — (1,199) — 828 — (371)
Other — 33 (6) 43 — 70
Balance at July 1, 2018 $ 47,042 $ 2,883,167 $ (224,120) $ (2,219,100) $ (56,450) $ 430,539
See accompanying notes to condensed consolidated financial statements.
8

Table of ContentsTHE WENDY’S COMPANY AND SUBSIDIARIES
CONDENSED CONSOLIDATED STATEMENTS OF CASH FLOWS(In Thousands)
Six Months Ended
June 30, 2019
July 1, 2018
(Unaudited)Cash flows from operating activities:
Net income $ 64,280 $ 50,035Adjustments to reconcile net income to net cash provided by operating activities:
Depreciation and amortization 64,669 65,579Share-based compensation 10,008 9,591Impairment of long-lived assets 1,684 1,809Deferred income tax 3,422 (2,508)Non-cash rental expense (income), net 11,519 (6,239)Change in operating lease liabilities (20,983) —Net receipt of deferred vendor incentives 5,312 4,904System optimization (gains) losses, net (122) 478Distributions received from joint ventures, net of equity in earnings 2,099 2,108Long-term debt-related activities, net 10,799 15,036Changes in operating assets and liabilities and other, net 1,373 7,628
Net cash provided by operating activities 154,060 148,421Cash flows from investing activities:
Capital expenditures (25,484) (23,898)Acquisitions (5,052) —Dispositions 1,240 1,814Proceeds from sale of investments 130 —Notes receivable, net (750) (538)Payments for investments — (13)
Net cash used in investing activities (29,916) (22,635)Cash flows from financing activities:
Proceeds from long-term debt 850,000 930,809Repayments of long-term debt (877,876) (878,849)Repayments of finance lease liabilities (3,521) (2,784)Deferred financing costs (14,008) (17,340)Repurchases of common stock (50,781) (84,307)Dividends (46,193) (40,645)Proceeds from stock option exercises 19,160 13,197Payments related to tax withholding for share-based compensation (6,957) (9,269)Contingent consideration payment — (6,100)
Net cash used in financing activities (130,176) (95,288)Net cash (used in) provided by operations before effect of exchange rate changes on cash (6,032) 30,498Effect of exchange rate changes on cash 3,866 (4,401)Net (decrease) increase in cash, cash equivalents and restricted cash (2,166) 26,097Cash, cash equivalents and restricted cash at beginning of period 486,512 212,824
Cash, cash equivalents and restricted cash at end of period $ 484,346 $ 238,921
9

Table of ContentsTHE WENDY’S COMPANY AND SUBSIDIARIES
CONDENSED CONSOLIDATED STATEMENTS OF CASH FLOWS—CONTINUED(In Thousands)
Six Months Ended
June 30, 2019
July 1, 2018
(Unaudited)Supplemental non-cash investing and financing activities:
Capital expenditures included in accounts payable $ 5,398 $ 7,463Finance leases 23,534 1,904
June 30, 2019
December 30, 2018
Reconciliation of cash, cash equivalents and restricted cash at end of period: Cash and cash equivalents $ 426,216 $ 431,405Restricted cash 29,494 29,860Restricted cash, included in Advertising funds restricted assets 28,636 25,247
Total cash, cash equivalents and restricted cash $ 484,346 $ 486,512
See accompanying notes to condensed consolidated financial statements.
10

Table of ContentsTHE WENDY’S COMPANY AND SUBSIDIARIES
NOTES TO CONDENSED CONSOLIDATED FINANCIAL STATEMENTS(In Thousands Except Per Share Amounts)
(1) Basis of Presentation
The accompanying unaudited condensed consolidated financial statements (the “Financial Statements”) of The Wendy’s Company (“The Wendy’s Company”and, together with its subsidiaries, the “Company,” “we,” “us” or “our”) have been prepared in accordance with accounting principles generally accepted in theUnited States of America (“GAAP”) for interim financial information and, therefore, do not include all information and footnotes required by GAAP for completefinancial statements. In our opinion, the Financial Statements contain all adjustments of a normal recurring nature necessary to present fairly our financial positionas of June 30, 2019 , the results of our operations for the three and six months ended June 30, 2019 and July 1, 2018 and cash flows for the six months endedJune 30, 2019 and July 1, 2018 . The results of operations for the three and six months ended June 30, 2019 are not necessarily indicative of the results to beexpected for the full 2019 fiscal year. The Financial Statements should be read in conjunction with the audited consolidated financial statements for The Wendy’sCompany and notes thereto included in our Annual Report on Form 10-K for the fiscal year ended December 30, 2018 (the “Form 10-K”).
The principal 100% owned subsidiary of the Company is Wendy’s International, LLC and its subsidiaries (“Wendy’s”). The Company manages and internallyreports its business geographically. The operation and franchising of Wendy’s ® restaurants in North America (defined as the United States of America (“U.S.”)and Canada) comprises virtually all of our current operations and represents a single reportable segment. The revenues and operating results of Wendy’s restaurantsoutside of North America are not material.
We report on a fiscal year consisting of 52 or 53 weeks ending on the Sunday closest to or on December 31. All three- and six-month periods presented hereincontain 13 weeks and 26 weeks, respectively. All references to years and quarters relate to fiscal periods rather than calendar periods.
Our significant interim accounting policies include the recognition of advertising funds expense in proportion to advertising funds revenue.
Certain reclassifications have been made to the prior year presentation to conform to the current year presentation. See Note 2 for further information.
(2) New Accounting Standards
New Accounting Standards Adopted
Cloud Computing
In August 2018, the Financial Accounting Standards Board (“FASB”) issued new guidance on accounting for implementation costs of a cloud computingarrangement that is a service contract. The new guidance aligns the accounting for such implementation costs of a cloud computing arrangement that is a servicecontract with the guidance on capitalizing costs associated with developing or obtaining internal-use software. The Company adopted this amendment during thefirst quarter of 2019. The adoption of this guidance did not have a material impact on our condensed consolidated financial statements.
Nonemployee Share-Based Payments
In June 2018, the FASB issued new guidance on nonemployee share-based payment arrangements. The new guidance aligns the requirements fornonemployee share-based payments with the requirements for employee share-based payments. The Company adopted this amendment during the first quarter of2019. The adoption of this guidance did not have a material impact on our condensed consolidated financial statements.
Leases
In February 2016, the FASB issued new guidance on leases, which outlines principles for the recognition, measurement, presentation and disclosure of leasesapplicable to both lessors and lessees. The new guidance requires lessees to recognize on the balance sheet the assets and liabilities for the rights and obligationscreated by finance and operating leases. The Company adopted the new guidance during the first quarter of 2019 using the effective date as the date of initialapplication; therefore, the comparative period has not been adjusted and continues to be reported under the previous lease guidance.
11

Table of ContentsTHE WENDY’S COMPANY AND SUBSIDIARIES
NOTES TO CONDENSED CONSOLIDATED FINANCIAL STATEMENTS(In Thousands Except Per Share Amounts)
The new standard provides a number of optional practical expedients in transition. The Company elected the package of practical expedients, which permits usnot to reassess under the new standard our prior conclusions about lease identification, lease classification and initial direct costs. For those leases that fall underthe definition of a short-term lease, the Company elected the short-term lease recognition exemption. Under this practical expedient, for those leases that qualify,we did not recognize right-of-use (“ROU”) assets or liabilities, which included not recognizing ROU assets or lease liabilities for existing short-term leases of thoseassets in transition. The Company also elected the practical expedient for lessees to account for lease components and nonlease components as a single leasecomponent for all underlying classes of assets. In addition, the Company elected the practical expedient for lessors to account for lease components and nonleasecomponents as a single lease component in instances where the lease component is predominant, the timing and pattern of transfer for the lease component andnonlease component are the same and the lease component, if accounted for separately, would be classified as an operating lease. The Company did not elect theuse-of-hindsight practical expedient.
The standard had a material impact on our condensed consolidated balance sheets and related disclosures. Upon adoption at the beginning of 2019, werecognized operating lease liabilities of $1,011,000 based on the present value of the remaining minimum rental payments, with corresponding ROU assets of$934,000 . The measurement of the operating lease ROU assets included, among other items, favorable lease amounts of $23,000 and unfavorable lease amounts of$30,000 , which were previously included in “Other intangible assets” and “Other liabilities,” respectively, as well as the excess of rent expense recognized on astraight-line basis over the minimum rents paid of $67,000 , which was previously included in “Other liabilities.” In addition, the standard requires lessors torecognize lessees’ payments to the Company for executory costs on a gross basis as revenue with a corresponding expense, which we expect will result in anincrease of approximately $40,000 to our 2019 franchise rental income and expense. The Company also recognized a decrease to retained earnings of $1,105 as aresult of impairing newly recognized ROU assets upon transition to the new guidance. The adoption of the guidance did not have a material impact on ourcondensed consolidated statement of cash flows.
In connection with the adoption of the standard, the Company has reclassified finance lease ROU assets to “Finance lease assets,” which were previouslyrecorded to “Properties.” The Company also reclassified the current and long-term finance lease liabilities to “Current portion of finance lease liabilities” and“Long-term finance lease liabilities,” respectively, which were previously recorded to “Current portion of long-term debt” and “Long-term debt,” respectively. Theprior period reflects the reclassifications of these assets and liabilities to conform to the current year presentation.
The following table illustrates the reclassifications made to the condensed consolidated balance sheet as of December 30, 2018 :
As PreviouslyReported Reclassifications
As CurrentlyReported
Properties $ 1,213,236 $ (189,969) $ 1,023,267Finance lease assets — 189,969 189,969Current portion of long-term debt 31,655 (8,405) 23,250Current portion of finance lease liabilities — 8,405 8,405Long-term debt 2,752,783 (447,231) 2,305,552Long-term finance lease liabilities — 447,231 447,231
12

Table of ContentsTHE WENDY’S COMPANY AND SUBSIDIARIES
NOTES TO CONDENSED CONSOLIDATED FINANCIAL STATEMENTS(In Thousands Except Per Share Amounts)
(3) Revenue
Disaggregation of Revenue
The following tables disaggregate revenue by primary geographical market and source:
U.S. Canada Other International TotalThree Months Ended June 30, 2019 Sales at Company-operated restaurants $ 181,050 $ — $ — $ 181,050Franchise royalty revenue 91,430 6,304 5,087 102,821Franchise fees 5,716 708 (120) 6,304Franchise rental income 50,041 8,520 — 58,561Advertising funds revenue 81,437 5,175 — 86,612
Total revenues $ 409,674 $ 20,707 $ 4,967 $ 435,348
Six Months Ended June 30, 2019 Sales at Company-operated restaurants $ 348,747 $ — $ — $ 348,747Franchise royalty revenue 175,808 11,812 10,044 197,664Franchise fees 11,725 1,120 569 13,414Franchise rental income 100,706 16,307 — 117,013Advertising funds revenue 157,418 9,675 — 167,093
Total revenues $ 794,404 $ 38,914 $ 10,613 $ 843,931
Three Months Ended July 1, 2018 Sales at Company-operated restaurants $ 167,344 $ — $ — $ 167,344Franchise royalty revenue 87,224 6,073 4,861 98,158Franchise fees 7,011 2,275 115 9,401Franchise rental income 44,881 6,648 — 51,529Advertising funds revenue 79,485 5,085 — 84,570
Total revenues $ 385,945 $ 20,081 $ 4,976 $ 411,002
Six Months Ended July 1, 2018 Sales at Company-operated restaurants $ 320,993 $ — $ — $ 320,993Franchise royalty revenue 167,446 11,436 9,219 188,101Franchise fees 14,096 2,921 349 17,366Franchise rental income 89,146 12,490 — 101,636Advertising funds revenue 153,899 9,571 — 163,470
Total revenues $ 745,580 $ 36,418 $ 9,568 $ 791,566
13

Table of ContentsTHE WENDY’S COMPANY AND SUBSIDIARIES
NOTES TO CONDENSED CONSOLIDATED FINANCIAL STATEMENTS(In Thousands Except Per Share Amounts)
Contract Balances
The following table provides information about receivables and contract liabilities (deferred franchise fees) from contracts with customers:
June 30,2019 (a)
December 30,2018 (a)
Receivables, which are included in “Accounts and notes receivable, net” (b) $ 43,398 $ 40,300Receivables, which are included in “Advertising funds restricted assets” 49,308 47,332Deferred franchise fees (c) 101,267 102,205_______________
(a) Excludes funds collected from the sale of gift cards, which are primarily reimbursed to franchisees upon redemption at franchised restaurants and do notultimately result in the recognition of revenue in the Company’s condensed consolidated statements of operations.
(b) Includes receivables related to “ Sales ” and “ Franchise royalty revenue and fees .”
(c) Deferred franchise fees are included in “ Accrued expenses and other current liabilities ” and “ Deferred franchise fees ” and totaled $9,679 and $91,588as of June 30, 2019 , respectively, and $9,973 and $92,232 as of December 30, 2018 , respectively.
Significant changes in deferred franchise fees are as follows:
Six Months Ended
June 30, 2019
July 1, 2018
Deferred franchise fees at beginning of period $ 102,205 $ 102,492Revenue recognized during the period (4,609) (5,127)New deferrals due to cash received and other 3,671 6,358
Deferred franchise fees at end of period $ 101,267 $ 103,723
Anticipated Future Recognition of Deferred Franchise Fees
The following table reflects the estimated franchise fees to be recognized in the future related to performance obligations that are unsatisfied at the end of theperiod:
Estimate for fiscal year: 2019 (a) $ 4,2602020 7,0252021 5,9852022 5,7822023 5,527Thereafter 72,688
$ 101,267_______________
(a) Represents franchise fees expected to be recognized for the remainder of 2019, which includes development-related franchise fees expected to berecognized over a duration of one year or less.
14

Table of ContentsTHE WENDY’S COMPANY AND SUBSIDIARIES
NOTES TO CONDENSED CONSOLIDATED FINANCIAL STATEMENTS(In Thousands Except Per Share Amounts)
(4) Acquisitions
During the six months ended June 30, 2019, the Company acquired five restaurants from franchisees for total net cash consideration of $5,052 . The Companydid not incur any material acquisition-related costs associated with the acquisitions and such transactions were not significant to our condensed consolidatedfinancial statements. The table below presents the allocation of the total purchase price to the fair value of assets acquired and liabilities assumed for restaurantsacquired from franchisees:
Six Months Ended
June 30, 2019
Restaurants acquired from franchisees 5
Total consideration paid, net of cash received $ 5,052Identifiable assets acquired and liabilities assumed:
Properties 666Acquired franchise rights 1,354Finance lease assets 5,350Finance lease liabilities (4,084)Other (2,316)
Total identifiable net assets 970
Goodwill $ 4,082
During 2018, the Company acquired 16 restaurants from a franchisee for total net cash consideration of $21,401 . The fair values of the identifiable intangibleassets related to the acquisition were provisional amounts as of December 30, 2018 , pending final purchase accounting adjustments. The Company finalized thepurchase price allocation during the three months ended March 31, 2019, which resulted in a decrease in the fair value of acquired franchise rights of $2,989 and anincrease in deferred tax assets of $140 .
(5) System Optimization (Gains) Losses, Net
The Company’s system optimization initiative includes a shift from Company-operated restaurants to franchised restaurants over time, through acquisitionsand dispositions, as well as facilitating franchisee-to-franchisee restaurant transfers (“Franchise Flips”). As of January 1, 2017, the Company completed its plan toreduce its ongoing Company-operated restaurant ownership to approximately 5% of the total system. While the Company has no plans to reduce its ownershipbelow the approximately 5% level, the Company expects to continue to optimize the Wendy’s system through Franchise Flips, as well as evaluating strategicacquisitions of franchised restaurants and strategic dispositions of Company-operated restaurants to existing and new franchisees, to further strengthen thefranchisee base, drive new restaurant development and accelerate reimages.
During the six months ended July 1, 2018 , the Company completed the sale of three Company-operated restaurants to a franchisee and facilitated 64 FranchiseFlips. During the six months ended June 30, 2019, no Company-operated restaurants were sold to franchisees and no Franchise Flips were facilitated by theCompany.
Gains and losses recognized on dispositions are recorded to “ System optimization (gains) losses, net ” in our condensed consolidated statements of operations.Costs related to acquisitions and dispositions under our system optimization initiative are recorded to “Reorganization and realignment costs,” which are furtherdescribed in Note 6 . All other costs incurred related to facilitating Franchise Flips are recorded to “ Franchise support and other costs .”
15
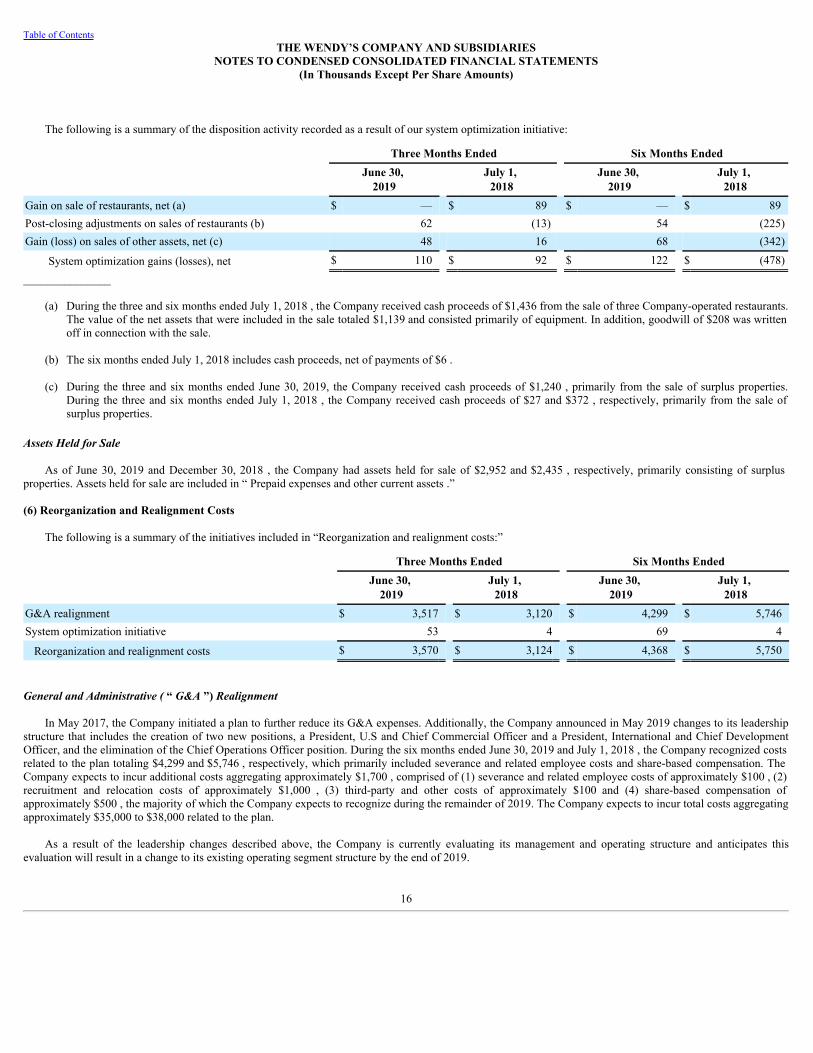
Table of ContentsTHE WENDY’S COMPANY AND SUBSIDIARIES
NOTES TO CONDENSED CONSOLIDATED FINANCIAL STATEMENTS(In Thousands Except Per Share Amounts)
The following is a summary of the disposition activity recorded as a result of our system optimization initiative:
Three Months Ended Six Months Ended
June 30, 2019
July 1, 2018
June 30, 2019
July 1, 2018
Gain on sale of restaurants, net (a) $ — $ 89 $ — $ 89Post-closing adjustments on sales of restaurants (b) 62 (13) 54 (225)Gain (loss) on sales of other assets, net (c) 48 16 68 (342)
System optimization gains (losses), net $ 110 $ 92 $ 122 $ (478)_______________
(a) During the three and six months ended July 1, 2018 , the Company received cash proceeds of $1,436 from the sale of three Company-operated restaurants.The value of the net assets that were included in the sale totaled $1,139 and consisted primarily of equipment. In addition, goodwill of $208 was writtenoff in connection with the sale.
(b) The six months ended July 1, 2018 includes cash proceeds, net of payments of $6 .
(c) During the three and six months ended June 30, 2019, the Company received cash proceeds of $1,240 , primarily from the sale of surplus properties.During the three and six months ended July 1, 2018 , the Company received cash proceeds of $27 and $372 , respectively, primarily from the sale ofsurplus properties.
Assets Held for Sale
As of June 30, 2019 and December 30, 2018 , the Company had assets held for sale of $2,952 and $2,435 , respectively, primarily consisting of surplusproperties. Assets held for sale are included in “ Prepaid expenses and other current assets .”
(6) Reorganization and Realignment Costs
The following is a summary of the initiatives included in “Reorganization and realignment costs:”
Three Months Ended Six Months Ended
June 30, 2019
July 1, 2018
June 30, 2019
July 1, 2018
G&A realignment $ 3,517 $ 3,120 $ 4,299 $ 5,746System optimization initiative 53 4 69 4
Reorganization and realignment costs $ 3,570 $ 3,124 $ 4,368 $ 5,750
General and Administrative ( “ G&A ”) Realignment
In May 2017, the Company initiated a plan to further reduce its G&A expenses. Additionally, the Company announced in May 2019 changes to its leadershipstructure that includes the creation of two new positions, a President, U.S and Chief Commercial Officer and a President, International and Chief DevelopmentOfficer, and the elimination of the Chief Operations Officer position. During the six months ended June 30, 2019 and July 1, 2018 , the Company recognized costsrelated to the plan totaling $4,299 and $5,746 , respectively, which primarily included severance and related employee costs and share-based compensation. TheCompany expects to incur additional costs aggregating approximately $1,700 , comprised of (1) severance and related employee costs of approximately $100 , (2)recruitment and relocation costs of approximately $1,000 , (3) third-party and other costs of approximately $100 and (4) share-based compensation ofapproximately $500 , the majority of which the Company expects to recognize during the remainder of 2019. The Company expects to incur total costs aggregatingapproximately $35,000 to $38,000 related to the plan.
As a result of the leadership changes described above, the Company is currently evaluating its management and operating structure and anticipates thisevaluation will result in a change to its existing operating segment structure by the end of 2019.
16

Table of ContentsTHE WENDY’S COMPANY AND SUBSIDIARIES
NOTES TO CONDENSED CONSOLIDATED FINANCIAL STATEMENTS(In Thousands Except Per Share Amounts)
The following is a summary of the activity recorded as a result of the G&A realignment plan:
Three Months Ended Six Months Ended Total Incurred Since
Inception June 30, 2019
July 1, 2018
June 30, 2019
July 1, 2018
Severance and related employee costs $ 2,130 $ 1,052 $ 2,602 $ 3,111 $ 21,355Recruitment and relocation costs 482 360 596 508 2,162Third-party and other costs 71 604 87 932 2,197 2,683 2,016 3,285 4,551 25,714Share-based compensation (a) 834 1,104 1,014 1,195 7,698Termination of defined benefit plans — — — — 1,335
Total G&A realignment $ 3,517 $ 3,120 $ 4,299 $ 5,746 $ 34,747_______________
(a) Primarily represents incremental share-based compensation resulting from the modification of stock options in connection with the termination ofemployees under our G&A realignment plan.
The accruals for our G&A realignment plan are included in “Accrued expenses and other current liabilities” and “Other liabilities” and totaled $4,835 and$607 as of June 30, 2019 , respectively, and $7,985 and $2,107 as of July 1, 2018, respectively. The tables below present a rollforward of our accruals for the plan.
BalanceDecember 30,
2018 Charges Payments
BalanceJune 30,2019
Severance and related employee costs $ 7,241 $ 2,602 $ (4,724) $ 5,119Recruitment and relocation costs 83 596 (356) 323Third-party and other costs — 87 (87) —
$ 7,324 $ 3,285 $ (5,167) $ 5,442
BalanceDecember 31,
2017 Charges Payments
BalanceJuly 1,2018
Severance and related employee costs $ 12,093 $ 3,111 $ (5,326) $ 9,878Recruitment and relocation costs 177 508 (471) 214Third-party and other costs — 932 (932) —
$ 12,270 $ 4,551 $ (6,729) $ 10,092
System Optimization Initiative
The Company recognizes costs related to acquisitions and dispositions under its system optimization initiative. The Company has incurred costs of $72,261under the initiative since inception and expects to incur additional costs of approximately $500 during the remainder of 2019, which are primarily comprised ofprofessional fees.
17

Table of ContentsTHE WENDY’S COMPANY AND SUBSIDIARIES
NOTES TO CONDENSED CONSOLIDATED FINANCIAL STATEMENTS(In Thousands Except Per Share Amounts)
(7) Investments
Equity Investments
Wendy’s has a 50% share in a partnership in a Canadian restaurant real estate joint venture (“TimWen”) with a subsidiary of Restaurant Brands InternationalInc., a quick-service restaurant company that owns the Tim Hortons ® brand. (Tim Hortons is a registered trademark of Tim Hortons USA Inc.) In addition, awholly-owned subsidiary of Wendy’s has a 20% share in a joint venture for the operation of Wendy’s restaurants in Brazil (the “Brazil JV”). The Company hassignificant influence over these investees. Such investments are accounted for using the equity method of accounting, under which our results of operations includeour share of the income (loss) of the investees in “ Other operating income, net .”
Presented below is activity related to our investment in TimWen and the Brazil JV included in our condensed consolidated financial statements:
Six Months Ended
June 30, 2019
July 1, 2018
Balance at beginning of period $ 47,021 $ 55,363
Investment — 13
Equity in earnings for the period 6,048 4,827Amortization of purchase price adjustments (a) (1,129) (1,179) 4,919 3,648Distributions received (7,018) (5,756)Foreign currency translation adjustment included in “Other comprehensive income (loss), net” and other 2,359 (1,763)
Balance at end of period $ 47,281 $ 51,505_______________
(a) Purchase price adjustments that impacted the carrying value of the Company’s investment in TimWen are being amortized over the average originalaggregate life of 21 years .
18

Table of ContentsTHE WENDY’S COMPANY AND SUBSIDIARIES
NOTES TO CONDENSED CONSOLIDATED FINANCIAL STATEMENTS(In Thousands Except Per Share Amounts)
(8) Long-Term Debt
Long-term debt consisted of the following:
June 30, 2019
December 30, 2018
Series 2019-1 Class A-2 Notes: 3.783% Series 2019-1 Class A-2-I Notes, anticipated repayment date 2026 $ 400,000 $ —4.080% Series 2019-1 Class A-2-II Notes, anticipated repayment date 2029 450,000 —
Series 2018-1 Class A-2 Notes: 3.573% Series 2018-1 Class A-2-I Notes, anticipated repayment date 2025 443,250 445,5003.884% Series 2018-1 Class A-2-II Notes, anticipated repayment date 2028 467,875 470,250
Series 2015-1 Class A-2 Notes: 4.080% Series 2015-1 Class A-2-II Notes, repaid in connection with the June 2019 refinancing — 870,7504.497% Series 2015-1 Class A-2-III Notes, anticipated repayment date 2025 481,250 483,750
7% debentures, due in 2025 91,403 90,769Unamortized debt issuance costs (36,061) (32,217) 2,297,717 2,328,802Less amounts payable within one year (22,750) (23,250)
Total long-term debt $ 2,274,967 $ 2,305,552
On June 26, 2019, Wendy’s Funding, LLC (the “Master Issuer”), a limited-purpose, bankruptcy-remote, wholly-owned indirect subsidiary of the Company,completed a debt refinancing transaction under which the Master Issuer issued fixed rate senior secured notes in the following 2019-1 series: Class A-2-I with aninitial principal amount of $400,000 and Class A-2-II with an initial principal amount of $450,000 (collectively, the “Series 2019-1 Class A-2 Notes”). Interestpayments on the Series 2019-1 Class A-2 Notes are payable on a quarterly basis. The legal final maturity date of the Series 2019-1 Class A-2 Notes is in June 2049.If the Master Issuer has not repaid or refinanced the Series 2019-1 Class A-2 Notes prior to the respective anticipated repayment date, additional interest willaccrue on each tranche of the Series 2019-1 Class A-2 Notes at a rate equal to the greater of (A) 5.00% per annum and (B) a per annum interest rate equal to theamount, if any, by which the sum of (i) the yield to maturity (adjusted to a quarterly bond-equivalent basis) on such anticipated repayment date of the United StatesTreasury Security having a term closest to 10 years , plus (ii) 5.00% , plus (iii) (1) with respect to the Series 2019-1 Class A-2-I Notes, 1.863% , and (2) withrespect to the Series 2019-1 Class A-2-II Notes, 2.051% , exceeds the original interest rate with respect to such tranche. The Master Issuer’s outstanding Series2015-1 Class A-2-II Notes were repaid as part of the refinancing transaction. As a result, the Company recorded a loss on early extinguishment of debt of $7,150during the three months ended June 30, 2019, which was comprised of the write-off of certain unamortized deferred financing costs. The Series 2019-1 Class A-2Notes have scheduled principal payments of $4,250 in 2019, $8,500 annually from 2020 through 2025, $378,500 in 2026, $4,500 in each of 2027 and 2028 and$407,250 in 2029.
In connection with the issuance of the Series 2019-1 Class A-2 Notes, the Master Issuer also entered into a revolving financing facility of Series 2019-1Variable Funding Senior Secured Notes, Class A-1 (the “Series 2019-1 Class A-1 Notes” and, together with the Series 2019-1 Class A-2 Notes, the “Series 2019-1Senior Notes”), which allows for the drawing of up to $150,000 on a revolving basis using various credit instruments, including a letter of credit facility. Noamounts were borrowed under the Series 2019-1 Class A-1 Notes during the three months ended June 30, 2019. The Series 2019-1 Class A-1 Notes replaced theCompany’s $150,000 Series 2018-1 Class A-1 Notes, which were canceled on the closing date, and the letters of credit outstanding against the Series 2018-1 ClassA-1 Notes were transferred to the Series 2019-1 Class A-1 Notes.
The Series 2019-1 Senior Notes are secured by substantially all of the assets of the Master Issuer and certain other limited-purpose, bankruptcy-remote,wholly-owned indirect subsidiaries of the Company that act as guarantors (the “Guarantors”), excluding certain real estate assets and subject to certain limitations.The Series 2019-1 Senior Notes are subject to the same series of covenants and restrictions as the Company’s outstanding Series 2018-1 Class A-2 Notes andSeries 2015-1 Class A-2 Notes.
19

Table of ContentsTHE WENDY’S COMPANY AND SUBSIDIARIES
NOTES TO CONDENSED CONSOLIDATED FINANCIAL STATEMENTS(In Thousands Except Per Share Amounts)
During the three and six months ended June 30, 2019, the Company incurred debt issuance costs of $14,008 in connection with the issuance of the Series2019-1 Senior Notes. The debt issuance costs will be amortized to “Interest expense, net” through the anticipated repayment dates of the Series 2019-1 SeniorNotes utilizing the effective interest rate method.
Wendy’s U.S. advertising fund has a revolving line of credit of $25,000 . Neither the Company nor Wendy’s is the guarantor of the debt. The advertising fundfacility was established to fund the advertising fund operations. During the six months ended July 1, 2018 , the Company borrowed $5,809 and repaid $7,096 underthe line of credit. There were no borrowings or repayments under the line of credit during the six months ended June 30, 2019.
(9) Fair Value Measurements
Fair value is defined as the price that would be received to sell an asset or paid to transfer a liability in an orderly transaction between market participants atthe measurement date. Valuation techniques under the accounting guidance related to fair value measurements are based on observable and unobservable inputs.Observable inputs reflect readily obtainable data from independent sources, while unobservable inputs reflect our market assumptions. These inputs are classifiedinto the following hierarchy:
• Level 1 Inputs - Quoted prices for identical assets or liabilities in active markets.
• Level 2 Inputs - Quoted prices for similar assets or liabilities in active markets; quoted prices for identical or similar assets or liabilities in markets that arenot active; and model-derived valuations whose inputs are observable or whose significant value drivers are observable.
• Level 3 Inputs - Pricing inputs are unobservable for the assets or liabilities and include situations where there is little, if any, market activity for the assetsor liabilities. The inputs into the determination of fair value require significant management judgment or estimation.
Financial Instruments
The following table presents the carrying amounts and estimated fair values of the Company’s financial instruments:
June 30, 2019
December 30, 2018
CarryingAmount
FairValue
CarryingAmount
FairValue
Fair ValueMeasurements
Financial assets Cash equivalents $ 221,818 $ 221,818 $ 222,228 $ 222,228 Level 1Other investments in equity securities (a) 639 1,945 639 2,181 Level 3
Financial liabilities Series 2019-1 Class A-2-I Notes (b) 400,000 402,704 — — Level 2Series 2019-1 Class A-2-II Notes (b) 450,000 453,146 — — Level 2Series 2018-1 Class A-2-I Notes (b) 443,250 446,747 445,500 424,026 Level 2Series 2018-1 Class A-2-II Notes (b) 467,875 469,756 470,250 439,353 Level 2Series 2015-1 Class A-2-II Notes (b) — — 870,750 865,342 Level 2Series 2015-1 Class A-2-III Notes (b) 481,250 500,519 483,750 482,522 Level 27% debentures, due in 2025 (b) 91,403 105,750 90,769 102,750 Level 2Guarantees of franchisee loan obligations (c) 9 9 17 17 Level 3
_______________
(a) The fair values of our investments are not significant and are based on our review of information provided by the investment managers or investees whichwas based on (1) valuations performed by the investment managers or investees, (2) quoted market or broker/dealer prices for similar investments and (3)quoted market or broker/dealer prices adjusted by the investment managers for legal or contractual restrictions, risk of nonperformance or lack ofmarketability, depending upon the underlying investments.
20

Table of ContentsTHE WENDY’S COMPANY AND SUBSIDIARIES
NOTES TO CONDENSED CONSOLIDATED FINANCIAL STATEMENTS(In Thousands Except Per Share Amounts)
(b) The fair values were based on quoted market prices in markets that are not considered active markets.
(c) Wendy’s has provided loan guarantees to various lenders on behalf of franchisees entering into debt arrangements for equipment financing. We haveaccrued a liability for the fair value of these guarantees, the calculation of which was based upon a weighted average risk percentage.
The carrying amounts of cash, accounts payable and accrued expenses approximated fair value due to the short-term nature of those items. The carryingamounts of accounts and notes receivable, net (both current and non-current) approximated fair value due to the effect of the related allowance for doubtfulaccounts. Our cash equivalents and guarantees are the only financial assets and liabilities measured and recorded at fair value on a recurring basis.
Non-Recurring Fair Value Measurements
Assets and liabilities remeasured to fair value on a non-recurring basis resulted in impairment that we have recorded to “Impairment of long-lived assets” inour condensed consolidated statements of operations.
Total impairment losses may reflect the impact of remeasuring long-lived assets held and used (including land, buildings, leasehold improvements, favorablelease assets and ROU assets) to fair value as a result of (1) declines in operating performance at Company-operated restaurants and (2) the Company’s decision tolease and/or sublease the land and/or buildings to franchisees in connection with the sale or anticipated sale of restaurants, including any subsequent leasemodifications. The fair values of long-lived assets held and used presented in the tables below represents the remaining carrying value and were estimated based oneither discounted cash flows of future anticipated lease and sublease income or discounted cash flows of future anticipated Company-operated restaurantperformance.
Total impairment losses may also include the impact of remeasuring long-lived assets held for sale, which primarily include surplus properties. The fair valuesof long-lived assets held for sale presented in the tables below represents the remaining carrying value and were estimated based on current market values. SeeNote 10 for further information on impairment of our long-lived assets.
Fair Value Measurements
June 30, 2019 Level 1 Level 2 Level 3
Held and used $ 2,112 $ — $ — $ 2,112Held for sale 1,215 — — 1,215
Total $ 3,327 $ — $ — $ 3,327
Fair Value Measurements
December 30,
2018 Level 1 Level 2 Level 3Held and used $ 462 $ — $ — $ 462Held for sale 1,031 — — 1,031
Total $ 1,493 $ — $ — $ 1,493
(10) Impairment of Long-Lived Assets
The Company records impairment charges as a result of (1) the deterioration of operating performance of certain Company-operated restaurants, (2) closingCompany-operated restaurants and classifying such surplus properties as held for sale and (3) the Company’s decision to lease and/or sublease properties tofranchisees in connection with the sale or anticipated sale of Company-operated restaurants, including any subsequent lease modifications.
21
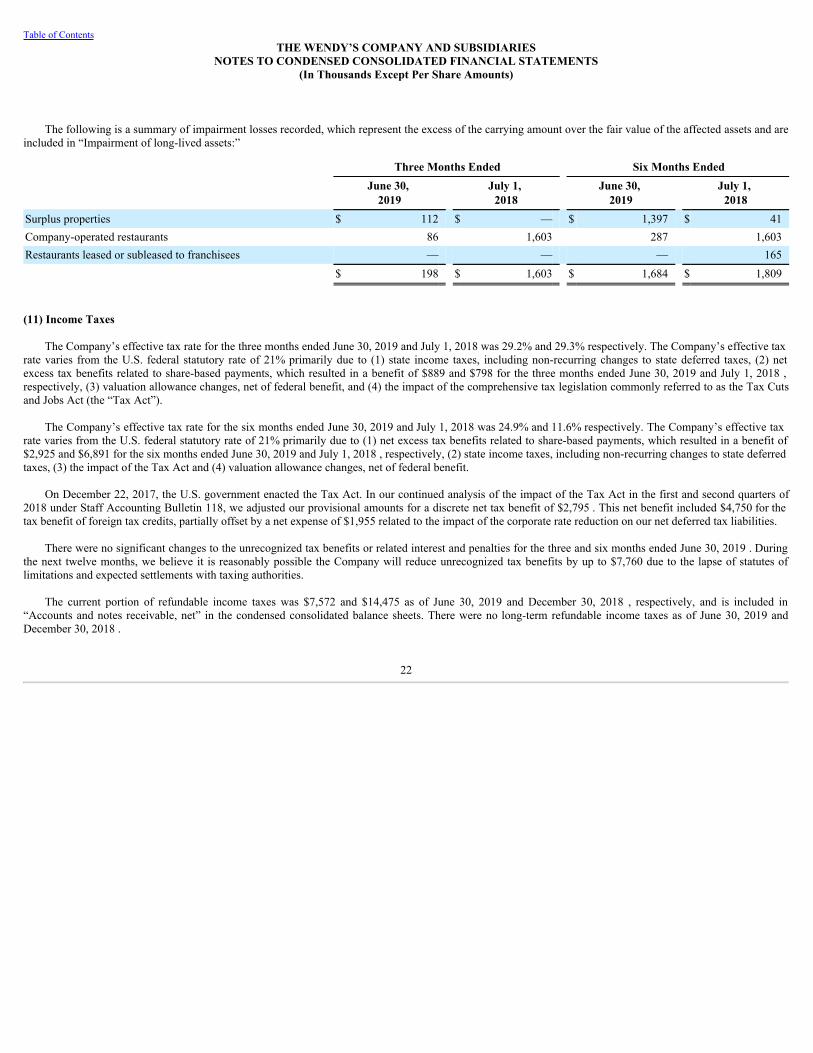
Table of ContentsTHE WENDY’S COMPANY AND SUBSIDIARIES
NOTES TO CONDENSED CONSOLIDATED FINANCIAL STATEMENTS(In Thousands Except Per Share Amounts)
The following is a summary of impairment losses recorded, which represent the excess of the carrying amount over the fair value of the affected assets and areincluded in “Impairment of long-lived assets:”
Three Months Ended Six Months Ended
June 30, 2019
July 1, 2018
June 30, 2019
July 1, 2018
Surplus properties $ 112 $ — $ 1,397 $ 41Company-operated restaurants 86 1,603 287 1,603Restaurants leased or subleased to franchisees — — — 165
$ 198 $ 1,603 $ 1,684 $ 1,809
(11) Income Taxes
The Company’s effective tax rate for the three months ended June 30, 2019 and July 1, 2018 was 29.2% and 29.3% respectively. The Company’s effective taxrate varies from the U.S. federal statutory rate of 21% primarily due to (1) state income taxes, including non-recurring changes to state deferred taxes, (2) netexcess tax benefits related to share-based payments, which resulted in a benefit of $889 and $798 for the three months ended June 30, 2019 and July 1, 2018 ,respectively, (3) valuation allowance changes, net of federal benefit, and (4) the impact of the comprehensive tax legislation commonly referred to as the Tax Cutsand Jobs Act (the “Tax Act”).
The Company’s effective tax rate for the six months ended June 30, 2019 and July 1, 2018 was 24.9% and 11.6% respectively. The Company’s effective taxrate varies from the U.S. federal statutory rate of 21% primarily due to (1) net excess tax benefits related to share-based payments, which resulted in a benefit of$2,925 and $6,891 for the six months ended June 30, 2019 and July 1, 2018 , respectively, (2) state income taxes, including non-recurring changes to state deferredtaxes, (3) the impact of the Tax Act and (4) valuation allowance changes, net of federal benefit.
On December 22, 2017, the U.S. government enacted the Tax Act. In our continued analysis of the impact of the Tax Act in the first and second quarters of2018 under Staff Accounting Bulletin 118, we adjusted our provisional amounts for a discrete net tax benefit of $2,795 . This net benefit included $4,750 for thetax benefit of foreign tax credits, partially offset by a net expense of $1,955 related to the impact of the corporate rate reduction on our net deferred tax liabilities.
There were no significant changes to the unrecognized tax benefits or related interest and penalties for the three and six months ended June 30, 2019 . Duringthe next twelve months, we believe it is reasonably possible the Company will reduce unrecognized tax benefits by up to $7,760 due to the lapse of statutes oflimitations and expected settlements with taxing authorities.
The current portion of refundable income taxes was $7,572 and $14,475 as of June 30, 2019 and December 30, 2018 , respectively, and is included in“Accounts and notes receivable, net” in the condensed consolidated balance sheets. There were no long-term refundable income taxes as of June 30, 2019 andDecember 30, 2018 .
22

Table of ContentsTHE WENDY’S COMPANY AND SUBSIDIARIES
NOTES TO CONDENSED CONSOLIDATED FINANCIAL STATEMENTS(In Thousands Except Per Share Amounts)
(12) Net Income Per Share
Basic net income per share was computed by dividing net income amounts by the weighted average number of shares of common stock outstanding.
The weighted average number of shares used to calculate basic and diluted net income per share were as follows:
Three Months Ended Six Months Ended
June 30, 2019
July 1, 2018
June 30, 2019
July 1, 2018
Common stock: Weighted average basic shares outstanding 231,029 238,991 230,807 239,459Dilutive effect of stock options and restricted shares 5,064 7,161 5,186 7,826
Weighted average diluted shares outstanding 236,093 246,152 235,993 247,285
Diluted net income per share for the three and six months ended June 30, 2019 and July 1, 2018 was computed by dividing net income by the weightedaverage number of basic shares outstanding plus the potential common share effect of dilutive stock options and restricted shares. We excluded potential commonshares of 2,049 and 2,104 for the three and six months ended June 30, 2019 , respectively, and 27 and 1,369 for the three and six months ended July 1, 2018 ,respectively, from our diluted net income per share calculation as they would have had anti-dilutive effects.
(13) Stockholders’ Equity
Dividends
During each of the first and second quarters of 2019, the Company paid quarterly cash dividends of $.10 per share. During each of the first and second quartersof 2018, the Company paid quarterly cash dividends of $.085 per share.
Repurchases of Common Stock
In February 2019, our Board of Directors authorized a repurchase program for up to $225,000 of our common stock through March 1, 2020, when and ifmarket conditions warrant and to the extent legally permissible. In connection with the February 2019 authorization, the Company’s previous November 2018repurchase authorization for up to $220,000 of our common stock was canceled. During the six months ended June 30, 2019 , the Company repurchased 2,824shares with an aggregate purchase price of $49,721 , of which $807 was accrued at June 30, 2019 , and excluding commissions of $40 , under the November 2018and February 2019 authorizations. As of June 30, 2019 , the Company had $196,736 of availability remaining under its February 2019 authorization. Subsequentto June 30, 2019 through July 31, 2019 , the Company repurchased 521 shares under the February 2019 authorization with an aggregate purchase price of $9,980 , excluding commissions of $7 .
In February 2018, our Board of Directors authorized a repurchase program for up to $175,000 of our common stock through March 3, 2019, when and ifmarket conditions warranted and to the extent legally permissible. During the six months ended July 1, 2018 , the Company repurchased 3,675 shares under theFebruary 2018 repurchase authorization with an aggregate purchase price of $62,490 , of which $2,146 was accrued at July 1, 2018 , and excluding commissions of$52 . Additionally, during the six months ended July 1, 2018 , the Company completed its previous February 2017 repurchase authorization for up to $150,000 ofour common stock with the repurchase of 1,385 shares with an aggregate purchase price of $22,633 , excluding commissions of $19 .
23

Table of ContentsTHE WENDY’S COMPANY AND SUBSIDIARIES
NOTES TO CONDENSED CONSOLIDATED FINANCIAL STATEMENTS(In Thousands Except Per Share Amounts)
Accumulated Other Comprehensive Loss
The following table provides a rollforward of the components of accumulated other comprehensive loss, net of tax as applicable:
Foreign Currency
Translation Pension TotalBalance at December 30, 2018 $ (61,673) $ — $ (61,673)
Current-period other comprehensive income 9,860 — 9,860
Balance at June 30, 2019 $ (51,813) $ — $ (51,813)
Balance at December 31, 2017 $ (45,149) $ (1,049) $ (46,198)Current-period other comprehensive (loss) income (10,369) 117 (10,252)
Balance at July 1, 2018 $ (55,518) $ (932) $ (56,450)
(14) Leases
Nature of Leases
The Company operates restaurants that are located on sites owned by us and sites leased by us from third parties. In addition, the Company owns sites andleases sites from third parties, which it leases and/or subleases to franchisees. At June 30, 2019, Wendy’s and its franchisees operated 6,719 Wendy’s restaurants.Of the 358 Company-operated Wendy’s restaurants, Wendy’s owned the land and building for 144 restaurants, owned the building and held long-term land leasesfor 144 restaurants and held leases covering the land and building for 70 restaurants. Wendy’s also owned 513 and leased 1,264 properties that were either leasedor subleased principally to franchisees. The Company also leases restaurant, office and transportation equipment.
Determination of Whether a Contract Contains a Lease
The Company evaluates the contracts it enters into to determine whether such contracts contain leases. A contract contains a lease if the contract conveys theright to control the use of identified property, plant or equipment for a period of time in exchange for consideration. At commencement, contracts containing alease are further evaluated for classification as an operating or finance lease where the Company is a lessee, or as an operating, sales-type or direct financing leasewhere the Company is a lessor, based on their terms.
ROU Model and Determination of Lease Term
The Company uses the ROU model to account for leases where the Company is the lessee, which requires an entity to recognize a lease liability and ROUasset on the lease commencement date. A lease liability is measured equal to the present value of the remaining lease payments over the lease term and isdiscounted using the incremental borrowing rate, as the rate implicit in the Company’s leases is not readily determinable. The incremental borrowing rate is the rateof interest that the Company would have to pay to borrow, on a collateralized basis over a similar term, an amount equal to the lease payments in a similareconomic environment. Lease payments include payments made before the commencement date and any residual value guarantees, if applicable. The initial ROUasset consists of the initial measurement of the lease liability, adjusted for any favorable or unfavorable terms for leases acquired from franchisees, as well aspayments made before the commencement date, initial direct costs and lease incentives earned. When determining the lease term, the Company includes optionperiods that it is reasonably certain to exercise as failure to renew the lease would impose a significant economic detriment. For properties used for Company-operated restaurants, the primary economic detriment relates to the existence of unamortized leasehold improvements which might be impaired if we choose not toexercise the available renewal options. The lease term for properties leased or subleased to franchisees is determined based upon the economic detriment to thefranchisee and includes consideration of the length of the franchise agreement, historical performance of the restaurant and the existence of bargain renewaloptions. Lease terms for real estate are generally initially between 15 and 20 years and, in most cases, provide for rent escalations and renewal options.
24

Table of ContentsTHE WENDY’S COMPANY AND SUBSIDIARIES
NOTES TO CONDENSED CONSOLIDATED FINANCIAL STATEMENTS(In Thousands Except Per Share Amounts)
Operating Leases
For operating leases, minimum lease payments or receipts, including minimum scheduled rent increases, are recognized as rent expense where the Company isa lessee, or income where the Company is a lessor, as applicable, on a straight-line basis (“Straight-Line Rent”) over the applicable lease terms. There is a periodunder certain lease agreements referred to as a rent holiday (“Rent Holiday”) that generally begins on the possession date and ends on the rent commencement date.During a Rent Holiday, no cash rent payments are typically due under the terms of the lease; however, expense is recorded for that period on a straight-line basis.The excess of the Straight-Line Rent over the minimum rents paid is included in the ROU asset where the Company is a lessee. The excess of the Straight-LineRent over the minimum rents received is recorded as a deferred lease asset and is included in “Other assets” where the Company is a lessor. Certain leases containprovisions, referred to as contingent rent (“Contingent Rent”), that require additional rental payments based upon restaurant sales volume. Contingent Rent isrecognized each period as the liability is incurred or the asset is earned.
Lease cost for operating leases is recognized on a straight-line basis and includes the amortization of the ROU asset and interest expense related to theoperating lease liability. Variable lease cost for operating leases includes Contingent Rent and payments for executory costs such as real estate taxes, insurance andcommon area maintenance, which are excluded from the measurement of the lease liability. Short-term lease cost for operating leases includes rental expense forleases with a term of less than 12 months. Lease costs are recorded in the condensed consolidated statements of operations based on the nature of the underlyinglease as follows: (1) rental expense related to leases for Company-operated restaurants is recorded to “Cost of sales,” (2) rental expense for leased properties thatare subsequently subleased to franchisees is recorded to “Franchise rental expense” and (3) rental expense related to leases for corporate offices and equipment isrecorded to “General and administrative.”
Favorable and unfavorable lease amounts for operating leases where the Company is the lessor are recorded as components of “Other intangible assets” and“Other liabilities,” respectively. Favorable and unfavorable lease amounts are amortized on a straight-line basis over the term of the leases. When the expected termof a lease is determined to be shorter than the original amortization period, the favorable or unfavorable lease balance associated with the lease is adjusted to reflectthe revised lease term.
Rental income and favorable and unfavorable lease amortization for operating leases on properties leased or subleased to franchisees is recorded to “Franchiserental income.” Lessees’ variable payments to the Company for executory costs under operating leases are recognized on a gross basis as “Franchise rental income”with a corresponding expense recorded to “Franchise rental expense.”
Finance Leases
Lease cost for finance leases includes the amortization of the ROU asset, which is amortized on a straight-line basis and recorded to “Depreciation andamortization,” and interest expense on the finance lease liability, which is calculated using the interest method and recorded to “Interest expense, net.”
Sales-Type and Direct Financing Leases
For sales-type and direct financing leases where the Company is the lessor, the Company records its investment in properties leased to franchisees on a netbasis, which is comprised of the present value of the lease payments not yet received and the present value of the guaranteed and unguaranteed residual assets. Thecurrent and long-term portions of our net investment in sales-type and direct financing leases are included in “Accounts and notes receivable, net” and “Netinvestment in sales-type and direct financing leases,” respectively. Unearned income is recognized as interest income over the lease term and is included in“Interest expense, net.” Sales-type leases result in the recognition of gain or loss at the commencement of the lease, which is recorded to “ Other operating income,net .” The gain or loss recognized upon commencement of the lease is directly affected by the Company’s estimate of the amount to be derived from the guaranteedand unguaranteed residual assets at the end of the lease term. The Company’s main component of this estimate is the expected fair value of the underlying assets,primarily the fair value of land. Lessees’ variable payments to the Company for executory costs under sales-type and direct financing leases are recognized on agross basis as “Franchise rental income” with a corresponding expense recorded to “Franchise rental expense.”
25

Table of ContentsTHE WENDY’S COMPANY AND SUBSIDIARIES
NOTES TO CONDENSED CONSOLIDATED FINANCIAL STATEMENTS(In Thousands Except Per Share Amounts)
Significant Assumptions and Judgments
Management makes certain estimates and assumptions regarding each new lease and sublease agreement, renewal and amendment, including, but not limitedto, property values, market rents, property lives, discount rates and probable term, all of which can impact (1) the classification and accounting for a lease orsublease as operating or finance, including sales-type and direct financing, (2) the Rent Holiday and escalations in payment that are taken into consideration whencalculating Straight-Line Rent, (3) the term over which leasehold improvements for each restaurant are amortized and (4) the values and lives of adjustments to theinitial ROU asset where the Company is the lessee, or favorable and unfavorable leases where the Company is the lessor. The amount of depreciation andamortization, interest and rent expense and income reported would vary if different estimates and assumptions were used.
Company as Lessee
The components of lease cost are as follows:
Three Months
Ended Six Months Ended
June 30, 2019
June 30, 2019
Finance lease cost: Amortization of finance lease assets $ 1,631 $ 4,748Interest on finance lease liabilities 9,939 16,692
11,570 21,440Operating lease cost 19,086 43,729Variable lease cost (a) 15,371 29,475Short-term lease cost 1,153 2,279
Total operating lease cost (b) 35,610 75,483
Total lease cost $ 47,180 $ 96,923_______________
(a) The three and six months ended June 30, 2019 includes expenses for executory costs of $9,779 and $19,303 , respectively, for which the Company isreimbursed by sublessees.
(b) The three and six months ended June 30, 2019 includes $28,022 and $60,473 , respectively, recorded to “Franchise rental expense” for leased propertiesthat are subsequently leased to franchisees and $7,007 and $13,600 , respectively, recorded to “Cost of sales” for leases for Company-operated restaurants.
The following table includes supplemental cash flow and non-cash information related to leases:
Six Months Ended
June 30, 2019
Cash paid for amounts included in the measurement of lease liabilities: Operating cash flows from finance leases $ 19,567Operating cash flows from operating leases 46,425Financing cash flows from finance leases 3,521
Right-of-use assets obtained in exchange for lease obligations: Finance lease liabilities 23,534Operating lease liabilities 5,677
26

Table of ContentsTHE WENDY’S COMPANY AND SUBSIDIARIES
NOTES TO CONDENSED CONSOLIDATED FINANCIAL STATEMENTS(In Thousands Except Per Share Amounts)
The following table includes supplemental information related to leases:
June 30, 2019
Weighted-average remaining lease term (years): Finance leases 17.5Operating leases 15.7
Weighted average discount rate: Finance leases 10.11%Operating leases 5.10%
The following table illustrates the Company’s future minimum rental payments for non-cancelable leases as of June 30, 2019:
FinanceLeases
OperatingLeases
Fiscal Year Company-Operated Franchiseand Other Company-Operated
Franchiseand Other
2019 (a) $ 1,338 $ 23,714 $ 10,072 $ 35,6602020 2,697 44,918 19,921 71,5372021 2,808 46,315 19,733 71,4332022 2,858 47,322 19,421 71,6042023 2,810 48,988 19,400 71,571Thereafter 37,034 695,753 201,762 836,750Total minimum payments $ 49,545 $ 907,010 $ 290,309 $ 1,158,555Less interest (23,169) (458,243) (91,101) (383,409)
Present value of minimum lease payments (b) (c) $ 26,376 $ 448,767 $ 199,208 $ 775,146_______________
(a) Represents future minimum rental payments for non-cancelable leases for the remainder of 2019.
(b) The present value of minimum finance lease payments of $9,917 and $465,226 are included in “Current portion of finance lease liabilities” and “Long-term finance lease liabilities,” respectively.
(c) The present value of minimum operating lease payments of $43,321 and $931,033 are included in “Current portion of operating lease liabilities” and“Long-term operating lease liabilities,” respectively.
27

Table of ContentsTHE WENDY’S COMPANY AND SUBSIDIARIES
NOTES TO CONDENSED CONSOLIDATED FINANCIAL STATEMENTS(In Thousands Except Per Share Amounts)
The following table illustrates the Company’s future minimum rental payments for non-cancelable leases as of December 30, 2018:
FinanceLeases
OperatingLeases
Fiscal Year Company-Operated Franchiseand Other
Company-Operated
Franchiseand Other
2019 $ 1,962 $ 45,125 $ 20,174 $ 75,7032020 1,978 43,969 20,052 73,3202021 2,082 45,522 19,820 73,1672022 2,114 46,573 19,530 73,3002023 2,084 48,109 19,430 73,377Thereafter 23,558 676,139 203,073 854,964
Total minimum payments $ 33,778 $ 905,437 $ 302,079 $ 1,223,831
Less interest (16,874) (466,705)
Present value of minimum lease payments (a) $ 16,904 $ 438,732 _______________
(a) The present value of minimum finance lease payments of $8,405 and $447,231 are included in “Current portion of finance lease liabilities” and “Long-term finance lease liabilities,” respectively.
Company as Lessor
The components of lease income are as follows:
Three Months
Ended Six Months Ended
June 30, 2019
June 30, 2019
Sales-type and direct-financing leases: Selling profit $ 37 $ 1,971Interest income 7,072 11,805
Operating lease income $ 43,959 $ 89,164Variable lease income 14,602 27,849
Franchise rental income (a) $ 58,561 $ 117,013_______________
(a) Includes sublease income of $42,921 and $85,942 recognized during the three and six months ended June 30, 2019, respectively, of which $9,779 and$19,211 , respectively, represents lessees’ variable payments to the Company for executory costs.
28

Table of ContentsTHE WENDY’S COMPANY AND SUBSIDIARIES
NOTES TO CONDENSED CONSOLIDATED FINANCIAL STATEMENTS(In Thousands Except Per Share Amounts)
The following table illustrates the Company’s future minimum rental receipts for non-cancelable leases and subleases as of June 30, 2019:
Sales-Type and
Direct Financing Leases OperatingLeases
Fiscal Year Subleases Owned Properties Subleases Owned Properties2019 (a) $ 13,661 $ 1,028 $ 55,839 $ 26,2402020 27,872 2,130 112,551 52,8722021 28,910 2,162 113,162 54,6612022 29,548 2,243 114,269 56,1342023 30,587 2,287 115,190 56,339Thereafter 473,264 28,037 1,355,212 861,139
Total future minimum receipts 603,842 37,887 $ 1,866,223 $ 1,107,385
Unearned interest income (377,235) (20,405)
Net investment in sales-type and direct financing leases (b) $ 226,607 $ 17,482 _______________
(a) Represents future minimum rental receipts for non-cancelable leases for the remainder of 2019.
(b) The present value of minimum direct financing rental receipts of $2,505 and $241,584 are included in “Accounts and notes receivable, net” and “Netinvestment in sales-type and direct financing leases,” respectively. The present value of minimum direct financing rental receipts includes a netinvestment in unguaranteed residual assets of $237 .
The following table illustrates the Company’s future minimum rental receipts for non-cancelable leases and subleases as of December 30, 2018:
Sales-Type and
Direct Financing Leases OperatingLeases
Fiscal Year Subleases Owned Properties Subleases Owned Properties2019 $ 26,239 $ 1,937 $ 113,180 $ 52,5272020 26,859 2,006 113,578 53,0662021 27,904 2,043 114,447 54,6152022 28,563 2,119 115,552 56,0922023 29,512 2,159 116,463 56,284Thereafter 448,851 26,404 1,372,646 858,755
Total future minimum receipts 587,928 36,668 $ 1,945,866 $ 1,131,339
Unearned interest income (377,046) (20,338)
Net investment in sales-type and direct financing leases (a) $ 210,882 $ 16,330 _______________
(a) The present value of minimum direct financing rental receipts of $735 and $226,477 are included in “Accounts and notes receivable, net” and “Netinvestment in sales-type and direct financing leases,” respectively.
29

Table of ContentsTHE WENDY’S COMPANY AND SUBSIDIARIES
NOTES TO CONDENSED CONSOLIDATED FINANCIAL STATEMENTS(In Thousands Except Per Share Amounts)
Properties owned by the Company and leased to franchisees and other third parties under operating leases include:
June 30, 2019
Land $ 281,650Buildings and improvements 311,104Restaurant equipment 2,251 595,005Accumulated depreciation and amortization (149,931)
$ 445,074
(15) Transactions with Related Parties
Except as described below, the Company did not have any significant changes in or transactions with its related parties during the current fiscal period sincethose reported in the Form 10-K.
TimWen Lease and Management Fee Payments
A wholly-owned subsidiary of Wendy’s leases restaurant facilities from TimWen for the operation of Wendy’s/Tim Hortons combo units in Canada. Duringthe six months ended June 30, 2019 and July 1, 2018 , Wendy’s paid TimWen $8,140 and $6,504 , respectively, under these lease agreements. In addition, TimWenpaid Wendy’s a management fee under the TimWen joint venture agreement of $103 and $108 during the six months ended June 30, 2019 and July 1, 2018 ,respectively, which has been included as a reduction to “General and administrative.”
(16) Guarantees and Other Commitments and Contingencies
Except as described below, the Company did not have any significant changes in guarantees and other commitments and contingencies during the currentfiscal period since those reported in the Form 10-K. Refer to the Form 10-K for further information regarding the Company’s additional commitments andobligations.
Lease Guarantees
Wendy’s has guaranteed the performance of certain leases and other obligations, primarily from former Company-operated restaurant locations now operatedby franchisees, amounting to $68,953 as of June 30, 2019 . These leases extend through 2056. We have not received any notice of default related to these leases asof June 30, 2019 . In the event of default by a franchise owner, Wendy’s generally retains the right to acquire possession of the related restaurant locations.
Letters of Credit
As of June 30, 2019 , the Company had outstanding letters of credit with various parties totaling $25,086 . The outstanding letters of credit include amountsoutstanding against the Series 2019-1 Class A-1 Notes. We do not expect any material loss to result from these letters of credit.
30

Table of ContentsTHE WENDY’S COMPANY AND SUBSIDIARIES
NOTES TO CONDENSED CONSOLIDATED FINANCIAL STATEMENTS(In Thousands Except Per Share Amounts)
Purchase and Capital Commitments
Beverage Agreement
The Company has an agreement with a beverage vendor that provides fountain beverage products and certain marketing support funding to the Company andits franchisees. This agreement requires minimum purchases of certain fountain beverages (“Fountain Beverages”) by the Company and its franchisees at certainagreed upon prices until the total contractual gallon volume usage is reached. This agreement also provides for an annual advance to be paid to the Company basedon the vendor’s expectation of the Company’s annual Fountain Beverages usage, which is amortized over actual usage during the year. In January 2019, theCompany amended its contract with the beverage vendor, which now expires at the later of reaching a threshold usage requirement or December 31, 2025.Beverage purchases made by the Company under this agreement during the six months ended June 30, 2019 were $5,481 . As of June 30, 2019 , the Companyestimates future purchases to be approximately $5,400 for the remainder of 2019, $11,600 in 2020, $12,100 in 2021, $13,000 in 2022 and $13,700 in 2023 basedon current pricing and the expected ratio of usage at Company-operated restaurants to usage at franchised restaurants.
(17) Legal and Environmental Matters
The Company is involved in litigation and claims incidental to our current and prior businesses. We provide accruals for such litigation and claims whenpayment is probable and reasonably estimable. We believe we have adequate accruals for continuing operations for all of our legal and environmental matters. Wecannot estimate the aggregate possible range of loss for various reasons, including, but not limited to, many proceedings being in preliminary stages, with variousmotions either yet to be submitted or pending, discovery yet to occur and/or significant factual matters unresolved. In addition, most cases seek an indeterminateamount of damages and many involve multiple parties. Predicting the outcomes of settlement discussions or judicial or arbitral decisions is thus inherently difficultand future developments could cause these actions or claims, individually or in aggregate, to have a material adverse effect on the Company’s financial condition,results of operations or cash flows of a particular reporting period.
We previously described certain legal proceedings in the Form 10-K. As of June 30, 2019, there were no material developments in those legal proceedings.
31

Item 2. Management’s Discussion and Analysis of Financial Condition and Results of Operations .
Introduction
This “Management’s Discussion and Analysis of Financial Condition and Results of Operations” of The Wendy’s Company (“The Wendy’s Company” and,together with its subsidiaries, the “Company,” “we,” “us,” or “our”) should be read in conjunction with the accompanying unaudited condensed consolidatedfinancial statements and the related notes included elsewhere within this report and “Item 7. Management’s Discussion and Analysis of Financial Condition andResults of Operations” in our Annual Report on Form 10-K for the fiscal year ended December 30, 2018 (the “Form 10-K”). There have been no material changesas of June 30, 2019 to the application of our critical accounting policies as described in Item 7 of the Form 10-K. Certain statements we make under this Item 2constitute “forward-looking statements” under the Private Securities Litigation Reform Act of 1995. See “Special Note Regarding Forward-Looking Statementsand Projections” in “Part II - Other Information” of this report. You should consider our forward-looking statements in light of our unaudited condensedconsolidated financial statements, related notes and other financial information appearing elsewhere in this report, the Form 10-K and our other filings with theSecurities and Exchange Commission (the “SEC”).
The Wendy’s Company is the parent company of its 100% owned subsidiary holding company, Wendy’s Restaurants, LLC (“Wendy’s Restaurants”). Theprincipal 100% owned subsidiary of Wendy’s Restaurants is Wendy’s International, LLC and its subsidiaries (“Wendy’s”). Wendy’s franchises and operatesWendy’s ® quick-service restaurants specializing in hamburger sandwiches throughout North America (defined as the United States of America (“U.S.”) andCanada). Wendy’s also has franchised restaurants in 30 foreign countries and U.S. territories.
Each Wendy’s restaurant offers an extensive menu specializing in hamburger sandwiches and featuring filet of chicken breast sandwiches, which are preparedto order with the customer’s choice of condiments. Wendy’s menu also includes chicken nuggets, chili, french fries, baked potatoes, freshly prepared salads, softdrinks, Frosty ® desserts and kids’ meals. In addition, the restaurants sell a variety of promotional products on a limited time basis. Wendy’s also offers breakfast insome restaurants in the United States.
The Company manages and internally reports its business geographically. The operation and franchising of Wendy’s restaurants in North America comprisesvirtually all of our current operations and represents a single reportable segment. The revenues and operating results of Wendy’s restaurants outside of NorthAmerica are not material. The results of operations discussed below may not necessarily be indicative of future results.
The Company’s fiscal reporting periods consist of 52 or 53 weeks ending on the Sunday closest to December 31. All three- and six-month periods presentedherein contain 13 weeks and 26 weeks, respectively. All references to years and quarters relate to fiscal periods rather than calendar periods.
We adopted the new accounting guidance for leases effective December 31, 2018, which had a material impact on our condensed consolidated financialstatements. Beginning with the first quarter of 2019, our financial condition and results of operations reflect adoption of the guidance; however, prior period resultswere not restated. See Note 2 to the Condensed Consolidated Financial Statements contained in Item 1 herein for further information.
Executive Overview
Our Business
As of June 30, 2019 , the Wendy’s restaurant system was comprised of 6,719 restaurants, of which 358 were owned and operated by the Company. All of ourCompany-operated restaurants are located in the United States.
Wendy’s operating results are impacted by a number of external factors, including commodity costs, labor costs, intense price competition, unemployment anddecreased consumer spending levels, general economic and market trends and weather.
Wendy’s long-term growth opportunities include (1) systemwide same-restaurant sales growth through continuing core menu improvement, productinnovation, customer count growth and strategic price increases on our menu items, (2) system investment in our Image Activation program, which includesinnovative exterior and interior restaurant designs for our new and reimaged restaurants and focused execution of operational excellence, (3) growth in newrestaurants, including global growth, (4) increased focus on consumer-facing digital platforms and technologies, (5) increased restaurant utilization in variousdayparts, (6)
32
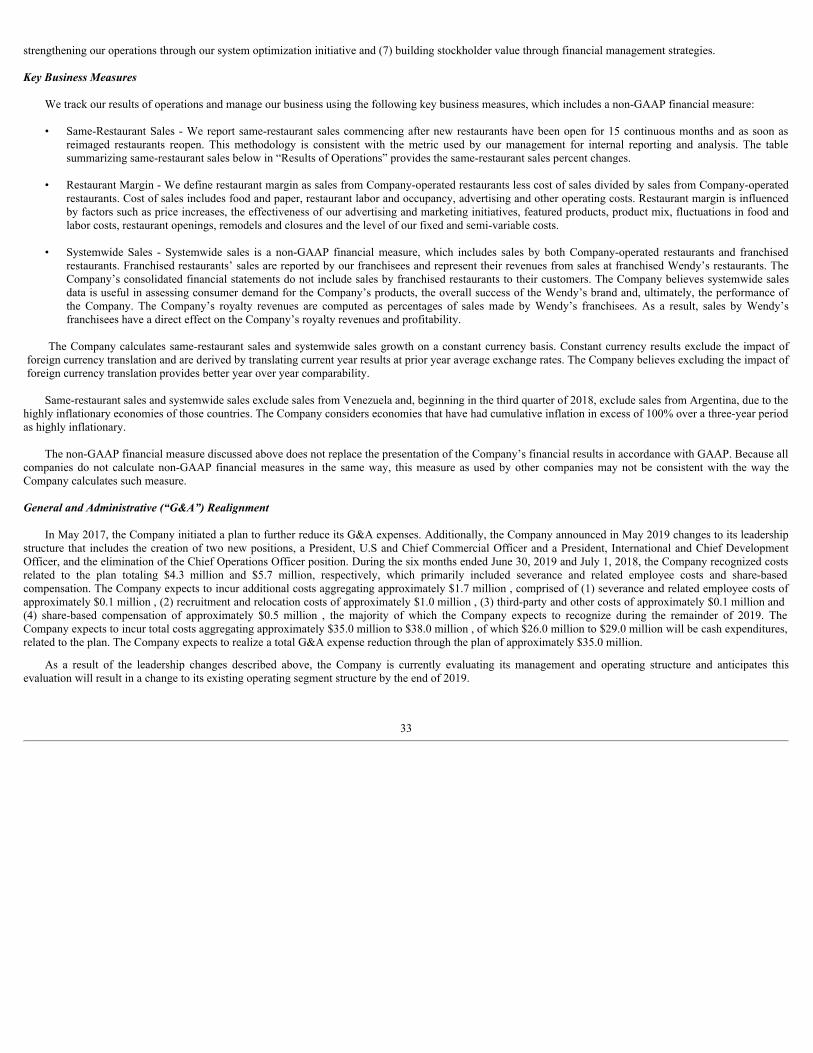
strengthening our operations through our system optimization initiative and (7) building stockholder value through financial management strategies.
Key Business Measures
We track our results of operations and manage our business using the following key business measures, which includes a non-GAAP financial measure:
• Same-Restaurant Sales - We report same-restaurant sales commencing after new restaurants have been open for 15 continuous months and as soon asreimaged restaurants reopen. This methodology is consistent with the metric used by our management for internal reporting and analysis. The tablesummarizing same-restaurant sales below in “Results of Operations” provides the same-restaurant sales percent changes.
• Restaurant Margin - We define restaurant margin as sales from Company-operated restaurants less cost of sales divided by sales from Company-operatedrestaurants. Cost of sales includes food and paper, restaurant labor and occupancy, advertising and other operating costs. Restaurant margin is influencedby factors such as price increases, the effectiveness of our advertising and marketing initiatives, featured products, product mix, fluctuations in food andlabor costs, restaurant openings, remodels and closures and the level of our fixed and semi-variable costs.
• Systemwide Sales - Systemwide sales is a non-GAAP financial measure, which includes sales by both Company-operated restaurants and franchisedrestaurants. Franchised restaurants’ sales are reported by our franchisees and represent their revenues from sales at franchised Wendy’s restaurants. TheCompany’s consolidated financial statements do not include sales by franchised restaurants to their customers. The Company believes systemwide salesdata is useful in assessing consumer demand for the Company’s products, the overall success of the Wendy’s brand and, ultimately, the performance ofthe Company. The Company’s royalty revenues are computed as percentages of sales made by Wendy’s franchisees. As a result, sales by Wendy’sfranchisees have a direct effect on the Company’s royalty revenues and profitability.
The Company calculates same-restaurant sales and systemwide sales growth on a constant currency basis. Constant currency results exclude the impact offoreign currency translation and are derived by translating current year results at prior year average exchange rates. The Company believes excluding the impact offoreign currency translation provides better year over year comparability.
Same-restaurant sales and systemwide sales exclude sales from Venezuela and, beginning in the third quarter of 2018, exclude sales from Argentina, due to thehighly inflationary economies of those countries. The Company considers economies that have had cumulative inflation in excess of 100% over a three-year periodas highly inflationary.
The non-GAAP financial measure discussed above does not replace the presentation of the Company’s financial results in accordance with GAAP. Because allcompanies do not calculate non-GAAP financial measures in the same way, this measure as used by other companies may not be consistent with the way theCompany calculates such measure.
General and Administrative (“G&A”) Realignment
In May 2017, the Company initiated a plan to further reduce its G&A expenses. Additionally, the Company announced in May 2019 changes to its leadershipstructure that includes the creation of two new positions, a President, U.S and Chief Commercial Officer and a President, International and Chief DevelopmentOfficer, and the elimination of the Chief Operations Officer position. During the six months ended June 30, 2019 and July 1, 2018, the Company recognized costsrelated to the plan totaling $4.3 million and $5.7 million, respectively, which primarily included severance and related employee costs and share-basedcompensation. The Company expects to incur additional costs aggregating approximately $1.7 million , comprised of (1) severance and related employee costs ofapproximately $0.1 million , (2) recruitment and relocation costs of approximately $1.0 million , (3) third-party and other costs of approximately $0.1 million and(4) share-based compensation of approximately $0.5 million , the majority of which the Company expects to recognize during the remainder of 2019. TheCompany expects to incur total costs aggregating approximately $35.0 million to $38.0 million , of which $26.0 million to $29.0 million will be cash expenditures,related to the plan. The Company expects to realize a total G&A expense reduction through the plan of approximately $35.0 million.
As a result of the leadership changes described above, the Company is currently evaluating its management and operating structure and anticipates thisevaluation will result in a change to its existing operating segment structure by the end of 2019.
33

Results of Operations
The tables included throughout this Results of Operations set forth in millions the Company’s condensed consolidated results of operations for the secondquarter and the first six months of 2019 and 2018 .
Second Quarter Six Months 2019 2018 Change 2019 2018 ChangeRevenues:
Sales $ 181.1 $ 167.3 $ 13.8 $ 348.7 $ 321.0 $ 27.7Franchise royalty revenue and fees 109.1 107.6 1.5 211.1 205.5 5.6Franchise rental income 58.5 51.5 7.0 117.0 101.6 15.4Advertising funds revenue 86.6 84.6 2.0 167.1 163.5 3.6
435.3 411.0 24.3 843.9 791.6 52.3Costs and expenses:
Cost of sales 151.1 138.2 12.9 293.7 270.4 23.3Franchise support and other costs 4.0 7.0 (3.0) 10.1 13.2 (3.1)Franchise rental expense 28.0 24.3 3.7 60.5 47.6 12.9Advertising funds expense 88.7 84.6 4.1 169.1 163.5 5.6General and administrative 50.8 49.2 1.6 100.1 99.5 0.6Depreciation and amortization 31.5 33.4 (1.9) 64.7 65.6 (0.9)System optimization (gains) losses, net (0.1) (0.1) — (0.1) 0.5 (0.6)Reorganization and realignment costs 3.6 3.1 0.5 4.4 5.7 (1.3)Impairment of long-lived assets 0.2 1.6 (1.4) 1.7 1.8 (0.1)Other operating income, net (3.1) (1.8) (1.3) (7.1) (2.9) (4.2)
354.7 339.5 15.2 697.1 664.9 32.2Operating profit 80.6 71.5 9.1 146.8 126.7 20.1
Interest expense, net (29.9) (30.1) 0.2 (59.0) (60.3) 1.3Loss on early extinguishment of debt (7.2) — (7.2) (7.2) (11.5) 4.3Other income, net 2.2 0.9 1.3 5.0 1.7 3.3
Income before income taxes 45.7 42.3 3.4 85.6 56.6 29.0Provision for income taxes (13.3) (12.4) (0.9) (21.3) (6.6) (14.7)
Net income $ 32.4 $ 29.9 $ 2.5 $ 64.3 $ 50.0 $ 14.3
34
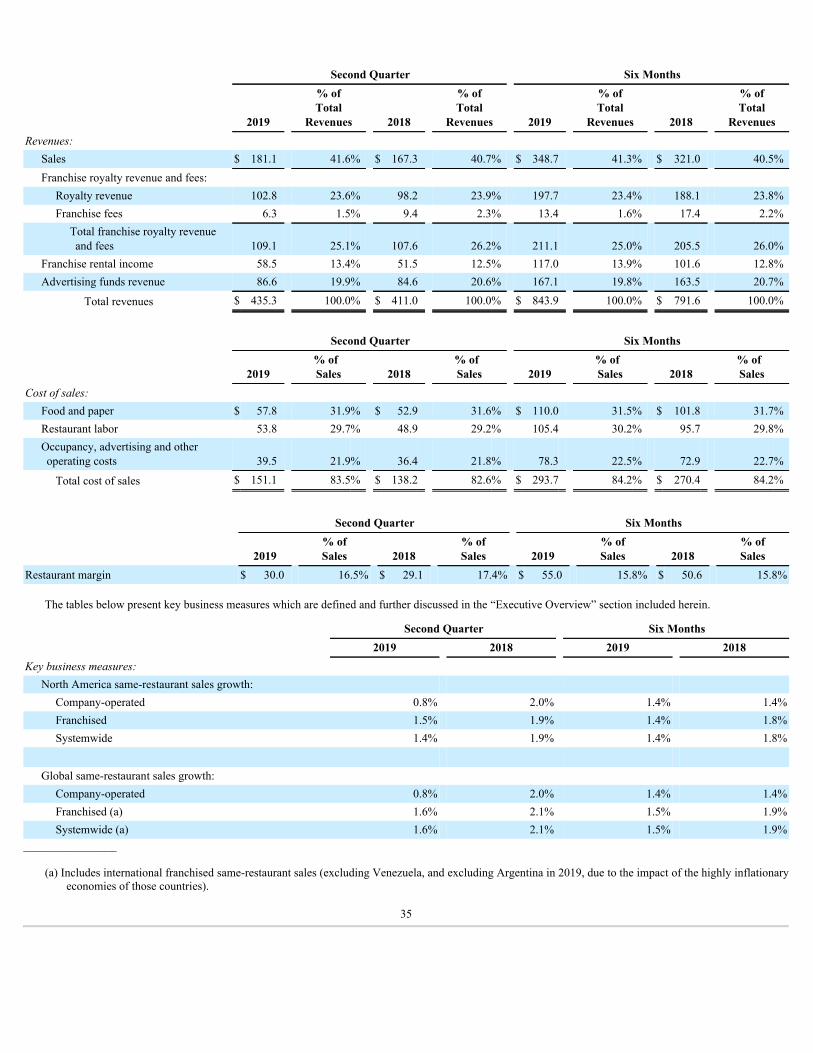
Second Quarter Six Months
2019
% ofTotal
Revenues 2018
% ofTotal
Revenues 2019
% ofTotal
Revenues 2018
% ofTotal
RevenuesRevenues:
Sales $ 181.1 41.6% $ 167.3 40.7% $ 348.7 41.3% $ 321.0 40.5%Franchise royalty revenue and fees:
Royalty revenue 102.8 23.6% 98.2 23.9% 197.7 23.4% 188.1 23.8%Franchise fees 6.3 1.5% 9.4 2.3% 13.4 1.6% 17.4 2.2%
Total franchise royalty revenueand fees 109.1 25.1% 107.6 26.2% 211.1 25.0% 205.5 26.0%
Franchise rental income 58.5 13.4% 51.5 12.5% 117.0 13.9% 101.6 12.8%Advertising funds revenue 86.6 19.9% 84.6 20.6% 167.1 19.8% 163.5 20.7%
Total revenues $ 435.3 100.0% $ 411.0 100.0% $ 843.9 100.0% $ 791.6 100.0%
Second Quarter Six Months
2019 % of Sales 2018
% of Sales 2019
% of Sales 2018
% of Sales
Cost of sales: Food and paper $ 57.8 31.9% $ 52.9 31.6% $ 110.0 31.5% $ 101.8 31.7%Restaurant labor 53.8 29.7% 48.9 29.2% 105.4 30.2% 95.7 29.8%Occupancy, advertising and otheroperating costs 39.5 21.9% 36.4 21.8% 78.3 22.5% 72.9 22.7%
Total cost of sales $ 151.1 83.5% $ 138.2 82.6% $ 293.7 84.2% $ 270.4 84.2%
Second Quarter Six Months
2019 % ofSales 2018
% ofSales 2019
% ofSales 2018
% ofSales
Restaurant margin $ 30.0 16.5% $ 29.1 17.4% $ 55.0 15.8% $ 50.6 15.8%
The tables below present key business measures which are defined and further discussed in the “Executive Overview” section included herein.
Second Quarter Six Months 2019 2018 2019 2018Key business measures:
North America same-restaurant sales growth: Company-operated 0.8% 2.0% 1.4% 1.4%Franchised 1.5% 1.9% 1.4% 1.8%Systemwide 1.4% 1.9% 1.4% 1.8%
Global same-restaurant sales growth: Company-operated 0.8% 2.0% 1.4% 1.4%Franchised (a) 1.6% 2.1% 1.5% 1.9%Systemwide (a) 1.6% 2.1% 1.5% 1.9%
________________
(a) Includes international franchised same-restaurant sales (excluding Venezuela, and excluding Argentina in 2019, due to the impact of the highly inflationaryeconomies of those countries).
35

Second Quarter Six Months 2019 2018 2019 2018Key business measures (continued):
Systemwide sales: (a) Company-operated $ 181.1 $ 167.3 $ 348.7 $ 321.0North America franchised 2,482.5 2,434.2 4,773.2 4,684.9
North America systemwide 2,663.6 2,601.5 5,121.9 5,005.9International franchised (b) 140.1 132.1 273.0 259.3
Global systemwide $ 2,803.7 $ 2,733.6 $ 5,394.9 $ 5,265.2________________
(a) During the second quarter of 2019 and 2018 , North America systemwide sales increased 3.0% and 2.7% , respectively, international franchised salesincreased 10.4% and 12.8% , respectively, and global systemwide sales increased 3.3% and 3.1% , respectively, on a constant currency basis. During thefirst six months of 2019 and 2018 , North America systemwide sales increased 3.0% and 2.7% , respectively, international franchised sales increased10.2% and 13.2% , respectively, and global systemwide sales increased 3.3% and 3.2% , respectively, on a constant currency basis.
(b) Excludes Venezuela, and excludes Argentina in 2019, due to the impact of the highly inflationary economies of those countries.
Second Quarter
Company-operated North AmericaFranchised
InternationalFranchised Systemwide
Restaurant count: Restaurant count at March 31, 2019 358 5,825 527 6,710
Opened — 20 8 28Closed — (17) (2) (19)Net purchased from (sold by) franchisees — — — —
Restaurant count at June 30, 2019 358 5,828 533 6,719
Six Months
Company-operated North AmericaFranchised
InternationalFranchised Systemwide
Restaurant count at December 30, 2018 353 5,825 533 6,711Opened — 49 22 71Closed — (41) (22) (63)Net purchased from (sold by) franchisees 5 (5) — —
Restaurant count at June 30, 2019 358 5,828 533 6,719
Sales Second Quarter Six Months 2019 2018 Change 2019 2018 ChangeSales $ 181.1 $ 167.3 $ 13.8 $ 348.7 $ 321.0 $ 27.7
The increase in sales for the second quarter and the first six months of 2019 was primarily due to a net increase in the number of Company-operatedrestaurants in operation during 2019 compared to 2018 . In addition, sales for the second quarter and the first six months of 2019 benefited from a 0.8% and 1.4%increase in Company-operated same-restaurant sales, respectively. Company-operated same-restaurant sales improved due to an increase in our average percustomer check amount, reflecting benefits from strategic price increases on our menu items and changes in product mix. These benefits were partially offset by adecrease in customer count.
36

Franchise Royalty Revenue and Fees Second Quarter Six Months 2019 2018 Change 2019 2018 ChangeRoyalty revenue $ 102.8 $ 98.2 $ 4.6 $ 197.7 $ 188.1 $ 9.6Franchise fees 6.3 9.4 (3.1) 13.4 17.4 (4.0)
$ 109.1 $ 107.6 $ 1.5 $ 211.1 $ 205.5 $ 5.6
The increase in franchise royalty revenue during the second quarter and the first six months of 2019 was primarily due to a 1.6% and 1.5% increase infranchise same-restaurant sales, respectively. Royalty revenue was also positively impacted by a net increase in the number of franchise restaurants in operation.The decrease in franchise fees during the second quarter and the first six months of 2019 was primarily due to not facilitating any franchisee-to-franchiseerestaurant transfers (“Franchise Flips”) in 2019 and lower other miscellaneous franchise fees, partially offset by higher fees for providing information technologyservices and other services to franchisees.
Franchise Rental Income Second Quarter Six Months 2019 2018 Change 2019 2018 ChangeFranchise rental income $ 58.5 $ 51.5 $ 7.0 $ 117.0 $ 101.6 $ 15.4
The increase in franchise rental income during the second quarter and the first six months of 2019 was primarily due to the adoption of new accountingguidance for leases. Under the new guidance, lessees’ payments to the Company for executory costs are recorded on a gross basis as revenue with a correspondingexpense. See “Franchise Rental Expense” below. This increase was partially offset by the assignment of certain leases to a franchisee.
Advertising Funds Revenue Second Quarter Six Months 2019 2018 Change 2019 2018 ChangeAdvertising funds revenue $ 86.6 $ 84.6 $ 2.0 $ 167.1 $ 163.5 $ 3.6
The Company maintains two national advertising funds established to collect and administer funds contributed for use in advertising and promotionalprograms for Company-operated and franchised restaurants in the U.S. and Canada. Franchisees make contributions to the national advertising funds based on apercentage of sales of the franchised restaurants. The increase in advertising funds revenue during the second quarter and the first six months of 2019 was primarilydue to an increase in North America franchise same-restaurant sales, as well as a net increase in the number of North America franchise restaurants in operation.These increases were partially offset by reductions in advertising receipts under the Company’s new restaurant development incentive program.
Cost of Sales, as a Percent of Sales Second Quarter Six Months 2019 2018 Change 2019 2018 ChangeFood and paper 31.9% 31.6% 0.3% 31.5% 31.7% (0.2)%Restaurant labor 29.7% 29.2% 0.5% 30.2% 29.8% 0.4 %Occupancy, advertising and other operating costs 21.9% 21.8% 0.1% 22.5% 22.7% (0.2)%
83.5% 82.6% 0.9% 84.2% 84.2% — %
Cost of sales, as a percent of sales, during the second quarter and the first six months of 2019 was impacted by (1) an increase in restaurant labor rates, (2) adecrease in customer count and (3) an increase in commodity costs. These impacts were partially offset by benefits from strategic price increases on certain of ourmenu items.
Franchise Support and Other Costs Second Quarter Six Months 2019 2018 Change 2019 2018 ChangeFranchise support and other costs $ 4.0 $ 7.0 $ (3.0) $ 10.1 $ 13.2 $ (3.1)
The decrease in franchise support and other costs during the second quarter and the first six months of 2019 was primarily due to lower costs incurred toprovide information technology and other services to our franchisees.
37

Franchise Rental Expense Second Quarter Six Months 2019 2018 Change 2019 2018 ChangeFranchise rental expense $ 28.0 $ 24.3 $ 3.7 $ 60.5 $ 47.6 $ 12.9
The increase in franchise rental expense during the second quarter and the first six months of 2019 was primarily due to the adoption of new accountingguidance for leases. Under the new guidance, lessees’ payments to the Company for executory costs are recorded on a gross basis as revenue with a correspondingexpense. See “Franchise Rental Income” above. This increase was partially offset by the impact of assigning certain leases to a franchisee.
Advertising Funds Expense Second Quarter Six Months 2019 2018 Change 2019 2018 ChangeAdvertising funds expense $ 88.7 $ 84.6 $ 4.1 $ 169.1 $ 163.5 $ 5.6
The increase in advertising funds expense during the second quarter and the first six months of 2019 was primarily due to the same factors as described abovefor advertising funds revenue. On an interim basis, advertising funds expense is recognized in proportion to advertising funds revenue. During the second quarterand the first six months of 2019, advertising funds expense exceeded advertising funds revenue by $2.1 million, reflecting a portion of the expected advertisingspend in excess of advertising funds revenue for the remainder of 2019. This excess for 2019 is expected to approximate the amount by which advertising fundsrevenue exceeded advertising funds expense in 2018.
General and Administrative Second Quarter Six Months 2019 2018 Change 2019 2018 ChangeEmployee compensation and related expenses $ 40.8 $ 39.8 $ 1.0 $ 81.8 $ 81.3 $ 0.5Other, net 10.0 9.4 0.6 18.3 18.2 0.1
$ 50.8 $ 49.2 $ 1.6 $ 100.1 $ 99.5 $ 0.6
The increase in general and administrative expenses during the second quarter and the first six months of 2019 was primarily due to higher employeecompensation and related expenses, reflecting additional expenditures to support our digital experience and international organizations, as well as timing of otheremployee-related expenses. These increases were partially offset by changes in staffing driven by our G&A realignment plan.
Depreciation and Amortization Second Quarter Six Months 2019 2018 Change 2019 2018 ChangeRestaurants $ 20.0 $ 22.2 $ (2.2) $ 41.9 $ 42.9 $ (1.0)Corporate and other 11.5 11.2 0.3 22.8 22.7 0.1
$ 31.5 $ 33.4 $ (1.9) $ 64.7 $ 65.6 $ (0.9)
The decrease in restaurant depreciation and amortization during the second quarter and the first six months of 2019 was primarily due to the assignment ofcertain leases to a franchisee, resulting in the write-off of the related net investment in the leases. Corporate and other expense increased due to depreciation andamortization for technology investments.
System Optimization (Gains) Losses, Net Second Quarter Six Months 2019 2018 Change 2019 2018 ChangeSystem optimization (gains) losses, net $ (0.1) $ (0.1) $ — $ (0.1) $ 0.5 $ (0.6)
System optimization (gains) losses, net for the second quarter and the first six months of 2019 and 2018 were primarily comprised of post-closing adjustmentson previous sales of restaurants and gains (losses) on the sale of surplus properties.
38

Reorganization and Realignment Costs Second Quarter Six Months 2019 2018 Change 2019 2018 ChangeG&A realignment $ 3.5 $ 3.1 $ 0.4 $ 4.3 $ 5.7 (1.4)System optimization initiative 0.1 — 0.1 0.1 — 0.1
$ 3.6 $ 3.1 $ 0.5 $ 4.4 $ 5.7 $ (1.3)
In May 2017, the Company initiated a G&A realignment plan to further reduce its G&A expenses. In addition, the Company announced changes to itsleadership structure in May 2019. G&A realignment costs for the second quarter and the first six months of 2019 and 2018 were primarily comprised of severanceand related employee costs and share-based compensation.
Impairment of Long-Lived Assets Second Quarter Six Months 2019 2018 Change 2019 2018 ChangeImpairment of long-lived assets $ 0.2 $ 1.6 $ (1.4) $ 1.7 $ 1.8 $ (0.1)
The change in impairment charges during the second quarter and the first six months of 2019 was primarily driven by lower impairment charges as a result ofthe deterioration in operating performance of certain Company-operated restaurants when compared to the first six months of 2018. In addition, the change inimpairment charges during the first six months of 2019 was offset by an increase in losses resulting from closing Company-operated restaurants and classifyingsuch surplus properties as held for sale.
Other Operating Income, Net Second Quarter Six Months 2019 2018 Change 2019 2018 ChangeEquity in earnings in joint ventures, net $ (3.1) $ (1.8) $ (1.3) $ (4.9) $ (3.6) $ (1.3)Gains on sales-type leases — — — (2.0) $ — (2.0)Lease buyout — — — (0.2) 0.6 (0.8)Other, net — — — — $ 0.1 (0.1)
$ (3.1) $ (1.8) $ (1.3) $ (7.1) $ (2.9) $ (4.2)
The change in other operating income, net during the second quarter of 2019 was due to an increase in the equity in earnings from our TimWen joint venture.The change in other operating income, net during the first six months of 2019 was primarily due to gains on new and modified sales-type leases as a result of thenew accounting guidance for leases, as well as an increase in the equity in earnings from our TimWen joint venture.
Interest Expense, Net Second Quarter Six Months 2019 2018 Change 2019 2018 ChangeInterest expense, net $ 29.9 $ 30.1 $ (0.2) $ 59.0 $ 60.3 $ (1.3)
Interest expense, net decreased during the first six months of 2019 primarily due to the timing of interest expense on the Company’s finance lease obligations.
Loss on Early Extinguishment of Debt Second Quarter Six Months 2019 2018 Change 2019 2018 ChangeLoss on early extinguishment of debt $ 7.2 $ — $ 7.2 $ 7.2 $ 11.5 $ (4.3)
During the second quarter of 2019, in connection with the refinancing of a portion of the Company’s securitized financing facility, the Company incurred aloss on the early extinguishment of debt as a result of repaying its outstanding Series 2015-1 Class A-2-II Notes primarily with the proceeds from the issuance ofits Series 2019-1 Class A-2 Notes. The loss on the early extinguishment of debt of $7.2 million was comprised of the write-off of certain deferred financing costs.
39

During the first quarter of 2018, in connection with the refinancing of a portion of the Company’s securitized financing facility, the Company incurred a losson the early extinguishment of debt as a result of repaying its outstanding Series 2015-1 Class A-2-I Notes with the proceeds from the issuance of its Series 2018-1Class A-2 Notes. The loss on the early extinguishment of debt of $11.5 million was comprised of the write-off of certain deferred financing costs and a specifiedmake-whole payment.
Other Income, Net Second Quarter Six Months 2019 2018 Change 2019 2018 ChangeOther income, net $ 2.2 $ 0.9 $ 1.3 $ 5.0 $ 1.7 $ 3.3
Other income, net increased during the second quarter and the first six months of 2019 primarily due to higher interest income earned on our cash equivalents.
Provision for Income Taxes Second Quarter Six Months 2019 2018 Change 2019 2018 ChangeIncome before income taxes $ 45.7 $ 42.3 $ 3.4 $ 85.6 $ 56.6 $ 29.0Provision for income taxes (13.3) (12.4) (0.9) (21.3) (6.6) (14.7)Effective tax rate on income 29.2% 29.3% (0.1)% 24.9% 11.6% 13.3%
Our effective tax rates in the second quarter of 2019 and 2018 were impacted by variations in income before income taxes, adjusted for recurring items such asnon-deductible expenses and state income taxes, as well as non-recurring discrete items. Discrete items, which may occur in any given year but are not consistentfrom year to year, include the following: (1) state income taxes, including non-recurring changes to state deferred taxes, (2) net excess benefits related to share-based payments, which resulted in a benefit of $0.9 million and $0.8 million in the second quarter of 2019 and 2018, respectively, (3) valuation allowance changes,net of federal benefit, and (4) the impact of the comprehensive tax legislation commonly referred to as the Tax Cuts and Jobs Act (the “Tax Act”).
Our effective tax rates in the first six months of 2019 and 2018 were impacted by variations in income before income taxes, adjusted for recurring items suchas non-deductible expenses and state income taxes, as well as non-recurring discrete items. Discrete items, which may occur in any given year but are notconsistent from year to year include the following: (1) net excess tax benefits related to share-based payments, which resulted in a benefit of $2.9 million and $6.9million in the first six months of 2019 and 2018, respectively, (2) state income taxes, including non-recurring changes to state deferred taxes, (3) the impact of theTax Act and (4) valuation allowance changes, net of federal benefit.
Liquidity and Capital Resources
Cash Flows
Our primary sources of liquidity and capital resources are cash flows from operations and borrowings under our securitizedfinancing facility. Principal uses of cash are operating expenses, capital expenditures, repurchases of common stock and dividends to stockholders.
Our anticipated cash requirements for the remainder of 2019 , exclusive of operating cash flow requirements, consist principally of:
• capital expenditures of approximately $50.0 million to $55.0 million, resulting in total anticipated cash capital expenditures for the year of approximately$75.0 million to $80.0 million;
• cash dividends aggregating up to approximately $46.1 million as discussed below in “Dividends;” and
• potential stock repurchases of up to $196.7 million, of which $10.0 million was repurchased subsequent to June 30, 2019 through July 31, 2019 , asdiscussed below in “Stock Repurchases.”
Based on current levels of operations, the Company expects that available cash and cash flows from operations will provide sufficient liquidity to meetoperating cash requirements for the next 12 months.
40

The table below summarizes our cash flows from operating, investing and financing activities for the first six months of 2019 and 2018:
Six Months 2019 2018 ChangeNet cash provided by (used in):
Operating activities $ 154.1 $ 148.4 $ 5.7Investing activities (29.9) (22.6) (7.3)Financing activities (130.2) (95.3) (34.9)
Effect of exchange rate changes on cash 3.8 (4.4) 8.2
Net (decrease) increase in cash, cash equivalents and restricted cash $ (2.2) $ 26.1 $ (28.3)
Operating Activities
Cash provided by operating activities was $154.1 million and $148.4 million in the first six months of 2019 and 2018, respectively. Cash provided byoperating activities consists primarily of net income, adjusted for non-cash expenses such as depreciation and amortization, deferred income tax and share-basedcompensation, and the net change in operating assets and liabilities. Cash provided by operating activities increased $5.7 million during the first six months of 2019as compared to the first six months of 2018, primarily due to (1) a decrease in payments for incentive compensation (2) higher net income, adjusted for non-cashexpenses and (3) the timing of receipt of rental payments from franchisees. These favorable changes were partially offset by (1) the timing of collections of royaltyreceivables and (2) the timing of payments for marketing expenses of the national advertising funds.
Investing Activities
Cash used in investing activities increased $7.3 million during the first six months of 2019 as compared to the first six months of 2018, primarily due to anincrease in cash used for the Company’s acquisition of restaurants from franchisees of $5.1 million and an increase in capital expenditures of $1.6 million .
Financing Activities
Cash used in financing activities increased $34.9 million during the first six months of 2019 as compared to the first six months of 2018, primarily due to (1) anet increase in cash used for long-term debt activities of $76.5 million, reflecting the respective impacts of the completion of debt refinancing transactions duringthe first six months of 2019 and 2018 and (2) an increase in dividends of $5.5 million. These changes were partially offset by (1) a decrease in repurchases ofcommon stock of $33.5 million , (2) an increase in proceeds from stock option exercises, net of payments related to tax withholding for share-based compensation,of $8.3 million and (3) the settlement of a supplemental purchase price liability associated with the acquisition of 140 Wendy’s restaurants from DavCoRestaurants, LLC of $6.1 million during the first six months of 2018.
Long-Term Debt, Including Current Portion
Except as described below, there were no material changes to the terms of any debt obligations since December 30, 2018. The Company was in compliancewith its debt covenants as of June 30, 2019. See Note 8 to the Condensed Consolidated Financial Statements contained in Item 1 herein for further informationrelated to our long-term debt obligations.
On June 26, 2019, Wendy’s Funding, LLC (the “Master Issuer”), a limited-purpose, bankruptcy-remote, wholly-owned indirect subsidiary of the Company,completed a debt refinancing transaction under which the Master Issuer issued fixed rate senior secured notes in the following 2019-1 series: Class A-2-I with aninterest rate of 3.783% and initial principal amount of $400.0 million and Class A-2-II with an interest rate of 4.080% and initial principal amount of $450.0million (collectively, the “Series 2019-1 Class A-2 Notes”). The Master Issuer’s outstanding Series 2015-1 Class A-2-II Notes were redeemed as part of therefinancing transaction.
In connection with the issuance of the Series 2019-1 Class A-2 Notes, the Master Issuer also entered into a revolving financing facility of Series 2019-1Variable Funding Senior Secured Notes, Class A-1 (the “Series 2019-1 Class A-1 Notes”), which allows for the drawing of up to $150.0 million using variouscredit instruments, including a letter of credit facility. No amounts were borrowed under the Series 2019-1 Class A-1 Notes during the three months ended June 30,2019. The Series 2019-1 Class A-1
41

Notes replaced the Company’s $150.0 million Series 2018-1 Class A-1 Notes, which were canceled on the closing date and the letters of credit outstanding againstthe Series 2018-1 Class A-1 Notes were transferred to the Series 2019-1 Class A-1 Notes.
Dividends
On March 15, 2019 and June 17, 2019, the Company paid quarterly cash dividends of $.10 per share on its common stock, aggregating $46.2 million . OnAugust 1, 2019, the Company declared a dividend of $.10 per share to be paid on September 17, 2019 to stockholders of record as of September 3, 2019. If theCompany pays regular quarterly cash dividends for the remainder of 2019 at the same rate as declared in the third quarter of 2019, the Company’s total cashrequirement for dividends for the remainder of 2019 would be approximately $46.1 million based on the number of shares of its common stock outstanding atJuly 31, 2019 . The Company currently intends to continue to declare and pay quarterly cash dividends; however, there can be no assurance that any additionalquarterly dividends will be declared or paid or of the amount or timing of such dividends, if any.
Stock Repurchases
In February 2019, our Board of Directors authorized a repurchase program for up to $225.0 million of our common stock through March 1, 2020, when and ifmarket conditions warrant and to the extent legally permissible. In connection with the February 2019 authorization, the Company’s previous November 2018repurchase authorization for up to $220.0 million of our common stock was canceled. During the six months ended June 30, 2019 , the Company repurchased 2.8million shares with an aggregate purchase price of $49.7 million , of which $0.8 million was accrued at June 30, 2019 , and excluding commissions, under theNovember 2018 and February 2019 authorizations. As of June 30, 2019 , the Company had $196.7 million of availability remaining under its February 2019authorization. Subsequent to June 30, 2019 through July 31, 2019 , the Company repurchased 0.5 million shares under the February 2019 authorization with anaggregate purchase price of $10.0 million , excluding commissions.
In February 2018, our Board of Directors authorized a repurchase program for up to $175.0 million of our common stock through March 3, 2019, when and ifmarket conditions warranted and to the extent legally permissible. During the six months ended July 1, 2018 , the Company repurchased 3.7 million shares underthe February 2018 repurchase authorization with an aggregate purchase price of $62.5 million , of which $2.1 million was accrued at July 1, 2018 , and excludingcommissions of $0.1 million . Additionally, during the six months ended July 1, 2018, the Company completed its previous February 2017 repurchase authorizationfor up to $150.0 million of our common stock with the repurchase of 1.4 million shares with an aggregate purchase price of $22.6 million, excluding commissions.
General Inflation, Commodities and Changing Prices
We believe that general inflation did not have a significant effect on our consolidated results of operations. We attempt to manage any inflationary costs andcommodity price increases through product mix and selective menu price increases. Delays in implementing such menu price increases and competitive pressuresmay limit our ability to recover such cost increases in the future. Inherent volatility experienced in certain commodity markets, such as those for beef, chicken,pork, cheese and grains, could have a significant effect on our results of operations and may have an adverse effect on us in the future. The extent of any impactwill depend on our ability to manage such volatility through product mix and selective menu price increases.
Seasonality
Wendy’s restaurant operations are moderately seasonal. Wendy’s average restaurant sales are normally higher during the summer months than during thewinter months. Because our business is moderately seasonal, results for a particular quarter are not necessarily indicative of the results that may be achieved forany other quarter or for the full fiscal year.
Item 3. Quantitative and Qualitative Disclosures about Market Risk.
This “Quantitative and Qualitative Disclosures about Market Risk” should be read in conjunction with “Item 7A. Quantitative and Qualitative Disclosuresabout Market Risk” in our annual report on Form 10-K for the fiscal year ended December 30, 2018 (the “Form 10-K”).
As of June 30, 2019 , there were no material changes from the information contained in the Form 10-K, except as described below.
42

Interest Rate Risk
As discussed in “Item 2. Management’s Discussion and Analysis of Financial Condition and Results of Operation” under “Liquidity and Capital Resources,”the Company completed an $850.0 million debt refinancing transaction on June 26, 2019. The Company’s outstanding Series 2015-1 Class A-2-II Notes wererepaid as part of the refinancing transaction. In aggregate, the Company’s new Series 2019-1 Class A-2 Notes bear a weighted-average fixed-rate interest at ratesslightly lower than our historical effective rates on the Series 2015-1 Class A-2-II Notes. In addition, the principal amounts outstanding on the Series 2019-1 ClassA-2 Notes are lower than the amounts that were outstanding on the Series 2015-1 Class A-2-II Notes. In connection with the issuance of the Series 2019-1 Class A-2 Notes, a wholly-owned subsidiary of the Company also entered into a revolving financing facility, the Series 2019-1 Class A-1 Notes, which allows for thedrawing of up to $150.0 million using various credit instruments, including a letter of credit facility. The Series 2019-1 Class A-1 Notes replaced the Company’s$150.0 million Series 2018-1 Class A-1 Notes, which were canceled on the closing date, and the letters of credit outstanding against the Series 2018-1 Class A-1Notes were transferred to the Series 2019-1 Class A-1 Notes.
Consequently, our long-term debt, including the current portion, aggregated $2,342.4 million as of June 30, 2019 (excluding unamortized debt issuance costsand the effect of purchase accounting adjustments). The Company’s predominantly fixed-rate debt structure has reduced its exposure to interest rate increases thatcould adversely affect its earnings and cash flows. The Company is exposed to interest rate increases under the Series 2019-1 Class A-1 Notes; however, theCompany had no outstanding borrowings under the Series 2019-1 Class A-1 Notes as of June 30, 2019 .
Item 4. Controls and Procedures.
Evaluation of Disclosure Controls and Procedures
The management of the Company, under the supervision and with the participation of its Chief Executive Officer and Chief Financial Officer, evaluated theeffectiveness of the design and operation of the Company’s disclosure controls and procedures (as defined in Rules 13a-15(e) or 15d-15(e) under the SecuritiesExchange Act of 1934, as amended (the “Exchange Act”)) as of June 30, 2019 . Based on such evaluations, the Chief Executive Officer and Chief Financial Officerconcluded that, as of June 30, 2019 , the disclosure controls and procedures of the Company were effective at a reasonable assurance level in (1) recording,processing, summarizing and reporting, on a timely basis, information required to be disclosed by the Company in the reports that it files or submits under theExchange Act and (2) ensuring that information required to be disclosed by the Company in such reports is accumulated and communicated to management,including the Chief Executive Officer and Chief Financial Officer, as appropriate to allow timely decisions regarding required disclosure.
Changes in Internal Control Over Financial Reporting
There were no changes in the internal control over financial reporting of the Company during the second quarter of 2019 that materially affected, or arereasonably likely to materially affect, its internal control over financial reporting.
Inherent Limitations on Effectiveness of Controls
There are inherent limitations in the effectiveness of any control system, including the potential for human error and the possible circumvention or overridingof controls and procedures. Additionally, judgments in decision-making can be faulty and breakdowns can occur because of a simple error or mistake. An effectivecontrol system can provide only reasonable, not absolute, assurance that the control objectives of the system are adequately met. Accordingly, the management ofthe Company, including its Chief Executive Officer and Chief Financial Officer, does not expect that the control system can prevent or detect all errors or fraud.Finally, projections of any evaluation or assessment of effectiveness of a control system to future periods are subject to the risks that, over time, controls maybecome inadequate because of changes in an entity’s operating environment or deterioration in the degree of compliance with policies or procedures.
43

PART II. OTHER INFORMATION
Special Note Regarding Forward-Looking Statements and Projections
This Quarterly Report on Form 10-Q and oral statements made from time to time by representatives of the Company may contain or incorporate by referencecertain statements that are not historical facts, including, most importantly, information concerning possible or assumed future results of operations of theCompany. Those statements, as well as statements preceded by, followed by, or that include the words “may,” “believes,” “plans,” “expects,” “anticipates,” or thenegation thereof, or similar expressions, constitute “forward-looking statements” within the meaning of the Private Securities Litigation Reform Act of 1995 (the“Reform Act”). All statements that address future operating, financial or business performance; strategies, initiatives or expectations; future synergies, efficienciesor overhead savings; anticipated costs or charges; future capitalization; and anticipated financial impacts of recent or pending transactions are forward-lookingstatements within the meaning of the Reform Act. The forward-looking statements are based on our expectations at the time such statements are made, speak onlyas of the dates they are made and are susceptible to a number of risks, uncertainties and other factors. Our actual results, performance and achievements may differmaterially from any future results, performance or achievements expressed or implied by our forward-looking statements. For all of our forward-lookingstatements, we claim the protection of the safe harbor for forward-looking statements contained in the Reform Act. Many important factors could affect our futureresults and could cause those results to differ materially from those expressed in or implied by the forward-looking statements contained herein. Such factors, all ofwhich are difficult or impossible to predict accurately, and many of which are beyond our control, include, but are not limited to, the following:
• competition, including pricing pressures, couponing, aggressive marketing and the potential impact of competitors’ new unit openings on sales ofWendy’s restaurants;
• consumers’ perceptions of the relative quality, variety, affordability and value of the food products we offer, and changes in consumer tastes andpreferences;
• food safety events, including instances of food-borne illness (such as salmonella or E. coli) involving Wendy’s or its supply chain;
• consumer concerns over nutritional aspects of beef, chicken, french fries or other products we sell, the ingredients in our products and/or the cookingprocesses used in our restaurants;
• conditions beyond our control, such as weather, natural disasters, disease outbreaks, epidemics or pandemics impacting our customers or food supplies, oracts of war or terrorism;
• the effects of negative publicity that can occur from increased use of social media;
• success of operating and marketing initiatives, including advertising and promotional efforts and new product and concept development by us and ourcompetitors;
• prevailing economic, market and business conditions affecting us, including competition from other food service providers, unemployment and decreasedconsumer spending levels, particularly in geographic regions that contain a high concentration of Wendy’s restaurants;
• changes in the quick-service restaurant industry, spending patterns and demographic trends, such as consumer trends toward value-oriented products andpromotions or toward consuming fewer meals away from home;
• certain factors affecting our franchisees, including the business and financial viability of franchisees, the timely payment of franchisees’ obligations due tous or to national or local advertising organizations, and the ability of franchisees to open new restaurants and reimage existing restaurants in accordancewith their development and franchise commitments, including their ability to finance restaurant development and reimages;
• increased labor costs due to competition or increased minimum wage or employee benefit costs;
• changes in commodity costs (including beef, chicken, pork, cheese and grains), labor, supplies, fuel, utilities, distribution and other operating costs;
• the availability of suitable locations and terms for restaurant development by us and our franchisees;
44

• development costs, including real estate and construction costs;
• delays in opening new restaurants or completing reimages of existing restaurants, including risks associated with our Image Activation program;
• the ability to effectively manage the acquisition and disposition of restaurants or successfully implement other strategic initiatives;
• anticipated or unanticipated restaurant closures by us and our franchisees;
• our ability to identify, attract and retain franchisees with sufficient experience and financial resources to develop and operate Wendy’s restaurantssuccessfully;
• availability of qualified restaurant personnel to us and our franchisees, and the ability to retain such personnel;
• our ability, if necessary, to secure alternative distribution of supplies of food, equipment and other products to Wendy’s restaurants at competitive ratesand in adequate amounts, and the potential financial impact of any interruptions in such distribution;
• availability and cost of insurance;
• availability, terms (including changes in interest rates) and deployment of capital, and changes in debt, equity and securities markets;
• changes in, and our ability to comply with, legal, regulatory or similar requirements, including franchising laws, payment card industry rules, overtimerules, minimum wage rates, wage and hour laws, tax legislation, federal ethanol policy and accounting standards, policies and practices;
• the costs, uncertainties and other effects of legal, environmental and administrative proceedings;
• the effects of charges for impairment of goodwill or for the impairment of other long-lived assets;
• risks associated with failures, interruptions or security breaches of our computer systems or technology, or the occurrence of cyber incidents or adeficiency in cybersecurity that impacts us or our franchisees, including the cybersecurity incident described in the Company’s Annual Report on Form10-K filed with the SEC on February 27, 2019 (the “Form 10-K”);
• the difficulty in predicting the ultimate costs that will be incurred in connection with our plan to reduce general and administrative expense, and the futureimpact on our earnings;
• risks associated with our securitized financing facility and other debt agreements, including the ability to generate sufficient cash flow to meet increaseddebt service obligations, compliance with operational and financial covenants, and restrictions on our ability to raise additional capital;
• risks associated with the amount and timing of share repurchases under share repurchase programs approved by our Board of Directors;
• risks associated with the proposed settlement of the Financial Institutions case described in the Form 10-K, including the timing and amount of payments;
• risks associated with our digital commerce strategy, platforms and technologies, including our ability to adapt to changes in industry trends and consumerpreferences;
• risks associated with our evolving organizational and leadership structure; and
• other risks and uncertainties affecting us and our subsidiaries referred to in the Form 10-K (see especially “Item 1A. Risk Factors” and “Item 7.Management’s Discussion and Analysis of Financial Condition and Results of Operations”) and in our other current and periodic filings with theSecurities and Exchange Commission.
45

All future written and oral forward-looking statements attributable to us or any person acting on our behalf are expressly qualified in their entirety by thecautionary statements contained or referred to in this section. New risks and uncertainties arise from time to time, and it is impossible for us to predict these eventsor how they may affect us. We assume no obligation to update any forward-looking statements after the date of this Quarterly Report on Form 10-Q as a result ofnew information, future events or developments, except as required by federal securities laws. In addition, we do not endorse any projections regarding futureperformance that may be made by third parties.
Item 1. Legal Proceedings.
The Company is involved in litigation and claims incidental to our current and prior businesses. We provide accruals for such litigation and claims whenpayment is probable and reasonably estimable. The Company believes it has adequate accruals for continuing operations for all of its legal and environmentalmatters. We cannot estimate the aggregate possible range of loss for various reasons, including, but not limited to, many proceedings being in preliminary stages,with various motions either yet to be submitted or pending, discovery yet to occur and/or significant factual matters unresolved. In addition, most cases seek anindeterminate amount of damages and many involve multiple parties. Predicting the outcomes of settlement discussions or judicial or arbitral decisions is thusinherently difficult and future developments could cause these actions or claims, individually or in aggregate, to have a material adverse effect on the Company’sfinancial condition, results of operations or cash flows of a particular reporting period.
Item 1A. Risk Factors.
In addition to the information contained in this report, you should carefully consider the risk factors disclosed in our Form 10-K and our Quarterly Report onForm 10-Q for the period ended March 31, 2019, which could materially affect our business, financial condition or future results. Except as described elsewhere inthis report, there have been no material changes from the risk factors previously disclosed in our Form 10-K and our Quarterly Report on Form 10-Q for the periodended March 31, 2019.
46

Item 2. Unregistered Sales of Equity Securities and Use of Proceeds.
The following table provides information with respect to repurchases of shares of our common stock by us and our “affiliated purchasers” (as defined in Rule10b-18(a)(3) under the Exchange Act) during the second quarter of 2019 :
Issuer Repurchases of Equity Securities
PeriodTotal Number of Shares
Purchased (1)
AveragePrice Paidper Share
Total Number ofShares Purchased
as Part ofPublicly Announced
Plans
Approximate DollarValue of Sharesthat May Yet BePurchased Underthe Plans (2)
April 1, 2019 through
May 5, 2019349,393 $18.40 307,555 $211,458
May 6, 2019 through
June 2, 2019355,836 $18.69 352,527 $204,874
June 3, 2019 through
June 30, 2019424,461 $19.38 420,110 $196,736
Total 1,129,690 $18.86 1,080,192 $196,736
(1) Includes 49,498 shares reacquired by the Company from holders of share-based awards to satisfy certain requirements associated with the vesting or exerciseof the respective awards. The shares were valued at the average of the high and low trading prices of our common stock on the vesting or exercise date of suchawards.
(2) In February 2019, our Board of Directors authorized a repurchase program for up to $225.0 million of our common stock through March 1, 2020, when and ifmarket conditions warrant and to the extent legally permissible.
Subsequent to June 30, 2019 through July 31, 2019 , the Company repurchased 0.5 million shares under the February 2019 authorization with an aggregatepurchase price of $10.0 million , excluding commissions.
47

Item 6. Exhibits.
EXHIBIT NO. DESCRIPTION
4.1 Series 2019-1 Supplement to Base Indenture, dated as of June 26, 2019, by and between Wendy’s Funding, LLC, as Master Issuer of the Series2019-1 fixed rate senior secured notes, Class A-2, and Series 2019-1 variable funding senior notes, Class A-1, and Citibank, N.A., as Trusteeand Series 2019-1 Securities Intermediary, incorporated herein by reference to Exhibit 4.1 of The Wendy’s Company Current Report on Form8-K filed on June 26,2019 (SEC file no. 001-02207).
4.2 Fourth Supplement to the Base Indenture, dated as of June 26, 2019, by and between Wendy’s Funding, LLC, as Master Issuer, and Citibank,N.A., as Trustee, incorporated herein by reference to Exhibit 4.2 of The Wendy’s Company Current Report on Form 8-K filed on June 26, 2019(SEC file no. 001-02207).
10.1 2019-1 Class A-2 Note Purchase Agreement, dated as of June 13, 2019, by and among The Wendy’s Company, the subsidiaries of The Wendy’sCompany party thereto and Guggenheim Securities, LLC and Citigroup Global Markets Inc., each acting on behalf of itself and as therepresentatives of the initial purchasers, incorporated herein by reference to Exhibit 10.1 of The Wendy’s Company Current Report on Form 8-K filed on June 13, 2019 (SEC file no. 001-02207).
10.2 Class A-1 Note Purchase Agreement, dated as of June 26, 2019, by and among Wendy’s Funding, LLC, as Master Issuer, each of Quality IsOur Recipe, LLC, Wendy’s Properties, LLC and Wendy’s SPV Guarantor, LLC, as Guarantors, Wendy’s International, LLC, as Manager, theconduit investors party thereto, the financial institutions party thereto, certain funding agents, and Coöperatieve Rabobank, U.A., New YorkBranch, as L/C Provider, Swingline Lender and Administrative Agent, incorporated herein by reference to Exhibit 10.1 of The Wendy’sCompany Current Report on Form 8-K filed on June 26, 2019 (SEC file no. 001-02207).
10.3 Second Amendment to the Management Agreement, dated as of June 26, 2019, by and among Wendy’s Funding, LLC, as Master Issuer, certainsubsidiaries of Wendy’s Funding, LLC party thereto, Wendy’s International, LLC, as Manager, and Citibank, N.A., as Trustee, incorporatedherein by reference to Exhibit 10.2 of The Wendy’s Company Current Report on Form 8-K filed on June 26, 2019 (SEC file no. 001-02207).
31.1 Certification of the Chief Executive Officer of The Wendy’s Company, pursuant to Section 302 of the Sarbanes-Oxley Act of 2002.*31.2 Certification of the Chief Financial Officer of The Wendy’s Company, pursuant to Section 302 of the Sarbanes-Oxley Act of 2002.*32.1 Certifications of the Chief Executive Officer and Chief Financial Officer pursuant to 18 U.S.C. Section 1350, as adopted pursuant to Section
906 of the Sarbanes-Oxley Act of 2002.*101.INS XBRL Instance Document - the instance document does not appear in the Interactive Data File because its XBRL tags are embedded within the
Inline XBRL document.101.SCH XBRL Taxonomy Extension Schema Document*101.CAL XBRL Taxonomy Extension Calculation Linkbase Document*101.DEF XBRL Taxonomy Extension Definition Linkbase Document*101.LAB XBRL Taxonomy Extension Label Linkbase Document*101.PRE XBRL Taxonomy Extension Presentation Linkbase Document*
____________________
* Filed herewith.
48

SIGNATURES
Pursuant to the requirements of the Securities Exchange Act of 1934, the registrant has duly caused this report to be signed on its behalf by the undersignedthereunto duly authorized.
THE WENDY’S COMPANY(Registrant)
Date: August 7, 2019
By: /s/ Gunther Plosch
Gunther Plosch Chief Financial Officer (On behalf of the registrant) Date: August 7, 2019 By: /s/ Leigh A. Burnside Leigh A. Burnside Senior Vice President, Finance and
Chief Accounting Officer (Principal Accounting Officer)
49

EXHIBIT 31.1
CERTIFICATION OF THE CHIEF EXECUTIVE OFFICEROF THE WENDY’S COMPANY, PURSUANT TO SECTION 302
OF THE SARBANES-OXLEY ACT OF 2002
I, Todd A. Penegor, certify that:
1. I have reviewed this quarterly report on Form 10-Q of The Wendy’s Company;
2. Based on my knowledge, this report does not contain any untrue statement of a material fact or omit to state a material fact necessary to make the statementsmade, in light of the circumstances under which such statements were made, not misleading with respect to the period covered by this report;
3. Based on my knowledge, the financial statements, and other financial information included in this report, fairly present in all material respects the financialcondition, results of operations and cash flows of the registrant as of, and for, the periods presented in this report;
4. The registrant’s other certifying officer(s) and I are responsible for establishing and maintaining disclosure controls and procedures (as defined in ExchangeAct Rules 13a-15(e) and 15d-15(e)) and internal control over financial reporting (as defined in Exchange Act Rules 13a-15(f) and 15d-15(f)) for the registrantand have:
(a) Designed such disclosure controls and procedures, or caused such disclosure controls and procedures to be designed under our supervision, to ensurethat material information relating to the registrant, including its consolidated subsidiaries, is made known to us by others within those entities,particularly during the period in which this report is being prepared;
(b) Designed such internal control over financial reporting, or caused such internal control over financial reporting to be designed under our supervision, toprovide reasonable assurance regarding the reliability of financial reporting and the preparation of financial statements for external purposes inaccordance with generally accepted accounting principles;
(c) Evaluated the effectiveness of the registrant’s disclosure controls and procedures and presented in this report our conclusions about the effectiveness ofthe disclosure controls and procedures, as of the end of the period covered by this report based on such evaluation; and
(d) Disclosed in this report any change in the registrant’s internal control over financial reporting that occurred during the registrant’s most recent fiscalquarter (the registrant’s fourth fiscal quarter in the case of an annual report) that has materially affected, or is reasonably likely to materially affect, theregistrant’s internal control over financial reporting; and
5. The registrant’s other certifying officer(s) and I have disclosed, based on our most recent evaluation of internal control over financial reporting, to theregistrant’s auditors and the audit committee of the registrant’s board of directors (or persons performing the equivalent functions):
(a) All significant deficiencies and material weaknesses in the design or operation of internal control over financial reporting which are reasonably likely toadversely affect the registrant’s ability to record, process, summarize and report financial information; and
(b) Any fraud, whether or not material, that involves management or other employees who have a significant role in the registrant’s internal control overfinancial reporting.
Date: August 7, 2019
/s/ Todd A. Penegor Todd A. PenegorPresident and Chief Executive Officer

EXHIBIT 31.2
CERTIFICATION OF THE CHIEF FINANCIAL OFFICEROF THE WENDY’S COMPANY, PURSUANT TO SECTION 302
OF THE SARBANES-OXLEY ACT OF 2002
I, Gunther Plosch, certify that:
1. I have reviewed this quarterly report on Form 10-Q of The Wendy’s Company;
2. Based on my knowledge, this report does not contain any untrue statement of a material fact or omit to state a material fact necessary to make the statementsmade, in light of the circumstances under which such statements were made, not misleading with respect to the period covered by this report;
3. Based on my knowledge, the financial statements, and other financial information included in this report, fairly present in all material respects the financialcondition, results of operations and cash flows of the registrant as of, and for, the periods presented in this report;
4. The registrant’s other certifying officer(s) and I are responsible for establishing and maintaining disclosure controls and procedures (as defined in ExchangeAct Rules 13a-15(e) and 15d-15(e)) and internal control over financial reporting (as defined in Exchange Act Rules 13a-15(f) and 15d-15(f)) for the registrantand have:
(a) Designed such disclosure controls and procedures, or caused such disclosure controls and procedures to be designed under our supervision, to ensurethat material information relating to the registrant, including its consolidated subsidiaries, is made known to us by others within those entities,particularly during the period in which this report is being prepared;
(b) Designed such internal control over financial reporting, or caused such internal control over financial reporting to be designed under our supervision, toprovide reasonable assurance regarding the reliability of financial reporting and the preparation of financial statements for external purposes inaccordance with generally accepted accounting principles;
(c) Evaluated the effectiveness of the registrant’s disclosure controls and procedures and presented in this report our conclusions about the effectiveness ofthe disclosure controls and procedures, as of the end of the period covered by this report based on such evaluation; and
(d) Disclosed in this report any change in the registrant’s internal control over financial reporting that occurred during the registrant’s most recent fiscalquarter (the registrant’s fourth fiscal quarter in the case of an annual report) that has materially affected, or is reasonably likely to materially affect, theregistrant’s internal control over financial reporting; and
5. The registrant’s other certifying officer(s) and I have disclosed, based on our most recent evaluation of internal control over financial reporting, to theregistrant’s auditors and the audit committee of the registrant’s board of directors (or persons performing the equivalent functions):
(a) All significant deficiencies and material weaknesses in the design or operation of internal control over financial reporting which are reasonably likely toadversely affect the registrant’s ability to record, process, summarize and report financial information; and
(b) Any fraud, whether or not material, that involves management or other employees who have a significant role in the registrant’s internal control overfinancial reporting.
Date: August 7, 2019
/s/ Gunther Plosch Gunther PloschChief Financial Officer

EXHIBIT 32.1
CERTIFICATIONS OF THE CHIEF EXECUTIVE OFFICER AND CHIEF FINANCIAL OFFICERPURSUANT TO 18 U.S.C. SECTION 1350, AS ADOPTED PURSUANT TO
SECTION 906 OF THE SARBANES-OXLEY ACT OF 2002
Pursuant to Section 1350 of Chapter 63 of Title 18 of the United States Code, as adopted pursuant to Section 906 of the Sarbanes-Oxley Act of 2002, each ofthe undersigned officers of The Wendy’s Company, a Delaware corporation (the “Company”), does hereby certify, to the best of such officer’s knowledge, that inconnection with the Quarterly Report on Form 10-Q of the Company for the quarter ended June 30, 2019 (the “Form 10-Q”):
1. the Form 10-Q fully complies with the requirements of Section 13(a) or 15(d) of the Securities Exchange Act of 1934; and
2. the information contained in the Form 10-Q fairly presents, in all material respects, the financial condition and results of operations of the Company.
Date: August 7, 2019
/s/ Todd A. Penegor Todd A. PenegorPresident and Chief Executive Officer
Date: August 7, 2019/s/ Gunther Plosch Gunther PloschChief Financial Officer