Embed Size (px)
Citation preview
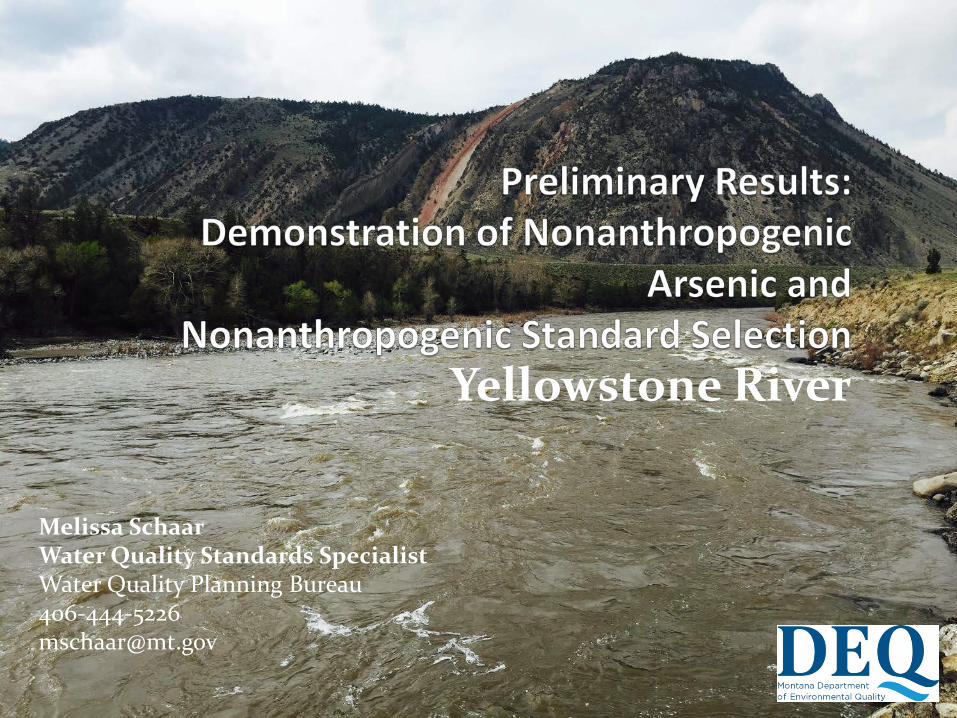
Yellowstone River
Melissa SchaarWater Quality Standards Specialist Water Quality Planning [email protected]
Outline History Demonstration of Nonanthropogenic (DON) Nonanthropogenic Standard Selection (NAS) Conclusions
3/2/2018 DRAFT 2

History A spinoff of SB325 legislation – resulting in
nonanthropogenic arsenic site specific standards Madison River DON/NAS Draft Documentation Complete
Demonstration of Nonanthropogenic Arsenic: Madison River, Madison County, Montana
Nonanthropogenic Standard Selection: Madison River, Madison County, Montana
DON and NAS processes have been reviewed by the SB325 workgroup and EPA
These same processes were used to develop the Yellowstone River Arsenic DON/NAS
Preliminary Results for Yellowstone River Arsenic DON/NAS complete
3/2/2018 DRAFT 3
Yellowstone River
3/2/2018 DRAFT 4
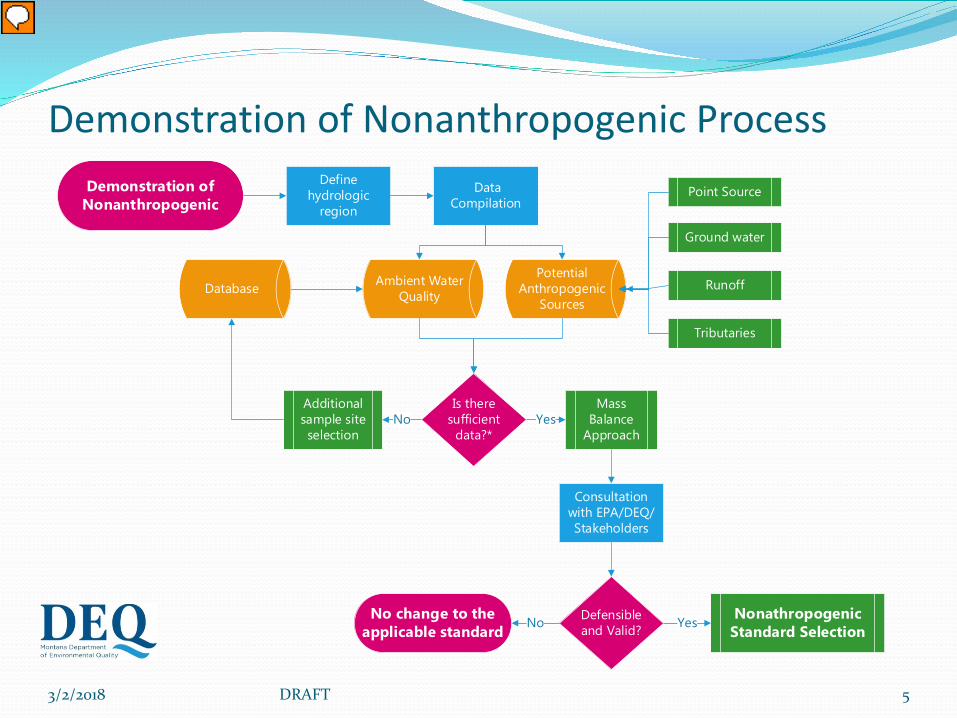
Demonstration of Nonanthropogenic Process
3/2/2018 DRAFT 5
Demonstration of Nonanthropogenic
Data Compilation
Database
Is there sufficient
data?*
Additional sample site selection
Ambient Water Quality
Potential Anthropogenic
Sources
Mass Balance
Approach
Define hydrologic
region
Consultation with EPA/DEQ/Stakeholders
Defensible and Valid?
Nonathropogenic Standard Selection
No change to the applicable standard
No Yes
No Yes
Point Source
Tributaries
Runoff
Ground water
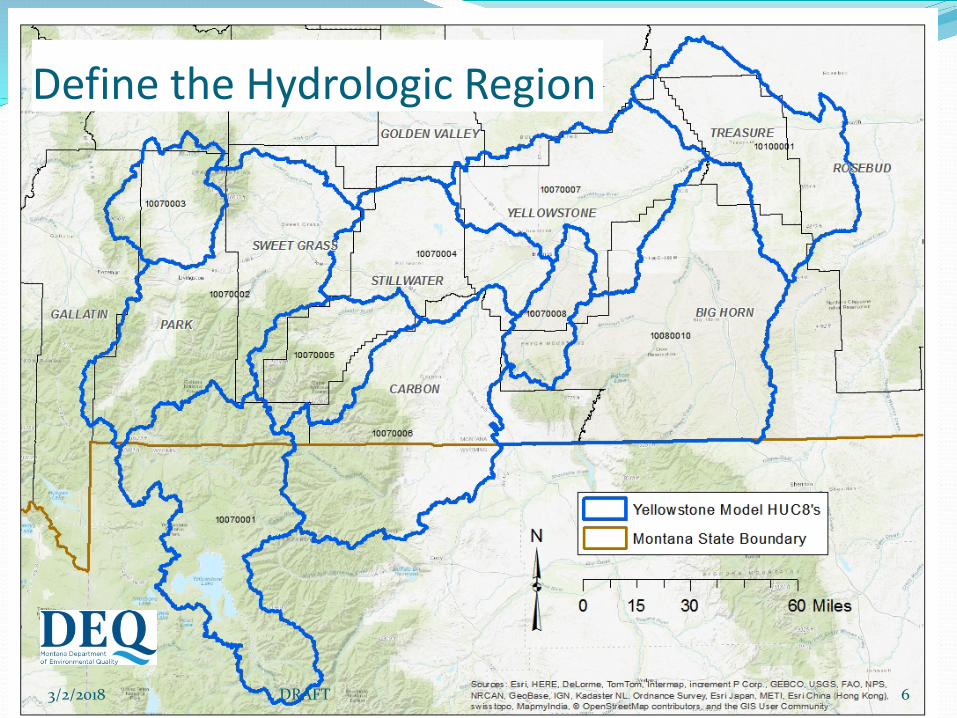
Define the Hydrologic Region
3/2/2018 DRAFT 6
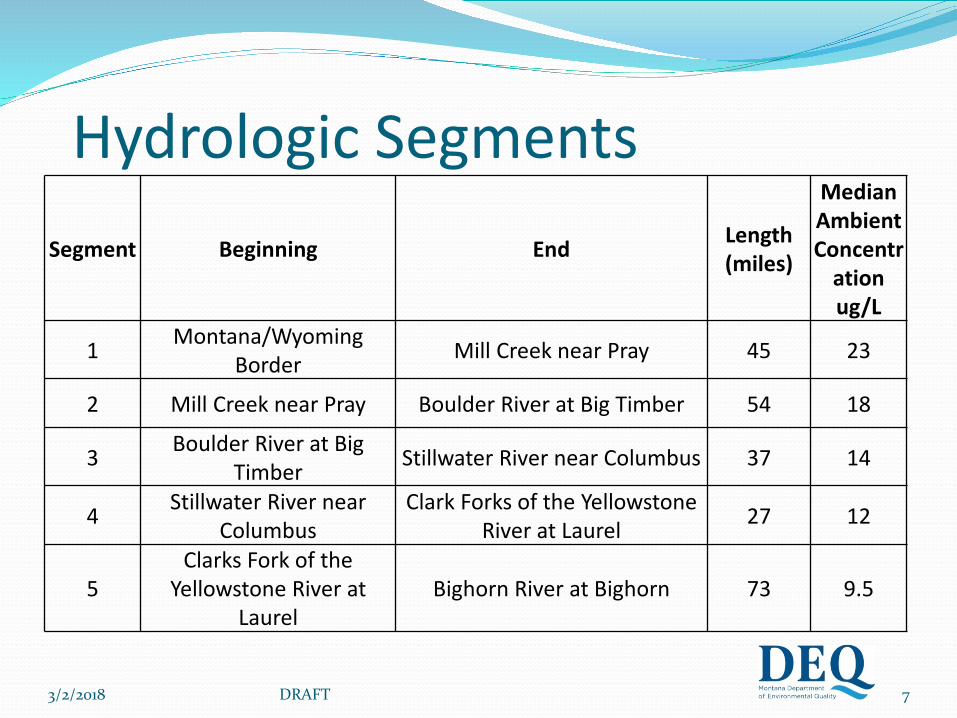
Hydrologic Segments
3/2/2018 DRAFT 7
Segment Beginning End Length (miles)
MedianAmbient Concentr
ation ug/L
1 Montana/Wyoming Border Mill Creek near Pray 45 23
2 Mill Creek near Pray Boulder River at Big Timber 54 18
3 Boulder River at Big Timber Stillwater River near Columbus 37 14
4 Stillwater River near Columbus
Clark Forks of the Yellowstone River at Laurel 27 12
5Clarks Fork of the
Yellowstone River at Laurel
Bighorn River at Bighorn 73 9.5

3/2/2018 DRAFT 8
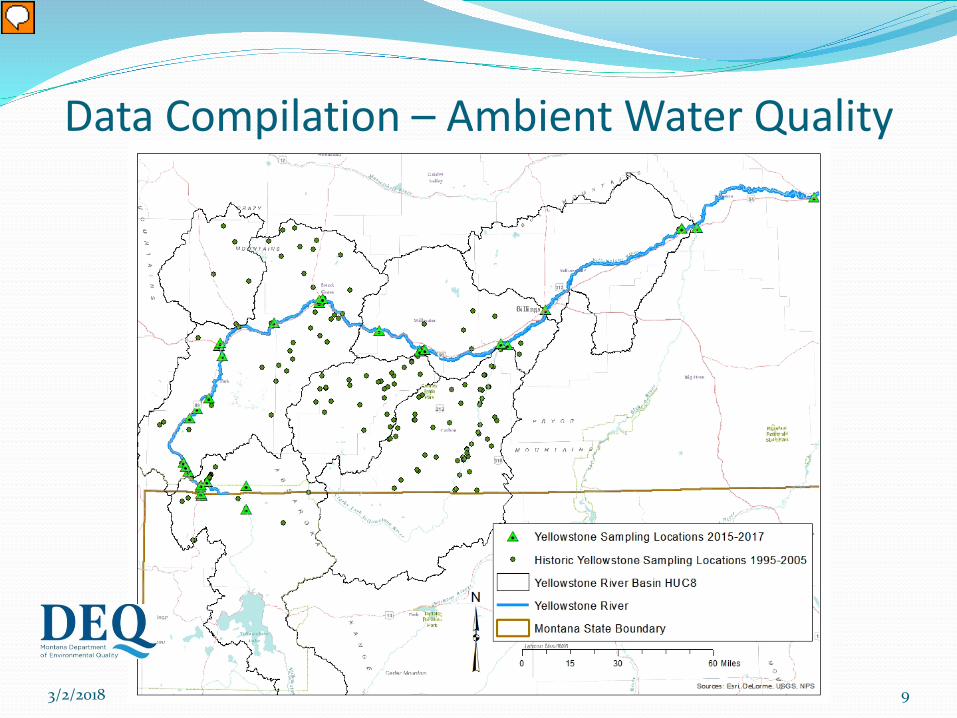
Data Compilation – Ambient Water Quality
3/2/2018 DRAFT 9

3/2/2018 DRAFT 10
Permitted Point Sources

Permitted Point Sources with Arsenic
3/2/2018 DRAFT 11
MPDES No. Facility Receiving Body
Facility Load (Kg/ Month)
River Load at Facility
(Kg/ Month)
% of River Load
Facility Load (Kg/month)
River Load at Facility
(Kg/ Month)
% of River Load
June December
MT0030252
TVX MINERAL HILL INC -TVX MINERAL HILL
MINE
BEAR CREEK 0.19 6,109 0.003% 0.39 2,417 0.016%
MT0022705
GARDINER WWTF
YELLOWSTONE RIVER 4.44 6,109 0.073% 2.25 2,417 0.093%
MT0020435
CITY OF LIVINGSTON
WWTP
YELLOWSTONE RIVER 0.50 7,037 0.007% 0.50 2,463 0.020%
MT0000264
CENEX HARVEST
STATES COOP.
YELLOWSTONE RIVER 3.64 11,983 0.030% 5.37 2,382 0.226%
MT0000281
WESTERN SUGAR
COOPERATIVEYEGEN DRAIN 0.95 12,943 0.007% 0.74 2,307 0.032%
MT0000256
PHILLIPS 66 -BILLINGS REFINERY
YEGEN DRAIN 0.31 12,943 0.002% 0.45 2,307 0.019%
MT0000477
EXXONMOBIL REFINING &
SUPPLY
YELLOWSTONE RIVER 1.67 12,943 0.013% 2.54 2,307 0.110%
MT0022586
CITY OF BILLINGS
WWTP
YELLOWSTONE RIVER 6.81 12,943 0.053% 6.81 2,307 0.295%
Total From All Permittees at Billings 18.52 12,943 0.143% 19.04 2,307 0.826%

3/2/2018 DRAFT 12
Tributary Contribution

The Mass Balance Approach involves calculation of Mass Loads of Arsenic from various sources defined in the Mass Load Equation (next Slide). Mass load is defined as:ML = C x Q x t x cf
ML – Mass Load – pounds/day, kilograms/monthC – Concentration (ug/L or mg/L)Q – Volume of water at a point (cubic feet per
second, cfs)T – A period of time (season, month, or year)cf – conversion factor for mass load calculation
Mass Balance Approach
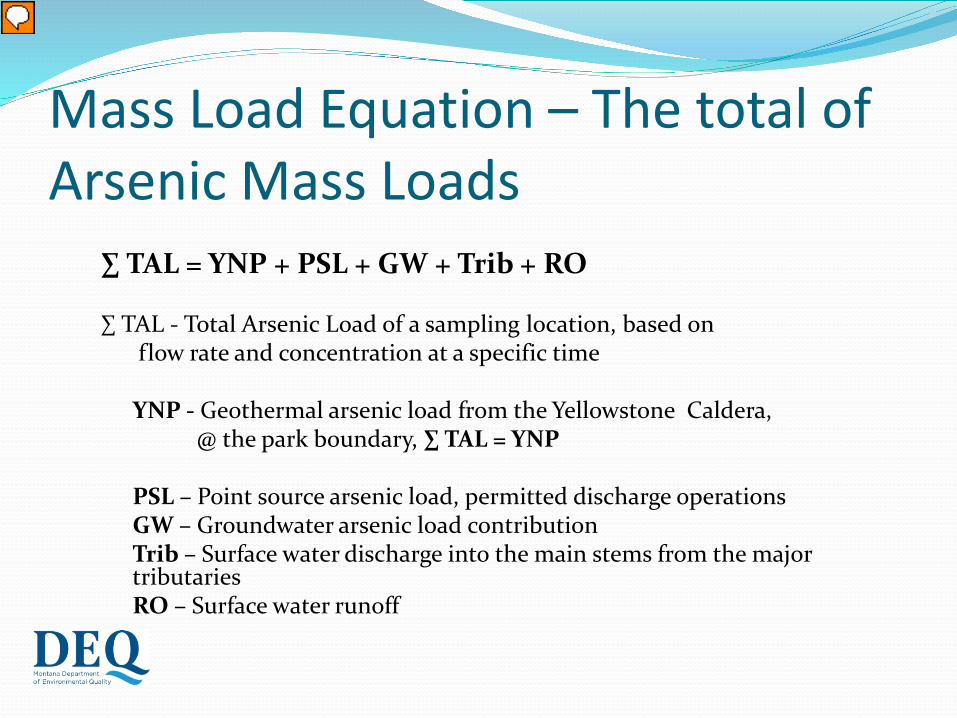
∑ TAL = YNP + PSL + GW + Trib + RO
∑ TAL - Total Arsenic Load of a sampling location, based onflow rate and concentration at a specific time
YNP - Geothermal arsenic load from the Yellowstone Caldera,@ the park boundary, ∑ TAL = YNP
PSL – Point source arsenic load, permitted discharge operations GW – Groundwater arsenic load contribution Trib – Surface water discharge into the main stems from the major tributariesRO – Surface water runoff
Mass Load Equation – The total of Arsenic Mass Loads

Yearly Mass Balance
3/2/2018 DRAFT 15
Station
Median Total
Arsenic Load (TAL)
Source Loads (PSL
+ GWA)
Anthro-pogenicRunoff
Load (ROA)
Running Total
Anthro-pogenic
Loads (PSL + ROA + GWA)
Median Non-
Anthro-pogenic
Loads (NAL)
kg/year
MT/WY Border to Mill Creek 41587.0 41.4 25.3 357.6 41229.5
Mill Creek to Boulder River 44664.2 6.0 133.7 497.3 44167.0
Boulder River to Stillwater River 44364.3 0.0 24.8 522.1 43842.2Stillwater River to Clarks Fork
Yellowstone River 50763.8 62.1 117.9 702.1 50061.7Clarks Fork Yellowstone River to
Bighorn River 51551.9 225.0 364.5 1291.6 50260.4

Mass Load Summary
3/2/2018 DRAFT 16
Mass Balance
Load at Bighorn
(kg/year)% of TAL at
Bighorn
Start: MT/WY Border 41,229 80%
Anthropogenic Arsenic Load 1292 2.5%
Non-Anthropogenic Tributary Load 7,908 15.3%
Unaccounted for Mass Load/Error 1,123 2.2%
End: Mouth of the Big Horn River (kg/year) 51,552 100.0%
Total Nonanthropogenic Arsenic from MT/WY Border to the Confluence of the Bighorn River 49,137 95.3%

Yellowstone River
3/2/2018 DRAFT 17

Picking a NAS Is Not Simple – Example: Concentration Patterns at Corwin Springs
3/2/2018 DRAFT 18

Nonanthropogenic Standard (NAS) Selection Process
3/2/2018 DRAFT 19
Whether Low Flow or Annual, the NAS is based on the 50th percentile (median) of the nonanthropogenic distribution
Nonanthropogenic Standard Selection
Demonstration of Nonanthropogenic
Dilution Test
Seasonality Test
Seasons?
Existing or Potential
Discharges?
Annual Criteria
Annual Criteria
Annual Criteria Criteria Based on Low Flow
No
7Q10 >0 ?
NO
YES Significant (>1%) ?
No
No YES
Annual CriteriaYES
YES

Dilution Test – Permitted Discharges
3/2/2018 DRAFT 20
MPDES No. FacilityHydrologic Segment Discharge
Maximum Flow (cfs)
Max Conc.(ug/L)
MT0030252TVX MINERAL HILL INC -TVX MINERAL
HILL MINE 1 0.42 14MT0022705 GARDINER WWTF 1 0.65 10MT0020435 CITY OF LIVINGSTON WWTP 2 1.7 4MT0000264 CENEX HARVEST STATES COOP. 4 2.2 8MT0000281 WESTERN SUGAR COOPERATIVE 5 3.2 4MT0000256 PHILLIPS 66 - BILLINGS REFINERY 5 1 6MT0000477 EXXONMOBIL REFINING & SUPPLY 5 3.9 12MT0022586 CITY OF BILLINGS WWTP 5 23 4

Dilution Test - Results
3/2/2018 DRAFT 21
Station
USGS Station Number
7Q10 (cfs)
Discharger Max Flow
(cfs)Dilution Test (MAX/7Q10) Conclusions
MT/WY Border to Mill Creek 6191500 504 1.07 0.2%Use Seasonal
Determination
Mill Creek to Boulder River 6192500 766 1.7 0.2%Use Seasonal
DeterminationBoulder River to Stillwater
River N/A 907 0 0 Annual CriteriaStillwater River to Clarks Fork
Yellowstone N/A 1047 2.2 0.2%Use Seasonal
DeterminationClarks Fork of the Yellowstone
River to Bighorn River 6214500 1197 31.1 2.6% Annual Criteria
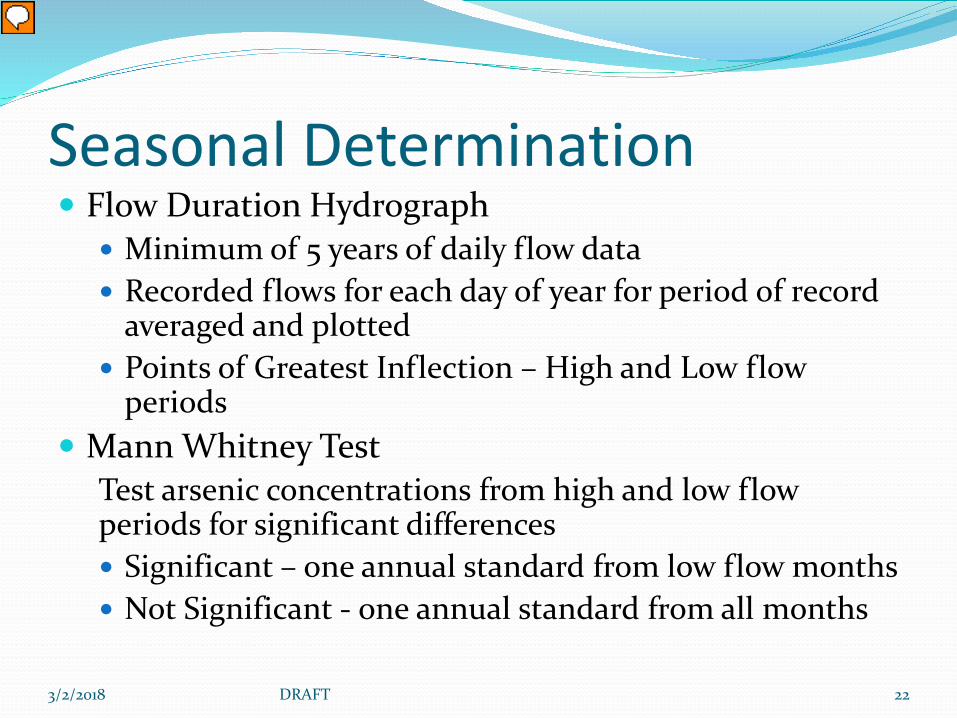
Seasonal Determination Flow Duration Hydrograph
Minimum of 5 years of daily flow data Recorded flows for each day of year for period of record
averaged and plotted Points of Greatest Inflection – High and Low flow
periods Mann Whitney Test
Test arsenic concentrations from high and low flow periods for significant differences Significant – one annual standard from low flow months Not Significant - one annual standard from all months
3/2/2018 DRAFT 22

Seasonal Determination-Hydrograph
3/2/2018 DRAFT 23
0
2000
4000
6000
8000
10000
12000
14000
Flow
(cfs
)
Day of Year
Yellowstone Corwin Springs USGS Gage# 6191500, (1997-2017)
Inflection Points: 111 - 222 daysActual Dates: April 21 to August 10High Flow Period: May 1 to July 31Low Flow Period: August 1 to April 30

Seasonal Determination Results Mann- Whitney Test
using Minitab Concentrations
determined significantly different between high and low flow periods
Seasonality NAS selected is an
annual standard based on low flow months
3/2/2018 DRAFT 24

Seasonality – YES1. MT/WY Border to Mill Creek: Model Derived Median Monthly Nonanthropogenic Arsenic Loads, Flow Rates, and Concentrations
3/2/2018 DRAFT 25
*High Flow Period in Blue and the Low Flow Period in Red, derived from Histogram
Month
Median Nonanthropogenic
Arsenic Load (kg/month) Median Flow Rate (cfs)
Median Nonanthropogenic
Concentration (ug/L)October 3111 1360 31
November 2259 1460 21December 2414 903 36
January 2190 878 34February 2196 903 33
March 2595 1070 33April 3486 2535 18May 5694 7340 10June 6105 9120 9July 4692 3860 16
August 3708 2060 24September 3090 1305 32
Annual Standard Based on Low Flow Months 32

Summary: NAS Yellowstone River
3/2/2018 DRAFT 26
Segment Seasonality Results
Type of Standard Selected
Numeric Criteria
Frequency and Duration
1. MT/WY Border to Mill Creek Seasonality Annual Based on
Low Flow Months 32Average Annual
Concentration Not to Exceed Criteria
2. Mill Creek to Boulder River Seasonality Annual Based on Low Flow Months 24
Average Annual Concentration Not to
Exceed Criteria
3. Boulder River to Stillwater River N/A
Annual Based on All Months 16
Average Annual Concentration Not to
Exceed Criteria
4. Stillwater River to Clarks Fork of the Yellowstone River Seasonality
Annual Based on Low Flow Months 14
Average Annual Concentration Not to
Exceed Criteria5. Clarks Fork of the
Yellowstone River to Bighorn River
N/A Annual Based on All Months 10
Average Annual Concentration Not to
Exceed Criteria

Nonanthropogenic Standards (NAS) for Yellowstone River
273/2/2018Melissa Schaar, Water Quality Specialist, Montana DEQ
NAS= 32 ug/L
NAS= 24 ug/L
NAS= 16 ug/L
NAS= 14 ug/L
NAS= 10 ug/L

Frequency and Duration of Arsenic Current DEQ 7 (2010)
(16) Surface or groundwater concentrations may not exceed these values
Reasoning for change Arsenic is a carcinogenic MCL-based criterion that factors
cost and technology into the recommendation - less stringent than a health-based recommendation
Since the MCL is not derived directly from toxicity, a “may not” exceed is not necessary.
Proposed Frequency and Duration for ArsenicAverage annual concentrations may not exceed the standard
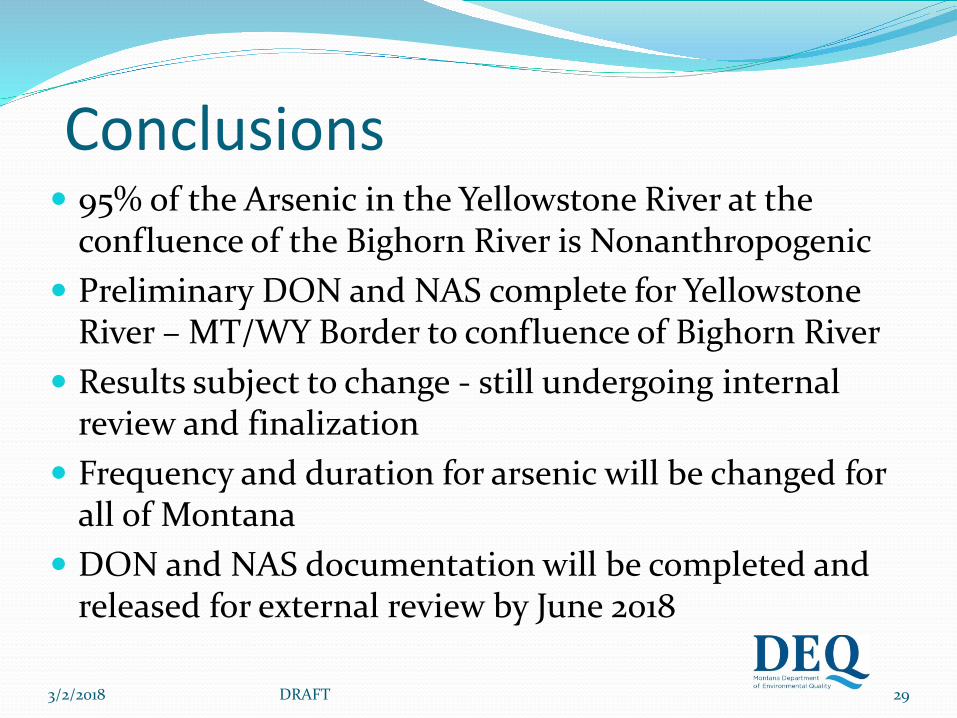
Conclusions 95% of the Arsenic in the Yellowstone River at the
confluence of the Bighorn River is Nonanthropogenic Preliminary DON and NAS complete for Yellowstone
River – MT/WY Border to confluence of Bighorn River Results subject to change - still undergoing internal
review and finalization Frequency and duration for arsenic will be changed for
all of Montana DON and NAS documentation will be completed and
released for external review by June 2018
3/2/2018 DRAFT 29

Timeline for RulemakingTasks Target Dates Draft DON and NAS for
External Review Draft Arsenic Rule Language Briefing to BER Present to WPCAC Request from BER adoption
of proposed rule BER adoption of proposed
rule
June 2018
June 2018June 8, 2018July 13, 2018August 10, 2018
December 7, 2018
3/2/2018 DRAFT 31


![[XLS]deq.mt.govdeq.mt.gov/Portals/112/Land/WMRD/DataInformationResources... · Web view855041 855041 817722 855041 855041 855067 855041 855041 855041 855041 855041 855041 855041 855041](https://img.pdfslide.us/doc/110x75/5b3e80647f8b9af8748b5805/xlsdeqmt-web-view855041-855041-817722-855041-855041-855067-855041-855041.jpg)


![[XLS]deq.mt.govdeq.mt.gov/Portals/112/Land/WMRD/DataInformation... · Web viewrt_well_segment_type rt_valid_code rt_unit_conversion_factor rt_unit rt_timezone rt_test_type rt_test_batch_type](https://img.pdfslide.us/doc/110x75/5ab577477f8b9a0f058cd7fc/xlsdeqmt-viewrtwellsegmenttype-rtvalidcode-rtunitconversionfactor-rtunit.jpg)