Embed Size (px)
Citation preview
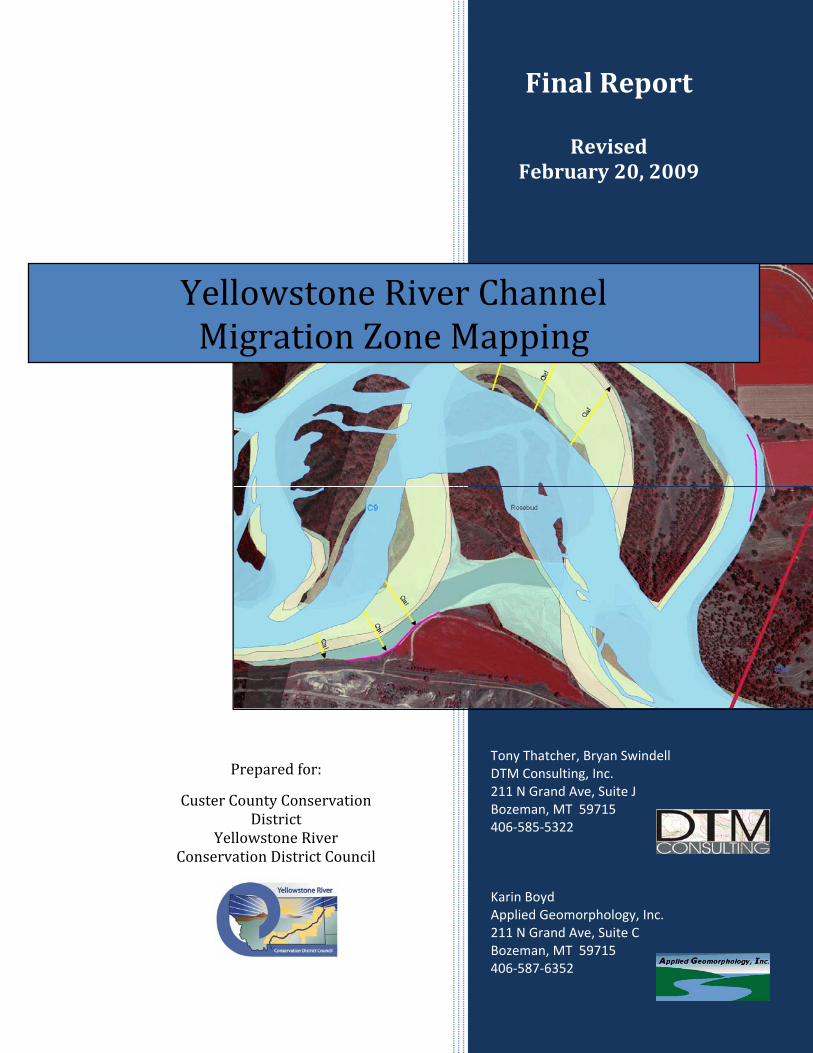
Final Report
Revised
February 20, 2009
Tony Thatcher, Bryan Swindell DTM Consulting, Inc. 211 N Grand Ave, Suite J Bozeman, MT 59715 406‐585‐5322
Karin Boyd Applied Geomorphology, Inc. 211 N Grand Ave, Suite C Bozeman, MT 59715 406‐587‐6352
Yellowstone River Channel Migration Zone Mapping
Prepared for:
Custer County Conservation District
Yellowstone River Conservation District Council

Yellowstone CMZ i DTM and AGI
Table of Contents
1.0 Introduction .............................................................................................................. 1 1.1 Revisions to 2008 Report ..................................................................................... 1 1.2 Channel Migration and Avulsion Processes ......................................................... 1 1.3 The Channel Migration Zone Mapping Concept ................................................. 3 1.4 Uncertainty ........................................................................................................... 4 1.5 Relative Levels of Risk ........................................................................................ 4 1.6 Potential Applications .......................................................................................... 4 1.7 Disclaimer and Limitations .................................................................................. 5 1.8 Acknowledgements .............................................................................................. 5
2.0 Physical Setting ........................................................................................................ 7 2.1 Regional Geologic History ................................................................................... 7 2.2 Valley Wall Geology ............................................................................................ 8 2.3 Quaternary Terraces ............................................................................................. 8 2.4 River Morphology .............................................................................................. 10
3.0 Methods and Results .............................................................................................. 13 3.1 The Historic Migration Zone (HMZ) ................................................................. 13 3.2 The Erosion Buffer ............................................................................................. 14
3.2.1 Geologic Controls on Migration Rate ......................................................... 16 3.2.2 Migration Rate Statistics ............................................................................. 17
3.3 The Restricted Migration Area ........................................................................... 20 3.4 The Avulsion Potential Zone (APZ) .................................................................. 22 3.5 The Restricted Avulsion Potential Zone ............................................................ 22 3.6 Composite Map .................................................................................................. 22 3.7 Deliverables ........................................................................................................ 23
4.0 References .............................................................................................................. 25 Appendix A. Reach Lengths, Classification, and General Location ............................ 27 Appendix B. Channel Classification Scheme ............................................................... 31 Appendix C. Channel Migration Measurement Results ............................................... 33 Appendix D. Erosion Buffer Values ............................................................................. 36
List of Figures
Figure 1-1. Example of progressive 1950-2001 meander migration at two sites in Rosebud County. ......................................................................................................... 2
Figure 1-2. Example of a 1997 flood-driven avulsion via meander cutoff, Rosebud County. ........................................................................................................................ 3
Figure 2-1. Valley bottom width and associated valley wall geology, Springdale to mouth. ......................................................................................................................... 8
Figure 2-2. Schematic diagram of a typical river valley floodplain and terrace configuration (unt.edu). .............................................................................................. 9
Figure 2-3. River floodplain and terrace downstream of Pine Creek Bridge in the Paradise Valley, Yellowstone River. ........................................................................ 10
Figure 2-4. Regional geomorphic zones of the Middle and Lower Yellowstone River. . 12
Yellowstone CMZ ii DTM and AGI
Figure 3-1. Composite Historic Migration Zone (HMZ) showing bendway migration from 1950-2001; migration lines are shown as arrows. ............................................ 14
Figure 3-2. Migration vectors, showing length of longest site vector in feet. ................. 16 Figure 3-3. Schematic Cross Section showing geologic units addressed in CMZ
development. ............................................................................................................. 17 Figure 3-4. Erosion buffers applied to 2001 channel margin, Yellowstone River project
reach. ......................................................................................................................... 18 Figure 3-5. Erosion buffers applied to 2001 channel margin. ......................................... 19 Figure 3-6. Statistical summary of erosion buffer widths by each reach type; average
values are labeled. ..................................................................................................... 19 Figure 3-7. CMZ showing Restricted Migration Areas (cross-hatched) and Avulsion
Potential Areas (pink). .............................................................................................. 20 Figure 3-8. Total channel migration zone area by Reach Type. ...................................... 21 Figure 3-9. Percent of restricted migration area by reach type (total of all acreage). ..... 21 Figure 3-10. Statistical summary of percent restricted migration area by reach type;
based on individual reach data (median values are labeled). .................................... 22 Figure 3-11. Composite Channel Migration Zone on 2005 NAIP imagery. ................... 23
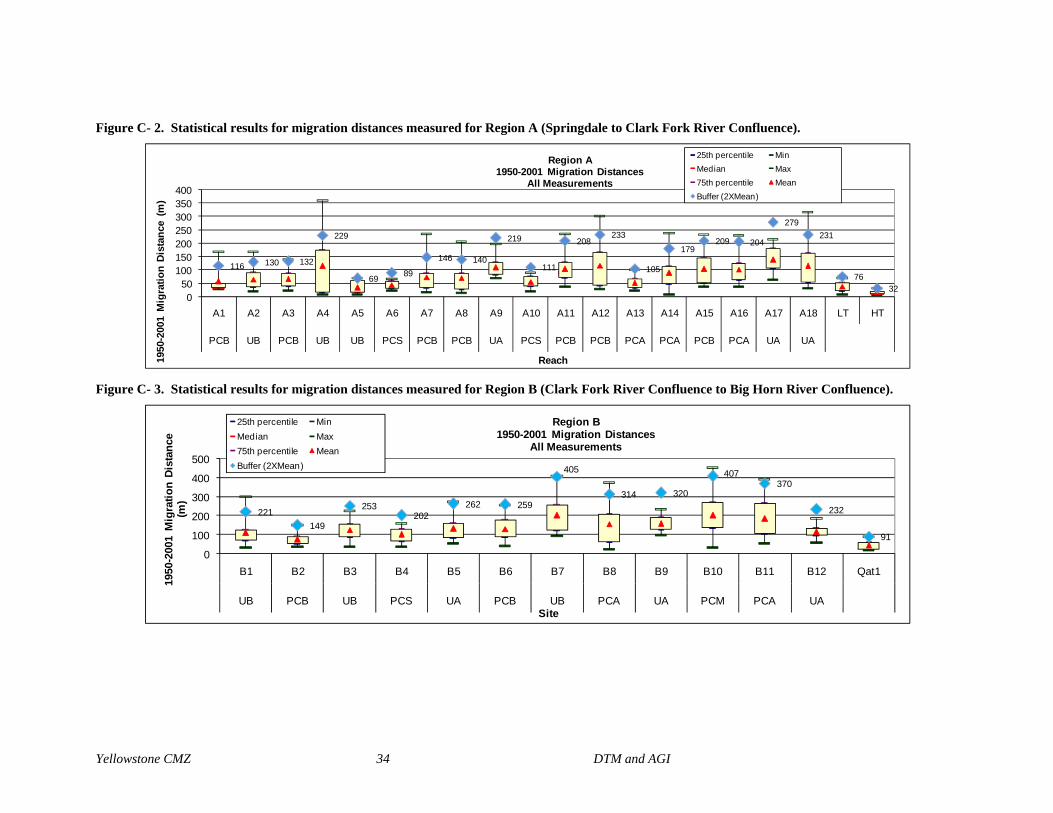
Figure C- 1. Statistical results for migration distances measured for Park County. ........ 33 Figure C- 2. Statistical results for migration distances measured for Region A
(Springdale to Clark Fork River Confluence). .......................................................... 34 Figure C- 3. Statistical results for migration distances measured for Region B (Clark
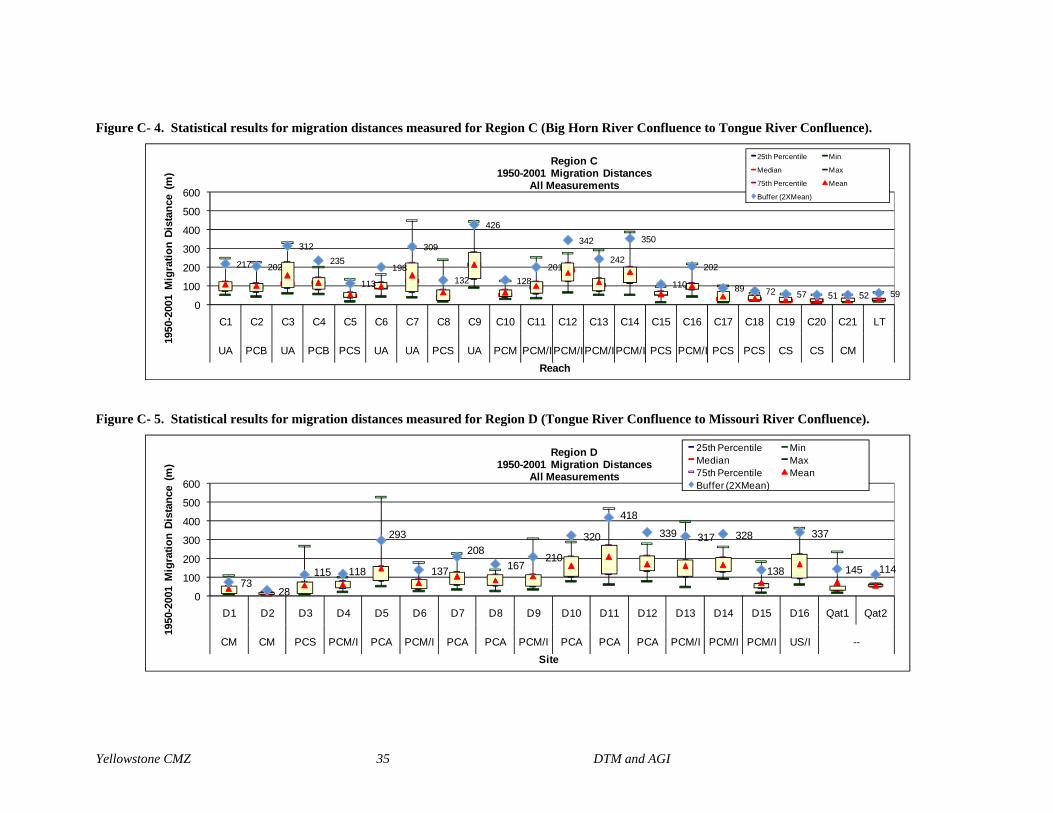
Fork River Confluence to Big Horn River Confluence). .......................................... 34 Figure C- 4. Statistical results for migration distances measured for Region C (Big Horn
River Confluence to Tongue River Confluence). ..................................................... 35 Figure C- 5. Statistical results for migration distances measured for Region D (Tongue
River Confluence to Missouri River Confluence). ................................................... 35
List of Tables Table 1. Descriptions of mapped terraces in the vicinity of Billings (Lopez, 2000). ........ 9
Table A- 1. Summary of reach types and geographic location ........................................ 27
Table B- 1. Channel classification ................................................................................... 31
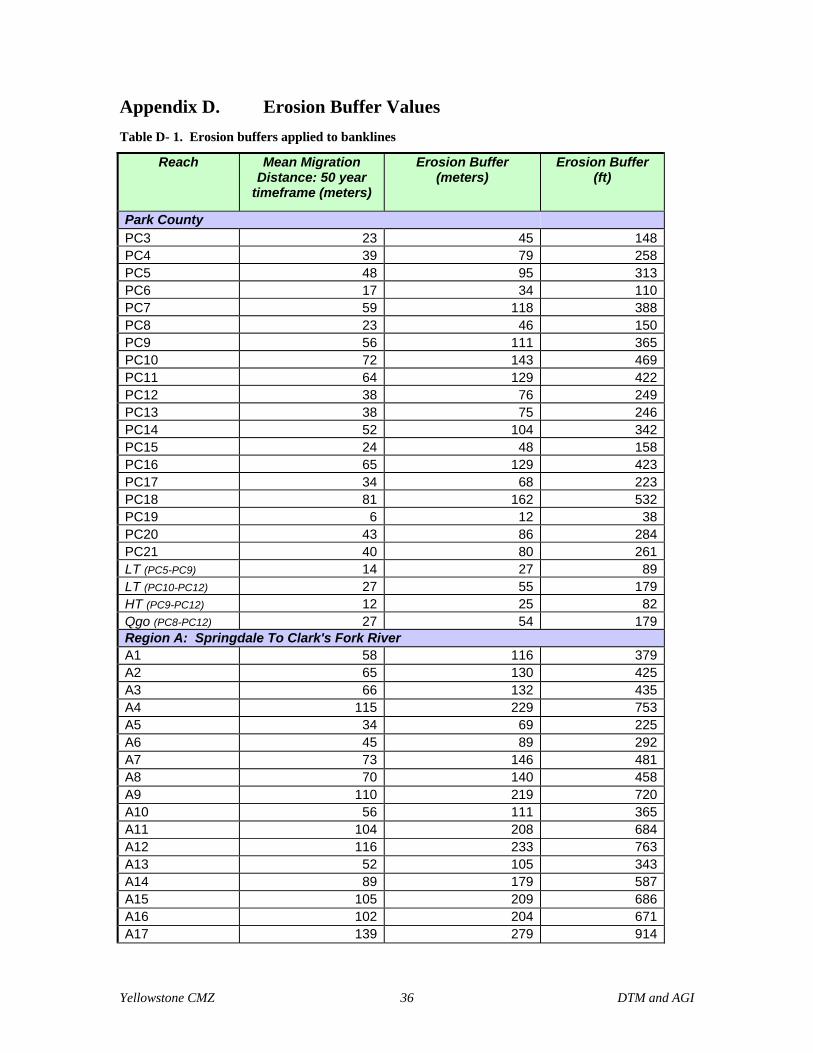
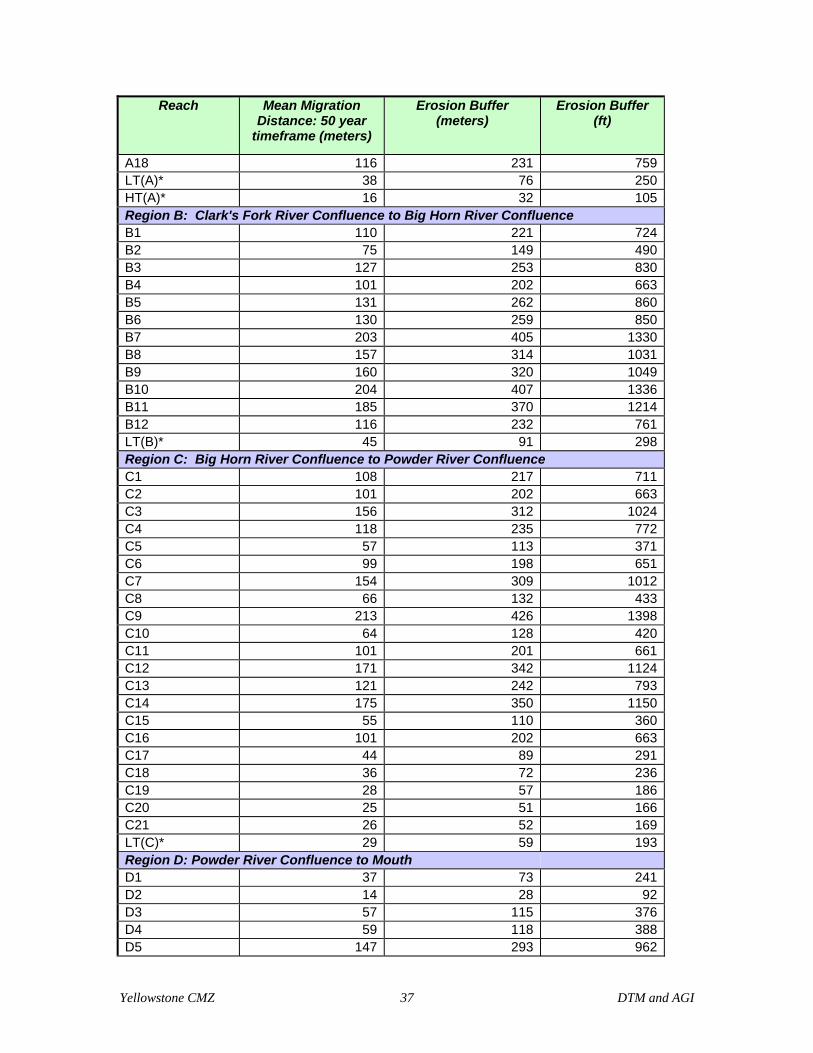
Table D- 1. Erosion buffers applied to banklines ............................................................ 36
Yellowstone CMZ 1 DTM and AGI
1.0 Introduction This report describes the development of a Channel Migration Zone (CMZ) map for the portion of the Yellowstone River that extends from the Gardiner near Yellowstone National Park, to its confluence with the Missouri River in McKenzie County, North Dakota. This mapping supports the Yellowstone River Conservation District Council in their efforts developing best management practices and performing a cumulative effects assessment of the Yellowstone River corridor.
1.1 Revisions to 2008 Report This report contains revisions made to the original June 2008 document based on the incorporation of high-resolution Light Detection and Ranging (LiDAR) topographic data that has recently become available for all counties in the Yellowstone River corridor with the exception of Park County. In Park County, a photogrammetric elevation model supporting 2-foot contours was used in lieu of LiDAR data. The LiDAR data have been utilized for two primary purposes. First, the topographic data have been used to refine the mapping of Quaternary-age geologic units in the valley bottom. These revisions reflect an evaluation of the alluvial benches in the valley bottom in terms of their elevations relative to the river. The Yellowstone River valley bottom contains distinct terrace surfaces as well as less-pronounced alluvial surfaces that lie within the river’s active floodplain. By evaluating cross sections using the LiDAR data, areas where terraces intersect the channel margin were identified with greater precision than mapping previously performed with aerial photography and published geologic mapping. Second, the high resolution LiDAR elevation data have been used to identify high flow channels that dissect the floodplain and may be prone to activation, or avulsion during flood events. As the LiDAR data collection method penetrates the tree canopy and represents a bare earth elevation surface, floodplain topography is much more evident on these maps than on air photos. The other main revision to this report is the inclusion of Park County mapping. The previous document that described Yellowstone River CMZ mapping did not contain the Park County portion of the Yellowstone River, which reaches from Gardiner to Springdale. As part of the effort to update the mapping, Park County has been included to provide consistent mapping between Gardiner, Montana and the river’s mouth.
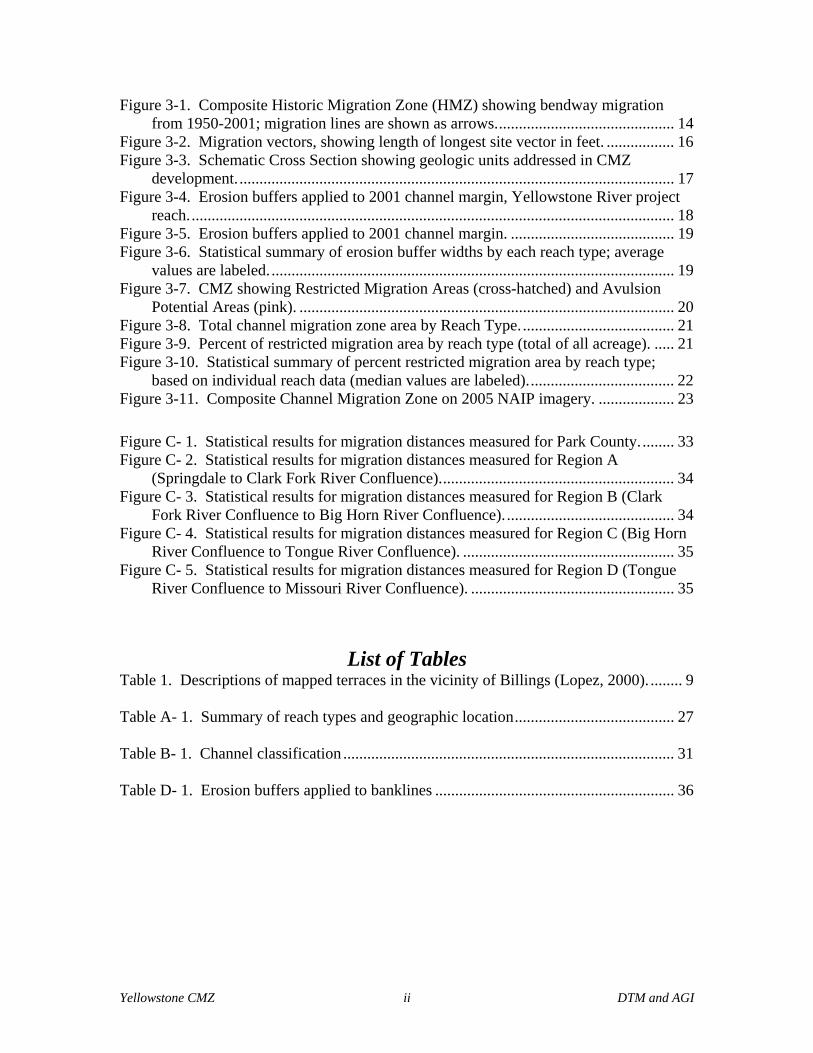
1.2 Channel Migration and Avulsion Processes Along the majority of its extent, the Yellowstone River is an alluvial river, meaning it flows through sediment that has been deposited by the river itself (versus bedrock, concrete, etc.). As a result, the river is in a constant state of sediment reworking, as it builds point bars, erodes banks, and conveys sediment downstream. Over a given timeframe, the river thereby occupies a corridor that extends beyond its current channel boundaries. The width of this corridor is reflective of the rates of lateral shift, or migration, that are characteristic of a given stream segment (Figure 1-1). Some stream segments, referred to as reaches, migrate relatively slowly due to low stream energy such as low slope, or where the channel flows through resistant boundary materials such as old
Yellowstone CMZ 2 DTM and AGI
river terraces or bedrock. Conversely, some segments migrate rapidly where the stream energy and sediment loads are relatively high and the erosion resistance of the channel perimeter is low.
Figure 1-1. Example of progressive 1950-2001 meander migration at two sites in Rosebud County.
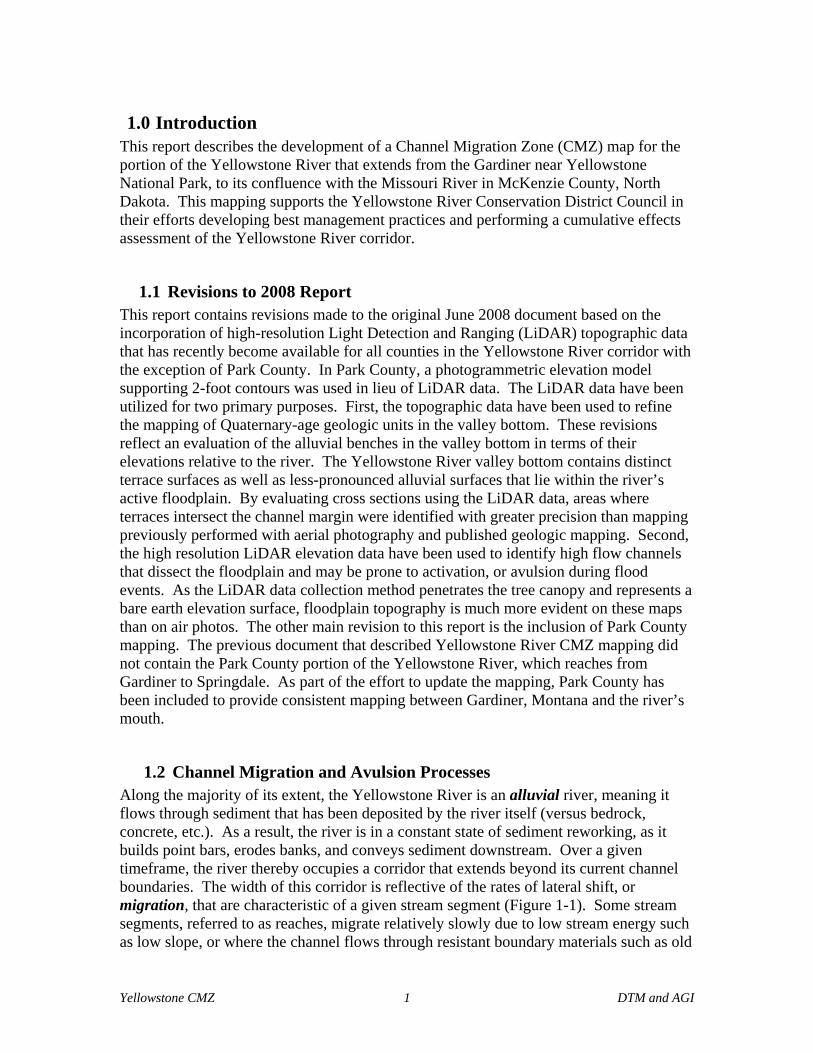
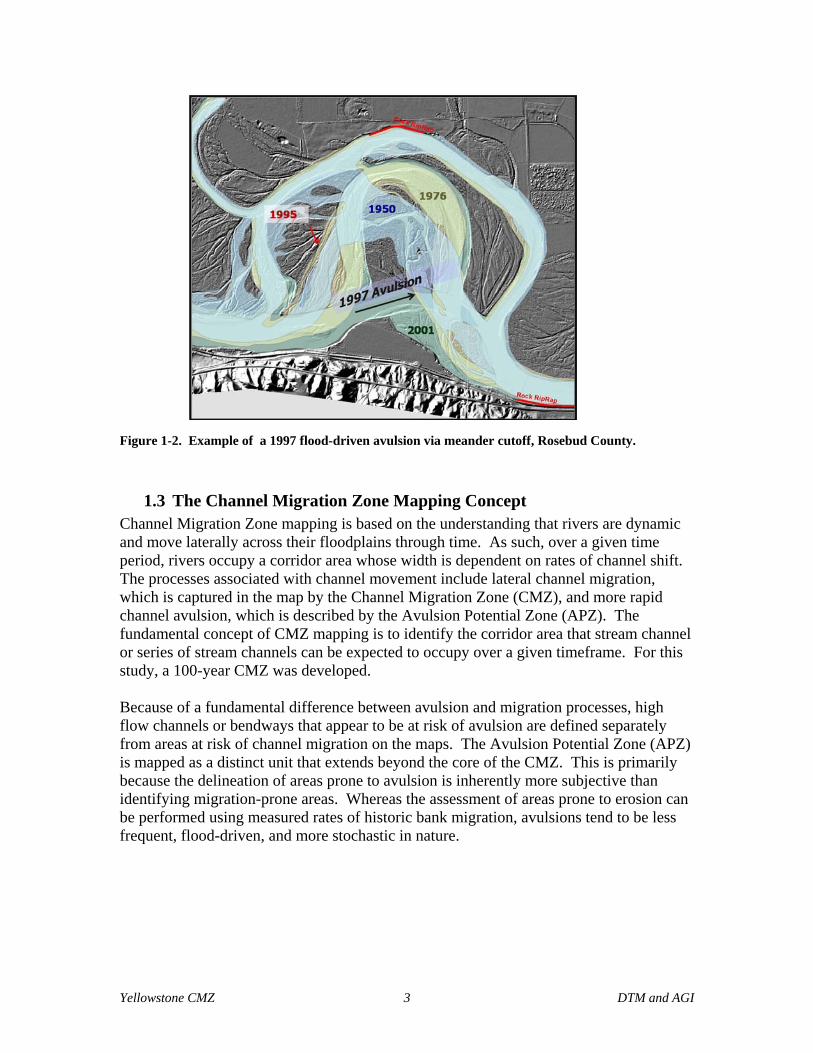
Whereas channel migration refers to the process of progressive lateral channel movement, avulsion refers to the rapid development of a main channel thread due to the “jumping” of the main channel. This process typically occurs during flood events. One primary example of avulsion on the Yellowstone is meander bend cutoff (Figure 1-2). In addition to bendway cutoffs, avulsions may occur where high flow channels enlarge and capture a main portion of the rivers flow. The process of rapid channel shift into a new primary channel, called avulsion, differs from that of lateral channel migration in terms of process and frequency, and as such poses a different challenge in river management.
Yellowstone CMZ 3 DTM and AGI
Figure 1-2. Example of a 1997 flood-driven avulsion via meander cutoff, Rosebud County.
1.3 The Channel Migration Zone Mapping Concept Channel Migration Zone mapping is based on the understanding that rivers are dynamic and move laterally across their floodplains through time. As such, over a given time period, rivers occupy a corridor area whose width is dependent on rates of channel shift. The processes associated with channel movement include lateral channel migration, which is captured in the map by the Channel Migration Zone (CMZ), and more rapid channel avulsion, which is described by the Avulsion Potential Zone (APZ). The fundamental concept of CMZ mapping is to identify the corridor area that stream channel or series of stream channels can be expected to occupy over a given timeframe. For this study, a 100-year CMZ was developed. Because of a fundamental difference between avulsion and migration processes, high flow channels or bendways that appear to be at risk of avulsion are defined separately from areas at risk of channel migration on the maps. The Avulsion Potential Zone (APZ) is mapped as a distinct unit that extends beyond the core of the CMZ. This is primarily because the delineation of areas prone to avulsion is inherently more subjective than identifying migration-prone areas. Whereas the assessment of areas prone to erosion can be performed using measured rates of historic bank migration, avulsions tend to be less frequent, flood-driven, and more stochastic in nature.
Yellowstone CMZ 4 DTM and AGI
1.4 Uncertainty The adoption of a 100-year time frame for the CMZ boundaries creates a level of uncertainty with regard to the likelihood of channel occupation of specific areas within the CMZ over the next century. FEMA (1999) noted the following:
…uncertainty is greater for long time frames. On the other hand, a very short time frame for which uncertainty is much reduced may be useless for floodplain management because of the minimal erosion expected to occur.
For this study, a 100-year time frame was selected for the life of the CMZ. This criteria for projected channel movement was adopted because of the ecological implications of a 100-year time frame, as well as the fact that a 100-year CMZ has been most commonly adopted by other mapping efforts (Section 3.2). As the oldest cottonwood trees in the riparian zone are on the order of 100 years old, this time frame is considered likely to provide conditions necessary to develop diverse riparian age classes and locally support mature riparian forest. Section 3.2 contains further discussion regarding the adoption of a 100-year time frame, as well as levels of uncertainty associated with reach-scale CMZ mapping.
1.5 Relative Levels of Risk Bankline migration and channel avulsion processes both present some level of risk to property within stream corridors. Although the quantitative probability of any floodplain area experiencing either migration or an avulsion during the next century has not been determined, their association with specific river process allows some relative comparison of the type and magnitude of associated risk. In general, the Channel Migration Zone delineates areas that have a moderate to high risk of channel occupation due to channel migration over the next 100 years. Such bank erosion can occur across a wide range of flows. As such, the risk is not solely associated with flood events, as channel migration commonly occurs as a relatively steady process. In contrast, avulsion tends to be a flood-driven process, and as such, risks identified by the Avulsion Potential Zone are typically associated with infrequent, relatively rapid shifts in channel course that are commonly very difficult to predict.
1.6 Potential Applications The CMZ maps developed for the Yellowstone River identify areas prone to lateral channel shift over the next 100 years. These results are intended to support a myriad of applications. Potential applications for the CMZ maps include the following:
• Proactively identify future problem areas through documentation of active bankline migration;
Yellowstone CMZ 5 DTM and AGI
• Identify restoration opportunities where bank armor and diking has restricted the natural Channel Migration Zone;
• Provide a background tool to assess channel dynamics within any given area;
• Assist in the development of river corridor best management practices; • Support the ongoing Cumulative Effects Study;
• Improve stakeholder understanding of the geomorphic behavior of this large river
system; • Support planning decisions at local and county levels by identifying relative
levels of erosion risk; • Facilitate productive discussion between regulatory, planning, and development
interests active within the river corridor; and,
• Help define long-term sustainable river corridor boundaries.
1.7 Disclaimer and Limitations The boundaries developed on the Channel Migration Zone maps are intended to provide a basic screening tool to help guide and support management decisions within the Yellowstone River corridor and ARE NOT intended to provide regulatory boundaries or override site-specific assessments. The criteria for developing the boundaries are based on reach scale conditions and average historic rates of change. These criteria do not reflect any intended regulatory application. The boundaries can support river management efforts, but in any application it is critical that users thoroughly understand the process of their development and associated limitations. Primary limitations of this reach-scale mapping approach include the potential for an underestimation of short-term migration rates in discrete areas that are eroding especially rapidly, as well as limitations in mapping of site-specific geotechnical attributes of banklines. As such, it is recommended that these maps be supplemented by site-specific assessment where near-term migration rates or site geology and associated bankline retreat rates create anomalies in the reach-averaging approach.
1.8 Acknowledgements This effort was performed for the Yellowstone River Conservation District Council (YRCDC) through a contract between the Custer County Conservation District and the DTM Consulting/Applied Geomorphology Project Team. Nicole McLain and Carol Watts were instrumental in providing contract management and facilitating communication between the authors and project sponsors. Feedback from the YRCDC and the YRCDC Technical Advisory Committee (TAC) was critical in developing the maps. We especially extend our thanks to YRCDC TAC members Warren Kellogg
Yellowstone CMZ 6 DTM and AGI
(NRCS) and Jim Robinson (DNRC), as well as Karl Christians of DNRC for providing insightful review and discussion of the draft submittal. The project team extends its gratitude to all involved parties that facilitated this effort.
Yellowstone CMZ 7 DTM and AGI
2.0 Physical Setting The following summary of the Yellowstone River corridor geology and geomorphology is intended to provide basic context regarding the physical conditions within the project reach. Because of the large scale of this project (approximately 564 miles of river), it is important to consider the variability in physical conditions that control river form and process. Much of this information is derived from the report entitled Geomorphic Reconnaissance and GIS Development, Yellowstone River, Montana: Springdale to the Missouri River (AGI and DTM, 2004).
2.1 Regional Geologic History From Gardiner, Montana, to Springdale, the Park County segment of the Yellowstone River flows through the Rocky Mountain physiographic province. The rocks exposed along the banks of the Yellowstone River in Park County range from Archean gneisses in Yankee Jim Canyon that are over 2.5 billion years old, to numerous recent landslides and glacial outwash terraces. The geomorphology of the Yellowstone River through Park County is strongly affected by outwash terraces that formed during a series of glacial episodes over the last 150,000 years. These terraces are largely exposed in the northern portion of the Paradise Valley, between Mill Creek and Carter’s Bridge. Within and downstream of Livingston, the river is intermittently confined by Cretaceous-age sedimentary and volcanic rocks. From Springdale, Montana, to its mouth, the Yellowstone River flows through what is known as the Northern Great Plains physiographic province, a broad surface that slopes eastward from the Rocky Mountain Front towards the Missouri River. Throughout its course, the Yellowstone River is strongly affected by the bedrock geology of the Northern Great Plains, which largely consists of sedimentary rocks that are Cretaceous and Tertiary in age (65 to 150 million years old). These rocks formed when uplift of the Rocky Mountains drove extensive erosion of the growing mountain range, and eastward transport of sediment. This material was then deposited as extensive layers of sand, silt, and organic matter on the gently sloping terrain. During Pliocene time (over 2.5 million years ago), river systems began to dissect the Northern Great Plains, exposing the accumulated layers of sandstone, shale, and coal. At this time, the ancestral Yellowstone River drained northward to Hudson Bay (Wayne and others, 1991). When continental glaciation began about 2.5 million years ago, ice repeatedly blocked the easterly flowing rivers, causing them to form lakes, spill across divides, and form new courses. At one point, a lobe of the ice sheet extended as far south as Intake, blocking the course of the Yellowstone River (Howard, 1960), and forming Lake Glendive near present-day Glendive. Lake Glendive eventually reached upstream of Miles City to near Hathaway. About 20,000 years ago, the ice sheet retreated to the north, shifting and dropping the elevation at the river’s mouth. This base level lowering caused the river to downcut into its valley fill, resulting in the formation of a series of terraces that bound the river today (Zelt and others, 1999). These terraces are important components of the Channel Migration Zone delineation, as the lowermost terraces commonly form the margin of the river, and are prone to erosion.
Yellowstone CMZ 8 DTM and AGI
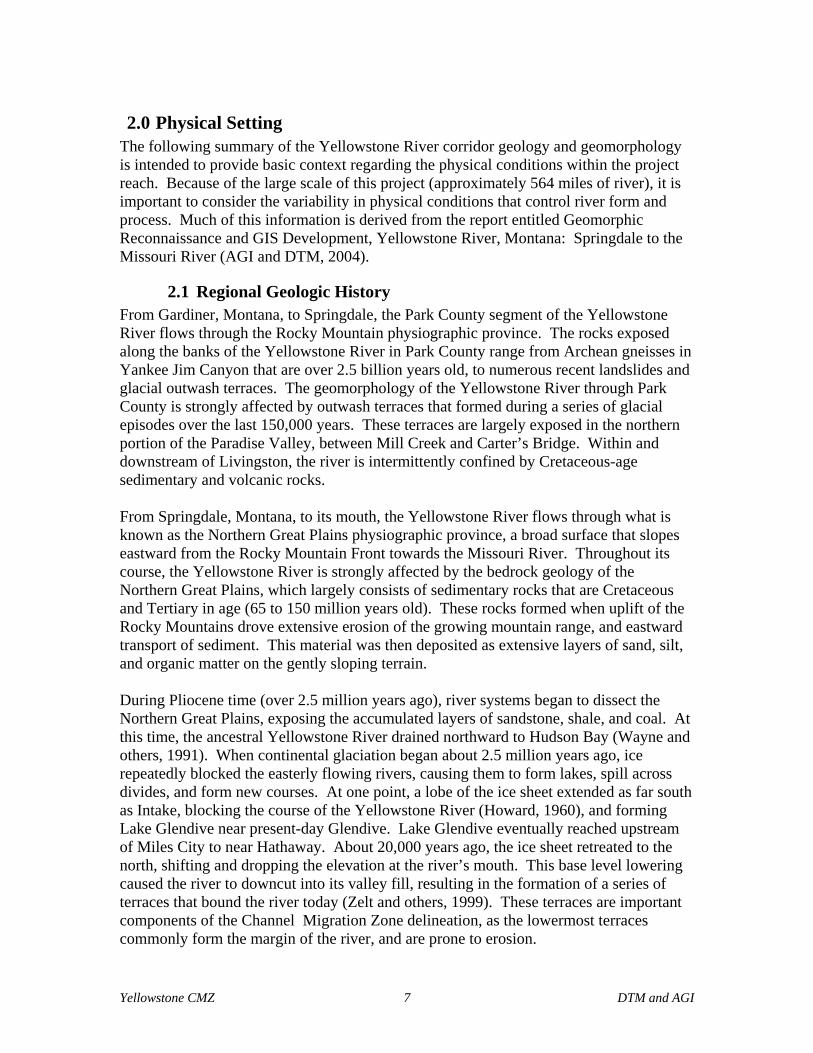
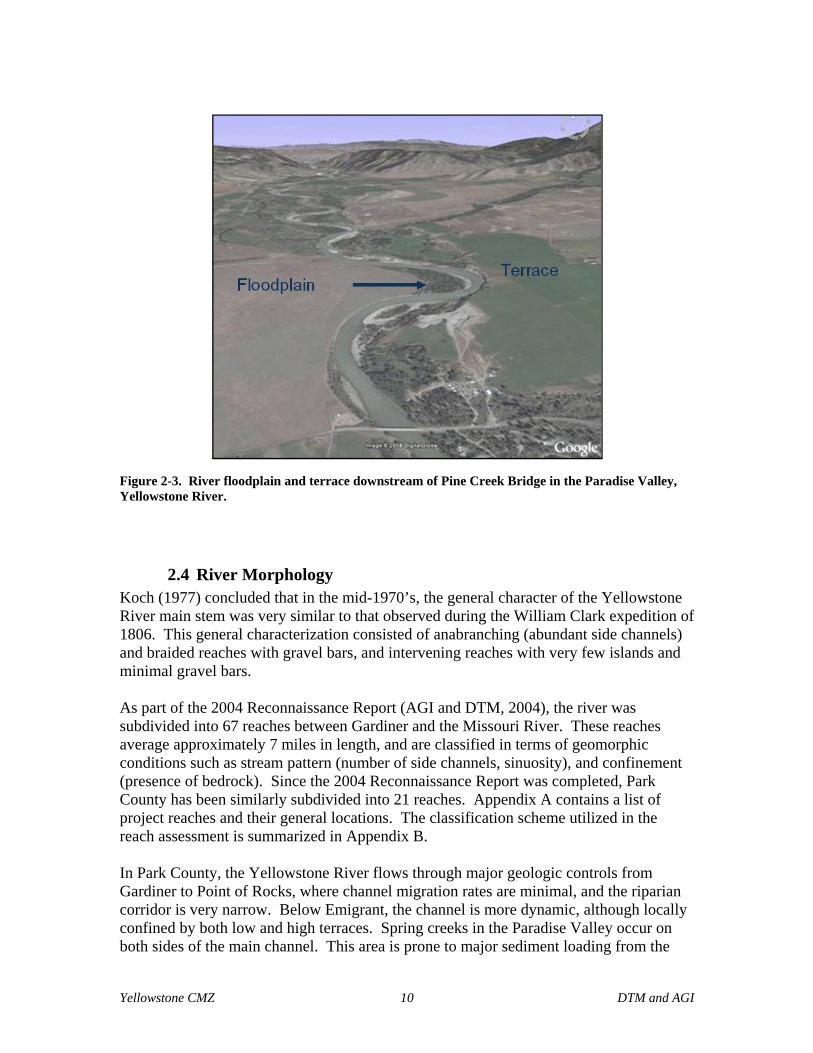
2.2 Valley Wall Geology The Yellowstone River flows through a well-defined river valley that has eroded through sandstone, shale, and coal. The variability in rock types along the river course has resulted in major variations in valley width (AGI and DTM, 2004). Where the valley wall is made of shale, the valley tends to be relatively wide. A plot showing this correlation is shown in Figure 2-1. In this figure, each bar represents a 3-mile length of valley; the Valley Mile (VM) referencing reflects the valley distance upstream from the mouth of the Yellowstone Missouri River confluence. Each 3 mile segment has been attributed by the primary geology at the margin of the river valley. The yellow bars represent a series of shale units between Billings and Park City (Valley Mile 294-327), where valley is typically over 2.5 miles wide. The Bearpaw Shale, depicted as red columns on Figure 2-1, can be correlated to valley floor widening from Huntley to Pompey’s Pillar (VM 261-288), in Mission Valley (VM 212-230), and in Hammond Valley (VM 199-206). Towards the river mouth, the Tongue River member of the Fort Union Formation is similarly associated with a relatively wide valley bottom. Whereas shales are typically associated with valley bottom widening, the narrowest valley bottom in the study reach occurs between Springdale and Park City, where the valley walls are comprised of resistant sandstone of the Hell Creek Formation.
Figure 2-1. Valley bottom width and associated valley wall geology, Springdale to mouth.
2.3 Quaternary Terraces As described in Section 2.1, the Yellowstone River has eroded the Northern Great Plains landscape over the past few million years. On most river systems, this process of vertical downcutting to form a stream valley is characterized by periods of active incision that are separated by periods of relative stability. During these periods of relative stability, the
0.0
1.0
2.0
3.0
4.0
5.0
6.0
Inun
datio
n C
orrid
or W
idth
(mi)
0306090120150180210240270300330360390
Valley Mile
Hell Cr Fm Judith R. Fm Misc ShaleBearpaw Shale Lance Fm Tullock Mbr Ft UnionLebo Shale Ludlow Mbr Tongue R. Mbr
---B
illin
gs
---M
iles
City
---G
lend
ive
---S
prin
gdal
e
Yellowstone CMZ 9 DTM and AGI
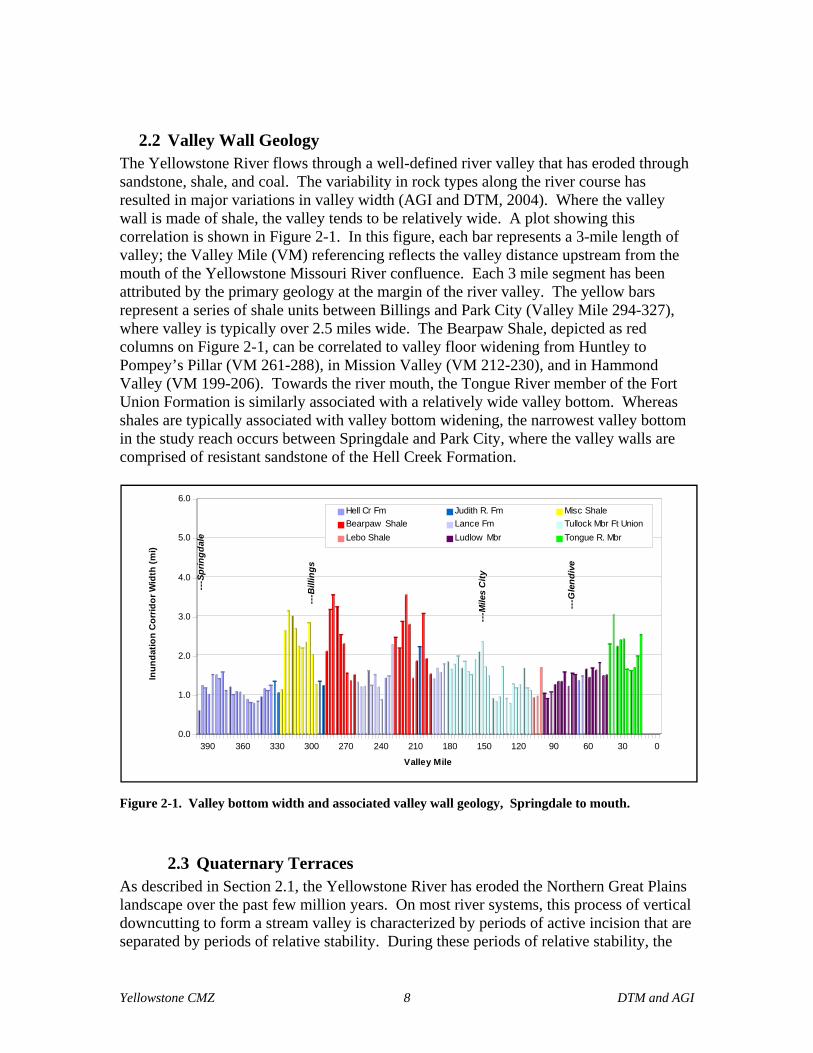
river migrates laterally, forming a floodplain. When incision resumes, downcutting of the river below its floodplain perches that surface as a terrace. Most river terraces are abandoned floodplain surfaces, which is why they tend to be flat, and draped by stream deposits (Figure 2-2).
Figure 2-2. Schematic diagram of a typical river valley floodplain and terrace configuration (unt.edu).
Quaternary-age terraces along the Yellowstone River valley extend from the lower river upstream to the Paradise Valley (Figure 2-3). The terraces are typically coarse-grained sediments that were deposited during a period of extensive alpine glaciation in the upper watershed (Zelt and others, 1999). Individual terrace surfaces tend to converge in the upstream direction, which reflects the progressive entrenchment of the lower reaches of the river. The same high terrace surface that is approximately 380 feet above the river near Glendive, is only 120 feet above the river near Billings. In the vicinity of Billings, five distinct Pleistocene-age terrace units have been mapped above the elevation of the modern river and its alluvial deposits (Lopez, 2000;Table 1).
Table 1. Descriptions of mapped terraces in the vicinity of Billings (Lopez, 2000).
Geologic Map Unit
Thickness (ft)
Estimated height above floodplain
(ft)
Reference in Channel Migration
Zone
Qat1 20-40 10-20 LT: “Low Terrace” Qat2 40-60 20-40 HT: “High Terrace” Qat3 20-30 50-90 None Qat4 20 200-300 None Qat5 20 400-500 None
The only two terraces that have been identified as directly influencing the Channel Migration Zone boundaries are the Low Terrace (LT; Qat1) and the High Terrace (HT; Qat2). None of the higher terraces were identified as forming actively eroding margins of the modern river corridor; these high terraces are typically either hundreds of feet away from the river, or characterized by a gravel veneer over bedrock, perched well above the active channel.
Terrace Floodplain
Yellowstone CMZ 10 DTM and AGI
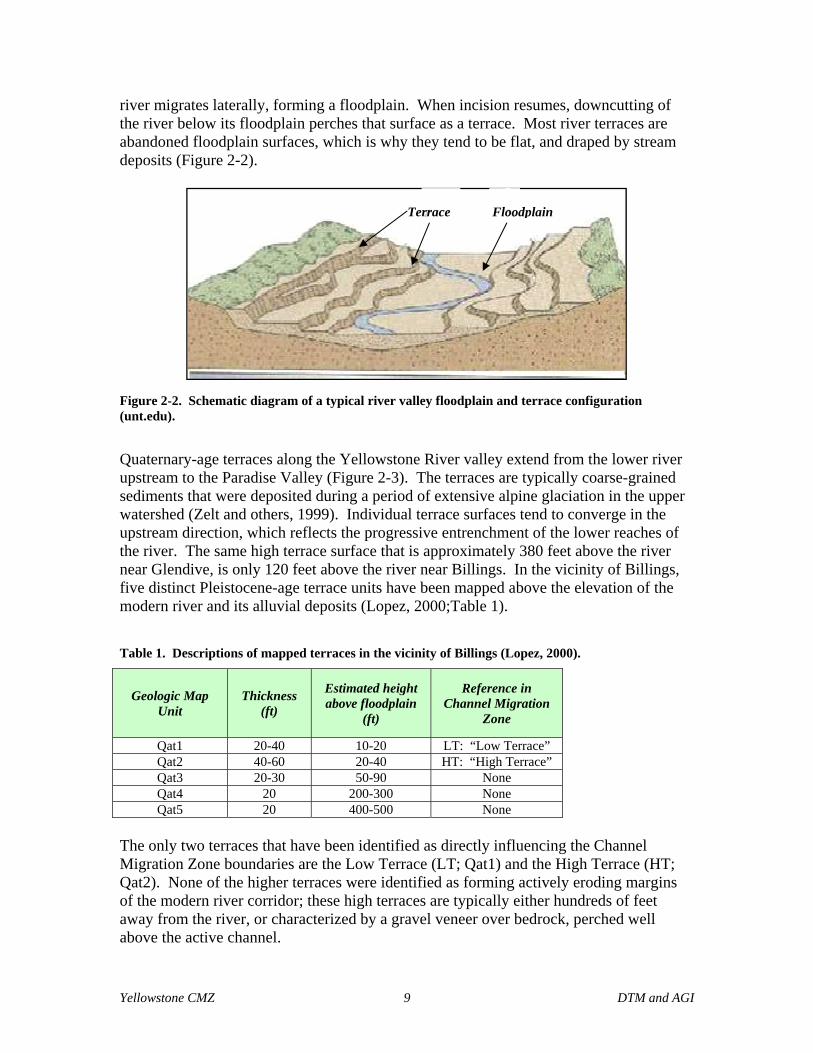
Figure 2-3. River floodplain and terrace downstream of Pine Creek Bridge in the Paradise Valley, Yellowstone River.
2.4 River Morphology Koch (1977) concluded that in the mid-1970’s, the general character of the Yellowstone River main stem was very similar to that observed during the William Clark expedition of 1806. This general characterization consisted of anabranching (abundant side channels) and braided reaches with gravel bars, and intervening reaches with very few islands and minimal gravel bars. As part of the 2004 Reconnaissance Report (AGI and DTM, 2004), the river was subdivided into 67 reaches between Gardiner and the Missouri River. These reaches average approximately 7 miles in length, and are classified in terms of geomorphic conditions such as stream pattern (number of side channels, sinuosity), and confinement (presence of bedrock). Since the 2004 Reconnaissance Report was completed, Park County has been similarly subdivided into 21 reaches. Appendix A contains a list of project reaches and their general locations. The classification scheme utilized in the reach assessment is summarized in Appendix B. In Park County, the Yellowstone River flows through major geologic controls from Gardiner to Point of Rocks, where channel migration rates are minimal, and the riparian corridor is very narrow. Below Emigrant, the channel is more dynamic, although locally confined by both low and high terraces. Spring creeks in the Paradise Valley occur on both sides of the main channel. This area is prone to major sediment loading from the
Yellowstone CMZ 11 DTM and AGI
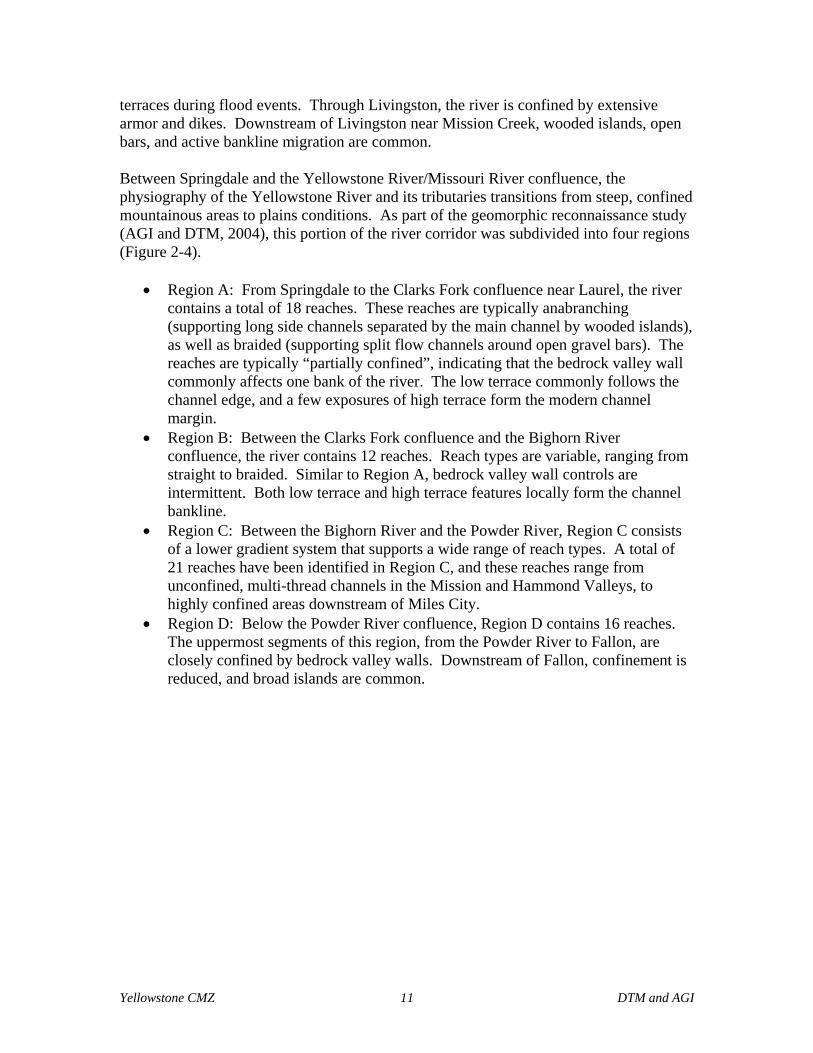
terraces during flood events. Through Livingston, the river is confined by extensive armor and dikes. Downstream of Livingston near Mission Creek, wooded islands, open bars, and active bankline migration are common. Between Springdale and the Yellowstone River/Missouri River confluence, the physiography of the Yellowstone River and its tributaries transitions from steep, confined mountainous areas to plains conditions. As part of the geomorphic reconnaissance study (AGI and DTM, 2004), this portion of the river corridor was subdivided into four regions (Figure 2-4).
• Region A: From Springdale to the Clarks Fork confluence near Laurel, the river contains a total of 18 reaches. These reaches are typically anabranching (supporting long side channels separated by the main channel by wooded islands), as well as braided (supporting split flow channels around open gravel bars). The reaches are typically “partially confined”, indicating that the bedrock valley wall commonly affects one bank of the river. The low terrace commonly follows the channel edge, and a few exposures of high terrace form the modern channel margin.
• Region B: Between the Clarks Fork confluence and the Bighorn River confluence, the river contains 12 reaches. Reach types are variable, ranging from straight to braided. Similar to Region A, bedrock valley wall controls are intermittent. Both low terrace and high terrace features locally form the channel bankline.
• Region C: Between the Bighorn River and the Powder River, Region C consists of a lower gradient system that supports a wide range of reach types. A total of 21 reaches have been identified in Region C, and these reaches range from unconfined, multi-thread channels in the Mission and Hammond Valleys, to highly confined areas downstream of Miles City.
• Region D: Below the Powder River confluence, Region D contains 16 reaches. The uppermost segments of this region, from the Powder River to Fallon, are closely confined by bedrock valley walls. Downstream of Fallon, confinement is reduced, and broad islands are common.
Yellowstone CMZ 12 DTM and AGI
Figure 2-4. Regional geomorphic zones of the Middle and Lower Yellowstone River.
Yellowstone CMZ 13 DTM and AGI
3.0 Methods and Results The methodology applied to the CMZ delineation generally follows the techniques outlined in Rapp and Abbe (2003). The channel migration zone (CMZ) developed for the Yellowstone River is defined as a composite area made up of the existing channel, the historic channel since 1950 (Historic Migration Zone, or HMZ), and an Erosion Buffer that encompasses areas prone to channel erosion over the next 100 years. Areas within this CMZ that have been isolated by constructed features such as armor or floodplain dikes are attributed as “Restricted Migration Area” (RMA). Beyond the CMZ boundaries, outlying areas that pose risks of channel avulsion are identified as “Avulsion Potential Zones”. Channel Migration Zone (CMZ) = Historic Migration Zone (HMZ) + Erosion Buffer Restricted Migration Area (RMA) = Areas of CMZ isolated from the current river channel by constructed bank and floodplain protection features The following sections describe the methodologies for developing the individual components of the CMZ maps. These methodologies are adapted from those presented in Rapp and Abbe (2003) to accommodate the scale of the project area, available data sources, and the anticipated level of effort required.
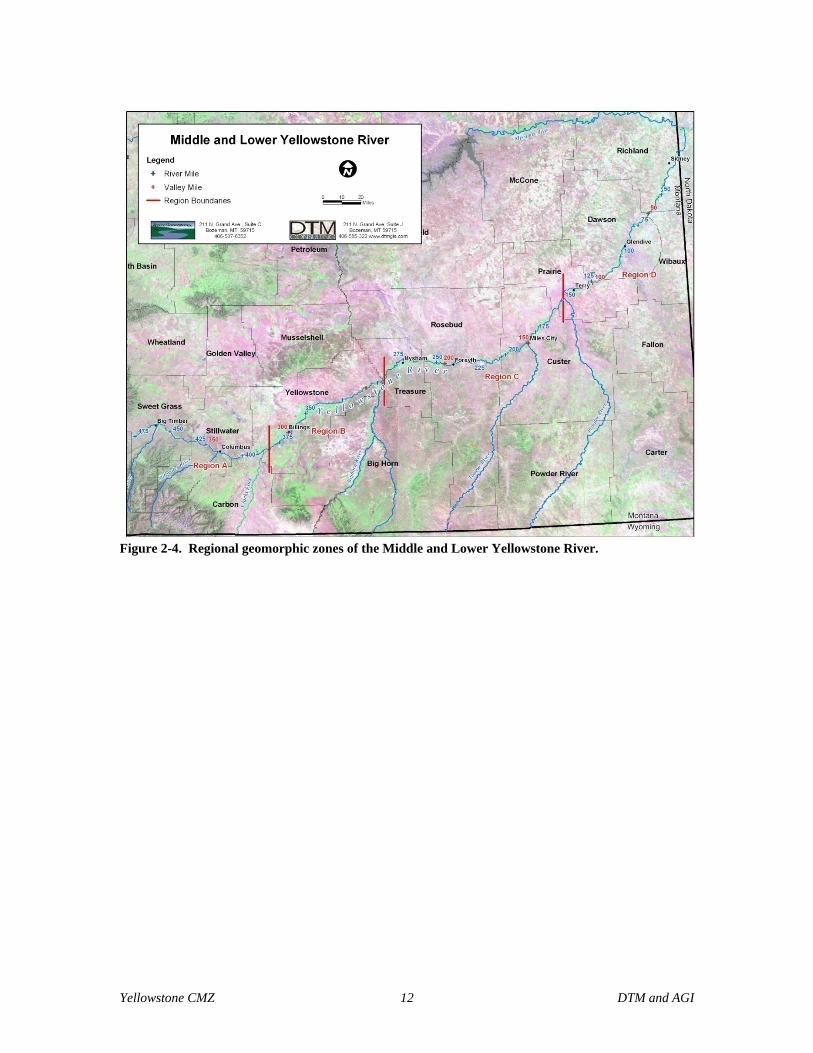
3.1 The Historic Migration Zone (HMZ) The Historic Migration Zone is based on a composite area defined by the channel locations in 1949-1951, 1976, 1995, and 2001 (Figure 3-1). The resulting area reflects the zone of channel occupation over a 50-year timeframe. The method for delineating the HMZ is to overlay the digitized polygons for the bankfull channel for each time series, and merge those polygons into a single HMZ polygon. The bankfull channel reflects the active channel area that is comprised of unvegetated substrate, and its boundaries are delineated as the boundary between open channel and woody vegetation stands, terrace margins, or bedrock valley wall. The HMZ contains all unvegetated channel threads that are interpreted to convey water under bankfull conditions (typical spring runoff), and as such, the zone has split flow segments and islands. All islands within the HMZ are included with the merged HMZ polygon.
Yellowstone CMZ 14 DTM and AGI
Figure 3-1. Composite Historic Migration Zone (HMZ) showing bendway migration from 1950-2001; migration lines are shown as arrows.
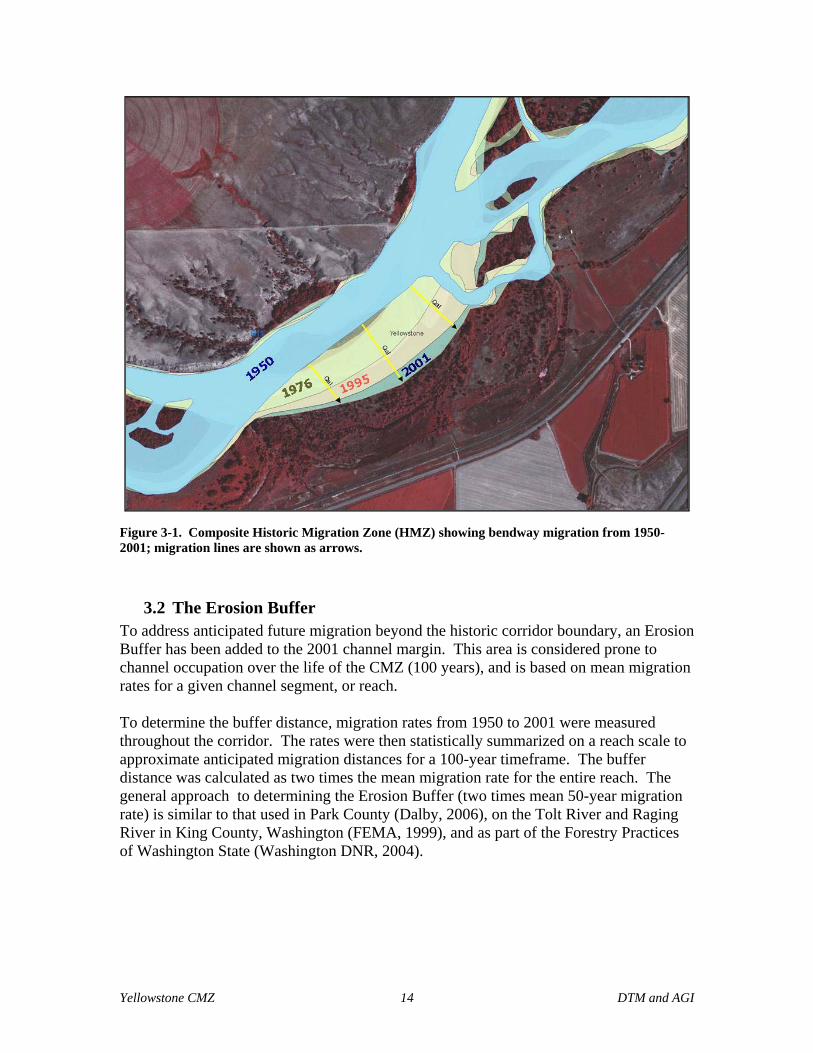
3.2 The Erosion Buffer To address anticipated future migration beyond the historic corridor boundary, an Erosion Buffer has been added to the 2001 channel margin. This area is considered prone to channel occupation over the life of the CMZ (100 years), and is based on mean migration rates for a given channel segment, or reach. To determine the buffer distance, migration rates from 1950 to 2001 were measured throughout the corridor. The rates were then statistically summarized on a reach scale to approximate anticipated migration distances for a 100-year timeframe. The buffer distance was calculated as two times the mean migration rate for the entire reach. The general approach to determining the Erosion Buffer (two times mean 50-year migration rate) is similar to that used in Park County (Dalby, 2006), on the Tolt River and Raging River in King County, Washington (FEMA, 1999), and as part of the Forestry Practices of Washington State (Washington DNR, 2004).
Yellowstone CMZ 15 DTM and AGI
FEMA (1999), concluded the following, which also supports the average migration rate approach:
Because of limitations in data availability and model capabilities, it is extremely difficult to reproduce detailed time variation of stream movement; however, it is entirely feasible to analyze channel history and infer trends in the stream alignment and average migration rates.
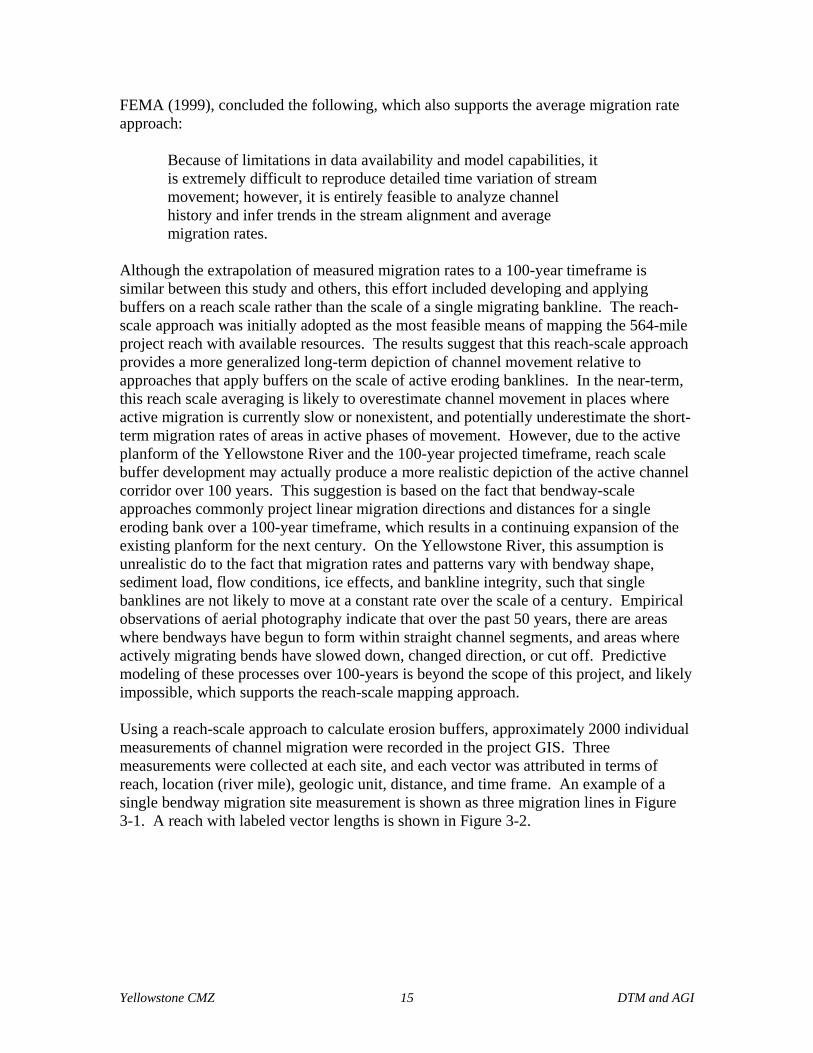
Although the extrapolation of measured migration rates to a 100-year timeframe is similar between this study and others, this effort included developing and applying buffers on a reach scale rather than the scale of a single migrating bankline. The reach-scale approach was initially adopted as the most feasible means of mapping the 564-mile project reach with available resources. The results suggest that this reach-scale approach provides a more generalized long-term depiction of channel movement relative to approaches that apply buffers on the scale of active eroding banklines. In the near-term, this reach scale averaging is likely to overestimate channel movement in places where active migration is currently slow or nonexistent, and potentially underestimate the short-term migration rates of areas in active phases of movement. However, due to the active planform of the Yellowstone River and the 100-year projected timeframe, reach scale buffer development may actually produce a more realistic depiction of the active channel corridor over 100 years. This suggestion is based on the fact that bendway-scale approaches commonly project linear migration directions and distances for a single eroding bank over a 100-year timeframe, which results in a continuing expansion of the existing planform for the next century. On the Yellowstone River, this assumption is unrealistic do to the fact that migration rates and patterns vary with bendway shape, sediment load, flow conditions, ice effects, and bankline integrity, such that single banklines are not likely to move at a constant rate over the scale of a century. Empirical observations of aerial photography indicate that over the past 50 years, there are areas where bendways have begun to form within straight channel segments, and areas where actively migrating bends have slowed down, changed direction, or cut off. Predictive modeling of these processes over 100-years is beyond the scope of this project, and likely impossible, which supports the reach-scale mapping approach. Using a reach-scale approach to calculate erosion buffers, approximately 2000 individual measurements of channel migration were recorded in the project GIS. Three measurements were collected at each site, and each vector was attributed in terms of reach, location (river mile), geologic unit, distance, and time frame. An example of a single bendway migration site measurement is shown as three migration lines in Figure 3-1. A reach with labeled vector lengths is shown in Figure 3-2.
Yellowstone CMZ 16 DTM and AGI
Figure 3-2. Migration vectors, showing length of longest site vector in feet.
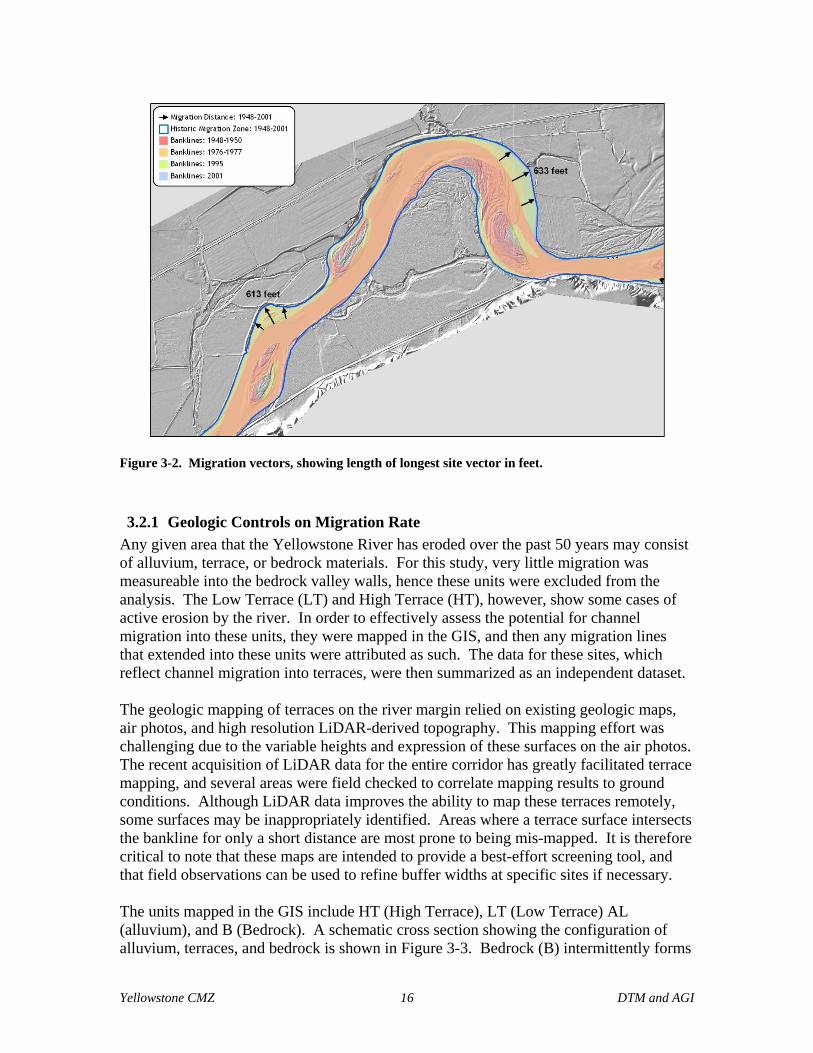
3.2.1 Geologic Controls on Migration Rate Any given area that the Yellowstone River has eroded over the past 50 years may consist of alluvium, terrace, or bedrock materials. For this study, very little migration was measureable into the bedrock valley walls, hence these units were excluded from the analysis. The Low Terrace (LT) and High Terrace (HT), however, show some cases of active erosion by the river. In order to effectively assess the potential for channel migration into these units, they were mapped in the GIS, and then any migration lines that extended into these units were attributed as such. The data for these sites, which reflect channel migration into terraces, were then summarized as an independent dataset. The geologic mapping of terraces on the river margin relied on existing geologic maps, air photos, and high resolution LiDAR-derived topography. This mapping effort was challenging due to the variable heights and expression of these surfaces on the air photos. The recent acquisition of LiDAR data for the entire corridor has greatly facilitated terrace mapping, and several areas were field checked to correlate mapping results to ground conditions. Although LiDAR data improves the ability to map these terraces remotely, some surfaces may be inappropriately identified. Areas where a terrace surface intersects the bankline for only a short distance are most prone to being mis-mapped. It is therefore critical to note that these maps are intended to provide a best-effort screening tool, and that field observations can be used to refine buffer widths at specific sites if necessary. The units mapped in the GIS include HT (High Terrace), LT (Low Terrace) AL (alluvium), and B (Bedrock). A schematic cross section showing the configuration of alluvium, terraces, and bedrock is shown in Figure 3-3. Bedrock (B) intermittently forms
Yellowstone CMZ 17 DTM and AGI
bluffs along the river’s edge, and these bluffs are typically taller than the high terrace (HT). The most common material bounding the river channel is alluvium (AL), which is that material deposited and frequently reworked by the river. This alluvium, or floodplain area, includes both the active riparian corridor and slightly higher alluvial bottomlands. Where the river migrates beyond the edge of the alluvium, it commonly encounters the low terrace (LT), which is 10-20 feet above the alluvial bottom. This surface supports extensive agriculture in the corridor, and the railroad commonly follows its edge where it is in contact with the lower elevation floodplain. Locally, the river has eroded laterally to the edge of the high terrace (HT), which is at least 20 feet higher than the alluvial river bottom.
Figure 3-3. Schematic Cross Section showing geologic units addressed in CMZ development.
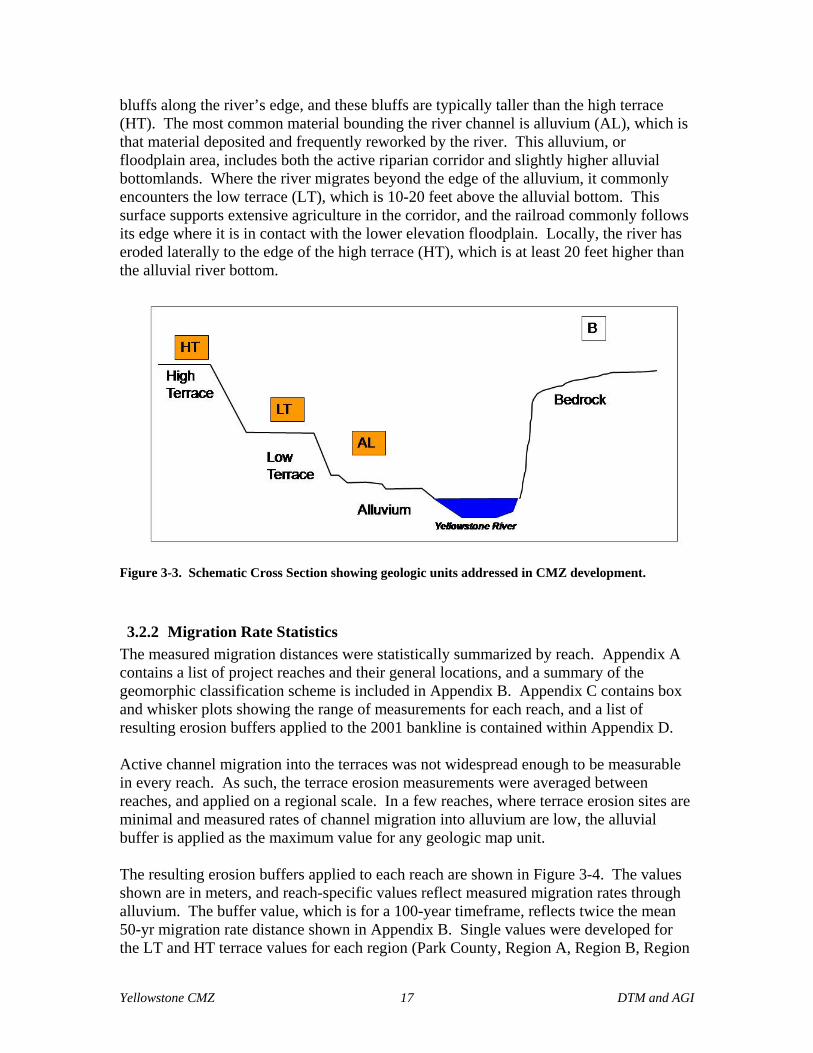
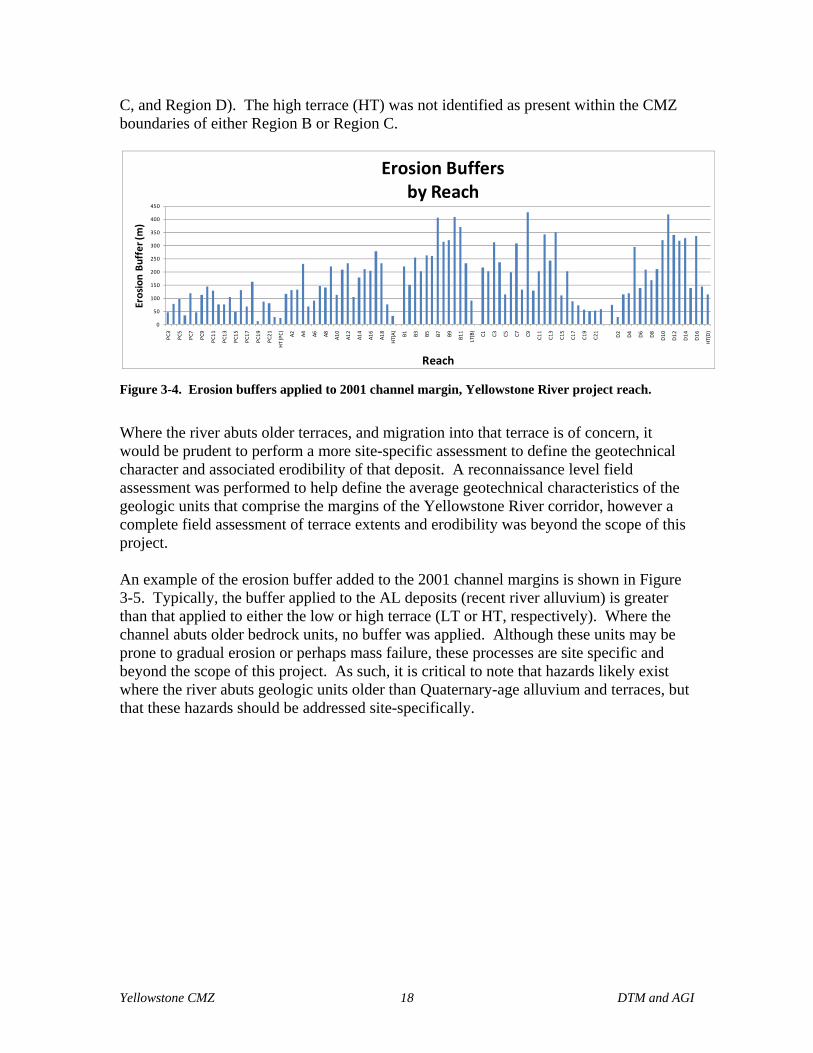
3.2.2 Migration Rate Statistics The measured migration distances were statistically summarized by reach. Appendix A contains a list of project reaches and their general locations, and a summary of the geomorphic classification scheme is included in Appendix B. Appendix C contains box and whisker plots showing the range of measurements for each reach, and a list of resulting erosion buffers applied to the 2001 bankline is contained within Appendix D. Active channel migration into the terraces was not widespread enough to be measurable in every reach. As such, the terrace erosion measurements were averaged between reaches, and applied on a regional scale. In a few reaches, where terrace erosion sites are minimal and measured rates of channel migration into alluvium are low, the alluvial buffer is applied as the maximum value for any geologic map unit. The resulting erosion buffers applied to each reach are shown in Figure 3-4. The values shown are in meters, and reach-specific values reflect measured migration rates through alluvium. The buffer value, which is for a 100-year timeframe, reflects twice the mean 50-yr migration rate distance shown in Appendix B. Single values were developed for the LT and HT terrace values for each region (Park County, Region A, Region B, Region
Yellowstone CMZ 18 DTM and AGI
C, and Region D). The high terrace (HT) was not identified as present within the CMZ boundaries of either Region B or Region C.
Figure 3-4. Erosion buffers applied to 2001 channel margin, Yellowstone River project reach.
Where the river abuts older terraces, and migration into that terrace is of concern, it would be prudent to perform a more site-specific assessment to define the geotechnical character and associated erodibility of that deposit. A reconnaissance level field assessment was performed to help define the average geotechnical characteristics of the geologic units that comprise the margins of the Yellowstone River corridor, however a complete field assessment of terrace extents and erodibility was beyond the scope of this project. An example of the erosion buffer added to the 2001 channel margins is shown in Figure 3-5. Typically, the buffer applied to the AL deposits (recent river alluvium) is greater than that applied to either the low or high terrace (LT or HT, respectively). Where the channel abuts older bedrock units, no buffer was applied. Although these units may be prone to gradual erosion or perhaps mass failure, these processes are site specific and beyond the scope of this project. As such, it is critical to note that hazards likely exist where the river abuts geologic units older than Quaternary-age alluvium and terraces, but that these hazards should be addressed site-specifically.
0
50
100
150
200
250
300
350
400
450
PC3
PC5
PC7
PC9
PC11
PC13
PC15
PC17
PC19
PC21
HT (PC) A2 A4 A6 A8 A10
A12
A14
A16
A18
HT(A) B1 B3 B5 B7 B9 B11
LT(B)
C1 C3 C5 C7 C9 C11
C13
C15
C17
C19
C21
D2
D4
D6
D8
D10
D12
D14
D16
HT(D)
Erosion Bu
ffer (m
)
Reach
Erosion Buffersby Reach
Yellowstone CMZ 19 DTM and AGI
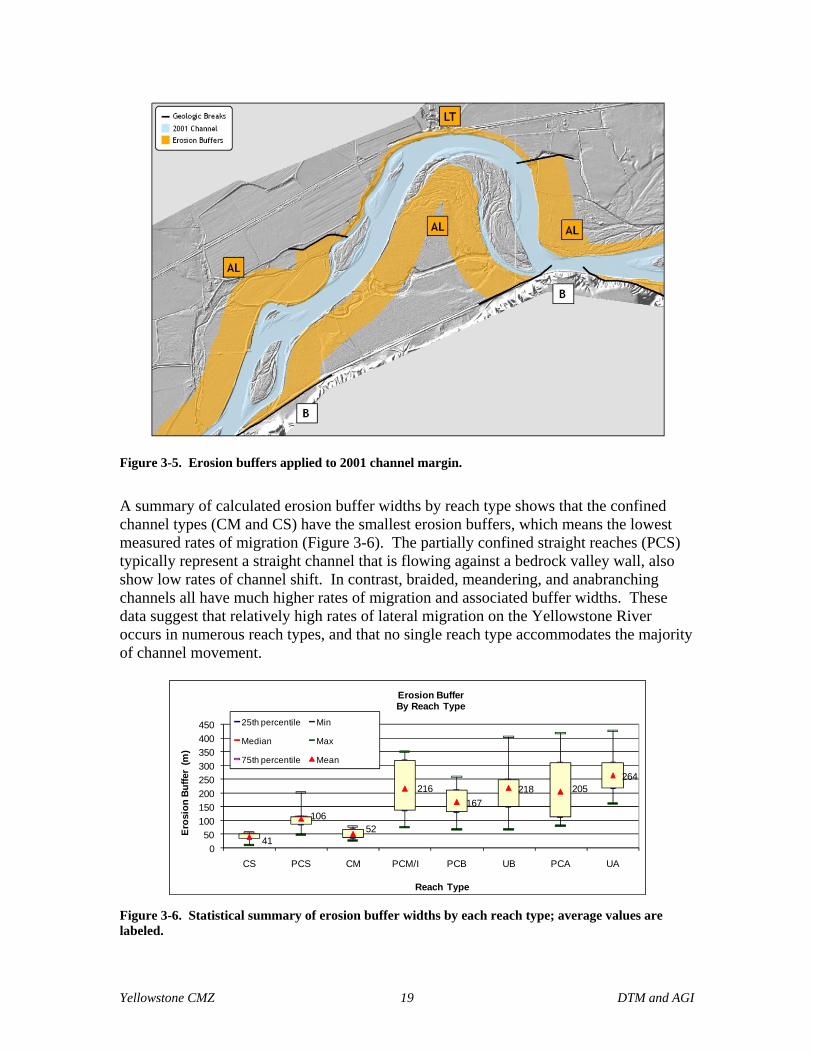
Figure 3-5. Erosion buffers applied to 2001 channel margin.
A summary of calculated erosion buffer widths by reach type shows that the confined channel types (CM and CS) have the smallest erosion buffers, which means the lowest measured rates of migration (Figure 3-6). The partially confined straight reaches (PCS) typically represent a straight channel that is flowing against a bedrock valley wall, also show low rates of channel shift. In contrast, braided, meandering, and anabranching channels all have much higher rates of migration and associated buffer widths. These data suggest that relatively high rates of lateral migration on the Yellowstone River occurs in numerous reach types, and that no single reach type accommodates the majority of channel movement.
Figure 3-6. Statistical summary of erosion buffer widths by each reach type; average values are labeled.
41
10652
216167
218 205264
050
100150200250300350400450
CS PCS CM PCM/I PCB UB PCA UA
Eros
ion
Buf
fer
(m)
Reach Type
Erosion BufferBy Reach Type
25th percentile Min
Median Max
75th percentile Mean
Yellowstone CMZ 20 DTM and AGI
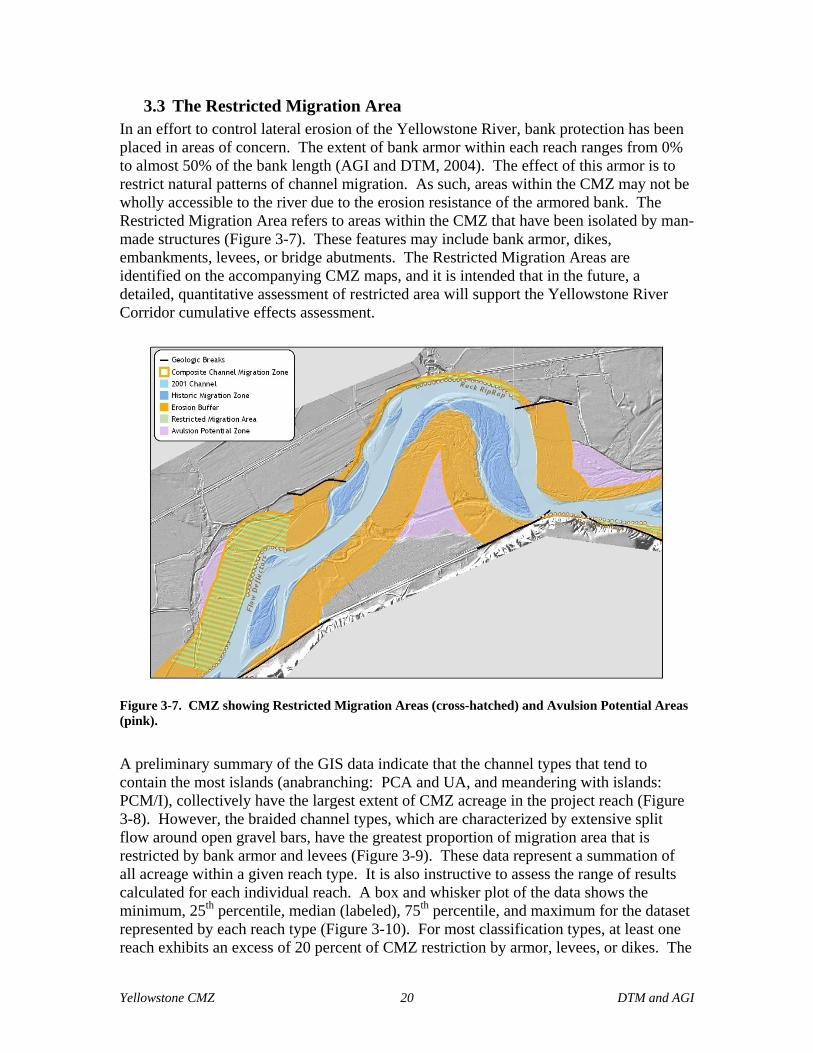
3.3 The Restricted Migration Area In an effort to control lateral erosion of the Yellowstone River, bank protection has been placed in areas of concern. The extent of bank armor within each reach ranges from 0% to almost 50% of the bank length (AGI and DTM, 2004). The effect of this armor is to restrict natural patterns of channel migration. As such, areas within the CMZ may not be wholly accessible to the river due to the erosion resistance of the armored bank. The Restricted Migration Area refers to areas within the CMZ that have been isolated by man-made structures (Figure 3-7). These features may include bank armor, dikes, embankments, levees, or bridge abutments. The Restricted Migration Areas are identified on the accompanying CMZ maps, and it is intended that in the future, a detailed, quantitative assessment of restricted area will support the Yellowstone River Corridor cumulative effects assessment.
Figure 3-7. CMZ showing Restricted Migration Areas (cross-hatched) and Avulsion Potential Areas (pink).
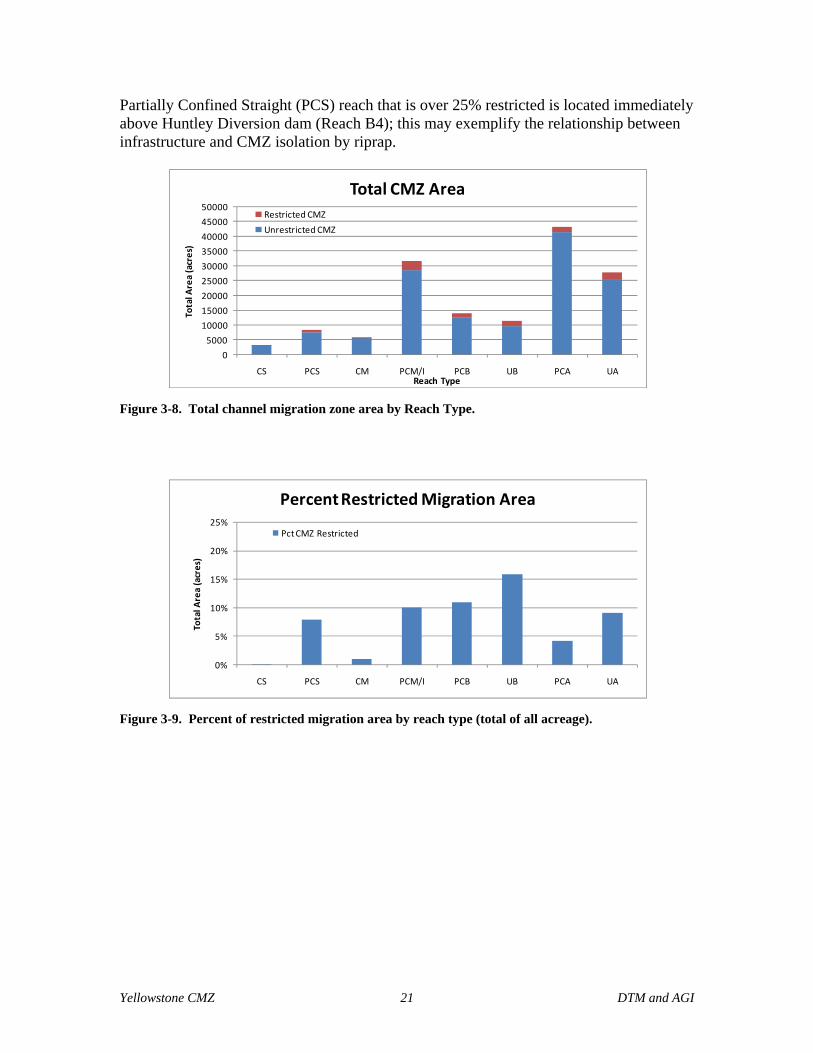
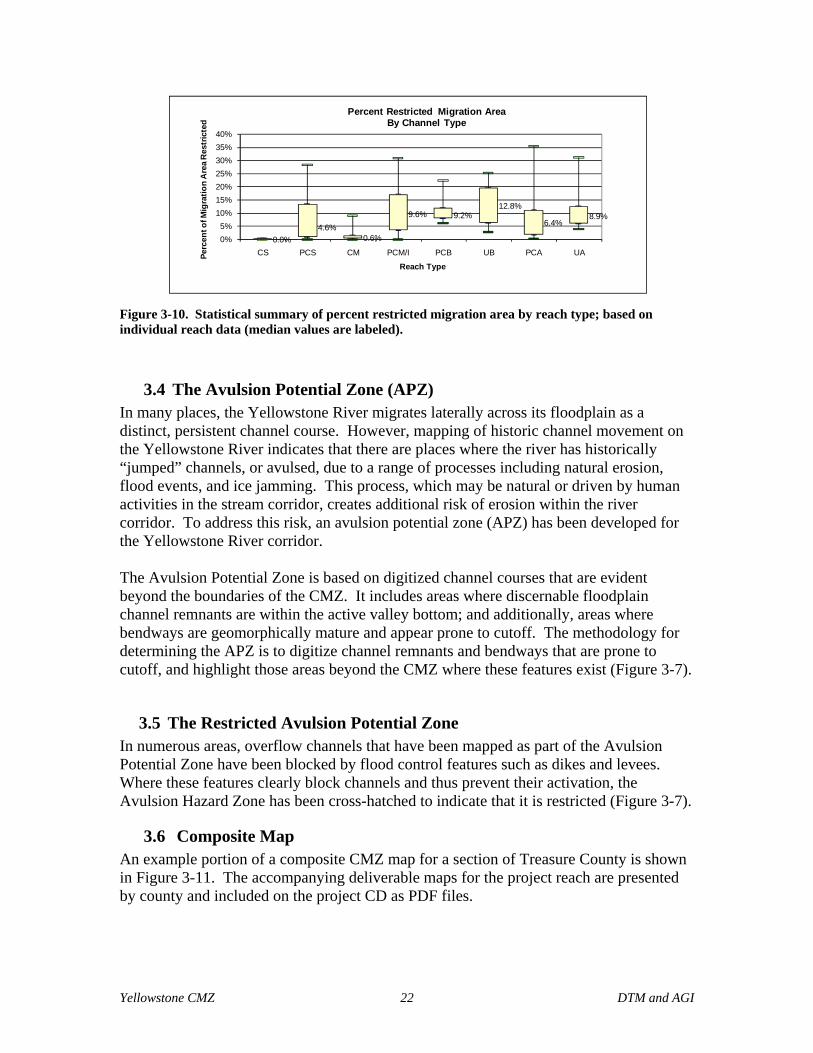
A preliminary summary of the GIS data indicate that the channel types that tend to contain the most islands (anabranching: PCA and UA, and meandering with islands: PCM/I), collectively have the largest extent of CMZ acreage in the project reach (Figure 3-8). However, the braided channel types, which are characterized by extensive split flow around open gravel bars, have the greatest proportion of migration area that is restricted by bank armor and levees (Figure 3-9). These data represent a summation of all acreage within a given reach type. It is also instructive to assess the range of results calculated for each individual reach. A box and whisker plot of the data shows the minimum, 25th percentile, median (labeled), 75th percentile, and maximum for the dataset represented by each reach type (Figure 3-10). For most classification types, at least one reach exhibits an excess of 20 percent of CMZ restriction by armor, levees, or dikes. The
Yellowstone CMZ 21 DTM and AGI
Partially Confined Straight (PCS) reach that is over 25% restricted is located immediately above Huntley Diversion dam (Reach B4); this may exemplify the relationship between infrastructure and CMZ isolation by riprap.
Figure 3-8. Total channel migration zone area by Reach Type.
Figure 3-9. Percent of restricted migration area by reach type (total of all acreage).
0
5000
10000
15000
20000
25000
30000
35000
40000
45000
50000
CS PCS CM PCM/I PCB UB PCA UA
Total A
rea (acres)
Reach Type
Total CMZ AreaRestricted CMZ
Unrestricted CMZ
0%
5%
10%
15%
20%
25%
CS PCS CM PCM/I PCB UB PCA UA
Total A
rea (acres)
Percent Restricted Migration Area
Pct CMZ Restricted
Yellowstone CMZ 22 DTM and AGI
Figure 3-10. Statistical summary of percent restricted migration area by reach type; based on individual reach data (median values are labeled).
3.4 The Avulsion Potential Zone (APZ) In many places, the Yellowstone River migrates laterally across its floodplain as a distinct, persistent channel course. However, mapping of historic channel movement on the Yellowstone River indicates that there are places where the river has historically “jumped” channels, or avulsed, due to a range of processes including natural erosion, flood events, and ice jamming. This process, which may be natural or driven by human activities in the stream corridor, creates additional risk of erosion within the river corridor. To address this risk, an avulsion potential zone (APZ) has been developed for the Yellowstone River corridor. The Avulsion Potential Zone is based on digitized channel courses that are evident beyond the boundaries of the CMZ. It includes areas where discernable floodplain channel remnants are within the active valley bottom; and additionally, areas where bendways are geomorphically mature and appear prone to cutoff. The methodology for determining the APZ is to digitize channel remnants and bendways that are prone to cutoff, and highlight those areas beyond the CMZ where these features exist (Figure 3-7).
3.5 The Restricted Avulsion Potential Zone In numerous areas, overflow channels that have been mapped as part of the Avulsion Potential Zone have been blocked by flood control features such as dikes and levees. Where these features clearly block channels and thus prevent their activation, the Avulsion Hazard Zone has been cross-hatched to indicate that it is restricted (Figure 3-7).
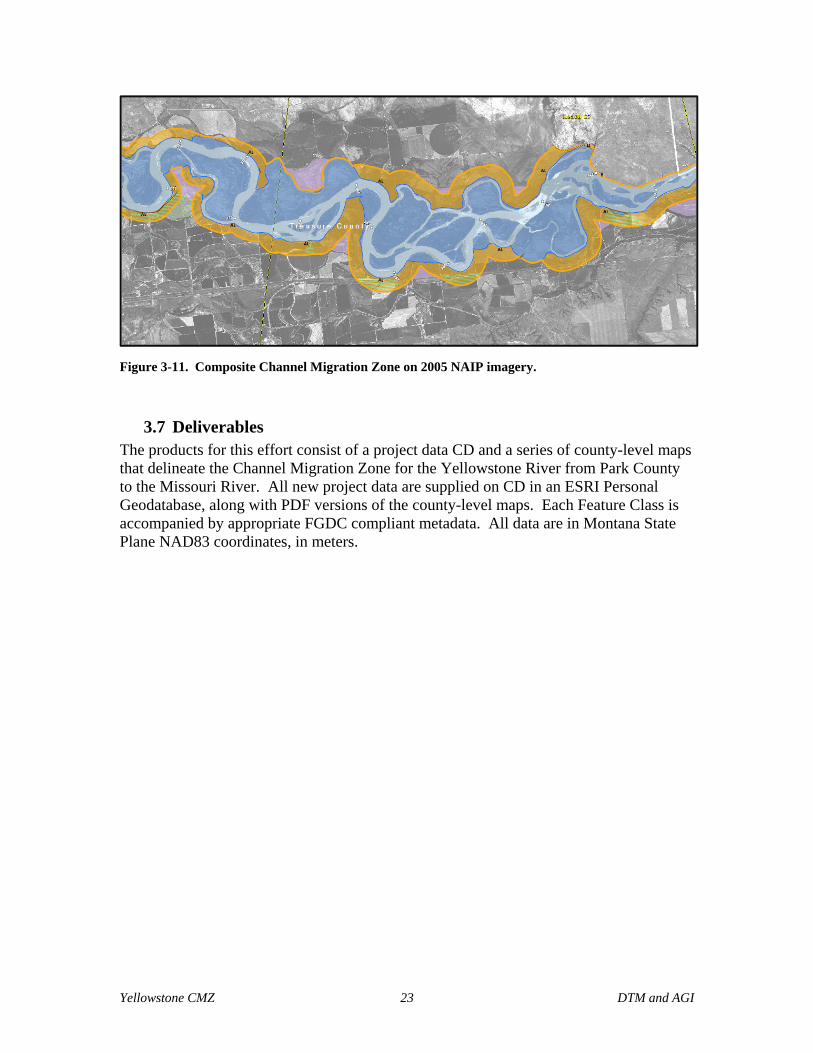
3.6 Composite Map An example portion of a composite CMZ map for a section of Treasure County is shown in Figure 3-11. The accompanying deliverable maps for the project reach are presented by county and included on the project CD as PDF files.
0.0%4.6%
0.6%
9.6% 9.2%12.8%
6.4%8.9%
0%5%
10%15%20%25%30%35%40%
CS PCS CM PCM/I PCB UB PCA UAPerc
ent o
f Mig
ratio
n A
rea
Res
tric
ted
Reach Type
Percent Restricted Migration AreaBy Channel Type
Yellowstone CMZ 23 DTM and AGI
Figure 3-11. Composite Channel Migration Zone on 2005 NAIP imagery.
3.7 Deliverables The products for this effort consist of a project data CD and a series of county-level maps that delineate the Channel Migration Zone for the Yellowstone River from Park County to the Missouri River. All new project data are supplied on CD in an ESRI Personal Geodatabase, along with PDF versions of the county-level maps. Each Feature Class is accompanied by appropriate FGDC compliant metadata. All data are in Montana State Plane NAD83 coordinates, in meters.

Yellowstone CMZ 24 DTM and AGI
Yellowstone CMZ 25 DTM and AGI
4.0 References Applied Geomorphology (AGI), and DTM Consulting (DTM), 2004. Geomorphic Reconnaissance and GIS Development, Yellowstone River, Montana—Springdale to the Missouri River Confluence: Final Report prepared for Custer County Conservation District, Miles City, MT, 108p. Dalby, C, 2006. Comparison of channel migration zones in plane-bed, pool-riffle and anabranching channels of the upper Yellowstone River: Poster Session delivered at the Montana Section AWRA annual meeting, October 12-13, 2006. FEMA, 1999, River Erosion Hazard Areas—Mapping Feasibility Study: Federal Emergency Management Agency, Technical Services Division, Hazards Study Branch, 154p. Howard, A.D., 1960. Cenozoic history of northeastern Montana and northwestern North Dakota with emphasis on the Pleistocene: USGS Professional Paper 326. Koch, R., 1977. The effect of altered streamflow on the hydrology and geomorphology of the Yellowstone River Basin, Montana: Yellowstone Impact Study, Technical Report No. 2, Water Resources Division, Montana Department of Natural Resources and Conservation, 163p. Lopez, D., 2000. Geologic Map of the Billings 30’ X 60’ Quadrangle, Montana: Montana Bureau of Mines and Geology Geologic Map Series No. 59. Rapp, C., and T. Abbe, 2003. A Framework for Delineating Channel Migration Zones: Washington State Department of Ecology and Washington State Department of Transportation. Ecology Final Draft Publication #03-06-027. Washington Department of Natural Resources Forest Board Manual, 2004, Section 2: Standard Methods for Identifying Bankfull Channel Features and Channel Migration Zones, 69p. Zelt, R.B., BOughton, G.K., Miller, K.A., Mason, J.P., and L.M. Gianakos, 1999. Environmental Setting of the Yellowstone River Basin, Montana, North Dakota, and Wyoming: USGS Water Resources Investigations Report 98-4269, 92p.

Yellowstone CMZ 26 DTM and AGI
Yellowstone CMZ 27 DTM and AGI
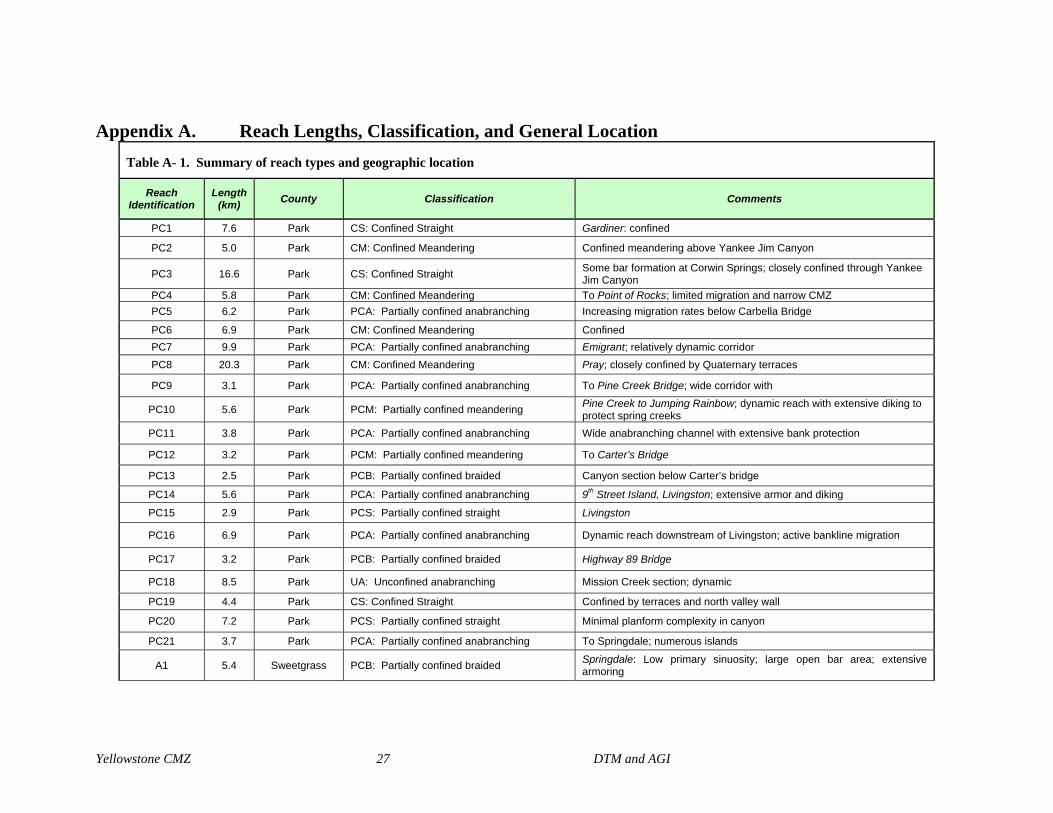
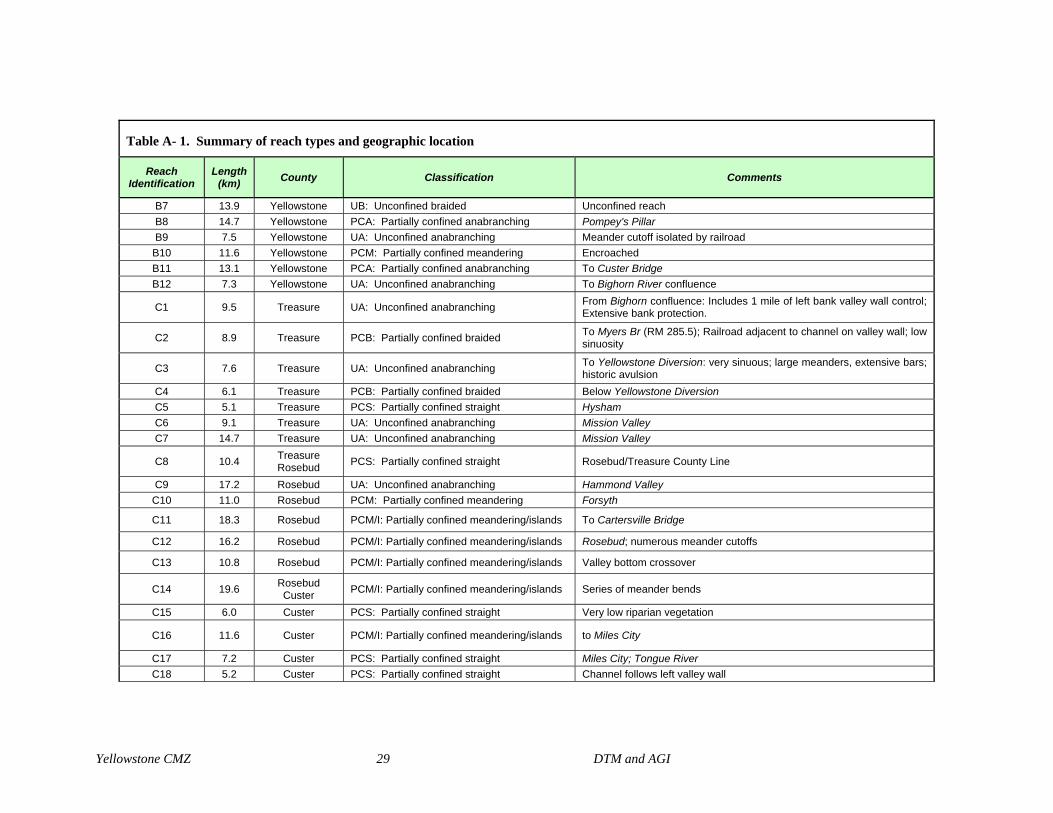
Appendix A. Reach Lengths, Classification, and General Location Table A- 1. Summary of reach types and geographic location
Reach Identification
Length (km) County Classification Comments
PC1 7.6 Park CS: Confined Straight Gardiner: confined
PC2 5.0 Park CM: Confined Meandering Confined meandering above Yankee Jim Canyon
PC3 16.6 Park CS: Confined Straight Some bar formation at Corwin Springs; closely confined through Yankee Jim Canyon
PC4 5.8 Park CM: Confined Meandering To Point of Rocks; limited migration and narrow CMZ PC5 6.2 Park PCA: Partially confined anabranching Increasing migration rates below Carbella Bridge
PC6 6.9 Park CM: Confined Meandering Confined PC7 9.9 Park PCA: Partially confined anabranching Emigrant; relatively dynamic corridor PC8 20.3 Park CM: Confined Meandering Pray; closely confined by Quaternary terraces
PC9 3.1 Park PCA: Partially confined anabranching To Pine Creek Bridge; wide corridor with
PC10 5.6 Park PCM: Partially confined meandering Pine Creek to Jumping Rainbow; dynamic reach with extensive diking to protect spring creeks
PC11 3.8 Park PCA: Partially confined anabranching Wide anabranching channel with extensive bank protection
PC12 3.2 Park PCM: Partially confined meandering To Carter’s Bridge
PC13 2.5 Park PCB: Partially confined braided Canyon section below Carter’s bridge
PC14 5.6 Park PCA: Partially confined anabranching 9th Street Island, Livingston; extensive armor and diking
PC15 2.9 Park PCS: Partially confined straight Livingston
PC16 6.9 Park PCA: Partially confined anabranching Dynamic reach downstream of Livingston; active bankline migration
PC17 3.2 Park PCB: Partially confined braided Highway 89 Bridge
PC18 8.5 Park UA: Unconfined anabranching Mission Creek section; dynamic
PC19 4.4 Park CS: Confined Straight Confined by terraces and north valley wall
PC20 7.2 Park PCS: Partially confined straight Minimal planform complexity in canyon
PC21 3.7 Park PCA: Partially confined anabranching To Springdale; numerous islands
A1 5.4 Sweetgrass PCB: Partially confined braided Springdale: Low primary sinuosity; large open bar area; extensive armoring
Yellowstone CMZ 28 DTM and AGI
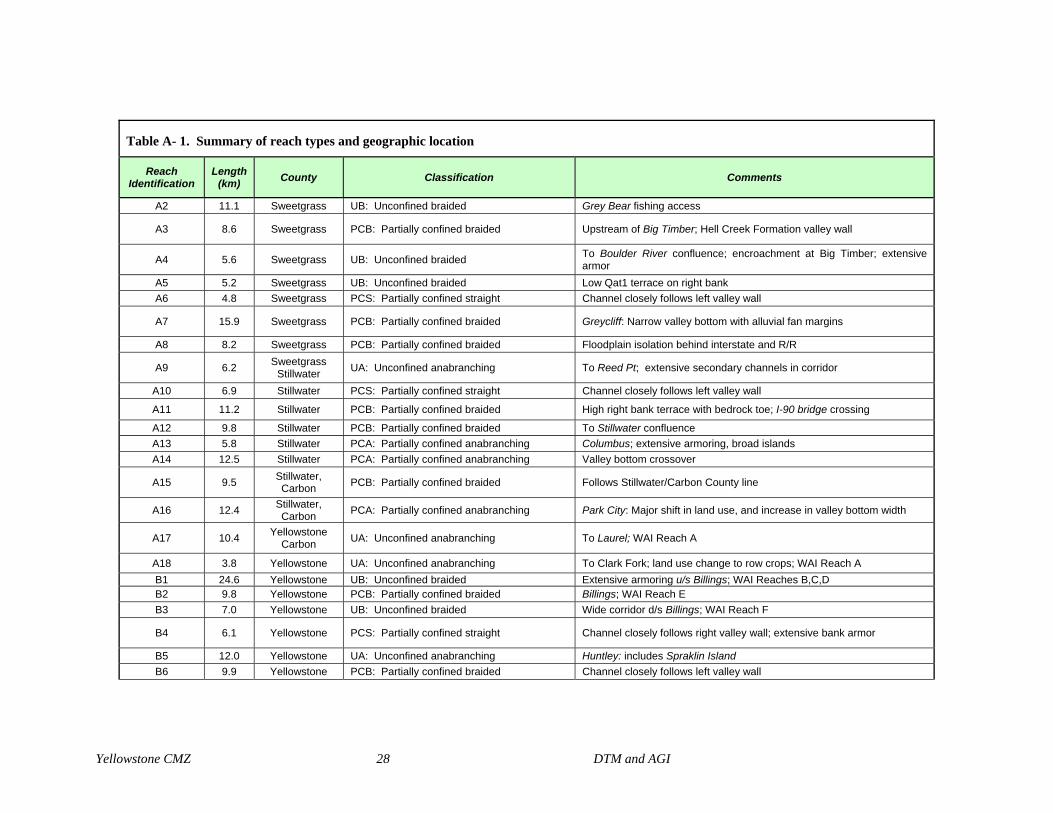
Table A- 1. Summary of reach types and geographic location
Reach Identification
Length (km) County Classification Comments
A2 11.1 Sweetgrass UB: Unconfined braided Grey Bear fishing access
A3 8.6 Sweetgrass PCB: Partially confined braided Upstream of Big Timber; Hell Creek Formation valley wall
A4 5.6 Sweetgrass UB: Unconfined braided To Boulder River confluence; encroachment at Big Timber; extensive armor
A5 5.2 Sweetgrass UB: Unconfined braided Low Qat1 terrace on right bank A6 4.8 Sweetgrass PCS: Partially confined straight Channel closely follows left valley wall
A7 15.9 Sweetgrass PCB: Partially confined braided Greycliff: Narrow valley bottom with alluvial fan margins
A8 8.2 Sweetgrass PCB: Partially confined braided Floodplain isolation behind interstate and R/R
A9 6.2 Sweetgrass Stillwater UA: Unconfined anabranching To Reed Pt; extensive secondary channels in corridor
A10 6.9 Stillwater PCS: Partially confined straight Channel closely follows left valley wall
A11 11.2 Stillwater PCB: Partially confined braided High right bank terrace with bedrock toe; I-90 bridge crossing
A12 9.8 Stillwater PCB: Partially confined braided To Stillwater confluence A13 5.8 Stillwater PCA: Partially confined anabranching Columbus; extensive armoring, broad islands A14 12.5 Stillwater PCA: Partially confined anabranching Valley bottom crossover
A15 9.5 Stillwater, Carbon PCB: Partially confined braided Follows Stillwater/Carbon County line
A16 12.4 Stillwater, Carbon PCA: Partially confined anabranching Park City: Major shift in land use, and increase in valley bottom width
A17 10.4 Yellowstone Carbon UA: Unconfined anabranching To Laurel; WAI Reach A
A18 3.8 Yellowstone UA: Unconfined anabranching To Clark Fork; land use change to row crops; WAI Reach A B1 24.6 Yellowstone UB: Unconfined braided Extensive armoring u/s Billings; WAI Reaches B,C,D B2 9.8 Yellowstone PCB: Partially confined braided Billings; WAI Reach E B3 7.0 Yellowstone UB: Unconfined braided Wide corridor d/s Billings; WAI Reach F
B4 6.1 Yellowstone PCS: Partially confined straight Channel closely follows right valley wall; extensive bank armor
B5 12.0 Yellowstone UA: Unconfined anabranching Huntley: includes Spraklin Island B6 9.9 Yellowstone PCB: Partially confined braided Channel closely follows left valley wall
Yellowstone CMZ 29 DTM and AGI
Table A- 1. Summary of reach types and geographic location
Reach Identification
Length (km) County Classification Comments
B7 13.9 Yellowstone UB: Unconfined braided Unconfined reach B8 14.7 Yellowstone PCA: Partially confined anabranching Pompey's Pillar B9 7.5 Yellowstone UA: Unconfined anabranching Meander cutoff isolated by railroad
B10 11.6 Yellowstone PCM: Partially confined meandering Encroached B11 13.1 Yellowstone PCA: Partially confined anabranching To Custer Bridge B12 7.3 Yellowstone UA: Unconfined anabranching To Bighorn River confluence
C1 9.5 Treasure UA: Unconfined anabranching From Bighorn confluence: Includes 1 mile of left bank valley wall control; Extensive bank protection.
C2 8.9 Treasure PCB: Partially confined braided To Myers Br (RM 285.5); Railroad adjacent to channel on valley wall; low sinuosity
C3 7.6 Treasure UA: Unconfined anabranching To Yellowstone Diversion: very sinuous; large meanders, extensive bars; historic avulsion
C4 6.1 Treasure PCB: Partially confined braided Below Yellowstone Diversion C5 5.1 Treasure PCS: Partially confined straight Hysham C6 9.1 Treasure UA: Unconfined anabranching Mission Valley C7 14.7 Treasure UA: Unconfined anabranching Mission Valley
C8 10.4 Treasure Rosebud PCS: Partially confined straight Rosebud/Treasure County Line
C9 17.2 Rosebud UA: Unconfined anabranching Hammond Valley C10 11.0 Rosebud PCM: Partially confined meandering Forsyth
C11 18.3 Rosebud PCM/I: Partially confined meandering/islands To Cartersville Bridge
C12 16.2 Rosebud PCM/I: Partially confined meandering/islands Rosebud; numerous meander cutoffs
C13 10.8 Rosebud PCM/I: Partially confined meandering/islands Valley bottom crossover
C14 19.6 Rosebud Custer PCM/I: Partially confined meandering/islands Series of meander bends
C15 6.0 Custer PCS: Partially confined straight Very low riparian vegetation
C16 11.6 Custer PCM/I: Partially confined meandering/islands to Miles City
C17 7.2 Custer PCS: Partially confined straight Miles City; Tongue River C18 5.2 Custer PCS: Partially confined straight Channel follows left valley wall
Yellowstone CMZ 30 DTM and AGI
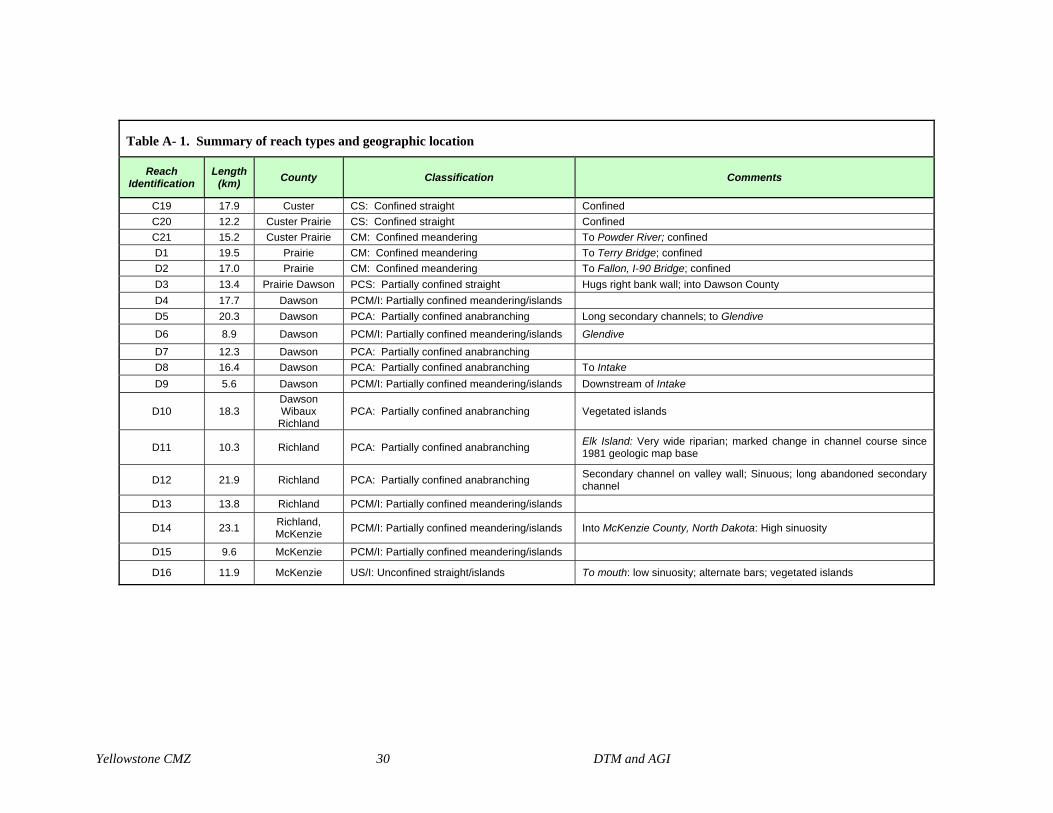
Table A- 1. Summary of reach types and geographic location
Reach Identification
Length (km) County Classification Comments
C19 17.9 Custer CS: Confined straight Confined C20 12.2 Custer Prairie CS: Confined straight Confined C21 15.2 Custer Prairie CM: Confined meandering To Powder River; confined D1 19.5 Prairie CM: Confined meandering To Terry Bridge; confined D2 17.0 Prairie CM: Confined meandering To Fallon, I-90 Bridge; confined D3 13.4 Prairie Dawson PCS: Partially confined straight Hugs right bank wall; into Dawson County D4 17.7 Dawson PCM/I: Partially confined meandering/islands D5 20.3 Dawson PCA: Partially confined anabranching Long secondary channels; to Glendive
D6 8.9 Dawson PCM/I: Partially confined meandering/islands Glendive
D7 12.3 Dawson PCA: Partially confined anabranching D8 16.4 Dawson PCA: Partially confined anabranching To Intake D9 5.6 Dawson PCM/I: Partially confined meandering/islands Downstream of Intake
D10 18.3 Dawson Wibaux
Richland PCA: Partially confined anabranching Vegetated islands
D11 10.3 Richland PCA: Partially confined anabranching Elk Island: Very wide riparian; marked change in channel course since 1981 geologic map base
D12 21.9 Richland PCA: Partially confined anabranching Secondary channel on valley wall; Sinuous; long abandoned secondary channel
D13 13.8 Richland PCM/I: Partially confined meandering/islands
D14 23.1 Richland, McKenzie PCM/I: Partially confined meandering/islands Into McKenzie County, North Dakota: High sinuosity
D15 9.6 McKenzie PCM/I: Partially confined meandering/islands
D16 11.9 McKenzie US/I: Unconfined straight/islands To mouth: low sinuosity; alternate bars; vegetated islands
Yellowstone CMZ 31 DTM and AGI
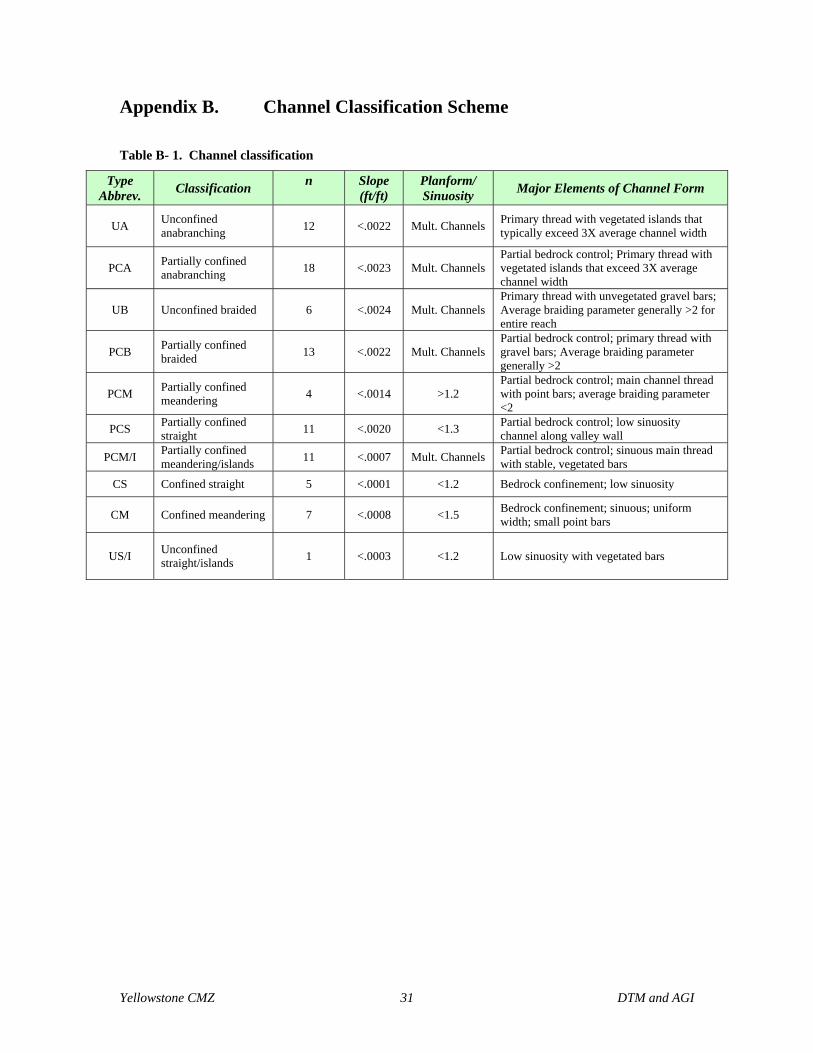
Appendix B. Channel Classification Scheme
Table B- 1. Channel classification
Type Abbrev. Classification n
Slope (ft/ft)
Planform/ Sinuosity Major Elements of Channel Form
UA Unconfined anabranching 12 <.0022 Mult. Channels Primary thread with vegetated islands that
typically exceed 3X average channel width
PCA Partially confined anabranching 18 <.0023 Mult. Channels
Partial bedrock control; Primary thread with vegetated islands that exceed 3X average channel width
UB Unconfined braided 6 <.0024 Mult. Channels Primary thread with unvegetated gravel bars; Average braiding parameter generally >2 for entire reach
PCB Partially confined braided 13 <.0022 Mult. Channels
Partial bedrock control; primary thread with gravel bars; Average braiding parameter generally >2
PCM Partially confined meandering 4 <.0014 >1.2
Partial bedrock control; main channel thread with point bars; average braiding parameter <2
PCS Partially confined straight 11 <.0020 <1.3 Partial bedrock control; low sinuosity
channel along valley wall
PCM/I Partially confined meandering/islands 11 <.0007 Mult. Channels Partial bedrock control; sinuous main thread
with stable, vegetated bars
CS Confined straight 5 <.0001 <1.2 Bedrock confinement; low sinuosity
CM Confined meandering 7 <.0008 <1.5 Bedrock confinement; sinuous; uniform width; small point bars
US/I Unconfined straight/islands 1 <.0003 <1.2 Low sinuosity with vegetated bars

Yellowstone CMZ 32 DTM and AGI
Yellowstone CMZ 33 DTM and AGI
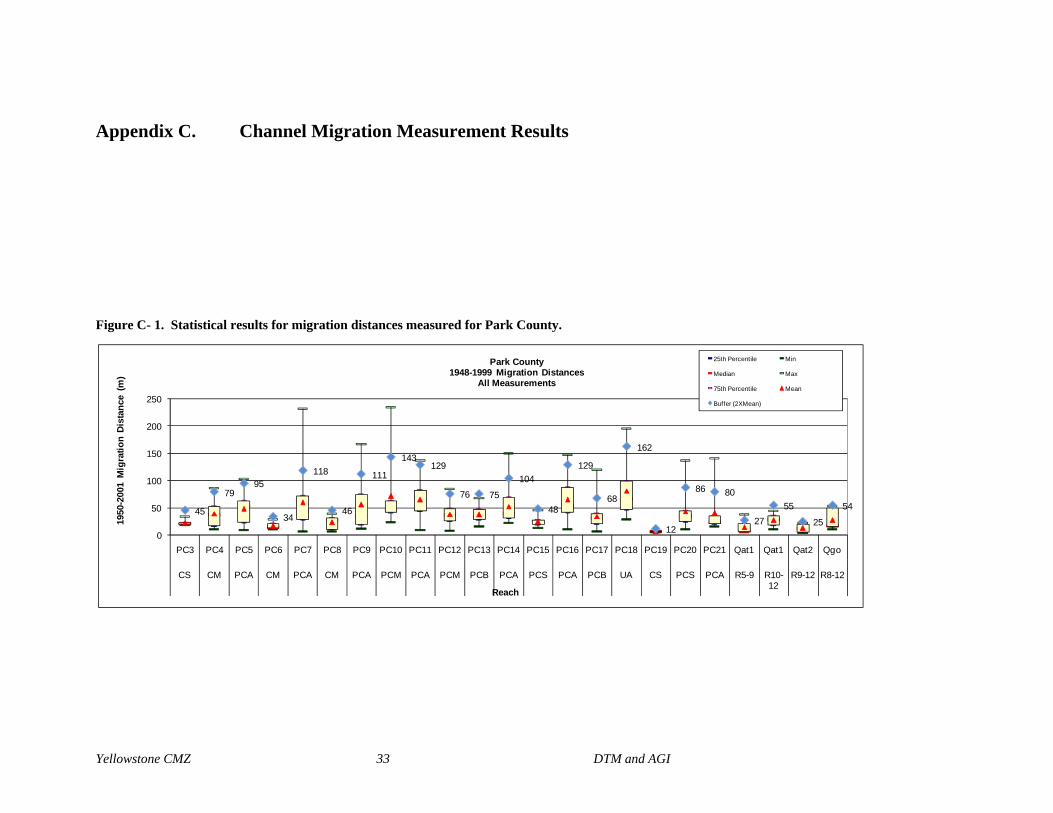
Appendix C. Channel Migration Measurement Results
Figure C- 1. Statistical results for migration distances measured for Park County.
45
7995
34
118
46
111
143129
76 75
104
48
129
68
162
12
86 80
2755
25
54
0
50
100
150
200
250
PC3 PC4 PC5 PC6 PC7 PC8 PC9 PC10 PC11 PC12 PC13 PC14 PC15 PC16 PC17 PC18 PC19 PC20 PC21 Qat1 Qat1 Qat2 Qgo
CS CM PCA CM PCA CM PCA PCM PCA PCM PCB PCA PCS PCA PCB UA CS PCS PCA R5-9 R10-12
R9-12 R8-12
1950
-200
1 M
igra
tion
Dist
ance
(m
)
Reach
Park County1948-1999 Migration Distances
All Measurements
25th Percentile Min
Median Max
75th Percentile Mean
Buffer (2XMean)
Yellowstone CMZ 34 DTM and AGI
Figure C- 2. Statistical results for migration distances measured for Region A (Springdale to Clark Fork River Confluence).
Figure C- 3. Statistical results for migration distances measured for Region B (Clark Fork River Confluence to Big Horn River Confluence).
116 130 132
229
69 89
146 140
219
111
208233
105
179209 204
279231
7632
050
100150200250300350400
A1 A2 A3 A4 A5 A6 A7 A8 A9 A10 A11 A12 A13 A14 A15 A16 A17 A18 LT HT
PCB UB PCB UB UB PCS PCB PCB UA PCS PCB PCB PCA PCA PCB PCA UA UA
1950
-200
1 M
igra
tion
Dis
tanc
e (m
)
Reach
Region A1950-2001 Migration Distances
All Measurements
25th percentile MinMedian Max75th percentile MeanBuffer (2XMean)
221149
253202
262 259
405
314 320
407370
232
91
0
100
200
300
400
500
B1 B2 B3 B4 B5 B6 B7 B8 B9 B10 B11 B12 Qat1
UB PCB UB PCS UA PCB UB PCA UA PCM PCA UA
1950
-200
1 M
igra
tion
Dist
ance
(m
)
Site
Region B1950-2001 Migration Distances
All Measurements
25th percentile MinMedian Max75th percentile MeanBuffer (2XMean)
Yellowstone CMZ 35 DTM and AGI
Figure C- 4. Statistical results for migration distances measured for Region C (Big Horn River Confluence to Tongue River Confluence).
Figure C- 5. Statistical results for migration distances measured for Region D (Tongue River Confluence to Missouri River Confluence).
217 202
312235
113
198
309
132
426
128201
342
242
350
110
202
89 72 57 51 52 590
100
200
300
400
500
600
C1 C2 C3 C4 C5 C6 C7 C8 C9 C10 C11 C12 C13 C14 C15 C16 C17 C18 C19 C20 C21 LT
UA PCB UA PCB PCS UA UA PCS UA PCM PCM/IPCM/IPCM/IPCM/I PCS PCM/I PCS PCS CS CS CM
1950
-200
1 M
igra
tion
Dist
ance
(m
)
Reach
Region C1950-2001 Migration Distances
All Measurements
25th Percentile Min
Median Max
75th Percentile Mean
Buffer (2XMean)
7328
115 118
293
137
208167
210
320
418
339 317 328
138
337
145 114
0
100
200
300
400
500
600
D1 D2 D3 D4 D5 D6 D7 D8 D9 D10 D11 D12 D13 D14 D15 D16 Qat1 Qat2
CM CM PCS PCM/I PCA PCM/I PCA PCA PCM/I PCA PCA PCA PCM/I PCM/I PCM/I US/I --
1950
-200
1 M
igra
tion
Dist
ance
(m
)
Site
Region D1950-2001 Migration Distances
All Measurements
25th Percentile MinMedian Max75th Percentile MeanBuffer (2XMean)
Yellowstone CMZ 36 DTM and AGI
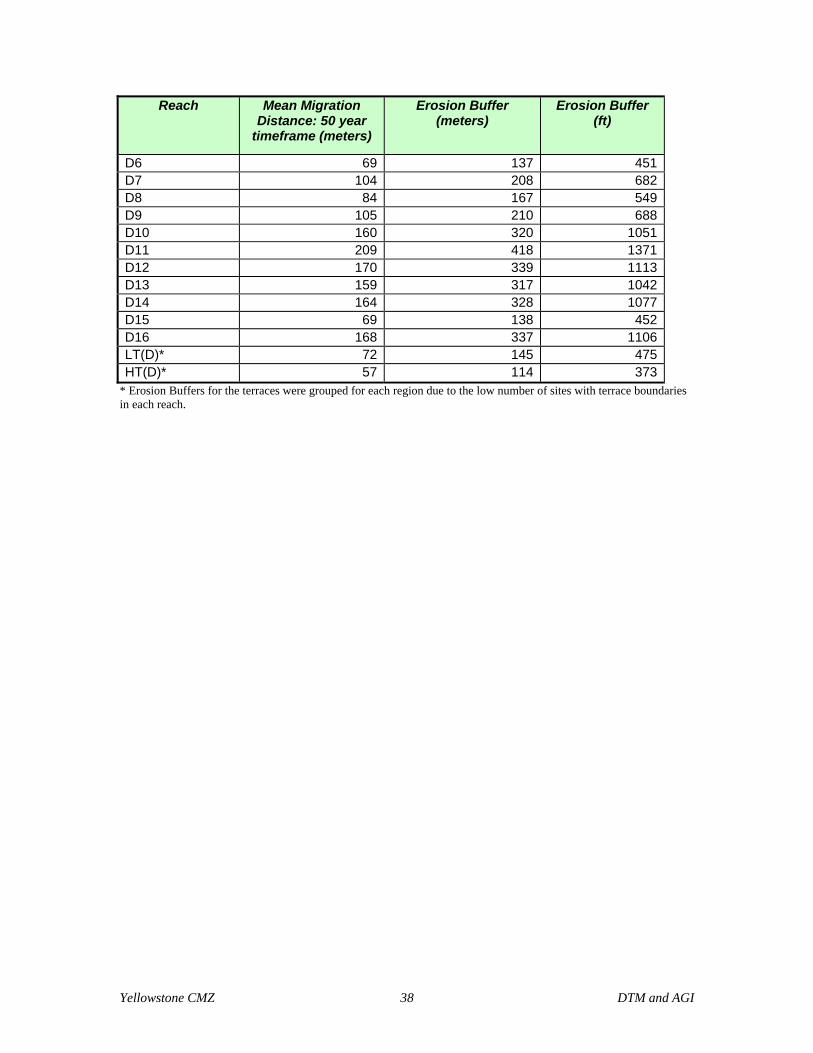
Appendix D. Erosion Buffer Values Table D- 1. Erosion buffers applied to banklines
Reach Mean Migration Distance: 50 year
timeframe (meters)
Erosion Buffer (meters)
Erosion Buffer (ft)
Park County PC3 23 45 148PC4 39 79 258PC5 48 95 313PC6 17 34 110PC7 59 118 388PC8 23 46 150PC9 56 111 365PC10 72 143 469PC11 64 129 422PC12 38 76 249PC13 38 75 246PC14 52 104 342PC15 24 48 158PC16 65 129 423PC17 34 68 223PC18 81 162 532PC19 6 12 38PC20 43 86 284PC21 40 80 261LT (PC5-PC9) 14 27 89LT (PC10-PC12) 27 55 179HT (PC9-PC12) 12 25 82Qgo (PC8-PC12) 27 54 179Region A: Springdale To Clark's Fork River A1 58 116 379A2 65 130 425A3 66 132 435A4 115 229 753A5 34 69 225A6 45 89 292A7 73 146 481A8 70 140 458A9 110 219 720A10 56 111 365A11 104 208 684A12 116 233 763A13 52 105 343A14 89 179 587A15 105 209 686A16 102 204 671A17 139 279 914
Yellowstone CMZ 37 DTM and AGI
Reach Mean Migration Distance: 50 year
timeframe (meters)
Erosion Buffer (meters)
Erosion Buffer (ft)
A18 116 231 759LT(A)* 38 76 250HT(A)* 16 32 105Region B: Clark's Fork River Confluence to Big Horn River Confluence B1 110 221 724B2 75 149 490B3 127 253 830B4 101 202 663B5 131 262 860B6 130 259 850B7 203 405 1330B8 157 314 1031B9 160 320 1049B10 204 407 1336B11 185 370 1214B12 116 232 761LT(B)* 45 91 298Region C: Big Horn River Confluence to Powder River Confluence C1 108 217 711C2 101 202 663C3 156 312 1024C4 118 235 772C5 57 113 371C6 99 198 651C7 154 309 1012C8 66 132 433C9 213 426 1398C10 64 128 420C11 101 201 661C12 171 342 1124C13 121 242 793C14 175 350 1150C15 55 110 360C16 101 202 663C17 44 89 291C18 36 72 236C19 28 57 186C20 25 51 166C21 26 52 169LT(C)* 29 59 193Region D: Powder River Confluence to Mouth D1 37 73 241D2 14 28 92D3 57 115 376D4 59 118 388D5 147 293 962
Yellowstone CMZ 38 DTM and AGI
Reach Mean Migration Distance: 50 year
timeframe (meters)
Erosion Buffer (meters)
Erosion Buffer (ft)
D6 69 137 451D7 104 208 682D8 84 167 549D9 105 210 688D10 160 320 1051D11 209 418 1371D12 170 339 1113D13 159 317 1042D14 164 328 1077D15 69 138 452D16 168 337 1106LT(D)* 72 145 475HT(D)* 57 114 373
* Erosion Buffers for the terraces were grouped for each region due to the low number of sites with terrace boundaries in each reach.