Embed Size (px)
Citation preview
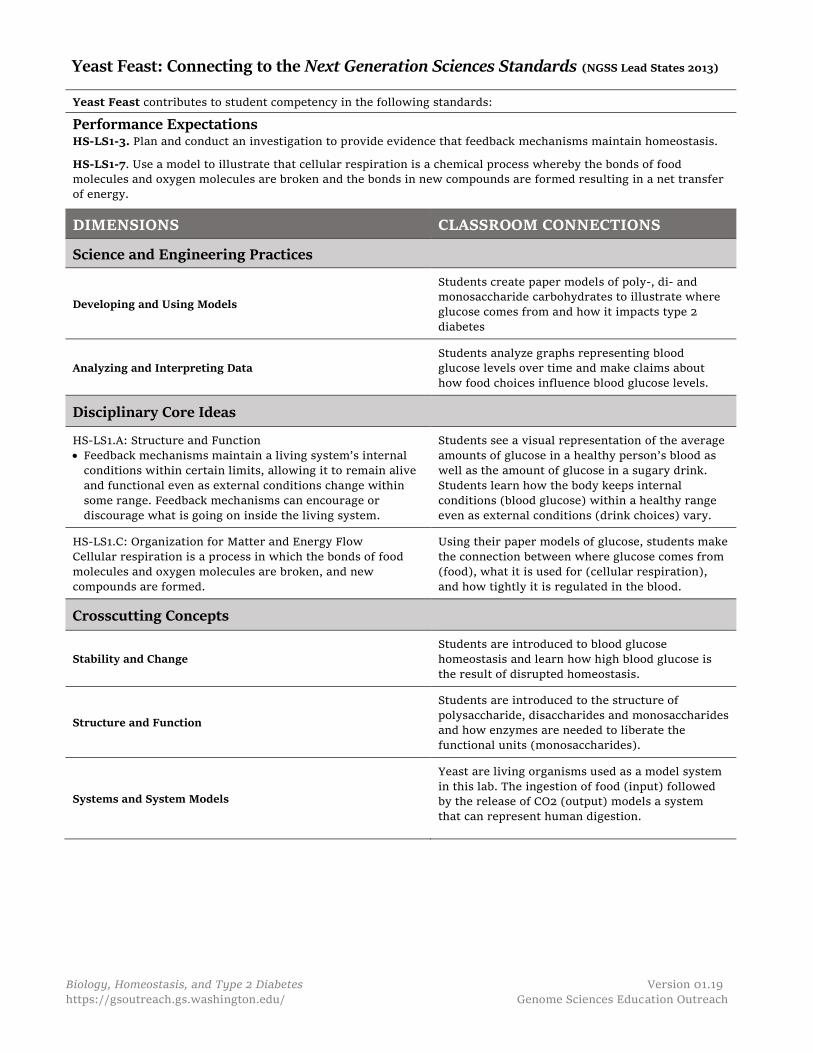
Yeast Feast: Connecting to the Next Generation Sciences Standards (NGSS Lead States 2013)
Biology, Homeostasis, and Type 2 Diabetes Version 01.19
https://gsoutreach.gs.washington.edu/ Genome Sciences Education Outreach
Yeast Feast contributes to student competency in the following standards:
Performance Expectations HS-LS1-3. Plan and conduct an investigation to provide evidence that feedback mechanisms maintain homeostasis.
HS-LS1-7. Use a model to illustrate that cellular respiration is a chemical process whereby the bonds of food molecules and oxygen molecules are broken and the bonds in new compounds are formed resulting in a net transfer
of energy.
DIMENSIONS CLASSROOM CONNECTIONS
Science and Engineering Practices
Developing and Using Models
Students create paper models of poly-, di- and monosaccharide carbohydrates to illustrate where
glucose comes from and how it impacts type 2
diabetes
Analyzing and Interpreting Data Students analyze graphs representing blood glucose levels over time and make claims about
how food choices influence blood glucose levels.
Disciplinary Core Ideas
HS-LS1.A: Structure and Function
Feedback mechanisms maintain a living system’s internal
conditions within certain limits, allowing it to remain alive
and functional even as external conditions change within
some range. Feedback mechanisms can encourage or
discourage what is going on inside the living system.
Students see a visual representation of the average
amounts of glucose in a healthy person’s blood as
well as the amount of glucose in a sugary drink.
Students learn how the body keeps internal
conditions (blood glucose) within a healthy range
even as external conditions (drink choices) vary.
HS-LS1.C: Organization for Matter and Energy Flow
Cellular respiration is a process in which the bonds of food
molecules and oxygen molecules are broken, and new
compounds are formed.
Using their paper models of glucose, students make
the connection between where glucose comes from
(food), what it is used for (cellular respiration),
and how tightly it is regulated in the blood.
Crosscutting Concepts
Stability and Change Students are introduced to blood glucose
homeostasis and learn how high blood glucose is
the result of disrupted homeostasis.
Structure and Function
Students are introduced to the structure of
polysaccharide, disaccharides and monosaccharides and how enzymes are needed to liberate the
functional units (monosaccharides).
Systems and System Models
Yeast are living organisms used as a model system
in this lab. The ingestion of food (input) followed by the release of CO2 (output) models a system
that can represent human digestion.
Biology, Homeostasis, and Type 2 Diabetes Version 01.19
https://gsoutreach.gs.washington.edu/ Genome Sciences Education Outreach
Yeast Feast: Finding glucose in food Time: ~150 min
Lesson Objectives:
Students will be able
to learn:
Where is glucose
found in food?
How can yeast be
used to measure
glucose in food?
How do feedback
mechanisms
maintain
homeostasis?
Overview
This lab was written as an extension to the curriculum Biology, Homeostasis, and Type 2 Diabetes and an also be used independently. In this lab experience, students use the CO2 production by yeast as an assay for the amount of glucose in a food. The lab itself (Part III of the lesson) is bookended by activities that support student learning of lab concepts.
In Part I, students see a visual representation of the amount of
glucose present in the blood of a person with healthy blood glucose regulation and compare that to the amount of sugar in a 20-ounce
soda, showing how sugar can be fuel, food, and too much of a good thing.
In Part II, students trace glucose molecules from the foods they eat to the starting point of cellular respiration by creating paper models of different carbohydrates, including starch, fiber, sucrose, fructose
and glucose.
In Part III, students are introduced to the lab set-up, make hypotheses, and conduct the lab, including collecting and graphing
their data
In Part IV, students use a variety of materials to model what happened in the yeast and share their understanding.
In Part V, students complete a Claim-Evidence-Reasoning as an
evaluation for the lab.
Enduring Understandings
Glucose, the major energy source for all human cells, is released primarily through digestion of carbohydrates. Food choices impact blood glucose levels.
Blood glucose levels are regulated to stay within a healthy range.
Essential Question
Where is glucose found in food, and how is it regulated?
Lesson Summary with Timings
Part I: Engage: How much sugar is in our blood? 10 min
Part II: Explain: Modeling carbohydrates with paper 30 min
Part III: Explore: Yeast Feast pre-lab and lab 60 min
Part IV: Elaborate: Student-made models 20 min
Part V: Evaluate: Claim, Evidence, and Reasoning 30 min
Biology, Homeostasis and Type 2 Diabetes UW GSEO 09/18 https://gsoutreach.gs.washington.edu/
Kit Components:
Tub 1 (large gray) contains 4 water baths and the whole-classroom materials for the lab
Tub 2 (large gray) contains 4 water baths and group supplies for student groups for the lab
Tub 3 (small clear) contains materials for Parts I, II, IV of the lesson
Suggested timing:
Day 1: Present the How much sugar is in our blood? Engage activity
Model carbohydrates using the paper; introduce vocabulary
Prelab: Orient student to the materials and protocol for the Yeast Feast, using Student Sheet 1
Day 2: Students complete Yeast Feast lab and collect data using Student Sheet 2
Day 3: Students use various materials to model what happened during the lab, and work on their Claim, Evidence, Reasoning statements using Student Sheet 3
Materials Materials Quantity
Computer and projector 1 per class
Yeast Kit Stand Alone PowerPoint 1 per class
Background on Carbohydrates, optional 1 per student
Student Sheet 1, 2, and 3, photocopied 1 per student
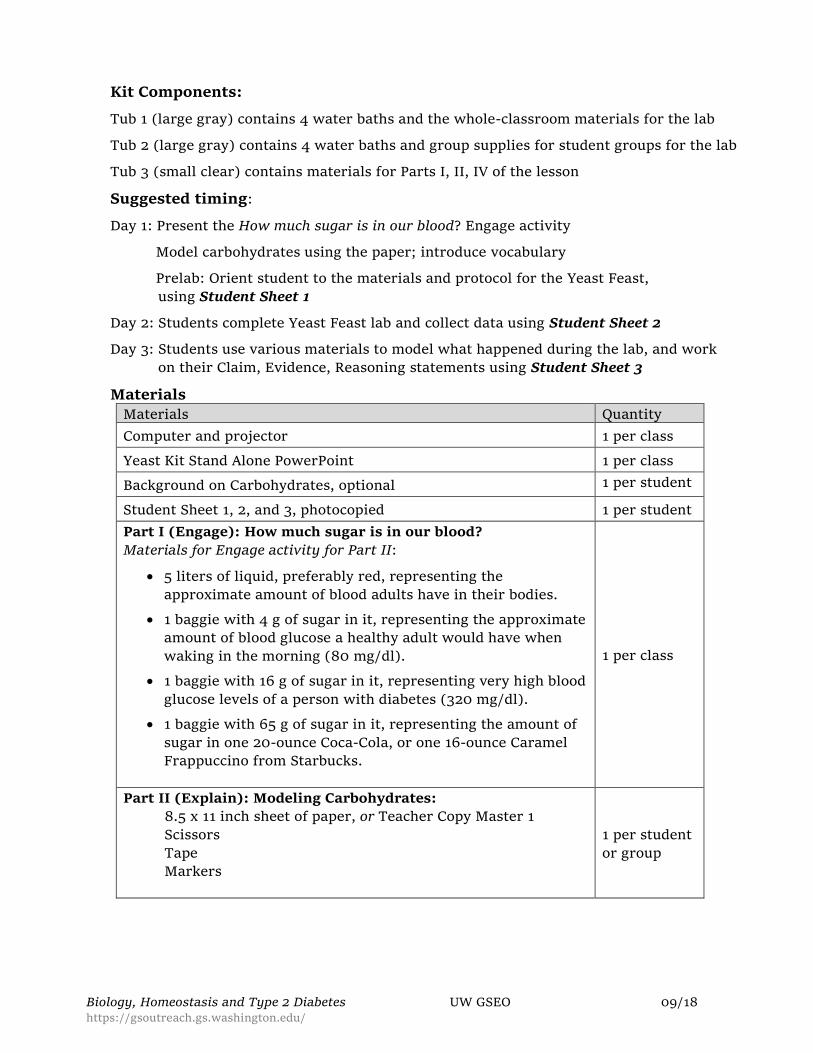
Part I (Engage): How much sugar is in our blood?
Materials for Engage activity for Part II:
5 liters of liquid, preferably red, representing the
approximate amount of blood adults have in their bodies.
1 baggie with 4 g of sugar in it, representing the approximate amount of blood glucose a healthy adult would have when waking in the morning (80 mg/dl).
1 baggie with 16 g of sugar in it, representing very high blood
glucose levels of a person with diabetes (320 mg/dl).
1 baggie with 65 g of sugar in it, representing the amount of
sugar in one 20-ounce Coca-Cola, or one 16-ounce Caramel Frappuccino from Starbucks.
1 per class
Part II (Explain): Modeling Carbohydrates: 8.5 x 11 inch sheet of paper, or Teacher Copy Master 1 Scissors Tape Markers
1 per student or group
Yeast Feast
Biology, Homeostasis and Type 2 Diabetes UW GSEO 01.19 https://gsoutreach.gs.washington.edu/
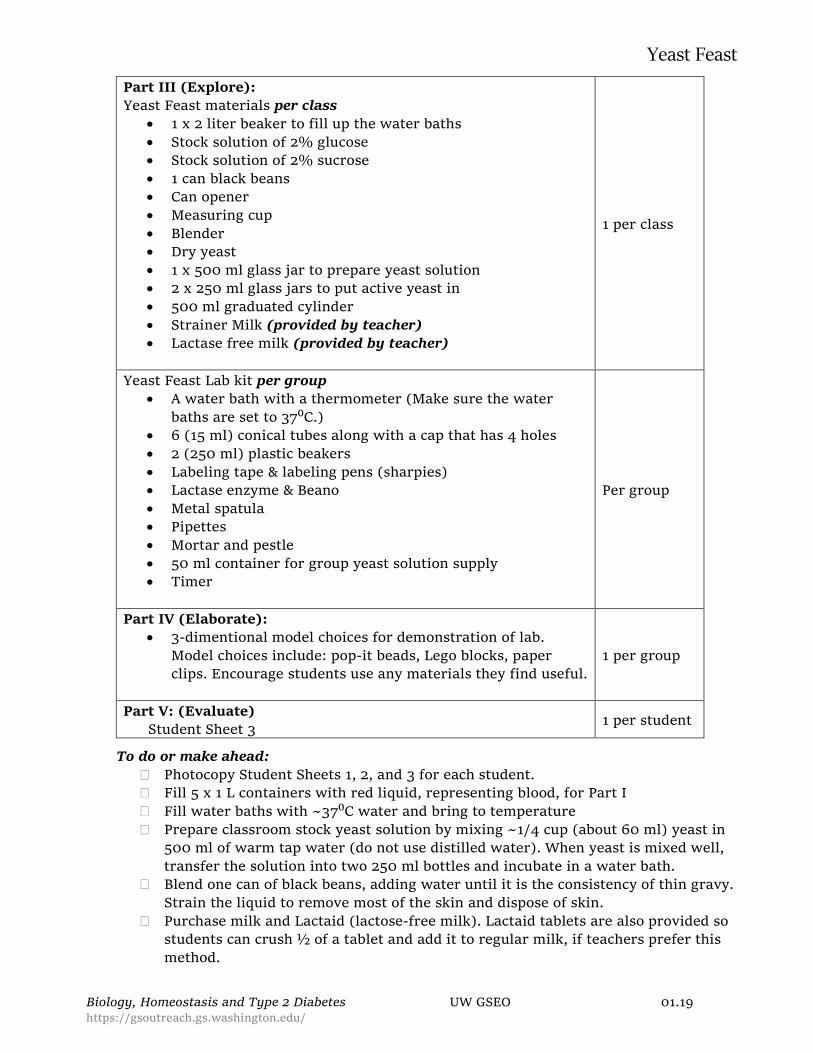
Part III (Explore): Yeast Feast materials per class
1 x 2 liter beaker to fill up the water baths Stock solution of 2% glucose Stock solution of 2% sucrose
1 can black beans Can opener Measuring cup Blender Dry yeast
1 x 500 ml glass jar to prepare yeast solution 2 x 250 ml glass jars to put active yeast in 500 ml graduated cylinder Strainer Milk (provided by teacher) Lactase free milk (provided by teacher)
1 per class
Yeast Feast Lab kit per group A water bath with a thermometer (Make sure the water
baths are set to 37⁰C.) 6 (15 ml) conical tubes along with a cap that has 4 holes 2 (250 ml) plastic beakers Labeling tape & labeling pens (sharpies) Lactase enzyme & Beano Metal spatula Pipettes
Mortar and pestle 50 ml container for group yeast solution supply Timer
Per group
Part IV (Elaborate): 3-dimentional model choices for demonstration of lab.
Model choices include: pop-it beads, Lego blocks, paper clips. Encourage students use any materials they find useful.
1 per group
Part V: (Evaluate) Student Sheet 3
1 per student
To do or make ahead:
Photocopy Student Sheets 1, 2, and 3 for each student. Fill 5 x 1 L containers with red liquid, representing blood, for Part I
Fill water baths with ~37⁰C water and bring to temperature Prepare classroom stock yeast solution by mixing ~1/4 cup (about 60 ml) yeast in
500 ml of warm tap water (do not use distilled water). When yeast is mixed well, transfer the solution into two 250 ml bottles and incubate in a water bath.
Blend one can of black beans, adding water until it is the consistency of thin gravy. Strain the liquid to remove most of the skin and dispose of skin.
Purchase milk and Lactaid (lactose-free milk). Lactaid tablets are also provided so students can crush ½ of a tablet and add it to regular milk, if teachers prefer this method.
Yeast Feast
Biology, Homeostasis and Type 2 Diabetes UW GSEO 01.19 https://gsoutreach.gs.washington.edu/
Background on Carbohydrates
Glucose, a monosaccharide, is the primary energy molecule of the body. Surprisingly, much of the food we eat is not in the form of glucose. More commonly, glucose is found as part of
disaccharides like sucrose (found in fruit) and lactose (in milk) or as a starch.
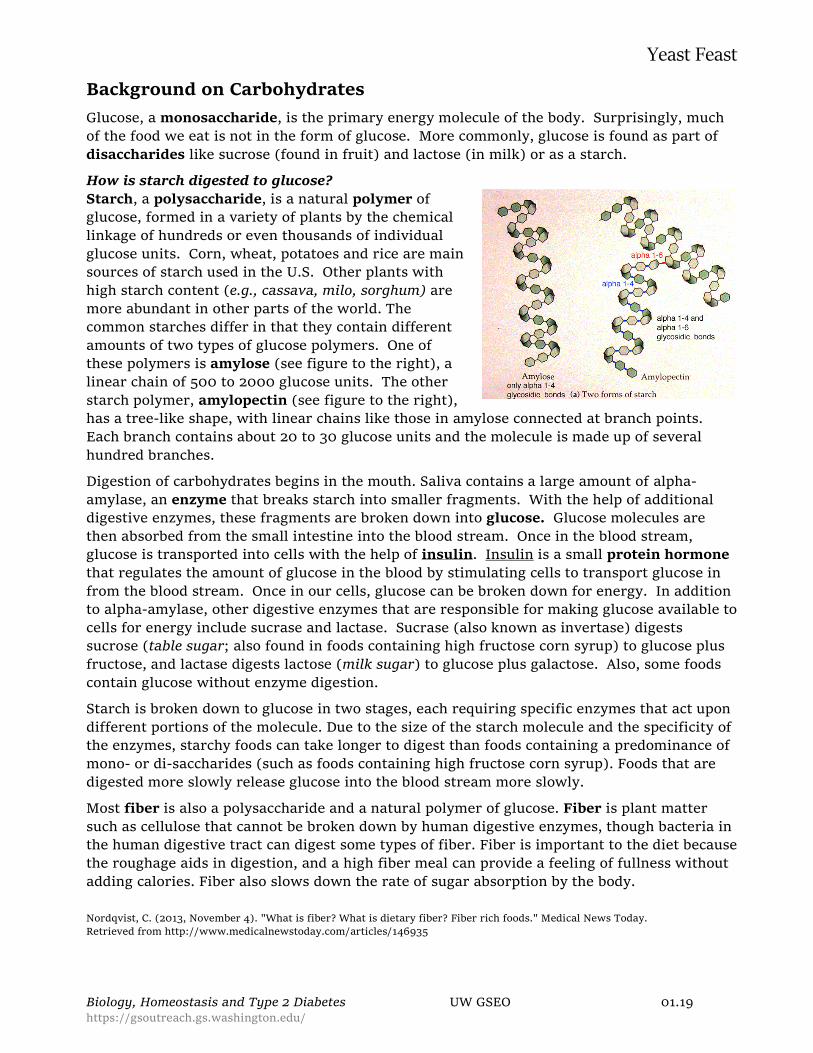
How is starch digested to glucose? Starch, a polysaccharide, is a natural polymer of glucose, formed in a variety of plants by the chemical linkage of hundreds or even thousands of individual glucose units. Corn, wheat, potatoes and rice are main sources of starch used in the U.S. Other plants with
high starch content (e.g., cassava, milo, sorghum) are more abundant in other parts of the world. The common starches differ in that they contain different
amounts of two types of glucose polymers. One of these polymers is amylose (see figure to the right), a linear chain of 500 to 2000 glucose units. The other starch polymer, amylopectin (see figure to the right), has a tree-like shape, with linear chains like those in amylose connected at branch points. Each branch contains about 20 to 30 glucose units and the molecule is made up of several
hundred branches.
Digestion of carbohydrates begins in the mouth. Saliva contains a large amount of alpha-amylase, an enzyme that breaks starch into smaller fragments. With the help of additional digestive enzymes, these fragments are broken down into glucose. Glucose molecules are
then absorbed from the small intestine into the blood stream. Once in the blood stream, glucose is transported into cells with the help of insulin. Insulin is a small protein hormone
that regulates the amount of glucose in the blood by stimulating cells to transport glucose in from the blood stream. Once in our cells, glucose can be broken down for energy. In addition to alpha-amylase, other digestive enzymes that are responsible for making glucose available to
cells for energy include sucrase and lactase. Sucrase (also known as invertase) digests sucrose (table sugar; also found in foods containing high fructose corn syrup) to glucose plus fructose, and lactase digests lactose (milk sugar) to glucose plus galactose. Also, some foods
contain glucose without enzyme digestion.
Starch is broken down to glucose in two stages, each requiring specific enzymes that act upon
different portions of the molecule. Due to the size of the starch molecule and the specificity of the enzymes, starchy foods can take longer to digest than foods containing a predominance of mono- or di-saccharides (such as foods containing high fructose corn syrup). Foods that are digested more slowly release glucose into the blood stream more slowly.
Most fiber is also a polysaccharide and a natural polymer of glucose. Fiber is plant matter such as cellulose that cannot be broken down by human digestive enzymes, though bacteria in the human digestive tract can digest some types of fiber. Fiber is important to the diet because
the roughage aids in digestion, and a high fiber meal can provide a feeling of fullness without adding calories. Fiber also slows down the rate of sugar absorption by the body.
Nordqvist, C. (2013, November 4). "What is fiber? What is dietary fiber? Fiber rich foods." Medical News Today. Retrieved from http://www.medicalnewstoday.com/articles/146935
Yeast Feast
Biology, Homeostasis and Type 2 Diabetes UW GSEO 01.19 https://gsoutreach.gs.washington.edu/
Procedures Part I (Engage): How much sugar is in our blood? (10 min)
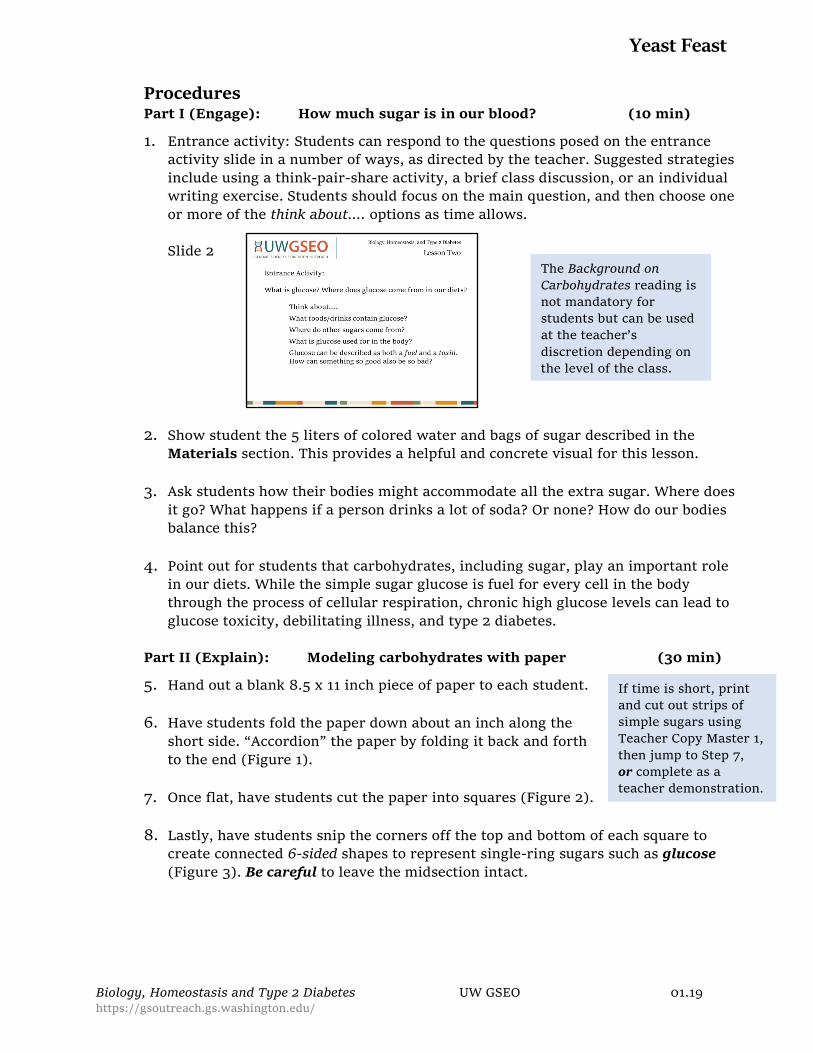
1. Entrance activity: Students can respond to the questions posed on the entrance activity slide in a number of ways, as directed by the teacher. Suggested strategies include using a think-pair-share activity, a brief class discussion, or an individual writing exercise. Students should focus on the main question, and then choose one
or more of the think about…. options as time allows. Slide 2
2. Show student the 5 liters of colored water and bags of sugar described in the Materials section. This provides a helpful and concrete visual for this lesson.
3. Ask students how their bodies might accommodate all the extra sugar. Where does it go? What happens if a person drinks a lot of soda? Or none? How do our bodies balance this?
4. Point out for students that carbohydrates, including sugar, play an important role in our diets. While the simple sugar glucose is fuel for every cell in the body
through the process of cellular respiration, chronic high glucose levels can lead to glucose toxicity, debilitating illness, and type 2 diabetes.
Part II (Explain): Modeling carbohydrates with paper (30 min)
5. Hand out a blank 8.5 x 11 inch piece of paper to each student.
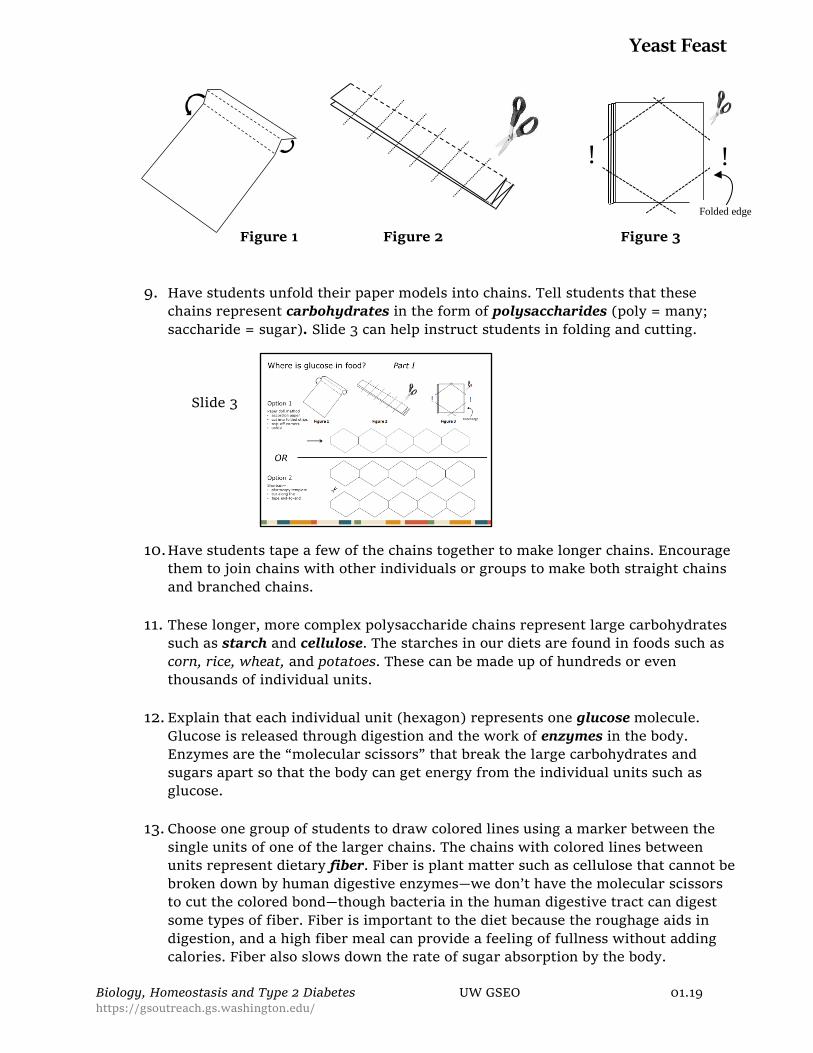
6. Have students fold the paper down about an inch along the short side. “Accordion” the paper by folding it back and forth to the end (Figure 1).
7. Once flat, have students cut the paper into squares (Figure 2).
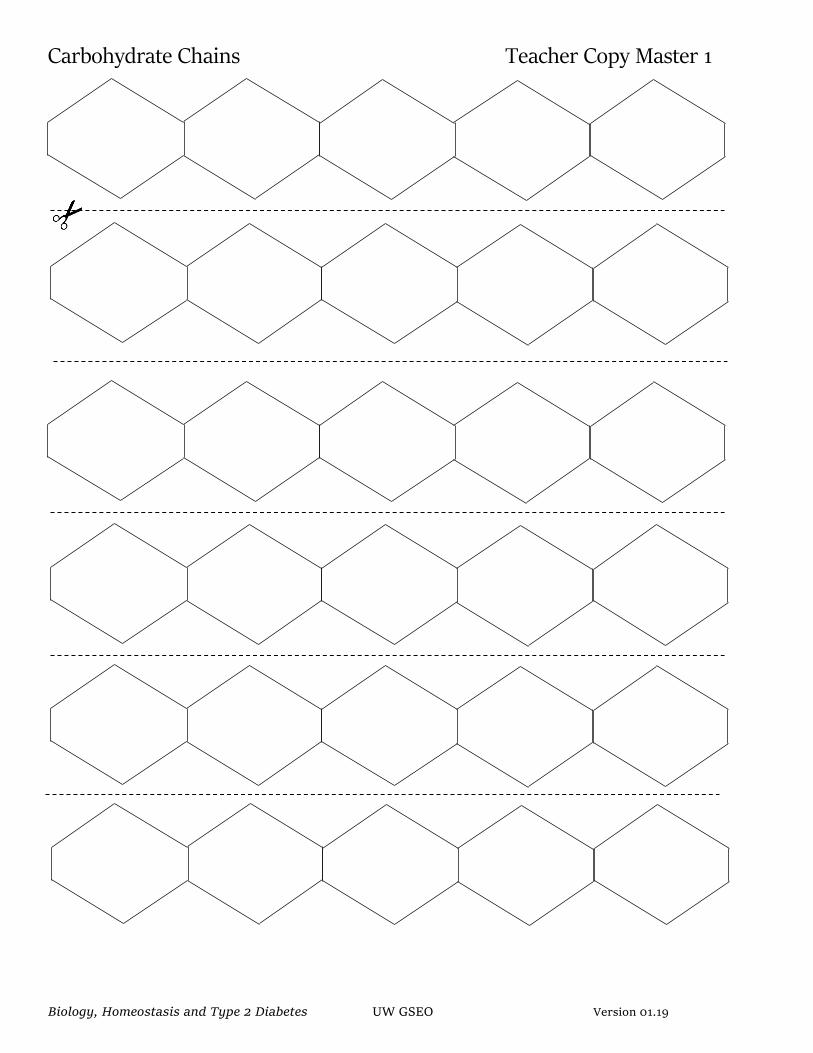
8. Lastly, have students snip the corners off the top and bottom of each square to create connected 6-sided shapes to represent single-ring sugars such as glucose (Figure 3). Be careful to leave the midsection intact.
If time is short, print
and cut out strips of
simple sugars using
Teacher Copy Master 1,
then jump to Step 7,
or complete as a
teacher demonstration.
The Background on
Carbohydrates reading is
not mandatory for
students but can be used
at the teacher’s
discretion depending on
the level of the class.
Yeast Feast
Biology, Homeostasis and Type 2 Diabetes UW GSEO 01.19 https://gsoutreach.gs.washington.edu/
Figure 1 Figure 2 Figure 3
9. Have students unfold their paper models into chains. Tell students that these chains represent carbohydrates in the form of polysaccharides (poly = many; saccharide = sugar). Slide 3 can help instruct students in folding and cutting.
Slide 3
10. Have students tape a few of the chains together to make longer chains. Encourage them to join chains with other individuals or groups to make both straight chains and branched chains.
11. These longer, more complex polysaccharide chains represent large carbohydrates such as starch and cellulose. The starches in our diets are found in foods such as
corn, rice, wheat, and potatoes. These can be made up of hundreds or even thousands of individual units.
12. Explain that each individual unit (hexagon) represents one glucose molecule. Glucose is released through digestion and the work of enzymes in the body. Enzymes are the “molecular scissors” that break the large carbohydrates and sugars apart so that the body can get energy from the individual units such as glucose.
13. Choose one group of students to draw colored lines using a marker between the
single units of one of the larger chains. The chains with colored lines between units represent dietary fiber. Fiber is plant matter such as cellulose that cannot be
broken down by human digestive enzymes—we don’t have the molecular scissors to cut the colored bond—though bacteria in the human digestive tract can digest some types of fiber. Fiber is important to the diet because the roughage aids in
digestion, and a high fiber meal can provide a feeling of fullness without adding calories. Fiber also slows down the rate of sugar absorption by the body.
! !
Folded edge
Yeast Feast
Biology, Homeostasis and Type 2 Diabetes UW GSEO 01.19 https://gsoutreach.gs.washington.edu/
14. Ask each student to take one of his or her chains and cut or tear it into individual hexagons, or glucose
units. Each glucose is a single sugar, or monosaccharide, (mono = one) when detached from the chain. Have students label a few monosaccharide pieces as glucose.
15. Explain that fructose is also a monosaccharide and have students label a few more monosaccharide pieces as fructose. Fructose is a very sweet sugar found in some plants such as fruits and berries. It is metabolized differently than glucose by the body. [Teacher note: fructose is a 5-ring sugar but will be represented the same way as glucose in this activity.]
16. Ask students to break another chain into groups of two hexagons. Each of these
represents a disaccharide (di = two). Sucrose (table sugar) is a disaccharide.
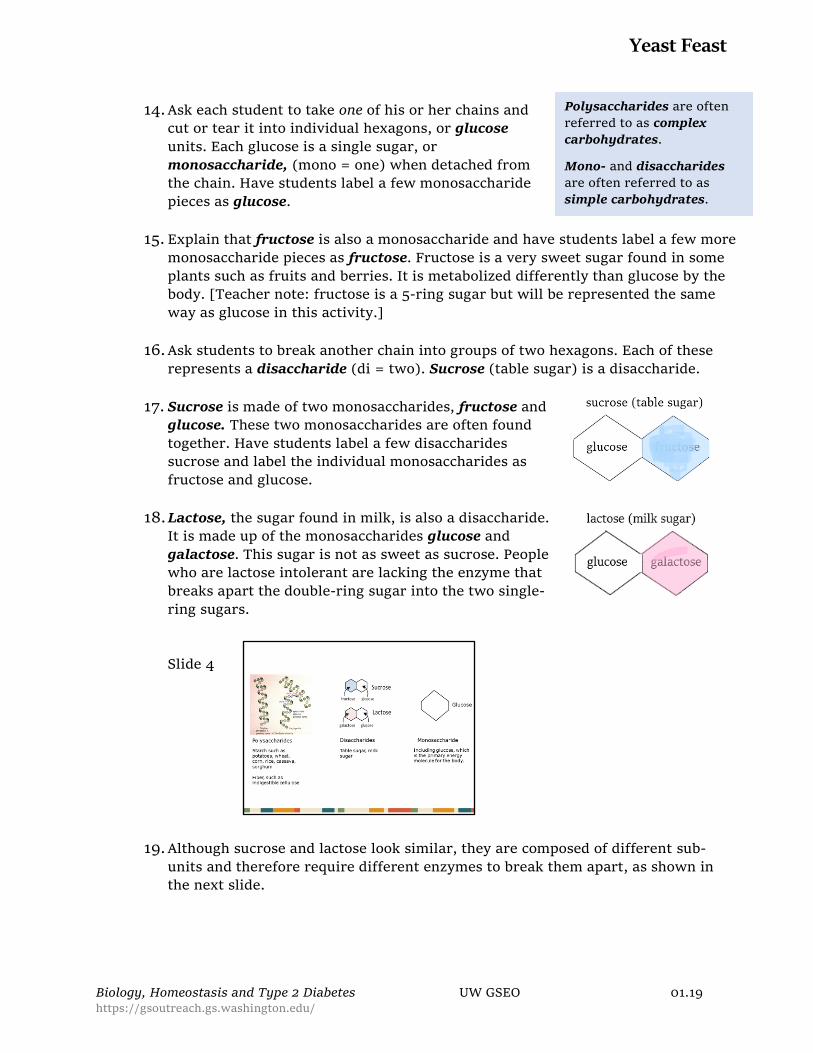
17. Sucrose is made of two monosaccharides, fructose and glucose. These two monosaccharides are often found
together. Have students label a few disaccharides sucrose and label the individual monosaccharides as fructose and glucose.
18. Lactose, the sugar found in milk, is also a disaccharide. It is made up of the monosaccharides glucose and galactose. This sugar is not as sweet as sucrose. People who are lactose intolerant are lacking the enzyme that breaks apart the double-ring sugar into the two single-ring sugars. Slide 4
19. Although sucrose and lactose look similar, they are composed of different sub-units and therefore require different enzymes to break them apart, as shown in the next slide.
Polysaccharides are often
referred to as complex
carbohydrates.
Mono- and disaccharides
are often referred to as
simple carbohydrates.
Yeast Feast
Biology, Homeostasis and Type 2 Diabetes UW GSEO 01.19 https://gsoutreach.gs.washington.edu/
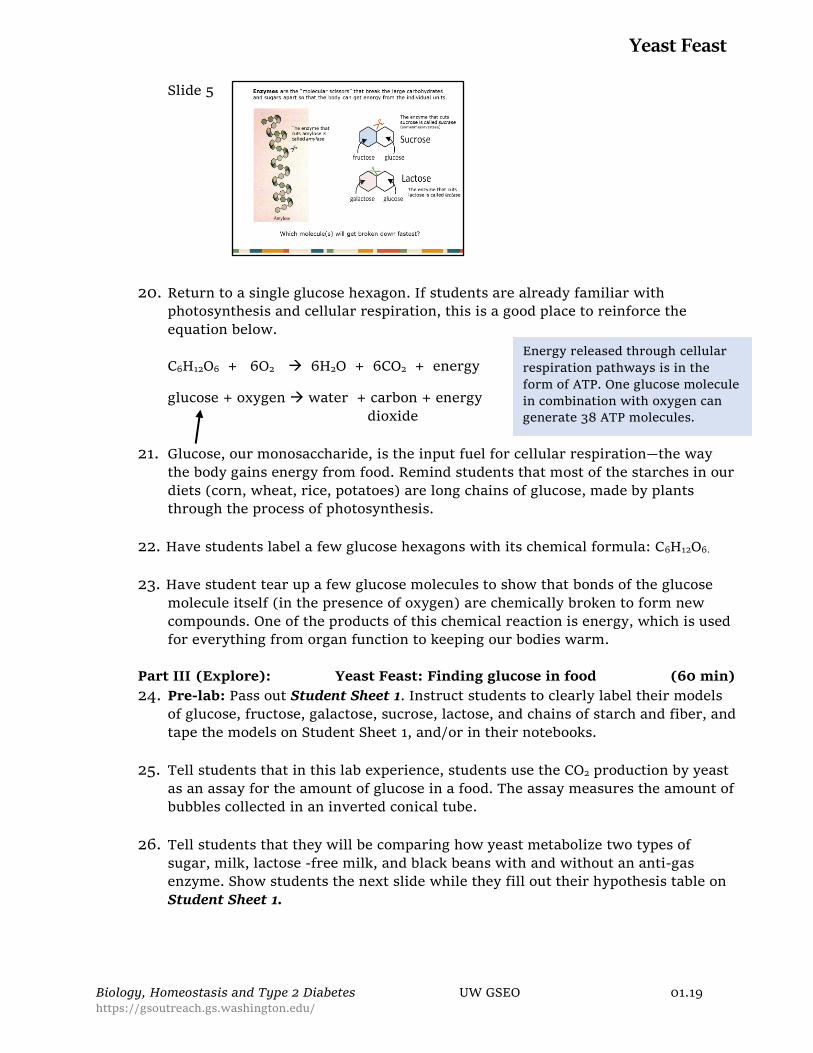
Slide 5
20. Return to a single glucose hexagon. If students are already familiar with photosynthesis and cellular respiration, this is a good place to reinforce the equation below.
C6H12O6 + 6O2 6H2O + 6CO2 + energy glucose + oxygen water + carbon + energy dioxide
21. Glucose, our monosaccharide, is the input fuel for cellular respiration—the way
the body gains energy from food. Remind students that most of the starches in our diets (corn, wheat, rice, potatoes) are long chains of glucose, made by plants through the process of photosynthesis.
22. Have students label a few glucose hexagons with its chemical formula: C6H12O6.
23. Have student tear up a few glucose molecules to show that bonds of the glucose molecule itself (in the presence of oxygen) are chemically broken to form new compounds. One of the products of this chemical reaction is energy, which is used for everything from organ function to keeping our bodies warm.
Part III (Explore): Yeast Feast: Finding glucose in food (60 min)
24. Pre-lab: Pass out Student Sheet 1. Instruct students to clearly label their models of glucose, fructose, galactose, sucrose, lactose, and chains of starch and fiber, and tape the models on Student Sheet 1, and/or in their notebooks.
25. Tell students that in this lab experience, students use the CO2 production by yeast as an assay for the amount of glucose in a food. The assay measures the amount of bubbles collected in an inverted conical tube.
26. Tell students that they will be comparing how yeast metabolize two types of
sugar, milk, lactose -free milk, and black beans with and without an anti-gas enzyme. Show students the next slide while they fill out their hypothesis table on
Student Sheet 1.
Energy released through cellular
respiration pathways is in the
form of ATP. One glucose molecule
in combination with oxygen can generate 38 ATP molecules.
Yeast Feast
Biology, Homeostasis and Type 2 Diabetes UW GSEO 01.19 https://gsoutreach.gs.washington.edu/
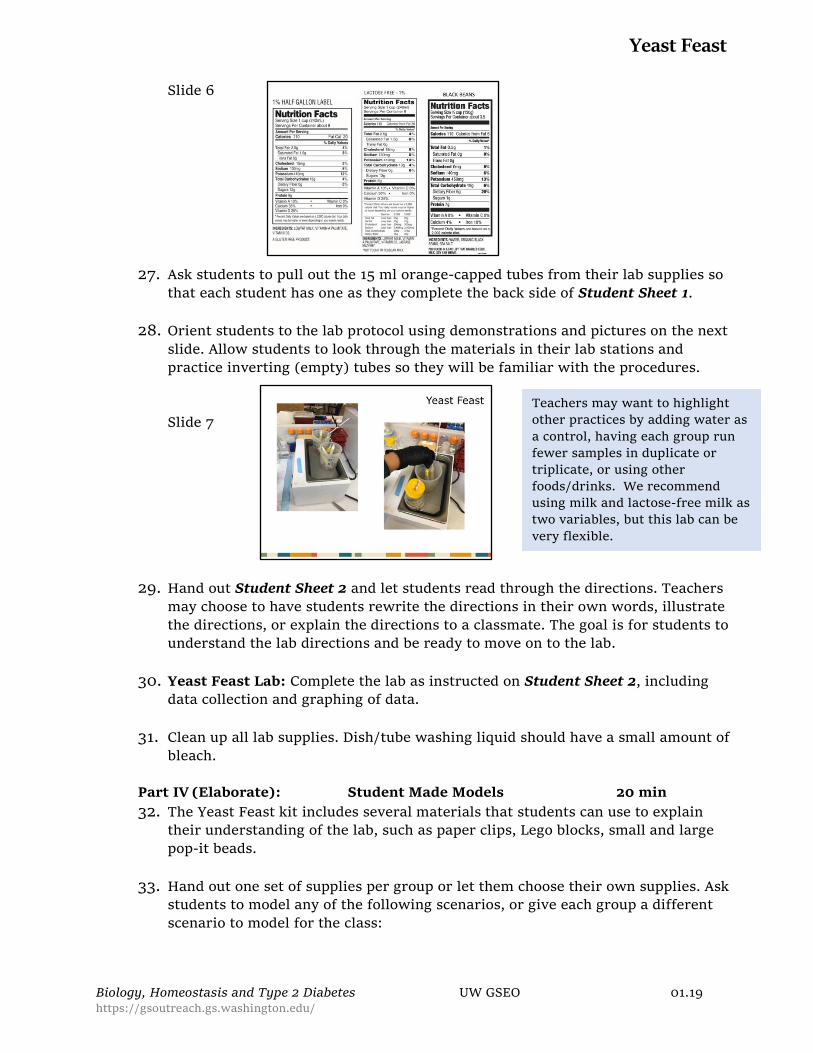
Slide 6
27. Ask students to pull out the 15 ml orange-capped tubes from their lab supplies so that each student has one as they complete the back side of Student Sheet 1.
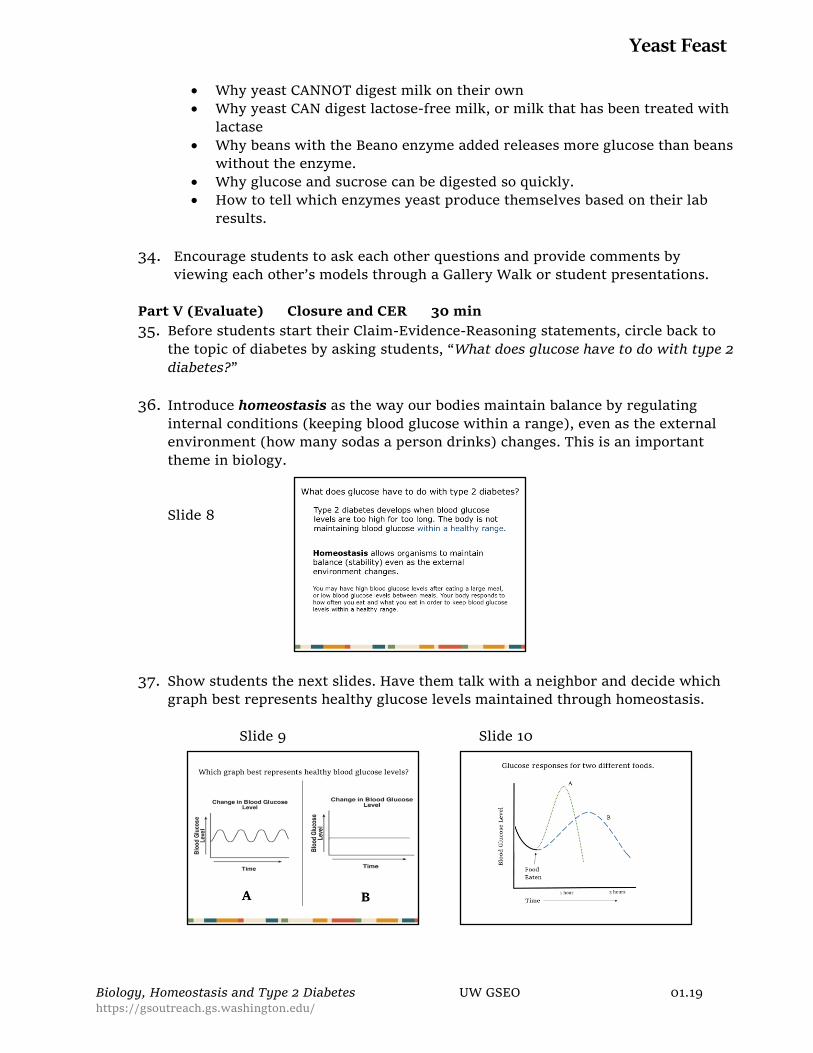
28. Orient students to the lab protocol using demonstrations and pictures on the next
slide. Allow students to look through the materials in their lab stations and practice inverting (empty) tubes so they will be familiar with the procedures.
Slide 7
29. Hand out Student Sheet 2 and let students read through the directions. Teachers
may choose to have students rewrite the directions in their own words, illustrate the directions, or explain the directions to a classmate. The goal is for students to understand the lab directions and be ready to move on to the lab.
30. Yeast Feast Lab: Complete the lab as instructed on Student Sheet 2, including data collection and graphing of data.
31. Clean up all lab supplies. Dish/tube washing liquid should have a small amount of bleach.
Part IV (Elaborate): Student Made Models 20 min
32. The Yeast Feast kit includes several materials that students can use to explain their understanding of the lab, such as paper clips, Lego blocks, small and large pop-it beads.
33. Hand out one set of supplies per group or let them choose their own supplies. Ask students to model any of the following scenarios, or give each group a different scenario to model for the class:
Teachers may want to highlight
other practices by adding water as
a control, having each group run
fewer samples in duplicate or
triplicate, or using other
foods/drinks. We recommend
using milk and lactose-free milk as
two variables, but this lab can be
very flexible.
Yeast Feast
Biology, Homeostasis and Type 2 Diabetes UW GSEO 01.19 https://gsoutreach.gs.washington.edu/
Why yeast CANNOT digest milk on their own Why yeast CAN digest lactose-free milk, or milk that has been treated with
lactase Why beans with the Beano enzyme added releases more glucose than beans
without the enzyme. Why glucose and sucrose can be digested so quickly. How to tell which enzymes yeast produce themselves based on their lab
results.
34. Encourage students to ask each other questions and provide comments by viewing each other’s models through a Gallery Walk or student presentations.
Part V (Evaluate) Closure and CER 30 min
35. Before students start their Claim-Evidence-Reasoning statements, circle back to
the topic of diabetes by asking students, “What does glucose have to do with type 2 diabetes?”
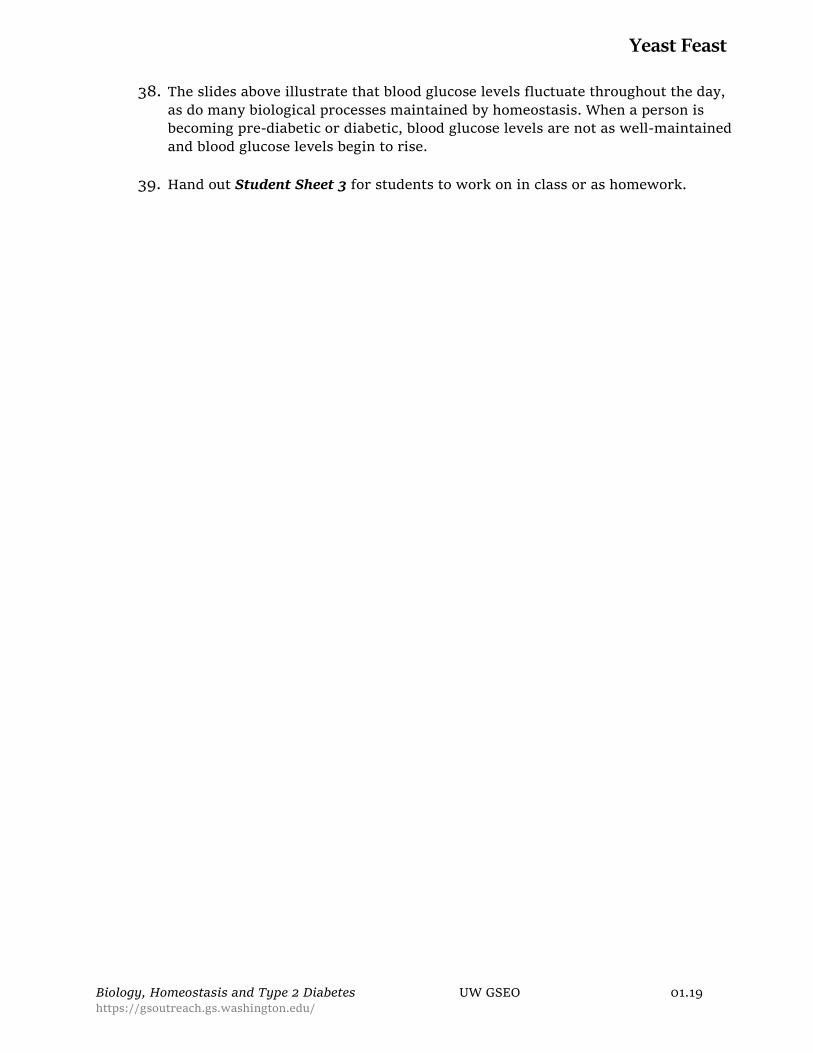
36. Introduce homeostasis as the way our bodies maintain balance by regulating internal conditions (keeping blood glucose within a range), even as the external environment (how many sodas a person drinks) changes. This is an important
theme in biology.
Slide 8
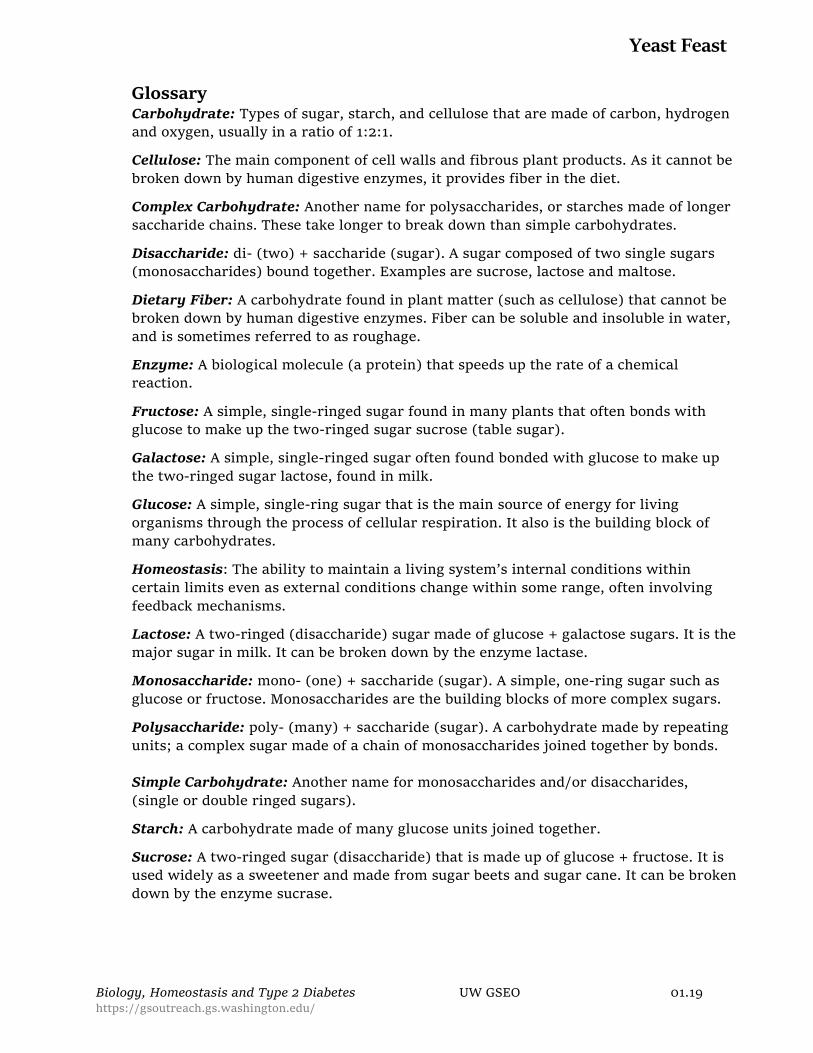
37. Show students the next slides. Have them talk with a neighbor and decide which graph best represents healthy glucose levels maintained through homeostasis.
Slide 9 Slide 10
Yeast Feast
Biology, Homeostasis and Type 2 Diabetes UW GSEO 01.19 https://gsoutreach.gs.washington.edu/
38. The slides above illustrate that blood glucose levels fluctuate throughout the day,
as do many biological processes maintained by homeostasis. When a person is becoming pre-diabetic or diabetic, blood glucose levels are not as well-maintained
and blood glucose levels begin to rise.
39. Hand out Student Sheet 3 for students to work on in class or as homework.
Yeast Feast
Biology, Homeostasis and Type 2 Diabetes UW GSEO 01.19 https://gsoutreach.gs.washington.edu/
Glossary Carbohydrate: Types of sugar, starch, and cellulose that are made of carbon, hydrogen and oxygen, usually in a ratio of 1:2:1.
Cellulose: The main component of cell walls and fibrous plant products. As it cannot be
broken down by human digestive enzymes, it provides fiber in the diet.
Complex Carbohydrate: Another name for polysaccharides, or starches made of longer saccharide chains. These take longer to break down than simple carbohydrates.
Disaccharide: di- (two) + saccharide (sugar). A sugar composed of two single sugars (monosaccharides) bound together. Examples are sucrose, lactose and maltose.
Dietary Fiber: A carbohydrate found in plant matter (such as cellulose) that cannot be broken down by human digestive enzymes. Fiber can be soluble and insoluble in water,
and is sometimes referred to as roughage.
Enzyme: A biological molecule (a protein) that speeds up the rate of a chemical reaction.
Fructose: A simple, single-ringed sugar found in many plants that often bonds with glucose to make up the two-ringed sugar sucrose (table sugar).
Galactose: A simple, single-ringed sugar often found bonded with glucose to make up
the two-ringed sugar lactose, found in milk.
Glucose: A simple, single-ring sugar that is the main source of energy for living organisms through the process of cellular respiration. It also is the building block of many carbohydrates.
Homeostasis: The ability to maintain a living system’s internal conditions within
certain limits even as external conditions change within some range, often involving feedback mechanisms.
Lactose: A two-ringed (disaccharide) sugar made of glucose + galactose sugars. It is the major sugar in milk. It can be broken down by the enzyme lactase.
Monosaccharide: mono- (one) + saccharide (sugar). A simple, one-ring sugar such as
glucose or fructose. Monosaccharides are the building blocks of more complex sugars.
Polysaccharide: poly- (many) + saccharide (sugar). A carbohydrate made by repeating units; a complex sugar made of a chain of monosaccharides joined together by bonds. Simple Carbohydrate: Another name for monosaccharides and/or disaccharides,
(single or double ringed sugars).
Starch: A carbohydrate made of many glucose units joined together.
Sucrose: A two-ringed sugar (disaccharide) that is made up of glucose + fructose. It is used widely as a sweetener and made from sugar beets and sugar cane. It can be broken down by the enzyme sucrase.
Biology, Homeostasis and Type 2 Diabetes UW GSEO Version 01.19
Carbohydrate Chains Teacher Copy Master 1
Teacher
Yeast Feast: Finding glucose in food
Biology, Homeostasis and Type 2 Diabetes UW GSEO Version 01.19
Student
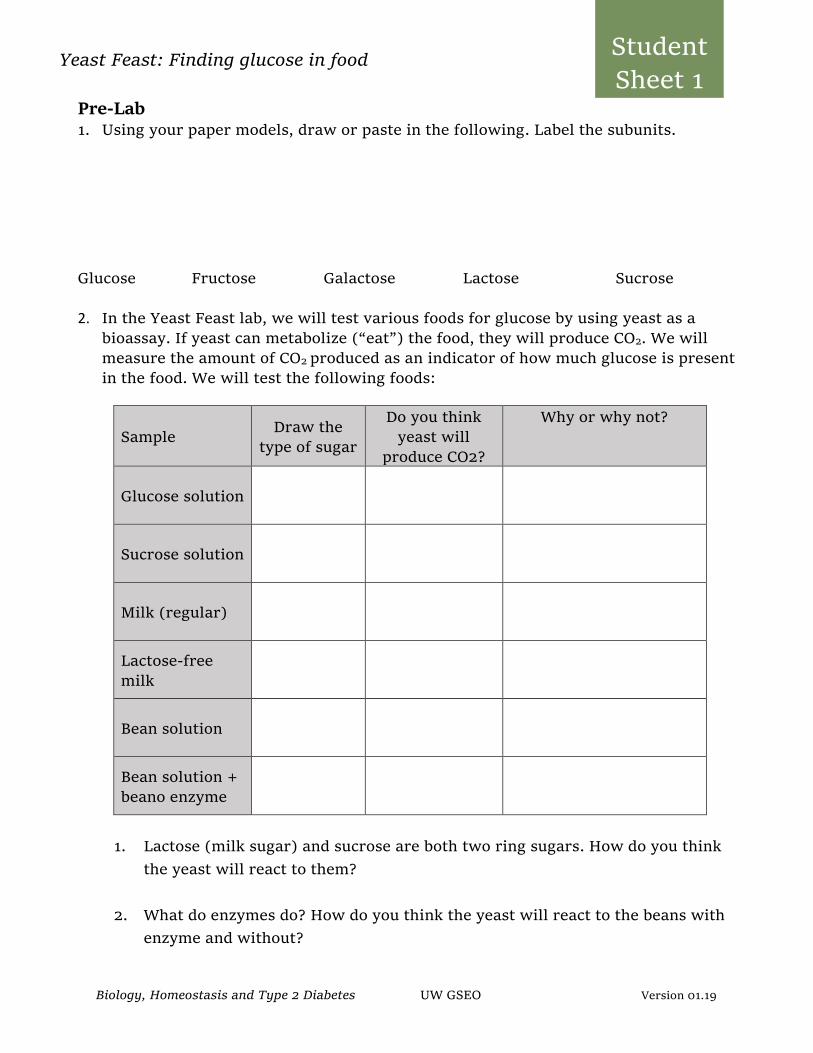
Sheet 1 Pre-Lab 1. Using your paper models, draw or paste in the following. Label the subunits.
Glucose Fructose Galactose Lactose Sucrose
2. In the Yeast Feast lab, we will test various foods for glucose by using yeast as a
bioassay. If yeast can metabolize (“eat”) the food, they will produce CO2. We will measure the amount of CO2 produced as an indicator of how much glucose is present
in the food. We will test the following foods:
Sample
Draw the type of sugar
Do you think yeast will
produce CO2?
Why or why not?
Glucose solution
Sucrose solution
Milk (regular)
Lactose-free milk
Bean solution
Bean solution + beano enzyme
1. Lactose (milk sugar) and sucrose are both two ring sugars. How do you think
the yeast will react to them?
2. What do enzymes do? How do you think the yeast will react to the beans with
enzyme and without?
Teacher
Yeast Feast: Finding glucose in food
Biology, Homeostasis and Type 2 Diabetes UW GSEO Version 01.19
Student
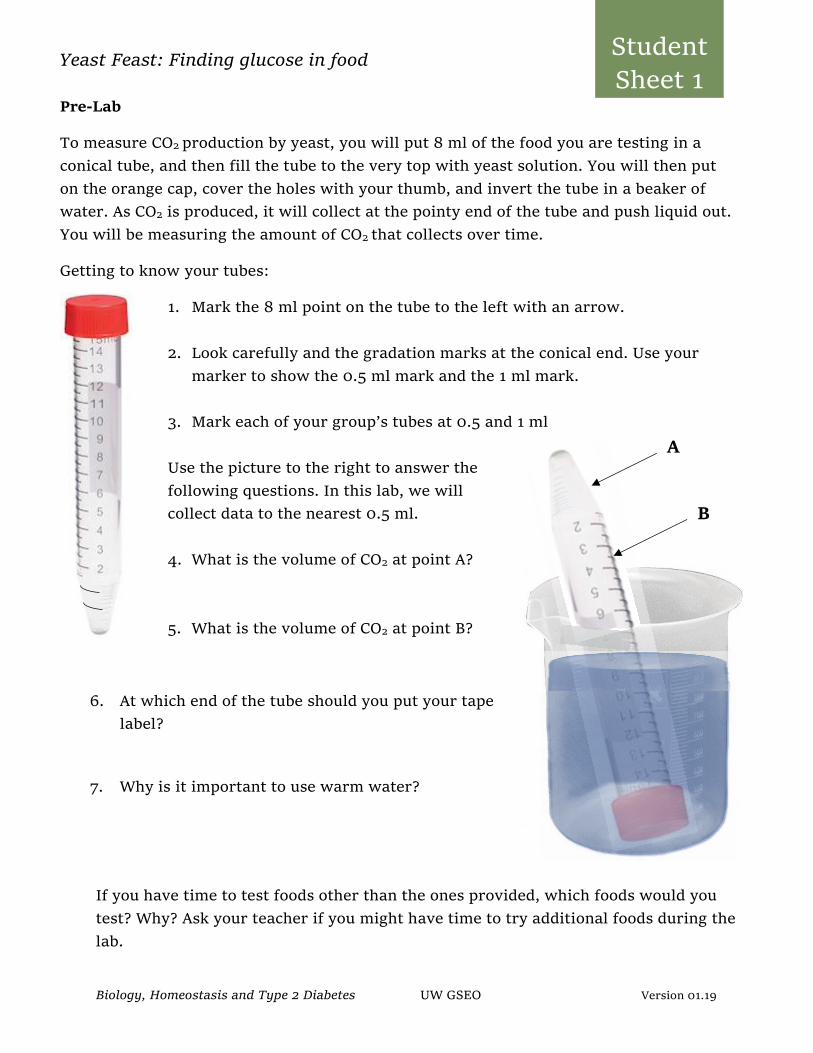
Sheet 1 Pre-Lab
To measure CO2 production by yeast, you will put 8 ml of the food you are testing in a
conical tube, and then fill the tube to the very top with yeast solution. You will then put
on the orange cap, cover the holes with your thumb, and invert the tube in a beaker of
water. As CO2 is produced, it will collect at the pointy end of the tube and push liquid out.
You will be measuring the amount of CO2 that collects over time.
Getting to know your tubes:
1. Mark the 8 ml point on the tube to the left with an arrow.
2. Look carefully and the gradation marks at the conical end. Use your
marker to show the 0.5 ml mark and the 1 ml mark.
3. Mark each of your group’s tubes at 0.5 and 1 ml
Use the picture to the right to answer the
following questions. In this lab, we will
collect data to the nearest 0.5 ml.
4. What is the volume of CO2 at point A?
5. What is the volume of CO2 at point B?
6. At which end of the tube should you put your tape
label?
7. Why is it important to use warm water?
If you have time to test foods other than the ones provided, which foods would you
test? Why? Ask your teacher if you might have time to try additional foods during the
lab.
A
B
Teacher
Yeast Feast: Finding glucose in food
Biology, Homeostasis and Type 2 Diabetes UW GSEO Version 01.19
Student
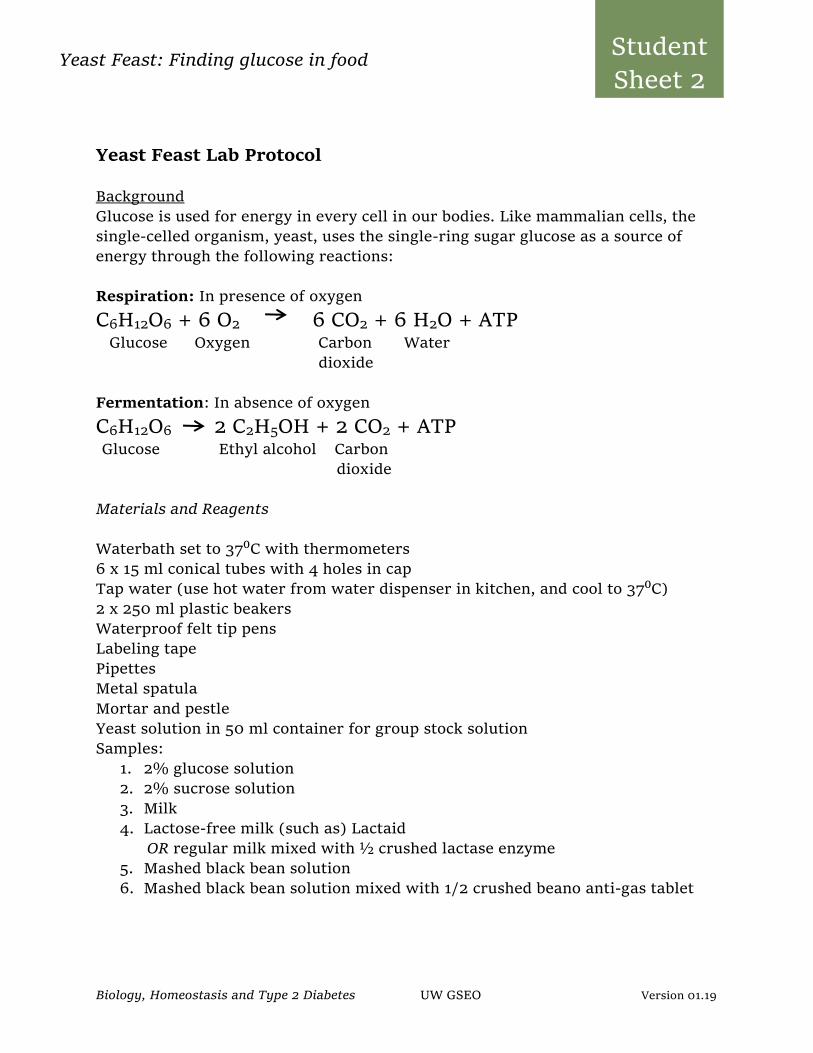
Sheet 2 Yeast Feast Lab Protocol Background Glucose is used for energy in every cell in our bodies. Like mammalian cells, the single-celled organism, yeast, uses the single-ring sugar glucose as a source of energy through the following reactions: Respiration: In presence of oxygen
C6H12O6 + 6 O2 6 CO2 + 6 H2O + ATP Glucose Oxygen Carbon Water dioxide
Fermentation: In absence of oxygen
C6H12O6 2 C2H5OH + 2 CO2 + ATP Glucose Ethyl alcohol Carbon dioxide Materials and Reagents Waterbath set to 37⁰C with thermometers
6 x 15 ml conical tubes with 4 holes in cap Tap water (use hot water from water dispenser in kitchen, and cool to 37⁰C) 2 x 250 ml plastic beakers Waterproof felt tip pens Labeling tape Pipettes Metal spatula
Mortar and pestle Yeast solution in 50 ml container for group stock solution Samples:
1. 2% glucose solution 2. 2% sucrose solution
3. Milk 4. Lactose-free milk (such as) Lactaid OR regular milk mixed with ½ crushed lactase enzyme 5. Mashed black bean solution 6. Mashed black bean solution mixed with 1/2 crushed beano anti-gas tablet
Teacher
Yeast Feast: Finding glucose in food
Biology, Homeostasis and Type 2 Diabetes UW GSEO Version 01.19
Student
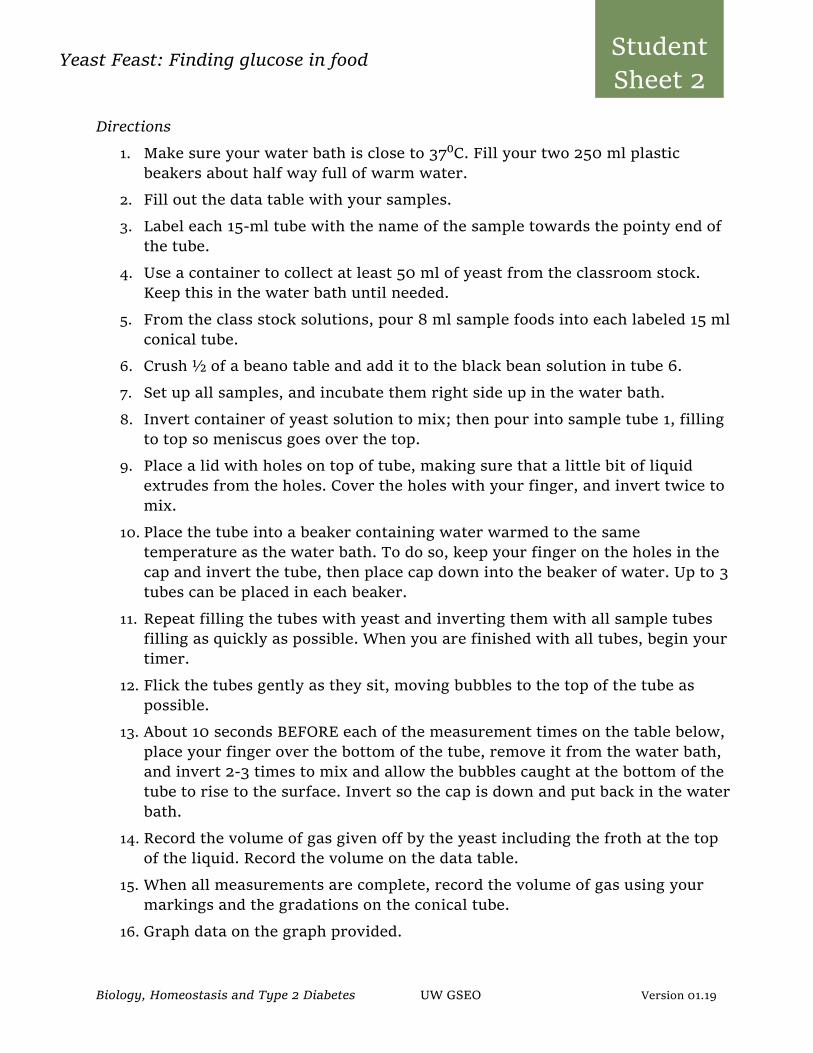
Sheet 2 Directions
1. Make sure your water bath is close to 37⁰C. Fill your two 250 ml plastic beakers about half way full of warm water.
2. Fill out the data table with your samples.
3. Label each 15-ml tube with the name of the sample towards the pointy end of the tube.
4. Use a container to collect at least 50 ml of yeast from the classroom stock. Keep this in the water bath until needed.
5. From the class stock solutions, pour 8 ml sample foods into each labeled 15 ml
conical tube.
6. Crush ½ of a beano table and add it to the black bean solution in tube 6.
7. Set up all samples, and incubate them right side up in the water bath.
8. Invert container of yeast solution to mix; then pour into sample tube 1, filling to top so meniscus goes over the top.
9. Place a lid with holes on top of tube, making sure that a little bit of liquid extrudes from the holes. Cover the holes with your finger, and invert twice to mix.
10. Place the tube into a beaker containing water warmed to the same temperature as the water bath. To do so, keep your finger on the holes in the
cap and invert the tube, then place cap down into the beaker of water. Up to 3 tubes can be placed in each beaker.
11. Repeat filling the tubes with yeast and inverting them with all sample tubes filling as quickly as possible. When you are finished with all tubes, begin your timer.
12. Flick the tubes gently as they sit, moving bubbles to the top of the tube as possible.
13. About 10 seconds BEFORE each of the measurement times on the table below, place your finger over the bottom of the tube, remove it from the water bath, and invert 2-3 times to mix and allow the bubbles caught at the bottom of the tube to rise to the surface. Invert so the cap is down and put back in the water
bath.
14. Record the volume of gas given off by the yeast including the froth at the top of the liquid. Record the volume on the data table.
15. When all measurements are complete, record the volume of gas using your markings and the gradations on the conical tube.
16. Graph data on the graph provided.
Teacher
Yeast Feast: Finding glucose in food
Biology, Homeostasis and Type 2 Diabetes UW GSEO Version 01.19
Student
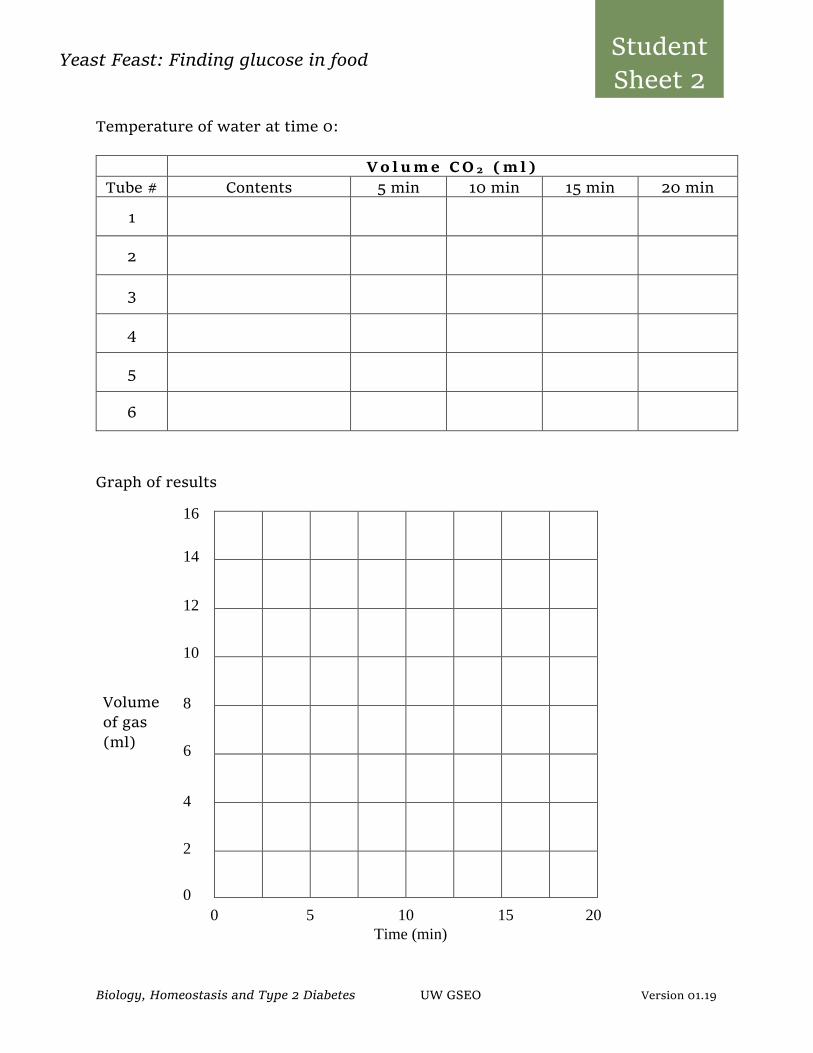
Sheet 2 Temperature of water at time 0:
V o l u m e C O 2 ( m l )
Tube # Contents 5 min 10 min 15 min 20 min
1
2
3
4
5
6
Graph of results
Volume of gas (ml)
0 5 10 15 20
Time (min)
16
14
12
10
8
6
4
2
0
Teacher
Yeast Feast: Finding glucose in food
Biology, Homeostasis and Type 2 Diabetes UW GSEO Version 01.19
Student
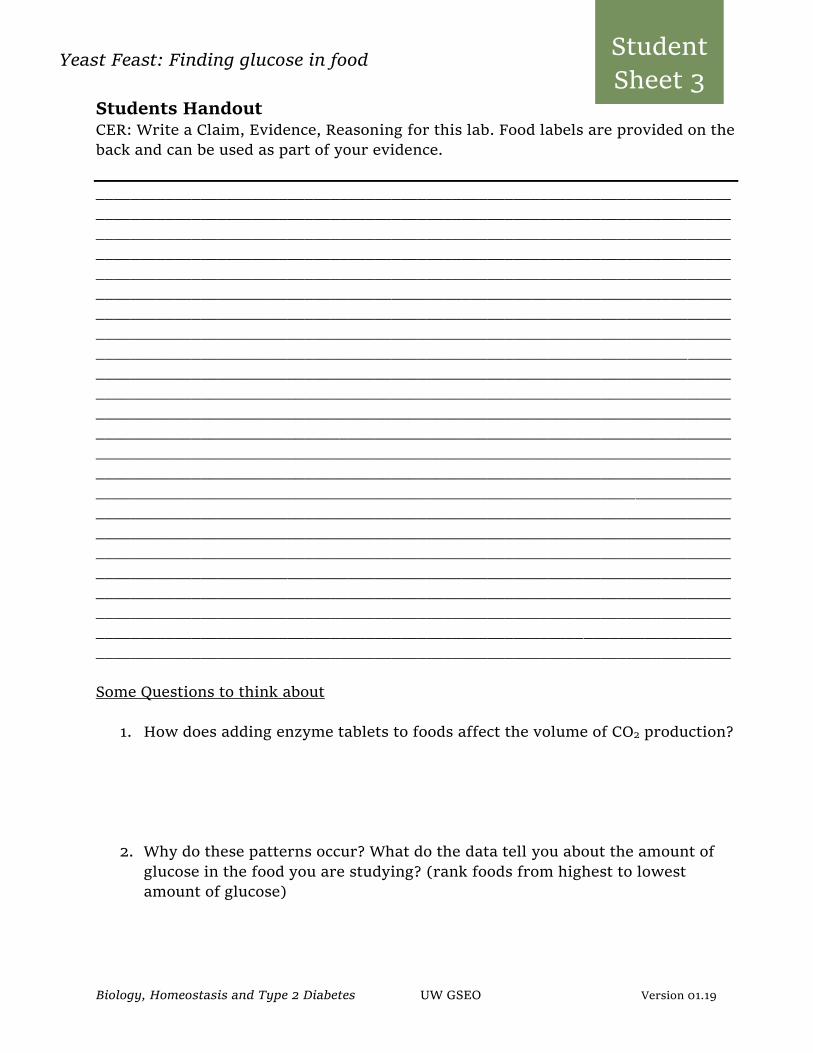
Sheet 3 Students Handout
CER: Write a Claim, Evidence, Reasoning for this lab. Food labels are provided on the back and can be used as part of your evidence.
_________________________________________________________________________ _________________________________________________________________________ _________________________________________________________________________ _________________________________________________________________________ _________________________________________________________________________ _________________________________________________________________________ _________________________________________________________________________ _________________________________________________________________________
_________________________________________________________________________ _________________________________________________________________________ _________________________________________________________________________ _________________________________________________________________________ _________________________________________________________________________ _________________________________________________________________________ _________________________________________________________________________ _________________________________________________________________________ _________________________________________________________________________ _________________________________________________________________________ _________________________________________________________________________
_________________________________________________________________________ _________________________________________________________________________ _________________________________________________________________________ _________________________________________________________________________ _________________________________________________________________________ Some Questions to think about
1. How does adding enzyme tablets to foods affect the volume of CO2 production?
2. Why do these patterns occur? What do the data tell you about the amount of
glucose in the food you are studying? (rank foods from highest to lowest amount of glucose)
Teacher
Yeast Feast: Finding glucose in food
Biology, Homeostasis and Type 2 Diabetes UW GSEO Version 01.19
Student
Sheet 3
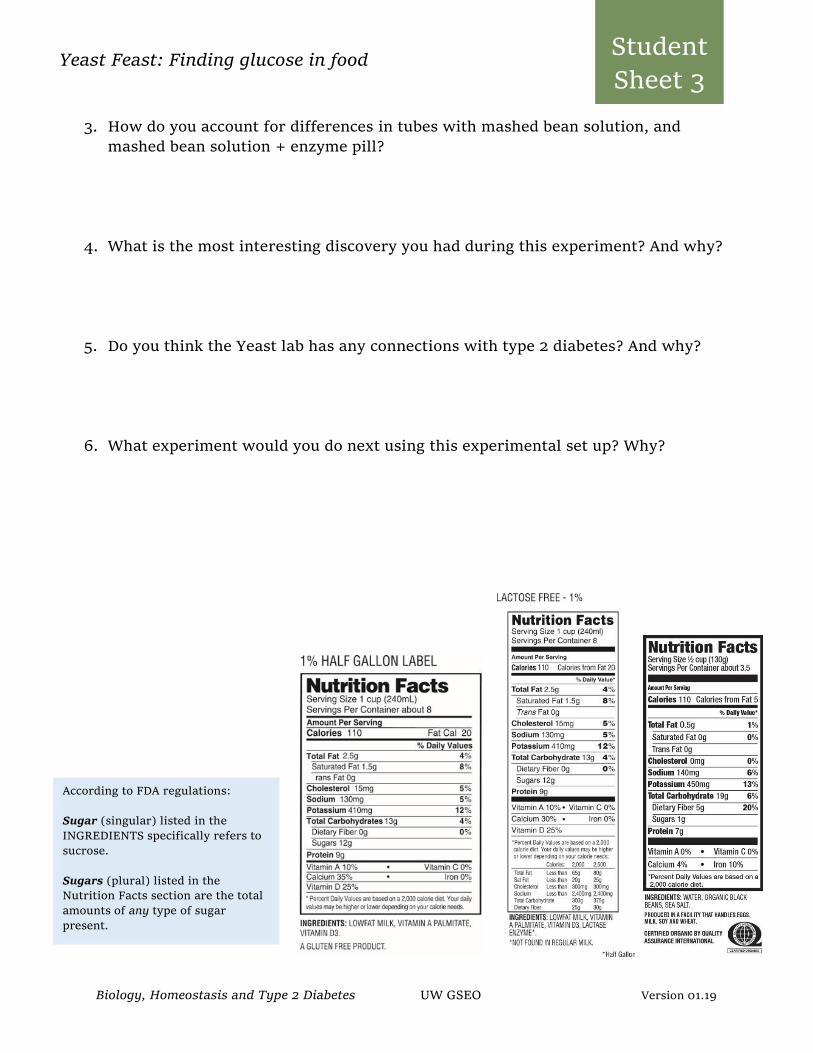
3. How do you account for differences in tubes with mashed bean solution, and mashed bean solution + enzyme pill?
4. What is the most interesting discovery you had during this experiment? And why?
5. Do you think the Yeast lab has any connections with type 2 diabetes? And why?
6. What experiment would you do next using this experimental set up? Why?
According to FDA regulations:
Sugar (singular) listed in the
INGREDIENTS specifically refers to
sucrose.
Sugars (plural) listed in the Nutrition Facts section are the total
amounts of any type of sugar
present.
Yeast Feast: Finding glucose in food
Biology, Homeostasis and Type 2 Diabetes UW GSEO Version 01.19
Teacher
Resource
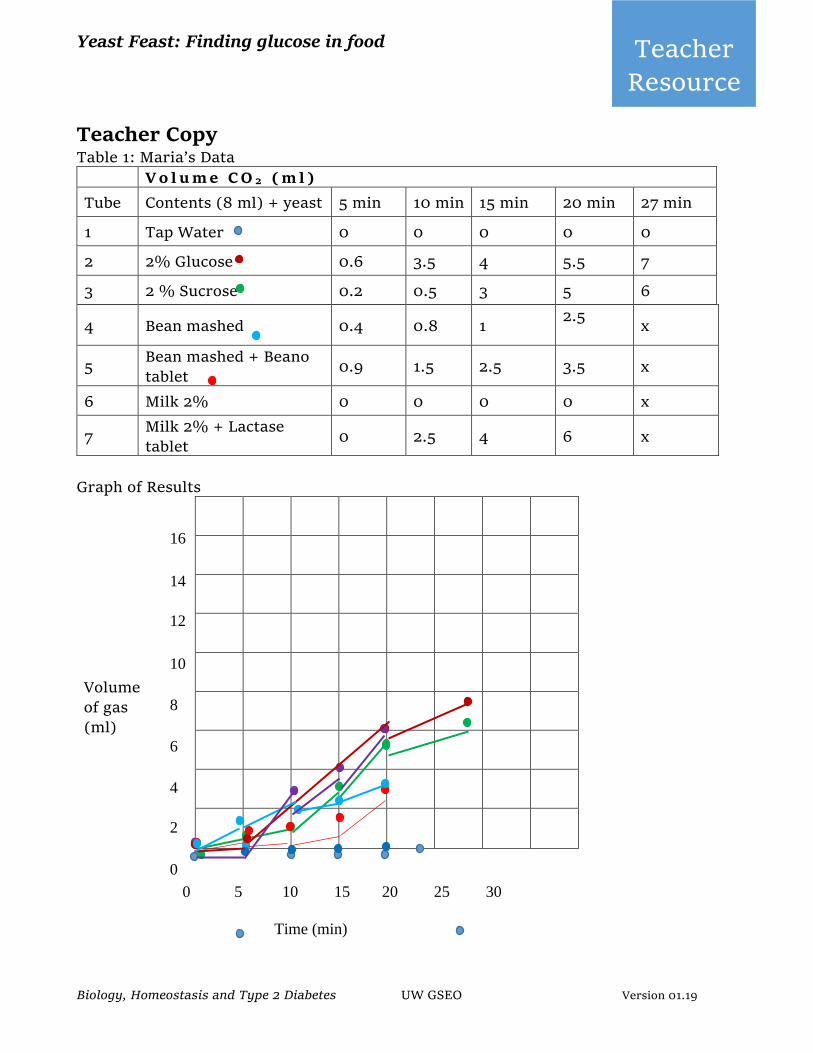
Teacher Copy Table 1: Maria’s Data
V o l u m e C O 2 ( m l )
Tube Contents (8 ml) + yeast 5 min 10 min 15 min 20 min 27 min
1 Tap Water 0 0 0 0 0
2 2% Glucose 0.6 3.5 4 5.5 7
3 2 % Sucrose 0.2 0.5 3 5 6
4 Bean mashed 0.4 0.8 1 2.5
x
5 Bean mashed + Beano tablet
0.9 1.5 2.5 3.5 x
6 Milk 2% 0 0 0 0 x
7 Milk 2% + Lactase tablet
0 2.5 4 6 x
Graph of Results
Volume of gas (ml)
0 5 10 15 20 25 30
Time (min)
16
14
12
10
8
6
4
2
0
Yeast Feast: Finding glucose in food
Biology, Homeostasis and Type 2 Diabetes UW GSEO Version 01.19
Teacher
Resource Possible answer for Student Sheet 2:
Some Questions to think about
1. How does adding an enzyme tablet specific to a food affect the volume of CO2 production?
Adding an enzyme tablet that is specific to a food can increase the rate of CO2 production. The enzyme breaks down the carbohydrate (the polysaccharide found in beans, or a disaccharide found in milk) into glucose molecules that can be used by the yeast as food. When yeast “eat/consume” the glucose, they release CO2.
2. What do the data tell you about the amount of glucose in the food you are studying?
(rank foods from highest to lowest amount of glucose) Glucose can be found in foods that don’t say “glucose” on the label, or even seem to contain sugar. Different types of carbohydrates are contained within different foods. With the right enzymes, these carbohydrates can be broken down to monosaccharides, such as glucose. (Students can rank foods from the highest to lowest amount of glucose according to their data)
3. How do you account for differences in mashed bean solution and mashed bean
solution + an enzyme pill?
Mashed beans contain big strands of polysaccharides. Over time, yeast can consume
some of it because it has the enzyme to break it down into a glucose. However, it is slower in compare to the mashed bean solution with the beano enzyme pill, because the enzyme pill speeds up the digestion of the polysaccharides.
4. What is the most interesting discovery you had during this experiment? And why?
Students can freely and creatively answer this question.
5. Do you think the Yeast lab have any connections with type 2 diabetes? And why?
Type 2 diabetes is a condition resulting from a person having high levels of blood
glucose over time. However we rarely, if ever, eat foods that say “glucose” on the label. So where does the glucose in the blood come from? In this experiment, students us yeast as a bioassay (bio=living; assay=measure or test) to find out the content of glucose in food. Student find out that glucose is a building block of carbohydrates, including polysaccharides in beans and disaccharides in milk and table sugar.
6. What experiment would you do next using this experimental set up? Why?
Students can answer freely and creatively answer this question.
Yeast Feast: Finding glucose in food
Biology, Homeostasis and Type 2 Diabetes UW GSEO Version 01.19
Teacher
Resource