Embed Size (px)
Citation preview
ANNUAL REPORT 2016
YEARS OF PROGRESS

Rotork is a market-leading actuator manufacturer and flow control company, with over 3,750 talented employees who work across a global network of local offices and established manufacturing facilities to provide a world-class service.
60 YEARS OF RELIABILITY

Governance Company InformationDirectors Financial StatementsStrategic Report
01Rotork Annual Report 2016
Financial Statements
2016 SUMMARY
è Stabilising trading environment
è 10% currency tailwind
è Successful cost management programme
è Continued expansion of product portfolio
è Acquisition of Mastergear
è Strong cash generation
è Full year dividend of 5.1p
Revenue
£590.1m +8.0%Operating profit*
£120.6m -3.7%
Profit before tax
£91.1m -10.6%Earnings per share
10.0p -3.8%
* References to adjusted profit throughout this document are defined as the IFRS profit, whether operating profit or profit before tax, with £26.8m (2015: £20.9m) of amortisation of acquired intangibles added back.
References to organic constant currency (OCC) or underlying results throughout this document are the 2016 figures restated at 2015 exchange rates and with the incremental contribution from acquisitions removed.
Strategic Report02 60 years of innovation04 2016 at a glance06 Chairman's statement08 Our investment case10 Where we operate12 Market overview14 Our business model16 Business model in action
– Global expertise, local support – Asset-light model – Winning culture – Innovative products
24 Strategic framework26 Strategic priorities28 How we manage risk32 Principal risks and uncertainties36 Chief Executive’s statement38 Business review
– Rotork Controls – Rotork Fluid Systems – Rotork Gears – Rotork Instruments
42 Financial review46 Key performance indicators48 Corporate social responsibility
– Ethics and values – Community involvement – Helping the environment – Health and safety
Directors60 Board of directors
Governance62 Corporate Governance Report70 Audit Committee Report74 Nomination Committee Report76 Directors’ Remuneration Report94 Report of the Directors
Financial Statements97 Independent auditor's report to the
members of Rotork plc104 Consolidated income statement104 Consolidated statement of
comprehensive income105 Consolidated balance sheet106 Consolidated statement of
changes in equity107 Consolidated statement of
cash flows108 Notes to the Group financial
statements140 Rotork plc Company balance sheet141 Rotork plc Company statement
of changes in equity142 Notes to the Company financial
statements
Company Information149 Ten year trading history150 Share register information151 Corporate directory

02 Rotork Annual Report 2016
1957Rotork Engineering Company Ltd begins trading
1959A RangeSyncroset switch mechanism launched, becoming generic name for A Range actuator
1960A RangeSyncropak with integral starter and standard control circuitry
1963A RangeA Range with o-ring sealing introduced
1965HG and P RangeFluid power actuators
1970Double-sealing introduced
1971NA RangeSpecially developed nuclear actuator range
1979 P and H Range Range of heavy-duty fluid power actuators
1983A Range 1600 SeriesFirst actuator with electronic circuitry
1986 PakscanFirst digital bus control system
1990Pakscan IISecond generation digital control system
Q RangeSmall quarter-turn actuator, compatible with A Range and AQ
1993 IQ RangeThe first non-intrusive, intelligent electric actuator which enabled commissioning without removing electrical covers
2000 IQ RangeIQ mk2 non-intrusive multi-turn actuator
Skilmatic RangeElectro-hydraulic failsafe actuator for remotely operated shut-off valves (ROSoV)
2002 CP Range Small quarter-turn pneumatic actuators
2003IQT RangePart-turn IQ mk2 actuator
1950s 1960s 1970s 1980s 1990s 2000s
60 YEARS OF INNOVATION
Governance Company InformationDirectors Financial StatementsStrategic Report
03Rotork Annual Report 2016
2006IQ Pro RangeFurther advancement of the IQ and IQT actuator
2008 CVA RangeElectrically powered failsafe modulating actuator for the process industry
2009ROMpak Range Lightweight and compact solution for the marine industry
2010PakscanWireless version of Pakscan
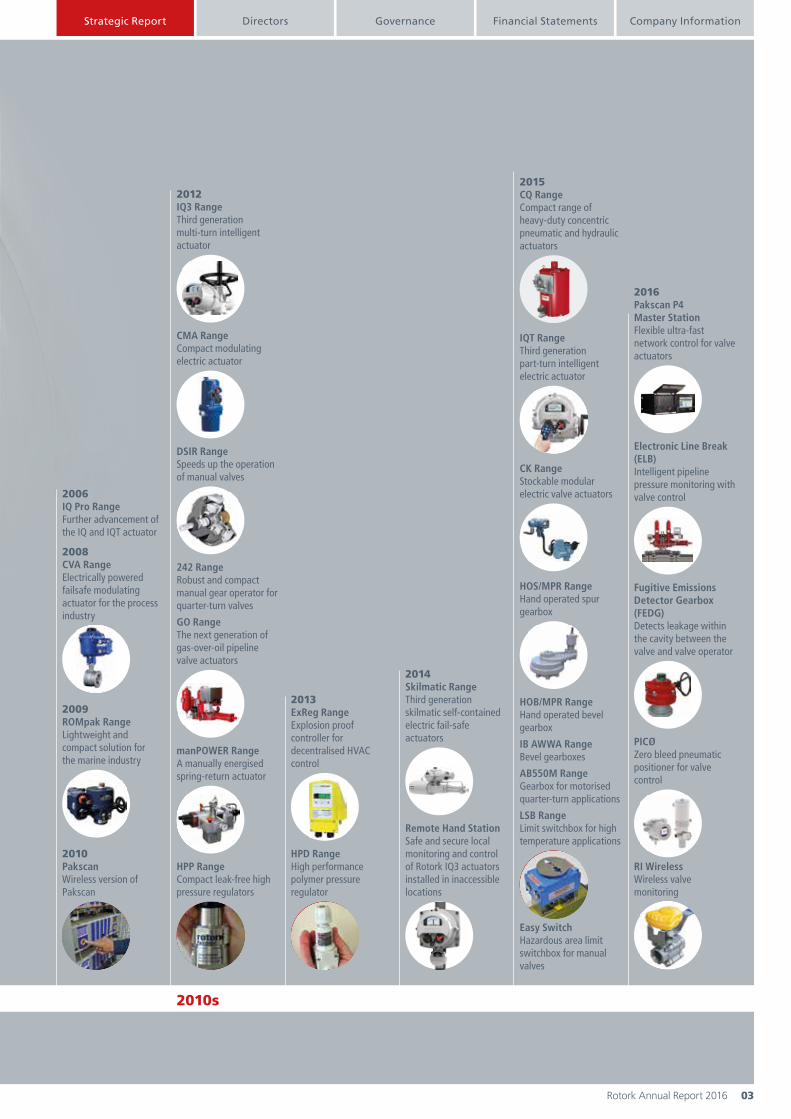
2012 IQ3 RangeThird generation multi-turn intelligent actuator
CMA RangeCompact modulating electric actuator
DSIR RangeSpeeds up the operation of manual valves
242 RangeRobust and compact manual gear operator for quarter-turn valves
GO RangeThe next generation of gas-over-oil pipeline valve actuators
manPOWER RangeA manually energised spring-return actuator
HPP RangeCompact leak-free high pressure regulators
2013ExReg RangeExplosion proof controller for decentralised HVAC control
HPD RangeHigh performance polymer pressure regulator
2014Skilmatic RangeThird generation skilmatic self-contained electric fail-safe actuators
Remote Hand Station Safe and secure local monitoring and control of Rotork IQ3 actuators installed in inaccessible locations
2015 CQ RangeCompact range of heavy-duty concentric pneumatic and hydraulic actuators
IQT RangeThird generation part-turn intelligent electric actuator
CK Range Stockable modular electric valve actuators
HOS/MPR RangeHand operated spur gearbox
HOB/MPR RangeHand operated bevel gearbox
IB AWWA RangeBevel gearboxes
AB550M RangeGearbox for motorised quarter-turn applications
LSB RangeLimit switchbox for high temperature applications
Easy SwitchHazardous area limit switchbox for manual valves
2016Pakscan P4 Master StationFlexible ultra-fast network control for valve actuators
Electronic Line Break (ELB) Intelligent pipeline pressure monitoring with valve control
Fugitive Emissions Detector Gearbox (FEDG) Detects leakage within the cavity between the valve and valve operator
PICØZero bleed pneumatic positioner for valve control
RI WirelessWireless valve monitoring
2010s

04 Rotork Annual Report 2016
Our divisions:
Revenue
£298.4m +4.1%Operating profit
£87.3m+2.1%
For 60 years, our customers have relied upon Rotork for innovative and reliable solutions to manage the flow of liquids and gases.
Rotork comprises four actuation and flow control divisions. In addition, Rotork Site Services works across all four divisions, providing worldwide planned and emergency services for all our flow control products.
2016 AT A GLANCE
Business review on page 38
Rotork ControlsRotork Controls' products include the Group’s electric valve actuator ranges and network control systems for all applications, and it is the largest independent manufacturer in its sector. It has manufacturing facilities in UK, USA, China, Malaysia, India, Germany and Spain.

Governance Company InformationDirectors Financial StatementsStrategic Report
05Rotork Annual Report 2016
End user marketsWhen you turn on a tap or a gas hob, switch on a light, or put fuel in your car, a flow control product is being used somewhere in the process of delivering that service.
Our flow control products are used extensively in the oil and gas, power and water markets, and the development of our product portfolio allows expansion into new and diverse markets.
Oil and gasRotork products are used on applications for upstream, midstream and downstream activities including offshore and onshore production facilities, refining, processing, transportation, storage and distribution.
Power Rotork products are found in conventional power stations, emission reduction plants, such as flue gas desulphurisation, and renewable energy plants such as solar collecting power stations. Rotork products are also certified for use on nuclear power stations, both inside and outside containment.
WaterWater treatment and distribution offers significant opportunities for Rotork through modern state-of-the-art processes which maximise existing resources, such as desalination plants and water re-use projects, together with conventional water and wastewater plants.
Industrial and otherOther industries served by Rotork include mining and marine and any other industry where you are trying to control flow or measure flow or pressure, for example food and beverage.
Revenue
£72.4m+23.4%Operating profit
£14.1m+17.2%
Revenue
£91.2m+35.4%Operating profit
£20.1m+10.0%
Revenue
£145.3m -2.6%Operating profit
£6.2m-59.4%
Business review on page 39 Business review on page 40 Business review on page 41
Rotork Fluid SystemsRotork Fluid Systems manufactures and supplies a comprehensive range of pneumatic, hydraulic and electro-hydraulic actuators and control systems that are used in a wide range of applications. It has manufacturing facilities located in UK, Germany, Italy, Sweden and USA.
Rotork GearsRotork Gears is a specialist manufacturer and supplier of gearboxes, adaptations and accessories to the international valve and actuator industry. It has manufacturing facilities located in UK, Netherlands, Italy, India, China and USA.
Rotork InstrumentsRotork Instruments manufactures and supplies instrumentation and control products for flow, pressure, temperature and position measurement applications for a wide range of industries. It has manufacturing facilities located in UK, Korea, Italy and USA.
Our divisions:

06 Rotork Annual Report 2016
Looking back on 2016, I am able to report a return to a more stable trading environment for Rotork following the sharp downturn in oil and gas markets in the second half of 2015. Whilst there has been some improvement in market sentiment following a modest recovery in the oil price, activity levels in the Group’s oil and gas markets remain below those seen before the downturn.
Against this backdrop, Rotork has delivered a solid set of full year results, with adjusted operating margin lower than in 2015, as anticipated, but in excess of 20% – a key achievement for the Group. This performance resulted from a combination of focusing on end markets and geographies showing the greatest resilience, and a concerted effort in driving cost efficiencies throughout all areas of our business.
Whilst Rotork's trading environment was more stable during 2016, it was a year that brought increased geopolitical uncertainty, notably in Europe and the USA following the outcome of the EU referendum in the UK and the US Presidential elections. We will continue to closely monitor these developments and evaluate their potential impact, but the Board remains confident that Rotork's diverse end market, geographic spread and highly flexible operating base leaves it well placed to optimise its performance under a range of potential future scenarios.
Our business has proved to be resilient in the current market environment and we continue to focus on our strategy for long-term growth.
Martin LambChairman
CHAIRMAN'S STATEMENT
Governance Company InformationDirectors Financial StatementsStrategic Report
07Rotork Annual Report 2016
Financial highlightsOrder intake increased 9.6% on the prior year as a result of contributions from acquisitions and currency tailwinds. On an organic constant currency (OCC) basis, order intake reduced by 6.1%, reflecting the current market conditions.
Revenue increased by 8.0% (-8.0% OCC) to £590.1m on a reported basis, also supported by acquisitions and currency tailwinds.
Adjusted operating profit reduced £4.7m to £120.6m (£102.3m OCC), with adjusted operating margin 250 basis points lower at 20.4%. This reflected the mix effect of newly acquired businesses at slightly lower margins and the impact of lower volumes, partially offset by £9.2m of material cost and overhead savings from our cost reduction programme, and effective control over material and labour costs.
AcquisitionsOur principal focus was on the integration of the six businesses acquired in 2015, and in particular on delivering their anticipated synergies. We completed one acquisition during the year, acquiring Mastergear in June for £16.3m. The Mastergear business operates from bases in USA, Italy and China and sits within the Gears division.
Board composition and performanceAs announced last April, Bob Arnold retired in August 2016 as President of Rotork Controls Inc. and a member of the Board after a long career at Rotork.
We are also announcing that John Nicholas retired from the Board on 24 February 2017. John has served on the Board for nine years, latterly as the Senior Independent Director.
I would like to thank Bob and John on behalf of the Board for their excellent contributions.
Sally James has replaced John as the Senior Independent Director and Lucinda Bell has replaced Sally as the Chair of the Audit Committee. We are currently in the process of recruiting a non-executive director to fill the vacancy that John’s departure has created.
The Board now comprises two executive directors, three independent non-executive directors and myself as Chairman, which is in compliance with the UK Corporate Governance Code (the Code). In addition, more than 25% of the Board are women which exceeds our stated aim that at least 25% of our independent non-executive directors are women.
The annual performance review of the Board took place during February and March 2016, see page 62 of the Corporate Governance Report for further details.
Corporate governanceThe Board continues to be committed to the highest standards of governance which we see as essential to the delivery of increasing long-term shareholder value. During the year, the Board and Audit Committee were involved in work related to risk appetite and monitoring and disclosure of risk, building on the work that was done during 2015.
Further details of this work and its outputs, our approach to governance and our compliance with the Code are contained in the Corporate Governance Report on pages 62 to 69.
EmployeesI would like to thank all of our employees for their continued high level of commitment and professionalism during 2016.
DividendThe Board recommends a final dividend of 3.15p per share, a 1.6% increase over the 2015 final dividend. Taken with the 2016 interim dividend, the total dividend is 5.10p per share (2015: 5.05p), representing a 1.0% increase in the total dividend on 2015. The final dividend will be payable on 15 May 2017 to shareholders on the register on 7 April 2017.
Outlook We anticipate that any near-term growth in energy markets will remain modest. Our focus will remain on providing our customers with innovative, high quality products and services, reducing their cost of ownership and improving plant efficiency.
Cost management will remain a priority in the current year as we look to mitigate any inflationary pressures through our highly flexible operating base.
We continue to target growth through organic development and acquisition that will enhance our broad product portfolio, diverse end market exposure and wide geographic presence.
Whilst mindful of continued macroeconomic uncertainties, at this stage of the year the Board believes Rotork is well placed to make progress in 2017.
Martin LambChairman27 February 2017

08 Rotork Annual Report 2016
Americas 30%Europe 30%Rest of world 40%
Upstream 16.0%Midstream 13.2%Downstream 23.3%
Oil and gas 52.4%Industrial 14.7%Power 15.5%Water 12.8%Other 4.6%
[XX.X]% [XX.X]% [XX.X]%
[XX.X]%52.4%
Americas 30%Europe 30%Rest of world 40%
Upstream 16.0%Midstream 13.2%Downstream 23.3%
Oil and gas 52.4%Industrial 14.7%Power 15.5%Water 12.8%Other 4.6%
[XX.X]% [XX.X]% [XX.X]%
[XX.X]%52.4%
OUR INVESTMENT
CASE
Track record for sustainable growth
Group revenue £m
200
300
400
500
600
2016201520142013201220112010200920082007
Diverse end markets
4.6% Other
14.7% Industrial
12.8% Water
15.5% Power
52.4% Oil and gas
Oil and gas revenue by sub-sectorRevenue by end user market
16.0% Upstream
13.2% Midstream
23.3% Downstream
Electric actuators
No.1
Pneumatic and hydraulic actuators
No.2
Gears
No.1
Instrumentation and controls
No.1-51
Competitive position in our chosen markets
1 There are multiple markets for instrumentation and control products.

Governance Company InformationDirectors Financial StatementsStrategic Report
09Rotork Annual Report 2016
Our investment case is underpinned by our strategy of delivering a high return on capital and strong sustainable margins from our diverse end markets and wide geographic spread.
See how our business model works on page 14
Strong culture where sustainability matters
Strong balance sheet
Cash conversion
130.1%Debt/equity
11.3%
High margins Adjusted operating margin
20.4%ROCE
23.4%High return on capital employed (ROCE)
Wide international coverage
R&D spend
£10.2m
Increased spend in 2016
+5.9%
Revenue by end destination
Americas 30%Europe 30%Rest of world 40%
Upstream 16.0%Midstream 13.2%Downstream 23.3%
Oil and gas 52.4%Industrial 14.7%Power 15.5%Water 12.8%Other 4.6%
[XX.X]% [XX.X]% [XX.X]%
[XX.X]%52.4%
40% Rest of World
30% Americas
30% Europe
Investment in innovation

10 Rotork Annual Report 2016
5
2
6
WHERE WE OPERATE
For 60 years Rotork has developed ways of working across borders and time zones to maximise local skills and links, whilst leveraging Group resources and expertise. Our global presence is key to supporting new customer growth and supporting our existing customers.
Rotork’s 27 manufacturing facilities, global network of 69 offices and local agents allows customers to locally source Rotork products. The products are supported by 430 engineers who provide life-of-plant maintenance, repair and upgrade services.
Rotork has more than 3,750 employees globally and they are fundamental to maintaining our reputation for excellence in innovation and the quality of our products and services.
Governance Company InformationDirectors Financial StatementsStrategic Report
11Rotork Annual Report 2016
5
2
6
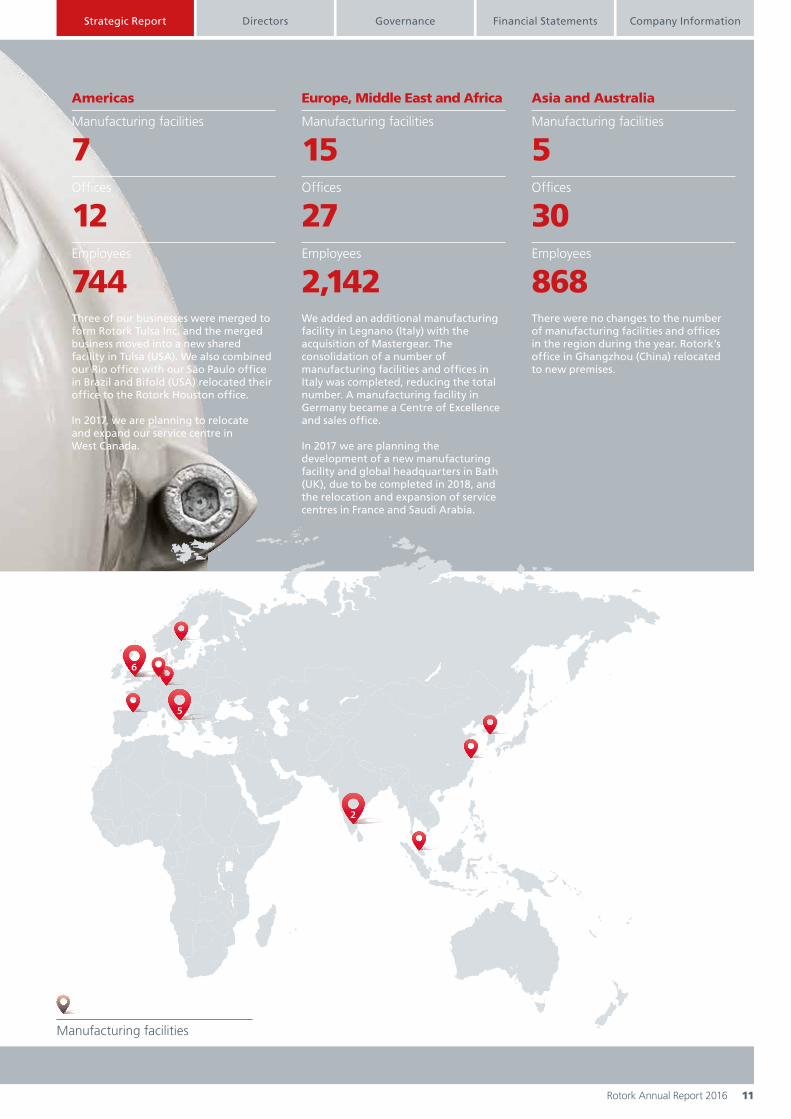
Americas Europe, Middle East and Africa Asia and Australia
Manufacturing facilities
Manufacturing facilities
7Manufacturing facilities
15Manufacturing facilities
5Offices
12Offices
27Offices
30Employees
744Employees
2,142Employees
868Three of our businesses were merged to form Rotork Tulsa Inc. and the merged business moved into a new shared facility in Tulsa (USA). We also combined our Rio office with our São Paulo office in Brazil and Bifold (USA) relocated their office to the Rotork Houston office.
In 2017, we are planning to relocate and expand our service centre in West Canada.
We added an additional manufacturing facility in Legnano (Italy) with the acquisition of Mastergear. The consolidation of a number of manufacturing facilities and offices in Italy was completed, reducing the total number. A manufacturing facility in Germany became a Centre of Excellence and sales office.
In 2017 we are planning the development of a new manufacturing facility and global headquarters in Bath (UK), due to be completed in 2018, and the relocation and expansion of service centres in France and Saudi Arabia.
There were no changes to the number of manufacturing facilities and offices in the region during the year. Rotork’s office in Ghangzhou (China) relocated to new premises.

12 Rotork Annual Report 2016
MARKET OVERVIEW
UrbanisationMore people live in cities than rural areas around the world and that number is climbing. This trend towards urbanisation, particularly in emerging markets, is increasing demand for water and energy. Investment in private and public sector infrastructure such as power stations, electricity grids, water supply and water treatment plants is required to meet this growth in demand.
AutomationBusinesses and organisations around the world continue to require greater automation in their operations to reduce costs, improve efficiencies and safety, and increase precision in production. Real-time monitoring of plant allows problems to be fixed before they escalate, improving safety and optimising asset life.
Population growthThe growing global population is driving increased demand for land, food, energy and water, against a backdrop of dwindling resources. Investment in new power and water facilities and the refurbishment of existing facilities is necessary to respond to this need.
New technologiesThere is growing global demand for innovative products offering improved performance, lower power, increased reliability and reduced environmental impact. New technological advances enable companies to improve the data being sent to the plant control centre, improving asset management and plant performance.
Market drivers Our products are used in essential infrastructure for the global economy where there is an increasing demand arising from urbanisation and growing populations that require water, food and energy.
Trends for greater automation and new technology also drive growth in our markets.

Governance Company InformationDirectors Financial StatementsStrategic Report
13Rotork Annual Report 2016
[XX.X]% [XX.X]% [XX.X]%15.4%
XX% XX%
XX%
XX%
XX%
XX%
XX%
4.5%
[XX.X]% [XX.X]% [XX.X]%15.4%
XX% XX%
XX%
XX%
XX%
XX%
XX%
4.5%
Total flow control market
£40.0bnRotork addressable market
£3.8bnGroup market share
15.4%
Addressable market share by division
Market share by division
Group revenue by end user market Group market share
Controls
£1,552m Fluid Systems
£785m Gears
£275m Instruments
£1,227m
Market share based on competitors' revenue, published market reports and Rotork internal data.
4.6% Other
15.5% Power
12.8% Water
14.7% Industrial
52.4% Oil and Gas
15.4%
Controls
19.2%Fluid Systems
18.5%Gears
22.1%Instruments
7.0%
14 Rotork Annual Report 2016
OUR BUSINESS MODEL
We provide high quality, technically advanced and innovative industrial valve actuation and flow control equipment, and a superior level of service to support our customers’ activities wherever they are in the world. We do this in a sustainable way with corporate social responsibility (CSR) values being entrenched in our business processes.
What we do How we do it
Global expertise, local supportWe meet our customers’ needs through global expertise delivered locally.
Asset-light model Most of our sites receive finished components and assemble to order.
Winning cultureOur values of respect, excellence and integrity ensure consistency for our customers and make us an employer of choice.
Innovative productsWe innovate our products to reduce power consumption, improve their efficiency and minimise their environmental impact in response to our customers’ requirements.

Governance Company InformationDirectors Financial StatementsStrategic Report
15Rotork Annual Report 2016
We maximise value by focusing on our strategic priorities. See pages 26 to 27
Competitive strengths How we create valuefor stakeholders
Our asset-light model, combining the benefits of global expertise and local service, makes us well placed to generate sustainable value for our stakeholders.
Technological leadershipOur understanding of our customers and the markets we serve allows us to continue to develop new products and lead the evolution of actuator and flow control products.
Reputation for qualityRotork products have a reputation for technological excellence, quality and reliability; meeting or exceeding international technical and performance standards.
Talented peopleAttracting, developing and retaining outstanding talented people has been a key part of our success. Continued investment in our employees and their development is a key part of our strategy, and is essential to ensure that we remain competitive.
Diverse end market exposureOur actuators and flow control products are used most intensively in the oil and gas, power and water markets, but our products are also used in many other markets. Wherever fluids or gases are being moved and the process requires automation, or to contain failsafe controls, actuators and flow control products are required.
Global footprint Rotork’s worldwide geographic base provides a resilient business portfolio. Local relationships with customers not only means that Rotork has clear sight of value generation in the long term, but also the ability to recognise customers’ evolving requirements.
Breadth of product portfolio We have the broadest range of actuators on the market and a growing range of complementary flow control instruments. The breadth of our offering ensures we have the appropriate product for the widest range of applications within a site or a project and can access increased cross-selling opportunities.
EmployeesWe provide development opportunities and a rewarding place to work and create a safe working environment for our employees. See page 50 for more details.
SuppliersOur suppliers are supported by the procurement of goods and services that we require.
CustomersWe provide innovative solutions in response to our customer’s requirements and aftermarket service support.
CommunitiesWe support local jobs and skills and contribute to, and engage positively with, the communities in which we operate. See pages 52 to 53 for more details.
GovernmentsThrough paying taxes in the jurisdictions in which we operate, we support the development of public infrastructure and public services.
ShareholdersWe return money to our shareholders through dividends and, through the execution of our strategy, we grow the value of their investment over time.

16 Rotork Annual Report 2016
GLOBAL EXPERTISE,
LOCALSUPPORT
Our global geographic footprint is key to our continued business success. Local relationships with customers allow Rotork to understand long-term value generation opportunities and ensure that our innovation is relevant to our customers’ evolving requirements.
BUSINESS MODEL IN ACTION
Our worldwide presence allows us to manage complex global projects and to support customers in the field. Rotork Site Services work with our customers by installing and commissioning our actuators, and by meeting our customers’ service requirements. Our strategic manufacturing locations optimise supply chain management and productivity.

Governance Company InformationDirectors Financial StatementsStrategic Report
17Rotork Annual Report 2016
“My role is dealing with sales. It can be something simple like a limit switch bracket, which is an off the shelf product, to more complex extensions for different applications. Often I speak directly with the end user to determine what the requirement is to mount and automate the valve.
As Rotork Tulsa designs, engineers, and manufactures custom solutions, it is imperative that I understand the customers’ needs as I am the first point of contact and the arbiter of information to design, purchasing, production, and even shipping to some degree. I understand the customers’ needs by diligently asking questions and requesting all pertinent documentation to support our design staff. Sometimes understanding the
customers’ needs goes as far as having valves requiring more complex solutions for automation sent to our facility for reverse engineering.
As well as working with many external customers, a number of the requests I field come from other Rotork offices in USA, as well as Canada and Mexico. I regularly work with all North American locations and I try to support our offices by turning quotes around within 24 hours when all information is available. Other Rotork offices have been very supportive when working with third party customers who do not have all the details needed for mounting items from the Rotork portfolio of products.”
Justin Cooper Inside Sales Engineer for Rotork Gears, USA
Justin has worked for Rotork’s Tulsa office in the USA for over three years. His role involves valve adaptation sales, both intercompany and to third party customers directly.
18 Rotork Annual Report 2016
ASSET-LIGHT MODEL
Our asset-light business model allows us to focus on our core strengths. Over 90% of our products are built using an outsourced manufacturing model, with our workforce assembling components and configuring products to match customer orders.
BUSINESS MODEL IN ACTION continued
Our model provides considerable flexibility in prioritising resource according to the greatest need or opportunity, whilst preserving capital for investment in technology and innovation. We have developed a global network of suppliers who manufacture the components to our designs and who use our tooling. Leveraging our international supply chain allows us to achieve and maintain profitable growth while supporting new market entry.

Governance Company InformationDirectors Financial StatementsStrategic Report
19Rotork Annual Report 2016
“I’ve been at Rotork for over 23 years, I had a short break in 2012 for six months but came back. I currently work on our Skilmatic product range, and have close relationships with our suppliers to make sure our products are delivered on time, every time.
Having suppliers that are flexible, competitive, have accurate delivery schedules and provide good quality products enables Rotork to offer reliable products.
There are approximately 2,000 parts in the range so having suppliers that have our tooling is advantageous.
Each order is configured to match a customer order. Once we receive an order, the basic builds are added to our internal system, and this ensures that if any of the products are on a long lead time, they are ordered immediately. Next a contract review takes place and our application engineers check the order and add in any additional components to the build, and our purchasing department order the additional components.”
Nigel Cox Contracts and Material Control Manager, UK
Nigel works for Rotork’s Fluid Systems division based in Leeds (UK) and is responsible for reviewing contracts, managing materials, scheduling the contracts into production and dealing with suppliers.

20 Rotork Annual Report 2016
WINNING CULTURE
We cultivate a working environment which is collegiate, aspirational, performance orientated and non-hierarchical with an open door policy. This supports our open and transparent culture where every member of staff respects the views and opinions of their colleagues in a non-judgmental and supportive way. Our employees, regardless of seniority, are prepared to roll up their sleeves to get the job done.
Our business around the world is structured as a number of smaller business units led by a general manager. As a result, employees act and behave as smaller family units whilst still part of the larger Rotork family. Our matrix management structure supports our employees to work collaboratively with other Rotork business units often across multiple jurisdictions and as one big team. Competition between Rotork businesses is not acceptable.
We encourage the development of our employees by providing training and career growth opportunities. This encourages loyalty and we have a large number of employees who have been at Rotork for a long time. We expect all our employees around the world to act in good faith, with fair dealing and integrity as outlined in our ethics and values statement and with accountability both on a personal and collective basis.
Our winning culture is shared with new offices and businesses, who are expected to adopt it, to ensure that our customers receive a consistently high quality service throughout the world.
BUSINESS MODEL IN ACTION continued

Governance Company InformationDirectors Financial StatementsStrategic Report
21Rotork Annual Report 2016
“I have worked at YTC for over 16 years, and during my time here I have had a number of roles. When Rotork acquired us I had mixed feelings about it, but once the integration process began I experienced the Rotork culture of being part of a family and working as one team. We share information with one another, debate and execute the outcome which makes us stronger. We’re not part of a team, we are one team.
We can have open discussions whenever we want and with whoever we want without any barriers. I don’t think this is just at our office, it’s common in Rotork.
Feeling secure and appreciated makes me feel motivated and the Company always supports employees to help them improve and progress. If I want to upgrade any of my skills in the workplace, the Company provides that training, internally or externally.”
SoonOk Lee Senior Office Administrator and HR Manager, Korea
SoonOk works for YTC based in Gimpo City, Republic of Korea. YTC manufactures smart positioners and was acquired by Rotork in 2014.

22 Rotork Annual Report 2016
INNOVATIVEPRODUCTS
BUSINESS MODEL IN ACTION continued
We have a history of innovation and introducing game changing, technological advances over the last 60 years. We capitalise on our industry knowledge to develop and introduce tailored solutions to our customers’ problems. Research and development occurs in all our facilities around the world and is continuous across the whole Group to ensure that we have the best technology and remain competitive.
Innovation continues to be a core part of our strategy and business model as we work with our customers to find ways to reduce power consumption, increase efficiency, lower the costs of asset ownership and minimise carbon footprint.

Governance Company InformationDirectors Financial StatementsStrategic Report
23Rotork Annual Report 2016
“I worked on designing the CK actuator during the early stages. My background is electronics so I helped design the core electronics in the actuator. During the later stage, I supported the mechanics design authority, testing and assessment processes for the design of new variants and modules.
The actuator is a modular design so can be configured to suit the end users’ application. CK actuators can be adapted to meet a specification quickly and efficiently to achieve fast turnarounds and quick delivery.
This project involved several Rotork factories and engineering offices around the world - UK, Spain, China and the Rotork Innovation Design and Engineering Centre (RIDEC) in India. The project team worked well together with each individual having their own tasks but with the advantage of the synergies between the different locations.”
Jose Perez CK Engineering Manager,Spain
Jose works for Rotork’s Controls division in San Sebastian (Spain). He is the Engineering Manager for the CK range as well as other local products.

24 Rotork Annual Report 2016
1 Providing high quality and innovative products and services to control the flow of fluids and gases.
2 Meeting customer needs through global expertise delivered locally.
3 Achieving consistent and sustainable profitable growth.
4 Being an employer of choice.
STRATEGIC FRAMEWORK
Our strategic vision is to be the leader in our targeted segments of the global flow control market.

Governance Company InformationDirectors Financial StatementsStrategic Report
25Rotork Annual Report 2016
HIG
H
LOCAL BUSINESS D
IVER
SE END M
AR
GIN
S
UNITS MA
RK
ETS
INNOVATION
ASS
ET-LIGHT
PRO
DU
CT QUALITY SERVICE OPERATOR
PORT
FOLI
O
LEAD
ING WORLD-CLASS GLOBAL
B
ROAD PR
OD
UC
T
CUSTOMER
FLOW
CONTROL
GROWTH
OR
GA
NIC
ACQUI
SITI
ON
See pages 26 to 27 for more details on strategic priorities
Our aim is to deliver a high return on capital with strong and sustainable margins and consistent year-on-year growth in revenues and profit which, combined with our asset-light model, will deliver strong cash generation.

26 Rotork Annual Report 2016
STRATEGIC PRIORITIES
To provide short-term focus, we agree an annual set of key objectives. The progress against these during the year and objectives for the coming year are shown below.
INNOVATIONStrategic objectives Progress in 2016 Focus for 2017
InnovationDevelop and introduce new products in each of the divisions and research new technologies to improve the way flow control is delivered.
There were a number of product launches, expansion of product ranges and certifications during the year in all divisions. See the business reviews on pages 38 to 41 for further details. Spend on R&D increased 5.9% in the year to £10.2m.
Launch new products in accordance with divisional product road maps. Leverage technology within the Group through cross divisional collaboration.
OPERATIONAL EXCELLENCEStrategic objectives Progress in 2016 Focus for 2017
Manufacturing excellence Consolidate and continue to develop world-class manufacturing facilities.
The move into the new Lucca (Italy) factory was completed. There were a number of consolidations during the year: three businesses in Tulsa (USA) were merged together with the merged business moving into a new factory; and in Northern Italy completed the consolidation of a number of facilities.
Complete further consolidation of facilities. Implement the new manufacturing version of our global business system. Progress the development of a new manufacturing facility and global headquarters in Bath (UK).
Global business systems Develop and rollout our global business systems.
The rollout of RQM (quotation system) was almost completed. There was a delay in the rollout of the manufacturing solution due to the consolidation of facilities in Italy.
Complete the rollout of RQM in the two remaining sales locations. Complete the successful 'go live' of the first manufacturing site in Bergamo (Italy) and then commence rollout of manufacturing global business system in other locations.
Cost managementContinued cost management, reflecting current market conditions, and development of the global supply chain.
We achieved cost savings of £9.2m in 2016. This included £6.6m from sourcing initiatives.
Continue to execute the cost management programme. Further develop and leverage the global supply chain for all parts of the Group, including newly acquired companies.
GROWTHStrategic objectives Progress in 2016 Focus for 2017
Sales growthDeliver profitable sales growth by strengthening international coverage, broadening end markets and leveraging the expanding product portfolio.
Delivery of consistent year-on-year growth in revenues and profits was challenging in 2016. There were a number of further changes to the regional management structure following its initial implementation, this included the introduction of regional finance and service managers.
Sales channels and teams have been strengthened, partly assisted by recent acquisitions. Revenue synergies were achieved from acquisitions.
There were a number of large project wins.
Further strengthen sales channels and teams to develop international coverage, broaden end markets and leverage product portfolio.
Continue to realise revenue synergies from acquisitions.

Governance Company InformationDirectors Financial StatementsStrategic Report
27Rotork Annual Report 2016
GROWTHStrategic objectives Progress in 2016 Focus for 2017
AcquisitionsContinue to pursue suitable acquisitions. An acquisition will only be considered if it will deliver a new product, geographic market, market sector or a combination of these.
Acquired the business and assets of Mastergear which sits within the Gears division.
Execute acquisition plan of identified opportunities.
Service growthFurther develop aftermarket services capability including the Client Support Programme (CSP).
We increased the number of service engineers by 7%. Our service coverage was increased in Brazil and France (following the integration of SMS).
Continue to work with customers to develop the delivery of aftermarket services and leverage our capabilities to capture data that can be used in asset management to build a broader relationship with our customers.
Relocation and expansion of service centres in France, Canada and Saudi Arabia.
Positive customer experienceEnhance our customer facing processes to reflect current market requirements.
We maintained our focus on our customers having a positive experience, investing in our customer facing processes.
Continued focus on our customer experience. Enhance and achieve a high level of customer awareness and support to differentiate us from our competitors.
SUSTAINABILITYStrategic objectives Progress in 2016 Focus for 2017
Employee developmentInvest to support our growth strategy and promote diversity and inclusion throughout the Group.
We expanded the online training courses delivered throughout the Group. This included training on new markets, products and refresher training on anti-bribery and corruption awareness. Our Group training department was restructured to co-ordinate courses and improve coverage across the Group.
Further expand the training opportunities throughout the Group. Continue to promote diversity throughout the Group and, in the UK, work with training colleges to recruit female apprentices. Identify career growth opportunities and development needs in connection with succession planning.
Corporate social responsibility (CSR)Communicate best practice throughout the Group, training those responsible and, where appropriate, verifying adoption in each subsidiary.
Our CSR sub-committees continued to promote improvements in health and safety, monitor initiatives to reduce CO2 emissions, provide training on ethical behaviour and our employees gave their time and money to many charities around the world.
Continue to drive safety improvement and deliver the CSR strategy. The CSR report is on pages 48 to 59 of this report.

28 Rotork Annual Report 2016
HOW WE MANAGE
RISK
Managing business risksAs with all businesses, there are certain risks and uncertainties that may impact Rotork’s ability to achieve its objectives. This is why Rotork operates a risk management process which is fully integrated with its day to day business.
The assessment and management of risk is the responsibility of the Board and the continuous improvement and execution of a comprehensive and robust system of risk management is a high priority for us. Managing the risks of our business is essential to the long-term success and sustainability of the Group and our approach to risk is intended to protect the interests of shareholders and other stakeholders. The risk management process is an established way of identifying and managing risk, first at divisional board level, and then for the Group as a whole and works within our governance framework as set out in our Corporate Governance Report, see page 62.
The Board’s role in risk management involves promoting a culture that emphasises integrity at all levels of business operations. This includes ensuring that risk management is embedded within the core processes of the Group, determining the principal risks, communicating
these effectively across the business and setting the overall policies for risk management and control. The geographic spread of our activities makes communication of these policies and standards a key part of ensuring consistency across the whole Group.
2016 has seen the continued development of the risk management process, including the first full year of implementing the risk appetite framework (RAF). The Group’s risk management and internal controls framework was enhanced during the year with the appointment of an experienced Head of Risk and Internal Audit. This has led to a number of improvements to the risk management process as detailed below.
Risk appetite frameworkThe Board is responsible for determining the nature and extent of the risks it is willing to take in achieving its strategic objectives. During 2015, we implemented a more structured approach to determine and document the Board’s risk appetite and created a RAF. The RAF consists of a set of risk appetite dimensions against which there is a statement defining our risk appetite. Each risk appetite dimension is monitored against key risk indicators (KRIs) (see table overleaf). In addition, Rotork has the following risk appetite statement that is designed to set the right tone from the
top for Rotork and support decision making both at a strategic level, for the Board and divisional management, and at a tactical level throughout the wider business:
Risk appetite statementRotork is a growth company and will continue to pursue both organic and acquisition led initiatives to drive future growth. Growth will lead to greater diversification in our product portfolio, geographic coverage and end market exposure. However, in pursuing growth our preference will be to maintain the current levels of operational risk and our existing business model and not to dilute the core values associated with the Rotork brand. We will also not risk the financial stability of the Company through the pursuit of development opportunities.
We have applied the RAF throughout 2016, incorporating this into Board decision making and measuring business decision making against this appetite through a quarterly executive risk summary. The approach taken by the Board is summarised opposite.

Governance Company InformationDirectors Financial StatementsStrategic Report
29Rotork Annual Report 2016
For a given Board decision, underlying parameters are identified and considered alongside the likely impacts of the decision:
• Potential decision points and outcomes; and
• Impact types (e.g. financial, reputational).
Potential decisions are evaluated against the over-arching principles contained in the Group risk appetite statement:
• Do the forecast returns justify the additional risk taken on.
Potential decisions are evaluated against the specific risk appetite dimensions, statements and KRIs.We consider:
• The key risk appetite dimensions related to the decision;
• How the KRIs are likely to be impacted by the decision; and
• Whether the impact supports our desired appetite for the given risk(s).
The RAF is continuously refined in light of the decisions made. We then use the RAF to determine:
• Where we are willing to take on additional risk;
• Where further action is needed to manage risk within our appetite;
• Whether decisions expose us to additional risk dimensions not currently identified; and
• How the RAF could better support the Board’s decision-making process in the future.
IDENTIFY KEY DECISIONS AND UNDERLYING PARAMETERS
EVALUATE POTENTIAL DECISIONS AGAINST GROUP RISK APPETITE STATEMENT
EVALUATE SPECIFIC RISK APPETITE DIMENSIONS
ASSESS AND REFINE RISK APPETITE FRAMEWORK
Finance Director and Head of Risk and
Internal AuditBoard Board
Finance Director with
Board sign-off
Risk appetite framework approach

Rotork Annual Report 201630
HOW WE MANAGE RISK continued
This framework has driven further improvements to risk management at Rotork. Our risk appetite statement and reporting ensure that our risk management processes support our strategic objectives. Rotork has better visibility of which risks need additional mitigation, which risks are managed and where we have the appetite to accept additional risk.
We continue to develop the framework and integrate this with other elements of Rotork’s risk management and assurance processes. In 2017 the further development of the KRIs will be a focus.
Risk appetite framework
Risk appetite dimension Statement Key risk indicators (KRI)
Acquisitions We will pursue acquisition opportunities. Total value and number of acquisitions within the last 12 months, both in terms of turnover and employees.
Control environment We will continue to further strengthen the control environment of the business, including in second and third lines of defence.
Significant control breaches identified by internal audit.
Control environment – cyber
We will ensure that the business is well protected from external cyber threats and ensure that we have adequate processes in place to respond to a cyber attack.
Successful cyber-attacks or high risk information losses.
Critical system uptime %.
Earnings volatility We have limited appetite for volatility in earnings at present, but would consider opportunities that would prove higher risk than our overall business, if the upside opportunity could be proven.
Level of hedging cover for currency exposures.
Forecast revenue growth and comparison of forecast revenue to actuals.
Geopolitical We will continue to operate a geographically diverse business and we want to be as geographically diverse as possible in the future.
% of Group revenue from higher risk countries by:• Subsidiary location (actual and forecast);• Customer location; and• End destination location.Risky countries are defined in the AON Political Risk Map 2016.
Health and safety We are fully committed to ensuring the safety of all our employees.
Monitor AFR and LTI measures to assess level and severity of accidents.
Health and Safety audit scores.
Market/industry concentration
We will, in the long-term, move to greater diversification in the end-markets we serve.
% of Group revenue by industry.
Operational We will continue to have a preference for an asset-light business model and will evaluate dual supply for critical long lead-time items.
Critical components which are single sourced.
Operational – project We will take on projects, including long-term maintenance contracts, but will only do so on commercially acceptable terms and under strict terms and conditions.
Major contract approvals summary.
Operational – IT systems We will invest in our IT systems and infrastructure in order to ensure that we are resilient to external and internal threats, including cyber.
Progress reporting for IT system implementation and investment.
People – succession planning
We want to maintain appropriate succession plans for our key people at a Board and divisional management level.
Quality and coverage of succession and talent plans in place for identified key individuals.
Product We will invest in R&D in order to retain a differentiated product portfolio and will support this by providing a leading service element to our offering.
Actual and forecast R&D investment.
Market conditions and size of market opportunities.
Competitor actions.
Quality We will maintain robust quality control procedures over components purchased and over our finished product in all of our manufacturing locations.
Warranty costs.
Product failure events.
Legal and regulatory We have zero tolerance for non-compliance with relevant laws and regulations in the markets in which we operate.
Legal/regulatory breaches.
Tax We are risk averse with regards to tax. Monitoring of Group effective tax rates.

Governance Company InformationDirectors Financial StatementsStrategic Report
31Rotork Annual Report 2016
Stage 1Identification of risk within
Rotork divisions
Stage 3Identify risk mitigation
and controls
Stage 5Review and moderation by Rotork
Management Board
Report to Audit Committee and Board
Stage 2Quantify the gross risk
Increased consistency of risk descriptions, valuation and approach
to mitigation
Stage 4Quantify the net risk
Stage 6Monitor, assure and report on
robustness of risks and risk assessment processes
Top down risk
assessment
Ongoing risk
mitigation reviews and
controls testing.
Updated risk register
presented to Audit
Committee and Board
twice a year
Bottom up risk
assessment
Risk management process The risk management process continued to mature in 2016 and is summarised as follows:
The risk assessment process is consistent across all divisions. The major risks affecting the Group are first identified (stage 1) and considered by the divisional boards during their regular meetings. Each division also performs a full risk assessment workshop annually (which is formally updated at half year). Each division values the gross likelihood and impact of each risk (stage 2) on their divisional business, assuming no specific mitigations or controls. Divisions then consider the strength of mitigations and controls in place for each key risk (stage 3) before giving a net likelihood and impact score (stage 4). The Head of Risk and Internal Audit facilitates risk assessment workshops with each division to promote improved consistency and to challenge the completeness of the output.
There are a range of potential impacts including financial, reputational and health and safety. For financial impacts, valuation limits are tailored to each division so that each division has an appropriate benchmark. Once the risk assessment workshops are completed by each division, the risks are then consolidated at a Group level using an appropriate Group impact scale. This consolidation process is subject to top down input and challenge from the Rotork Management Board, Audit Committee and Board (stage 5).
The consolidated risk scores are used to determine which risks are most important at a Group level and these are defined as our principal risks. Each principal risk is ultimately owned by a member of the Rotork Management Board. Risks which, upon consolidation, are not considered to be principal risks, are owned and managed by members of the divisional or Plc Boards. These continue to be monitored and if consolidated risk scores increase, these risks will be escalated into the Group principal risk register. The principal risks are set out on pages 32 to 35.
Our risk assessment includes consideration of risks which threaten many aspects of the business, including but not limited to business model, future performance, solvency or liquidity.
Risks are monitored, assured and reported in a number of ways (stage 6). An example of each is below:
• Monitoring – Divisional management and the Board continuously monitor, manage and reassess risk, maintaining risk registers as live documents.
• Assurance – In 2017 our internal audit plans will be directly linked to the risks within the Group principal risk register in order to test the effectiveness of mitigations and controls, providing assurance over net risk scores.
• Reporting – The quarterly executive risk summary reports KRIs giving an indication of how Rotork is being affected by these risks. The Board and divisional management meet twice a year to formally review risk and consider progress made and changes in the previous six months.
Identified risks are discussed and the progress reviewed at both Rotork Management Board and divisional board meetings during the year. Senior management, in association with the Board, meets twice a year to consider the Group risk register and progress with mitigating actions. The external auditor is invited to attend one of the meetings each year.

Rotork Annual Report 201632
PRINCIPAL RISKS AND UNCERTAINTIES
Description and importance to Rotork
Summary of mitigation and controls
Link to strategic objectives
Economic and market conditions
A decline in government and private sector confidence and spending will lead to cancellations of expected projects or delays to existing expenditure commitments.
This lower investment in Rotork’s traditional market sectors would result in a smaller addressable market, which in turn could lead to a reduction in revenue from that sector.
• Product development and innovation to address new markets and new applications in existing markets.
• Geographic and end market diversification provides resilience to a reduction in any one area or market but, as we have seen this year, may not fully mitigate a change in the larger end markets.
• Accelerated cost saving management as required to maintain profitability of regions and relevant businesses.
• Sales growth
• Service growth
• Cost management
Increased competition on price or product offering leading to a loss of sales globally or market share.
• Rotork already has production or sales and service operations in many low cost countries.
• Global strategic sourcing team secure lower prices for components.
• R&D investment and organic product development, or acquisition of companies with new products, to maintain differentiation from the competition both in terms of the quality of our products and the services we provide.
• Continue to focus on an improved customer experience to ensure that price is not the only means of gaining a competitive advantage.
• Sales growth
• Service growth
• Cost management
• Innovation
Increasing social and political instability results in both disruption and increased protectionism in key geographic markets. This includes the risks posed by Brexit.
Business disruption would impact our sales and might ultimately lead to loss of assets located in the affected region.
• Regular review of global markets considering social and political risks, including the risk of greater protectionism, and develop contingency plans and market exit strategies to implement as appropriate.
• Key risk indicator monitoring % of revenue from high risk markets reported quarterly to the Board.
• The increasing geographic spread of Rotork’s operations and customers diminishes the impact of any one market on the results of the Group as a whole.
• Sales growth
• Service growth
• Cost management
Financial
UK defined benefit pension scheme deficit continues to increase due to a number of factors including investment returns, long-term interest rates, price inflation and members’ longevity. This in turn might lead to a requirement for the Company to increase cash contributions to the schemes.
• Both defined benefit schemes are closed to new members.
• The Group and trustees monitor the performance of the scheme.
• Actuarial and investment advice is taken with a view to reducing volatility and the overall cost of the provision of this employee benefit.
• Cost management
The following are considered the principal risks facing the Group and are the result of the robust, top down and bottom up risk assessment process previously described. It includes those risks that would threaten the Group's business model, future performance, solvency or liquidity.

Governance Company InformationDirectors Financial StatementsStrategic Report
33Rotork Annual Report 2016
Description and importance to Rotork
Summary of mitigation and controls
Link to strategic objectives
Financial
Volatility of exchange rates would impact Rotork’s reported results and competitive position.
• Rotork’s Treasury Hedging Policy addresses short-term risk and this works together with the natural hedging provided by the geographical spread of operations, sourcing and customers.
• The Hedging Policy continues to be reviewed annually to ensure it remains fit for purpose.
• Cost management
Health and safety
The nature of Rotork’s core business and geographical locations involves potential risks to the health and safety of our employees and other stakeholders.
• Compliance with relevant legislation and codes of best practice.
• Robust health and safety policy and training included in all staff inductions, in addition to regular refresher training.
• Regular health and safety audits, site checks and reporting.
• Regular communications about accidents at work and visible key performance indicators (KPIs).
• Appropriate training is provided for known safety risks.
• Third party provider of international support and travel advice in all markets and regions.
• See health and safety report on pages 58 to 59 for further details.
• Manufacturing excellence
• Corporate social responsibility
Product quality and reliability
Major in-field failure of a new or existing Rotork product potentially leading to a product recall, major on-site warranty programme or the loss of an existing or potential customer.
• Extensive product design review process pre-launch reduces the risk of product failures occurring in the field.
• Rotork has experience of launching many products and has enhanced the process based on this experience.
• Comprehensive set of quality control procedures over suppliers. These include supplier visits, audits and a scorecard system to measure their performance.
• Our global service coverage ensures that any product failure issues should be dealt with quickly and efficiently to minimise any reputational impact.
• Fitting and commissioning products wherever possible by Rotork engineers to ensure current operations.
• Sales growth
• Service growth
• Manufacturing excellence
• Corporate social responsibility
• Innovation
Increasing
Stable
Decreasing
Risk trend
Rotork Annual Report 201634
Description and importance to Rotork
Summary of mitigation and controls
Link to strategic objectives
Product quality and reliability
Failure of a key supplier or tooling failure at a supplier causing disruption to manufacturing at a Rotork factory.
• Dual sourcing for key components wherever possible provides the best mitigation for key suppliers.
• Regular KPI monitoring of the supply chain throughout the organisation, including a key risk indicator (KRI) measuring dual sourcing of critical components reported quarterly to the Board.
• Comprehensive set of quality control procedures over suppliers. These include supplier visits, audits and a scorecard system to measure their performance.
• Maintaining safety stock levels sufficient to protect against short-term disruption.
• Regular monitoring and replacement of our tooling at all suppliers reduces the risk of a tooling failure.
• Manufacturing excellence
• Cost management
Acquisition risk
Failure of an acquisition to deliver the growth or synergies anticipated, either due to unforeseen changes in market conditions, or failure to integrate an acquisition effectively.
Significant financial underperformance could lead to an impairment write down of the associated intangible assets.
• Forecast market conditions are considered during the acquisition process.
• During the due diligence process a 100 day plan is prepared to manage the important initial stages of integration.
• Consideration is given to the composition and skills of the management team with the necessary training and support provided by a variety of Rotork personnel.
• Business development directors provide greater support and co-ordination.
• Effective integration and communication of Rotork’s policies and procedures.
• Sales growth
• Service growth
• Acquisitions
IT security, continuity and system implementation
Failure to provide, maintain and update the systems and infrastructure required by the Rotork business.
Failure to protect Rotork operations, sensitive or commercial data, technical specifications and financial information from cybercrime.
• Thorough business process reviews and use of flexible testing environments to address functional issues.
• Post-system implementation, each business is monitored.
• Dedicated implementation resource provided by experienced Rotork team.
• Robust security systems are in place to monitor and protect the Rotork network.
• We continually review the effectiveness of our key IT security controls, including a KRI to monitor the number of successful cyber breaches reported quarterly to the Board.
• Regular cyber security and cyber fraud awareness training and guidance.
• Global business systems
PRINCIPAL RISKS AND UNCERTAINTIES continued

Governance Company InformationDirectors Financial StatementsStrategic Report
35Rotork Annual Report 2016
Description and importance to Rotork
Summary of mitigation and controls
Link to strategic objectives
Compliance with law, regulation or ethical standards
Failure of our staff or third parties with whom we do business to comply with law or regulation or to uphold our high ethical standards and values.
• Tone from the top, a 'no tolerance' culture to reinforce our high ethical standards and values.
• Commitment to compliance embodied in Rotork culture.
• Anti-bribery and corruption training is provided to all relevant staff.
• Continued communication and education of agents.
• Use of WorldCheck for agents and acquisition targets before engaging in business relationships.
• Availability and promotion of the whistleblowing policy and hotline.
• Ethical and quality control procedures over suppliers. These include supplier visits, audits and a scorecard system to measure their performance.
• Corporate social responsibility
Viability statement The directors have assessed the viability of the Group over a three year period taking account of the Group’s current position and the potential impact of the principal risks as documented above. A robust assessment of the principal risks facing the business was conducted through the year with the review of the risk appetite framework and executive risk summaries contributing to a fuller consideration of those risks which might impact the business model or future performance. The Board believes that the three year period is an appropriate period over which a reasonable expectation of the Group’s longer-term viability can be evaluated and is aligned with our planning horizon at both Group and divisional level.
In coming to this view, the Board has considered the inherent volatility in exchange rates and oil prices, the nature of the industry and the planning cycles involved. The Group works closely with its customers on projects ranging from several weeks to several years, discussing operational plans and longer-term capital expenditure programmes.
In making this statement, the directors have considered each of the principal risks, individually and some in combination, and the potential impact they could have in severe but plausible scenarios. Financial sensitivity modelling was carried out to assess the impact of these risks on the Group’s three year plan. Assumptions were made concerning market activity levels, the impact of the scenarios on working capital cycles and the mitigating actions that could be taken to reduce the impact of the stress-test scenarios. Given the current position of the Group and the likely effectiveness of mitigating actions, the Board has assessed the impact these would have on the business model, future performance, solvency and liquidity over the period and have a reasonable expectation that the Company will be able to continue in operation and meet its liabilities as they fall due over a three year period.
Increasing
Stable
Decreasing
Risk trend

36 Rotork Annual Report 2016
CHIEF EXECUTIVE’S STATEMENT
Our continued investment in new products, new markets and acquisitions provides us with a strong platform for growth, albeit in continuing challenging market conditions.
The Group’s trading environment became more stable during the year, although we continued to see caution from our customers in terms of large-scale investments in projects. Geopolitical tensions also affected certain key markets. Our reported numbers benefited from a contribution from acquisitions and currency movements. We continued to invest in infrastructure, including IT, which will improve our operational performance, and we made good progress on our previously announced cost reduction programme, exceeding our initial target.
Full year order intake was up 9.6% on a reported basis, but 6.1% lower on an OCC basis. Whilst reported revenue increased 8.0% to £590.1m, underlying revenue decreased 8.0% to £502.6m which was the main driver of the reduction in adjusted operating profit to £120.6m (£102.3m OCC). Our accelerated cost management programme delivered savings of £6.6m in respect of material costs, which was more than sufficient to mitigate the impact of any pricing pressure, which we continue to carefully monitor and manage. A further £2.6m of savings was found in other areas including overhead savings.
In 2016, we continued to implement our long-term strategy for growth by introducing new products and investing in new and existing markets through developing our sales channels. Our focus on selling additional products and services to our existing customer base through cross-divisional initiatives, and new product training for our sales force, had a positive impact. We also introduced a Group-wide initiative to improve our success rate on sales quotes.
During the year, oil and gas represented 52.4% of revenue, a decline of 70 basis points on the previous year, with an increase in the percentage of our sales to upstream and midstream but a decrease in downstream. In the water and industrial markets, underlying revenue increased over the prior year by 10.0% and 5.3% respectively, demonstrating that our strategy of
Peter FranceChief Executive

Governance Company InformationDirectors Financial StatementsStrategic Report
37Rotork Annual Report 2016
diversifying our end markets continues to make progress. Our sales in the power market, down 6.4%, continued to be affected by China’s economy, although we saw an increase in activity levels in China in the second half of 2016. USA revenues increased year-on-year, with growth in the water market but weakness in oil and gas. The Latin American market remained difficult due to our exposure to oil and gas in that region. However, the Middle East and Africa had positive sales momentum and we saw an increase in activity in certain territories in Asia.
Cost saving initiatives included the consolidation of facilities in the USA and Italy, resulting in a reduction in the number of our manufacturing facilities and offices. We now have 27 manufacturing sites, 69 national offices, and 84 regional locations in 38 countries. In total, we have over 860 sales channels in 101 countries. Our strong global presence remains a core part of our strategy. As well as consolidation of sites, we have focused on the rollout of a global value engineering programme in support of increased customer demand for 'smarter' lower cost solutions and measures to rationalise our supply chain and better leverage our global purchasing spend. We also accelerated the rollout of our global business system to improve operational effectiveness and facilitate future scaleability.
We welcomed Mastergear into the Rotork family in June 2016 which expanded our Gears portfolio with new products in motorised and manual gears as we continued to consolidate our market leadership in this segment. Our focus during the year was on integrating Mastergear and the six acquisitions that we completed in 2015 and leveraging their product portfolios to drive growth.
The long-term drivers of our markets remain positive with population growth, urbanisation and automation continuing to drive increased demand for flow control products and services. Our customers are also increasingly focused on reducing power consumption, increasing efficiency, maximising cost reduction, improved safety and minimising their carbon footprints, which will drive long-term growth in our markets.
The broadening of our product portfolio, developing our geographic reach and expanding our end markets remain the key elements of our strategy. Our sales proposition of providing innovative market-leading products and services locally to our customers continues to serve us well.
Customers have always been at the heart of what we do and in 2017 we are introducing a number of measures that will further enhance our customer-facing processes to reflect
market requirements and to ensure that we remain competitive. This includes the introduction of a Group-wide initiative, Project Energise (2017), focused on improving the customer experience.
Rotork Site Services (RSS)Our global service network is a key differentiator for us in our industry. Our highly trained service team provide service and support to our customers around the world through preventative maintenance contracts, onsite and workshop service, retrofit solutions and through the Client Support Programme which offers maintenance contracts tailored to our customers’ specific needs. In 2016, we continued to invest in our aftermarket business with 430 directly employed service engineers and other service technicians employed by our agents around the world, an increase of 7% on the previous year (2015: 402).
Research and developmentIn 2016, we accelerated a number of product introductions as we continued to widen our product range and improve our existing products to remain competitive. Our investment in research and development (R&D) is led by Gary Jacobson, who was appointed as Group Innovation Director following the acquisition of Bifold in 2015, and during the year this increased by 5.9% to £10.2m. The increase is partly attributable to the pipeline of Bifold, whose strong history of product development was a key rationale for its acquisition. In addition, we are making a major investment in Bath to replace our mature factory and corporate headquarters and develop a state-of-the-art R&D centre, to be completed by the end of 2018. Innovation and organic product development remains a key part of our strategy for growth. See the business review on pages 38 to 41 for more details on product launches.
Corporate social responsibilityCorporate social responsibility (CSR) values continue to be an integral part of our business model. We take our responsibilities to our stakeholders very seriously and continuously look for ways to improve our performance. The work in this area is led by our CSR committee and sub-committees who met throughout the year.
We supported WaterAid and Sightsavers again in 2016 and also Seva Bharathi (an NGO in India) and The Forever Friends Appeal (Royal United Hospitals Bath, UK), donating a total of £102,000. Our employees also gave support to their local communities with the Group contributing a further £157,000 to support these causes. This brought the total Group
contributions in the year to £259,000 (2015: £297,000).
For more information about the CSR committee and sub-committees and the work they carry out see pages 48 to 59.
Our peopleOur culture and values are key to Rotork’s success. See pages 20 to 21 for further information on our winning culture.
Rotork aims to be an employer of choice and our annual employee satisfaction survey is used to improve employee engagement and guide changes in how we work. Our annual survey for 2016 was completed by over 2,300 employees, with the response rate being slightly down (67% compared to 71% last year), and the overall satisfaction score remaining the same as last year at 3.6 out of 5.
The global results showed that on average people are most satisfied with Rotork’s products and services, our approach to health and safety, and our values and ethics, and that Rotork is considered a great place to work by the majority of our employees. One clear message that came out of the survey related to employee involvement and understanding of the Group strategy. I am currently looking at the ways we share the Group strategy with all employees and how we might more fully engage employees in a dialogue on strategy in response to this.
We increased our training activities for employees during the year, including the introduction of new training materials for our sales engineers and the rollout of new e-learning modules throughout the business.
Rotork’s total employee numbers in 2016 were 3,754, broadly in line with the previous year. This included 55 employees who joined following the Mastergear acquisition. Excluding this, the total number of employees decreased by 59 as a result of the cost management initiatives that were implemented during the year.
Rotork’s success is due to the dedication and hard work of our employees. I would like to personally thank them all for making Rotork the industry-leading business that it is today.
Peter FranceChief Executive27 February 2017

38 Rotork Annual Report 2016
BUSINESS REVIEW
ROTORKCONTROLS
Order intake was £295.2m, a 6.6% increase compared with the prior year, with revenue up 4.1% to £298.4m, reflecting benefits from currency tailwinds. On an OCC basis order intake and revenue decreased by 4.3% and 6.5% respectively.
Adjusted operating profit of £87.3m was up 2.1% with an adjusted operating margin of 29.3%, 50 basis points with 2015, by 8.4% and 60 basis points respectively, reflecting the effect of lower volumes but partly offset by continued resilience in our pricing and control of costs.
Our exposure to oil and gas reduced again in 2016, with the proportion of revenue down from 48% to 45% with reductions in midstream and downstream. The power market remained slow and although our market exposure declined slightly year-on-year we will continue to focus on expanding in this area. Incremental gains were seen in all the other end markets, including water. Our newer developing territories (Turkey, Poland and Chile) all delivered growth in 2016
and most of Europe, Middle East and Africa had positive sales momentum, with an increase in activity levels seen in South East Asia. Whilst the USA benefited from growth in the water market, overall we saw a decline in this region due to continued challenging conditions in the oil and gas market. Latin America also had its challenges due to our exposure to the oil and gas markets in that region.
In 2016, we launched further extensions to our IQ3 range, enabling us to offer more cost effective solutions. We also replaced a number of the original IQT3 variants with improved designs. Single phase and modulating variants of our Centork range were launched in Europe and China and will be sold outside these territories once the required electrical certification has been obtained. We are developing an intelligent asset management system that will collect and analyse field data from our installed actuators to ensure that our preventative service activities are optimised.
Our business has remained resilient in the face of difficult market conditions.
Grant WoodManaging Director – Rotork Controls
Revenue
£298.4m+4.1%Adjusted operating profit
£87.3m+2.1%
Opportunities
è Centork CK (power and water)
è IQ3/IQT3 extensions è Develop sales channels è Service growth
Pakscan control systemRotork’s Pakscan is a two-wire digital control system for valve actuators and it has recently been improved with the introduction of a new P4 Master Station which has the capability of running the new Pakscan Plus ultra-fast control loop.

Governance Company InformationDirectors Financial StatementsStrategic Report
39Rotork Annual Report 2016
Governance Company InformationDirectors Financial StatementsStrategic Report
ROTORK FLUID SYSTEMS
Order intake was down 4.8% on a reported basis to £134.7m and down 14.2% to £121.4m on an OCC basis, with revenue down 2.6% to £145.3m (-12.4% to £130.7m OCC). Adjusted operating profit was down 59.4% to £6.2m and adjusted operating margin decreased 590 basis points (-64.1% to £5.5m OCC).
Despite actions to consolidate facilities, a redundancy programme in one location and material cost saving initiatives, these were unable to fully cover the fall in volume and the impact of mix and pricing which were most pronounced in Fluid Systems.
The division’s exposure to oil and gas remained broadly similar to 2015 at 69%. There was some positive Liquefied Natural Gas (LNG) activity and an increase in projects in Saudi Arabia helped offset overall lower activity elsewhere in this sector. Exposure to each of the other markets also remained broadly similar to the previous year. Our North American market saw a small increase, with a strong performance by our Gulf Coast subsidiary as a result of good LNG activity offsetting a general decline in other markets in this region. Europe remained broadly similar to the previous year, with the modest increase in the
Eastern European market offsetting the decrease in Western Europe. Latin America was a weak performer, largely due to significant project delays as a result of both market and political instability that continues to impact business levels in Venezuela, Mexico and Brazil. Our Malaysia, India and Middle East subsidiaries performed well but the Far East, including China, reported lower activity overall, mainly due to ongoing project delays within oil and gas.
2016 saw significant value engineering efforts on our core products that we expect to continue to benefit the division during 2017. This will be supported by our ongoing low cost country sourcing programme that will benefit both our European manufacturing facilities and enable our regional China and India manufacturing operations to better address their regional markets.
Product development continued to be a focus for Fluid Systems in 2016. We expanded our SI3 range (our 3rd Generation Skilmatic electric failsafe actuator) with the launch of quarter-turn and linear variants. We introduced a stainless steel option in our GT range (pneumatic rack and pinion actuators). A new electronic line break detection system designed to detect and isolate leaks in major pipeline infrastructure was also launched.
Fluid Systems has the largest exposure to oil and gas and continued to be affected by weak project activity in this market.
Electronic Line Break (ELB)The ELB continuously monitors upstream and downstream pipeline pressure dynamics to provide early detection of pipeline breaks and initiate automatic valve actuator movement. It is shown (on the left side of the picture) attached to a Rotork Gas-over-Oil pipeline actuator.
David Littlejohns Managing Director – Rotork Fluid Systems
Revenue
£145.3m-2.6%Adjusted operating profit
£6.2m-59.4%
Opportunities
è Oil and gas market è Developing broader end markets
è Collaboration with other divisions
è Site consolidation

40 Rotork Annual Report 2016
BUSINESS REVIEW continued
ROTORKGEARS
Gears performed well over the period, with order intake increasing 22.7%, including contributions from the recent acquisitions, Roto Hammer and Mastergear. On an OCC basis, order intake declined by 4.8% relative to a strong comparable year.
Revenue grew 23.4% including contributions from the acquisitions and currency tailwinds. On an OCC basis, revenue fell by 4.0%, primarily due to the impact of the slowdown in oil and gas. Adjusted operating profit increased 17.2% to £14.1m but fell 14.1% excluding the effects of acquisitions and currency as the lower volumes reduced OCC adjusted operating margin by 220 basis points.
Oil and gas accounted for 54% of revenue, assisted by the contribution from the recent acquisitions. Upstream remained flat, but midstream and downstream both grew. Water grew 16% over the prior year. North America experienced good sales growth, mainly in the Gulf Coast and we saw an increase in activity in China.
The acquisition of Mastergear was completed in June 2016 for £16.3m. Mastergear has its main centres of operations in Italy and the USA, with a further operational presence in China. It has a
well regarded product portfolio of manual and motorised gearboxes and will enable us to offer our customers a more comprehensive range of products and services.
In 2016, we introduced new products across many of our gearbox ranges: a quarter-turn gearbox for use with motorised applications (ABM range); a bronze worm gearbox for steam distribution applications in manholes and vaults (BR range); a hand operated quarter-turn worm gearbox for use in the water and pipeline markets (QTW150 range); and a hand operated bevel gearbox for use on gate valves, globe valves and penstocks (HOB range). We also unveiled a fugitive emission detector gearbox which is a new smart gearbox designed for leak detection and which will be launched in 2017. We changed the standard baseplates on all our gearboxes in the IW range to a new improved flat design. We also launched a new Smart Position Indicator which mechanically displays the position of the valve for in-field notification and digitally signals its open/closed position, helping to create a safer working environment.
The recent acquisitions, Roto Hammer and Mastergear, have broadened our product offering, making our gears product range one of the most complete in the industry.
Revenue
£72.4m+23.4%Adjusted operating profit
£14.1m+17.2%
Opportunities
è Mastergear integration è Product range expansion è Market expansion è New Tulsa facility
Fugitive Emission Detector GearboxShown in prototype form, the Fugitive Emission Detector Gearbox surpasses existing technology as it forms an integral part of the valve operator and is not an external measurement device. It accurately detects leakage within the cavity formed between the valve and valve operator.
Pamela Bingham Managing Director – Rotork Gears

Governance Company InformationDirectors Financial StatementsStrategic Report
41Rotork Annual Report 2016
Governance Company InformationDirectors Financial StatementsStrategic Report
ROTORKINSTRUMENTS
Instruments benefited both from the acquisitions completed in the prior year and favourable exchange rates, with order intake increasing 42.3% or 5.7% on an OCC basis. The closing order book increased by 22.8% during the year to £9.3m before a £0.5m increase due to currency is included.
Revenue increased by 35.4% with contributions from acquisitions and currency tailwinds. On an OCC basis, revenue declined by 3.9% as a result of the challenging conditions in the oil and gas market and ongoing tight conditions in the tyre market. Instruments supplies a number of components to Fluid Systems, and the weak revenue growth in that division also affected Instruments as a result.
As anticipated, the 2015 acquisitions were dilutive to the division's margins in 2016. Adjusted operating profit grew by 10% (-16.6% OCC) but adjusted operating margins decreased 510 basis points to 22.1% (-360 basis points to 23.6% OCC). We made additional investment in the division’s engineering resource, although the overall margin at Instruments remains above that of the Group as a whole.
Instruments’ exposure to the oil and gas market increased from 44% to 50% in 2016 following the acquisition in 2015 of Bifold, which increased the level of business derived from the upstream market. There was some softness in the North American market and continuing delays in large rail projects. However, the other markets we are now serving include a wide variety of geographies and end markets, including industrial automation, commercial vehicles, rail and life sciences.
In 2016, we continued to develop our product range by updating existing products and introducing new variants. Bifold launched a digital filter booster which integrates a complete control panel into a single unit and a new range of pressure transmitters specifically tailored to the oil and gas market; Rotork Fairchild launched a new PAX1 linear actuator which can be used by itself or paired with a variety of pressure regulators enabling remote control of pneumatic pressure for a variety of applications, and a new range of low pressure transducers for use in the medical and precision test rig markets; YTC Positioners were re-engineered and certified for hazardous area use in North America and Canada; Rotork Midland launched a redesigned stainless steel filter regulator; and RI Wireless, a device which provides wireless valve monitoring in the process industry, was re-engineered.
The acquisitions we made in the prior year are delivering significant growth in both revenue and profits.
Revenue
£91.2m+35.4%Adjusted operating profit
£20.1m+10.0%
Opportunities
è Product range expansion è Sales channel development è Rotork synergies è Bifold – R&D catalyst
Alan Paine Managing Director – Rotork Instruments
PICØ Bifold has developed a new zero bleed pneumatic positioner without any of the performance degradation usually associated with low bleed. It will transform pneumatic/gas actuation, not just in on/off and ESD valves, but also in modulating and control valves, by providing zero bleed without any loss of performance.

42 Rotork Annual Report 2016
FINANCIAL REVIEW
In challenging market conditions, the Group has demonstrated the resilience of our business model. Our recent acquisitions have delivered significant revenue growth and broadened our product offering, building on the solid foundations laid by the investments we have made in innovation. Strong operating cash flow, demonstrating the robust financial disciplines embedded in the business, resulted in a reduction in net debt of £16.2m after spending £16.3m on the acquisition of Mastergear. We also continued our accelerated cost management programme, delivering cost savings of £9.2m.
The second half of the year saw an increase in order intake compared with the first half of the year on a reported basis, remaining broadly consistent on an organic constant currency (OCC) basis. Revenue in the second half of the year increased on both a reported and OCC basis, by 23.6% and 16.5% respectively. Full year order intake of £576.6m was 9.6% above 2015 although on an OCC basis this was a reduction of 6.1% after excluding the currency tailwind and the contribution from acquisitions. Revenue of £590.1m was 8.0% higher than the prior year (-8.0% OCC) with an increase in the closing order book of 8.7% to £180.7m.
Gross margins reduced from 45.7% to 44.3%, although the key elements within cost of sales were managed closely to mitigate the effect of the adverse conditions during the year. Material costs are the largest element of cost of sales and are an area where sourcing initiatives have consistently driven savings. This year these initiatives were accelerated and as a result the material cost percentage decreased by 180 basis points. Our diverse product portfolio means that breaking this down into cost, sales price and mix impacts is particularly challenging but this does illustrate that the impact of pricing pressure was mitigated. While labour costs decreased in absolute terms, they increased slightly as a percentage of sales in 2016 as the actions to reduce variable spend such as reducing overtime were all taken in 2015. The
Strong cash generation and a focus on integrating acquisitions and accelerating cost reductions has partially mitigated the impact of the current market environment.
Jonathan DavisFinance Director

Governance Company InformationDirectors Financial StatementsStrategic Report
43Rotork Annual Report 2016
largely fixed cost associated with our factories and service facilities accounted for the remaining reduction in gross margins.
Adjusted operating profit was £120.6m, 3.7% lower than the prior year and the corresponding margin reduced by 250 basis points to 20.4%. On an OCC basis adjusted operating profit reduced 18.4% to £102.3m, a margin of 20.3%. The increase in reported gross profit was offset by an increase in overheads of 13.6%, mainly as a result of currency and acquisitions. On an OCC basis the increase in overheads was 2.6% with employee bonuses and benefits increasing from last year’s low point and a general rise in salary costs. Average salary per head increased by 1.9% at constant exchange rates. Net finance costs rose £0.2m to £2.7m with lower currency losses (£0.7m) and a lower interest charge in respect of the pension schemes (£0.4m) offset by higher net bank interest payable (£1.3m). This resulted in adjusted profit before tax of £117.9m, a 4.0% reduction on the prior year, however, a 30 basis point reduction in the effective tax rate offset some of this movement so that adjusted earnings per share was 3.8% lower than 2015 at 10.0 pence.
AcquisitionsIn June we completed the acquisition of Mastergear, a leading manufacturer of manual and motorised gearboxes focused on the oil and gas, water and distribution, chemical processing and wider industrial markets, for £16.3m. Along with the prior year acquisition of Roto Hammer, this makes our Gears product range one of the most complete in the industry.
£6.8m of the consideration for Mastergear was attributed to intangible assets which will be amortised and £5.3m is goodwill which will be subject to an annual impairment review. The increased value of acquisitions over the last three years led to a rise in the amortisation charge related to acquired intangible assets to £26.8m (2015: £20.9m). In order to adjust the
income statement to show a like-for-like period for each acquisition, 2016 revenue has to be reduced by £32.6m and adjusted operating profit by £5.4m. The profit margins of the acquired businesses were slightly dilutive in aggregate, at 16.7%.
During 2015, we completed a total of six acquisitions, the most significant of which was Bifold. Each provided access to a new product range, end user market or new geographic market in line with our stated acquisition strategy. We are pleased to report that the integration of these businesses is progressing well and once fully assimilated into the Rotork global sales portfolio, we expect their overall adjusted operating margins to improve.
Accelerated cost management programmeIn 2015 we announced an accelerated cost management programme as part of our response to the changing market environment which identified £8m of annualised savings, split equally between material costs and overheads. The 2016 benefit of these initiatives was £2.8m of material cost savings and a £2.1m saving in overheads in addition to the £5.4m benefit already delivered in 2015.
In 2016 new initiatives were identified targeting a further £7.0m of annualised savings. These have so far delivered material cost savings of £3.8m and £0.5m in relation to other costs, bringing the total benefit in 2016 to £9.2m.
The material cost savings resulted in a decrease in the material cost percentage of 180 basis points net of the impacts of pricing and mix. The initiatives to reduce overheads delivered greater savings than anticipated. The consolidation of our facilities along with our headcount reduction initiatives were the largest contributors to the annualised savings. Not replacing leavers and consolidating roles led to a net headcount reduction of 59 people, including some senior
posts, before the 55 people added with acquisitions are reflected.
A further £4.2m of savings are anticipated from these actions in 2017. We are also targeting a further £4m of annualised savings from new initiatives to be identified.
CurrencyThe progressive strengthening of the US dollar and euro during the year gave the Group a foreign exchange translation tailwind. The US$/£ average rate was $1.36 (2015: $1.53), a 17 cent tailwind. The €/£ average rate was €1.22 (2015: €1.38), a 16 cent tailwind. This, along with movements amongst the other 16 currencies that are home to one or more of our subsidiaries, benefited reported revenue by £54.9m, or 10%.
The impact of currency on the Group is both translational and transactional. Given the locations in which we have operations and the international nature of our supply base and sales currencies, the impact of transaction differences can be very different from the translation impact. We are able to partially mitigate the transaction impact through matching supply currency with sales currency, but ultimately we are still net sellers of both US dollars and euros. It is the net sale of these currencies which we principally address through our hedging policy, covering up to 75% of trading transactions in the next 12 months and up to 50% between 12 and 24 months. Net of these mitigating actions adjusted* operating profit was £12.9m (10.3%) lower than it would have been at 2015 rates.
In order to estimate the impact of currency, at the current exchange rates we consider the effect of a 1 cent movement versus sterling. A 1 euro cent movement now results in approximately a £250,000 (2015: £235,000) adjustment to profit and for US dollar, and dollar related currencies, a 1 cent movement equates to approximately a £450,000 (2015: £400,000) adjustment.
Revenue
£590.1m+8.0%
Adjusted* operating profit
£120.6m-3.7%

44 Rotork Annual Report 2016
Return on capital employed (ROCE)Our asset-light business model and strong profit margins mean Rotork generates a high ROCE. Our definition of ROCE is based on adjusted* operating profit as a return on the average net assets excluding net debt and the pension scheme liability net of the related deferred tax. This means that as we make acquisitions our capital base grows when the associated intangible assets and goodwill are recognised. The average capital employed increased year-on-year by 17.8% to £516m as a result of the full year impact of the additional intangibles and goodwill acquired in the last two years. This, combined with the lower adjusted operating profit resulted in a reduction in ROCE to 23.4% (2015: 28.6%).
TaxationThe Group’s effective tax rate reduced slightly from 26.5% to 26.2%. The Group continues to operate in many jurisdictions where local profits are taxed at their national statutory rates, ranging from nil to over 35%, compared to a UK statutory rate of 20.0% for the year. In the year, the reduction in the effective rate resulted from the 25 basis points decrease in the UK statutory tax rate and the change in profit mix across the Group. In addition, the Group continues to benefit from the UK patent box regime and R&D tax relief.
The Group’s approach to tax continues to be to operate on the basis of full disclosure and co-operation with all tax authorities and, where possible, to mitigate the burden of tax within the local legislation.
Cash generationOur strong cash generation and disciplined working capital management resulted in a reduction in net debt of £16.2m to £55.0m at the end of the year. Our cash generation KPI shows a conversion of 130.1% of operating profit into operating cash. This allowed us to invest £17.6m in capital expenditure and £16.3m on the Mastergear acquisition, pay dividends of £43.9m and after currency movements and tax payments of £32.9m, we reduced net bank borrowings used to fund the prior year acquisitions.
Control of working capital as defined in the cash flow statement, using average exchange rates and excluding acquisitions, is key to achieving our cash generation KPI. Inventory reduced by £14.4m in the cash flow but currency and acquisitions reduced the impact to a £1.4m reduction between balance sheets. As a function of revenue, reported inventory reduced from 16.0% to 14.5%. Trade receivables increased by £13.1m as reported, with debtor days outstanding
reducing by 1 to 61 days, however, in the cash flow receivables generated a £2.5m inflow. In total, net working capital decreased to 30.2% of revenue compared with 31.0% in December 2015 and generated an £18.2m inflow in the cash flow statement.
Credit managementThe Group’s credit risk is primarily attributable to trade receivables, with the risk spread over a large number of countries and customers, and no significant concentration of risk. Creditworthiness checks are undertaken before entering into contracts or commencing trade with new customers and in companies where insurance cover operates, the authorisation process works in conjunction with the insurer, taking advantage of their market intelligence. We actively expanded the coverage of the credit insurance policy during the year and have cover in place for 83% of receivables in those companies now using the policy. Where appropriate, we use trade finance instruments such as letters of credit to mitigate any identified risk.
FINANCIAL REVIEW
CONTINUED
Organic business growth
£m2016 as
reported
Constant currency
adjustment
2016 at 2015 exchange
ratesRemove
acquisitions
Organic business at
2015 exchange
rates2015 as
reported
Revenue 590.1 (54.9) 535.2 (32.6) 502.6 546.5Cost of sales (328.4) 33.7 (294.7) 21.9 (272.8) (297.0)
Gross profit 44.3% 261.7 (21.2) 44.9% 240.5 (10.7) 45.7% 229.8 45.7% 249.5Overheads 23.9% (141.1) 8.3 24.8% (132.8) 5.3 25.4% (127.5) 22.7% (124.2)
Adjusted operating profit* 20.4% 120.6 (12.9) 20.1% 107.7 (5.4) 20.3% 102.3 22.9% 125.3
* Adjusted is before the amortisation of acquired intangible assets.

Governance Company InformationDirectors Financial StatementsStrategic Report
45Rotork Annual Report 2016
TreasuryThe Group operates a centralised treasury function managed by a Treasury Committee chaired by the Finance Director and also comprising the Chief Executive, Group Financial Controller and Group Treasurer. The Committee meets regularly to consider foreign currency exposure, control over deposits, funding requirements and cash management. The Group Treasurer monitors compliance with the treasury policies and is responsible for overseeing all the Group’s banking relationships. A Subsidiary Treasury Policy restricts the actions subsidiaries can take and the Group Treasury Policy and Terms of Reference define the responsibilities of the Group Treasurer and Treasury Committee.
The Group uses financial instruments where appropriate to hedge significant currency transactions, principally forward exchange contracts and swaps. These financial instruments are used to reduce volatility which might affect the Group’s cash or income statement. In assessing the level of cash flows to hedge with forward exchange contracts, the maximum cover taken is 75% of forecast flows. The Board receives monthly treasury reports which summarise the Group’s foreign currency hedging position, distribution of cash balances and any significant changes to banking relationships.
The Group has three committed facilities with two different lenders comprising a one year £20m facility, which was extended during the year and now expires in August 2017, a £90m three year facility expiring in August 2018 and a five year £60m facility expiring in August 2020. At year end £155.5m of the committed facilities were drawn resulting in £54.5m being available.
Retirement benefitsThe Group accounts for post-retirement benefits in accordance with IAS 19, Employee Benefits. The balance sheet reflects the net deficit of these schemes at 31 December 2016 based on the market value of the assets at that date, and the valuation of liabilities using year end AA corporate bond yields. We have closed both the main defined benefit pension schemes to new entrants; the UK scheme in 2003 and the US one in 2009, in order to reduce the risk of volatility of the Group’s liabilities.
The most recent triennial valuation for the UK scheme took place as at 31 March 2016 and showed a decrease in the actuarial deficit of £1.5m to £32.5m and an increase in the funding level from 78% to 82% as investment outperformance, favourable changes in assumptions and additional Company contributions offset the negative impact of the continued reduction in gilt yields, which is the key driver behind the value of the scheme’s liabilities. A recovery plan has been agreed with the Trustees resulting in required annual contributions from the Company of £5.5m during 2016, 2017 and 2018, at which time the next valuation will take place.
On an accounting basis the deficit on the schemes increased from £23.3m to £58.5m during the year and the funding level decreased from 87% to 75%. The Company paid total contributions of £8.5m in the year and the scheme assets increased slightly in value. This was offset, however, by the largest drivers of the increased deficit which were the lower discount rate due to the fall in AA corporate bond rates and increased inflation rates.
The accounting deficit is higher than the actuarial deficit as on an accounting basis we are required to use AA corporate bond rates to value the liabilities. The actuarial valuation uses gilt yields since this most closely matches the investment strategy which is designed in part to hedge the interest rate and inflation risks borne by the scheme. Cash contributions are driven by the actuarial valuation.
DividendsThe Board is proposing a 1.6% increase in the final dividend to 3.15p per share. When taken together with the 1.95p interim dividend paid in September, the 5.10p represents a 1.0% increase in dividends over the prior year. This gives dividend cover of 1.5 times (2015: 1.7 times). Our dividend policy is to grow core dividends in line with earnings and supplement core dividends with additional dividends when the Board considers it appropriate to do so having considered the near-term expected cash requirements of the Group.

Rotork Annual Report 201646
2016 2016 2016 2016
2015 2015 2015 2015
2014 2014 2014 2014
2013 2013 2013 2013
2012 2012 2012 2012
8.0 20.0 130.1 23.4
-8.1 22.5 115.4 28.6
2.8 26.2 97.4 47.6
13.0 26.0 99.6 59.1
14.3 25.7 95.4 61.9
KEY PERFORMANCE INDICATORS
Sales revenue growth Return on sales Cash generation Return on capital employed Earnings per share growthAccident frequency rate (AFR)/
Lost time injury rates (LTIR) Carbon emissions Employee satisfaction
8.0% 20.0% 130.1% 23.4% -3.8% 0.26 / 0.36 25.0% 3.6AFR
LTIR
Reasons for choice
This is reported in detail for operating segments and is a key driver for the business. This measure enables us to track our overall success in specific project activity and our progress in increasing our market share by product and by region.
This measure brings together the combined effects of procurement costs and pricing as well as the leveraging of our operating assets. It is also a check on the quality of revenue growth but is heavily influenced by divisional mix.
This is used as a measure of performance where a target of 85% is regarded as a base level of achievement. Cash generation is also one of the constituent parts of the senior management reward system.
Rotork has an asset-light business model by design and reporting this ratio internally helps management at Group level monitor our adherence to this philosophy.
The measurement of earnings per share (EPS) reflects all aspects of the income statement including management of the Group’s tax rate.
The AFR is used as one measure of the effectiveness of our health and safety procedures. As we improve our safety performance, in future years we will measure all LTIR instead of those resulting in over three days’ lost time.
This KPI compares this year’s carbon emissions stated as a function of revenue with last year’s and is a broad measure of our impact on the environment.
The survey as a whole enabled the Group to get feedback from across the businesses on how we relate to our employees and what we can do better.
How we calculate
Increase in sales revenue year-on-year divided by prior year sales revenue.
Adjusted profit before tax (after financing and interest) shown as a percentage of sales revenue.
Cash flow from operating activities before tax outflows and the pension charge to cash adjustment as a percentage of adjusted operating profit.
Adjusted operating profit as a percentage of average capital employed. Capital employed is defined as shareholders’ funds less net cash held, with the pension fund deficit net of related deferred tax asset added back. The calculation is shown on page 138.
Increase in adjusted basic EPS (based on adjusted profit after tax) year-on-year divided by the prior year adjusted basic EPS.
The formula we have used for calculating our AFR is the number of reportable injuries resulting in over three days’ lost time divided by the number of hours worked multiplied by 100,000. LTIR will be calculated on the same basis but using the total number of reportable injuries.
Energy usage data (scope 1 and 2) is collected and converted to equivalent tonnes of CO2 and then reported as a function of revenue. Further details are contained in the corporate social responsibility report on page 57.
Employees scored their responses directly into a prepared survey with 1 being very dissatisfied and 5 being very satisfied.
Comments on results
The recent acquisitions made a significant contribution to the results of the Group, also aided by the impact of currency tailwinds. The market environment remained tough, and whilst our diversified end market and geographic exposure enabled us to deliver a solid set of results, underlying divisional revenues were affected by these headwinds.
The margin was impacted by the mix effect of the recent acquisitions and the impact of lower volumes, partially offset by material cost and overhead savings from our cost reduction programme, reflecting effective control over material and labour costs.
Disciplined working capital management generated a net cash inflow of £18.2m, excluding that added through acquisitions and impact of exchange rates, which is reflected in this KPI.
The main driver of the reduction in this measure was the increase in capital employed as a result of the acquisitions in each of the last two years.
The reduction in the Group’s effective tax rate, the result of the change in profit mix and the reduction in the UK Corporation tax rate, partially mitigated the decrease in profit before tax.
Whilst the AFR has increased slightly the overall number of days lost due to workplace injuries has decreased by 25% on the previous year due to our investment in health and safety training, audits to monitor compliance with procedures and initiatives to embed safe working practices.
The full year impact of the acquisitions has resulted in an increase in the Group energy usage. However, on a comparable basis the usage has remained broadly consistent.
The number of employees completing the survey was over 2,300, a 67% response rate (4% down on the previous year). The highest scoring questions were those on being proud of the products and services we provide our customers, our approach to health and safety and our values and ethics.
Financial KPIs
Growth of the business, quality of earnings and efficient use of resources are crucial target areas for Rotork and we employ a number of performance measures throughout Rotork to monitor them. The KPIs used to monitor the financial performance of the business are set out below.

Governance Company InformationDirectors Financial StatementsStrategic Report
Rotork Annual Report 2016 47
2016 2016 20162016-3.8
2016
2015 2015 20152015
2015
2014 2014 20142014
2014
2013 2013 20132013
2012 2012 20122012
0.26 25.0 3.6
0.36
0.25 22.8 3.6-21.0
0.42
0.31 19.2 3.65.4
0.62
0.33 17.9 3.614.3
0.46 19.2 3.613.6
Non-financial KPIs
We monitor non-financial areas in our businesses, particularly in the environmental, health and safety and quality control areas, and we place strong emphasis within our organisation on improving our performance here.
Sales revenue growth Return on sales Cash generation Return on capital employed Earnings per share growthAccident frequency rate (AFR)/
Lost time injury rates (LTIR) Carbon emissions Employee satisfaction
8.0% 20.0% 130.1% 23.4% -3.8% 0.26 / 0.36 25.0% 3.6AFR
LTIR
Reasons for choice
This is reported in detail for operating segments and is a key driver for the business. This measure enables us to track our overall success in specific project activity and our progress in increasing our market share by product and by region.
This measure brings together the combined effects of procurement costs and pricing as well as the leveraging of our operating assets. It is also a check on the quality of revenue growth but is heavily influenced by divisional mix.
This is used as a measure of performance where a target of 85% is regarded as a base level of achievement. Cash generation is also one of the constituent parts of the senior management reward system.
Rotork has an asset-light business model by design and reporting this ratio internally helps management at Group level monitor our adherence to this philosophy.
The measurement of earnings per share (EPS) reflects all aspects of the income statement including management of the Group’s tax rate.
The AFR is used as one measure of the effectiveness of our health and safety procedures. As we improve our safety performance, in future years we will measure all LTIR instead of those resulting in over three days’ lost time.
This KPI compares this year’s carbon emissions stated as a function of revenue with last year’s and is a broad measure of our impact on the environment.
The survey as a whole enabled the Group to get feedback from across the businesses on how we relate to our employees and what we can do better.
How we calculate
Increase in sales revenue year-on-year divided by prior year sales revenue.
Adjusted profit before tax (after financing and interest) shown as a percentage of sales revenue.
Cash flow from operating activities before tax outflows and the pension charge to cash adjustment as a percentage of adjusted operating profit.
Adjusted operating profit as a percentage of average capital employed. Capital employed is defined as shareholders’ funds less net cash held, with the pension fund deficit net of related deferred tax asset added back. The calculation is shown on page 138.
Increase in adjusted basic EPS (based on adjusted profit after tax) year-on-year divided by the prior year adjusted basic EPS.
The formula we have used for calculating our AFR is the number of reportable injuries resulting in over three days’ lost time divided by the number of hours worked multiplied by 100,000. LTIR will be calculated on the same basis but using the total number of reportable injuries.
Energy usage data (scope 1 and 2) is collected and converted to equivalent tonnes of CO2 and then reported as a function of revenue. Further details are contained in the corporate social responsibility report on page 57.
Employees scored their responses directly into a prepared survey with 1 being very dissatisfied and 5 being very satisfied.
Comments on results
The recent acquisitions made a significant contribution to the results of the Group, also aided by the impact of currency tailwinds. The market environment remained tough, and whilst our diversified end market and geographic exposure enabled us to deliver a solid set of results, underlying divisional revenues were affected by these headwinds.
The margin was impacted by the mix effect of the recent acquisitions and the impact of lower volumes, partially offset by material cost and overhead savings from our cost reduction programme, reflecting effective control over material and labour costs.
Disciplined working capital management generated a net cash inflow of £18.2m, excluding that added through acquisitions and impact of exchange rates, which is reflected in this KPI.
The main driver of the reduction in this measure was the increase in capital employed as a result of the acquisitions in each of the last two years.
The reduction in the Group’s effective tax rate, the result of the change in profit mix and the reduction in the UK Corporation tax rate, partially mitigated the decrease in profit before tax.
Whilst the AFR has increased slightly the overall number of days lost due to workplace injuries has decreased by 25% on the previous year due to our investment in health and safety training, audits to monitor compliance with procedures and initiatives to embed safe working practices.
The full year impact of the acquisitions has resulted in an increase in the Group energy usage. However, on a comparable basis the usage has remained broadly consistent.
The number of employees completing the survey was over 2,300, a 67% response rate (4% down on the previous year). The highest scoring questions were those on being proud of the products and services we provide our customers, our approach to health and safety and our values and ethics.

48 Rotork Annual Report 2016
CORPORATE SOCIAL
RESPONSIBILITY
We believe that being a responsible business by the effective management of social, ethical, health and safety and environmental matters is key to our success. It benefits our operational effectiveness, builds on the trust of our stakeholders and protects our reputation.
Employees worldwide
3,754Countries with a direct presence
38
Sustainability is an integral part of our business model and strategy. Achieving a positive impact around the world lies at the heart of our commitment to corporate social committee (CSR) and it represents a valuable opportunity to ensure that Rotork continues to be successful in the long-term. We are committed to embedding CSR values across all our processes and ways of working.
Rotork has been a member of the UN Global Compact since 2003 and continues to be included in the FTSE4Good index where we maintain an above average score in the global rankings, UK rankings and industry sector rankings.
We believe that the approach that we take to CSR helps to meet the expectations of our stakeholders and contributes to the success of our corporate strategy by promoting an effective and sustainable business.
Our Chief Executive chairs the CSR Committee and reports on progress to the Board. The CSR Committee is a management committee which has four sub-committees with each representing one of the areas of CSR described opposite. Presentations are given by the chairs of the four sub-committees to the Board on activity and progress in their areas of CSR during the year.
The diagram above sets out our CSR Committee structure.
ETHICS COMMITTEE
SOCIAL ISSUES COMMITTEE
ENVIRONMENTAL COMMITTEE
HEALTH AND SAFETY COMMITTEE
CORPORATE SOCIAL RESPONSIBILITY COMMITTEE

Governance Company InformationDirectors Financial StatementsStrategic Report
49Rotork Annual Report 2016
The Group’s approach is focused around four main areas:
Helping the environmentRotork is fully committed to reducing its impact on the environment by preventing pollution in all countries in which it operates, and to make sure it is compliant with any legal and regulatory requirements. Our compliance contributes to sustaining the environment and brings cost savings by reducing the consumption of energy, water and waste and recycling. The environmental programme is described in more detail on pages 54 to 57.
Health and safetyThe health and safety of all employees and contractors is of paramount importance in providing a safe working environment. Our fundamental principle, ‘if you cannot do a job safely, we will not do the job’, is actively promoted to everyone. This ensures that our people remain safe, and we enhance the effectiveness of our workforce by reducing the risk of injury and costs associated with injury or illness. The Group’s approach to health and safety can be found on pages 58 to 59.
Ethics and valuesEthics and values are fundamental to the way in which we do business. Respecting internationally proclaimed human rights, promoting an open and honest culture, having a zero tolerance to bribery and corruption worldwide, and selecting suppliers with sound reputations in the marketplace are important principles for the Group to adhere to. More details of the Group’s ethics and values can be found on pages 50 to 51.
Community involvementWe consider it important to contribute to and engage positively in the communities in which we operate, and to be a good community neighbour around the world. One of our corporate values is to produce a positive and beneficial impact in the areas in which we operate. Further details on community involvement can be found on pages 52 to 53.
Rotork Singapore employees support the Singapore Red Cross R.I.C.E. Project.

50 Rotork Annual Report 2016
Our ethics and values are central to the way we do business. These are set out in Rotork’s Ethics and Values Statement that can be viewed on our website, in a number of languages. Our ethics and values can be split into four strands:
Human rights and ethical businessRotork is fully committed to respecting internationally proclaimed human rights as defined in the International Declaration of Human Rights and the International Labour Organisation’s standards. We do not accept any form of child or forced labour and embracing the UN Global Compact principles throughout the business is a demonstration of this commitment. In line with the intent of the UK Modern Slavery Act, we are continuing to review the processes used with suppliers to address human rights risks in our supply chain. Further details will be contained in our first Modern Slavery Act statement which will be published during 2017.
We recognise that an open and honest culture is key to understanding concerns within the business and will investigate any potential wrongdoing. Rotork has a whistleblowing policy (which can be found on Rotork’s website), with an independent external whistleblowing hotline, to assist in facilitating the reporting of any concerns of wrongdoing confidentially.
EmployeesRotork has a firm commitment to all its employees regarding wellbeing and development. Many of our offices provide health checks for their employees, as well as encouraging participation in sports teams or one-off charitable events. More details regarding charitable activities can be found in the community involvement section (see pages 52 to 53).
CORPORATE SOCIAL RESPONSIBILITY continued
ETHICS AND VALUES
We have an objective and fair recruitment process which promotes equal opportunities across the Group in line with the ‘Respect at Work and Equality of Opportunity’ policy. We are committed to the principle of equal opportunities in employment to ensure that no employee or job applicant receives less favourable treatment because of their age, race, nationality, ethnic origin, disability, sex, sexual orientation, religion, belief or marital status. All employees have a responsibility to ensure that the policy is successfully implemented. This includes ensuring that work allocation and selection for hiring, promotion and training is carried out in a non-discriminatory manner.
Employee views and direct communication are part of our values and we run employee suggestion schemes, an annual Group-wide Employee Satisfaction Survey (ESS) and several locations have employee forums where employees can raise issues to be further considered by management.
Employees are briefed by management on various matters, including the Group’s performance, at regular intervals as well as the employee bonus performance which is profit related. Most locations participate in an employee profit linked share scheme.
We have has built a strong partnership with the Institution of Mechanical Engineers (IMechE) to support its engineers in gaining Incorporated and Chartered accreditation. We continue to work with IMechE in Leeds, which has an IMechE Industrial Liaison team who support members of the Institution and help to promote it internally and to the wider engineering community.
Rotork supports apprenticeship schemes for young men and women which helps to increase access into all aspects of Rotork’s business. Rotork belongs to a Standardisation Committee called the Manufacturers Standardization Society (MSS) that offers undergraduate and graduate scholarships.
We are committed to improving diversity across the Group. As at 31 December 2016, we had seven Board directors of which five are male and two are female. As at 31 December 2016, we had a total of 3,754 employees of which 3,015 were male and 739 were female. We also had 91 senior managers (excluding Board directors), 87 of which were male and four were female. Full details of Rotork’s diversity policy and targets can be found in the Nomination Committee Report on page 74.
Bribery and corruptionWe have a zero tolerance policy on bribery and corruption worldwide, irrespective of country or business culture. Rotork’s Ethics and Values Statement makes it clear that our employees will never offer, pay or solicit bribes in any form. Rotork does not make political contributions in cash or kind anywhere in the world.
The whistleblowing policy gives whistleblowers various ways to alert senior management, anonymously if required, to any suspected bribery or corruption. All whistleblowing concerns, however received, are investigated and reported to the Audit Committee. During 2016 the whistleblowing hotline received seven calls covering issues related to human resources, employment and dishonest behaviour. All were resolved satisfactorily. The Employee Satisfaction Survey for 2016 continued to show a relatively high level of understanding of how to raise a wrongdoing concern using the whistleblowing hotline. During the year further steps were taken to publicise and promote the hotline. To raise awareness further, we are developing a new online training module that will be rolled out to all employees across the Group in the first half of 2017.
See more at www.rotork.com/en/investors/index/corporatesocialresponsibility

Governance Company InformationDirectors Financial StatementsStrategic Report
51Rotork Annual Report 2016
Progress• All new suppliers to Rotork’s Bath manufacturing facility
were assessed and passed the approval system satisfactorily.
• Membership of FTSE4Good and UN Global Compact was maintained.
• Presentations relating to bribery and corruption were given by Rotork’s legal department to general managers and sales managers.
• The whistleblowing policy was communicated to all employees in each edition of the internal Rotork e-newsletter and on the Rotork intranet.
• Bribery and corruption refresher training was provided to employees who had received online bribery and corruption training over 12 months ago, in 13 languages.
• Information was circulated to agents on bribery and corruption issues in the form of a tailored booklet and compliance declarations were received from agents.
• A comprehensive bribery risk assessment was commenced.
2017 targets• Continue to make progress in increasing diversity across
Rotork.
• Ensure Rotork’s diversity policy is communicated across the Group.
• Continue to communicate the whistleblowing policy regularly through the Rotork e-newsletter.
• Continue to provide a refresher course in 2016 to all employees who have received online bribery and corruption training over 12 months ago.
• Ensure that all agents confirm in writing they have read and understand the information in the bribery and corruption booklet tailored for agents.
• Ensure the Group-wide bribery and corruption risk assessment exercise is completed by the end of 2017.
• Publish a Modern Slavery Act Statement on the Rotork website.
• Develop and rollout a whistleblowing online training module to all employees in the Group.
We frequently make use of detailed background checks provided by specialist bribery and corruption due diligence consultants before dealing with unknown third parties (including agents and on prospective acquisitions) particularly where they are operating in higher risk jurisdictions or market sectors. We also make use of objective guidance on country risk, such as the Corruption Perception Index by Transparency International. When working with unknown third parties, after the initial detailed background checks, we continue to screen these third parties via a large number of international sources, which can detect unethical behaviour including watchlists, sanctions lists and the media, using its due diligence consultants’ proprietary databases.
We are in the process of carrying out a comprehensive bribery risk assessment. As part of this process general managers across the Group have responded to a questionnaire covering bribery and corruption risk issues. The intention is to analyse the results and plot each business unit against the five main risk areas identified by Ministry of Justice Guidance to the Bribery Act 2010. The Audit Committee will consider the results and recommendations of the assessment.
We have developed and delivered anti-bribery and corruption training, including an assessment, to all employees working in sales and purchasing roles, as well as to senior accountants, all
managers and directors (including executive and non-executive directors). The anti-bribery and corruption training is delivered as an e-learning module. During 2016, those employees who had completed the course over 12 months ago received a refresher course. Both courses have been made available in numerous languages and almost 100% of employees required to complete a course have done so within the required period, including new employees from acquisitions. All the Company’s agents have received a bribery and corruption booklet which is required to be read by all employees of the agent working on the Rotork account. The relevant manager for the agent was required to sign off that this has been done.
SuppliersRotork operates an outsourced manufacturing model, selecting suppliers with sound reputations in the marketplace. Many of the suppliers have a long-term working relationship with the Group, ensuring ingrained product knowledge within the supply chain.
Suppliers are subject to continuous automated online monitoring against sanctions lists, watchlists, regulatory and court records and a large number of national and international media sources and the Group is alerted where any information is uncovered.
The supplier assessment programme includes CSR themed questions associated with equal rights and equal pay, anti-bribery and corruption policies, charitable giving, environmental impact and anti-compulsory or child labour practices. These surveys consider current and prospective suppliers. The assessments are discussed directly with the suppliers and any corrective action plan is agreed between the Company and the supplier.
Rotork Controls Limited and Rotork UK Limited, the Group’s main UK trading companies, and Rotork plc, are signatories to the Prompt Payment Code. This ensures suppliers are paid according to the terms agreed and this encourages good practice to be passed down supply chains.

52 Rotork Annual Report 2016
Rotork considers it important to contribute to and engage positively with stakeholders in the communities in which we operate, and to be a good community neighbour around the world.
We regard this as part of our ongoing responsibilities as a good corporate citizen. This links into our ethics and values which include producing a positive and beneficial impact in the areas in which we operate. One of the ways Rotork does this is by having local charity committees at each of our sites which donate to local charitable causes. This empowers local employees to decide how to distribute the funds in their local communities. Rotork aims to contribute 0.1% of profits to local charitable causes.
Local community involvement highlights from the year include:
• Bath (UK) employees donated an impressive amount of Easter gifts to the children’s ward of the local Royal United Hospital;
• Rochester (USA) organised an employee fundraiser for Red Nose Day, which raised almost $500 from employees and was matched by the Charity Committee for a total contribution of nearly $1,000;
• Gimpo (Korea) donated to a number of local charities that focus on supporting community members with disabilities;
• Rotterdam (Netherlands) employees volunteered for a day out at the zoo with disabled children from a local school. A €250 donation was also made to help build playing material in the school playground; and
• Winston-Salem (USA) employees supported The Salvation Army’s Angel Tree Programme by donating new clothing, shoes, and toys for around 30 less fortunate children in the local community.
CORPORATE SOCIAL RESPONSIBILITY continued
COMMUNITY INVOLVEMENT
In addition to local charitable and educational activities, Rotork has supported two major charities in 2016, WaterAid and Sightsavers.
The selected WaterAid project is situated in the South East Asian state of Timor-Leste. It began in 2015, and is scheduled to be completed by 2018. It aims to improve the lives of families living in 12 communities in rural Timor-Leste. Rotork’s support so far has helped the construction of four gravity flow systems, which has delivered clean, safe water to four local communities. Community members have been trained to fully own and understand their water systems to help maintain the taps and even carry out minor repairs.
Our donation has also helped 594 people benefit from the newly constructed toilets and handwashing stations. This has helped stop the spread of disease and ensured that the community stays healthy. Education sessions about the importance of handwashing with soap, good kitchen hygiene and the need to make toilets accessible for disabled members of the community, have been held. The project has also had a continued focus on empowering women and girls within the communities. Following gender equality sessions, men and women are now sharing the responsibility of household tasks, and women are playing a larger role in community decision-making.
Sightsavers is an international charity that works with partners in the developing world to combat avoidable blindness. In 2016, Rotork supported their Urban Eye Project in Bangalore, India which caters to the eye health needs of poor communities living in the local slums. Under the project, vision centres have been setup to provide eye screening services to poor people residing in the area. The centres are run by health workers and community volunteers who make the community aware when the screenings are taking place and the benefits of good eye health.
Furthermore, cataract treatment is provided to patients who are identified, and they are treated at the base hospital. For example, after hearing about an eye screening camp being conducted by Nayonika Eye Care Charitable Trust under Amrita Drishti in her area, Mallika Prabhavati (56) went for a free eye check-up. She was diagnosed with a cataract in her right eye and later received surgery free of charge in hospital. Rotork is proud to continue supporting this great cause.
A contribution of £3,454 was made to Seva Bharathi, a non-governmental organisation that focuses its work on the economically weaker sections of Indian society. Rotork’s donation has gone towards setting up the tuition centre for Kids AT Chennai. In addition, £12,000 was donated to The Forever Friends Appeal. This is the charity for The Royal United Hospitals, Bath UK (RUH) that funds projects for the hospitals, for example, assistance with the purchase of additional equipment and funding for research projects.

Governance Company InformationDirectors Financial StatementsStrategic Report
53Rotork Annual Report 2016
Progress• £50,000 contributed to WaterAid.
• £36,354 contributed to Sightsavers.
• £3,454 contributed to NGO Seva Bharathi.
• £12,000 contributed to The Forever Friends Appeal (RUH) Bath, UK.
• Variety of donations made to charitable causes relevant to the local communities of Rotork’s operating sites.
2017 targetsTo increase donations to charitable causes. The Group will:• Donate 0.1% of Group profits to Rotork’s
nominated international charity;
• Donate 0.1% of Group profits to charitable causes local to Rotork’s operating sites;
• Continue to support WaterAid and in particular the Timor-Leste Project; and
• Continue to support Sightsavers, specifically urban-based projects in India.
Credit: WaterAid/Tom Greenwood
Sightsavers

54 Rotork Annual Report 2016
CORPORATE SOCIAL RESPONSIBILITY continued
Rotork is fully committed to the prevention of pollution, to comply with all legal and regulatory requirements and to reduce our environmental impact by targeting key areas such as energy consumption, water consumption and waste.
HELPING THE
ENVIRONMENT
We continue with our assembly only philosophy in the majority of our business units where we utilise specialist suppliers for most of our manufactured components and assemblies. This philosophy has resulted in the majority of our energy being used on lighting, heating and cooling and IT systems. The acquisitions that occurred in 2015 have increased the amount of machining that we do and this is reflected in the energy profiles of these businesses. As a responsible global entity, we continue to influence the environmental performance of our supply chain through our supplier assessment programme.
Strategy • We will improve our operational efficiency
and enhance our environmental performance in order to secure the continued sustainability of the Group.
• We will work as a business, and in the local communities where we operate, to ensure that the environment on which we depend is maintained for future generations.
• We will encourage all employees to behave in an environmentally responsible manner by supporting the businesses in reducing waste, saving energy and water and using technology to reduce travel.
• We will continue to work in partnership with our regulatory bodies and respect the regulatory framework in which we work.
• As an environmentally responsible business, we will be open and transparent and report regularly to all relevant stakeholders on our environmental performance.
Corporate objectivesProgress has been made against the previous year’s objectives. All large facilities have a full energy balance in place, easy wins are being identified at a local level and controls are being implemented to help reduce consumption and control energy costs. Large energy saving projects are being assessed on a case-by-case basis and where viable are being implemented.
Organisational boundariesThe environmental report covers all operations and processes within the physical boundaries of the facilities and business transportation by company cars or vans or any private cars and hire cars used for business purposes only. Transportation of products by third parties are not covered by the report.
Where energy consumption cannot be verified, normally due to the size of the facility, then an estimation on the energy use per square metre of floor space occupied will be made. This estimation is based on The Chartered Institution of Building Services Engineers (CIBSE) Guide F – Energy Efficiency in Buildings. This estimation equates to 0.78% of total emissions declared.
Unique itemsDue to the growth through acquisition of the Group during 2015 and 2016, and the upgrading of the Lucca (Italy) facility, overall energy consumption has increased. Exceptional items that have caused this increase are:
• Full year reporting of Bifold Group (UK) and M&M (Italy);
• New facility and paint plant installation at Lucca (Italy); and
• Acquisition of Mastergear (Italy).

Governance Company InformationDirectors Financial StatementsStrategic Report
55Rotork Annual Report 2016
2016
2016 2016
2016
2016 2016
2015
2015 2015
2015
2015 2015
2014
2014 2014
2014
2014 2014
2013
2013 2013
2013
2013 2013
2012
2012 2012
2012
2012 2012
16,514
1,177 924
12,824
282 280
13,992
885 885
13,992
355 355
12,605
769 769
12,605
338 338
11,184
761 761
11,184
300 300
11,193
594 594
11,193
279 279
LPG (1,000 litres) (Exc. unique items)
Electricity (MWH) (Absolute)
Electricity (MWH) (Exc. unique items)
Gas (1,000m3) (Exc. unique items)
LPG (1,000 litres) (Absolute)
Gas (1,000m3) (Absolute)
ProgressThe baseline year remains at 2012. A number of acquisitions have occurred since 2012 that have affected the overall energy consumption. We also show figures after the removal of unique items to show the underlying trends in the organisation.
A number of key activities have occurred during the year that have impacted on our emissions. The new facility and installation of the painting plant at Lucca (Italy) has increased our direct emissions, though this has been offset by removing approximately 63 tonnes of carbon from the transportation of products and has removed approximately 500 road journeys from our supply chain. The energy consumption for the Lucca (Italy) subsidiary is in line with expectations.
The consolidation of some of our facilities in Italy and the USA have started to impact on the electricity consumption. The consolidation in Italy has resulted in approximately 18% reduction in electricity consumed on those sites. Further energy savings will occur when other consolidation activities are completed and full year figures are available. We continue to target electricity as part of our energy efficiency programme with 12 sites reducing electricity consumption by more than 5%.
Energy consumptionOverall electricity consumption has increased by 18% on the previous year and by 47.5% on the baseline of 2012. The increase is based on the full year reporting of Bifold Group (UK) and M&M (Italy), changes at Lucca (Italy) and the acquisition of Mastergear. Excluding these unique items, the electricity consumption has decreased by 8.3% on the previous year but increased by 14.6% on the baseline of 2012.
56 Rotork Annual Report 2016
CORPORATE SOCIAL RESPONSIBILITY continued
Absolute gas consumption increased by 32.9% on the previous year and 98.1% on the baseline year of 2012. The increase is due to the acquisition of Mastergear, full year reporting from Bifold Group (UK) and M&M (Italy) and the installation of the paint plant at Lucca (Italy). Excluding these unique items, gas consumption has increased by 4.4% on the previous year and increased by 55.5% on the baseline year of 2012. This is mainly due to colder weather conditions in 2016 than in 2015 and therefore increased use of heating.
In 2016, Liquid Petroleum Gas (LPG) consumption decreased by 20% on the previous year and increased 1% on the baseline of 2012. This significant change on the previous year is related to the consolidation activities in Italy and upgrading of equipment in Lucca (Italy).
Overall oil consumption has decreased on the previous year by 34% and also decreased on the baseline year of 2012 by 30%. Excluding unique items, oil consumption has decreased by 48% on the previous year and decreased by 64% on the baseline year of 2012. The main reasons for this reduction are the removal of the generator and upgrading of the electrical system at Bifold Marshalsea (UK) and more secure energy supply in India where generator use has reduced by approximately 20%.
To support the continued focus on energy management, our UK businesses continue to be certified to ISO50001 with the exception of the Bifold Group which will come under the certification during 2017. Surveillance audits were conducted through 2016 with no major non-conformances identified. The internal audit process ensures that those sites that are not certified to ISO50001 are managing their energy and looking at ways to reduce their consumption.
As we develop new sites or upgrade our existing sites, we will be introducing energy efficient solutions into the building design. Where viable we will also look at the generation of power from renewable sources, which will help to reduce the environmental impact of our business going forward.
Water consumptionAbsolute water consumption has increased by 30.6% on the previous year and by 65.7% on the baseline year. This is mainly due to the acquisition of Mastergear, full year reporting of Bifold Group (UK) and M&M (Italy) and the introduction of process related water at Lucca (Italy). Consumption, excluding unique items, has decreased by 13.6% on the previous year but increased by 8.6% on the baseline year.
Waste and recyclingThere are a number of local programmes in place to promote recycling and reduce waste across the Group. This has resulted in a reduction of waste generated by 59 tonnes in absolute terms but recycling has dropped to 76%. Further work will be done during 2017 to increase our recycling rates and reduce waste further.
Environmental incidents There have been no reportable environmental incidents during 2016. Systems are in place to address any environmental incident that occurs at our subsidiaries and the robustness of these emergency systems are included as part of our internal audit system.
Greenhouse gas reportingIn January 2017, EEF undertook an assurance audit of the Greenhouse Gas Emissions (GHG) report. The business reports on GHG Emission are in line with the GHG Emissions Protocol developed jointly by the World Business Council for Sustainable Development and the World Resource Institute. No significant issues were identified during the assurance audit.
HELPING THE
ENVIRONMENT

Governance Company InformationDirectors Financial StatementsStrategic Report
57Rotork Annual Report 2016
2016 2016
2016 2016
2016 2016
2015 2015
2015 2015
2015 2015
2014 2014
2014 2014
2014 2014
2013 2013
2013 2013
2013 2013
2012 2012
2012 2012
2012 2012
20,315 10,290
58 38
5,3964,448 5,3964,448
30,893 19,657
44 44
5,3175,024 5,3175,024
10,445 10,445
40 40
6,1825,231 6,1825,231
23,470 23,070
36 36
6,7415,725 6,7415,725
29,305 29,305
35 35
7,8026,973 6,2816,429
Scope 1 and 2 emissions (TnCO2e)(Exc. unique items)
Oil (1,000 litres) (Absolute)
Oil (1,000 litres) (Exc. unique items)
Water (1,000m3) (Exc. unique items)
Scope 1 and 2 emissions (TnCO2e)(Absolute)
Water (1,000m3) (Absolute)
■ Scope 1 ■ Scope 2 ■ Scope 1 ■ Scope 2
2016 2016
2015 2015
2014 2014
2013 2013
2012 2012
2,723 76
2,782 79
2,801 76
2,435 71
2,579 74
Recycle rate (%) Waste generated (Tonnes) (Absolute)
Greenhouse gas is measured across three different scopes:
Scope 1: Emissions that are direct GHG emissions from sources that are owned or controlled by Rotork. These include emissions from fossil fuels burned on site, emissions from owned or leased vehicles, and other direct sources.
Scope 2: Emissions that are indirect GHG emissions resulting from the generation of electricity, heating and cooling, or steam generated off-site but purchased for heating.
Scope 3: Emissions that are indirect GHG emissions from sources not owned or directly controlled by the entity but related to the entity’s activities. Scope 3 GHG emission sources currently required for GHG reporting include transmission and distribution, losses associated with purchased electricity and steam, and well-to-tank emissions for all energy, business travel and transport.
Absolute scope 1 and scope 2 emissions have increased by 18.5% from 2015 and by 50% from 2012. Excluding unique items, scope 1 and 2 emissions have increased by 2% on 2015 and increased by 29.1% from 2012. Emissions per £million turnover has increased from 22.8 TnCO2e to 25.0 TnCO2e.
ConclusionsOverall emissions have increased due to the unique items identified, and whilst the underlying trend is a reduction in consumption due to the consolidation of sites and energy reduction programmes, the emissions have increased slightly due to the emissions factors of each country in which we operate.
2017 targets To support the increase in the number of energy related projects that are occurring across our business, the following targets have been set:
• Project that delivers a 2% electricity saving on a 2016 baseline; and
• Project that delivers a 3% gas consumption for heating normalised on degree days.
More local stringent targets can be set where needed to support the energy reduction programme of the Group.

58 Rotork Annual Report 2016
CORPORATE SOCIAL RESPONSIBILITY continued
HEALTH AND SAFETY
Rotork is fully committed to the health, safety and wellbeing of its employees and contractors. We ensure compliance with all relevant legal and regulatory requirements and strive to continuously improve our health and safety performance.
Policies, procedures and systems of safe working are in place, supported with training to ensure the health, safety and wellbeing of our employees during their working day.
Fundamental principlesAs the business continues to grow, both organically and through acquisition, the fundamental principle of ‘If we cannot do a job safely, we will not do the job’ is maintained and communicated to all those who work for or on behalf of Rotork.
ProgressThe objective for 2016 was to have an accident frequency rate (AFR) below a target of 0.30. The actual AFR for 2016 is 0.26 which is below target and a decrease of 43% since 2012.
The AFR is a calculation of accidents resulting in over three days' lost time, divided by the average hours worked, multiplied by 100,000.
As we improve our safety performance, and following review, in the future lost time injury rates (LTIR) will be measured instead of AFR. The LTIR is a calculation of number of lost time incidents instead of only those resulting in three days’ lost time. This will require the business to focus on further improvements in our safety performance. The previous three
years LTIR has been shown in the opposite graph to give a comparison against the AFR. The current LTIR is 0.36 which is a 7% reduction on the previous year.
Whilst the AFR has increased slightly on the previous year, the overall number of days lost due to workplace injuries has decreased by 25% on the previous year.
The number of minor injuries has increased by 10% and reported near misses have increased by 75%. These increases are due to better reporting mechanisms and the promotion of reporting minor injuries and near misses rather than a decrease in health and safety performance.
Occupational healthThere have been no occupational diseases reported during 2016. Rotork continues to promote the wellbeing of its employees. This includes both physical health and mental wellbeing.
Awards and recognitionTo ensure high standards of health and safety performance, a number of businesses within the Group have gained or have maintained certification to OHSAS18001. These include facilities in Bergamo (Italy), Leeds (UK), Wolverhampton (UK) and Singapore.

Governance Company InformationDirectors Financial StatementsStrategic Report
59Rotork Annual Report 2016
Accident frequency rate and lost time incident rate
Assurance activitiesAfter the rebalancing of the audit standard last year, our subsidiaries have embraced the challenge for the continuous improvement of our health and safety standards. This year we increased our assurance audits compared to 2015, with a total of 85 audits being conducted. The increase was to support certification but also to support the maintenance of high standards of health and safety performance. Manufacturing facilities have increased their audit scores from 78% to 88%; sales and service divisions have increased their scores from 81% to 84%; and on site RSS audits saw their scores increase from 78% to 91%. The overall average audit score has increased from 78% to 86%.
No immediate actions were identified at any of the audits that were conducted. Corrective action plans are in place to ensure that issues raised during the internal audit process are tracked to closure.
Employee satisfaction surveyDuring 2016, 67% of the workforce completed an employee satisfaction survey. For the question, “I believe that Rotork cares about my health and safety” overall satisfaction was at 80%, this was a decrease of 1% on the previous year but the same as for 2014. We shall be reviewing the responses during 2017 to see where improvements can be made.
ConclusionsThroughout the year, health and safety continued to be a priority for employees and contractors. This can be seen by the improvements in the audit scores; reduction in lost time; and increase in ‘near miss’ reporting. We continue to learn from events, audits and inspections which enables us to continually improve our health and safety performance. As we move forward, we will be looking at innovative practices to improve our health and safety performance.
TargetsThe method adopted to set the LTIR target is the calculated average of the previous three years LTIR results. This sets the LTIR target for 2017 at below 0.47.
Americas 26%Asia Paci�c/Far East 28%East Europe 6%West Europe 18%Latin America 4%Middle East/Africa 12%UK 6%
0.0
0.1
0.2
0.3
0.4
0.5
0.6
0.7
20162015201420132012
AFR ActualLTIR ActualAFR Target
[XX.X]%
1
2
3

Rotork Annual Report 201660
EXPERIENCE
APPOINTED TO THE BOARD
EXTERNAL APPOINTMENTS
COMMITTEE MEMBERSHIP
1. Martin LambChairman
Martin has extensive experience in the global engineering sector. He worked for IMI plc for over 33 years in a number of senior management roles, joining the board in 1996, and served as Chief Executive from 2001 to 2013. He has served on the boards of a number of engineering businesses in a non-executive capacity, both in the public and private equity arena.
2014
Chairman of Evoqua Water Technologies LLC
Non-executive director of Mercia Technologies plc
Member of the European Advisory Board of AEA Investors (UK) Ltd
�
2. Peter FranceChief Executive
Peter was appointed as Chief Executive of Rotork plc in 2008. He joined Rotork in 1989 as an Inside Sales Engineer. In 1998, he was appointed director and General Manager at Rotork Singapore before becoming Managing Director of the Fluid Systems Division and then Chief Operating Officer.
2006
�
4. Lucinda BellNon-Executive Director
Lucinda is Chief Financial Officer of the British Land Company plc. She has served on the board of British Land since 2011 and has held a range of finance roles in the real estate industry.
2014
Chief Financial Officer of The British Land Company plc
���
3. Jonathan DavisFinance Director
Jonathan joined Rotork in 2002 after holding a number of finance positions in listed companies. He gained experience of the Rotork business, initially as Group Financial Controller, and then as Finance Director of the Rotork Controls division, and in 2010 was appointed Group Finance Director.
2010
BOARD OF DIRECTORS
1.
6.
7.
4.
3.
5.
2.

Company InformationFinancial StatementsStrategic Report
61Rotork Annual Report 2016
Directors GovernanceStrategic Report Directors
6. Sally JamesNon-Executive Director
Sally previously held senior legal roles in investment banking in London and Chicago including, Managing Director and EMEA General Counsel for UBS Investment Bank. She has also held the position of Bursar of Corpus Christi College, Cambridge.
2012
Non-executive director of Moneysupermarket.com Group PLC
Non-executive director of Abdi Limited
Trustee of Legal Education Foundation
���
7. John NicholasSenior Independent Director
John was appointed as Senior Independent Director of Rotork plc on 20 June 2014. Formerly, John was Group Finance Director of Tate & Lyle plc and Kidde plc.
2008
Non-executive director of Mondi plc
Non-executive director of Hunting plc
Chairman of Diploma plc
���
5. Gary BullardNon-Executive Director
Gary previously held senior management positions, including sales and marketing roles, at IBM and BT Group plc and was a non-executive director of Chloride Group plc. Gary most recently held the position of President Logica UK until October 2012 and was a member of the Executive Committee of Logica plc.
2010
Founder and CEO of Catquin Ltd
Chairman of New Model Identity Ltd
Non-executive director of Spirent Communications plc
���
���
Nomination
Audit
Remuneration
Denotes Chair of Committee
62 Rotork Annual Report 2016
Statement from the ChairmanI am pleased to set out our Corporate Governance Report on pages 62 to 69. The aim of this report is to provide a clear and comprehensive explanation of Rotork‘s governance framework and how it is applied day-to-day. Whilst ensuring that we provide detailed reporting in our Corporate Governance Report, we have sought to place emphasis on explaining how the principles of the UK Corporate Governance Code (the Code) are applied across our Group.
I believe that strong corporate governance has a key role to play in protecting our business and its long-term success, especially in challenging market conditions. It is important for good governance to resonate throughout our entire organisation and at Rotork we seek to apply it across all our activities around the world in a consistent and unified way to create and maintain the right culture throughout the Group.
The current environment has driven an emphasis on continuous strategy evaluation and refinement throughout the year, to ensure that the Group responds dynamically to changing market, economic and political situations.
Execution of the Group‘s strategy has been aided by the risk processes that were introduced during 2015. These included a new risk appetite framework, improved risk reporting procedures and an augmented risk assessment process. These were reviewed and further refined in 2016. Our robust risk processes ensure that not only do we as a Board accurately identify and quantify the risks faced by the Group, but that the Board‘s appetite for risk informs decision making throughout the Group, so we can prudently take advantage of the opportunities that changing markets inevitably present. The Board is pleased by the manner in which the foundations laid last year successfully informed these strategic debates.
As highlighted in last year‘s Annual Report and Accounts, the Board delayed its 2015 annual performance review until early 2016, to enable an enhanced review to be conducted in conjunction with an external facilitator that included one-on-one interviews with the directors and completion of a questionnaire. This process, and the outputs from it, are discussed in more detail overleaf.
Martin LambChairman
CORPORATE GOVERNANCE
REPORT

Governance Company InformationDirectors Financial StatementsStrategic Report
63Rotork Annual Report 2016
During the year the Board has examined the role that the Group's culture plays in the development of the business and considered the Financial Reporting Council's (FRC) Report on Corporate Culture and the Role of Boards that was published in July. The Board recognises that a good corporate culture is essential to the creation of long-term value. It has sought to distil the essence of that culture so that it can be clearly communicated with the business as it continues to grow and enter new markets both by organic growth and acquisition. Our culture is described in more detail on pages 20 and 21.
Rotork is subject to the Code, and I am happy to report that throughout 2016 Rotork has complied with the revised Code in all respects.
Finally, the reports of the Board's principal Committees are set out on pages 70 to 93. I would like to thank John Nicholas for his long-standing service to each of these Committees, as a previous Chair of the Audit Committee and as the Senior Independent Director. Following John's retirement in February 2017, Sally James has been appointed Senior Independent Director and Lucinda Bell has been appointed Chair of the Audit Committee to replace Sally James.
A summary of the business the Board considered during 2016 is set out on page 64. However, I firmly believe that corporate governance does not stop at the boardroom door. It is important that the strong governance principles demonstrated by the Board are carried on throughout the Group at every level and in every location.
Jan Feb Mar Apr May Jun Jul Aug Sept Oct Nov Dec
Dates of 2016 Board meetings
✔ ✔ ✔✔ ✔✔ ✔ ✔ ✔✔ ✔

64 Rotork Annual Report 2016
CORPORATE GOVERNANCE REPORT continued
strategy and acquisitions
Business review,
Fina
ncial
perfo
rman
ce Governance
and stakeholders
and risk m
anag
emen
t
Internal cont
rols
Board activity 2016
Business review, strategy and acquisitions• Received regular performance and business updates
from the Chief Executive.
• Set the Group‘s strategy and vision, with an emphasis on addressing the challenges facing the Group as a result of continuing challenges in its markets during the year.
• Received presentations from divisional and Group business function managers to consolidate understanding and awareness of activities and performance within the relevant divisions and business functions.
• Consideration and approval of Mastergear acquisition.
• Received regular briefings on potential acquisition targets from the Chief Executive.
Financial performance• Received regular financial performance updates from
the Finance Director.
• Approval of 2017 budget.
• Consideration of 2015 financial statements.
• Approval of 2015 final dividend recommendation and 2016 interim dividend declaration.
Governance and stakeholders• Series of meetings undertaken between the Chair of
the Remuneration Committee and key shareholders.
• Approval of 2015 Annual Report and Accounts and Annual General Meeting (AGM) business.
• Approval of interim report and trading updates.
• Consideration of FRC report on corporate culture.
• Regular review of feedback from institutional shareholders.
• Adoption of revised schedule of matters reserved for the Board.
Internal controls and risk management• Approval of appointment of new Head of Risk and
Internal Audit.
• Received regular reports on risk including, quarterly executive risk summary.
• Received regular reports on litigation and regulatory matters.
• Received a presentation on IT and cyber security.
• Review of effectiveness of risk management and internal control systems.
• Established Disclosure Committee and implemented new internal procedures to reflect the introduction of the EU Market Abuse Regulation.

Governance Company InformationDirectors Financial StatementsStrategic Report
65Rotork Annual Report 2016
Americas 26%Asia Paci�c/Far East 28%East Europe 6%West Europe 18%Latin America 4%Middle East/Africa 12%UK 6%
[XX.X]%
Americas 26%Asia Paci�c/Far East 28%East Europe 6%West Europe 18%Latin America 4%Middle East/Africa 12%UK 6%
[XX.X]%
Americas 26%Asia Paci�c/Far East 28%East Europe 6%West Europe 18%Latin America 4%Middle East/Africa 12%UK 6%
[XX.X]%
UK Corporate Governance Code compliance statementThe following section on pages 65 to 69 is a summary of the system of corporate governance adopted by Rotork. Throughout the year ended 31 December 2016, Rotork plc fully complied with the Code. The Code is available to download at www.frc.org.uk.
The BoardThe Board has a duty to promote the long-term success of Rotork for its shareholders; accomplished by entrepreneurial leadership within a framework of prudent and effective controls. Its role therefore includes approval of strategy, risk reviews, finance matters and internal control and risk management including major contract approvals.
The terms and conditions of appointment of directors are available for inspection during business hours at the registered office of Rotork plc and at the AGM.
Board composition Rotork is led by an effective Board which currently consists of six members (seven as at 31 December 2016 prior to the retirement of John Nicholas): the Chairman, three independent non-executive directors and two executive directors. Apart from the Chairman, all non-executive directors are considered to be independent from Rotork and are appointed for an initial term of three years. Upon the completion of this term, the appointment is reviewed and, if appropriate, extended.
Rotork is compliant with the recommendations of Lord Davies’ 'Women on Boards' initiative, with female representation on the Board standing at 29% as at 31 December 2016.
The biographies of the directors and details of Board committee membership are set out on pages 60 to 61.
All directors are subject to annual re-election at the AGM in line with the Code.
Directors’ attendance at Board and Committee meetings during 2016
No. of meetings
BoardAudit
CommitteeRemuneration
CommitteeNomination Committee
Bob Arnold 7(ii) 3(i) 0 0Lucinda Bell 11 5 4 3Gary Bullard 11 5 4 3Jonathan Davis 11 5(i) 1(i) 1(i)
Peter France 11 5(i) 4(i) 3Sally James 11 5 4 3Martin Lamb 11 5(i) 4(i) 3John Nicholas 10 4 4 3
(i) By invitation.(ii) Bob Arnold retired from the Board on 31 August 2016.
Roles and responsibilitiesThere is a documented clear division of responsibilities between the Chairman and the Chief Executive to ensure that there is a balance of power and authority between leadership of the Board and executive leadership.
All directors are entitled to seek independent, professional advice at the Company‘s expense, and arranged by the Company Secretary, in order to discharge their responsibilities as directors. Rotork maintains appropriate directors’ and officers’ insurance cover.
Length of tenure of independent non-executive directors as at 31 December 2016
Balance of independent non-executive directors and executive directors as at 31 December 2016
Balance between male and female directors on the Board as at 31 December 2016
Male
Non-executive Chairman
0-3 years
3-6 years
6-9 years
Non-executive directors
Executive directors
Female

66 Rotork Annual Report 2016
management reporting packs circulated to the Board to further ensure that the non-executive directors receive focused, concise and relevant information from the executive management team. Further work will be done on this in 2017. The Chairman and the Company Secretary discuss the agenda in detail ahead of every meeting and the Chairman and Chief Executive hold a review meeting ahead of each Board meeting.
At least once annually, the Board travels to and meets at one of Rotork‘s locations other than its head office in Bath. This allows the Board, and, in particular, the non-executive directors, the opportunity to gain a deeper understanding of overseas businesses and their markets and to interact with local management and staff, as well as to view new capital investments and acquisitions. In 2016, the Board visited Rotork‘s newly-completed manufacturing facility in Lucca (Italy) and met with, and received presentations from, local management.
How the Board operates effectivelyBoard activitiesAs part of Rotork‘s Board effectiveness, day-to-day responsibility forthe running of the Company is delegated to executive management. However, there are a number of matters where, because of their importance to the Group, it is not considered appropriate to do this. The Board therefore has a formal and documented schedule of matters reserved for its decision. This schedule was updated during the course of 2016 and can be found on the Company‘s website at www.rotork.com/en/investors/index/theboard.
In 2016, there were 11 Board meetings in total. The Chairman, through the Company Secretary, ensures that the Board agenda and all relevant information is circulated to the Board members sufficiently in advance of the meeting. Following feedback from the Board‘s 2016 performance review, the Board held a workshop to consider changes to the
CORPORATE GOVERNANCE REPORT continued
■ 2016 – Lucca, Italy■ 2015 – Shanghai, China■ 2014 – Winston-Salem, USA■ 2013 – Lucca, Italy■ 2012 – Chennai, India
Location of Board meetings
Board meetings held outside the UK in past five years:

Governance Company InformationDirectors Financial StatementsStrategic Report
67Rotork Annual Report 2016
All non-executive directors constructively challenge executive management at Board meetings and are entitled to unfettered access to information and management across the Group. Rotork‘s executive directors understand the distinction between their roles as executive managers and as Board directors. Rotork Board members come from a variety of professional backgrounds including engineering, legal, accountancy and international sales and collectively possess significant managerial experience, as well as experience of being company directors of other public limited companies.
At each Board meeting, the Board receives presentations from senior management (including all divisional managing directors during the year) regarding that senior manager‘s area of responsibility. The principal purpose of the presentations is to consolidate the Board‘s understanding of the Group‘s operations, and in particular current strategic and operational issues facing divisional and business functional management. The presentations are structured so that the Board has the opportunity to ask questions and constructively challenge senior management at their presentations. Management presentations normally take place at the start of the meeting so that any issues raised in them can be considered in wider Board discussions, particularly around strategy and risk.
The Chief Executive and Finance Director present to the Board the content of preliminary and half year results announcements and the Board also considers trading updates.
Induction and development New Board members receive a suitable and tailored induction. This is facilitated by the Company Secretary. No new director appointments were made in 2016.
Directors are encouraged to continually update their professional skills and knowledge. During 2016, development activities for the directors included participation in external training seminars. All the non-executive directors are members of the Deloitte Academy which provides a wide range of training opportunities for FTSE 350 board directors.
The Chairman is responsible for reviewing the level and nature of training given to the Board at least annually.
Performance evaluationsThe formal performance evaluation of the Board in accordance with Code Provision B.6 took place in February and March 2016. As discussed in last year‘s Annual Report and Accounts, the Board‘s evaluation of its performance in 2015 was delayed until the first quarter of 2016 to allow the Chairman time to form a view of the dynamics of the Board under his chairmanship.
As in previous years, the evaluation was externally facilitated by Vivienne Cassley of Useful Thinking, an independent external consultancy, and took the form of structured, one-on-one, interviews with each Board member and a written questionnaire. The facilitators noted a culture of rigorous and constructive challenge. The Board is self-critical, and is continuously looking to improve its performance. In this respect, the appointment of new members to the Board in recent years has provided a valuable opportunity to review and refresh the approach to achieving best practice.
Key areas identified by the evaluation process as requiring focus included: the structure and content of Board reports; the Group management structure; information on the competitive environment and Rotork‘s relative position; the acquisition process, integration and post-acquisition reviews; and succession planning and recruitment.
Board workshops were held in 2016 to consider the structure and content of board reports and the management structure. These will be given further consideration by the Board in 2017. At the December Board meeting, there was a presentation to the Board on the competitive landscape and further presentations are planned for 2017. Further Board workshops are due to be held in March and April 2017 to consider the acquisition process and succession planning and recruitment.
All Board members were mindful of the changing external environment and the challenges this presents to the business. During the year there had been a strong focus on the Group‘s culture and on its internal controls to ensure that these are keeping pace with Rotork‘s commercial development. In reviewing performance during the year, the directors particularly noted the success of work undertaken around risk appetite and the way in which this informs strategic debate.
The Senior Independent Director annually arranges a meeting of the non-executive directors to appraise the Chairman‘s performance. This feedback is used by the Senior Independent Director to discuss with the Chairman his performance.
68 Rotork Annual Report 2016
CORPORATE GOVERNANCE REPORT continued
Internal controls and risk managementThe Board is responsible for Rotork’s system of internal control and risk management and the review of the system’s effectiveness is done with the assistance of the Audit Committee.
During 2016, the Board regularly reviewed the effectiveness of the Group’s risk management and internal control systems. The systems which were in place for the year under review, and up to the date of approval of the report, are in accordance with the Code and the FRC Guidance on Risk Management, Internal Control and Related Financial and Business Reporting. No significant failings or weaknesses were identified.
Risk appetite framework and monitoring of risk management and internal controlsThe Group has adopted a risk review process at a divisional level for many years, resulting in a 'bottom up' assessment and consolidation of the risks facing the Group before the “top down” review is performed. To complement this review process, the risk appetite framework (RAF) was introduced in 2015. This has:
• Enhanced the incorporation of risk into strategic decision making at Board and divisional management levels;
• Improved quantitative and qualitative insight into principal risks and associated trends;
• Enabled the Board to lead by example in creating a risk aware culture and ensured consistency in decision making; and
• Facilitated proactive risk mitigation.
A quarterly executive risk summary was also introduced in 2015 to ensure ongoing oversight of the Group‘s risk management and internal controls, with quarterly reporting being supplemented as necessary by monthly reporting to the Board by the executive management team on new or evolving risks.
The effectiveness of the new processes were reviewed during the course of the year, and were found to have resulted in improvements in the Board‘s decision making. Refinements to both the processes and analytical metrics used by the Board to assess and quantify risk to reflect best practice were made following the appointment of the Head of Risk and Internal Audit in April 2016.
In addition to the reporting framework described above, all members of the Board receive full Audit Committee papers and prior meeting minutes, which contain the Audit Committee‘s assessment of the effectiveness of the Group‘s risk management and internal control systems. All non-executive directors are members of the Audit Committee and the executive directors and the Chairman also attend Audit Committee meetings.
In the course of its activities during the year the internal audit team identified improvement recommendations at all locations visited. These were discussed with local management at the end of the audit and they are charged with implementing the agreed improvement actions.
Main features of the Group‘s risk management and internal control systemsRisk management and internal control can only provide reasonable, not absolute, assurance against material misstatement or loss, as it is designed to manage the risks rather than remove them altogether.
The systems cover controls which enable Rotork to respond appropriately to financial, operational, compliance and any other risks. Key elements include:
• Robust assurance processes and controls over financial reporting procedures;
• A formal schedule of reserved matters for the Board including responsibility for reviewing Group strategy;
• Clearly defined levels of authority and a division of responsibilities throughout the Group;
• Formal documentation procedures;
• A formal whistleblowing policy with an external whistleblowing hotline; and
• An internal audit function made up of accountants from head office and across subsidiaries, managed by an experienced Head of Risk and Internal Audit and supported by internal audit training, best practice and control procedures to monitor and identify weaknesses in internal controls.
Further details of the Group’s internal control and risk management systems and the process for identifying, evaluating and managing the principal risks faced by the Group during 2016, including the Board’s approach to the principal risks the Group is willing to take in achieving its objectives (its ‘risk appetite’), are contained on pages 28 to 35.
Relations with shareholdersCommunication with shareholders is a priority for Rotork and the Company maintains a regular dialogue with its major shareholders. In 2016, the Board, and in particular the Chief Executive and Finance Director, have engaged with shareholders in a number of ways including:
• Hosting conference calls;
• Hosting webcasts;
• Attending shareholder events;
• Hosting investor site visits;
• Attending conferences;
• Hosting and participating in roadshows; and
• Arranging ad hoc meetings with shareholders.
A Director of Strategy and Investor Relations was appointed in January 2017 to increase the resources available to support existing and potential shareholders and enhance our reporting to shareholders.

Governance Company InformationDirectors Financial StatementsStrategic Report
69Rotork Annual Report 2016
The Chairman ensures that all directors are made aware of major shareholder issues and concerns by ensuring the Board receives reports from the Chief Executive on meetings with analysts and fund managers as well as shareholders. In addition, the Board receives reports from its brokers which give anonymised feedback from investors.
Rotork makes constructive use of its AGM as an opportunity for the Board to communicate with and answer questions from shareholders who attend in person. The entire Board is normally available during the meeting, and for lunch following the meeting, to allow direct interaction between the directors and the shareholders. This year, Rotork will adopt automatic poll voting at its AGM in order to better reflect the views of shareholders; previously voting on resolutions was generally undertaken on a show of hands at the AGM itself. Automatic poll voting ensures that all votes cast in person or by proxy are taken into account on a particular resolution.
Rotork also maintains a comprehensive investor relations section on its website which provides a variety of resources for investors including current webcasts, presentations and press releases as well as annual interim reports. The website can be accessed at www.rotork.com/en/investors.
Electronic communications are also used by Rotork to communicate with its shareholders. All shareholders have been asked whether they would like to receive the Annual Report and Accounts in electronic form rather than in hard copy form. Any shareholders wishing to receive corporate documents electronically can do this by registering for the service at www.shareview.co.uk and clicking on ‘Register’ under the ‘Shareview Portfolio’ section. Rotork also make available electronic proxy appointments for shareholders who wish to appoint a proxy online to vote at the Company‘s AGM.
Board CommitteesThe Board has Audit, Nomination and Remuneration Committees. Each Committee has formal, written terms of reference which are available to download from the Rotork website at www.rotork.com/en/investors/index/committees. All Committees have at least three independent non-executive directors within their composition. The Company Secretary advises and acts as secretary to the Committees.
During the course of the year, the Board also established a Disclosure Committee to ensure that Rotork complies with its obligations in relation to the control and disclosure of inside information under the EU Market Abuse Regulation which was introduced in July 2016. Membership of
the Disclosure Committee currently comprises the Chief Executive, the Finance Director and the Company Secretary and operates under formal, written terms of reference.
The Committees have authority to take external, independent professional advice at Rotork‘s expense for matters relating to the discharge of their duties.
Chairman of the Board and Chairs of the Committees as at 31 December 2016
PLC BoardMartin Lamb
AuditCommittee Sally James*
*Sally James was replaced by Lucinda Bell on 27 February 2017.
NominationCommitteeMartin Lamb
RemunerationCommitteeGary Bullard
Martin LambChairman 27 February 2017

70 Rotork Annual Report 2016
During 2016, in addition to its usual schedule of work, the Audit Committee focused on two key elements:
• The effectiveness of the Group‘s internal audit processes; and
• A review of the effectiveness of changes made to the Group‘s risk management and internal controls during 2015.
The membership of the Audit Committee was unchanged during the year ended 31 December 2016, but John Nicholas retired from the Audit Committee on his retirement from the Board on 24 February 2017 and Lucinda Bell replaced Sally James as Chair of the Audit Committee on 27 February 2017.
All Audit Committee members are independent non-executive directors. Lucinda Bell and John Nicholas hold professional accounting qualifications and the Board considers both to have recent and relevant financial experience. Biographies of each member of the Audit Committee can be found on pages 60 to 61. The Head of Risk and Internal Audit, the Risk and Audit Manager, the Chairman, the Chief Executive, the Finance Director, the Group Financial Controller, and representatives of the external auditor (including the principal audit partner) also regularly attend meetings by invitation.
The Audit Committee operates under formal terms of reference which are reviewed annually. A copy of the terms of reference is available on the Rotork website at www.rotork.com/en/investors/index/committees. Principal responsibilities are to review and report to the Board on:
• The integrity of financial reporting;
• Significant accounting policies and judgments;
• Internal control and risk management systems including monitoring the effectiveness of internal audit;
• The appointment, independence and effectiveness of the external auditor, including the policy relating to non-audit work and policy relating to employment of former staff of the external auditor;
• The external auditor‘s remuneration; and
• Whistleblowing and other Group policies as relevant.
AUDIT COMMITTEE
REPORT
Sally JamesChair of the Audit Committee
Activities of the Audit Committee during the yearThe Audit Committee maintains an annual schedule of work which is kept under review and forms the basis of its principal meetings throughout the year. The annual schedule is supplemented by consideration of specific issues as and when they arise. The Audit Committee met five times during the year. Meetings of the Audit Committee are arranged to co-ordinate with the Group‘s financial reporting timetable to ensure appropriate scrutiny by the Audit Committee of such announcements, including, in particular, review of year end and interim financial reports, in addition to other trading updates made during the year. A summary of its principal activities is set out opposite.

Governance Company InformationDirectors Financial StatementsStrategic Report
71Rotork Annual Report 2016
Audit Committee activity 2016A summary of its principal activities is set out below:
Jan Feb Mar Apr May Jun Jul Aug Sept Oct Nov Dec
Dates of 2016 Audit committee meetings
Members1: Lucinda Bell, Gary Bullard and John Nicholas
✔ ✔ ✔ ✔✔
External audit
Fina
ncial
repo
rting
Internal controls
and risk managem
ent
Other wor
k
Financial reporting• Review of the Annual Report and Accounts including
material judgments and estimates, and the governance reports and draft results announcements.
• Review of the going concern assumption and the viability statement in the Annual Report and Accounts.
• Review of half year accounts including material judgments, estimates and draft half year results announcements.
• Review of external auditor‘s report on the half year accounts and the proposed full year external audit scope, key risks, materiality and year end issues.
• Review of trading updates.
Internal controls and risk management• Internal controls and risk management review including,
consideration of processes and procedures for risk management, effectiveness of internal controls and fraud risk.
• Review of internal audit reports, the internal audit programme, its remit, resourcing and effectiveness.
• Appointment of Head of Risk and Internal Audit.
• Meetings with the Head of Risk and Internal Audit without management present.
• Review of anti-bribery and corruption policy and procedures including training and communication.
• Review of whistleblowing policy, the whistleblowing hotline and procedures including training and communication, and received reports on whistleblowing matters.
External audit• Consideration of and reporting to the Board on the
external auditor‘s independence, objectivity and effectiveness including the annual audit.
• Review of management's representation letter to the auditor, views on the control environment and fraud risk management.
• Meeting with the external auditor without the presence of management.
• Review of non-audit services undertaken by the external auditor and consideration of policy on non-audit work.
• Consideration of audit fees, engagement terms and risk of external auditor leaving the market.
• Consideration of re-tendering the external audit contract.
• Review of policies on the employment of ex-employees of the external auditor.
Other work• Assessing implementation by the Group of recent changes to the
Code and related guidance for audit committees.
• Consideration of accounting and corporate governance developments.
• Review of Audit Committee effectiveness and Terms of Reference.
1 As at 31 December 2016.

72 Rotork Annual Report 2016
Financial reportingA key role of the Audit Committee in relation to financial reporting is to review the quality and appropriateness of the half year and year end financial statements with a particular focus on:
• Accounting policies and practices;
• The clarity of disclosures and compliance with International Financial Reporting Standards, UK company law and the Code;
• Material areas in which significant judgments have been applied or where there has been discussion with the external auditor; and
• Upon request of the Board, advising the Board on whether the Annual Report and Accounts are fair, balanced and understandable and provide the information necessary for shareholders to assess the Company‘s performance as a whole.
To assist the Audit Committee, the Finance Director and the Group Financial Controller present a detailed report at each meeting outlining significant matters and the external auditor presents a report on the work they have undertaken on the half year and year end financial statements. They also present on the scope for the next full year audit for consideration by the Audit Committee.
The principal matters of judgment considered by the Audit Committee in relation to the 2016 accounts and how they were addressed were:
• Goodwill impairment testing. The year end balance sheet includes goodwill of £251.4m, which represents approximately 32.4% of the Group‘s assets. The Audit Committee reviewed the carrying value of goodwill by examining a report from the Group Financial Controller which set out the values attributable to each cash generating unit, the expected value in use, based on projected cash flows and the key economic assumptions related to growth and discount rates. The report included a detailed impairment review paper for Bifold as this was the cash-generating unit identified as being most sensitive to changes in the key assumptions. This paper was reviewed by the Board in December 2016 and finalised in January 2017 after being updated for the Board‘s comments. The Audit Committee discussed the appropriateness of the assumptions used, compared expected growth rates to historical averages and relevant market data and compared the discount rates to the Group weighted average cost of capital and appropriate risk premiums. The Audit Committee also considered whether it was possible that a reasonable change in assumptions might indicate impairment. Following discussion, the Audit Committee were satisfied that the approach taken by management was appropriate, that there was no requirement to record any impairments in the accounts and that the sensitivity analysis in relation to Bifold as disclosed in note 10 is also appropriate;
• Retirement benefit schemes. The Group operates two defined benefit retirement plans which are still open to future accrual. The valuations are prepared by an independent qualified actuary. The Audit Committee considered the report from the Group Financial Controller and were satisfied the assumptions used were appropriate. The detailed disclosure for these schemes under IAS 19 are shown in note 24 and the Audit Committee is satisfied they are complete and accurate; and
• Valuation of inventory. The Group has £85.8m of inventory which is spread across the Group‘s global locations. The provisions made to write down slow-moving and obsolete inventory are based on an assessment of market developments and on an analysis of historic and projected usage. The calculation of the provisions requires application of judgment by management. Management confirmed to the Audit Committee that there have been no significant changes to the approach used to estimate inventory provisions compared with the prior year. Following discussion, the Audit Committee was satisfied that the judgments that had been exercised and valuation methodology were appropriate and that the provisions were appropriately stated at year end.
External auditorThe year under review marks the third year during which Deloitte LLP has been the Group‘s external auditor. The Audit Committee assesses the effectiveness of the external audit process, the scope of the Group audit and the quality of the audit work throughout the year.
The assessment considers:
• Any issues arising from the prior year audit;
• The proposed audit plan including identification of risks specific to Rotork;
• Audit scope and materiality thresholds;
• Staffing continuity and experience;
• The delivery of the audit in line with the plan;
• Matters arising during the audit and the communication of these to the Audit Committee;
• Feedback from executive management;
• Private meetings with the auditor and the Head of Risk and Internal Audit without management being present;
• The independence, objectivity and scepticism of the auditor; and
• The FRC audit quality review report on selected audits undertaken by Deloitte.
Having completed this review, the Audit Committee agreed that the audit process, independence and quality of the external audit were satisfactory.
Consideration was given to the possibility of re-tendering the external work during the course of the year. The Audit Committee has recommended that Deloitte LLP be re-appointed auditors for the 2017 financial year and Deloitte‘s continuing appointment will be subject to shareholder approval at the 2017 AGM.
Statement of compliance The Company confirms that it has complied with terms of The Statutory Audit Services for Large Companies Market Investigation (Mandatory Use of Competitive Tender Processes and Audit Committee Responsibilities) Order 2014 (the Order) throughout the year.
In addition to requiring mandatory audit re-tendering at least every 10 years for FTSE 350 companies, the Order provides that only the Audit Committee, acting collectively or through its Chair, and for and on behalf of the Board, is permitted:
• To the extent permissible by law and regulations, to negotiate and agree the statutory audit fee and the scope of the statutory audit;
• To initiate and supervise a competitive tender process;
• To make recommendations to the directors as to the auditor appointment pursuant to a competitive tender process;
• To influence the appointment of the audit engagement partner; and
• To authorise an auditor to provide any non-audit services to the Group, prior to the commencement of those non-audit services.
Non-audit servicesIn order to safeguard the independence and objectivity of the external auditor, the Board has adopted a policy on non-audit services which restricts the work and fees available to the external audit firm, and the policy is reviewed by the Audit Committee annually to ensure it remains appropriate and in line with applicable requirements.
The policy specifies certain activities which the external auditor may not undertake such as tax services and services related to the internal audit function.
AUDIT COMMITTEE REPORT continued

Governance Company InformationDirectors Financial StatementsStrategic Report
73Rotork Annual Report 2016
The policy has been recently amended in response to EU legislation on permitted non-audit fee services which came into effect on 17 June 2016. The changes include: further restrictions on the scope of permissible non-audit work; and a cap on fees for permissible non-audit work (which may not exceed 70% of the average audit fees paid in the last three consecutive years).
For work that is permitted under the policy, authority has been delegated to the Finance Director to approve. This is for fees of up to £10,000 per project or £40,000 in aggregate for general work, and £10,000 for acquisition related work that is permitted under the policy. Non-audit work above these levels requires the prior approval of the Chair of the Audit Committee or the Audit Committee as a whole.
At each Audit Committee meeting, a summary is provided of all non-audit services awarded to the external auditor during the year.
An analysis of fees paid to Deloitte, including the split between audit and non-audit is included in note 8 of the Group financial statements. The total non-audit fees for 2016 represent 8.4% of the total Deloitte audit fee.
Risk managementThe Audit Committee has responsibility for reviewing and monitoring the effectiveness of the Group’s control environment, internal audit and risk management process. This year has seen continued focus on the Group’s approach to risk and its internal control environment. This included a review by the Audit Committee, of the effectiveness of the new risk appetite framework and reporting procedures which are summarised on page 29. The Audit Committee makes a recommendation to the Board for the Board to consider when forming its own view on the effectiveness of the risk management and internal control systems.
The Audit Committee also oversaw the appointment of a Head of Risk and Internal Audit. After a thorough recruitment process, using an external internal audit recruitment specialist, the Board was pleased to recruit a senior and experienced Head of Risk and Internal Audit in April 2016. The new role reports directly to the Finance Director and the Chair of the Audit Committee. A Risk and Internal Audit Manager with relevant experience was also recruited during the year.
Internal controlsA continued area of focus was to build on improvements to the quality of the Group's internal control procedures made in the preceding year and to oversee the revised internal audit approach adopted in 2016. The Audit Committee's work on this was assisted by the Head of Risk and Internal Audit, who has implemented new, more formalised, reporting procedures and supervised operational improvements in locations where issues were identified. Audit scoping for 2017 has been improved to be further ‘risk based’ with the plan being driven by the scoring of a number of relevant risk factors at our global locations including financial, location risk and key events such as site relocations and restructuring. Sites specifically not included in this scoping exercise will then be visited on a three year rolling basis.
Other means of assessing the internal control systems include competency assessments of key site staff, annual letters of assurance from the leadership team, key control monitors within each business, the risk assessment process and risk practitioners improving controls in each business, partly through site reviews.
During the year, the Audit Committee considered reports on internal control from the Finance Director and Head of Risk and Internal Audit, as well as reports on procedures to prevent bribery and corruption and whistleblowing events from the Group Legal Director.
Internal audit Internal audit has made significant progress in the year following the recommendations made by PwC in their 2015 Independent Quality Assessment into the Group‘s internal audit function and the arrival of the Head of Risk and Internal Audit. During 2016, the internal audit team took a more risk based approach to the internal control environment. The Group continues to use staff from one division to undertake audits in a different division, and this arrangement encourages the sharing of best practice and provides career development for the staff involved. However, all reports are now reviewed by the Head of Risk and Internal Audit to ensure consistency both in terms of audit approach and remedial actions. Feedback is given to all internal auditors on their findings and the audit programme has been continuously updated to ensure it reflects the current risks being identified in the business. Furthermore, where issues of concern are identified that require more management time the Head of Risk and Internal Audit will perform the follow up visit to ensure a level of independence from the business.
Whilst the Audit Committee are satisfied that this 'peer review' model remains appropriate for the Group‘s current internal audit objectives, it has noted PwC‘s observations that an independent function may be warranted in the future. The Audit Committee has noted an increase in independence and strategic direction since the appointment of the Head of Risk and Internal Audit.
Alongside the oversight of the implementation of PwC‘s recommendations, the Audit Committee continued to receive a report at each meeting on internal audit activity, any significant matters arising and the management response. For 2017, the Audit Committee has reviewed an internal audit plan that aligns with Rotork‘s identification of risks and mitigating controls, and also assesses adherence to the Group‘s compliance and policy initiatives.
Other mattersIn accordance with its terms of reference, the Audit Committee, led by the Chair, carried out a review of its effectiveness by way of a questionnaire, including how it discharged its responsibilities and the Terms of Reference. The areas for improvement identified by the review were all addressed prior to the end of the financial year.
The Audit Committee‘s activities were also reviewed as part of the Board evaluation process referred to on page 67.
Throughout the year, the Audit Committee also considered relevant accounting and corporate governance developments, in addition to those in relation to risk and internal controls discussed above.
Areas of focus for 2017Following some significant changes to the risk management processes and internal control environment, in 2017 we will focus on a degree of stability and consistency of the new processes that have been implemented as well as risk based testing of key controls. This will include planned improvements in the risk appetite framework, development of the associated key performance indicators and a further extension of the risk based audit programme which will ensure continued development.
Sally JamesChair of the Audit Committee 27 February 2017

74 Rotork Annual Report 2016
Activities of the Nomination Committee during the yearThe Committee met three times during the year. A summary of principal activities is set out opposite:
During the year, the Nomination Committee was responsible for commencing the process to identify and recommend the appointment of an additional non-executive director following the retirement of John Nicholas in February 2017. An external consultant has been appointed to assist with this process which is currently ongoing. In formulating the candidate profile for the appointment, the Nomination Committee had particular regard to the need to ensure a continuing balance of skills on the Board, given the comparatively large number of director retirements in recent years.
Diversity policy The Board seeks to attain a diverse mix of skills, experience, knowledge and background. In considering diversity, gender will play an important role but the Board will take account of ethnicity, nationality, background, profession and personality.
The Board has formally adopted a diversity policy to encourage diversity at all levels within the Group. At Board level, this includes a number of voluntary actions to improve diversity, including only using external search consultants that have signed up to the Voluntary Code of Conduct for Executive Search Firms.
The diversity policy also sets out other actions that will be taken to contribute to a more diverse pool of employees throughout the Group.
During 2017, the Nomination Committee when conducting its review of the diversity policy, will take account of the Hampton Alexander Review, which builds on the Davies Review, to increase the number of women on FTSE boards, and to improve women‘s representation in senior leadership positions. It will also take account of the Parker Review‘s recommendations to increase ethnic diversity on FTSE boards.
Details of the proportion of women on the Board, in senior leadership positions and within the Group can be found on page 50 of the corporate social responsibility report.
Martin LambChair of the Nomination Committee 27 February 2017
NOMINATION COMMITTEE
REPORT
Martin LambChair of the Nomination Committee
The Nomination Committee is responsible for leading the process for Board appointments and making recommendations to the Board; ensuring succession planning is in place; regularly reviewing the structure, size and composition of the Board, including its balance of skills, knowledge and experience, and making recommendations as appropriate.
The membership of the Nomination Committee was unchanged during the year ended 31 December 2016, but John Nicholas retired from the Nomination Committee on his retirement from the Board on 24 February 2017.
Succession planning, and its interaction with the Board‘s continuing focus on strategy and culture, was a focus for the Nomination Committee during the course of the year. These discussions were informed by consideration of the FRC‘s feedback paper on board succession planning, and attendance by the Chair at external seminars on the future role of the Nomination Committee.

Governance Company InformationDirectors Financial StatementsStrategic Report
75Rotork Annual Report 2016
Nomination Committee activity 2016
App
oint
men
t p
roce
ss
Succession planning
Appointment process• Approval of a revised policy on
non-executive director appointments.
• Approval of external search consultants for a replacement non-executive director.
• Consideration of the candidate profile for an additional non-executive director.
Succession planning• Consideration of FRC feedback
paper on board succession planning.
• Discussion of diversity at Board level, including on the basis of ethnicity, disability and awareness and experience of global business cultures.
Jan Feb Mar Apr May Jun Jul Aug Sept Oct Nov Dec
Dates of 2016 Nomination Committee meetings
✔ ✔ ✔
Members1: Lucinda Bell, Gary Bullard, Peter France, Sally James and John Nicholas
1 As at 31 December 2016.
76 Rotork Annual Report 2016
Activities of the Remuneration Committee during the yearThe Remuneration Committee maintains a rolling programme of activities which forms the basis of its scheduled meetings throughout the year. This rolling programme is supplemented by consideration of specific issues as and when they arise. The Remuneration Committee met four times during the year. A summary of its principal activities is set out below:
DIRECTORS’ REMUNERATION
REPORT
Gary BullardChair of the Remuneration Committee
Statement from the Chair of the Remuneration CommitteeThe Directors’ Remuneration Report is split into two parts:
• The Policy Report, which sets out the Company‘s policy on directors’ remuneration for the three year period (2017-2019); and
• The Annual Report on Remuneration which discloses the payments and awards made to the directors under the previously approved policy, shows the link between remuneration and the Group‘s performance, and sets out how the remuneration policy will be applied for the forthcoming year.
The Policy Report will be subject to shareholder approval in a binding vote at the forthcoming annual general meeting (AGM). The Annual Report on Remuneration, together with this introductory statement, will be subject to an advisory shareholder vote at the AGM.
Reporting• Approval of the Remuneration Report 2015.
Remuneration policy• Review of remuneration policy.
• Preparing 2017-2019 remuneration policy.
• Consultation with major shareholders on proposed changes to remuneration policy.
Other• Consideration of current investor guidance from
institutional investors on remuneration.
• Consideration of legal and corporate governance developments.
• Consideration of remuneration market trends.
• Approval of the Committee’s schedule of work for 2017.
Remuneration Committee activity 2016

Governance Company InformationDirectors Financial StatementsStrategic Report
77Rotork Annual Report 2016
Jan Feb Mar Apr May Jun Jul Aug Sept Oct Nov Dec
Dates of 2016 Remuneration Committee meetings
✔ ✔ ✔ ✔
Members1: Lucinda Bell, Sally James and John Nicholas
1 As at 31 December 2016. John Nicholas retired from the Remuneration Committee on his retirement from the Board on 24 February 2017.
Rem
uner
atio
n p
olic
y
LTIP and
bonus
Other
Pension
Setting executive salary
Reporting
Setting executive salary• Setting of basic salary for executive directors
for 2017.
• Consideration of report from New Bridge Street on executive remuneration.
Setting long term incentive plan (LTIP) and bonus opportunities• Approval of LTIP award levels and bonus
opportunity for 2017 for executive directors and other members of senior management.
• Setting of financial and non-financial bonus targets.
• Review of LTIP performance during the year.
Pension• Review of executive pension benefit.

Rotork Annual Report 201678
Remuneration for 2016Bonuses for 2016 were based on annual profit, cash generation, accident frequency rate and individual strategic targets. In line with our pay for performance philosophy, we set ambitious targets for the annual bonus, particularly in relation to profitability. The challenging trading environment meant that, whilst we performed in line with external expectations, this was at the lower end of the target range set for the bonus. However, cash generation remained strong and our continued focus on safety and operational performance has positioned the Group well for the future. Overall the bonus payments ranged from 40.7% to 56.8% of salary. Full details of the bonus targets and performance against them is set out on pages 85 to 86.
The 2014 LTIP awards (which were based on earnings per share (EPS) and total shareholder return (TSR) performance over the three years to 31 December 2016) failed to meet the threshold level of performance required and the awards will lapse in March 2017.
Remuneration for 2017Since I became Chair of the Remuneration Committee in 2010, we have made a number of changes to the way the executive directors at Rotork are remunerated. These have been designed to ensure that there is a clear and strong link between performance and reward and to meet best practice requirements. During the year, the Remuneration Committee undertook a comprehensive review of the remuneration policy for the executive directors to ensure that the policy remained fit for purpose and continued to meet the needs of the business and our shareholders. The latest review is the culmination of this process.
The principal changes to the Policy Report, from that previously approved by shareholders, are:
• Replacing the legacy defined benefit pension scheme with a cash allowance in lieu of pension;
• The introduction of deferral of bonus into shares;
• The addition of a capital return measure to the LTIP (to operate alongside EPS and TSR);
• The introduction of a two year post-vesting holding period for the LTIP awards; and
• An increase to the shareholding guidelines for the executive directors to 400% of salary for Peter France (Chief Executive) and 250% of salary for Jonathan Davis (Finance Director).
There are no changes to the maximum annual bonus and LTIP award opportunity and award levels for 2017 remain the same as 2016.
In terms of the implementation of the policy for 2017, we are mindful of the views expressed by our shareholders and the sensitivity of executive remuneration. However, we are also conscious that the policy must motivate, retain and attract executives of the right level of skill and experience to run the Company. Peter France and Jonathan Davis were both appointed to their roles following internal promotions (in 2008 and 2010 respectively). Their initial salaries were comparatively low at the time, reflecting their relative lack of experience in their new roles. Rotork has grown significantly under their tenure, increasing revenues from £320m in 2008 to £590.1m in 2016, the number of employees from 1,663 to 3,754 and more than doubling the Company's market capitalisation from £830m to £2.26bn. The two executive directors have been central to this growth.
Whilst we are cautious about the use of external data, it has been evident to the Remuneration Committee for some time that their salaries were increasingly uncompetitive, had not kept pace with the scope and demands of their roles, nor did they adequately reflect their skills and experience. This was impacting the effectiveness of the overall remuneration policy and causing compression on salary levels further down the organisation. We
believe strongly in pay for performance and aim for restraint on fixed compensation. However, to ensure that the policy can operate effectively and to retain and motivate the directors, we need to ensure that the fixed pay element is not so far adrift from the appropriate level.
Following discussions with our major shareholders, we have repositioned the base salaries for the executive directors to £525,000 and £335,000 for Peter France and Jonathan Davis respectively. We gave extensive consideration to phasing the increase, but given the time in their roles and the size of the gap, we believe it necessary to correct this imbalance now. Whilst this is a substantial increase on their current salaries, this still positions their packages towards the lower end of the range for companies of our size and in our sector. The executive directors will also, for the duration of the policy period, invest the increase above the normal workforce increase in Rotork shares and retain those shares for two years. Future increases for the executive directors under the Policy Report will be limited to the average increase for the rest of the workforce.
The Remuneration Committee sought extensive feedback from major shareholders, and those shareholders who were consulted were broadly supportive of the increases. The salary increases were permitted under the existing Policy Report and therefore, following the consultation exercise, the Remuneration Committee agreed to make the changes effective from 1 January 2017.
The other changes to the Policy Report have been designed to ensure that the Policy Report continues to meet the needs of the business for the next three year period, supports sustainable long-term growth and provides a strong alignment with shareholders. With the executive directors committing to invest part of their salary in shares, introducing deferral of bonus into shares, applying a post-vesting holding period to the LTIP awards and by significantly enhancing the share ownership requirements, we believe that we have reached a suitable balance – ensuring that the remuneration policy remains attractive whilst promoting strong alignment with shareholders. A summary of the revised policy is set out in the 'at a glance' section overleaf.
When conducting its business, the Remuneration Committee is mindful of the views of all of our stakeholders. During the course of the autumn, I consulted with more than 20 of Rotork’s largest shareholders to take them through our outline proposals and listen to their feedback. A number of changes were incorporated into the proposal as a result including a change to how we measure safety performance for the annual bonus and the greater focus on the use of share-based remuneration.
Throughout this process, we have also been alive to the internal sensitivities of changing the executive salaries. In particular we have given careful consideration to the conditions of the wider workforce, as Rotork’s success is dependent on the dedication and commitment of all our employees.
I am pleased to report that the average salary increase for all employees in 2017 is 3.4%, up from 2.8% last year. We will also continue to monitor internal relativities and pay ratios to ensure that they remain appropriate. I plan to meet with employee representatives during the course of 2017 to discuss the remuneration philosophy at Rotork, including the approach to executive reward.
I hope that you are able to support the changes to the Policy Report and its implementation.
Gary BullardChair of the Remuneration Committee 27 February 2017
DIRECTORS’ REMUNERATION REPORT continued

Governance Company InformationDirectors Financial StatementsStrategic Report
Rotork Annual Report 2016 79
Remuneration at a glance
Approach for 2017 Change from 2016
Salary £525,000 for the Chief Executive and £335,000 for the Finance Director, effective from 1 January 2017. The executives have committed to invest the uplift, above the normal workforce increase, in Rotork shares and to retain the shares for two years. Subsequent increases during the policy period will be no higher than the average increase for other employees.
Represents a one-off adjustment to align salaries closer to the appropriate level.
Benefits Car and fuel (or car and fuel allowance), personal accident and private medical insurance and life assurance.
No change.
Pension Cash allowance in lieu of pension set at 25% of salary for the Chief Executive and 20% of salary for the Finance Director.
Previously the directors participated in a defined benefit pension plan (based on capped salaries) with a cash allowance provided on salary above the cap. The revised rates are lower than the cost to the Company of the previous pension benefits.
Annual bonus Maximum opportunity of 125% of salary for the Chief Executive and 100% of salary for the Finance Director, within an overall policy maximum of 125% of salary.
No change to award levels. Policy maximum aligned at 125% of salary.
Based on profit, cash generation, safety and strategic and personal targets.
No change.
Any bonus above target performance (60% of maximum) will be deferred in shares for three years.
Bonus deferral introduced for 2017 onwards to provide a longer-term focus to the annual plan and greater alignment with shareholders.
LTIP Award levels of 150% of salary for the Chief Executive and 125% of salary for the Finance Director, within an overall policy maximum of 150% of salary.
No change.
Based one third on TSR, one third on EPS and one third on return on capital (economic profit).
The introduction of a new return on capital (economic profit) target for part of the award is new and reflects Rotork’s aim to deliver a high return on capital with strong and sustainable margins and consistent year-on-year growth in profit.
For the 2017 grants onwards, the executive directors will be required to retain any shares (net of tax) vesting under the plan until the fifth anniversary of grant.
Post-vesting holding period introduced for 2017 awards onwards to provide a long-term focus to the share awards.
Shareholding guidelines 400% of salary for Peter France and 250% of salary for Jonathan Davis.
Increased from 150% of salary.
Other There are no other substantive changes to the Policy Report or its implementation.

Rotork Annual Report 201680
DIRECTORS’ REMUNERATION REPORT continued
Policy ReportThis report sets out the policy of the Company on the remuneration of the directors. The Policy Report will be put to shareholders for approval at the AGM of the Company to be held on 28 April 2017 and, subject to approval, will take effect from that date. The current policy, approved by shareholders in 2014 and set out in last year‘s remuneration report will continue to apply until the revised policy is approved.
Role of the Remuneration Committee The principal role of the Remuneration Committee is to determine the framework and policy for remuneration of the executive directors and the Chairman, ensuring that remuneration levels are sufficient but not excessive in order to attract, retain and motivate directors of the quality required to successfully run the Company. The full terms of reference of the Committee can be found on the Company‘s website at www.rotork.com/en/investors/index/committees.
Key responsibilities include:
• Within the approved policy, determining individual remuneration packages for the Chairman and executive directors, including the terms of any discretionary share schemes in which executive directors may be invited to participate, taking account of the level of remuneration for other Rotork Management Board members and being aware of remuneration conditions throughout the Group;
• Agreeing the terms and conditions to be included in service agreements for executive directors, including termination payments; and
• Selecting, appointing and setting terms of reference with any remuneration consultants who may advise the Committee.
Consideration of conditions elsewhere in the CompanyThe Remuneration Committee is sensitive to employee remuneration conditions in the Group and in determining remuneration takes account of Group remuneration conditions. The Remuneration Committee invites the Group Human Resources Director to its meetings to provide, amongst other things, details of employee remuneration conditions and metrics, such as pay rises awarded to employees to inform the Remuneration Committee‘s decision making. During 2017, the Chair of the Remuneration Committee intends to meet with employee representatives to discuss the remuneration philosophy at Rotork, including the approach to executive reward. The Remuneration Committee also monitors internal relativities and pay ratios to ensure that they remain appropriate.
Consideration of shareholder views In formulating the Policy Report, the Remuneration Committee takes into account guidance issued by shareholders, their representative bodies and proxy agencies (including the Investment Association and ISS). The Remuneration Committee also takes into consideration any views expressed by shareholders during the year (including at the AGM) and encourages an open dialogue with its largest shareholders. Major shareholders are consulted in advance about changes to the Policy Report or any significant proposed changes to the way in which it is implemented. A detailed consultation exercise was undertaken in 2016 with more than 20 of Rotork‘s largest shareholders to seek feedback on the proposed changes to the Policy Report.
Overview of the Policy ReportDirectors’ future policy table
Element of remuneration
Purpose and how it supports the strategy How the element operates Maximum amounts payable Framework used to assess performance
Base salary To attract and retain executive directors of the right calibre and provide a core level of reward for the role.
Salary levels (and subsequent salary increases) are set after taking into account the responsibilities of the role, the value of the individual in terms of skills, experience and personal contribution, company performance, internal relativities and pay conditions, and external market data (benchmarked against companies of a similar size and complexity and other companies in the same industry sector). The Remuneration Committee also considers the impact of any increase to salaries on the total remuneration package.
Salaries are paid monthly and reviewed annually (salaries are normally reviewed in December, with any changes effective from 1 January)1.
Details of the current salaries of the executive directors are set out in the Annual Report on Remuneration.
For Peter France and Jonathan Davis, future salary increases will be no higher than the average increase (as a percentage of salary) applied to the UK workforce.
For other executive directors (if appointed), the Remuneration Committee retains the discretion to award higher increases if appropriate. For example, to reflect progression in the role or to the increased experience of the individual.
N/A
1 Peter France and Jonathan Davis have agreed to invest a proportion of their salary (net of tax) in Rotork shares and to retain those shares for two years. This commitment is expected to last for three years.
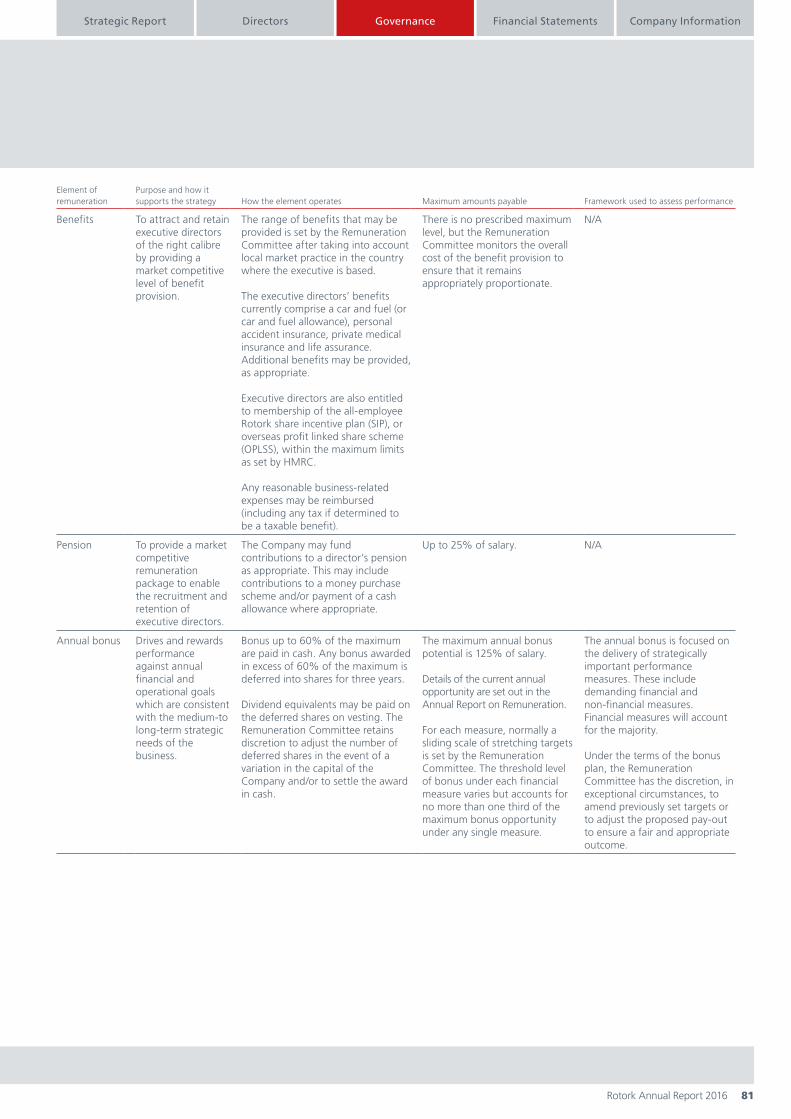
Governance Company InformationDirectors Financial StatementsStrategic Report
Rotork Annual Report 2016 81
Element of remuneration
Purpose and how it supports the strategy How the element operates Maximum amounts payable Framework used to assess performance
Benefits To attract and retain executive directors of the right calibre by providing a market competitive level of benefit provision.
The range of benefits that may be provided is set by the Remuneration Committee after taking into account local market practice in the country where the executive is based.
The executive directors’ benefits currently comprise a car and fuel (or car and fuel allowance), personal accident insurance, private medical insurance and life assurance. Additional benefits may be provided, as appropriate.
Executive directors are also entitled to membership of the all-employee Rotork share incentive plan (SIP), or overseas profit linked share scheme (OPLSS), within the maximum limits as set by HMRC.
Any reasonable business-related expenses may be reimbursed (including any tax if determined to be a taxable benefit).
There is no prescribed maximum level, but the Remuneration Committee monitors the overall cost of the benefit provision to ensure that it remains appropriately proportionate.
N/A
Pension To provide a market competitive remuneration package to enable the recruitment and retention of executive directors.
The Company may fund contributions to a director‘s pension as appropriate. This may include contributions to a money purchase scheme and/or payment of a cash allowance where appropriate.
Up to 25% of salary. N/A
Annual bonus Drives and rewards performance against annual financial and operational goals which are consistent with the medium-to long-term strategic needs of the business.
Bonus up to 60% of the maximum are paid in cash. Any bonus awarded in excess of 60% of the maximum is deferred into shares for three years.
Dividend equivalents may be paid on the deferred shares on vesting. The Remuneration Committee retains discretion to adjust the number of deferred shares in the event of a variation in the capital of the Company and/or to settle the award in cash.
The maximum annual bonus potential is 125% of salary.
Details of the current annual opportunity are set out in the Annual Report on Remuneration.
For each measure, normally a sliding scale of stretching targets is set by the Remuneration Committee. The threshold level of bonus under each financial measure varies but accounts for no more than one third of the maximum bonus opportunity under any single measure.
The annual bonus is focused on the delivery of strategically important performance measures. These include demanding financial and non-financial measures. Financial measures will account for the majority.
Under the terms of the bonus plan, the Remuneration Committee has the discretion, in exceptional circumstances, to amend previously set targets or to adjust the proposed pay-out to ensure a fair and appropriate outcome.

Rotork Annual Report 201682
Element of remuneration
Purpose and how it supports the strategy How the element operates Maximum amounts payable Framework used to assess performance
LTIP To incentivise long-term value creation and alignment with shareholder interests.
The LTIP permits an award of shares to be granted which vest subject to performance and continued employment. The LTIP awards will be granted in accordance with the rules of the plan, which were approved by shareholders in 2010, and the discretions contained therein. A copy of the rules is available on request from the Company Secretary.
Awards under the LTIP may be granted in the form of conditional shares, forfeitable shares, nil-cost options or cash (where the award cannot be settled in shares). Awards are currently structured as nil-cost options.
For awards granted in 2017 onwards, the directors must retain any shares vesting (net of tax) until the fifth anniversary of grant.
The grant level is 150% of salary per annum.
Details of the current award levels are set out in the Annual Report on Remuneration.
Awards under the LTIP are currently subject to performance conditions, measured over three financial years.
The awards for 2017 are based on a mix of EPS, return on capital (economic profit) and TSR. Different measures may be used for future award cycles.
A sliding scale of targets is set for each measure with no more than 25% of the award (under each measure) vesting for achieving the threshold performance hurdle.
The performance targets are set prior to the grant of each award. Different measures, targets and/ or weightings between measures may be set for future award cycles.
Under the LTIP rules approved by shareholders, the Remuneration Committee has the discretion to amend the targets applying to existing awards in exceptional circumstances providing the new targets are no less challenging than originally envisaged. The Remuneration Committee also has the power to adjust the number of shares subject to an award in the event of a variation in the capital of the Company.
Shareholding guideline
To provide alignment with shareholders by requiring executives to build and maintain a meaningful shareholding in Rotork.
The executive directors are also subject to a shareholding requirement to build and maintain a shareholding in Rotork equivalent to 250% of salary (400% of salary for Peter France).
N/A N/A
DIRECTORS’ REMUNERATION REPORT continued

Governance Company InformationDirectors Financial StatementsStrategic Report
Rotork Annual Report 2016 83
Element of remuneration
Purpose and how it supports the strategy How the element operates Maximum amounts payable Framework used to assess performance
Chairman and non-executive directors’ fees
To attract and retain non-executive directors of the right calibre
Fees for the Chairman and non-executive directors are reviewed periodically.
Non-executive director fees are determined by the Chairman and Chief Executive. The fees for the Chairman are determined by the Remuneration Committee taking into account views of the Chief Executive. The Chairman excludes himself from such discussions.
The fees for the non-executive directors normally comprise a basic Board fee, with additional fees paid to the Senior Independent Director and for chairing a Committee.
Any reasonable business-related expenses may be reimbursed (including tax thereon if determined to be a taxable benefit).
The maximum aggregate fee level is £700,000.
The fee levels set are set by reference to rates in companies of comparable size and complexity. The fee levels are reviewed periodically taking into account the responsibilities of the role and the time commitment of the individual.
N/A
Differences between the above Policy Report and that previously approved by shareholders are summarised on page 79.
Performance measuresPerformance measures are used to determine the extent of any awards made under the variable elements of the executive directors’ remuneration mix, being the annual bonus and the LTIP. The performance measures used are set out in the Annual Report on Remuneration. The performance measures are selected because of their use as key performance indicators (KPIs) to assess Company performance and to align the interests of the directors to those of the shareholders. Non-financial KPIs constitute part of the annual bonus award and these are selected to ensure that performance measured by financial KPIs is not delivered at the expense of important non-financial considerations.
Clawback and malusThe payment of any bonus is at the ultimate discretion of the Committee and the Committee also retains an absolute discretion to reclaim or withhold some, or all, of any annual bonus paid in exceptional circumstances, such as misstatement of results, an error in the calculation of the performance targets and/or award size and gross misconduct.
In terms of the LTIP, the Committee has the discretion to reclaim some, or all, of a vested LTIP award in exceptional circumstances (the categories for clawback being the same as for the annual bonus plan). In addition, the Committee may lapse or reduce an award prior to vesting where the participant is found to be guilty of serious misconduct.
Differences between the Policy Report and the policy on employee remunerationThe Board recognises that it is appropriate for a significant proportion of executive directors’ remuneration to be contingent on the performance of the Company, and that such remuneration is at risk subject to the satisfaction of stretching performance conditions. Consequently, executive directors and other senior managers are invited to participate in the LTIP where shares awarded will vest contingent upon performance conditions over a three year period. Executive directors and other senior managers are also invited to participate in the annual bonus scheme which will result in a bonus payment being made if targets are achieved, part of which may be deferred in shares.
For employee remuneration, the Board considers it more appropriate that employees share in the success of the Company through a profit based bonus plan which is based on the performance of their business unit. This is coupled with the opportunity, for eligible employees, to receive free shares from the Company, paid from the Company‘s profits.
Rotork Annual Report 201684
Approach to recruitment remunerationBase salary levels will be set in accordance with Rotork‘s remuneration policy, taking into account the experience and calibre of the individual and their existing remuneration package. Where it is appropriate to offer a lower salary initially, a series of increases to salary may be given over subsequent years subject to individual performance. Benefits will generally be provided in accordance with the approved policy, with relocation expenses/an expatriate allowance paid for, if necessary.
The structure of the variable pay element will be in accordance with Rotork‘s approved policy detailed above. The maximum aggregate variable pay opportunity under the policy is up to 275% of salary. Different performance measures may be set initially for the annual bonus, taking into account the responsibilities of the individual, and the point in the financial year that the executive joined.
In the case of an external hire, it may be necessary to buy-out incentive pay or benefit arrangements (which would be forfeited on leaving the previous employer). This would be provided for taking into account the form (cash or shares) and timing and expected value (i.e. likelihood of meeting any existing performance criteria) of the remuneration being forfeited. Replacement share awards, if used, may be granted using Rotork‘s existing share plans to the extent possible, although awards may also be granted outside of these schemes if necessary and as permitted under the Listing Rules.
In the case of an internal hire, any outstanding variable pay awarded in relation to the previous role will be allowed to pay out according to its terms of grant.
Fees for a new Chairman or non-executive director will be set in line with the approved policy.
Service contracts and policy on payments for loss of officeUnder the executive directors’ service contracts, up to 12 months’ notice of termination of employment is required by either party. Should notice be served, the executive directors can continue to receive basic salary, benefits and pension for the duration of their notice period during which time the Company may require the individual to continue to fulfil their current duties or may assign a period of garden leave. The Company applies a general principle of mitigation in relation to termination payments and the service contracts expressly include the use of monthly phased payments following termination in lieu of notice which can be reduced to the extent that alternative remunerated employment is found.
The service contracts also enable the Company to elect to make a payment in lieu of notice equivalent in value to 12 months’ base salary only.
In the event of cessation of employment, the executive directors may still be eligible for a bonus at the discretion of the Committee, on a pro-rata basis for the period of time served from the start of the financial year to the date of termination and not for any period in lieu of notice. Different performance measures (to the other executive directors) may be set for the bonus for the period up until departure, as appropriate, to reflect changes in responsibility.
Any unvested shares held under the deferred annual bonus plan will ordinarily vest on the normal vesting date, save where the departure is as a result of summary dismissal, in which case the awards will lapse on cessation of employment. The Remuneration Committee may also determine that the shares shall vest on an earlier date (including the date of cessation) if the Remuneration Committee, in its discretion, considers that the circumstances of the cessation merit early vesting of the awards. The rules of the LTIP set out what happens to awards if a participant leaves employment before the end of the vesting period. Generally, any unvested LTIP awards will lapse when an executive director leaves employment except in certain circumstances. If the executive director ceases to be employed as a result of death, injury, retirement, transfer of employment or any other reason at the discretion of the Committee, then they will be treated as a ‘good leaver’ under the plan rules. The shares for a good leaver will vest subject to an assessment of performance, with a pro-rata reduction to reflect the proportion of the vesting period served. Awards for a good leaver will vest on the normal vesting date, unless the Committee determines that they should vest early (for example, following the death of the participant). In determining whether an executive director should be treated as a good leaver and the extent to which their award may vest (up to the pro-rated amount), the Committee will take into account the circumstances of an individual‘s departure.
Outplacement services and reimbursement of legal costs may be provided where appropriate. Any statutory entitlements or sums to settle or compromise claims in connection with a termination would be paid as necessary.
Any legacy benefits under the Company‘s defined benefit pension schemes will be allowed to be paid under the terms of those schemes and as set out in the previously approved Policy Report.
Outstanding share awards would ordinarily vest early on a change of control of the Company. In the case of unvested awards under the LTIP, performance would be measured to the date of the change of control with a pro-rata reduction to reflect the proportion of the vesting period served.
The Chairman and non-executive directors do not have service contracts, they serve under letters of appointment and are subject to annual re-election by shareholders at the AGM. The term of appointment for non-executive directors and the Chairman is three years and their appointments’ are subject to termination on three months’ notice (12 months for the Chairman). In the event of the termination of their position, they are entitled to reimbursement of any outstanding fees and expenses due.
DIRECTORS’ REMUNERATION REPORT continued

Governance Company InformationDirectors Financial StatementsStrategic Report
Rotork Annual Report 2016 85
Illustration of the application of the Policy ReportThe charts below illustrate how the remuneration policy would function for minimum, on target and maximum performance for 2017 for each executive director.
0
450,000
900,000
1,350,000
1,800,000
2,250,000
MaximumOn targetMinimum
0
450,000
900,000
1,350,000
1,800,000
2,250,000
MaximumOn targetMinimum
Chief Executive (Peter France)
100% 56% 34%
31%
33%13%
33%
£1,225,500
£2,118,000
Finance Director (Jonathan Davis)
Annual Bonus LTIP
100% 61%
11%
40%
28%30%
30%
£420,000
£1,173,750
£
£674,250
£
Fixed pay(salary, bene�ts, pension)
£704,750
Salary levels (and consequently the other elements of the remuneration package which are calculated as a percentage of salary) are based on those applying in 2017. Taxable benefits are shown as the cost to the Company of supplying those benefits for the year ending 31 December 2016. On target performance, for illustrative purposes, assumes achievement of 60% of the maximum available bonus and threshold LTIP vesting (20% of the maximum). Maximum performance assumes achievement of the maximum bonus and full vesting of the LTIP shares. The LTIP grant level is 150% for the Chief Executive and 125% for the Finance Director. No share price growth has been assumed and for simplicity, the benefit derived from participating in the Company‘s all employee SIP or OPLSS have been excluded.

Rotork Annual Report 201686
Annual Report on Remuneration
Single figure of remuneration (£000s) (audited) Executive directors
Salary Benefits(i)
Annual cash bonus LTIP(ii)
Pension and related benefits
Total remuneration
Name 2016 2015 2016 2015 2016 2015 2016 2015 2016 2015 2016 2015
Bob Arnold(iii) 212 264 13 18 86 50 – – 481 413 792 745Jonathan Davis 295 292 18 18 128 55 – – 92 88 533 453Peter France 434 430 18 18 247 101 – – 154 147 853 696
(i) The benefit value consists of a car and fuel (or a car and fuel allowance), private medical insurance (executive director only) and the cash value on allocation of SIP and OPLSS share awards as appropriate.
(ii) The 2016 figures relate to the vesting of the 2014 LTIP award. The threshold performance targets for the award (which were based on performance over the three financial years to 31 December 2016) were not achieved and the award will lapse in March 2017.
(iii) Bob Arnold retired from the Board on 31 August 2016. He is paid in US dollars.
Directors not performing an executive function (£000s)
Base fees Additional fees Total remuneration
Name 2016 2015 2016 2015 2016 2015
Lucinda Bell 47 43 – – 47 43Gary Bullard 47 43 8 7 55 50Sally James 47 43 10 8 57 51Martin Lamb1 180 137 – – 180 137John Nicholas 47 43 8 8 55 51
1 Martin Lamb became Chairman on 24 April 2015.
Additional fees relate to the supplementary fee paid to the Chairs of the Audit and Remuneration Committees and the Senior Independent Director.
All directors have confirmed that, save as disclosed in the tables above, they have not received any other items in the nature of remuneration.
Annual cash bonus for 2016Bonuses in 2016 were based 60% on annual profit, 15% on cash generation and 5% on accident frequency rate. For Peter France and Jonathan Davis, the remaining 20% was based on personal strategic objectives. For Bob Arnold, the remaining 20% was based on specific objectives relating to levels of confirmed orders and inventory management. Details of performance achieved and the targets set are shown below:
Performance required to
trigger bonus
payment
Performance required at maximum
% payable* at maximum performance
Performance outcome
% bonus awarded*
Annual profit target £113.7 £147.2 60% £120.6 12%Cash generation 85% 100% 15% 130.1% 15%Accident frequency rate <0.30 <0.30 5% 0.26 5%
Total 80% 32%
* % of maximum bonus
Strategic objectives, which accounted for 20% of the bonus opportunity for Peter France and Jonathan Davis, were set at the start of the year. Detailed targets were set relating to their area of responsibility and delivery of the business strategy. Performance against the objectives was monitored and assessed by the Chairman, with input from the other non-executive directors and, where appropriate, the Chief Executive. Details of the objectives and performance against them are summarised in the table below:
% payable* at maximum
% bonus awarded*
Peter France Objectives related to risk management, integration and delivery against Bifold acquisition targets, succession planning, the development of comprehensive scenario planning analysis and new product development. 20% 13.5%
Jonathan Davis Objectives related to internal audit and risk management, inventory management, development of the finance team and specific implementation and performance targets relating to the rollout of AX (new enterprise management system). 20% 11.4%
* % of maximum bonus
DIRECTORS’ REMUNERATION REPORT continued

Governance Company InformationDirectors Financial StatementsStrategic Report
Rotork Annual Report 2016 87
For Bob Arnold, 20% was based on specific objectives relating to levels of confirmed orders and inventory management:
% payable* at maximum
% bonus awarded*
Bob Arnold Targets set relating to levels of confirmed orders and inventory management** 20% 8.8%
* % of maximum bonus. ** Targets aligned with those set for other members of the Rotork Management Board.
Overall performance resulted in the following bonus payments:
• Bob Arnold – £86,000 (40.7% of salary) based on pro-rata payment following his retirement on 31 August 2016.
• Peter France – £247,000 (56.8% of salary).
• Jonathan Davis – £128,000 (43.4% of salary).
The maximum bonus opportunity was 125% of salary for Peter France and 100% of salary for the other directors (pro-rated in the case of Bob Arnold). Bonuses were paid solely in cash.
LTIPThe Company’s LTIP rewards the creation of shareholder value which is a strategic priority. Performance is measured over a three year period using a combination of EPS and TSR compared to a comparator group. The performance measures and weightings are summarised in the table below along with the awards granted and vesting under this plan to the executive directors.
Note Year of grant
Awards at 1 January
2016
Awards granted during
the year
Awards vesting during
the year
Awards lapsed during
the year
Awards at 31 December
2016 Vesting date
Bob Arnold(v) (i) 2013 83,620 – – (83,620) – 3 March 2016(ii) 2014 83,080 – – – 83,080 7 March 2017(iii) 2015 100,840 – – – 100,840 6 March 2018(iv) 2016 – 169,612 – – 169,612 6 March 2019
267,540 169,612 – (83,620) 353,532
Jonathan Davis (i) 2013 92,920 – – (92,920) – 3 March 2016(ii) 2014 103,560 – – – 103,560 7 March 2017(iii) 2015 117,120 – – – 117,120 6 March 2018(iv) 2016 – 226,122 – – 226,122 6 March 2019
313,600 226,122 – (92,920) 446,802
Peter France (i) 2013 141,820 – – (141,820) – 3 March 2016(ii) 2014 153,440 – – – 153,440 7 March 2017(iii) 2015 215,500 – – – 215,500 6 March 2018(iv) 2016 – 399,416 – – 399,416 6 March 2019
510,760 399,416 – (141,820) 768,356
(i) The 2013 awards were based on TSR and EPS performance to 31 December 2015 (each condition accounting for 50% of the award). TSR was measured relative to the FTSE 250 index (excluding all financial services, insurance companies and investment trusts). For the EPS condition, EPS growth must be at least RPI +10% for 15% vesting, increasing on a straight-line basis to full vesting for EPS growth of RPI +25% and above. Rotork’s actual TSR performance was -20% and Rotork’s EPS performance was -16.4% resulting in the minimum performance criteria not being met. Therefore the awards lapsed on 3 March 2016.
(ii) The performance conditions for the 2014 awards are based on performance to 31 December 2016. The targets are the same as for the 2013 awards. Rotork’s actual TSR performance was negative at -15% over the performance period and the EPS performance was -33% resulting in the minimum performance criteria not being achieved. The awards will lapse on 7 March 2017.
(iii) The 2015 awards were granted on 6 March 2015 and are subject to the same performance targets as the 2013 and 2014 awards (albeit based on performance to 31 December 2017).
(iv) The 2016 awards were granted on 12 April 2016 and are subject to the same performance measures as at the 2013, 2014 and 2015 awards (albeit based on performance to 31 December 2018 and the EPS growth range is 9% to 35%).
(v) Bob Arnold retired from the Board on 31 August 2016. He had been treated as a good leaver in respect of his outstanding LTIP awards (see page 88). The awards will continue to vest subject to performance and a time pro-rata reduction.

Rotork Annual Report 201688
DIRECTORS’ REMUNERATION REPORT continued
LTIP awards made during the year (audited)
Share awards made during
2016Basis on which
award madeFace value of
award (£)
Number of shares vesting for minimum
performance(i)
Number of shares vesting for maximum performance
End of performance period
Bob Arnold(ii) 169,612 100% of salary 277,000 55,000 169,912 31 December 2018Jonathan Davis 226,122 125% of salary 369,000 74,000 226,122 31 December 2018Peter France 399,416 150% of salary 651,000 130,000 399,416 31 December 2018
(i) Vesting if the minimum performance EPS and TSR conditions are achieved (20% of the maximum award). The share price used to determine the number of shares under the award was £1.63 being the share price immediately prior to the date of the award.
(ii) Bob Arnold retired from the Board on 31 August 2016. His award will vest subject to performance and a time pro-rata reduction to reflect the proportion of the performance period served.
Free SIP and OPLSS share awards (audited)In common with all eligible employees, UK based executive directors receive an entitlement to ordinary shares under the SIP which is approved by Her Majesty‘s Revenue and Customs (HMRC). Under the SIP and the OPLSS, an aggregate total of up to 5% of profits are distributed to employees each year in the form of ordinary shares. The distribution is calculated by reference to years of service and basic salary. Details of free share awards under the SIP and OPLSS made to executive directors in 2016 are set out below. Free shares awarded to the two UK executive directors under the SIP are subject to the HMRC upper limit of £3,600 by value. This limit also applies to the OPLSS for the year under review.
Date of Grant
Free share awards made
during the year Basis on which award madeFace valueof award
Bob Arnold(i) 06 April 2016 2014 Non-performance based £3,600Jonathan Davis 06 April 2016 2014 Non-performance based £3,600 Peter France 06 April 2016 2014 Non-performance based £3,600
(i) Bob Arnold, in common with other eligible overseas employees, participates in the OPLSS. The scheme trustee is based in Jersey, Channel Islands. The figure shown for Bob Arnold relates solely to OPLSS.
Partnership SIP share awards (audited)In line with all eligible UK based employees, UK based directors are entitled to purchase monthly partnership shares under the SIP to a maximum of £150 per month. Interests in partnership shares as at 31 December 2016 are shown in the table below:
Partnership share interest
as at 31 December
2016
Jonathan Davis 9,239Peter France 4,385
Sharesave options granted to executive directors (audited)In common with all eligible UK employees, UK based executive directors are entitled to participate in the HMRC approved Rotork sharesave scheme. Under the sharesave scheme, employees are permitted to save up to £500 per month for a term of three or five years, after which the employee is allowed to exercise the share option. The option price is determined in accordance with the HMRC approved sharesave scheme rules and is calculated by taking an average of the share price over the five days preceding the invitation date.
The option exercise period is six months duration after which the options lapse.
Shares under option Basis on which award made Option price Duration Date of grant Date of vesting
Jonathan Davis 12,162 Non-performance based £1.48 3 years 13 October 2015 1 December 2018Peter France 20,270 Non-performance based £1.48 5 years 13 October 2015 1 December 2020
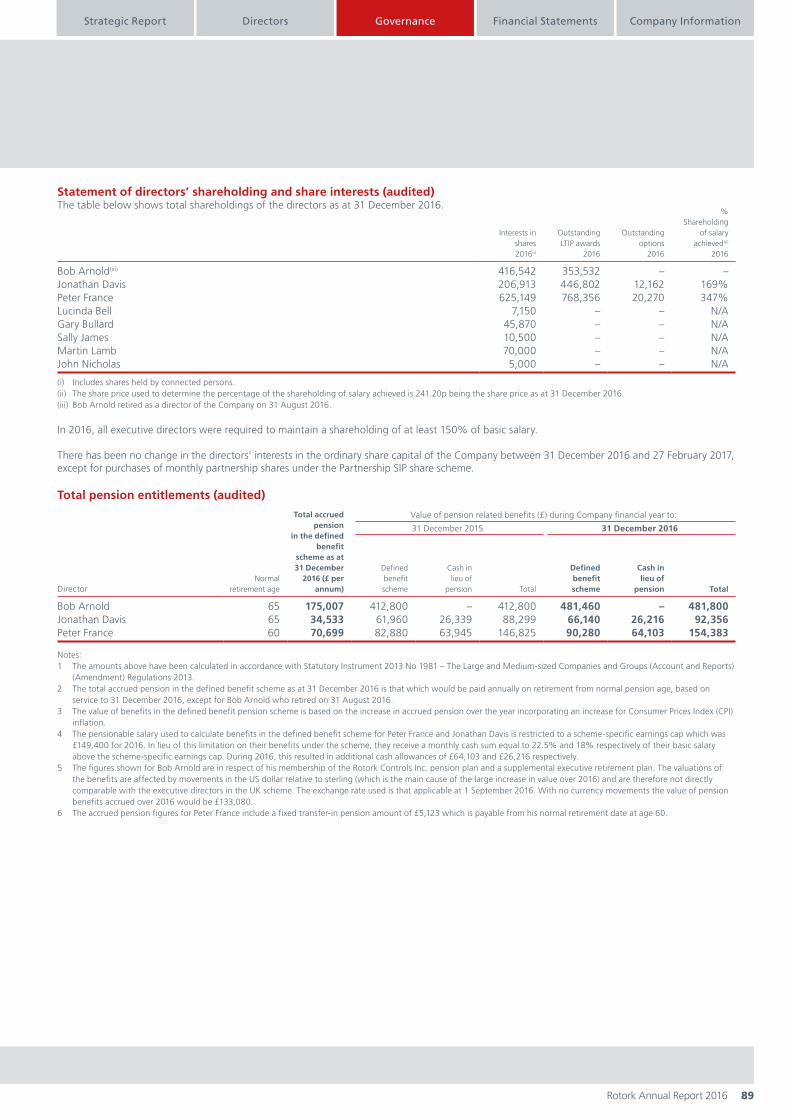
Governance Company InformationDirectors Financial StatementsStrategic Report
Rotork Annual Report 2016 89
Statement of directors’ shareholding and share interests (audited)The table below shows total shareholdings of the directors as at 31 December 2016.
Interests in shares2016(i)
Outstanding LTIP awards
2016
Outstanding options
2016
% Shareholding
of salaryachieved(ii)
2016
Bob Arnold(iii) 416,542 353,532 – –Jonathan Davis 206,913 446,802 12,162 169%Peter France 625,149 768,356 20,270 347%Lucinda Bell 7,150 – – N/AGary Bullard 45,870 – – N/ASally James 10,500 – – N/AMartin Lamb 70,000 – – N/AJohn Nicholas 5,000 – – N/A
(i) Includes shares held by connected persons.(ii) The share price used to determine the percentage of the shareholding of salary achieved is 241.20p being the share price as at 31 December 2016.(iii) Bob Arnold retired as a director of the Company on 31 August 2016.
In 2016, all executive directors were required to maintain a shareholding of at least 150% of basic salary.
There has been no change in the directors’ interests in the ordinary share capital of the Company between 31 December 2016 and 27 February 2017, except for purchases of monthly partnership shares under the Partnership SIP share scheme.
Total pension entitlements (audited)
DirectorNormal
retirement age
Total accrued pension
in the defined benefit
scheme as at31 December
2016 (£ per annum)
Value of pension related benefits (£) during Company financial year to:
31 December 2015 31 December 2016
Defined benefit
scheme
Cash in lieu of
pension Total
Defined benefit scheme
Cash in lieu of
pension Total
Bob Arnold 65 175,007 412,800 – 412,800 481,460 – 481,800Jonathan Davis 65 34,533 61,960 26,339 88,299 66,140 26,216 92,356Peter France 60 70,699 82,880 63,945 146,825 90,280 64,103 154,383
Notes:1 The amounts above have been calculated in accordance with Statutory Instrument 2013 No 1981 – The Large and Medium-sized Companies and Groups (Account and Reports)
(Amendment) Regulations 2013.2 The total accrued pension in the defined benefit scheme as at 31 December 2016 is that which would be paid annually on retirement from normal pension age, based on
service to 31 December 2016, except for Bob Arnold who retired on 31 August 2016.3 The value of benefits in the defined benefit pension scheme is based on the increase in accrued pension over the year incorporating an increase for Consumer Prices Index (CPI)
inflation.4 The pensionable salary used to calculate benefits in the defined benefit scheme for Peter France and Jonathan Davis is restricted to a scheme-specific earnings cap which was
£149,400 for 2016. In lieu of this limitation on their benefits under the scheme, they receive a monthly cash sum equal to 22.5% and 18% respectively of their basic salary above the scheme-specific earnings cap. During 2016, this resulted in additional cash allowances of £64,103 and £26,216 respectively.
5 The figures shown for Bob Arnold are in respect of his membership of the Rotork Controls Inc. pension plan and a supplemental executive retirement plan. The valuations of the benefits are affected by movements in the US dollar relative to sterling (which is the main cause of the large increase in value over 2016) and are therefore not directly comparable with the executive directors in the UK scheme. The exchange rate used is that applicable at 1 September 2016. With no currency movements the value of pension benefits accrued over 2016 would be £133,080.
6 The accrued pension figures for Peter France include a fixed transfer-in pension amount of £5,123 which is payable from his normal retirement date at age 60.
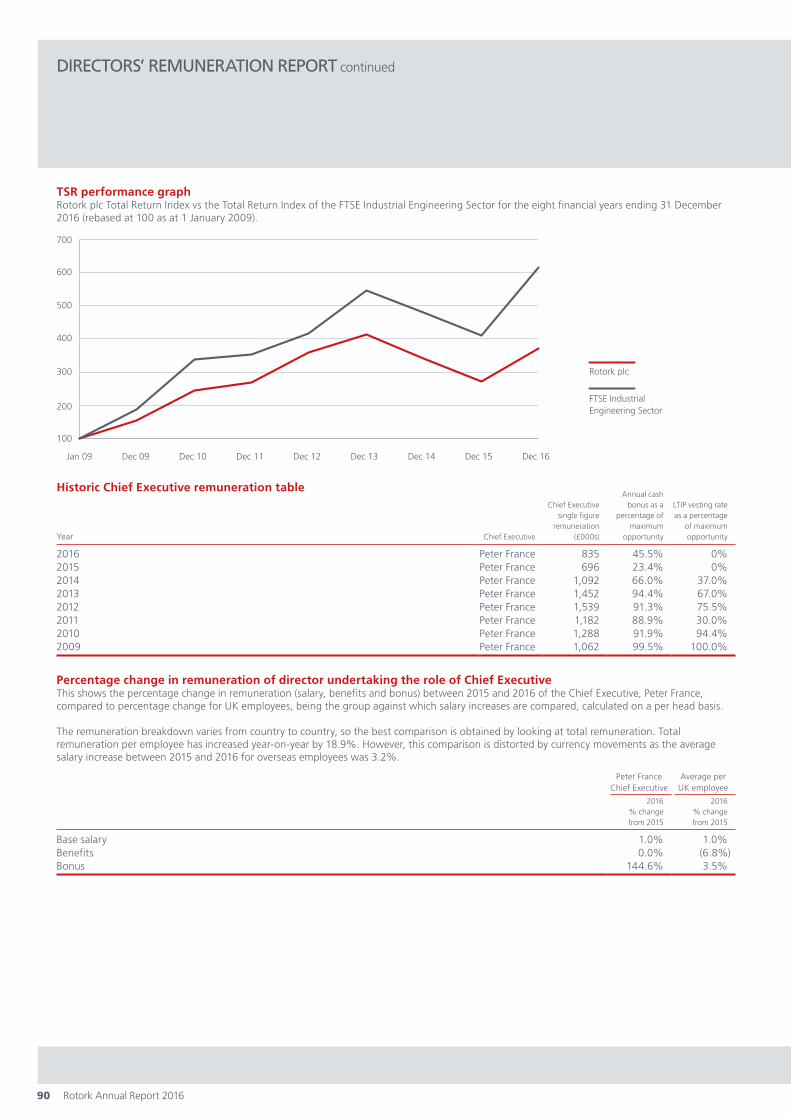
Rotork Annual Report 201690
TSR performance graphRotork plc Total Return Index vs the Total Return Index of the FTSE Industrial Engineering Sector for the eight financial years ending 31 December 2016 (rebased at 100 as at 1 January 2009).
100
200
300
400
500
600
700
Dec 09 Dec 10 Dec 11 Dec 12 Dec 13 Dec 14 Dec 16Dec 15Jan 09
Rotork plc
FTSE Industrial Engineering Sector
Historic Chief Executive remuneration table
Year Chief Executive
Chief Executive single figure
remuneration (£000s)
Annual cash bonus as a
percentage of maximum
opportunity
LTIP vesting rate as a percentage
of maximum opportunity
2016 Peter France 835 45.5% 0%2015 Peter France 696 23.4% 0%2014 Peter France 1,092 66.0% 37.0%2013 Peter France 1,452 94.4% 67.0%2012 Peter France 1,539 91.3% 75.5%2011 Peter France 1,182 88.9% 30.0%2010 Peter France 1,288 91.9% 94.4%2009 Peter France 1,062 99.5% 100.0%
Percentage change in remuneration of director undertaking the role of Chief ExecutiveThis shows the percentage change in remuneration (salary, benefits and bonus) between 2015 and 2016 of the Chief Executive, Peter France, compared to percentage change for UK employees, being the group against which salary increases are compared, calculated on a per head basis.
The remuneration breakdown varies from country to country, so the best comparison is obtained by looking at total remuneration. Total remuneration per employee has increased year-on-year by 18.9%. However, this comparison is distorted by currency movements as the average salary increase between 2015 and 2016 for overseas employees was 3.2%.
Peter France Chief Executive
Average per UK employee
2016% change from 2015
2016% change from 2015
Base salary 1.0% 1.0%Benefits 0.0% (6.8%)Bonus 144.6% 3.5%
DIRECTORS’ REMUNERATION REPORT continued

Governance Company InformationDirectors Financial StatementsStrategic Report
Rotork Annual Report 2016 91
Relative importance of spend on payThe following table shows actual expenditure of the Company and change in spend between current and prior financial periods on remuneration paid to all employees against distributions to shareholders. The employee remuneration increase is 31% if the impact of currency and acquisitions is removed.
2016 2015Percentage
change
Employee remuneration (£000s) 136,557 114,806 18.9%Dividends (£000s)(i) 43,876 43,765 0.3%
(i) Dividends paid were the only distributions to shareholders during the year.
Remuneration arrangements for former directorsBob Arnold retired from the Company on 31 August 2016. He did not receive any compensation for loss of office. He received a pro-rated annual cash bonus for 2016 as set out in the single total figure of remuneration table. The Remuneration Committee has exercised its discretion in relation to his outstanding LTIP awards for them not to lapse on his retirement in line with the relevant scheme rules applicable for each award. The Remuneration Committee considered that the use of its discretion in this way was justified given Bob Arnold‘s length of service as an employee and overall contribution to the Group. The awards remain eligible for vesting, on the normal vesting date, subject to performance and a time pro-rated reduction to reflect the proportion of the performance period served.
Graham Ogden retired from the Board on 31 March 2015. As disclosed in last year‘s report, he had been treated as a good leaver in respect of his outstanding 2013 and 2014 LTIP awards. For the 2013 LTIP award, performance was measured to the date of cessation of employment and vested in 2015 (as disclosed in last year's report). His 2014 award will lapse in March 2017.

Rotork Annual Report 201692
Statement of implementation of the policy report in 2017
Salary As noted in the Chair‘s letter, the salaries for the executive directors have been reviewed during the year and will be re-based as follows:
• Peter France – £525,000 (£445,000 to be taken in cash and £80,000 (net of tax) to be invested in Rotork shares and held for two years); and
• Jonathan Davis – £335,000 (£302,500 to be taken in cash and £32,500 (net of tax) to be invested in Rotork shares and held for two years).
Benefits No change to 2016 – benefits will comprise car and fuel (or car and fuel allowance), personal accident and private medical insurance and life assurance.
Pension Cash allowance in lieu of pension set at 25% of salary for Peter France and 20% of salary for Jonathan Davis.
Annual bonus Maximum award levels of 125% of salary for Peter France and 100% of salary for Jonathan Davis (unchanged from 2016). For the 2017 bonus onwards, any bonus above target performance (60% of maximum) will be deferred in shares for three years.
Bonuses will be based on annual profit (60%), cash generation (15%), lost time incident rate (5%) and personal strategic objectives (20%). The specific targets relating to the bonus have not been disclosed as they are considered by the Remuneration Committee to be commercially sensitive but full details will be given on a retrospective basis in next year‘s report.
LTIP The LTIP award levels for 2017 will be 150% of salary for the Chief Executive, 125% of salary for the Finance Director (unchanged from 2016). The awards will be subject to the following performance conditions:
• 33% will be based on relative TSR performance with 25% vesting at median increasing to full vesting for upper quartile performance or above;
• 33% will be based on EPS. EPS growth must be at least 9% for 15% vesting, increasing on a straight-line basis to full vesting for EPS growth of 35% and above. The comparator group for the 2017 awards will be the constituents of the FTSE 350 Industrial Goods and Services Sector. Awards in 2016 are based on the constituents of the FTSE 250 Index (excluding financial companies). The comparator group for the 2017 awards has been changed to more closely reflect the nature and business cycle of Rotork, providing a better benchmark to assess relative performance; and
• 33% will be based on a capital return measure (economic profit). This new measure will reward management for growing profits whilst retaining a disciplined approach to the management of the balance sheet. Economic profit is the extent to which a post-tax return in excess of the weighted average cost of capital (WACC) is created. This will reward management for increasing levels of economic profit, on a cumulative basis, over the three year performance period. Under this measure, no pay-out will be received for a negative economic profit and challenging targets have been set for the 2017 award. The threshold target will require the average economic profit over the three year period to exceed that generated in 2016 and the maximum target has been set such that it will require double digit growth in post-tax profits alongside improved balance sheet efficiencies. Details of the exact targets are considered by the Committee to be commercially sensitive at the current time. However, full details of the targets and how economic profit has been calculated will be disclosed on vesting.
For the 2017 awards onwards, the executive directors will be required to retain any shares vesting under the awards (net of tax) until the fifth anniversary of grant.
Shareholding guidelines
The executive directors will be required to build and maintain a shareholding equivalent to 400% of salary for Peter France and 250% of salary for Jonathan Davis (increased from 150% of salary in 2016).
Non-executive director fees
A change was made to the fee policy on 27 February 2017. The fee policy is:
• Chairman: £180,000;
• Base Board fee: £47,000;
• Additional fee for chairing the Audit Committee £10,000;
• Additional fee for chairing the Remuneration Committee £8,000; and
• Additional fee for the role of Senior Independent Director £10,000 (increased from £8,000).
DIRECTORS’ REMUNERATION REPORT continued

Governance Company InformationDirectors Financial StatementsStrategic Report
Rotork Annual Report 2016 93
Consideration by the directors of matters relating to directors’ remunerationThe members of the Remuneration Committee as at 31 December 2016 were Gary Bullard (Chair), Lucinda Bell, Sally James and John Nicholas. John Nicholas ceased to be a member on his retirement from the Board in February 2017. The Remuneration Committee invites the Group Human Resources Director to inform the Remuneration Committee of pay awards throughout the Group when setting executive director remuneration. The Chairman and Chief Executive are also invited to attend meetings except when their own remuneration is considered. The Company Secretary acts as secretary to the Remuneration Committee.
New Bridge Street is remuneration adviser to the Remuneration Committee and was appointed by the Remuneration Committee in September 2013 following a re-tendering process. New Bridge Street is a trading name of Aon plc and a signatory to the Remuneration Consultants’ Group Code of Conduct. A subsidiary of Aon plc is also the scheme actuary for the Group’s USA pension plan. The Remuneration Committee is satisfied that New Bridge Street is sufficiently independent to act as remuneration adviser to the Remuneration Committee.
In 2016, the Company paid £60,731 (2015: £54,926) to New Bridge Street for services to the Remuneration Committee. Figures exclude VAT and disbursements.
Statement of voting at general meetingAt the 2016 AGM of the Company, the percentages of votes cast ‘for‘, ‘against’ and ‘withheld’ in respect of the Annual Report on Remuneration were as follows:
ResolutionVotes cast
‘for‘Votes cast
‘against‘Votes
‘withheld‘
To approve the Annual Report on Remuneration 98.52% 1.43% 0%
‘Against’ votes cast at the AGM were a very small proportion of the overall votes and accordingly the directors did not deem it necessary to take any remedial action regarding these votes.

94 Rotork Annual Report 2016
REPORT OF THE
DIRECTORS
The directors submit their report which incorporates the management report required under the Disclosure Guidance and Transparency Rules for listed companies and the audited accounts for the year ended 31 December 2016 as set out on pages 104 to 148. In compiling this report, the directors have consulted with the management of the Group.
DirectorsThe names of the directors in office during the year still in office at the year end and their biographies and other details are set out on pages 60 to 61. Bob Arnold and John Nicholas were directors during the year and resigned from the Board on 31 August 2016 and 24 February 2017 respectively.
Directors’ indemnification and insuranceThe Company‘s articles of association provide for the directors and officers of the Company to be appropriately indemnified, subject to the provisions of the Companies Act 2006. The Company purchases and maintains insurance for the directors and officers of the Company in performing their duties, as permitted by section 233 Companies Act 2006.
Powers of the directorsAs set out in the Company‘s articles of association, the business of the Company is managed by the Board who may exercise all the powers of the Company.
Appointment and removal of directorsThe Board may appoint a director, either to fill a vacancy or as an additional director. Any director appointed by the Board must retire at the next AGM of the Company and put themselves forward for re-appointment by the shareholders. In accordance with the recommendations of the Code, each member of the Board submits themself for re-election on an annual basis.
In addition to any power of removal conferred by the Companies Act 2006, the Company may by ordinary resolution remove any director before the expiration of their period of office and may, subject to the articles of association, by ordinary resolution appoint another person who is willing to act as a director in their place.
Political donationsNo political donations were made during the year. The Group has a policy of not making political donations in any part of the world.
DividendThe directors recommend a final dividend of 3.15p per ordinary share (2015: 3.1p) for the year, payable on 15 May 2017 to shareholders on the register on 7 April 2017. An interim dividend for 2016 of 1.95p per ordinary share (2015: 1.95p) was paid on 23 September 2016.
Information required in the Report of the Directors’ set out in the Strategic ReportInformation relating to likely future developments of the Company and its subsidiaries and information relating to research and development activities of the Company and its subsidiaries is set out in the Strategic Report on pages 2 to 59.
Use of financial instrumentsAn explanation of the Group policies on the use of financial instruments and financial risk management objectives are contained in note 26 to the accounts.
Post-balance sheet eventsThere have been no important post-balance sheet events.
Existence of branches outside the UKThe Company has no branches outside of the UK.
Share capitalDetails of the Company‘s share capital including the rights and obligations attached to each class of shares and the ordinary shares issued during 2016 are summarised in note 17 of the financial statements. 0.5p ordinary shares represent over 99.9% of the Company‘s total share capital and £1 9.5% cumulative preference shares represent less than 0.1% of the Company‘s total share capital.
There are no securities of the Company carrying special rights with regard to the control of the Company.
At the Company‘s last AGM held on 29 April 2016, the shareholders authorised the Company to make market purchases of ordinary shares limited to just under approximately 10% of its issued ordinary share capital at that time and of certain issued preference shares, and to allot shares within certain limits approved by shareholders. These authorities expire at the 2017 AGM and appropriate renewals will be sought.
The Company did not acquire any of its own shares in 2016.

Governance Company InformationDirectors Financial StatementsStrategic Report
95Rotork Annual Report 2016
Substantial shareholdersAs at 31 December 2016, the following notifiable interests in issued share capital had been received by the Company under the Disclosure Guidance and Transparency Rules (DTR 5) of the UK Listing Authority. It should be noted that these holdings are likely to have changed since notified to the Company. However, notification of any change is not required until an applicable threshold is crossed.
IdentitySize of
holdingNature of
holding
Aberdeen Asset Managers Limited 4.99% IndirectAXA Investment Managers S.A. 4.99% IndirectAPG Asset Management NV 5.01% DirectBlackrock Inc 4.86% IndirectFiera Capital Corporation 4.23% IndirectMondrian Investment Partners Limited 4.91% IndirectT. Rowe Price Associates, Inc. 5.30%(i) Indirect
(i) The Company was informed on 23 February 2017 that T. Rowe Price Associates, Inc. had decreased the size of its holding to 4.97% of the voting capital. No other changes to the above have been disclosed to the Company in accordance with DTR 5 between the end of the financial year and 27 February 2017.
Corporate governanceThe Company‘s Corporate Governance Report can be found on pages 62 to 69.
Disclosure of information to auditorsThe directors who held office at the date of approval of this Report of the Directors confirm that, so far as they are each aware, there is no relevant audit information of which the Company‘s auditors are unaware; and each director has taken all the steps that they ought to have taken as a director to make themselves aware of any relevant audit information and to establish that the Company‘s auditor is aware of that information.
‘Going concern’ basis of preparationAfter making enquiries, the directors have a reasonable expectation that the Group has adequate resources to continue in operational existence for the foreseeable future. For this reason, they continue to adopt the going concern basis in preparing the financial statements. In forming this view, the directors have considered trading and cash flow forecasts, financial commitments, the significant order book with customers spread across different geographic areas and industries and the significant net cash position.
The Company‘s articles of association contain customary restrictions on the transfer of shares as applicable only in certain limited circumstances (e.g. in relation to transfers to a minor). Save for those provisions, there are no restrictions on the transfer of ordinary shares in the capital of the Company other than certain restrictions which may be required from time to time by law, for example, insider trading law. In accordance with the Company‘s share dealing code, directors and certain employees are required to seek the prior approval of the Company to deal in its shares.
The Company is not aware of any agreements between shareholders that may result in restrictions on the transfer of securities and/or voting rights. The Company‘s articles of association contain limited restrictions on the exercise of voting rights (e.g. in relation to disenfranchised shares following the issue of a notice to shareholders under section 793 Companies Act 2006).
The Company‘s share schemes each contain provisions providing voting rights to the scheme trustee.
Amendments to the Company‘s articles of associationThe Company‘s articles of association may only be amended by special resolution at a general meeting of the shareholders.
Significant agreements – change of controlThe Company is not aware of any significant agreements to which it is party that take effect, alter or terminate upon a change of control of the Company following a takeover. There are no agreements between the Company and its directors or employees that provide for compensation for loss of office or employment that occurs because of a takeover bid.
Greenhouse gas emissionsThe disclosures concerning greenhouse gas emissions required by law are set out in the corporate social responsibility report on page 56.
Disabled persons and employee involvementThe disclosures concerning the Group‘s policies on the employment of disabled persons and employee involvement are set out in the corporate social responsibility report on page 50.
Rotork Annual Report 201696
REPORT OF THE DIRECTORS continued
Statement of directors’ responsibility for preparing the Annual Report and financial statementsDirectors’ responsibilitiesThe directors are responsible for preparing the Annual Report and the financial statements in accordance with applicable law and regulations.
Company law requires the directors to prepare such financial statements for each financial year. Under that law the directors are required to prepare the Group financial statements in accordance with International Financial Reporting Standards (IFRSs) as adopted by the European Union and Article 4 of the IAS Regulation and have also chosen to prepare the parent company financial statements under IFRSs as adopted by the European Union. Under company law, the directors must not approve the financial statements unless they are satisfied that they give a true and fair view of the state of affairs of the Company and of the profit or loss of the Company for that period. In preparing these financial statements, IAS 1 requires that directors:
• Properly select and apply accounting policies;
• Present information, including accounting policies, in a manner that provides relevant, reliable, comparable and understandable information;
• Provide additional disclosures when compliance with the specific requirements in IFRSs are insufficient to enable users to understand the impact of particular transactions, other events and conditions on the entity‘s financial position and financial performance; and
• Make an assessment of the Company‘s ability to continue as a going concern.
The directors are responsible for keeping adequate accounting records that are sufficient to show and explain the Company‘s transactions and disclose with reasonable accuracy at any time the financial position of the Company and enable them to ensure that the financial statements comply with the Companies Act 2006. They are also responsible for safeguarding the assets of the Company and hence for taking reasonable steps for the prevention and detection of fraud and other irregularities.
The directors are responsible for the maintenance and integrity of the corporate and financial information included on the Company‘s website. Legislation in the United Kingdom governing the preparation and dissemination of financial statements may differ from legislation in other jurisdictions.
Directors’ responsibility statementWe confirm that to the best of our knowledge:
• The financial statements, prepared in accordance with IFRSs as adopted by the EU, give a true and fair view of the assets, liabilities, financial position and profit or loss of the Company and the undertakings included in the consolidation taken as a whole;
• The Strategic Report includes a fair review of the development and performance of the business and the position of the Company and the undertakings included in the consolidation taken as a whole, together with a description of the principal risks and uncertainties that they face; and
• The Annual Report and financial statements, taken as a whole, are fair, balanced and understandable and provide the information necessary for shareholders to assess the Company‘s performance, business model and strategy.
Directors’ statement pursuant to the Disclosure Guidance and Transparency Rules Each of the directors, whose names and functions are listed on pages 60 to 61 confirm that, to the best of each person‘s knowledge and belief:
• The financial statements, prepared in accordance with the applicable set of accounting standards, give a true and fair view of the assets, liabilities, financial position and profit of the Group and Company;
• The Report of the Directors includes a fair review of the development and performance of the business and the position of the Group and Company, together with a description of the principal risks and uncertainties that they face; and
• Having taken advice from the Audit Committee, the Annual Report and financial statements, taken as a whole, are fair, balanced and understandable and provide the information necessary for shareholders to assess the Company‘s performance, business model and strategies.
The directors are responsible for the maintenance and integrity of the corporate and financial information included on the Company‘s website. Legislation in the UK governing the preparation and dissemination of financial statements may differ from legislation in other jurisdictions.
External auditorUpon the recommendation of the Audit Committee and approval of the Board, a resolution to appoint Deloitte LLP as auditor, and to authorise the directors to determine their remuneration are to be proposed at the forthcoming AGM.
On behalf of the Board
Stephen Rhys Jones Company Secretary 27 February 2017

Company InformationDirectorsStrategic Report
97Rotork Annual Report 2016
Financial StatementsGovernance
INDEPENDENT AUDITOR'S REPORT TO THE MEMBERS OF ROTORK PLC
Opinion on financial statements of Rotork plcIn our opinion:• The financial statements give a true and fair view of the state of the Group's and of the parent company's affairs as at 31 December 2016
and of the Group's profit for the year then ended;
• The Group financial statements have been properly prepared in accordance with International Financial Reporting Standards (IFRSs) as adopted by the European Union;
• The Parent Company financial statements have been properly prepared in accordance with United Kingdom Generally Accepted Accounting Practice, including FRS 101 'Reduced Disclosure Framework'; and
• The financial statements have been prepared in accordance with the requirements of the Companies Act 2006 and, as regards the Group financial statements, Article 4 of the IAS Regulation.
The financial statements that we have audited comprise:
• The Group Income Statement;
• The Group Statement of Comprehensive Income;
• The Group and Parent Company Balance Sheets;
• The Group Cash Flow Statement;
• The Group and Parent Company Statements of Changes in Equity;
• The Statement of Accounting Policies; and
• The related notes 1 to 30 and a) to i).
The financial reporting framework that has been applied in the preparation of the Group financial statements is applicable law and IFRSs as adopted by the European Union. The financial reporting framework that has been applied in the preparation of the parent company financial statements is applicable law and United Kingdom Accounting Standards (United Kingdom Generally Accepted Accounting Practice), including FRS 101 'Reduced Disclosure Framework'.
Summary of our audit approach
Key risks The key risks that we identified for reporting in the current year were:
• Discount factors and growth rates utilised in management's assessment of impairment of goodwill, specifically in relation to the Bifold cash-generating unit (CGU);
• Manual adjustments to inventory provisions and profit in inventory adjustment; and
• Inflation and discount rate assumptions used in the valuation of the defined benefit pension scheme liabilities.
No new key risk areas have been identified in the current year.
Materiality The materiality that we used in the current year was £4.6m (2015: £5.3m) which was determined based on 5% of profit before tax.
Scoping Our Group audit was scoped by obtaining an understanding of the Group and its environment, including Group-wide controls, and assessing the risks of material misstatement at a Group level. Based on that assessment, we identified 26 components which, in our view, required a full scope audit of their financial information in order to ensure that sufficient appropriate audit evidence was obtained, with Europe, North America and China being the largest regions. 24 were subject to full scope audit and audit procedures were performed on key balances at the other two locations.
Significant changes in our approach
Last year our report included a risk in respect of the accounting for acquired intangibles on acquisition, which is not included in our report this year, given the reduction in acquisition activity. In the current year the risk of impairment of goodwill is specific to the Bifold entity.
98 Rotork Annual Report 2016
INDEPENDENT AUDITOR'S REPORT TO THE MEMBERS OF ROTORK PLC continued
Going concern and the directors' assessment of the principal risks that would threaten the solvency or liquidity of the Group
As required by the Listing Rules we have reviewed the directors' statement regarding the appropriateness of the going concern basis of accounting contained within note 1 to the financial statements and the directors' statement on the longer-term viability of the Group contained within the Strategic Report on page 35.
We are required to state whether we have anything material to add or draw attention to in relation to:
• The directors' confirmation on page 35 that they have carried out a robust assessment of the principal risks facing the Group, including those that would threaten its business model, future performance, solvency or liquidity;
• The disclosures on pages 32 to 35 that describe those risks and explain how they are being managed or mitigated;
• The directors' statement in note 1 to the financial statements about whether they considered it appropriate to adopt the going concern basis of accounting in preparing them and their identification of any material uncertainties to the Group's ability to continue to do so over a period of at least twelve months from the date of approval of the financial statements; and
• The directors' explanation on page 35 as to how they have assessed the prospects of the Group, over what period they have done so and why they consider that period to be appropriate, and their statement as to whether they have a reasonable expectation that the Group will be able to continue in operation and meet its liabilities as they fall due over the period of their assessment, including any related disclosures drawing attention to any necessary qualifications or assumptions.
We confirm that we have nothing material to add or draw attention to in respect of these matters.
We agreed with the directors' adoption of the going concern basis of accounting and we did not identify any such material uncertainties. However, because not all future events or conditions can be predicted, this statement is not a guarantee as to the Group's ability to continue as a going concern.
Independence
We are required to comply with the Financial Reporting Council's Ethical Standards for Auditors and confirm that we are independent of the Group and we have fulfilled our other ethical responsibilities in accordance with those standards.
We confirm that we are independent of the Group and we have fulfilled our other ethical responsibilities in accordance with those standards. We also confirm we have not provided any of the prohibited non-audit services referred to in those standards.

Company InformationDirectorsStrategic Report
99Rotork Annual Report 2016
Financial StatementsGovernance
Our assessment of risks of material misstatement
The assessed risks of material misstatement described below are those that had the greatest effect on our audit strategy, the allocation of resources in the audit and directing the efforts of the engagement team.
Risk titleDiscount factors and growth rates utilised in management's assessment of impairment of goodwill, specifically in relation to the Bifold CGU
Risk description Refer to pages 70 to 73 (Audit Committee Report), note 1 (Accounting policies), note 10 (Goodwill) and note 11 (Intangible assets).
The Group holds goodwill and acquired intangibles of £351.7m at 31 December 2016.
Management is required to assess the carrying value of goodwill and acquired intangibles, and perform an impairment review under IAS 36 'Impairment of Assets' on an annual basis and whenever an indication of impairment exists.
The key audit risk identified in relation to the impairment review is focused on the discount factors and future growth rate assumptions used to support the carrying value of goodwill in the Bifold CGU. As disclosed in note 10 the goodwill associated with the Bifold CGU of £67.2m is material, the level of headroom has reduced from the prior year and the model is sensitive to changes in both the discount rate and growth rates.
How the scope of our audit responded to the risk
• We challenged the reasonableness of forecast growth with reference to recent performance, trend analysis and external market data and confirmed that the forecast for 2017 was consistent with the Board approved budget.
• We visited the Bifold operations and made enquiries of Bifold management in relation to the current performance of the business and the growth assumptions in the forecasts.
• We obtained and reviewed a detailed Management impairment paper which had been considered and approved by the Board.
• We performed a specific review and challenge, involving our own internal valuations specialists, of the discount rate applied.
• We recalculated management's sensitivity analysis on key assumptions and replaced key assumptions with alternative scenarios e.g. an increase to the discount and a reduction in future growth rates.
• We considered the adequacy of the Group's disclosures in respect of the sensitivity of the Bifold CGU to changes in these key assumptions.
Key observations
We noted the significant short-term growth rates in respect of the Bifold CGU are a key source of estimation uncertainty. From our work performed, we concluded that the assumptions adopted by management were reasonable and no impairments were identified from the work performed.

100 Rotork Annual Report 2016
INDEPENDENT AUDITOR'S REPORT TO THE MEMBERS OF ROTORK PLC continued
Risk title Manual adjustments to inventory provision and profit in inventory adjustment
Risk description Refer to pages 70 to 73 (Audit Committee Report), note 1 (Accounting policies) and note 14 (Inventories).
The Group had inventory of £85.8m as at 31 December 2016 (£87.2m as at 31 December 2015) held in numerous global locations across several product lines.
We consider the risk in the valuation of inventory to be the manual override of inventory balances by management, which specifically occurs in two areas:
• Obsolescence provisions: local management apply judgement when deciding on levels of provisioning, overriding the automatic output from the Group's provisioning policy to reflect niche markets and industries where customer demand fluctuates over periods;
• Profit in inventory adjustment: there is management judgement required to arrive at the adjustment, specifically in relation to the average margin made on intercompany sales.
How the scope of our audit responded to the risk
Our component teams performed procedures to challenge local management to ensure the provisions were calculated in line with the Group's inventory provisioning policy. Procedures included recalculating the provisions, testing and verifying usage data and investigation of any manual override to the mechanical application of the provision, on a sample basis.
We challenged management's assumptions in relation to the profit in stock consolidation adjustment and corroborated the margin data utilised in this calculation to supporting evidence.
Key observations
We noted no material inconsistencies through our testing. We concur that the level of inventory provisions is appropriate.
Risk title Inflation and discount rate assumptions used in defined benefit pension liability valuation
Risk description Refer to pages 70 to 73 (Audit Committee Report), note 1 (Accounting policies) and note 24 (Pension Schemes).
The Group has a net defined benefit pension liability of £58.5m (gross liabilities of £236.5m) at 31 December 2016 (31 December 2015: £23.3m net liability and £180.4m gross liabilities).
There is a risk relating to judgements made by management in valuing the defined benefit pension scheme liabilities as small changes in the key model input assumptions such as the discount rate and inflation rate, can have a significant impact on the valuation of the liability.
How the scope of our audit responded to the risk
We used our internal actuarial experts to assess the key assumptions for the schemes in both the UK and US. Our assessment included reviewing available yield curves and inflation data to recalculate a reasonable range for the key assumptions.
We challenged management to understand the sensitivity of changes in assumptions and quantify a range of reasonable rates that could be used in their calculation. Additionally, we benchmarked key assumptions against other listed companies to identify any outliers in the data used.
We also considered the adequacy of the Group's disclosures in respect of the sensitivity of the deficit to changes in these key assumptions.
Key observations
From the work performed we are satisfied that the key assumptions applied in respect of the valuation of the defined benefit pension scheme liabilities are within a reasonable range.
These matters were addressed in the context of our audit of the financial statements as a whole, and in forming our opinion thereon, and we do not provide a separate opinion on these matters.

Company InformationDirectorsStrategic Report
101Rotork Annual Report 2016
Financial StatementsGovernance
Our application of materiality We define materiality as the magnitude of misstatement in the financial statements that makes it probable that the economic decisions of a reasonably knowledgeable person would be changed or influenced. We use materiality both in planning the scope of our audit work and in evaluating the results of our work.
Based on our professional judgement we determined materiality for the Group to be £4.6m (2015: £5.3m), which is 5% of pre-tax profit. The decrease in materiality is a result of the reduction in profit before tax compared to the prior year.
Group materiality £4.6m
PBT £91.1m
Component materiality range £1.8m to £2.5m
Audit committee reporting threshold £0.2mPBTGroup materiality
We agreed with the Audit Committee that we would report to the Committee all audit differences in excess of £229,000 (2015: £106,000), as well as differences below that threshold that, in our view, warranted reporting on qualitative grounds. We also report to the Audit Committee on disclosure matters that we identified when assessing the overall presentation of the financial statements.
An overview of the scope of our audit Our Group audit was scoped by obtaining an understanding of the Group and its environment, including Group-wide controls, and assessing the risks of material misstatement at a Group level. Our approach was consistent with that adopted in the prior year. Based on that assessment, we focused our Group audit scope primarily on the audit work at 26 components. 24 components were subject to a full scope audit and audit procedures were performed on key account balances at the other two locations where the extent of our testing was based on our assessment of the risks of material misstatement and of the materiality of the Group's operations at those locations.
74% Full audit
scope
85% Full audit
scope2% Specified
audit procedures
2% Specified
audit procedures
24% Review at
Group level
13% Review at
Group level
Revenue Profit before tax
102 Rotork Annual Report 2016
INDEPENDENT AUDITOR'S REPORT TO THE MEMBERS OF ROTORK PLC continued
The 26 locations represent the principal business units within the Group's four reportable segments across 15 countries and account for 76% of the Group's revenues (2015: 85%), 87% of profit before tax (2015: 95%). They were also selected to provide an appropriate basis for undertaking audit work to address the risks of material misstatement identified above. Our audit work at these locations was executed at levels of materiality applicable to each individual entity which were lower than Group materiality ranging from £1.8m to £2.5m.
Due to the significance to the Group audit of the 24 components' operations subject to full scope audits, a programme has been designed and implemented for senior members of the Group audit team to visit the key components where the Group audit scope was focused at least once every three years. As part of the 2016 audit, senior members of the Group audit team visited key components in the United Kingdom, United States of America, Italy, Spain and India.
For each of the businesses included within the programme of planned visits, the Group audit team also discusses audit findings with the relevant component audit team throughout the audit engagement and reviews relevant audit working papers. For the remaining locations where full audits were completed, we discuss audit findings with the relevant component audit team, review audit working papers in relation to key issues and discuss key matters with divisional management where considered necessary in forming our Group audit opinion. In relation to the locations which were subject to an audit of key account balances, we discuss the results of these businesses and accounting matters arising through our involvement in close meetings with management. At the parent entity level, we also tested the consolidation process and carried out analytical procedures to confirm our conclusion that there were no significant risks of material misstatement of the aggregated financial information of the remaining 34 components not subject to audit or audit of specified account balances. None of these components represented more than 2% of revenue or profit before taxation individually.
Opinion on other matters prescribed by the Companies Act 2006In our opinion, based on the work undertaken in the course of the audit:
• The part of the Directors' Remuneration Report to be audited has been properly prepared in accordance with the Companies Act 2006;
• The information given in the Strategic Report and the Directors' Report for the financial year for which the financial statements are prepared is consistent with the financial statements; and
• The Strategic Report and the Directors' Report have been prepared in accordance with applicable legal requirements.
In the light of the knowledge and understanding of the Company and its environment obtained in the course of the audit, we have not identified any material misstatements in the Strategic Report and the Directors' Report.
Matters on which we are required to report by exception
Adequacy of explanations received and accounting recordsUnder the Companies Act 2006 we are required to report to you if, in our opinion:
• We have not received all the information and explanations we require for our audit; or
• Adequate accounting records have not been kept by the parent company, or returns adequate for our audit have not been received from branches not visited by us; or
• The parent company financial statements are not in agreement with the accounting records and returns.
We have nothing to report in respect of these matters.
Directors' remunerationUnder the Companies Act 2006 we are also required to report if in our opinion certain disclosures of directors' remuneration have not been made or the part of the Directors' Remuneration Report to be audited is not in agreement with the accounting records and returns.
We have nothing to report arising from these matters.
Corporate Governance statementUnder the Listing Rules we are also required to review part of the Corporate Governance Statement relating to the Company's compliance with certain provisions of the UK Corporate Governance Code.
We have nothing to report arising from our review.
Our duty to read other information in the Annual ReportUnder International Standards on Auditing (UK and Ireland), we are required to report to you if, in our opinion, information in the Annual Report is:
• Materially inconsistent with the information in the audited financial statements; or
• Apparently materially incorrect based on, or materially inconsistent with, our knowledge of the Group acquired in the course of performing our audit; or
• Otherwise misleading.
In particular, we are required to consider whether we have identified any inconsistencies between our knowledge acquired during the audit and the directors' statement that they consider the Annual Report is fair, balanced and understandable and whether the Annual Report appropriately discloses those matters that we communicated to the audit committee which we consider should have been disclosed.
We confirm that we have not identified any such inconsistencies or misleading statements.

Company InformationDirectorsStrategic Report
103Rotork Annual Report 2016
Financial StatementsGovernance
Respective responsibilities of directors and auditorAs explained more fully in the Directors' Responsibilities Statement, the directors are responsible for the preparation of the financial statements and for being satisfied that they give a true and fair view. Our responsibility is to audit and express an opinion on the financial statements in accordance with applicable law and International Standards on Auditing (UK and Ireland). We also comply with International Standard on Quality Control 1 (UK and Ireland). Our audit methodology and tools aim to ensure that our quality control procedures are effective, understood and applied. Our quality controls and systems include our dedicated professional standards review team and independent partner reviews.
This report is made solely to the Company's members, as a body, in accordance with Chapter 3 of Part 16 of the Companies Act 2006. Our audit work has been undertaken so that we might state to the Company's members those matters we are required to state to them in an auditor's report and for no other purpose. To the fullest extent permitted by law, we do not accept or assume responsibility to anyone other than the Company and the Company's members as a body, for our audit work, for this report, or for the opinions we have formed.
Scope of the audit of the financial statementsAn audit involves obtaining evidence about the amounts and disclosures in the financial statements sufficient to give reasonable assurance that the financial statements are free from material misstatement, whether caused by fraud or error. This includes an assessment of: whether the accounting policies are appropriate to the Group's and the parent company's circumstances and have been consistently applied and adequately disclosed; the reasonableness of significant accounting estimates made by the directors; and the overall presentation of the financial statements. In addition, we read all the financial and non-financial information in the Annual Report to identify material inconsistencies with the audited financial statements and to identify any information that is apparently materially incorrect based on, or materially inconsistent with, the knowledge acquired by us in the course of performing the audit. If we become aware of any apparent material misstatements or inconsistencies we consider the implications for our report.
Nicola Mitchell FCA(Senior Statutory Auditor)for and on behalf of Deloitte LLPChartered Accountants and Statutory AuditorLondon, United Kingdom27 February 2017

104 Rotork Annual Report 2016
CONSOLIDATED INCOME STATEMENTFor the year ended 31 December 2016
Notes2016£000
2015£000
Revenue 2 590,078 546,459Cost of sales (328,410) (296,944)
Gross profit 261,668 249,515Other income 4 629 427Distribution costs (5,138) (4,613)Administrative expenses (163,165) (140,877)Other expenses 5 (217) (66)
Operating profit before the amortisation of acquired intangible assets 120,588 125,272Amortisation of acquired intangible assets (26,811) (20,886)
Operating profit 2 93,777 104,386
Finance income 7 1,744 1,740Finance expense 7 (4,451) (4,257)
Profit before tax 8 91,070 101,869Income tax expense 9 (23,897) (27,012)
Profit for the year 67,173 74,857
Basic earnings per share 18 7.7p 8.6pAdjusted basic earnings per share 18 10.0p 10.4pDiluted earnings per share 18 7.7p 8.6pAdjusted diluted earnings per share 18 10.0p 10.4p
CONSOLIDATED STATEMENT OF COMPREHENSIVE INCOMEFor the year ended 31 December 2016
2016£000
2015£000
Profit for the year 67,173 74,857Other comprehensive incomeItems that may be subsequently reclassified to the income statement:Foreign exchange translation differences 36,854 (6,511)Effective portion of changes in fair value of cash flow hedges net of tax (6,414) (1,448)
30,440 (7,959)Items that are not subsequently reclassified to the income statement:Actuarial (loss)/gain in pension scheme net of tax (30,732) 8,049
Income and expenses recognised directly in equity (292) 90
Total comprehensive income for the year 66,881 74,947
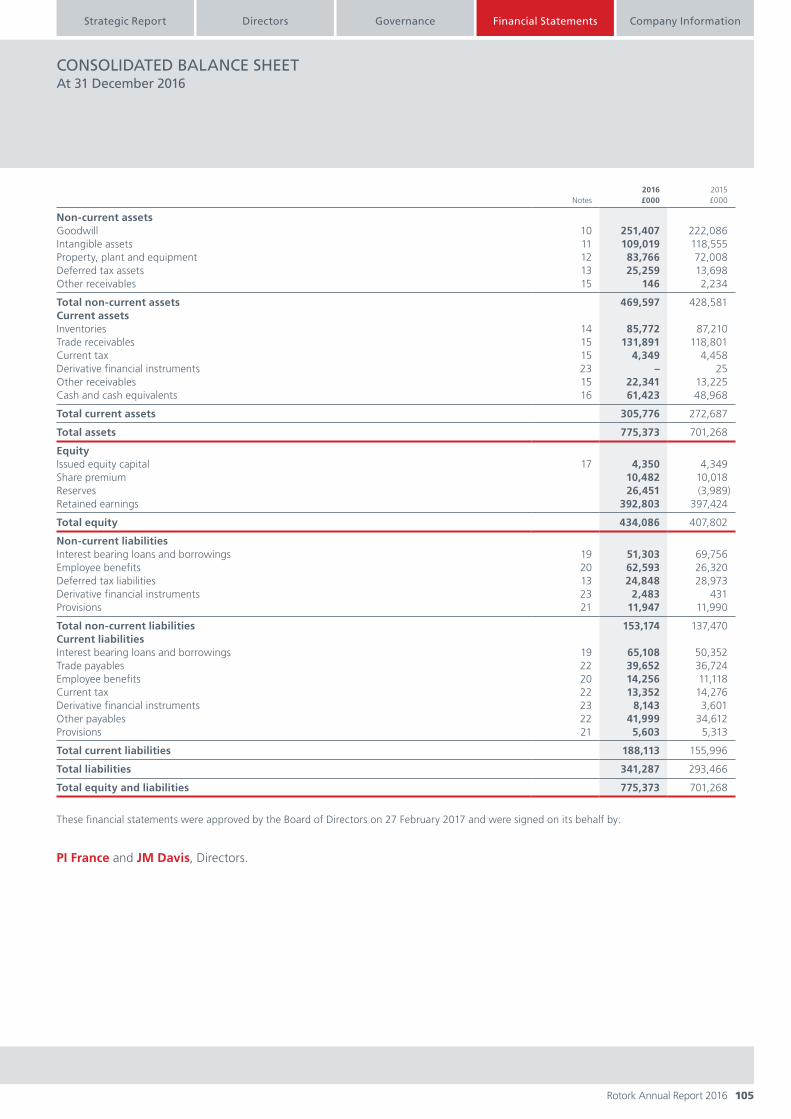
Company InformationDirectorsStrategic Report
105Rotork Annual Report 2016
Financial StatementsGovernance
CONSOLIDATED BALANCE SHEETAt 31 December 2016
Notes2016£000
2015£000
Non-current assetsGoodwill 10 251,407 222,086Intangible assets 11 109,019 118,555Property, plant and equipment 12 83,766 72,008Deferred tax assets 13 25,259 13,698Other receivables 15 146 2,234
Total non-current assets 469,597 428,581Current assetsInventories 14 85,772 87,210Trade receivables 15 131,891 118,801Current tax 15 4,349 4,458Derivative financial instruments 23 – 25Other receivables 15 22,341 13,225Cash and cash equivalents 16 61,423 48,968
Total current assets 305,776 272,687
Total assets 775,373 701,268
EquityIssued equity capital 17 4,350 4,349Share premium 10,482 10,018Reserves 26,451 (3,989)Retained earnings 392,803 397,424
Total equity 434,086 407,802
Non-current liabilitiesInterest bearing loans and borrowings 19 51,303 69,756Employee benefits 20 62,593 26,320Deferred tax liabilities 13 24,848 28,973Derivative financial instruments 23 2,483 431Provisions 21 11,947 11,990
Total non-current liabilities 153,174 137,470Current liabilitiesInterest bearing loans and borrowings 19 65,108 50,352Trade payables 22 39,652 36,724Employee benefits 20 14,256 11,118Current tax 22 13,352 14,276Derivative financial instruments 23 8,143 3,601Other payables 22 41,999 34,612Provisions 21 5,603 5,313
Total current liabilities 188,113 155,996
Total liabilities 341,287 293,466
Total equity and liabilities 775,373 701,268
These financial statements were approved by the Board of Directors on 27 February 2017 and were signed on its behalf by:
PI France and JM Davis, Directors.

106 Rotork Annual Report 2016
CONSOLIDATED STATEMENT OF CHANGES IN EQUITYFor the year ended 31 December 2016
Issuedequitycapital
Sharepremium
Translationreserve
Capitalredemption
reserveHedging
reserveRetainedearnings Total
Balance at 31 December 2014 4,346 9,422 1,799 1,644 527 359,057 376,795Profit for the year – – – – – 74,857 74,857Other comprehensive income
Foreign exchange translation differences – – (6,511) – – – (6,511)Effective portion of changes in fair value of
cash flow hedges – – – – (1,790) – (1,790)Actuarial gain on defined benefit
pension plans – – – – – 9,704 9,704Tax on other comprehensive income – – – – 342 (1,655) (1,313)
Total other comprehensive income – – (6,511) – (1,448) 8,049 90
Total comprehensive income – – (6,511) – (1,448) 82,906 74,947Transactions with owners, recorded
directly in equityEquity settled share-based payments
transactions – – – – – (1,447) (1,447)Tax on equity settled share-based
payment transactions – – – – – (799) (799)Share options exercised by employees 3 596 – – – – 599Own ordinary shares acquired – – – – – (2,785) (2,785)Own ordinary shares awarded under
share schemes – – – – – 4,257 4,257Dividends – – – – – (43,765) (43,765)
Balance at 31 December 2015 4,349 10,018 (4,712) 1,644 (921) 397,424 407,802
Profit for the year – – – – – 67,173 67,173Other comprehensive income
Foreign exchange translation differences – – 36,854 – – – 36,854Effective portion of changes in fair value of
cash flow hedges – – – – (7,822) – (7,822)Actuarial loss on defined benefit
pension plans – – – – – (37,923) (37,923)Tax on other comprehensive income – – – – 1,408 7,191 8,599
Total other comprehensive income – – 36,854 – (6,414) (30,732) (292)
Total comprehensive income – – 36,854 – (6,414) 36,441 66,881Transactions with owners, recorded
directly in equityEquity settled share-based payments
transactions – – – – – 1,557 1,557Tax on equity settled share-based
payment transactions – – – – – 74 74Share options exercised by employees 1 464 – – – – 465Own ordinary shares acquired – – – – – (1,019) (1,019)Own ordinary shares awarded under
share schemes – – – – – 2,202 2,202Dividends – – – – – (43,876) (43,876)
Balance at 31 December 2016 4,350 10,482 32,142 1,644 (7,335) 392,803 434,086
Detailed explanations for equity capital, the translation reserve, capital redemption reserve and hedging reserve can be seen in note 17.

Company InformationDirectorsStrategic Report
107Rotork Annual Report 2016
Financial StatementsGovernance
CONSOLIDATED STATEMENT OF CASH FLOWSFor the year ended 31 December 2016
Notes2016£000
2016£000
2015£000
2015£000
Cash flows from operating activitiesProfit for the year 67,173 74,857Adjustments for:Amortisation of intangibles 26,811 20,886Amortisation of development costs 2,226 1,814Depreciation 11,759 9,759Equity settled share-based payment expense 3,759 2,810Profit on sale of property, plant and equipment (254) (280)Finance income (1,744) (1,740)Finance expense 4,451 4,257Income tax expense 23,897 27,012
138,078 139,375Decrease in inventories 14,416 731Decrease in trade and other receivables 2,511 15,664Increase/(decrease) in trade and other payables 1,309 (6,931)Difference between pension charge and cash contribution (5,297) (5,051)Decrease in provisions (496) (56)Increase/(decrease) in employee benefits 1,047 (4,226)
151,568 139,506Income taxes paid (32,876) (35,716)
Cash flows from operating activities 118,692 103,790
Investing activitiesPurchase of property, plant and equipment (14,692) (11,762)Development costs capitalised (2,957) (3,063)Sale of property, plant and equipment 648 1,508Acquisition of businesses, net of cash acquired 3 (16,109) (133,857)Contingent consideration paid (257) (4,536)Settlement of hedging derivatives (25,867) 1,949Interest received 180 1,103
Cash flows from investing activities (59,054) (148,658)
Financing activitiesIssue of ordinary share capital 466 599Own ordinary shares acquired (1,019) (2,785)Interest paid (2,649) (1,759)(Decrease)/increase in bank loans (3,619) 98,326Repayment of finance lease liabilities (253) (100)Dividends paid on ordinary shares (43,876) (43,765)
Cash flows from financing activities (50,950) 50,516
Increase in cash and cash equivalents 8,688 5,648Cash and cash equivalents at 1 January 48,968 46,816Effect of exchange rate fluctuations on cash held 3,767 (3,496)
Cash and cash equivalents at 31 December 16 61,423 48,968
108 Rotork Annual Report 2016
NOTES TO THE GROUP FINANCIAL STATEMENTSFor the year ended 31 December 2016
Except where indicated, values in these notes are in £000.
Rotork plc is a company domiciled in England. The consolidated financial statements of the Company for the year ended 31 December 2016 comprise the Company and its subsidiaries (together referred to as the Group). The accounting policies contained below in note 1 and the disclosures in notes 2 to 30 all relate to the Group financial statements. The Company balance sheet, accounting policies and applicable notes can be found following note 30.
1. Accounting policiesThe accounting policies applied in the preparation of these consolidated financial statements are set out below. These policies have been consistently applied to the years presented, unless otherwise stated.
Basis of preparationThe consolidated financial statements of Rotork plc have been prepared and approved by the directors in accordance with International Financial Reporting Standards as adopted by the European Union (IFRSs as adopted by the EU), IFRIC Interpretations and the Companies Act 2006 applicable to companies reporting under IFRS.
The consolidated financial statements have been prepared under the historical cost convention subject to the items referred to in the derivative financial instruments accounting policy below.
New accounting standards and interpretationsThe following narrow scope amendments which were issued as part of the IFRS Annual improvement cycles have been applied from 1 January 2016:
• Amendments to IAS 1, 'Disclosure Initiative'
• Amendments to IFRS 10, IFRS 12 and IAS 28, 'Applying the Consolidation Exemption'
• Amendments to IFRS 11, 'Accounting for Acquisition Interests in Joint Operations'
• Amendments to IAS 16 and IAS 38, 'Clarification of Acceptable Methods of Depreciation and Amortisation'
• Amendments to IAS 27, 'Equity Method in Separate Financial Statements'
• Amendments to IFRS 5, 'Changes in Methods of Disposal'
• Amendments to IFRS 7, 'Servicing Contracts'
• Amendments to IAS 19, 'Regional Market Issue' Application of these standards and amendments has not had any material impact on the disclosures or on the amounts recognised in the Group's consolidated financial statements.
Recent accounting developmentsIFRS 15, 'Revenue from contracts with customers' has been issued but is not yet effective and has not been adopted as application was not mandatory for the year. The new standard requires the separation of performance obligations within contracts with customers and the contractual value to be allocated to the performance obligations. Once a performance obligation is satisfied revenue should be recognised on that element of the contract. The introduction of the standard is likely to have some impact on Rotork but this is unlikely to be material due to the relatively straightforward contractual terms and conditions with customers. An exercise is in process to confirm the impact of this standard before it becomes effective in January 2018.
IFRS 9, 'Financial Instruments' has been issued but is not yet effective and has not been adopted as application was not mandatory for the year. The directors anticipate that the adoption of this standard will not have a material impact on the disclosures, net assets or results of the Group.
IFRS 16, 'Leases' has been issued but is not yet effective and has not been adopted as application was not mandatory for the year. The new standard will eliminate the classification of leases as either operating or finance leases and result in operating leases being treated as finance leases. This will result in previously recognised operating leases being treated as property, plant and equipment and a finance lease creditor. The introduction of the standard will increase the value of property, plant and equipment and the finance lease liability on the balance sheet but it is unlikely to have a material impact on profit in any year. An assessment will be carried out to understand the full impact of the standard before it becomes effective in January 2019.
Going concernAfter carrying out a detailed review of the viability of the business, the directors have a reasonable expectation that the Group has adequate resources to continue in operational existence for the foreseeable future. For this reason, they continue to adopt the going concern basis in preparing the financial statements. In forming this view, the directors have considered trading and cash flow forecasts, financial commitments, the significant order book with customers spread across different geographic areas and industries and the net debt position.
ConsolidationThe consolidated financial statements incorporate the financial statements of the Company and its subsidiaries for the year to 31 December 2016. The financial statements of subsidiaries are included in the consolidated financial statements from the date that control commences until the date control ceases. Intra-group balances and any unrealised gains or losses or income and expenses arising from intra-group transactions are eliminated in preparing the consolidated financial statements.
Company InformationDirectorsStrategic Report
109Rotork Annual Report 2016
Financial StatementsGovernance
Foreign currenciesThe individual financial statements of each Group company are presented in the currency of the primary economic environment in which it operates (its functional currency). For the purposes of the consolidated financial statements, the results and financial position of each Group company is expressed in sterling, which is the functional currency of the Company, and the presentational currency for the consolidated financial statements.
Transactions in foreign currencies are translated at the foreign exchange rate ruling at the date of the transaction. Monetary assets and liabilities denominated in foreign currencies at the balance sheet date are translated to sterling at the foreign exchange rate ruling at that date. Foreign exchange differences arising on translation are recognised in the income statement. Non-monetary assets and liabilities that are measured in terms of historical cost in a foreign currency are translated using the exchange rate at the date of the transaction. Non-monetary assets and liabilities denominated in foreign currencies that are stated at fair value are translated to sterling at foreign exchange rates at the dates the values were determined.
Assets and liabilities of foreign subsidiaries, including goodwill and fair value adjustments arising on consolidation, are translated into sterling at rates of exchange ruling at the balance sheet date. The revenues and expenses of foreign subsidiaries are translated to sterling at rates approximating those ruling at the date of the transactions. Differences on exchange arising from the retranslation of the opening net investment in subsidiaries, and from the translation of the results of those subsidiaries at average rate, are reported as an item of other comprehensive income and accumulated in the translation reserve.
Any differences that have arisen since 1 January 2004, the date of transition to IFRS, are presented as a separate component of equity. Translation differences that arose before the date of transition to IFRS in respect of all foreign entities are not presented as a separate component.
RevenueRevenue comprises the fair value of the consideration received or receivable for the sale of goods or services. Revenue is shown net of value-added tax, returns, rebates and discounts and after eliminating sales within the Group. The Group recognises revenue when the amount of revenue can be reliably measured, it is probable that future economic benefits will flow to the entity and when specific criteria have been met for each of the Group's activities.
Revenue from the sale of actuators, gearboxes and flow control products is recognised in the income statement when the significant risks and rewards of ownership have been transferred to the buyer in accordance with the contracted shipping terms.
Revenue from service work is recognised in the income statement in proportion to the stage of completion of the transaction at the balance sheet date. No revenue is recognised if there are significant uncertainties regarding recovery of the consideration due, associated completion costs, the possible return of goods or continuing management involvement with the goods.
Business combinationsBusiness combinations are accounted for using the acquisition method as at the acquisition date, which is the date on which control is transferred to the Group.
For acquisitions on or after 1 January 2010, the Group measures goodwill at the acquisition date as:
• The fair value of the consideration transferred; plus
• The recognised amount of any non-controlling interests in the acquiree; plus
• The fair value of the existing equity interest in the acquiree; less
• The net recognised amount (generally fair value) of the identifiable assets acquired and liabilities assumed.
When the excess is negative, a bargain purchase gain is recognised immediately in the income statement. The fair value of the assets and liabilities assumed are provisional for a 12 month period. Costs related to the acquisition, other than those associated with the issue of debt or equity securities, are expensed as incurred.
Any contingent consideration payable is recognised at fair value at the acquisition date. If the contingent consideration is classified as equity, it is not remeasured and settlement is accounted for within equity. Otherwise, subsequent changes to the fair value of the contingent consideration are recognised in profit or loss.
Goodwill is stated at cost or deemed cost less any impairment losses. Goodwill is not amortised but is reviewed for impairment annually. For the purposes of impairment testing, goodwill is allocated to each of the Group's cash-generating units expected to benefit from the synergies of the combination. An impairment loss is recognised whenever the carrying value of an asset or its CGU exceeds its recoverable amount. Impairment losses are recognised in the income statement.

Rotork Annual Report 2016110
NOTES TO THE GROUP FINANCIAL STATEMENTS continuedFor the year ended 31 December 2016
1. Accounting policies continued Intangible assetsi) Research and developmentExpenditure on research activities, undertaken with the prospect of gaining new scientific or technical knowledge and understanding, is recognised in the income statement in the period in which it is incurred. Development costs incurred after the point at which the commercial and technical feasibility of the product have been proven, and the decision to complete the development has been taken and resources made available, are capitalised. The expenditure capitalised includes the cost of materials, direct labour and an appropriate proportion of overheads. Capitalised development expenditure is stated at cost less accumulated amortisation and impairment losses. Development expenditure has an estimated useful life of up to five years and is written off on a straight-line basis.
ii) Other intangible assetsOther intangible assets that are acquired by the Group as part of a business combination are stated at cost less accumulated amortisation and impairment losses. The useful life of each of these assets is assessed based on discussions with the management of the acquired business and takes account of the differing natures of each of the intangibles acquired. The assessed useful lives of intangibles acquired are as follows:
Brands and trademarks 4 to 10 yearsCustomer relationships 2 to 8 yearsProduct design patents 4 to 8 yearsOrder backlog 3 months to 1 year
Amortisation is charged on a straight-line basis over the estimated useful life of the assets.
Property, plant and equipmentFreehold land is not depreciated. Long leasehold buildings are amortised over 50 years or the expected useful life of the building where less than 50 years. Other assets are depreciated in equal annual instalments by reference to their estimated useful lives and residual values at the following annual rates:
Freehold buildings 2% to 4%Short leasehold buildings period of leasePlant and equipment 10% to 33%
Items of property, plant and equipment are stated at cost or deemed cost less accumulated depreciation.
LeasesWhere fixed assets are financed by leasing agreements, which give rights approximating to ownership, the assets are treated as if they had been purchased and the capital element of the leasing commitments are shown as obligations under finance leases. Assets acquired under finance leases are initially recognised at the present value of the minimum lease payments. The rentals payable are apportioned between interest, which is charged to the income statement, and liability, which reduces the outstanding obligation so as to give a constant rate of charge on the outstanding lease obligations. Costs in respect of operating leases are charged on a straight-line basis over the term of the lease in arriving at the operating profit.
Interest-bearing loans and borrowingsObligations for loans and borrowings are recognised when the Group becomes party to the related contracts and are measured initially at fair value less directly attributable transaction costs. After initial recognition, interest-bearing loans and borrowings are subsequently measured at amortised cost. Amortised cost is calculated by taking into account any issue costs and any discount or premium on settlement. Borrowings are classified as current liabilities unless the Group has an unconditional right to defer settlement of the liability for at least 12 months after the balance sheet date.
TaxationIncome tax on the profit for the year comprises current and deferred tax. Income tax is recognised in the income statement except to the extent that it relates to items recognised directly in equity, in which case it is recognised in equity. Current tax is the expected tax payable on the taxable income for the year, using tax rates enacted or substantively enacted at the balance sheet date, and any adjustment to tax payable in respect of previous years.
Deferred tax is provided using the balance sheet liability method, providing for temporary differences between the carrying amounts of assets and liabilities for financial reporting purposes and the amounts used for taxation purposes. The following temporary differences are not provided for: goodwill, not deductible for tax purposes, and the initial recognition of assets or liabilities that affect neither accounting nor taxable profits. The amount of deferred tax provided is based on the expected manner of realisation or settlement of the carrying amount of assets and liabilities, using tax rates enacted or substantively enacted at the balance sheet date.
A deferred tax asset is recognised only to the extent that it is probable that future taxable profits will be available against which the asset can be utilised. Deferred tax assets are reduced to the extent that it is no longer probable that the related tax benefit will be realised.

Company InformationDirectorsStrategic Report
111Rotork Annual Report 2016
Financial StatementsGovernance
Inventory and work in progressInventory and work in progress is valued at the lower of cost and net realisable value. In respect of work in progress and finished goods, cost includes all production overheads and the attributable proportion of indirect overhead expenses which are required to bring inventories to their present location and condition. The net realisable value in respect of old and slow-moving inventory is assessed by reference to historic usage patterns and forecast future usage.
Cash and cash equivalentsCash and cash equivalents comprise cash balances and short-term (with an original maturity less than three months) deposits. Bank overdrafts that are repayable on demand form part of cash and cash equivalents for the purpose of the consolidated statement of cash flows.
EquityEquity comprises issued equity capital, share premium, reserves and retained earnings.
When issued equity capital is repurchased, the amount paid, including directly attributable costs, is recognised as a change in equity. Repurchased shares are debited directly to equity and shown as a deduction from retained earnings.
Provisionsi) WarrantiesA provision for warranties is recognised when the underlying products or services are sold. The provision is based on historical warranty cost data, known issues and management expectations of future costs.
ii) Contingent considerationThe terms of an acquisition may provide that the value of the purchase consideration, which may be payable in cash at a future date, depends on uncertain future events. The amounts recognised in the financial statements represent a fair value estimate at the balance sheet date of the amounts expected to be paid.
Employee benefitsi) Pension plansWhere the Group operates a defined benefit pension scheme, contributions are made in accordance with the schedule of contributions agreed with the Trustees. In respect of all actuarial gains and losses that arise in calculating the Group's obligation in respect of the plans, these are recognised in equity. The retirement benefit obligation recognised in the consolidated balance sheet represents the deficit in the Group's defined benefit pension schemes. Interest on pension scheme liabilities has been recognised within financing expenses.
The Group also operates defined contribution pension schemes. The costs for these schemes are recognised in the income statement as incurred.
ii) Share-based payment transactionsThe Rotork UK Sharesave scheme, introduced in 2004, offers certain employees the opportunity to purchase shares in Rotork plc at a discounted price compared with the market price at the time of grant. Details of the scheme are given in note 25. The fair value of the right/option is recognised as an employee expense with a corresponding increase in equity. The fair value is measured at grant date and spread over the period between grant and maturity. The right/option reaches maturity when the employee becomes unconditionally entitled. The fair value of the grant is measured using a Black-Scholes model, taking into account the terms and conditions upon which the rights were granted. The amount recognised as an expense is adjusted to reflect the actual number of share options that vest except where forfeiture is due only to share prices not achieving the threshold for vesting.
The Rotork long term incentive plan (LTIP) grants awards of shares to executive directors and senior managers. These awards may vest after a period of three years dependent upon both market and non-market performance conditions being met. Details of the grants are given in note 25. The fair value of the award is measured at grant date, using a Monte Carlo simulation model which takes into account the market-based performance criteria, and spread over the vesting period. The fair value of the award is recognised as an employee expense with a corresponding increase in equity for the share settled award. The amount recognised as an expense is adjusted to exclude options that do not vest as a result of non-market performance conditions not being met.
The overseas profit linked share plan (OPLSS) and the share incentive plan (SIP) are discretionary profit linked share schemes based on the prior year profit of the participating Rotork companies. The value of the award to each employee is based on salary and the length of service, the value of the awards can be up to £3,600. Shares awarded under these schemes are issued by the trustee at the cost of purchase. The costs of providing these plans are recognised in the consolidated income statement over the period to which the employee has earned the award.
iii) Long-term service leaveThe Group's net obligation in respect of long-term service leave is the amount of future benefit that employees have earned in return for their service in the current and prior periods.
iv) Other employee benefitsThe Group offers a number of discretionary bonus schemes to employees around the world. The costs of these schemes are recognised in the income statement as incurred.

112 Rotork Annual Report 2016
1. Accounting policies continued Derivative financial instrumentsThe Group uses forward exchange contracts and swaps to hedge its exposure to foreign exchange risk arising from operational and financing activities. These are the only derivative financial instruments used by the Group. In accordance with its Treasury Policy, the Group does not hold or issue contracts for trading purposes. Forward exchange contracts that do not qualify for hedge accounting are accounted for as trading instruments.
Forward exchange contracts are recognised initially at fair value. Where a forward exchange contract is designated as a hedge of the variability in cash flows of a recognised liability, a firm commitment or a highly probable forecasted transaction, the effective part of any gain or loss on the forward contract is recognised directly in equity. Any effective cumulative gain or loss is removed from equity and recognised in the income statement at the same time as the hedged transaction. The ineffective part of any gain or loss is recognised in the income statement immediately.
When a hedging instrument or hedge relationship is terminated but the hedged transaction is still expected to occur, the cumulative gain or loss at that point remains in equity and is recognised in accordance with the above policy when the transaction occurs. If the hedged transaction is no longer expected to take place, the cumulative unrealised gain or loss held in equity is recognised in the income statement immediately.
DividendsInterim dividends are recorded in the financial statements when they are paid. Final dividends are recorded in the financial statements in the period in which they are approved by the Company's shareholders.
Critical accounting estimates and judgementsEstimates and judgements are regularly evaluated and are based on historical experience and other factors, including expectations of future events that are believed to be reasonable under the circumstances.
The Group makes estimates and assumptions concerning the future. The resulting estimates will, by definition, seldom equal the actual results. The estimates and assumptions that have a risk of causing a material adjustment to the carrying amount of assets and liabilities in the next financial year are listed below.
Impairment of intangible assetsIntangible assets (other than goodwill) are amortised over their useful lives which are based on management's estimates of the period over which the assets will generate revenue. The useful lives are periodically reviewed to ensure they continue to be appropriate. Changes to the estimates used can result in significant variations in the carrying value.
The Group assesses the impairment of intangible assets subject to amortisation whenever events or changes in circumstances indicate that the carrying value might not be recoverable. Additionally, goodwill arising on acquisitions and indefinite lived assets are subject to impairment review. The Group undertakes an impairment review annually or more frequently if events or changes in circumstances indicate that the carrying value may not be recoverable.
Factors considered important that could trigger an impairment review of intangible assets include the following:
• Significant underperformance relative to historical or projected future operating results;
• Significant changes in the use of the acquired assets or the strategy for the overall business; or
• Significant negative industry or economic trends.
The key assumptions in the value in use calculations are the discount rate and growth rates. Explanations of the estimates, judgements and sensitivities in respect of the current year impairment review are detailed in note 10.
Retirement benefitsThe Group's financial statements include costs in relation to, and provisions for, retirement benefit obligations. The costs and the present value of any defined benefit pension related assets and liabilities depend on such factors as life expectancy of the members, salary increases, inflation, the returns that the plan assets will generate and the discount rate to calculate the present value of the liabilities. Retirement benefits are inherently long-term and the calculation of any charge relating to retirement benefit obligations is dependent on the assumptions used, which reflects the exercise of judgement. The assumptions adopted are based on prior experience, market conditions and the advice of qualified actuaries. Sensitivities to changes in key assumptions affecting the pension schemes' liabilities are shown in note 24.
NOTES TO THE GROUP FINANCIAL STATEMENTS continuedFor the year ended 31 December 2016
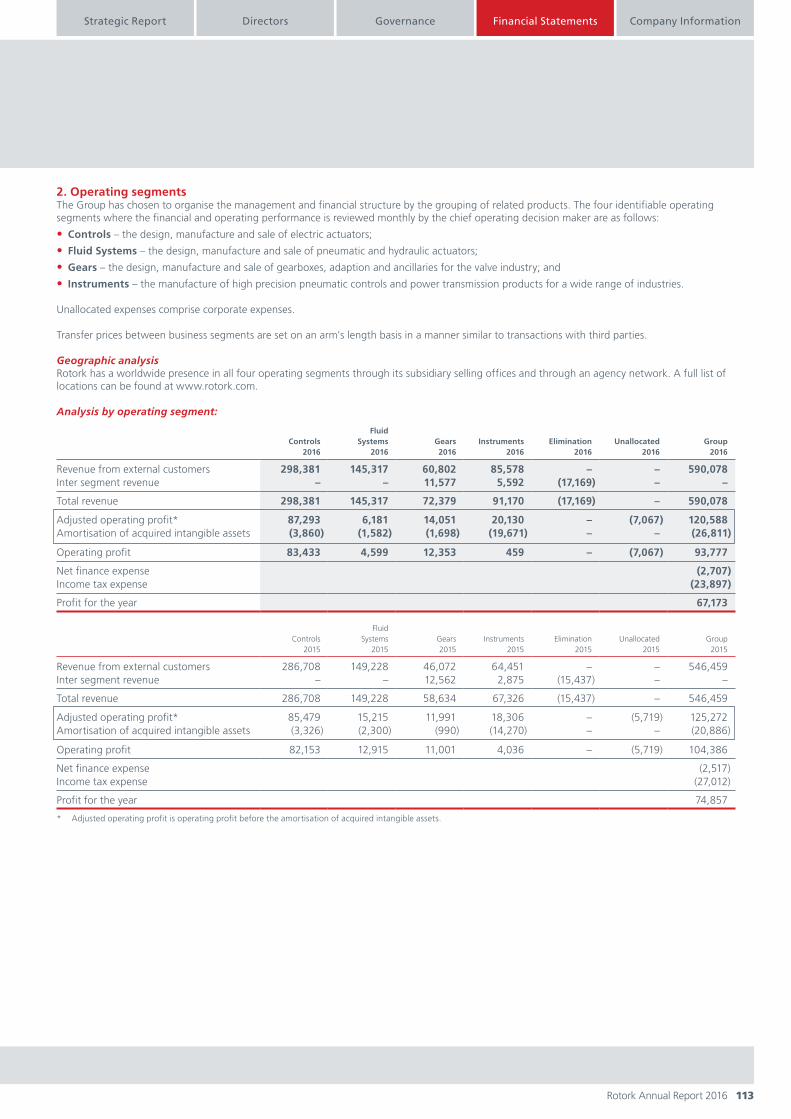
Company InformationDirectorsStrategic Report
113Rotork Annual Report 2016
Financial StatementsGovernance
2. Operating segmentsThe Group has chosen to organise the management and financial structure by the grouping of related products. The four identifiable operating segments where the financial and operating performance is reviewed monthly by the chief operating decision maker are as follows:
• Controls – the design, manufacture and sale of electric actuators;
• Fluid Systems – the design, manufacture and sale of pneumatic and hydraulic actuators;
• Gears – the design, manufacture and sale of gearboxes, adaption and ancillaries for the valve industry; and
• Instruments – the manufacture of high precision pneumatic controls and power transmission products for a wide range of industries.
Unallocated expenses comprise corporate expenses.
Transfer prices between business segments are set on an arm's length basis in a manner similar to transactions with third parties.
Geographic analysisRotork has a worldwide presence in all four operating segments through its subsidiary selling offices and through an agency network. A full list of locations can be found at www.rotork.com.
Analysis by operating segment:
Controls2016
FluidSystems
2016Gears2016
Instruments2016
Elimination2016
Unallocated2016
Group2016
Revenue from external customers 298,381 145,317 60,802 85,578 – – 590,078Inter segment revenue – – 11,577 5,592 (17,169) – –
Total revenue 298,381 145,317 72,379 91,170 (17,169) – 590,078
Adjusted operating profit* 87,293 6,181 14,051 20,130 – (7,067) 120,588Amortisation of acquired intangible assets (3,860) (1,582) (1,698) (19,671) – – (26,811)
Operating profit 83,433 4,599 12,353 459 – (7,067) 93,777
Net finance expense (2,707)Income tax expense (23,897)
Profit for the year 67,173
Controls2015
FluidSystems
2015Gears2015
Instruments2015
Elimination2015
Unallocated2015
Group2015
Revenue from external customers 286,708 149,228 46,072 64,451 – – 546,459Inter segment revenue – – 12,562 2,875 (15,437) – –
Total revenue 286,708 149,228 58,634 67,326 (15,437) – 546,459
Adjusted operating profit* 85,479 15,215 11,991 18,306 – (5,719) 125,272Amortisation of acquired intangible assets (3,326) (2,300) (990) (14,270) – – (20,886)
Operating profit 82,153 12,915 11,001 4,036 – (5,719) 104,386
Net finance expense (2,517)Income tax expense (27,012)
Profit for the year 74,857
* Adjusted operating profit is operating profit before the amortisation of acquired intangible assets.

Rotork Annual Report 2016114
2. Operating segments continued
Controls2016
FluidSystems
2016Gears2016
Instruments2016
Unallocated2016
Group2016
Depreciation 5,429 2,571 1,546 2,170 43 11,759Amortisation:– Acquired intangible assets 3,860 1,582 1,698 19,671 – 26,811– Development costs 1,628 211 281 106 – 2,226Non-cash items: equity settled share-based payments 1,709 680 480 473 417 3,759Net financing expense – – – – (2,707) (2,707)Acquired as part of business combinations:– Goodwill – – 5,317 – – 5,317– Intangible assets – – 6,816 – – 6,816Capital expenditure 6,975 4,575 1,741 1,357 13 14,661
Controls2015
FluidSystems
2015Gears2015
Instruments2015
Unallocated2015
Group2015
Depreciation 4,585 2,560 1,194 1,369 51 9,759Amortisation:– Acquired intangible assets 3,326 2,300 990 14,270 – 20,886– Development costs 1,514 148 67 85 – 1,814Non-cash items: equity settled share-based payments 1,911 549 351 103 (104) 2,810Net financing expense – – – – (2,517) (2,517)Acquired as part of business combinations:– Goodwill 1,321 – 3,933 69,206 – 74,460– Intangible assets 3,048 – 4,951 58,685 – 66,684Capital expenditure 5,093 4,970 811 818 46 11,738
Balance sheets are reviewed by subsidiary and operating segment balance sheets are not prepared, as such no further analysis of operating segments assets and liabilities is presented.
Geographical analysis:
Revenue by location of subsidiary 2016 2015
UK 74,144 64,415Italy 63,040 57,254Rest of Europe 112,759 92,908USA 145,473 137,898Other Americas 27,365 30,698Rest of the World 167,297 163,286
590,078 546,459
UK2016
Europe2016
USA2016
OtherAmericas
2016
Rest ofWorld
2016Group
2016
Non-current assets:– Goodwill 81,329 64,984 62,730 740 41,624 251,407– Intangible assets 52,138 17,595 20,674 – 18,612 109,019– Property, plant and equipment 26,099 29,812 10,348 527 16,980 83,766
UK2015
Europe2015
USA2015
OtherAmericas
2015
Rest ofWorld2015
Group2015
Non-current assets:– Goodwill 81,328 53,645 48,817 740 37,556 222,086– Intangible assets 60,917 20,833 16,827 – 19,978 118,555– Property, plant and equipment 25,675 22,362 7,834 618 15,519 72,008
NOTES TO THE GROUP FINANCIAL STATEMENTS continuedFor the year ended 31 December 2016

Company InformationDirectorsStrategic Report
115Rotork Annual Report 2016
Financial StatementsGovernance
3. Acquisitionsi) MastergearOn 2 June 2016 the Group completed the acquisition of the Mastergear business based in the US and Italy for £16,278,000, which was paid in cash. Mastergear is a leading manufacturer of manual and motorised gearboxes focused on the oil and gas, water and distribution, chemical processing and wider industrial markets. The Mastergear business is reported within the Gears division. In the seven months to 31 December 2016 Mastergear contributed £7,761,000 to Group revenue and £990,000 to consolidated operating profit before amortisation. The amortisation charge in the seven month period from the acquired intangible assets was £897,000.
If the acquisition had occurred on 1 January 2016 the business would have contributed £13,641,000 to Group revenue, £1,473,000 to Group operating profit and £944,000 to profit attributable to equity shareholders. The acquisition had the following effect on the Group's assets and liabilities.
Book value AdjustmentsProvisional fair
value
Non-current assetsProperty, plant and equipment 1,393 – 1,393Intangible assets – 6,816 6,816Deferred tax asset – 530 530Current assets Inventory 3,326 (1,601) 1,725Trade and other receivablesCorporation tax
2,801377
(160)–
2,641377
Cash 169 – 169Current liabilitiesTrade and other payables (1,662) (127) (1,789)Employee benefits (805) – (805)Warranty provision – (96) (96)
Total net assets 5,599 5,362 10,961Goodwill 5,317
Purchase consideration – paid in cash 16,278Cash held in acquired subsidiary (169)
Net cash outflow arising on acquisition 16,109
The adjustments shown in the table represent the alignment of accounting policies of the acquired business to Rotork Group policies and the fair value adjustments of the assets and liabilities at the acquisition date.
Due to their contractual dates, the fair value of receivables (shown above) approximate to the gross contractual amounts receivable. The amount of gross contractual receivables not expected to be recovered is immaterial.
The goodwill arising from this acquisition represents the opportunity to grow by exploiting new routes to market via the Rotork sales network and the technical expertise of the acquired workforce. Goodwill of £5,012,000 in respect of the asset purchase is deductible for income tax purposes.
The intangible assets identified comprise customer relationships, brands, intellectual property, product design patents and acquired order books.
ii) Acquisition costsAcquisition costs of £84,000 have been expensed in administration expenses in the income statement (2015: £1,321,000).

Rotork Annual Report 2016116
4. Other income
2016 2015
Gain on disposal of property, plant and equipment 462 325Other 167 102
629 427
5. Other expenses
2016 2015
Loss on disposal of property, plant and equipment 208 45Other 9 21
217 66
6. Personnel expenses
2016 2015
Wages and salaries (including bonus and incentive plans) 136,557 114,806Social security costs 18,032 14,596Pension costs (note 24) 7,799 7,056Share-based payments (note 25) 3,759 2,810Increase/(decrease) in liability for long-term service leave 49 (132)
166,196 139,136
2016Number
2015Number
During the year, the average monthly number of employees, analysed by business segment was:Controls 1,781 1,787Fluid Systems 860 865Gears 414 365Instruments 664 390
3,719 3,407
UK 1,028 847Overseas 2,691 2,560
3,719 3,407
NOTES TO THE GROUP FINANCIAL STATEMENTS continuedFor the year ended 31 December 2016

Company InformationDirectorsStrategic Report
117Rotork Annual Report 2016
Financial StatementsGovernance
7. Finance income and expenseRecognised in the income statement
2016 2015
Interest income 934 1,119Foreign exchange gains 810 621
Finance income 1,744 1,740
2016 2015
Interest expense (2,970) (1,811)Interest charge on pension scheme liabilities (note 24) (767) (1,181)Foreign exchange losses (714) (1,265)
Finance expense (4,451) (4,257)
Recognised in equity
2016 2015
Effective portion of changes in fair value of cash flow hedges (8,772) (1,123)Fair value of cash flow hedges transferred to income statement 950 (667) Foreign currency translation differences for foreign operations 36,854 (6,511)
29,032 (8,301)
Recognised in:Hedging reserve (7,822) (1,790)Translation reserve 36,854 (6,511)
29,032 (8,301)

Rotork Annual Report 2016118
8. Profit before taxProfit before tax is stated after charging the following:
Notes 2016 2015
Depreciation of property, plant and equipment:– Owned assets i 11,700 9,714– Assets held under finance lease contracts i 59 45Amortisation:– Other intangibles i 26,811 20,886– Development costs i 2,226 1,814Inventory write downs recognised in the year ii 6,632 3,547Hire of plant and machinery i 1,986 2,264Other operating lease rentals i 3,969 4,033Research and development expenditure iii 7,245 6,588Exchange differences realised iv (96) 644
Audit fees and expenses paid to Deloitte:– Audit of the Group financial statements 800 953– Audit of financial statements of subsidiaries of the Company 158 90
958 1,043Other auditors of financial statements of subsidiaries of the Company 34 7
Total audit fees and expenses 992 1,050
Amounts paid to Deloitte and its associates in respect of:– Taxation compliance services 12 19– Taxation advisory services 23 10– Half year review 42 40– Corporate finance services – –– Other assurance services 6 24
83 93
These costs can be found under the following headings in the income statement:i) Both within cost of sales and administrative expenses;ii) Within cost of sales;iii) Within administrative expenses; andiv) Within finance income and expenses.
NOTES TO THE GROUP FINANCIAL STATEMENTS continuedFor the year ended 31 December 2016
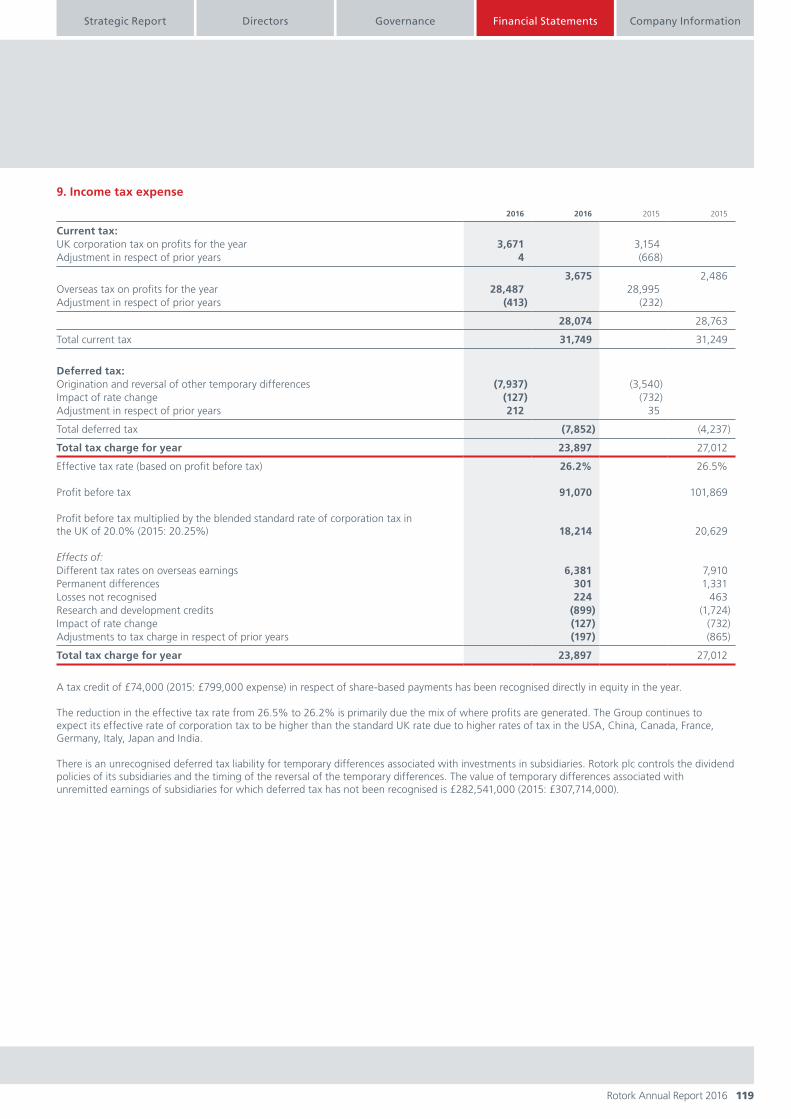
Company InformationDirectorsStrategic Report
119Rotork Annual Report 2016
Financial StatementsGovernance
9. Income tax expense
2016 2016 2015 2015
Current tax:UK corporation tax on profits for the year 3,671 3,154Adjustment in respect of prior years 4 (668)
3,675 2,486Overseas tax on profits for the year 28,487 28,995Adjustment in respect of prior years (413) (232)
28,074 28,763
Total current tax 31,749 31,249
Deferred tax:Origination and reversal of other temporary differences (7,937) (3,540)Impact of rate change (127) (732)Adjustment in respect of prior years 212 35
Total deferred tax (7,852) (4,237)
Total tax charge for year 23,897 27,012
Effective tax rate (based on profit before tax) 26.2% 26.5%
Profit before tax 91,070 101,869
Profit before tax multiplied by the blended standard rate of corporation tax inthe UK of 20.0% (2015: 20.25%) 18,214 20,629
Effects of:Different tax rates on overseas earnings 6,381 7,910Permanent differences 301 1,331Losses not recognised 224 463Research and development credits (899) (1,724)Impact of rate change (127) (732)Adjustments to tax charge in respect of prior years (197) (865)
Total tax charge for year 23,897 27,012
A tax credit of £74,000 (2015: £799,000 expense) in respect of share-based payments has been recognised directly in equity in the year.
The reduction in the effective tax rate from 26.5% to 26.2% is primarily due the mix of where profits are generated. The Group continues to expect its effective rate of corporation tax to be higher than the standard UK rate due to higher rates of tax in the USA, China, Canada, France, Germany, Italy, Japan and India.
There is an unrecognised deferred tax liability for temporary differences associated with investments in subsidiaries. Rotork plc controls the dividend policies of its subsidiaries and the timing of the reversal of the temporary differences. The value of temporary differences associated with unremitted earnings of subsidiaries for which deferred tax has not been recognised is £282,541,000 (2015: £307,714,000).

Rotork Annual Report 2016120
10. Goodwill
2016 2015
CostAt 1 January 222,086 149,679Acquisition through business combinations (note 3)Other movements
5,317–
74,460(743)
Exchange adjustments 24,004 (1,310)
At 31 December 251,407 222,086Provision for impairmentAt 1 January and 31 December – –
Carrying amounts 251,407 222,086
Cash-generating unitsGoodwill acquired through business combinations has been allocated to the lowest level of cash-generating unit (CGU) and to the division in which it is reported. Where the acquired entity's growth into new markets is through the Group's existing sales network and/or where manufacturing of certain products is transferred to other businesses within a division the lowest level of CGU is considered to be at a divisional sub-group level.
Cash-generating unit 2016 2015
ControlsSchischek 19,498 16,835Other cash-generating units 11,515 10,723
31,013 27,558Fluid SystemsRotork Fluid Systems 7,792 6,728Rotork Sweden 6,440 5,818Other cash-generating units 16,498 13,717
30,730 26,263GearsOther cash-generating units 20,759 12,963
20,759 12,963InstrumentsBifold 67,221 67,221Instruments sub-group 101,684 86,016Other cash-generating units – 2,065
168,905 155,302
Total Group 251,407 222,086
Impairment testingGoodwill is not amortised but is tested annually for impairment.
The key assumptions in the annual impairment review which are common to all CGUs are set out below:
i) Discount ratesThe discount rates used in the impairment review are pre-tax nominal weighted average cost of capital (WACC) for each of the CGUs. The WACC is the weighted average of the pre-tax cost of debt financing and the pre-tax cost of equity finance. The discount rates used in the impairment test ranged from 12.4% to 14.9% (2015: 12.5% to 16.7%). The discount rates of the significant CGU's, which represent more than 10% of the total goodwill balance, are 12.6% for the instruments sub-group (2015: 12.5%) and 12.4% for Bifold (2015: 12.5%).
NOTES TO THE GROUP FINANCIAL STATEMENTS continuedFor the year ended 31 December 2016

Company InformationDirectorsStrategic Report
121Rotork Annual Report 2016
Financial StatementsGovernance
ii) Growth ratesValue in use calculations are used to determine the recoverable amount of goodwill allocated to each of the CGUs. These calculations use cash flow projections from management forecasts which are based on the budget and the three year plan. The three year plan is a bottom up process which takes place as part of the annual budget process. Once the budget for the next financial year is finalised, years two and three of the three year plan are prepared by each reporting entity's management reflecting their view of the local market, known projects and experience of past performance. The forecast compound annual growth rate for the instruments sub-group for years one to three is 11.2%. For Bifold the forecast compound annual growth rate for revenue is 23.7% which generates annual growth of 50.9% in operating profit. The Bifold growth reflects the significant opportunities in the market following recent product development, growth in the underlying markets Bifold serves and expansion of sales opportunities through the Rotork network. The Group annual budget and the three year plan are reviewed and approved by the Board each year.
In the period after the three year plan growth rates are forecast at 5% per annum for the next two years and at 2% for the long-term growth rate. The 5% rate reflects a realistic market forecast for the flow control market up until 2021. The continued need for our customers to improve their infrastructure by automating valves gives confidence that the growth rate of our market will exceed the long-term growth rate of 2% used in the impairment calculations.
Sensitivity analysisSensitivity analysis has been undertaken for each CGU to assess the impact of any reasonably possible change in assumptions. Using the key assumptions above and applying sensitivities to these assumptions below, Bifold would be the first CGU to trigger a potential impairment. Apart from this there is no reasonably possible change that would cause the carrying amount of any other CGU goodwill to exceed the recoverable amount.
Bifold downside sensitivities have been assessed. A reduction in the long-term growth rate from 2% to 1% would result in a reduction of the headroom from £21,500,000 in the base case to £10,300,000. An increase in the discount rate by 1% would result in a reduction of the headroom from £21,500,000 to £6,800,000. A decrease in the forecast operating profit growth rate by 9 percentage points in each of years one, two and three would reduce the headroom to zero and this is considered to be a reasonably possible change. It is anticipated that with forecast underlying market growth, sales channel expansion and new product sales growth, the growth rates will exceed the long-term growth rate of 2% used in the impairment review but this has not been taken in either the base case or the sensitised scenarios.
11. Intangible assets
Research &development
costs
Acquired intangible assets
TotalBrandsCustomer
relationships Other
Cost 1 January 2015 14,084 34,353 61,097 12,428 121,962Acquisition through business combinations – 11,004 45,414 10,266 66,684Internally developed 3,050 – – – 3,050Exchange adjustments 13 (25) (364) (134) (510)
31 December 2015 17,147 45,332 106,147 22,560 191,186Acquisition through business combinations – 1,644 4,674 498 6,816Internally developed 2,958 – – – 2,958Exchange adjustments 290 6,130 11,296 2,357 20,073
31 December 2016 20,395 53,106 122,117 25,415 221,033
Amortisation 1 January 2015 7,526 11,875 23,154 7,137 49,692Charge for the year 1,814 4,974 12,014 3,898 22,700Exchange adjustments 1 196 74 (32) 239
31 December 2015 9,341 17,045 35,242 11,003 72,631Charge for the year 2,226 5,788 17,631 3,392 29,037Exchange adjustments 72 3,105 5,713 1,456 10,346
31 December 2016 11,639 25,938 58,586 15,851 112,014
Net Book Value 31 December 2015 7,806 28,287 70,905 11,557 118,555
31 December 2016 8,756 27,168 63,531 9,564 109,019
Other acquired intangible assets represent order books and intellectual property.
The amortisation charge is recognised within administrative expenses in the income statement.

Rotork Annual Report 2016122
12. Property, plant and equipment
Land andbuildings
Plant andequipment Total
Cost1 January 2015 44,877 70,786 115,663Additions 2,292 9,446 11,738Disposals (1,332) (1,174) (2,506)Acquisition through business combinations 5,597 2,410 8,007Exchange adjustments (602) (874) (1,476)
31 December 2015 50,832 80,594 131,426Additions 4,511 10,150 14,661Disposals (101) (2,288) (2,389)Acquisition through business combinations – 1,393 1,393Exchange adjustments 6,410 10,824 17,234
31 December 2016 61,652 100,673 162,325
Depreciation1 January 2015 9,277 42,336 51,613Charge for the year 1,324 8,435 9,759Disposals (320) (933) (1,253)Exchange adjustments (117) (584) (701)
31 December 2015 10,164 49,254 59,418Charge for the year 1,892 9,867 11,759Disposals (76) (1,953) (2,029)Exchange adjustments 1,504 7,907 9,411
31 December 2016 13,484 65,075 78,559
Net Book Value31 December 2015 40,668 31,340 72,008
31 December 2016 48,168 35,598 83,766
The net book value of the Group's plant and equipment includes £410,000 (2015: £325,000) in respect of assets held under finance leases.
Net book value of land and buildings can be analysed between:
2016 2015
Land 7,107 6,310Buildings 41,061 34,358
Net book value at 31 December 48,168 40,668
It is the Group's policy to test assets for impairment whenever events or changes in circumstances indicate that their carrying amounts may not be recoverable. No impairment was identified in the year.
NOTES TO THE GROUP FINANCIAL STATEMENTS continuedFor the year ended 31 December 2016

Company InformationDirectorsStrategic Report
123Rotork Annual Report 2016
Financial StatementsGovernance
13. Deferred tax assets and liabilities
Assets
2016Liabilities
2016Net
2016Assets
2015Liabilities
2015Net
2015
Property, plant and equipment 435 (985) (550) 111 (1,645) (1,534)Intangible assets 74 (23,829) (23,755) 307 (27,086) (26,779)Employee benefits 13,952 (48) 13,904 6,876 (461) 6,415Inventory 7,712 – 7,712 4,885 – 4,885Other items 6,211 (3,111) 3,100 4,607 (2,869) 1,738
Net tax assets/(liabilities) 28,384 (27,973) 411 16,786 (32,061) (15,275)Set off of tax (3,125) 3,125 – (3,088) 3,088 –
25,259 (24,848) 411 13,698 (28,973) (15,275)
Movements in the net deferred tax balance during the year are as follows:
2016 2015
Balance at 1 January (15,275) (4,655)Credited to the income statement 7,852 4,237Credited/(charged) directly to equity in respect of share-based payments 74 (139)Acquired as part of business combinations 530 (13,895)Credited/(charged) directly to equity in respect of pension schemes 7,191 (1,655)Credited directly to hedging reserves in respect of cash flow hedges 1,408 342Exchange differences (1,369) 490
Balance at 31 December 411 (15,275)
A deferred tax asset of £25,259,000 (2015: £13,698,000) has been recognised at 31 December 2016. The directors are of the opinion, based on recent and forecast trading, that the level of profits in the current and future years make it more likely than not that these assets will be recovered.
A deferred tax asset of £1,302,000 (2015: £1,302,000) has not been recognised in relation to capital losses. This asset may be recovered if sufficient capital profits are made in future in the companies concerned. There is no expiry date in relation to this asset.
14. Inventories
2016 2015
Raw materials and consumables 59,398 60,604Work in progress 10,211 8,890Finished goods 16,163 17,716
85,772 87,210
Included in cost of sales was £204,729,000 (2015: £196,826,000) in respect of inventories consumed in the year.

Rotork Annual Report 2016124
15. Trade and other receivables
2016 2015
Non-current assets: Other non-trade receivables 146 2,234
Other receivables 146 2,234
Current assets:Trade receivables 139,108 124,285Less provision for impairment of receivables (7,217) (5,484)
Trade receivables – net 131,891 118,801
Corporation tax 4,349 4,458
Current tax 4,349 4,458
Other non-trade receivables 7,600 2,025Other taxes and social security 7,333 6,002Prepayments 7,408 5,198
Other receivables 22,341 13,225
Included with non-trade receivables is £2,334,000 (2015: £nil) which relate to collateral held by a third party in respect of the Group's outstanding forward exchange contracts.
16. Cash and cash equivalents
2016 2015
Bank balances 50,110 35,013Cash in hand 65 63Short-term deposits 11,248 13,892
Cash and cash equivalents 61,423 48,968Bank overdraft – –
Cash and cash equivalents in the consolidated statement of cash flows 61,423 48,968
NOTES TO THE GROUP FINANCIAL STATEMENTS continuedFor the year ended 31 December 2016

Company InformationDirectorsStrategic Report
125Rotork Annual Report 2016
Financial StatementsGovernance
17. Capital and reserves
0.5p ordinarysharesissued
and fullypaid up
2016
£1 non-redeemablepreference
shares2016
0.5p ordinarysharesissued
and fullypaid up
2015
£1 non-redeemablepreference
shares2015
At 1 January 4,349 40 4,346 40Issued under employee share schemes 1 – 3 –
At 31 December 4,350 40 4,349 40
Number of shares (000) 870,051 869,738
The ordinary shareholders are entitled to receive dividends as declared and are entitled to vote at meetings of the Company.
The Group received proceeds of £465,000 (2015: £599,000) in respect of the 312,540 (2015: 458,990) ordinary shares issued during the year: £1,000 (2015: £3,000) was credited to share capital and £464,000 (2015: £596,000) to share premium. Further details of the share awards are shown in note 25.
The preference shareholders take priority over the ordinary shareholders when there is a distribution upon winding up the Company or on a reduction of equity involving a return of capital. The holders of preference shares are entitled to vote at a general meeting of the Company if a preference dividend is in arrears for six months or the business of the meeting includes the consideration of a resolution for winding up the Company or the alteration of the preference shareholders' rights.
Within the retained earnings reserve are own shares held. The investment in own shares held is £2,738,000 (2015: £3,920,000) and represents 963,000 (2015: 1,406,000) ordinary shares of the Company held in trust for the benefit of directors and employees for future payments under the share incentive plan and long term incentive plan. The dividends on these shares have been waived.
Translation reserveThe translation reserve comprises all foreign exchange differences arising from the translation of the financial statements of foreign operations.
Capital redemption reserveThe capital redemption reserve arises when the Company redeems shares wholly out of distributable profits.
Hedging reserveThe hedging reserve comprises the effective portion of the cumulative net change in the fair value of cash flow hedging instruments that are determined to be an effective hedge.
DividendsThe following dividends were paid in the year per qualifying ordinary share:
2016payment date 2016 2015
3.10p final dividend (2015: 3.09p) 16 May 26,933 26,8351.95p interim dividend (2015: 1.95p) 23 September 16,943 16,930
43,876 43,765
After the balance sheet date the following dividends per qualifying ordinary share were proposed by the directors. The dividends have not been provided for and there are no corporation tax consequences.
2016 2015
Final proposed dividend per qualifying ordinary share 3.15p 27,407
3.10p 26,962
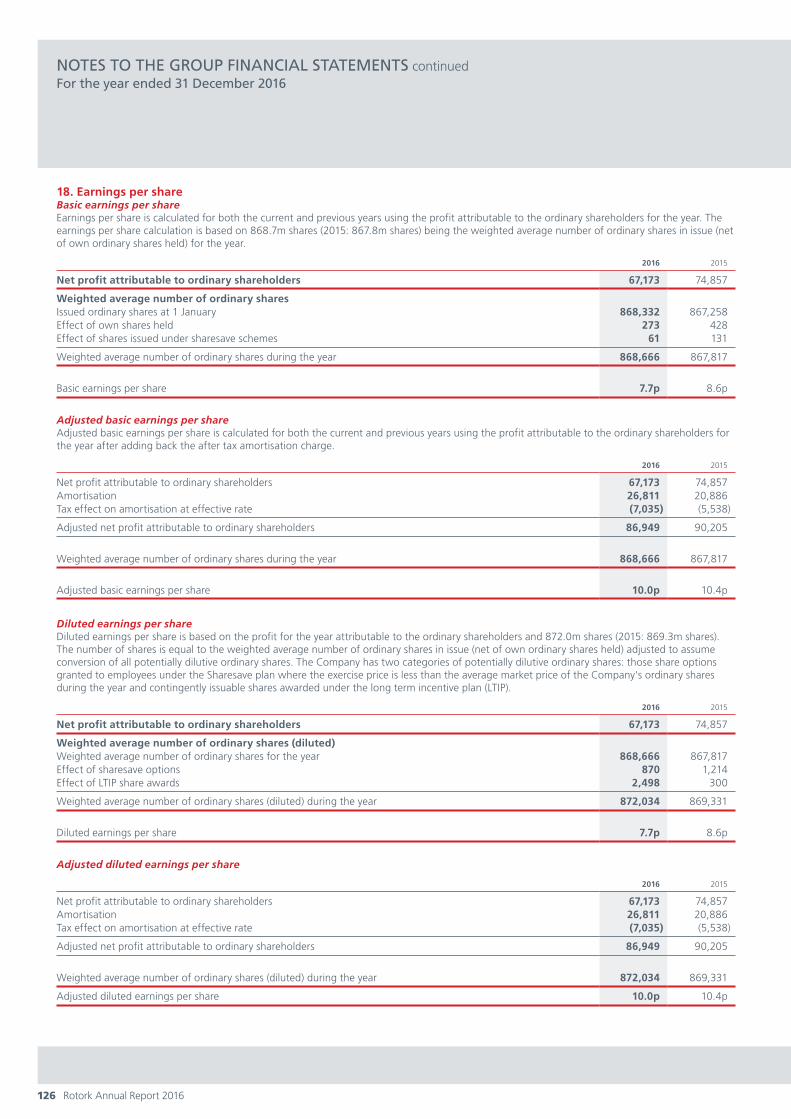
Rotork Annual Report 2016126
18. Earnings per shareBasic earnings per shareEarnings per share is calculated for both the current and previous years using the profit attributable to the ordinary shareholders for the year. The earnings per share calculation is based on 868.7m shares (2015: 867.8m shares) being the weighted average number of ordinary shares in issue (net of own ordinary shares held) for the year.
2016 2015
Net profit attributable to ordinary shareholders 67,173 74,857
Weighted average number of ordinary sharesIssued ordinary shares at 1 January 868,332 867,258Effect of own shares held 273 428Effect of shares issued under sharesave schemes 61 131
Weighted average number of ordinary shares during the year 868,666 867,817
Basic earnings per share 7.7p 8.6p
Adjusted basic earnings per shareAdjusted basic earnings per share is calculated for both the current and previous years using the profit attributable to the ordinary shareholders for the year after adding back the after tax amortisation charge.
2016 2015
Net profit attributable to ordinary shareholders 67,173 74,857Amortisation 26,811 20,886Tax effect on amortisation at effective rate (7,035) (5,538)
Adjusted net profit attributable to ordinary shareholders 86,949 90,205
Weighted average number of ordinary shares during the year 868,666 867,817
Adjusted basic earnings per share 10.0p 10.4p
Diluted earnings per shareDiluted earnings per share is based on the profit for the year attributable to the ordinary shareholders and 872.0m shares (2015: 869.3m shares). The number of shares is equal to the weighted average number of ordinary shares in issue (net of own ordinary shares held) adjusted to assume conversion of all potentially dilutive ordinary shares. The Company has two categories of potentially dilutive ordinary shares: those share options granted to employees under the Sharesave plan where the exercise price is less than the average market price of the Company's ordinary shares during the year and contingently issuable shares awarded under the long term incentive plan (LTIP).
2016 2015
Net profit attributable to ordinary shareholders 67,173 74,857
Weighted average number of ordinary shares (diluted) Weighted average number of ordinary shares for the year 868,666 867,817Effect of sharesave options 870 1,214Effect of LTIP share awards 2,498 300
Weighted average number of ordinary shares (diluted) during the year 872,034 869,331
Diluted earnings per share 7.7p 8.6p
Adjusted diluted earnings per share
2016 2015
Net profit attributable to ordinary shareholders 67,173 74,857Amortisation 26,811 20,886Tax effect on amortisation at effective rate (7,035) (5,538)
Adjusted net profit attributable to ordinary shareholders 86,949 90,205
Weighted average number of ordinary shares (diluted) during the year 872,034 869,331
Adjusted diluted earnings per share 10.0p 10.4p
NOTES TO THE GROUP FINANCIAL STATEMENTS continuedFor the year ended 31 December 2016

Company InformationDirectorsStrategic Report
127Rotork Annual Report 2016
Financial StatementsGovernance
19. Interest bearing loans and borrowingsThis note provides information about the contractual terms of the Group's interest bearing loans and borrowings. For more information about the Group's exposure to interest rate, liquidity and currency risks, see note 26.
2016 2015
Non-current liabilities Preference shares classified as debt 40 40Bank loans 51,260 69,645Finance lease liabilities 3 71
51,303 69,756
Current liabilities Bank loans 65,039 50,098Finance lease liabilities 69 254
65,108 50,352
Terms and debt repayment scheduleThe terms and conditions of outstanding loans were as follows:
Currency Interest rates Year of maturity 2016 2015
Non-redeemable preference shares Sterling 9.5% – 40 40Bank loans and overdrafts Sterling 0.6%-1.1% 2018-20 115,180 118,560Bank loans and overdrafts Euro 1.4%-4.5% 2017-32 1,119 1,183Finance lease liabilities Sterling 1.9%-10.6% 2017-19 72 325
116,411 120,108
Repayment profileFinance leases and bank loans are payable as follows:
Principal
2016Interest
2016
Minimum payments
2016Principal
2015Interest
2015
Minimum payments
2015
Bank loans less than one year 65,039 310 65,349 50,098 386 50,484Bank loans more than one and less than five years 50,565 81 50,646 68,987 73 69,060Bank loans more than five years 695 101 796 658 99 757Finance leases less than one year 69 2 71 254 7 261Finance leases more than one and less than five years 3 0 3 71 2 73
116,371 494 116,865 120,068 567 120,635

Rotork Annual Report 2016128
20. Employee benefits
2016 2015
Recognised liability for defined benefit obligations: – Present value of funded obligations 236,543 180,406– Fair value of plan assets (178,045) (157,131)
58,498 23,275Other pension scheme liabilities 356 239Employee bonuses 10,824 8,601 Long term incentive plan 216 80Employee indemnity provision 3,359 2,495Other employee benefits 3,596 2,748
76,849 37,438
Non-current 62,593 26,320Current 14,256 11,118
76,849 37,438
Defined benefit pension scheme disclosures are detailed in note 24.
21. Provisions
Contingent
considerationWarrantyprovision Total
Balance at 1 January 2016 11,775 5,528 17,303Exchange differences 190 713 903Increase as a result of business combinations – 96 96Provisions utilised during the year (257) (1,707) (1,964)Charged to the income statement – 1,212 1,212
Balance at 31 December 2016 11,708 5,842 17,550
Maturity at 31 December 2016 Non-current 10,000 1,947 11,947Current 1,708 3,895 5,603
11,708 5,842 17,550
Maturity at 31 December 2015 Non-current 10,147 1,843 11,990Current 1,628 3,685 5,313
11,775 5,528 17,303
The warranty provision is based on estimates made from historical warranty data associated with similar products and services. The provision relates mainly to products sold during the last 12 months and the typical warranty period is 18 months.
Contingent consideration relating to the Bifold acquisition is £10,500,000. £10,000,000 will become payable in 2018 if an EBITDA target is achieved in respect of the 2017 financial year. Other contingent consideration relates to amounts outstanding in respect of the GTA Group, Masso and Servo Moteurs Service acquisitions.
NOTES TO THE GROUP FINANCIAL STATEMENTS continuedFor the year ended 31 December 2016

Company InformationDirectorsStrategic Report
129Rotork Annual Report 2016
Financial StatementsGovernance
22. Trade and other payables
2016 2015
Trade payables 39,652 36,724
Corporation tax 13,352 14,276
Current tax 13,352 14,276
Other taxes and social security 10,806 8,592Payments on account 7,053 6,674Other payables and accrued expenses 24,140 19,346
Other payables 41,999 34,612
23. Derivative financial instruments
2016
Assets2016
Liabilities2015
Assets2015
Liabilities
Forward foreign exchange contracts – cash flow hedges – 8,945 25 975Foreign exchange swaps – cash flow hedges – 1,681 – 3,057
Total – 10,626 25 4,032
Less non-current portion:Forward foreign exchange contracts – cash flow hedges – 2,483 – 431
Current portion – 8,143 25 3,601
The full fair value of a hedging derivative is classified as a non-current asset or liability if the remaining maturity of the hedged item is more than 12 months and, as a current asset or liability, if the maturity of the hedged item is less than 12 months.
There was no ineffectiveness to be recorded from the use of foreign exchange contracts.
The hedged forecast transactions denominated in foreign currency are expected to occur at various dates. Gains and losses in respect of these derivatives recognised in the hedging reserve in equity at 31 December 2016 are recognised in the income statement in the period or periods during which the hedged forecast transaction affects the income statement.
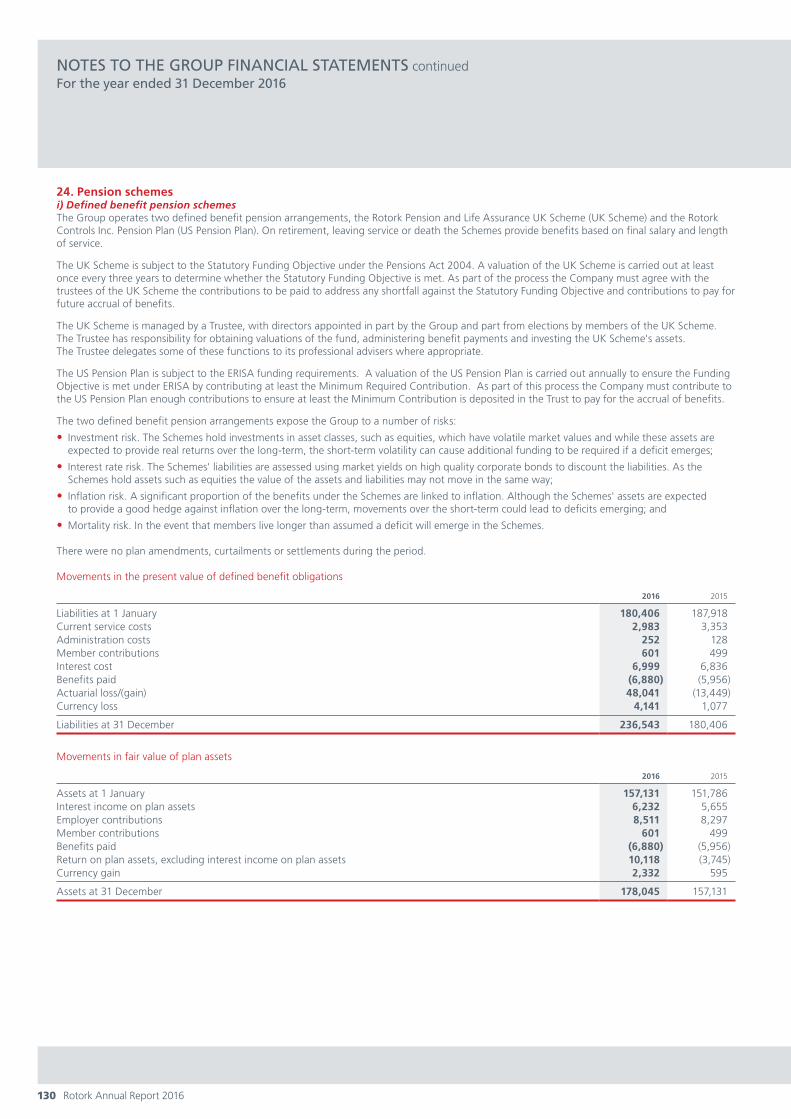
Rotork Annual Report 2016130
24. Pension schemesi) Defined benefit pension schemesThe Group operates two defined benefit pension arrangements, the Rotork Pension and Life Assurance UK Scheme (UK Scheme) and the Rotork Controls Inc. Pension Plan (US Pension Plan). On retirement, leaving service or death the Schemes provide benefits based on final salary and length of service.
The UK Scheme is subject to the Statutory Funding Objective under the Pensions Act 2004. A valuation of the UK Scheme is carried out at least once every three years to determine whether the Statutory Funding Objective is met. As part of the process the Company must agree with the trustees of the UK Scheme the contributions to be paid to address any shortfall against the Statutory Funding Objective and contributions to pay for future accrual of benefits.
The UK Scheme is managed by a Trustee, with directors appointed in part by the Group and part from elections by members of the UK Scheme. The Trustee has responsibility for obtaining valuations of the fund, administering benefit payments and investing the UK Scheme's assets. The Trustee delegates some of these functions to its professional advisers where appropriate.
The US Pension Plan is subject to the ERISA funding requirements. A valuation of the US Pension Plan is carried out annually to ensure the Funding Objective is met under ERISA by contributing at least the Minimum Required Contribution. As part of this process the Company must contribute to the US Pension Plan enough contributions to ensure at least the Minimum Contribution is deposited in the Trust to pay for the accrual of benefits.
The two defined benefit pension arrangements expose the Group to a number of risks:
• Investment risk. The Schemes hold investments in asset classes, such as equities, which have volatile market values and while these assets are expected to provide real returns over the long-term, the short-term volatility can cause additional funding to be required if a deficit emerges;
• Interest rate risk. The Schemes' liabilities are assessed using market yields on high quality corporate bonds to discount the liabilities. As the Schemes hold assets such as equities the value of the assets and liabilities may not move in the same way;
• Inflation risk. A significant proportion of the benefits under the Schemes are linked to inflation. Although the Schemes' assets are expected to provide a good hedge against inflation over the long-term, movements over the short-term could lead to deficits emerging; and
• Mortality risk. In the event that members live longer than assumed a deficit will emerge in the Schemes.
There were no plan amendments, curtailments or settlements during the period.
Movements in the present value of defined benefit obligations
2016 2015
Liabilities at 1 January 180,406 187,918Current service costs 2,983 3,353Administration costs 252 128Member contributions 601 499Interest cost 6,999 6,836Benefits paid (6,880) (5,956)Actuarial loss/(gain) 48,041 (13,449)Currency loss 4,141 1,077
Liabilities at 31 December 236,543 180,406
Movements in fair value of plan assets
2016 2015
Assets at 1 January 157,131 151,786Interest income on plan assets 6,232 5,655Employer contributions 8,511 8,297Member contributions 601 499Benefits paid (6,880) (5,956)Return on plan assets, excluding interest income on plan assets 10,118 (3,745)Currency gain 2,332 595
Assets at 31 December 178,045 157,131
NOTES TO THE GROUP FINANCIAL STATEMENTS continuedFor the year ended 31 December 2016
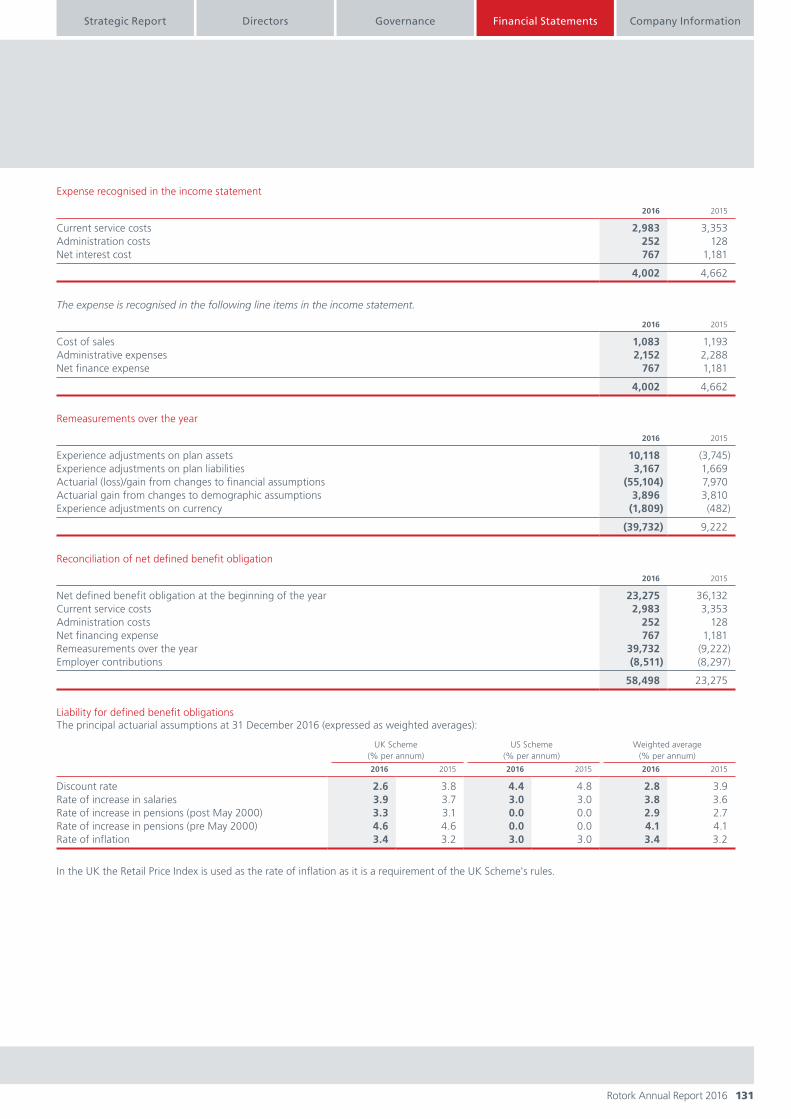
Company InformationDirectorsStrategic Report
131Rotork Annual Report 2016
Financial StatementsGovernance
Expense recognised in the income statement
2016 2015
Current service costs 2,983 3,353Administration costs 252 128Net interest cost 767 1,181
4,002 4,662
The expense is recognised in the following line items in the income statement.
2016 2015
Cost of sales 1,083 1,193Administrative expenses 2,152 2,288Net finance expense 767 1,181
4,002 4,662
Remeasurements over the year
2016 2015
Experience adjustments on plan assets 10,118 (3,745)Experience adjustments on plan liabilities 3,167 1,669Actuarial (loss)/gain from changes to financial assumptions (55,104) 7,970Actuarial gain from changes to demographic assumptions 3,896 3,810Experience adjustments on currency (1,809) (482)
(39,732) 9,222
Reconciliation of net defined benefit obligation
2016 2015
Net defined benefit obligation at the beginning of the year 23,275 36,132Current service costs 2,983 3,353Administration costs 252 128Net financing expense 767 1,181Remeasurements over the year 39,732 (9,222)Employer contributions (8,511) (8,297)
58,498 23,275
Liability for defined benefit obligationsThe principal actuarial assumptions at 31 December 2016 (expressed as weighted averages):
UK Scheme (% per annum)
US Scheme (% per annum)
Weighted average (% per annum)
2016 2015 2016 2015 2016 2015
Discount rate 2.6 3.8 4.4 4.8 2.8 3.9Rate of increase in salaries 3.9 3.7 3.0 3.0 3.8 3.6Rate of increase in pensions (post May 2000) 3.3 3.1 0.0 0.0 2.9 2.7Rate of increase in pensions (pre May 2000) 4.6 4.6 0.0 0.0 4.1 4.1Rate of inflation 3.4 3.2 3.0 3.0 3.4 3.2
In the UK the Retail Price Index is used as the rate of inflation as it is a requirement of the UK Scheme's rules.

Rotork Annual Report 2016132
24. Pension schemes continued The split of the Schemes' assets were as follows:
2016
Fair value2015
Fair value
Equities 83,099 75,550Bonds 70,805 60,111Property 9,534 9,687Cash 179 137US deposit administration contract 14,428 11,646
Total 178,045 157,131
Actual return on the Schemes' assets 16,350 1,910
The demographic assumptions are the same as used for the most recent valuations of the Schemes, except for mortality. The mortality assumptions used for the UK Scheme are the S2NXA year of birth tables (2015: S1NXA) with future improvements in mortality based on the CMI_2015 projections (2015: CMI_2015 projections) with a long-term rate of improvement of 1.25% per annum (2015: 1.25%).
By way of example the respective mortality tables indicate the following life expectancy:
Current age
2016 Life expectancy at age 65
2015 Life expectancy at age 65
Male Female Male Female
65 22.3 24.4 22.0 24.445 24.0 26.3 23.7 26.4
Sensitivity analysis on the Schemes' liabilities
Adjustments to assumptions
Approximate effect on liabilities
Discount ratePlus 0.5% p.a.Minus 0.5% p.a.
(24,000)26,800
InflationPlus 0.5% p.a.Minus 0.5% p.a.
12,600(11,900)
Salary increasePlus 0.5% p.a.Minus 0.5% p.a.
5,200(4,900)
Life expectancyDecrease mortality rates by a factor of 10%Increase mortality rates by a factor of 10%
7,000(6,400)
The above sensitivities are approximate and only show the likely effect of an assumption being adjusted whilst all other assumptions remain the same.
For the life expectancy sensitivity we have increased/decreased the mortality rates by a factor of 10%. Broadly speaking this decreases/increases the assumed life expectancy by slightly less than one year.
The sensitivity analysis shown above was determined using the same method as per the calculation of liabilities for the balance sheet disclosures, but using assumptions adjusted as detailed above.
Effect of the Schemes on the Group's future cash flowsThe Group is required to agree a Schedule of Contributions with the Trustees of the UK Scheme following a valuation which must be carried out at least once every three years. Following the valuation of the UK Scheme as at 31 March 2016, the Group is continuing to pay deficit contributions of £5,500,000 a year.
The Group estimates that cash contributions to the Group's defined benefit pension schemes during 2017 will be £3,590,000 for regular payments (2016: £3,000,000) and £5,500,000 of additional payments in relation to past service (2016: £5,500,000).
The weighted average duration of the defined benefit obligation is 22 years.
ii) Other pension plansThe Group makes a contribution to a number of defined contribution plans around the world to provide benefits for employees upon retirement. Total expense relating to these plans in the year was £4,816,000 (2015: £3,703,000).
NOTES TO THE GROUP FINANCIAL STATEMENTS continuedFor the year ended 31 December 2016

Company InformationDirectorsStrategic Report
133Rotork Annual Report 2016
Financial StatementsGovernance
25. Share-based paymentsThe Group awards shares under the long term incentive plan (LTIP), the Sharesave scheme, the overseas profit linked share plan (OPLSS) and the share incentive plan (SIP). The equity settled share-based payment expense included in the income statement for each of the plans can be analysed as follows:
2016 2015
Sharesave scheme (a) 592 1,093LTIP (b) 1,302 (445)OPLSS/SIP profit linked share scheme (c) 1,865 2,162
Total expense recognised as employee costs (note 6) 3,759 2,810
Volatility assumptions for equity-based paymentsThe expected volatility of all equity compensation benefits is based on the historic volatility (calculated based on the weighted average remaining life of each benefit), adjusted for any expected changes to future volatility due to publicly available information.
a) Sharesave schemeUK employees are invited to join the sharesave scheme when an offer is made each year. All the offers to date were made at a 20% discount to market price at the time. There are no performance criteria for the sharesave scheme. Employees are given the option of joining either the 3 year or the 5 year scheme.
3 year scheme 5 year scheme
2016 2015 2016 2015
Grant date 3 October 13 October 3 October 13 OctoberShare price at grant date 215p 180p 215p 180pExercise price 168p 148p 168p 148pShares granted under scheme 612,593 1,777,023 391,454 1,415,398Vesting period 3 years 3 years 5 years 5 yearsExpected volatility 29.4% 24.6% 27.7% 25.5%Risk free rate 0.09% 0.82% 0.25% 1.24%Expected dividends expressed as a dividend yield 2.4% 2.8% 2.4% 2.8%Probability of ceasing employment before vesting 2% 6% 2% 10%Fair value 56p 38p 57p 42p
Movements in the number of share options outstanding and their weighted average prices are as follows:
2016 2015
Averageoption price
per share Options
Average option price
per share Options
At 1 January 159p 4,367,367 192p 2,864,430Granted 168p 1,004,047 148p 3,192,421Exercised 149p (285,323) 122p (458,990)Forfeited 171p (544,176) 213p (1,230,494)
At 31 December 160p 4,541,915 159p 4,367,367
Of the 4,541,915 outstanding options (2015: 4,367,367), 132,000 are exercisable (2015: 169,000).
The Group received proceeds of £465,000 in respect of the 312,540 options exercised during the year: £1,000 was credited to share capital and £464,000 to share premium. The weighted average share price at date of exercise was 231p (2015: 201p).
The weighted average remaining life of 2,389,686 (2015: 2,137,864) awards outstanding under the 3 year plan is 2.1 years. The weighted average remaining life of 2,152,229 (2015: 2,229,503) awards outstanding under the 5 year plan is 3.6 years.
b) LTIPLTIP is a performance share plan under which shares are conditionally allocated to selected members of senior management at the discretion of the Remuneration Committee on an annual basis. Following shareholder approval of the LTIP at the Company's AGM on 18 May 2000, awards over shares are made to executive directors and senior managers each year.
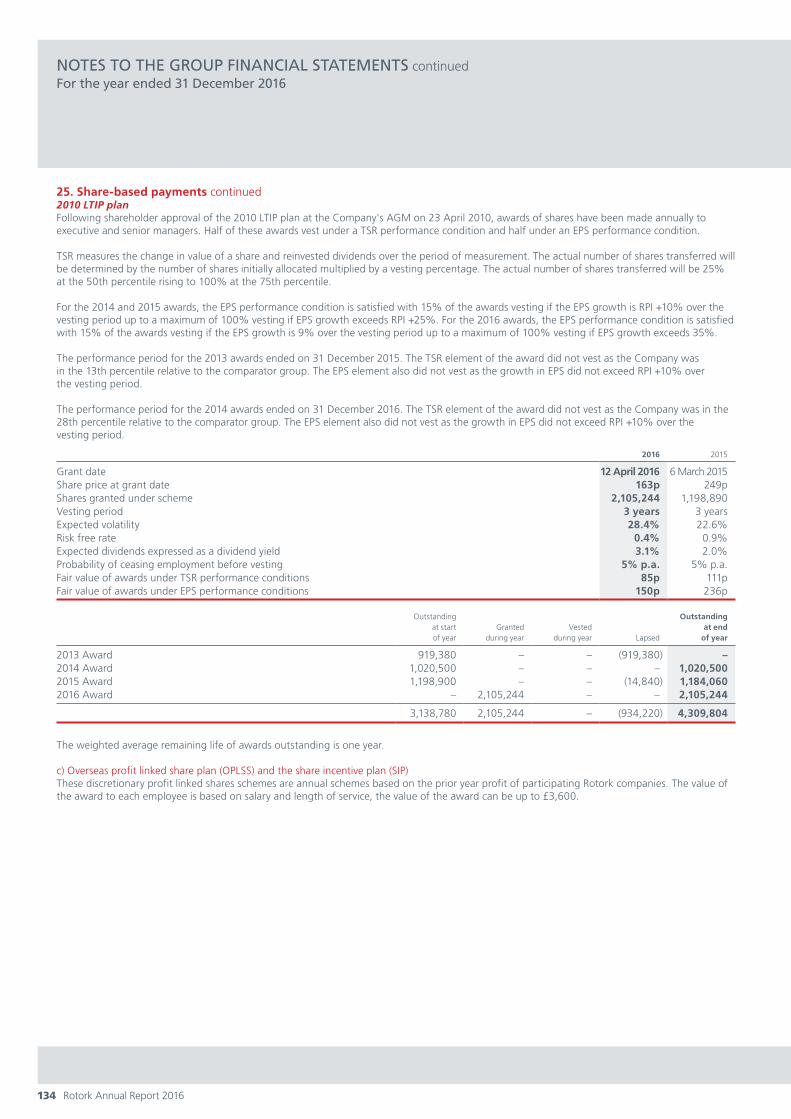
Rotork Annual Report 2016134
25. Share-based payments continued 2010 LTIP planFollowing shareholder approval of the 2010 LTIP plan at the Company's AGM on 23 April 2010, awards of shares have been made annually to executive and senior managers. Half of these awards vest under a TSR performance condition and half under an EPS performance condition.
TSR measures the change in value of a share and reinvested dividends over the period of measurement. The actual number of shares transferred will be determined by the number of shares initially allocated multiplied by a vesting percentage. The actual number of shares transferred will be 25% at the 50th percentile rising to 100% at the 75th percentile.
For the 2014 and 2015 awards, the EPS performance condition is satisfied with 15% of the awards vesting if the EPS growth is RPI +10% over the vesting period up to a maximum of 100% vesting if EPS growth exceeds RPI +25%. For the 2016 awards, the EPS performance condition is satisfied with 15% of the awards vesting if the EPS growth is 9% over the vesting period up to a maximum of 100% vesting if EPS growth exceeds 35%.
The performance period for the 2013 awards ended on 31 December 2015. The TSR element of the award did not vest as the Company was in the 13th percentile relative to the comparator group. The EPS element also did not vest as the growth in EPS did not exceed RPI +10% over the vesting period.
The performance period for the 2014 awards ended on 31 December 2016. The TSR element of the award did not vest as the Company was in the 28th percentile relative to the comparator group. The EPS element also did not vest as the growth in EPS did not exceed RPI +10% over the vesting period.
2016 2015
Grant date 12 April 2016 6 March 2015Share price at grant date 163p 249pShares granted under scheme 2,105,244 1,198,890Vesting period 3 years 3 yearsExpected volatility 28.4% 22.6%Risk free rate 0.4% 0.9%Expected dividends expressed as a dividend yield 3.1% 2.0%Probability of ceasing employment before vesting 5% p.a. 5% p.a.Fair value of awards under TSR performance conditions 85p 111pFair value of awards under EPS performance conditions 150p 236p
Outstandingat startof year
Grantedduring year
Vestedduring year Lapsed
Outstandingat end
of year
2013 Award 919,380 – – (919,380) –2014 Award 1,020,500 – – – 1,020,5002015 Award 1,198,900 – – (14,840) 1,184,0602016 Award – 2,105,244 – – 2,105,244
3,138,780 2,105,244 – (934,220) 4,309,804
The weighted average remaining life of awards outstanding is one year.
c) Overseas profit linked share plan (OPLSS) and the share incentive plan (SIP)These discretionary profit linked shares schemes are annual schemes based on the prior year profit of participating Rotork companies. The value of the award to each employee is based on salary and length of service, the value of the award can be up to £3,600.
NOTES TO THE GROUP FINANCIAL STATEMENTS continuedFor the year ended 31 December 2016
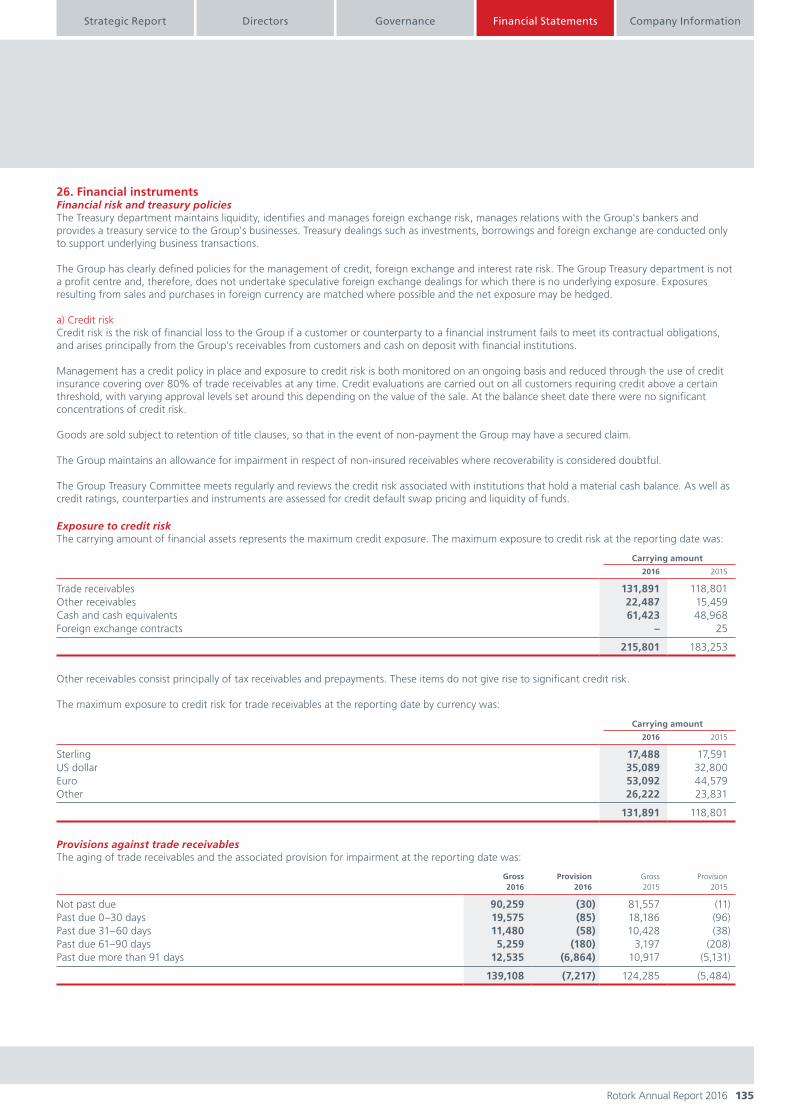
Company InformationDirectorsStrategic Report
135Rotork Annual Report 2016
Financial StatementsGovernance
26. Financial instrumentsFinancial risk and treasury policiesThe Treasury department maintains liquidity, identifies and manages foreign exchange risk, manages relations with the Group's bankers and provides a treasury service to the Group's businesses. Treasury dealings such as investments, borrowings and foreign exchange are conducted only to support underlying business transactions.
The Group has clearly defined policies for the management of credit, foreign exchange and interest rate risk. The Group Treasury department is not a profit centre and, therefore, does not undertake speculative foreign exchange dealings for which there is no underlying exposure. Exposures resulting from sales and purchases in foreign currency are matched where possible and the net exposure may be hedged.
a) Credit riskCredit risk is the risk of financial loss to the Group if a customer or counterparty to a financial instrument fails to meet its contractual obligations, and arises principally from the Group's receivables from customers and cash on deposit with financial institutions.
Management has a credit policy in place and exposure to credit risk is both monitored on an ongoing basis and reduced through the use of credit insurance covering over 80% of trade receivables at any time. Credit evaluations are carried out on all customers requiring credit above a certain threshold, with varying approval levels set around this depending on the value of the sale. At the balance sheet date there were no significant concentrations of credit risk.
Goods are sold subject to retention of title clauses, so that in the event of non-payment the Group may have a secured claim.
The Group maintains an allowance for impairment in respect of non-insured receivables where recoverability is considered doubtful.
The Group Treasury Committee meets regularly and reviews the credit risk associated with institutions that hold a material cash balance. As well as credit ratings, counterparties and instruments are assessed for credit default swap pricing and liquidity of funds.
Exposure to credit riskThe carrying amount of financial assets represents the maximum credit exposure. The maximum exposure to credit risk at the reporting date was:
Carrying amount
2016 2015
Trade receivables 131,891 118,801Other receivables 22,487 15,459Cash and cash equivalents 61,423 48,968Foreign exchange contracts – 25
215,801 183,253
Other receivables consist principally of tax receivables and prepayments. These items do not give rise to significant credit risk.
The maximum exposure to credit risk for trade receivables at the reporting date by currency was:
Carrying amount
2016 2015
Sterling 17,488 17,591US dollar 35,089 32,800Euro 53,092 44,579Other 26,222 23,831
131,891 118,801
Provisions against trade receivablesThe aging of trade receivables and the associated provision for impairment at the reporting date was:
Gross2016
Provision2016
Gross2015
Provision2015
Not past due 90,259 (30) 81,557 (11)Past due 0–30 days 19,575 (85) 18,186 (96)Past due 31–60 days 11,480 (58) 10,428 (38)Past due 61–90 days 5,259 (180) 3,197 (208)Past due more than 91 days 12,535 (6,864) 10,917 (5,131)
139,108 (7,217) 124,285 (5,484)
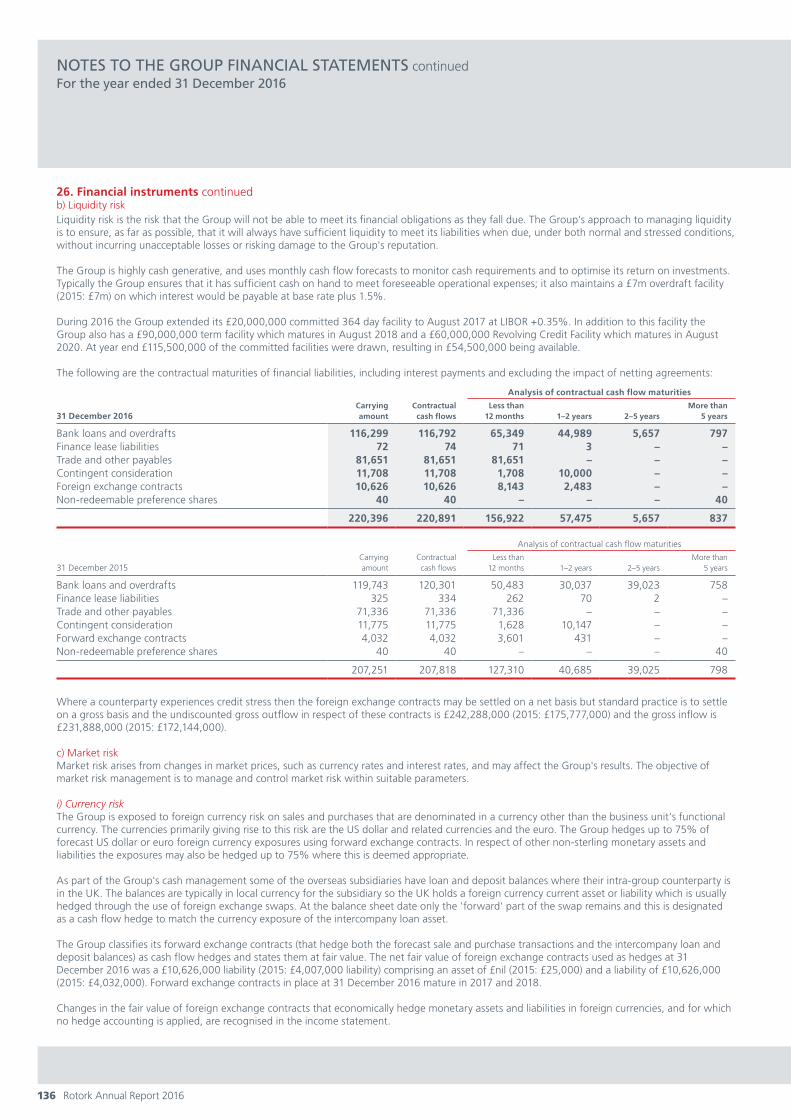
Rotork Annual Report 2016136
26. Financial instruments continuedb) Liquidity riskLiquidity risk is the risk that the Group will not be able to meet its financial obligations as they fall due. The Group's approach to managing liquidityis to ensure, as far as possible, that it will always have sufficient liquidity to meet its liabilities when due, under both normal and stressed conditions, without incurring unacceptable losses or risking damage to the Group's reputation.
The Group is highly cash generative, and uses monthly cash flow forecasts to monitor cash requirements and to optimise its return on investments. Typically the Group ensures that it has sufficient cash on hand to meet foreseeable operational expenses; it also maintains a £7m overdraft facility (2015: £7m) on which interest would be payable at base rate plus 1.5%.
During 2016 the Group extended its £20,000,000 committed 364 day facility to August 2017 at LIBOR +0.35%. In addition to this facility the Group also has a £90,000,000 term facility which matures in August 2018 and a £60,000,000 Revolving Credit Facility which matures in August 2020. At year end £115,500,000 of the committed facilities were drawn, resulting in £54,500,000 being available.
The following are the contractual maturities of financial liabilities, including interest payments and excluding the impact of netting agreements:
31 December 2016Carrying amount
Contractual cash flows
Analysis of contractual cash flow maturities
Less than12 months 1–2 years 2–5 years
More than5 years
Bank loans and overdrafts 116,299 116,792 65,349 44,989 5,657 797Finance lease liabilities 72 74 71 3 – –Trade and other payables 81,651 81,651 81,651 – – –Contingent consideration 11,708 11,708 1,708 10,000 – –Foreign exchange contracts 10,626 10,626 8,143 2,483 – –Non-redeemable preference shares 40 40 – – – 40
220,396 220,891 156,922 57,475 5,657 837
31 December 2015Carrying amount
Contractualcash flows
Analysis of contractual cash flow maturities
Less than 12 months 1–2 years 2–5 years
More than5 years
Bank loans and overdrafts 119,743 120,301 50,483 30,037 39,023 758Finance lease liabilities 325 334 262 70 2 –Trade and other payables 71,336 71,336 71,336 – – –Contingent consideration 11,775 11,775 1,628 10,147 – –Forward exchange contracts 4,032 4,032 3,601 431 – –Non-redeemable preference shares 40 40 – – – 40
207,251 207,818 127,310 40,685 39,025 798
Where a counterparty experiences credit stress then the foreign exchange contracts may be settled on a net basis but standard practice is to settle on a gross basis and the undiscounted gross outflow in respect of these contracts is £242,288,000 (2015: £175,777,000) and the gross inflow is £231,888,000 (2015: £172,144,000).
c) Market riskMarket risk arises from changes in market prices, such as currency rates and interest rates, and may affect the Group's results. The objective of market risk management is to manage and control market risk within suitable parameters.
i) Currency riskThe Group is exposed to foreign currency risk on sales and purchases that are denominated in a currency other than the business unit's functional currency. The currencies primarily giving rise to this risk are the US dollar and related currencies and the euro. The Group hedges up to 75% of forecast US dollar or euro foreign currency exposures using forward exchange contracts. In respect of other non-sterling monetary assets and liabilities the exposures may also be hedged up to 75% where this is deemed appropriate.
As part of the Group's cash management some of the overseas subsidiaries have loan and deposit balances where their intra-group counterparty is in the UK. The balances are typically in local currency for the subsidiary so the UK holds a foreign currency current asset or liability which is usually hedged through the use of foreign exchange swaps. At the balance sheet date only the 'forward' part of the swap remains and this is designated as a cash flow hedge to match the currency exposure of the intercompany loan asset.
The Group classifies its forward exchange contracts (that hedge both the forecast sale and purchase transactions and the intercompany loan and deposit balances) as cash flow hedges and states them at fair value. The net fair value of foreign exchange contracts used as hedges at 31 December 2016 was a £10,626,000 liability (2015: £4,007,000 liability) comprising an asset of £nil (2015: £25,000) and a liability of £10,626,000 (2015: £4,032,000). Forward exchange contracts in place at 31 December 2016 mature in 2017 and 2018.
Changes in the fair value of foreign exchange contracts that economically hedge monetary assets and liabilities in foreign currencies, and for which no hedge accounting is applied, are recognised in the income statement.
NOTES TO THE GROUP FINANCIAL STATEMENTS continuedFor the year ended 31 December 2016

Company InformationDirectorsStrategic Report
137Rotork Annual Report 2016
Financial StatementsGovernance
Sensitivity analysisIt is estimated that, with all other variables held equal (in particular other exchange rates), a general change of one cent in the value of euro against sterling would have had an impact on the Group's operating profit for the year ended 31 December 2016 of £250,000 (2015: £235,000) and a change of one cent in the value of US dollar against sterling would have had an impact on the Group's operating profit for the year ended 31 December 2016 of £450,000 (2015: £400,000). The method of estimation, which has been applied consistently, involves assessing the transaction impact of US dollar and euro cash flows and the translation impact of US dollar and euro profits.
The following significant exchange rates applied during the year:
Average rate Closing rate
2016 2015 2016 2015
US dollar 1.36 1.53 1.24 1.47Euro 1.22 1.38 1.17 1.36
ii) Interest rate riskThe Group does not undertake any hedging activity in this area. All cash deposits are made at prevailing interest rates and the majority is available with same day notice, though deposits are sometimes made with a maturity of no more than three months. The main element of interest rate risk concerns sterling, US dollar, euro and renminbi deposits, all of which are on a floating rate basis.
The interest rate profile of the Group's financial liabilities at 31 December was as follows:
2016 2015
Fixed rate financial liabilities 203 604Floating rate financial liabilities 116,208 119,504
116,411 120,108
The fixed and floating rate financial liabilities comprise finance leases, preference shares and bank loans. The floating rate obligations bear interest at rates determined by reference to the relevant LIBOR or equivalent rate.
The weighted average interest rate of the fixed rate financial liabilities is 2.08% (2015: 1.98%). The weighted average period for which interest rates on the fixed rate financial liabilities are fixed is 0.8 years.
The maturity profile of the Group's financial liabilities at 31 December was as follows:
2016 2015
In one year or less 65,108 50,352In more than one year but not more than two years 44,968 30,084In more than two years but not more than five years 5,600 38,975In more than five years 735 697
Total 116,411 120,108
d) Capital risk managementThe primary objective of the Group's capital management is to ensure it maintains sufficient capital in order to support its business and maximise shareholder value. The Group has an asset-light business model and uses cash generated from operations to either invest organically or by acquisition. The Group manages its capital structure and makes adjustments to it in light of changes in economic and market conditions. To maintain or adjust the capital structure, the Group may adjust the dividend payment to shareholders or issue new shares.
The Group defines capital as net debt plus equity attributable to shareholders. There are no externally imposed restrictions on the Group's capital structure.
The Group monitors capital using the following indicators:
i) Group net debt
2016 2015
Total borrowings (116,411) (120,108)Cash and cash equivalents (note 16) 61,423 48,968
Group net debt (54,988) (71,140)

Rotork Annual Report 2016138
26. Financial instruments continued ii) Return on capital employed
2016 2015
Adjusted operating profit Operating profit 93,777 104,386Amortisation of acquired intangible assets 26,811 20,886
120,588 125,272
Capital employed Shareholders' funds 434,086 407,802Cash and cash equivalents (note 16) (61,423) (48,968)Interest bearing loans and borrowings 116,411 120,108
Net debt 54,988 71,140Pension deficit net of deferred tax 46,469 17,532
535,543 496,474
Average capital employed 516,009 437,990Return on capital employed 23.4% 28.6%
e) Fair valuesThe fair values of financial assets and liabilities, together with the carrying amounts shown in the balance sheet, were as follows:
Carryingamount
2016Fair value
2016
Carryingamount
2015Fair value
2015
Loans and receivables Trade receivables 131,891 131,891 118,801 118,801Other receivables 22,487 22,487 15,459 15,459
Financial assets Cash and cash equivalents 61,423 61,423 48,968 48,968
Designated cash flow hedges Foreign exchange contracts: Financial assets – – 25 25 Financial liabilities (10,626) (10,626) (4,032) (4,032)
Financial liabilities at amortised cost Bank loans (116,299) (116,299) (119,743) (119,743)Trade and other payables (81,651) (81,651) (71,336) (71,336)Contingent consideration (11,708) (11,708) (11,775) (11,775)Preference shares (40) (40) (40) (40)Finance lease liabilities (72) (72) (325) (325)
(4,595) (4,595) (23,998) (23,998)
Fair value hierarchyThe fair value of the Group's outstanding derivative financial assets and liabilities consisted of foreign exchange contracts and swaps and were estimated using year end spot rates adjusted for the forward points to the appropriate value dates, and gains and losses are taken to equity estimated using market foreign exchange rates at the balance sheet date. All derivative financial instruments are categorised at level 2 of the fair value hierarchy. The other financial instruments are classified as level 3 in the fair value hierarchy and are valued as follows:
i) Trade and other receivables/payablesAs the majority of receivables/payables have a remaining life of less than one year, the notional amount is deemed to reflect the fair value.
ii) Contingent considerationAs all the contingent consideration is contractually due for payment within 14 months (2015: 14 months), the carrying amount is equal to the fair value. Further information on the contingent consideration is shown in note 21.
NOTES TO THE GROUP FINANCIAL STATEMENTS continuedFor the year ended 31 December 2016
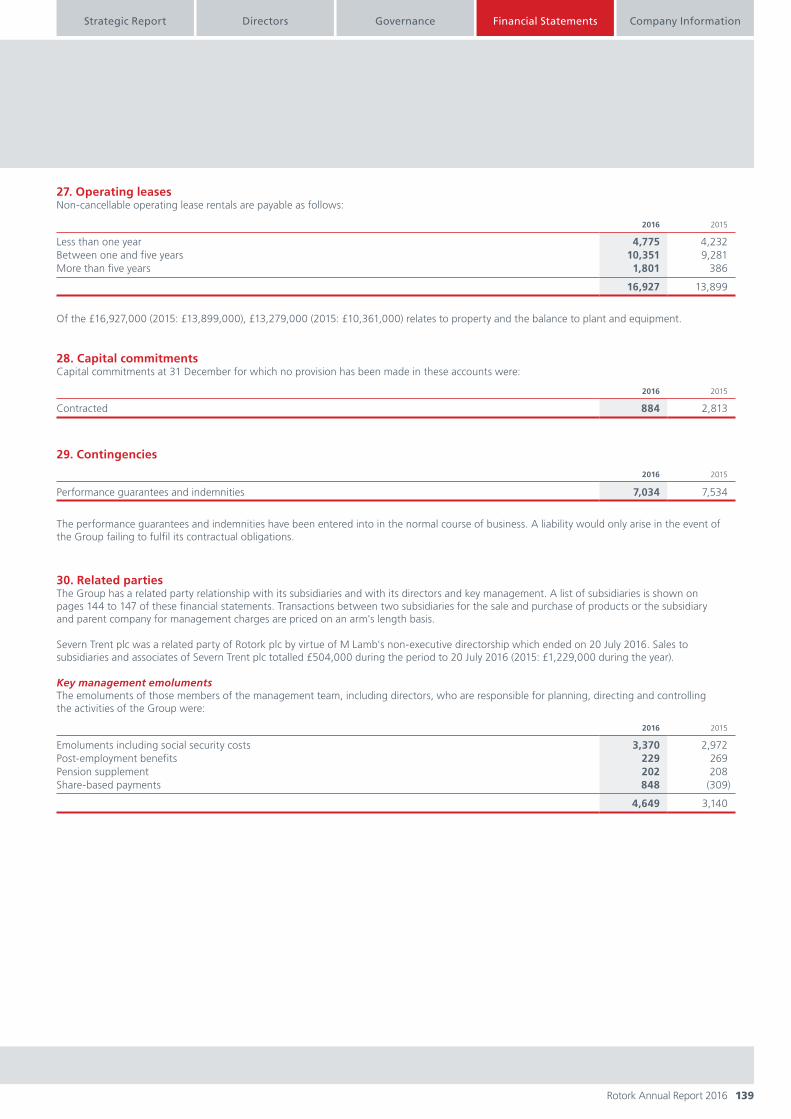
Company InformationDirectorsStrategic Report
139Rotork Annual Report 2016
Financial StatementsGovernance
27. Operating leasesNon-cancellable operating lease rentals are payable as follows:
2016 2015
Less than one year 4,775 4,232Between one and five years 10,351 9,281More than five years 1,801 386
16,927 13,899
Of the £16,927,000 (2015: £13,899,000), £13,279,000 (2015: £10,361,000) relates to property and the balance to plant and equipment.
28. Capital commitmentsCapital commitments at 31 December for which no provision has been made in these accounts were:
2016 2015
Contracted 884 2,813
29. Contingencies
2016 2015
Performance guarantees and indemnities 7,034 7,534
The performance guarantees and indemnities have been entered into in the normal course of business. A liability would only arise in the event of the Group failing to fulfil its contractual obligations.
30. Related partiesThe Group has a related party relationship with its subsidiaries and with its directors and key management. A list of subsidiaries is shown on pages 144 to 147 of these financial statements. Transactions between two subsidiaries for the sale and purchase of products or the subsidiary and parent company for management charges are priced on an arm's length basis.
Severn Trent plc was a related party of Rotork plc by virtue of M Lamb's non-executive directorship which ended on 20 July 2016. Sales to subsidiaries and associates of Severn Trent plc totalled £504,000 during the period to 20 July 2016 (2015: £1,229,000 during the year).
Key management emolumentsThe emoluments of those members of the management team, including directors, who are responsible for planning, directing and controlling the activities of the Group were:
2016 2015
Emoluments including social security costs 3,370 2,972Post-employment benefits 229 269Pension supplement 202 208Share-based payments 848 (309)
4,649 3,140

Rotork Annual Report 2016140
ROTORK PLC COMPANY BALANCE SHEETAt 31 December 2016
Notes2016£000
2015£000
Non-current assets Property, plant and equipment c 72 115Investments d 43,205 43,205Deferred tax assets e 145 51
43,422 43,371
Current assets Amounts owed by Group undertakings 150,327 129,974Other receivables f 743 203Cash and cash equivalents 1,234 1,680
152,304 131,857
Total assets 195,726 175,228
Equity Share capital i 4,350 4,349Share premium 10,482 10,018Capital redemption reserve 1,644 1,644Retained earnings 175,495 155,031
191,971 171,042
Non-current liabilitiesPreference share capital 40 40
40 40
Current liabilities Trade payables 15 232Amounts owed to Group undertakings 1,051 1,051Other payables g 2,649 2,863
3,715 4,146
Total equity and liabilities 195,726 175,228
The Company reported a profit for the financial year of £61,600,000 (2015: £95,905,000).
These Company financial statements were approved by the Board of Directors on 27 February 2017 and were signed on its behalf by:
PI France and JM Davis, Directors.

Company InformationDirectorsStrategic Report
141Rotork Annual Report 2016
Financial StatementsGovernance
ROTORK PLC COMPANY STATEMENT OF CHANGES IN EQUITYAt 31 December 2016
Sharecapital£000
Sharepremium
£000
Capitalredemption
reserve£000
Retainedearnings
£000Total equity
£000
Balance at 31 December 2014 4,346 9,422 1,644 102,883 118,295
Profit for the year – – – 95,905 95,905Equity settled share-based payment transactions net of tax – – – (1,464) (1,464)Share options exercised by employees 3 596 – – 599Own ordinary shares acquired – – – (2,785) (2,785)Own ordinary shares awarded under share schemes – – – 4,257 4,257Dividends – – – (43,765) (43,765)
Balance at 31 December 2015 4,349 10,018 1,644 155,031 171,042
Profit for the year – – – 61,600 61,600Equity settled share-based payment transactions net of tax – – – 1,557 1,557Share options exercised by employees 1 464 – – 465Own ordinary shares acquired – – – (1,019) (1,019)Own ordinary shares awarded under share schemes – – – 2,202 2,202Dividends – – – (43,876) (43,876)
Balance at 31 December 2016 4,350 10,482 1,644 175,495 191,971
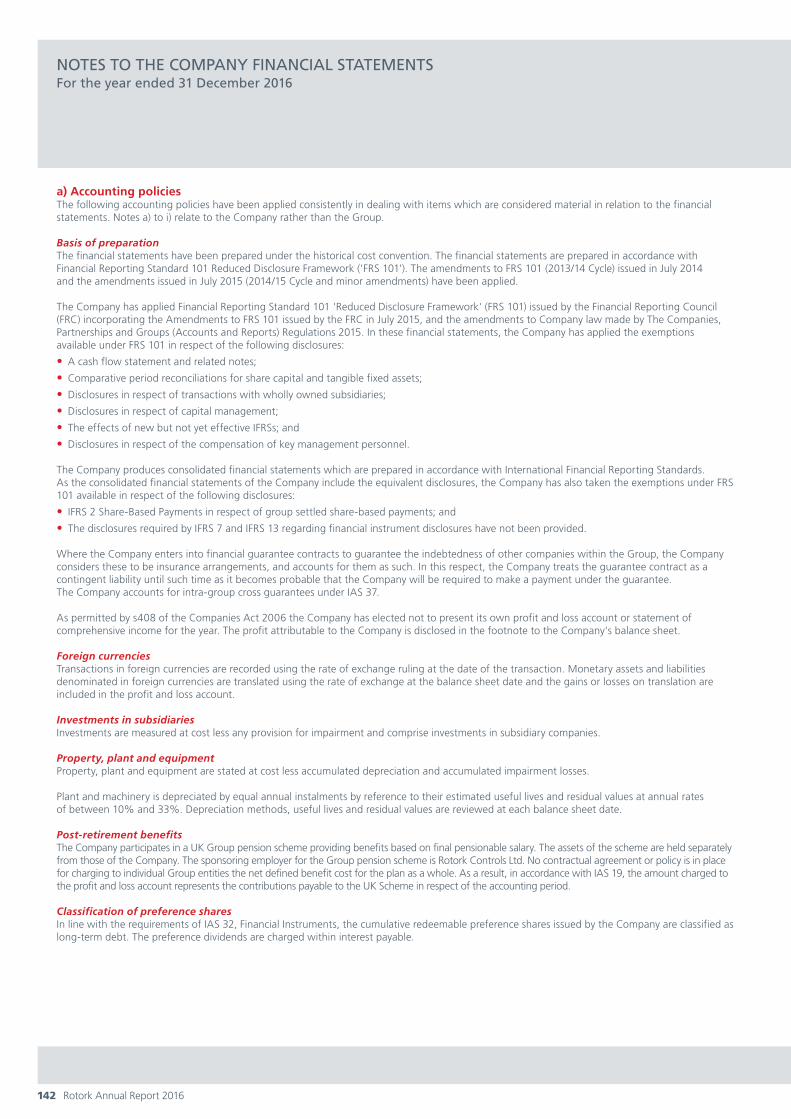
Rotork Annual Report 2016142
NOTES TO THE COMPANY FINANCIAL STATEMENTSFor the year ended 31 December 2016
a) Accounting policiesThe following accounting policies have been applied consistently in dealing with items which are considered material in relation to the financial statements. Notes a) to i) relate to the Company rather than the Group.
Basis of preparationThe financial statements have been prepared under the historical cost convention. The financial statements are prepared in accordance with Financial Reporting Standard 101 Reduced Disclosure Framework ('FRS 101'). The amendments to FRS 101 (2013/14 Cycle) issued in July 2014 and the amendments issued in July 2015 (2014/15 Cycle and minor amendments) have been applied.
The Company has applied Financial Reporting Standard 101 'Reduced Disclosure Framework' (FRS 101) issued by the Financial Reporting Council (FRC) incorporating the Amendments to FRS 101 issued by the FRC in July 2015, and the amendments to Company law made by The Companies, Partnerships and Groups (Accounts and Reports) Regulations 2015. In these financial statements, the Company has applied the exemptions available under FRS 101 in respect of the following disclosures:
• A cash flow statement and related notes;
• Comparative period reconciliations for share capital and tangible fixed assets;
• Disclosures in respect of transactions with wholly owned subsidiaries;
• Disclosures in respect of capital management;
• The effects of new but not yet effective IFRSs; and
• Disclosures in respect of the compensation of key management personnel.
The Company produces consolidated financial statements which are prepared in accordance with International Financial Reporting Standards. As the consolidated financial statements of the Company include the equivalent disclosures, the Company has also taken the exemptions under FRS 101 available in respect of the following disclosures:
• IFRS 2 Share-Based Payments in respect of group settled share-based payments; and
• The disclosures required by IFRS 7 and IFRS 13 regarding financial instrument disclosures have not been provided.
Where the Company enters into financial guarantee contracts to guarantee the indebtedness of other companies within the Group, the Company considers these to be insurance arrangements, and accounts for them as such. In this respect, the Company treats the guarantee contract as a contingent liability until such time as it becomes probable that the Company will be required to make a payment under the guarantee. The Company accounts for intra-group cross guarantees under IAS 37.
As permitted by s408 of the Companies Act 2006 the Company has elected not to present its own profit and loss account or statement of comprehensive income for the year. The profit attributable to the Company is disclosed in the footnote to the Company's balance sheet.
Foreign currenciesTransactions in foreign currencies are recorded using the rate of exchange ruling at the date of the transaction. Monetary assets and liabilities denominated in foreign currencies are translated using the rate of exchange at the balance sheet date and the gains or losses on translation are included in the profit and loss account.
Investments in subsidiariesInvestments are measured at cost less any provision for impairment and comprise investments in subsidiary companies.
Property, plant and equipmentProperty, plant and equipment are stated at cost less accumulated depreciation and accumulated impairment losses.
Plant and machinery is depreciated by equal annual instalments by reference to their estimated useful lives and residual values at annual rates of between 10% and 33%. Depreciation methods, useful lives and residual values are reviewed at each balance sheet date.
Post-retirement benefitsThe Company participates in a UK Group pension scheme providing benefits based on final pensionable salary. The assets of the scheme are held separately from those of the Company. The sponsoring employer for the Group pension scheme is Rotork Controls Ltd. No contractual agreement or policy is in place for charging to individual Group entities the net defined benefit cost for the plan as a whole. As a result, in accordance with IAS 19, the amount charged to the profit and loss account represents the contributions payable to the UK Scheme in respect of the accounting period.
Classification of preference sharesIn line with the requirements of IAS 32, Financial Instruments, the cumulative redeemable preference shares issued by the Company are classified as long-term debt. The preference dividends are charged within interest payable.

Company InformationDirectorsStrategic Report
143Rotork Annual Report 2016
Financial StatementsGovernance
Share-based paymentsThe Company has adopted IFRS 2 and its policy in respect of share-based payment transactions is consistent with the Group policy shown in note 1 to the Group financial statements. Costs in relation to share-based awards made to other Group employees are recharged to each subsidiary company.
Deferred taxationDeferred tax is provided on temporary differences between the carrying amounts of assets and liabilities for financial reporting purposes and the amounts used for taxation purposes. The following temporary differences are not provided for: the initial recognition of goodwill; the initial recognition of assets or liabilities that affect neither accounting nor taxable profit other than in a business combination, and differences relating to investments in subsidiaries to the extent that they will probably not reverse in the foreseeable future. The amount of deferred tax provided is based on the expected manner of realisation or settlement of the carrying amount of assets and liabilities, using tax rates enacted or substantively enacted at the balance sheet date.
A deferred tax asset is recognised only to the extent that it is probable that future taxable profits will be available against which the temporary difference can be utilised.
DividendsInterim dividends are recorded in the financial statements when they are paid. Final dividends are recorded in the financial statements in the period in which they are approved by the Company's shareholders.
b) Personnel expenses in the Company profit and loss account
2016 2015
Wages and salaries (including bonus and incentive plans) 3,028 2,221Social security costs 334 134Pension costs 251 233Share-based payments/(credit) 452 (237)
4,065 2,351
During the year there were 17 (2015: 15) employees of Rotork plc plus the three (2015: three) executive directors. The personnel costs accounted for within the Company include the full costs of the employees, the Finance Director, the Chief Executive, but the full costs of the other executive director is reported within the subsidiary where he is based.
Disclosures required by paragraph 1 of schedule 5 of SI2008/410 are set out in the Director's Remuneration Report on pages 76 to 93.
Share-based paymentsThe share-based payment charge relates to employees of the Company participating in the long term incentive plan (LTIP). The disclosures required under IFRS 2 can be found in note 25 to the Group financial statements. The table below sets out the movement of share options under the LTIP for employees of the Company.
Outstandingat startof year
Granted duringyear
Vestedduring
year
Lapsedduring
year
Outstandingat end
of year
2013 Award 289,820 – – (289,820) –2014 Award 316,920 – – – 316,9202015 Award 400,940 – – – 400,9402016 Award – 804,898 – – 804,898
1,007,680 804,898 – (289,820) 1,522,758
The weighted average remaining life of awards outstanding at the year end is one year.

Rotork Annual Report 2016144
NOTES TO THE COMPANY FINANCIAL STATEMENTS continuedFor the year ended 31 December 2016
c) Property, plant and equipment in the Company balance sheet
Plant andequipment Total
Cost At 1 January 2016 221 221Additions – –
At 31 December 2016 221 221
DepreciationAt 1 January 2016 106 106Charge for year 43 43
At 31 December 2016 149 149
Net book valueAt 31 December 2016 72 72
At 31 December 2015 115 115
d) Investments in the Company balance sheetShares in Group companies
2016 2015
At 1 January and 31 December 43,205 43,205
The Company has the following investments in wholly owned subsidiaries:
Subsidiary Incorporated in Registered address
100% owned by Rotork plcGH Chaplain & Co (Engineers) Limited England and Wales Rotork House, Brassmill Lane, Bath BA1 3JQRotork Analysis Limited England and Wales Rotork House, Brassmill Lane, Bath BA1 3JQRotork Cleaners Limited England and Wales Rotork House, Brassmill Lane, Bath BA1 3JQRotork Control and Safety Limited England and Wales Rotork House, Brassmill Lane, Bath BA1 3JQRotork Instruments Limited England and Wales Rotork House, Brassmill Lane, Bath BA1 3JQRotork Nominees Limited England and Wales Rotork House, Brassmill Lane, Bath BA1 3JQWidcombe (Developments) Limited England and Wales Rotork House, Brassmill Lane, Bath BA1 3JQRotork Controls Limited England and Wales Rotork House, Brassmill Lane, Bath BA1 3JQRotork Overseas Limited England and Wales Rotork House, Brassmill Lane, Bath BA1 3JQ
100% owned by Rotork Controls LimitedRotork Actuation (Shanghai) Co Limited China Building G, No.260 Liancao Road, Minhang District, Shanghai,
PRC 201108Rotork Trading (Shanghai) Co Limited China Room 1177, No.400, Middle Zhejiang Road, HuangPu District, Shanghai,
ChinaRotork Controls (India) Private Limited India 28B, Ambattur Industrial Estate (North Phase), Ambattur,
Chennai 600 098, IndiaRotork UK Limited England and Wales Rotork House, Brassmill Lane, Bath BA1 3JQValvekits Limited England and Wales Rotork House, Brassmill Lane, Bath BA1 3JQ
100% owned by Rotork Overseas LimitedRotork Australia Pty Limited Australia Level 26, 181 William Street, Melbourne, VIC, 3000, AustraliaRotork Controls Comercio De Atuadores LTDA Brazil Rodovia SP 73, 4509 – Armazem Modulo 14 – NR Cond.,
Indaiatuba – SP, BrazilRotork Controls (Canada) Limited Canada #4-2850 Argentia Road, Mississauga, Ontario, L5N-8G4, CanadaRotork Chile SpA Chile Rotork Es Presidente Kennedy 4700, Oficina 1001, Vitacura, ChileBifold Group Limited England and Wales Rotork House, Brassmill Lane, Bath BA1 3JQRotork Midland Limited England and Wales Rotork House, Brassmill Lane, Bath BA1 3JQRotork Motorisation SAS France 75, Rue Rateau 93126 La Courneuve Cedex, FranceRotork Controls (Deutschland) GmbH Germany Siemensstr. 33, 40721 Hilden, GermanyRotork Germany Holdings GmbH Germany Mühlsteig 45, 90579 Langenzenn, GermanyRotork Limited Hong Kong Level 54, Hopewell Centre, 183 Queen's Road East, Hong KongEltav Wireless Monitoring Limited Israel 15 Hata'asia St. Ra'anana, Israel 4365408Rotork Italy Holdings Srl Italy Corso di Porta Vittoria 9 (Milano) Italy

Company InformationDirectorsStrategic Report
145Rotork Annual Report 2016
Financial StatementsGovernance
Subsidiary Incorporated in Registered address
Rotork Japan Co Limited Japan 2-2-24 Sengoku, Koto-ku, Tokyo, 135-0015 JapanRotork Middle East FZE Jebel Ali Free Zone PUB-LC 07, near R/A 08, PO Box 262903, Jebel Ali Free Zone, Dubai,
United Arab EmiratesRotork (Malaysia) Sdn Bhd Malaysia 1-17-1, Menara Bangkok Bank, Berjaya Central Park, No 105, Jalan
Ampang, 50450 Kuala Lumpur, MalaysiaRotork Actuation Sdn Bhd Malaysia No 32, Jln Anggerik Mokara 31/47, Kota Kemuning, 40460 Shah Alam,
MalaysiaRotork BV Netherlands Mandenmakerstraat 45, 3194 DA Hoogvliet, The NetherlandsRotork Gears Holding BV Netherlands Nijverheidstraat 25, 7581 PV Losser, The NetherlandsRobusta Miry Brook BV Netherlands Strawinskylaan 3127, 8th Floor, 1077 ZX Amsterdam, The NetherlandsRotork Norge AS Norway Ormahaugvegen 3, 5347 Ågotnes, NorwayRotork Polska zoo Poland Tarnogórska 241, 44-100 Gliwice, PolandRotork Rus Limited Russia Offices 203-205, ul. Otradnaya 2B, bld. 3, 127273 Moscow, RussiaRotork Controls (Singapore) Pte Limited Singapore 426 Tagore Industrial Ave, Singapore 787808Rotork Africa (Pty) Limited South Africa 136 Kuschke Street, Meadowdale Ext3, Germiston, 1601 South AfricaRotork Controls (Korea) Co Limited South Korea 509, 5th Floor Leader's Bldg 342-1, Yatap-Dong, Bundang-gu,
Seong-nam Si, Gyeonggi-do, South Korea 463-828Young Tech Co Limited South Korea 81, Hwanggeum-ro, 89beon-gil, Yangchon-eup, Gimpo-si,
Gyeonggi-do, Korea 10048Rotork Controls (Iberia) SL Spain Larrondo Beheko Etorbidea, Edificio 2 – 48180 Loiu (Bizkaia) SpainRotork Sweden AB Sweden Box 80, 791 22 Falun, SwedenRotork AG Switzerland Fuchsacker 678, 9426 Lutzenberg, SwitzerlandRotork Inc. USA The Corporation Trust Company, Corporation Trust Center, 1209 Orange
St., Wilmington, DE 19801 USARotork Controls de Venezuela SA Venezuela Av. Casanova Torre Banco Plaza, Piso 3 Ofic. 3D. Sabana Grande.
Caracas – VenezuelaRotork Turkey Akıs Kontrol Sistemleri Ticaret Limited Sirketi
Turkey Aydinli Mahallesi Melodi Sok. Bilmo Küçük Sanayi Sitesi no:35/2 Tuzla, Turkey
100% owned by Valvekits LimitedCirca Engineering Limited England and Wales Rotork House, Brassmill Lane, Bath BA1 3JQ
100% owned by Rotork Trading (Shanghai) Co LimitedCentork Trading (Shanghai) Co. Ltd China Room C-02, 1/F, West Area No. 2 Building, No. 29 Jiatai Road, Free Trade
Zone, Shanghai, ChinaRotork Instruments Chengdu Co. Ltd China Room 1201, 12/F, Unit no.1, Building No. 1, Building I, 88 Shenghe No.1
Road, High Tech Zone, Chengdu, Sichuan, China 610041
100% owned by Rotork UK LimitedProkits Limited England and Wales Rotork House, Brassmill Lane, Bath BA1 3JQFlowco Limited England and Wales Rotork House, Brassmill Lane, Bath BA1 3JQ
100% owned by Rotork Motorisation SASServo Moteurs Service SARL France 210 Chemin du Guigonnet 13270 Fos-sur-Mer, France
100% owned by Rotork Italy Holdings SrlRotork Controls Italia Srl Italy Viale Europa n.17 – 20090 Cusago (Milano) ItalyRotork Instruments Italy Srl Italy Viale Europa n.17 – 20090 Cusago (Milano) ItalyGT Attuatori Srl Italy Viale Europa n.17 – 20090 Cusago (Milano) ItalyRotork Fluid Systems Srl Italy Via Padre Jacques Hamel, 138/B – 55016 Porcari (Lucca) ItalyCostruzioni Meccaniche Legnanesi Srl Italy Via del Brugo, 5 20025 Legnano (Milano) Italy
100% owned by Rotork Controls Italia SrlRotork Gears Srl Italy Viale Europa n.17 – 20090 Cusago (Milano) Italy
100% owned by Rotork Gears Holding BVRotork Gears BV Netherlands Nijverheidstraat 25, 7581 PV, Overijssel, The Netherlands
100% owned by Rotork IncRotork (Thailand) Limited Thailand 35/8 Soi Ladprao124 (Sawasdikarn) Ladprao Road, Plubpla,
Wangtonglang, Bangkok 10310 ThailandRotork Controls Inc. USA 675 Mile Crossing Blvd., Rochester, NY 14624, USA

Rotork Annual Report 2016146
Subsidiary Incorporated in Registered address
Ralph A.Hiller Company USA 6005 Enterpirise Drive, Export, PA 15632, USARemote Control Inc. USA 77 Circuit Dr. North Kingstown, RI 02852, USARanger Acquisition Corp USA The Corporation Trust Company, Corporation Trust Center, 1209 Orange
St., Wilmington, DE 19801 USA
100% owned by Ranger Acquisition CorpK-Tork International Inc. USA C T Corporation System, 1999 Bryan St., Suite 900, Dallas, TX 75201
USAFairchild Industrial Products Company USA 3920 West Point Blvd, Winston-Salem, NC 27103, USARotork Tulsa Inc. USA 4433 W 49th Suite D, Tulsa, OK 74017, USA
100% owned by K-Tork International IncRotork Dallas Inc. USA 10410 Vista Park Rd; Dallas, TX; 75238
100% owned by Fairchild Industrial Products CompanyFairchild Industrial Products (Sichuan) Company Limited
China Room 1201, Complex Square, No.88 West Shenghe No.1 Road, High Tech Zone, Chengdu, Sichuan, China. 610041
Fairchild India Private Limited India 56-C/Bb , Janakpuri, New Delhi-110058
100% owned by Bifold Group LimitedBifold Fluidpower (Holdings) Limited England and Wales Rotork House, Brassmill Lane, Bath BA1 3JQ
100% owned by Bifold Fluidpower (Holdings) LimitedBifold Fluidpower Limited England and Wales Rotork House, Brassmill Lane, Bath BA1 3JQMTS Precision Limited England and Wales Rotork House, Brassmill Lane, Bath BA1 3JQMarshalsea Hydraulics Limited England and Wales Rotork House, Brassmill Lane, Bath BA1 3JQBifold Company (Manufacturing) Limited England and Wales Rotork House, Brassmill Lane, Bath BA1 3JQ
100% owned by Bifold Fluidpower LimitedFluidpower (Stainless Steel) Limited England and Wales Rotork House, Brassmill Lane, Bath BA1 3JQ
100% owned by Rotork Germany Holdings GmbHMax Process GmbH Germany Rastenweg 10, 53489 SinzigSchischek GmbH Germany Mühlsteig 45, 90579 LangenzennSchischek Produktion Technischer Gerate GmbH Germany Mühlsteig 45, 90579 LangenzennRotork GmbH Germany Mühlsteig 45, 90579 Langenzenn
100% owned by Rotork AGSchischek Limited England and Wales Rotork House, Brassmill Lane, Bath BA1 3JQSchischek EURL France 49 Avenue du Président Salvador Allende, 77100 Meaux, FranceSchischek Srl Italy Ranica (BG) – Via Adelasio 22, Italy
60% owned by Max Process GmbHGT Attuatori Europe GmbH Germany Rastenweg 10, 53489 Sinzig
40% owned by Rotork Germany Holdings GmbHGT Attuatori Europe GmbH Germany Rastenweg 10, 53489 Sinzig
100% owned by Schischek GmbHSchischek Sales Europe Ltd England and Wales Mühlsteig 45, 90579 Langenzenn
100% owned by Robusta Miry Brook BVRotork Servo Controles de Mexico S.A de C.V Mexico Centeotl 223, Col. Industrial San Antonio, C.P. 02760, Azcapotzalco,
Ciudad de Mexico, Mexico
100% owned by Rotork Controls (Iberia) SLActuation Iberia S.L Spain C/Ercilla, 21., 48009, Bilbao (Vizcaya), Spain
d) Investments in the Company balance sheet continued
NOTES TO THE COMPANY FINANCIAL STATEMENTS continuedFor the year ended 31 December 2016
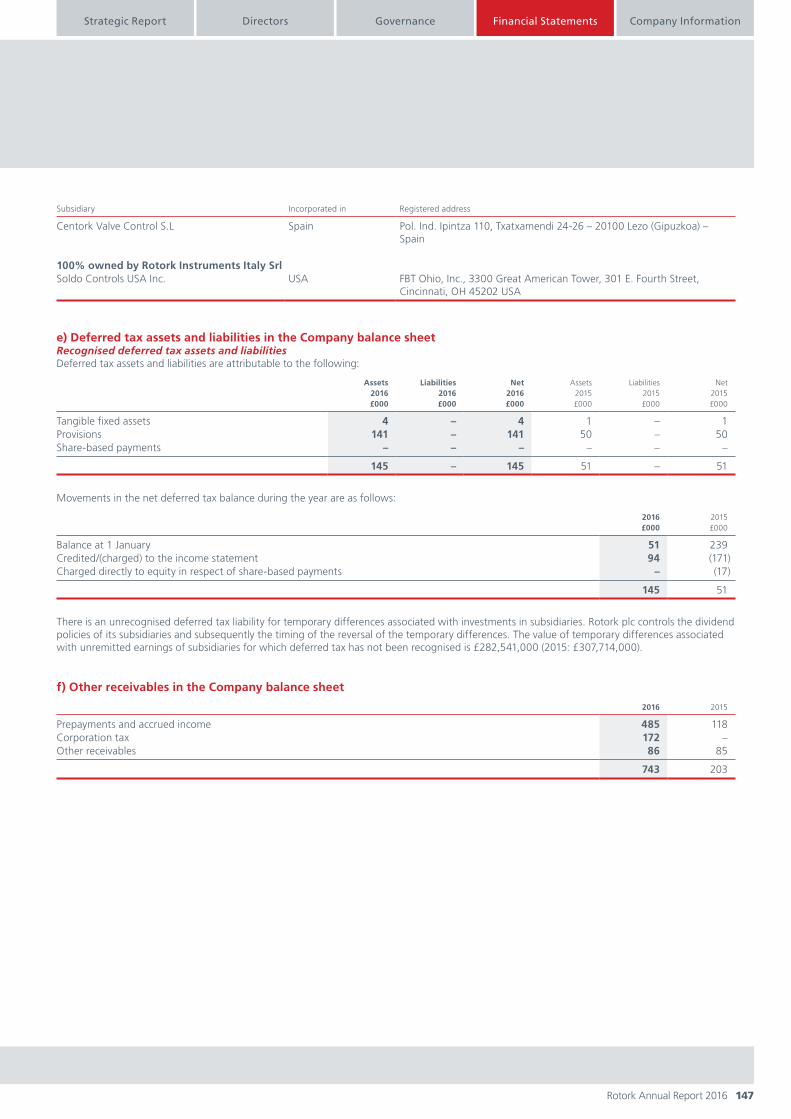
Company InformationDirectorsStrategic Report
147Rotork Annual Report 2016
Financial StatementsGovernance
Subsidiary Incorporated in Registered address
Centork Valve Control S.L Spain Pol. Ind. Ipintza 110, Txatxamendi 24-26 – 20100 Lezo (Gipuzkoa) – Spain
100% owned by Rotork Instruments Italy SrlSoldo Controls USA Inc. USA FBT Ohio, Inc., 3300 Great American Tower, 301 E. Fourth Street,
Cincinnati, OH 45202 USA
e) Deferred tax assets and liabilities in the Company balance sheetRecognised deferred tax assets and liabilitiesDeferred tax assets and liabilities are attributable to the following:
Assets2016£000
Liabilities2016£000
Net2016£000
Assets2015£000
Liabilities2015£000
Net2015£000
Tangible fixed assets 4 – 4 1 – 1Provisions 141 – 141 50 – 50Share-based payments – – – – – –
145 – 145 51 – 51
Movements in the net deferred tax balance during the year are as follows:
2016£000
2015£000
Balance at 1 January 51 239Credited/(charged) to the income statement 94 (171)Charged directly to equity in respect of share-based payments – (17)
145 51
There is an unrecognised deferred tax liability for temporary differences associated with investments in subsidiaries. Rotork plc controls the dividend policies of its subsidiaries and subsequently the timing of the reversal of the temporary differences. The value of temporary differences associated with unremitted earnings of subsidiaries for which deferred tax has not been recognised is £282,541,000 (2015: £307,714,000).
f) Other receivables in the Company balance sheet
2016 2015
Prepayments and accrued income 485 118Corporation tax 172 –Other receivables 86 85
743 203

Rotork Annual Report 2016148
g) Other payables in the Company balance sheet
2016 2015
Other taxes and social security 52 42Corporation tax – 447Other payables 1,455 973Accruals and deferred income 1,142 1,401
2,649 2,863
The Company has a £25,000,000 gross overdraft facility (2015: £25,000,000) and is part of a UK banking arrangement, see note h.
h) Contingencies in the CompanyThe UK banking arrangements are subject to cross-guarantees between the Company and its UK subsidiaries. These accounts are subject to a right of set-off. The performance guarantees and indemnities have been entered into in the normal course of business. A liability would only arise in the event of the Group failing to fulfil its contractual obligations.
During 2016 the Company extended its £20,000,000 committed 364 day facility to August 2017 at LIBOR +0.35%. In addition to this facility the Company also has a £90,000,000 term facility which matures in August 2018 and a £60,000,000 Revolving Credit Facility which matures in August 2020. These facilities are available to the Company, Rotork Controls Limited and Rotork Overseas Limited. At year end £115,500,000 of the committed facilities were drawn, resulting in £54,500,000 being available.
i) Capital and reserves in the Company balance sheetDetails of the number of ordinary shares in issue and dividends paid in the year are given in note 17 to the Group financial statements.
NOTES TO THE COMPANY FINANCIAL STATEMENTS continuedFor the year ended 31 December 2016

DirectorsStrategic Report
149Rotork Annual Report 2016
Governance Company InformationFinancial Statements
2016£000
2015£000
2014£000
2013£000
2012£000
2011£000
2010£000
2009£000
2008£000
2007£000
Revenue 590,078 546,459 594,739 578,440 511,747 447,833 380,560 353,521 320,207 235,688 Cost of sales (328,410) (296,944) (309,280) (304,066) (272,199) (236,359) (199,742) (187,600) (176,046) (127,748)
Gross profit 261,668 249,515 285,459 274,374 239,548 211,474 180,818 165,921 144,161 107,940 Overheads (167,891) (145,129) (143,232) (135,109) (115,081) (99,474) (83,094) (74,384) (69,272) (52,553)
Operating profit 93,777 104,386 142,227 139,265 124,467 112,000 97,724 91,537 74,889 55,387 Adjusted* operating
profit 120,588 125,272 157,167 151,412 131,866 115,921 99,442 92,103 76,014 55,461Amortisation of
acquired intangible assets (26,811) (20,886) (14,940) (12,147) (7,399) (3,921) (1,718) (1,153) (1,125) (74)
Disposal of property – – – – – – – 587 – –
Operating profit 93,777 104,386 142,227 139,265 124,467 112,000 97,724 91,537 74,889 55,387 Net interest (2,707) (2,517) (1,062) (1,268) (273) 550 131 (621) 862 1,866
Profit before taxation 91,070 101,869 141,165 137,997 124,194 112,550 97,855 90,916 75,751 57,253Tax expense (23,897) (27,012) (37,963) (38,488) (34,879) (32,149) (28,334) (26,884) (22,331) (17,957)
Profit for the year 67,173 74,857 103,202 99,509 89,315 80,401 69,521 64,032 53,420 39,296
Dividends 43,876 43,765 42,702 38,735 33,924 49,534 35,912 24,102 29,970 24,732 Basic EPS 7.7p 8.6p 11.9p 11.5p 10.3p 9.3p 8.1p 7.4p 6.2p 4.6pAdjusted* EPS 10.0p 10.4p 13.2p 12.5p 10.9p 9.6p 8.2p 7.5p 6.3p 4.6pDiluted EPS 7.7p 8.6p 11.9p 11.4p 10.3p 9.3p 8.0p 7.4p 6.2p 4.5p
* Adjusted is before the amortisation of acquired intangible assets and the disposal of property.
TEN YEAR TRADING HISTORY

Rotork Annual Report 2016150
SHARE REGISTER INFORMATION
The tables below show the split of shareholder and size of shareholding in Rotork plc.
Ordinary shareholder by typeNumber of
holdings %Number of
shares %
Individuals 2,363 74.0 25,096,671 2.9Bank or nominees 772 24.2 833,358,986 95.8Other company 35 1.1 807,256 0.1Other corporate body 24 0.7 10,800,217 1.2
3,194 100.0 870,063,130 100.0
RangeNumber of
holdings %Number of
shares %
1-1,000 727 22.8 354,125 0.11,001-2,000 356 11.2 528,763 0.12,001-5,000 630 19.7 2,086,439 0.25,001-10,000 401 12.5 2,947,107 0.310,001-50,000 600 18.8 13,636,134 1.550,001-100,000 130 4.1 9,333,716 1.1100,001 + 350 10.9 841,176,846 96.7
3,194 100.0 870,063,130 100.0
Source: Equiniti
Dividend informationThe table below details the amounts of interim, final and additional dividends declared in respect of each of the last five years.
Interim dividend
(p)
Finaldividend
(p)
Totaldividends
(p)
2016 1.95 3.15 5.102015 1.95 3.10 5.052014* 1.92 3.09 5.012013* 1.81 3.00 4.812012* 1.64 2.66 4.30
* Restated to reflect subdivision of 5p ordinary shares into 0.5p ordinary shares.
Financial calendar27 February 2017 Preliminary announcement of annual results for 20166 April 2017 Ex-dividend date for final proposed 2016 dividend7 April 2017 Record date for final proposed 2016 dividend28 April 2017 Announcement of trading update28 April 2017 Annual General Meeting held at Rotork House, Brassmill Lane, Bath, BA1 3JQ8 August 2017 Announcement of interim financial results for 201723 November 2017 Announcement of trading update

DirectorsStrategic Report
151Rotork Annual Report 2016
Governance Company InformationFinancial Statements
CORPORATE DIRECTORY
Company SecretaryStephen Rhys Jones
Registered OfficeRotork plcRotork HouseBrassmill LaneBath BA1 3JQ
Company Number00578327
RegistrarsEquinitiAspect HouseSpencer RoadLancingWest Sussex BN99 6DA
StockbrokersUBS Investment Bank1 Finsbury AvenueLondon EC2M 2PP
Citigroup Global Markets LtdCitigroup Centre33 Canada SquareLondon E14 5LB
Financial AdvisersUBS Investment Bank1 Finsbury AvenueLondon EC2M 2PP
Citigroup Global Markets LtdCitigroup Centre33 Canada SquareLondon E14 5LB
AuditorsDeloitte LLP2 New Street SquareLondon EC4A 3BZ
Financial Public RelationsFTI Consulting200 AldersgateAldersgate StreetLondon EC1A 4HD
SolicitorsMessrs. Osborne ClarkeNo.2 Temple Back EastTemple QuayBristol BS1 6EG


Brassmill Lane, Bath BA1 3JQ, UKT: +44 1225 733200 F: +44 1225 333467
www.rotork.com