Embed Size (px)
Citation preview

Yearly Snapshot of
Foreign Trade:
FY 2019-20 & FY 2020-21
DGCI&S, Kolkata, Ministry of Commerce & Industry
Commercial Intelligence (CI) Division
FY-2020-2021

I. Snapshot of Indian Exports and Imports (Value in Billion USD) by 2- digit ITC-HS Commodity Codes
Table 1: Top 15 ITC-HS Codes comprising India’s Exports in FY 2020-2021
HS Code
(2-digit) Name of the Commodities
Export Value
(Bn USD)
in 2020-21
Export
Share (%)
in 2020-21
27 Mineral fuels, oils, distillation products, etc 26.88 9.23
71 Pearls, precious stones, metals, coins, etc 26.16 8.98
30 Pharmaceutical products 19.38 6.66
84 Nuclear reactors, boilers, machinery, etc 18.95 6.51
29 Organic chemicals 17.95 6.17
85 Electrical, electronic equipment 14.21 4.88
87 Vehicles other than railway, tramway 13.64 4.68
72 Iron and steel 12.12 4.16
10 Cereals 10.06 3.46
39 Plastics and articles thereof 6.87 2.36
73 Articles of iron or steel 6.59 2.26
61 Articles of apparel, accessories, knit or crochet 6.35 2.18
52 Cotton 6.32 2.17
62 Articles of apparel, accessories, not knit or crochet 5.94 2.04
76 Aluminium and articles thereof 5.77 1.98
Others 93.96 32.27
Total Export Value (Billion USD) 291.16 100
From the Table 1 and Figure 1, it is found that HS Codes 27 (Mineral Fuels, Oils, Waxes),
71(Pearls/Semi-Precious Stones), and 30 (Pharmaceutical products) represented the top 3 HS
Codes in India’s exports to the world in FY 2020-2021, accounting for about 25% share of the
export-value in FY 2020-2021.
9% 9%7% 7% 6% 5% 5% 4% 3% 2% 2% 2% 2% 2% 2%
32%
0%
10%
20%
30%
40%
50%
Min
eral
fu
els
, oils
,d
isti
llati
on
pro
du
cts,
etc
Pea
rls,
pre
cio
us
sto
nes
,m
etal
s, c
oin
s, e
tc
Nu
clea
r re
acto
rs, b
oile
rs,
mac
hin
ery
, etc
Org
anic
ch
em
ical
s
Veh
icle
s o
the
r th
an r
ailw
ay,
tram
way
Ph
arm
ace
uti
cal p
rod
uct
s
Ele
ctri
cal,
ele
ctro
nic
equ
ipm
ent
Iro
n a
nd
ste
el
Art
icle
s o
f ap
par
el,
acce
sso
rie
s, n
ot
knit
or…
Art
icle
s o
f ap
par
el,
acce
sso
rie
s, k
nit
or
cro
chet
Art
icle
s o
f ir
on
or
stee
l
Pla
stic
s an
d a
rtic
les
the
reo
f
Ce
real
s
Fis
h, c
rust
acea
ns,
mo
llusc
s,aq
uat
ic in
vert
ebra
tes
ne
s
Co
tto
n
Oth
ers
Figure 1: 15 Major Components of India's Exports in FY2020-21(%)

Table 2: Top 15 ITC-HS Codes comprising India’s Imports in FY 2020-2021
HS Code
(2-digit) Name of the Commodities
Import Value
(Bn USD)
in 2020-21
Import
Share (%)
in 20120-21
27 Mineral fuels, oils, distillation products, etc 99.66 25.32
71 Pearls, precious stones, metals, coins, etc 55.20 14.02
85 Electrical, electronic equipment 46.69 11.86
84 Nuclear reactors, boilers, machinery, etc 37.03 9.41
29 Organic chemicals 19.69 5.00
39 Plastics and articles thereof 13.31 3.38
15 Animal, vegetable fats and oils, cleavage products, etc 11.30 2.87
90 Optical, photo, technical, medical, etc apparatus 8.57 2.18
72 Iron and steel 8.28 2.10
28 Inorganic chemicals, precious metal compound, isotopes 6.88 1.75
31 Fertilizers 6.87 1.75
38 Miscellaneous chemical products 6.11 1.55
88 Aircraft, spacecraft, and parts thereof 4.97 1.26
74 Copper and articles thereof 4.62 1.17
87 Vehicles other than railway, tramway 4.62 1.17
Others 59.80 15.19
Total Import Value (Billion USD) 393.61 100.00
From the Table 2 and Figure 2, it is found that HS Codes 27 (Mineral Fuels, Oils, Waxes),
71(Pearls/Semi-Precious Stones), and 85 (Electrical, electronic equipment) represented the top
3 HS Codes in India’s imports to the world in FY 2020-2021, accounting for about 51% share of
the export-value in FY 2020-2021.
0% 5% 10% 15% 20% 25% 30%
Mineral fuels, oils, distillation products, etc
Pearls, precious stones, metals, coins, etc
Electrical, electronic equipment
Nuclear reactors, boilers, machinery, etc
Organic chemicals
Plastics and articles thereof
Animal,vegetable fats and oils, cleavage products, etc
Optical, photo, technical, medical, etc apparatus
Iron and steel
Inorganic chemicals, precious metal compound,…
Fertilizers
Miscellaneous chemical products
Aircraft, spacecraft, and parts thereof
Copper and articles thereof
Vehicles other than railway, tramway
Others
Figure 2: 15 Major Components of India's Imports in FY 2020 - 21 (%)
II. Snapshot of Indian Exports and Imports (Value in Billion USD) by Countries
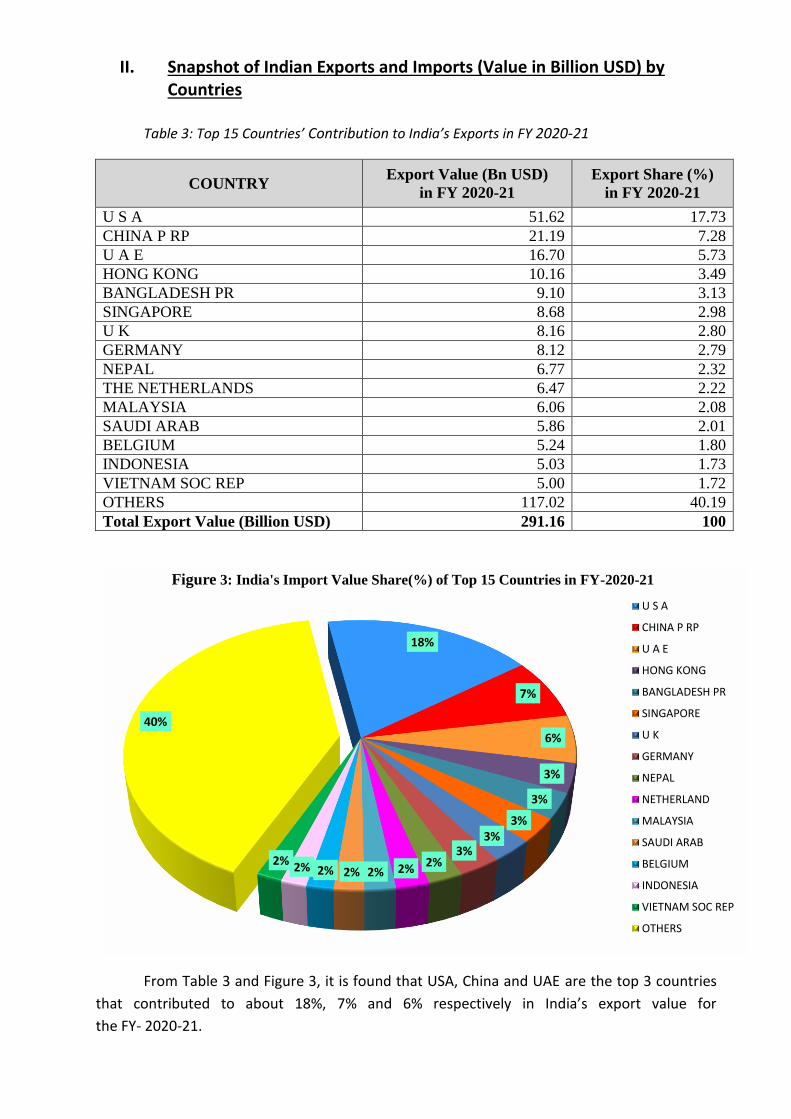
Table 3: Top 15 Countries’ Contribution to India’s Exports in FY 2020-21
COUNTRY Export Value (Bn USD)
in FY 2020-21
Export Share (%)
in FY 2020-21
U S A 51.62 17.73
CHINA P RP 21.19 7.28
U A E 16.70 5.73
HONG KONG 10.16 3.49
BANGLADESH PR 9.10 3.13
SINGAPORE 8.68 2.98
U K 8.16 2.80
GERMANY 8.12 2.79
NEPAL 6.77 2.32
THE NETHERLANDS 6.47 2.22
MALAYSIA 6.06 2.08
SAUDI ARAB 5.86 2.01
BELGIUM 5.24 1.80
INDONESIA 5.03 1.73
VIETNAM SOC REP 5.00 1.72
OTHERS 117.02 40.19
Total Export Value (Billion USD) 291.16 100
From Table 3 and Figure 3, it is found that USA, China and UAE are the top 3 countries
that contributed to about 18%, 7% and 6% respectively in India’s export value for
the FY- 2020-21.
18%
7%
6%
3%
3%
3%3%
3%2%2%2%2%2%2%2%
40%
Figure 3: India's Import Value Share(%) of Top 15 Countries in FY-2020-21
U S A
CHINA P RP
U A E
HONG KONG
BANGLADESH PR
SINGAPORE
U K
GERMANY
NEPAL
NETHERLAND
MALAYSIA
SAUDI ARAB
BELGIUM
INDONESIA
VIETNAM SOC REP
OTHERS

Table 4: Top 15 Countries’ Contribution to India’s Imports in FY - 2020-21
COUNTRY Import Value (Bn USD)
in FY 2020-21
Import Share (%)
in FY 2020-21
CHINA P RP 65.21 16.57
U S A 28.88 7.34
U A E 26.62 6.76
SWITZERLAND 18.23 4.63
SAUDI ARAB 16.19 4.11
HONG KONG 15.17 3.85
IRAQ 14.29 3.63
SINGAPORE 13.30 3.38
GERMANY 13.06 3.32
KOREA RP 12.77 3.25
INDONESIA 12.47 3.17
JAPAN 10.92 2.78
MALAYSIA 8.39 2.13
AUSTRALIA 8.25 2.10
QATAR 7.93 2.01
OTHERS 121.92 30.97
Total Import Value (Billion USD) 393.61 100.00
From Table 4 and Figure 4, it is seen that China, UAE and Switzerland are the top 3
countries that contributed to about 17%, 7% and 7% respectively in India’s import value for the
FY 2020-21.
17%
7%
7%
5% 4%4%
4%
3%
3%
3%
3%
3%
2%
2%
2%
31%
Figure 4: India's Import Value Share(%) of Top 15 Countries in FY-2020-21
CHINA P RP
U S A
U A E
SWITZERLAND
SAUDI ARAB
HONG KONG
IRAQ
SINGAPORE
GERMANY
KOREA RP
INDONESIA
JAPAN
MALAYSIA
AUSTRALIA
QATAR
OTHERS

III. Snapshot of Indian Exports and Imports (Value in Billion USD) by Port-wise trade values
Table 5 and 6 shows the share of the ports in terms of largest contributions to Indian
exports and imports. NavaSheva Sea, Mundra and DPCC Mumbai are the top ports through
which Indian exports took place in FY - 2020-21. For imports in the same FY - 2020-21, the
ports, namely, NavaSheva Sea, Delhi Air and Chennai Sea were the major contributors.
Table 5: Top 15 Ports’ Share in India’s Exports in FY 2019-2020 & FY 2020-21 (with Total
Export Value at 27.18Bn USD)
Table 6: Top 15 Ports’ Share in India’s Imports in FY 2019-2020 & FY 2020-21 (with Total
Import Value at 42.58Bn USD)
PORT FY-2020-21 Export Value (Bn USD) Export Share (%)
NHAVA SHEVA SEA 45.84 15.74
MUNDRA 19.79 6.80
DPCC MUMBAI 16.61 5.70
CHENNAI SEA 11.89 4.08
SEZ Jamnagar (Reliance) 11.38 3.91
DELHI AIR 8.90 3.06
MUMBAI AIR 7.95 2.73
VISAKHAPATNAM SEA 7.36 2.53
SIKKA 7.30 2.51
KOLKATA SEA 6.28 2.16
TUTICORIN SEA 5.97 2.05
HAZIRA PORT, SURAT 5.42 1.86
KANDLA SEA 4.38 1.50
HYDERABAD AIRPORT 4.32 1.48
PARADIP SEA 4.15 1.43
OTHERS 123.64 42.46
TOTAL EXPORT VALUE (BILLION USD) 291.16 100.00
Trade Value (Bn USD) Mar-20 Mar-21 YoY Change (%)
Export 21.49 34.71 61.52%
Import 31.47 48.41 53.83%PORT FY-2020-21 Import Value (Bn USD) Export Share (%)
NHAVA SHEVA SEA 46.18 11.73
DELHI AIR 37.97 9.65
CHENNAI SEA 24.41 6.20
MUNDRA 17.49 4.44
SRI City Pvt Ltd 14.45 3.67
MUMBAI AIR 14.21 3.61
CHENNAI AIR 13.08 3.32
PARADIP SEA 11.80 3.00
KOLKATA SEA 11.64 2.96
SIKKA 11.62 2.95
KANDLA SEA 10.78 2.74
MUMBAI SEA 10.73 2.73
SEZ Jamnagar (Reliance) 10.32 2.62
VADINAR 10.22 2.60
VISAKHAPATNAM SEA 8.69 2.21
OTHER 140.03 35.57
TOTAL IMPORT VALUE (BILLION USD) 393.61 100

IV. Year-on-Year Comparison of Indian Exports and Imports by
Commodity and Country
The YoY Growth (%) in Trade Values (in Bn USD) for 2020-21 is shown below. Both
exports and imports have fallen from FY 2020 - 2019 to FY 2020 - 21, with imports dropping by
about -17% and exports by -7%.
Table 7: YoY Growth (%) in Export Value (Bn USD) between FY 2019-2020 & FY 2020-21,
Commodity Wise
From Table 7, in exports, HS 10 (Cereals), HS 72 (Iron and steel), HS 30 (Pharmaceutical products) HS 10 (Cereals), HS 76 (Aluminium and articles thereof), HS 52 (Cotton) and HS 29 (Organic chemicals) registered increasing YoY growth.
The following HS code listed declining YoY growth, such as HS 39 (Plastics and articles thereof), HS 73 (Articles of iron or steel), HS 85 (Electrical, electronic equipment, HS 84 (Nuclear reactors, boilers, machinery, etc), HS 61 (Articles of apparel, accessories, knit or crochet), HS 87 (Vehicles other than railway, tramway), HS 62 (Articles of apparel, accessories, not knit or crochet), HS 71 ( Pearls, precious stones, metals, coins, etc) and HS 27 (Mineral fuels, oils, distillation products, etc)
Trade Value (Bn USD) FY - 2019-20 FY - 2020-21 YoY change (%)
Export 313.36 291.16 -7.08
Import 474.71 393.61 -17.08
HS Code
(2-digit)Name of the Commodities
Export Value
(Bn USD)
in 2020-21
Export Value
(Bn USD)
in 2019-20
YoY change %
27 Mineral fuels, oils, distillation products, etc 26.88 42.71 -37.06
71 Pearls, precious stones, metals, coins, etc 26.16 36.09 -27.50
30 Pharmaceutical products 19.38 16.29 19.00
84 Nuclear reactors, boilers, machinery, etc 18.95 20.84 -9.06
29 Organic chemicals 17.95 17.49 2.65
85 Electrical, electronic equipment 14.21 15.19 -6.42
87 Vehicles other than railway, tramway 13.64 16.71 -18.40
72 Iron and steel 12.12 9.28 30.69
10 Cereals 10.06 6.67 50.83
39 Plastics and articles thereof 6.87 6.92 -0.68
73 Articles of iron or steel 6.59 7.03 -6.27
61 Articles of apparel, accessories, knit or crochet 6.35 7.51 -15.53
52 Cotton 6.32 5.74 10.10
62 Articles of apparel, accessories, not knit or crochet 5.94 7.99 -25.68
76 Aluminium and articles thereof 5.77 5.09 13.35

Table 8: YoY Growth (%) in Import Value (Bn USD) between FY 2019-2020 and FY 2020-21,
Commodity Wise
From Table 8, it is seen that imports have risen significantly in FY 2019-2020 over
FY 2020-2021 for commodities such as HS 15 (Animal, vegetable fats and oils, cleavage
products, etc), HS 38 (Miscellaneous chemical products), HS 28 (Inorganic chemicals, precious
metal compound, isotopes), HS 31 (Fertilizers), HS 71 (Pearls, precious stones, metals, coins,
etc) and HS 29 (Organic chemicals).
The imports decreased significantly in FY 2019-2020 over FY 2020-2021 for
commodities such as HS 85 (Electrical, electronic equipment), HS 39 (Plastics and articles
thereof), HS 90 (Optical, photo, technical, medical, etc apparatus), HS 74 (Copper and articles
thereof), HS 87 (Vehicles other than railway, tramway), HS 84 (Nuclear reactors, boilers,
machinery, etc), HS 72 (Iron and steel), HS 27 (Mineral fuels, oils, distillation products, etc) and
HS 88 (Aircraft, spacecraft, and parts thereof).

Table 9: YoY Growth (%) in Export Value (Bn USD) between FY 2019-2020 and FY 2020-21,
Country Wise
The export performance during pandemic registered decline for USA, UAE, Hong Kong,
Singapore, UK, Germany, Nepal, Netherlands, Malaysia, Saudi Arab, Belgium and Vietnam, with
YoY export increases for China, Bangladesh and Indonesia around 60%.
Table 10: YoY Growth (%) in Import Value (Bn USD) between FY 2019-2020 and FY 2020-21,
Country Wise
From the preceding panel (tables 9 and 10), it is seen that Indian imports had, across-
the board, dropped for almost all major countries. For, China, Switzerland, Hong Kong, Singapore
& Germany, YoY increases of less than 10% in imports in FY 2019-2020 over FY 2020 -2021 were
noted. U S A, U A E, Korea RP, Indonesia, Japan, Malaysia, Australia & Qatar YoY increases of less
than 20% in imports in FY 2019-2020 over FY 2020 -2021 were noted. Saudi Arab & Iraq, YoY
increases of less than 40% in imports in FY 2019-2020 over FY 2020 -2021 were noted. For
Switzerland, this increase in imports was to the tune of 7.88% (Approximately 8%) from FY -
2019- 2020 to FY - 2020- 2021.
***
COUNTRYExport Value (Bn USD)
in FY 2020-21
Export Value (Bn USD)
in FY 2019-20YoY Change %
U S A 51.62 53.09 -2.76
CHINA P RP 21.19 16.61 27.54
U ARAB EMTS 16.70 28.85 -42.14
HONG KONG 10.16 10.97 -7.34
BANGLADESH PR 9.10 8.20 11.00
SINGAPORE 8.68 8.92 -2.77
U K 8.16 8.74 -6.63
GERMANY 8.12 8.29 -2.00
NEPAL 6.77 7.16 -5.51
NETHERLAND 6.47 8.37 -22.63
MALAYSIA 6.06 6.36 -4.82
SAUDI ARAB 5.86 6.24 -6.10
BELGIUM 5.24 5.81 -9.88
INDONESIA 5.03 4.13 21.72
VIETNAM SOC REP 5.00 5.06 -1.19
OTHERS 117.02 126.56 -7.54
COUNTRYImport Value (Bn USD)
in FY 2020-21
Import Value (Bn USD
in FY 2019-20
CHINA P RP 65.21 65.26 -0.07
U S A 28.88 35.82 -19.38
U ARAB EMTS 26.62 30.26 -12.01
SWITZERLAND 18.23 16.9 7.88 7.88
SAUDI ARAB 16.19 26.86 -39.73
HONG KONG 15.17 16.94 -10.41
IRAQ 14.29 23.74 -39.82
SINGAPORE 13.3 14.75 -9.78
GERMANY 13.06 13.69 -4.58
KOREA RP 12.77 15.66 -18.43
INDONESIA 12.47 15.06 -17.21
JAPAN 10.92 12.43 -12.14
MALAYSIA 8.39 9.78 -14.25
AUSTRALIA 8.25 9.78 -15.69
QATAR 7.93 9.69 -18.13
OTHERS 121.92 158.09 -22.88
YoY Change (%)