Embed Size (px)
Citation preview
8/3/2019 Yearly Analysis of the Repository September 2011
http://slidepdf.com/reader/full/yearly-analysis-of-the-repository-september-2011 1/21
1
Repository onMaternal Child Health in India
Developed and Managed by
National Child Health Resource Centre (NCHRC)National Institute of Health and Family Welfare (NIHFW)
New Delhi

8/3/2019 Yearly Analysis of the Repository September 2011
http://slidepdf.com/reader/full/yearly-analysis-of-the-repository-september-2011 2/21
2
Key Features (1)
Launched in July 2010
Collection & management of 600 resource materials
Free/open access to full text document or resource
material for all usersChild health information focuses on children 0-5 years ,while Maternal health information focuses on theperinatal periodRelevance of information from the public healthperspective

8/3/2019 Yearly Analysis of the Repository September 2011
http://slidepdf.com/reader/full/yearly-analysis-of-the-repository-september-2011 3/21
3
Key Features (2)
Updated information – published from the year 2000onwards
Categorization of information into specific Topics &
ThemesAbstract, Keywords, Source & Year of Publication foreach document along with cover page photograph
Thesaurus (standardized vocabulary) & Link keywords
IEC/BCC Gallery of more than 200 resources

8/3/2019 Yearly Analysis of the Repository September 2011
http://slidepdf.com/reader/full/yearly-analysis-of-the-repository-september-2011 4/21
4
Categorization
TOPICS
• Maternal health• Newborn child health• Immunization• Nutrition•
Diseases• General information
Each topic divided intoTHEME
Policies, programs,guidelinesTechnical publicationTrainings
Statistical informationScientific articleIEC/BCC Gallery

8/3/2019 Yearly Analysis of the Repository September 2011
http://slidepdf.com/reader/full/yearly-analysis-of-the-repository-september-2011 5/21
5www.childhealthindiainfo.com / www.childhealthindia.info
8/3/2019 Yearly Analysis of the Repository September 2011
http://slidepdf.com/reader/full/yearly-analysis-of-the-repository-september-2011 6/21
6
Aim
To find the trends of accessibility by type of visitors,location, timing
To find the trends of utilization of information in therepository

8/3/2019 Yearly Analysis of the Repository September 2011
http://slidepdf.com/reader/full/yearly-analysis-of-the-repository-september-2011 7/217
Methodology
• Secondary data analysis• Data was extracted from Google analytics data source• For the time period of July 2010 to June 2011.• Monthly & quarterly categorization of data
8/3/2019 Yearly Analysis of the Repository September 2011
http://slidepdf.com/reader/full/yearly-analysis-of-the-repository-september-2011 8/218
Indicators• Total no. of visits to the site.• No. of absolute unique visitors.• Average time spent on the site.•
Bounce rate• Sources of traffic• Visitors by country•
Visitors by cities in India
8/3/2019 Yearly Analysis of the Repository September 2011
http://slidepdf.com/reader/full/yearly-analysis-of-the-repository-september-2011 9/219
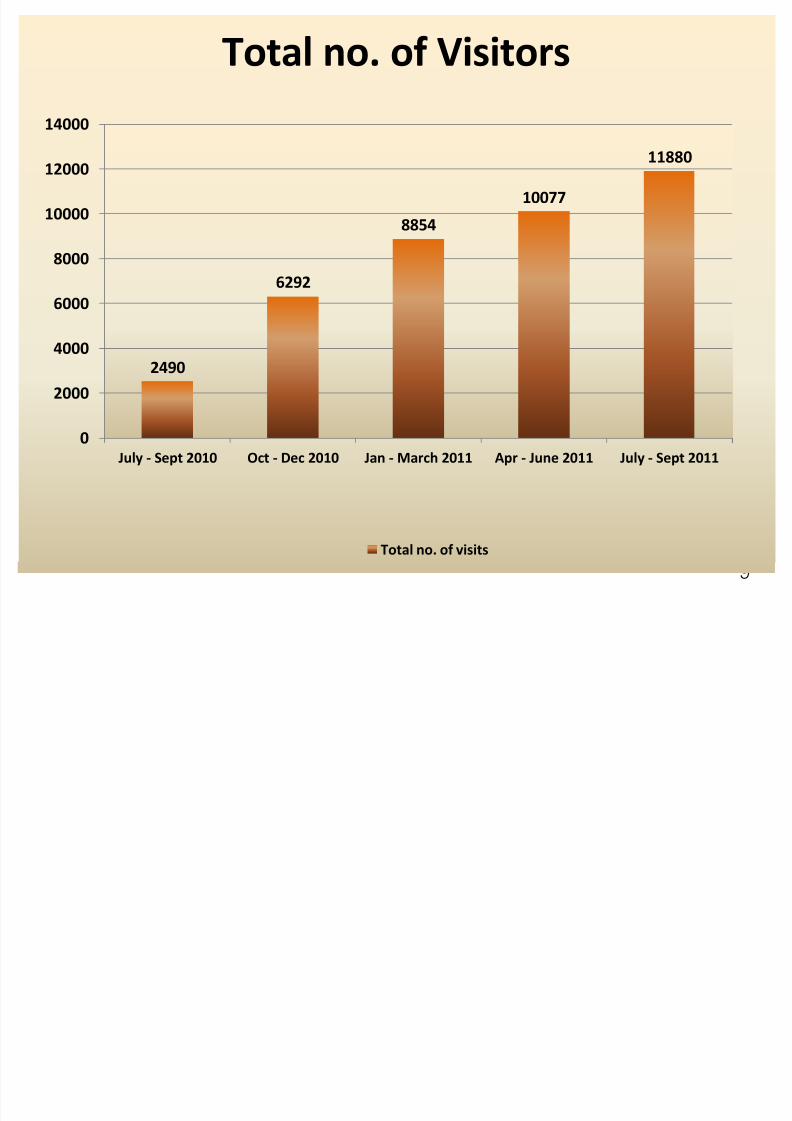
2490
6292
8854
10077
11880
0
2000
4000
6000
8000
10000
12000
14000
July - Sept 2010 Oct - Dec 2010 Jan - March 2011 Apr - June 2011 July - Sept 2011
Total no. of Visitors
Total no. of visits

8/3/2019 Yearly Analysis of the Repository September 2011
http://slidepdf.com/reader/full/yearly-analysis-of-the-repository-september-2011 10/2110
0
1000
2000
3000
4000
5000
6000
7000
8000
9000
10000
July - Sept
2010
Oct - Dec
2010
Jan - March
2011
Apr - June
2011
July - Sept
2011
Number of Unique visitors
Unique visitors

8/3/2019 Yearly Analysis of the Repository September 2011
http://slidepdf.com/reader/full/yearly-analysis-of-the-repository-september-2011 11/2111
0
1
2
3
4
5
6
7
July - Sept
2010
Oct - Dec
2010
Jan - March
2011
Apr - June
2011
July - Sept
2011
Av. Time sites (MIN.SEC)
Av. Time sites (MIN.SEC)
8/3/2019 Yearly Analysis of the Repository September 2011
http://slidepdf.com/reader/full/yearly-analysis-of-the-repository-september-2011 12/2112
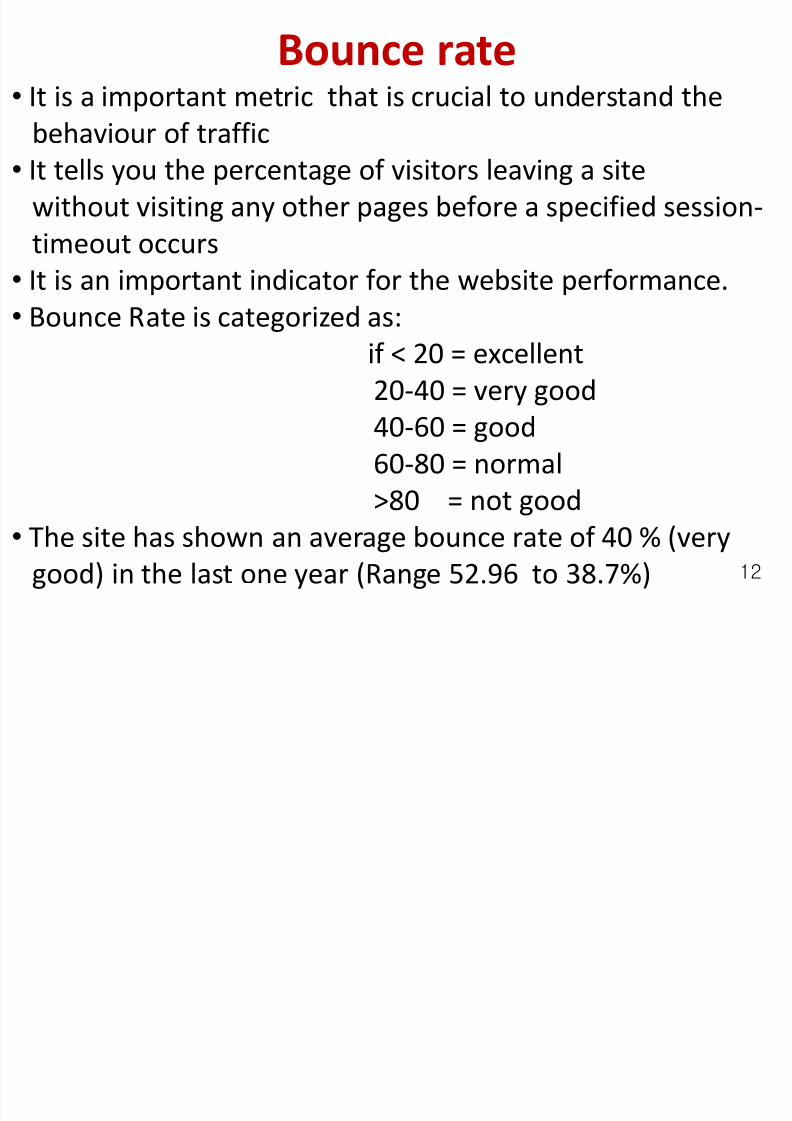
Bounce rate• It is a important metric that is crucial to understand the
behaviour of traffic• It tells you the percentage of visitors leaving a site
without visiting any other pages before a specified session-timeout occurs
• It is an important indicator for the website performance.• Bounce Rate is categorized as:
if < 20 = excellent20-40 = very good40-60 = good60-80 = normal>80 = not good
• The site has shown an average bounce rate of 40 % (verygood) in the last one year (Range 52.96 to 38.7%)
8/3/2019 Yearly Analysis of the Repository September 2011
http://slidepdf.com/reader/full/yearly-analysis-of-the-repository-september-2011 13/2113
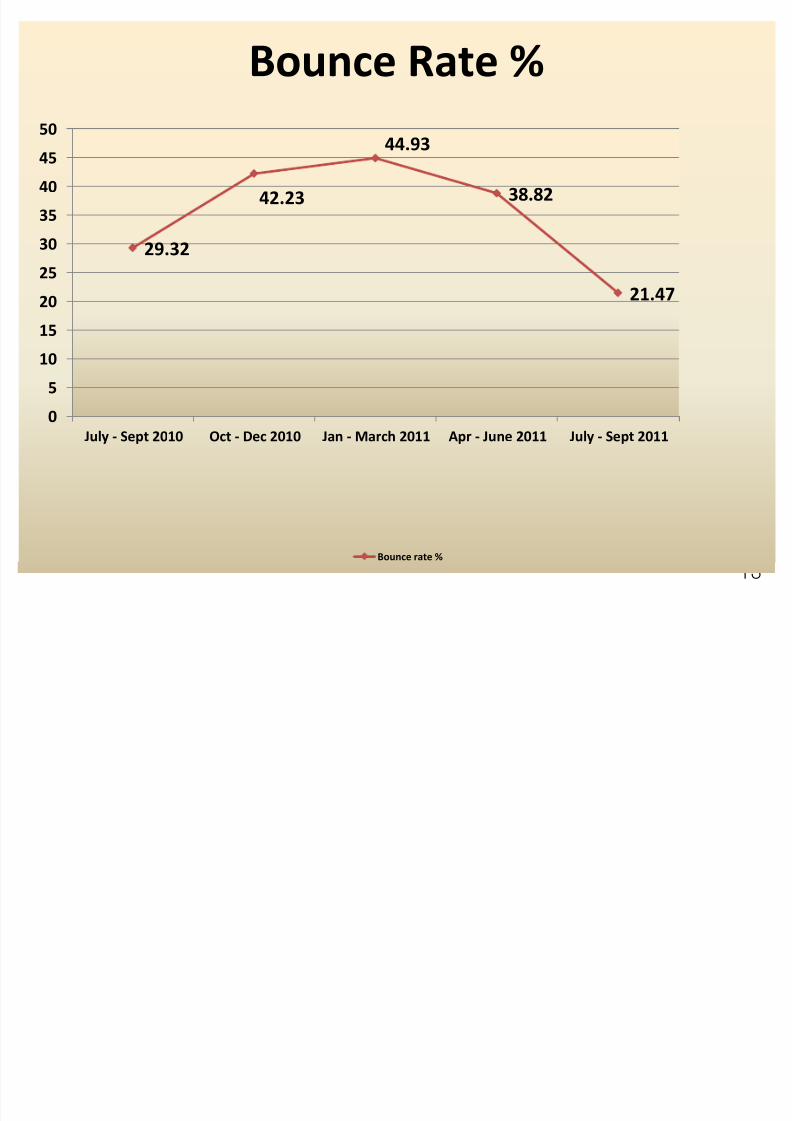
29.32
42.23
44.93
38.82
21.47
0
5
10
15
2025
30
35
40
45
50
July - Sept 2010 Oct - Dec 2010 Jan - March 2011 Apr - June 2011 July - Sept 2011
Bounce Rate %
Bounce rate %

8/3/2019 Yearly Analysis of the Repository September 2011
http://slidepdf.com/reader/full/yearly-analysis-of-the-repository-september-2011 14/21
14
Direct traffic• The visitors who
directly access the
website by usingthe URL. In this itshows a peak of 28% initially thanslowly dropped to
min. of 20%
Referring site• No. of visitors who
access the
repository throughreference of someother sites
Search engine• Visitors who
accessed the site
through somekeywords usingsearch engines likeGoogle, yahoo,bing etc.
The website can be accessed by Direct Traffic mode – anindicator of a very specific search.Referring site – the site viewed by clicking on the links on someother site and through Search Engines – like Google, Bing, andYahoo etc.The website has been accessed by traffic mode by 20% while50% is through search engines and 30% is through referring
sites.

8/3/2019 Yearly Analysis of the Repository September 2011
http://slidepdf.com/reader/full/yearly-analysis-of-the-repository-september-2011 15/21
15
0.00
10.00
20.00
30.00
40.00
50.00
60.00
70.00
quarter 1 quarter 2 quarter3 quarter 4
27.95
17.2 17.520.79
41.9
19.216.0
27.430.1
63.5
66.5
51.8
F i g u r e s i n
%
Direct traffic%
Reffering site%
Searchengine% Months
Sources of Traffic to the site

8/3/2019 Yearly Analysis of the Repository September 2011
http://slidepdf.com/reader/full/yearly-analysis-of-the-repository-september-2011 16/21
16

8/3/2019 Yearly Analysis of the Repository September 2011
http://slidepdf.com/reader/full/yearly-analysis-of-the-repository-september-2011 17/21
17
8/3/2019 Yearly Analysis of the Repository September 2011
http://slidepdf.com/reader/full/yearly-analysis-of-the-repository-september-2011 18/21
18
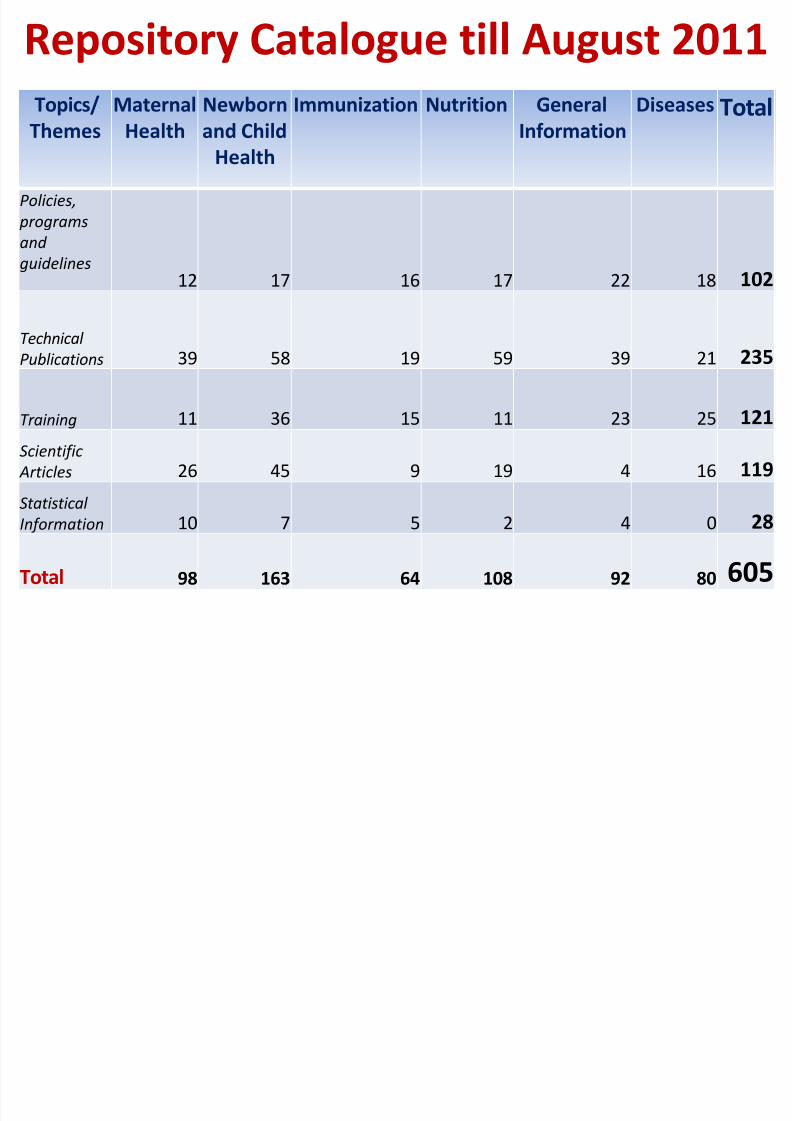
Topics/
Themes
Maternal
Health
Newborn
and ChildHealth
Immunization Nutrition General
Information
Diseases Total
Policies, programsand guidelines
12 17 16 17 22 18 102
Technical Publications 39 58 19 59 39 21 235
Training 11 36 15 11 23 25 121Scientific
Articles 26 45 9 19 4 16 119
Statistical Information 10 7 5 2 4 0 28
Total 98 163 64 108 92 80 605
Repository Catalogue till August 2011

8/3/2019 Yearly Analysis of the Repository September 2011
http://slidepdf.com/reader/full/yearly-analysis-of-the-repository-september-2011 19/21
19
8/3/2019 Yearly Analysis of the Repository September 2011
http://slidepdf.com/reader/full/yearly-analysis-of-the-repository-september-2011 20/21
20

8/3/2019 Yearly Analysis of the Repository September 2011
http://slidepdf.com/reader/full/yearly-analysis-of-the-repository-september-2011 21/21
21
THANK YOU!!!


![MIGRATION PROFILEpublications.jrc.ec.europa.eu/repository/bitstream/... · (2016) BY SECTOR [%] AND YEAR (2013 - 2016) TOTAL ENVIRONMENTAL OTHER N/A NOT AVAILABLE SECURITY Yearly](https://img.pdfslide.us/doc/110x75/5fa351f74b6d617a8979f99f/migration-2016-by-sector-and-year-2013-2016-total-environmental-other.jpg)