Embed Size (px)
Citation preview
Yearbook 2012 Activity Data on Fundraising, Investments and Divestments by
Private Equity and Venture Capital Firms in Europe
9 May, 2012
| Creating lasting value YearBook 2011 | Creating lasting value Yearbook 2012
Acknowledgements and Disclaimer
| 2
Acknowledgements
We are very grateful for the generous support by General Partners representing Private Equity and Venture Capital firms across Europe who are
directly submitting their activity data to our survey. Without their commitment providing comprehensive and verified pan-European statistics
would not be possible.
We also thank all regional and national private equity associations that collect their activity data via PEREP_Analytics, the pan-European statistics
platform, making it the most comprehensive European private equity database: APCRI (Portugal), AVCO (Austria), BVA (Belgium), BVK (Germany),
CVCA (Croatia), CVCA (the Czech Republic), DVCA (Denmark), EstVCA (Estonia), EVCA (Europe), FVCA (Finland), HVCA (Hungary), IVCA (Ireland),
LTVCA (Lithuania), NVCA (Norway), NVP (the Netherlands), PPEA (Poland), SECA (Switzerland), SEEPEA (South Eastern Europe), SLOVCA
(Slovakia), SVCA (Sweden). PEREP has collected data directly from associations’ members and participants in the other countries in Europe.
Version
Presentation as of 9/5/2012
Disclaimer
The information contained in this report has been produced by EVCA, based on PEREP_Analytics data and third parties information. While the
EVCA has made every effort to ensure the reliability of the data included in this report, EVCA can not guarantee the accuracy of the information
collected and presented. Therefore, EVCA cannot accept responsibility for any decision made or action taken based upon this report or the
information provided herein.
Copyright information
No part of this publication may be reproduced by any process except in accordance with the provisions of the Copyright Act 1968. Copyright
enquiries should be directed to EVCA, Tel: + 32 2 715 00 20.
© Copyright EVCA May 2012
| Creating lasting value YearBook 2011 | Creating lasting value Yearbook 2012
Executive Summary
| 3
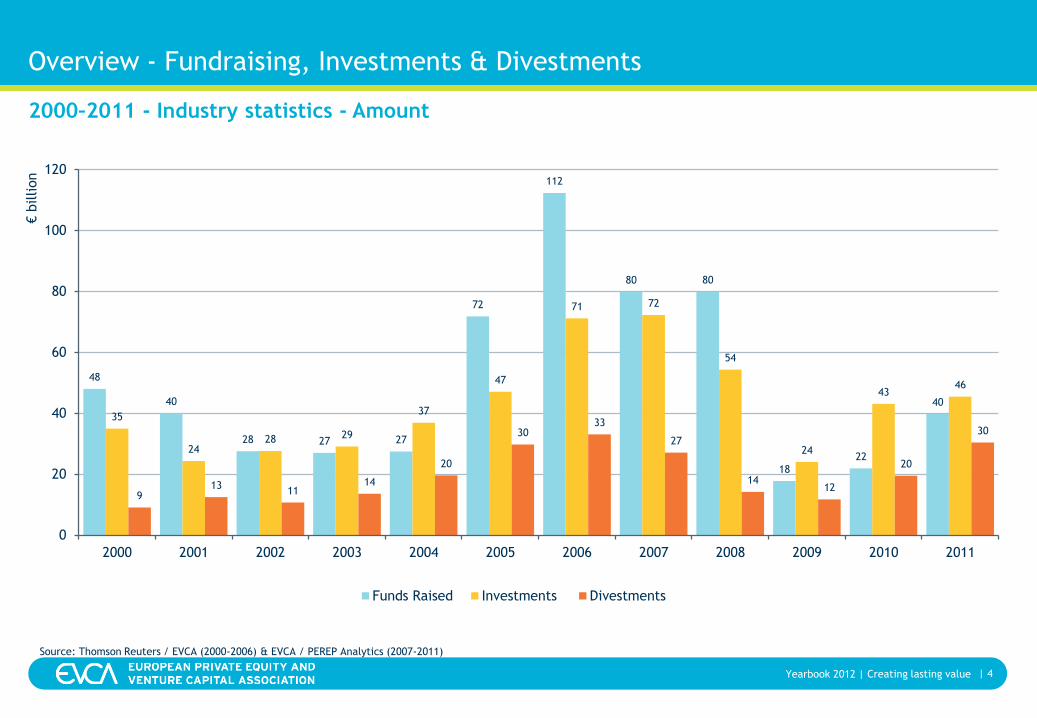
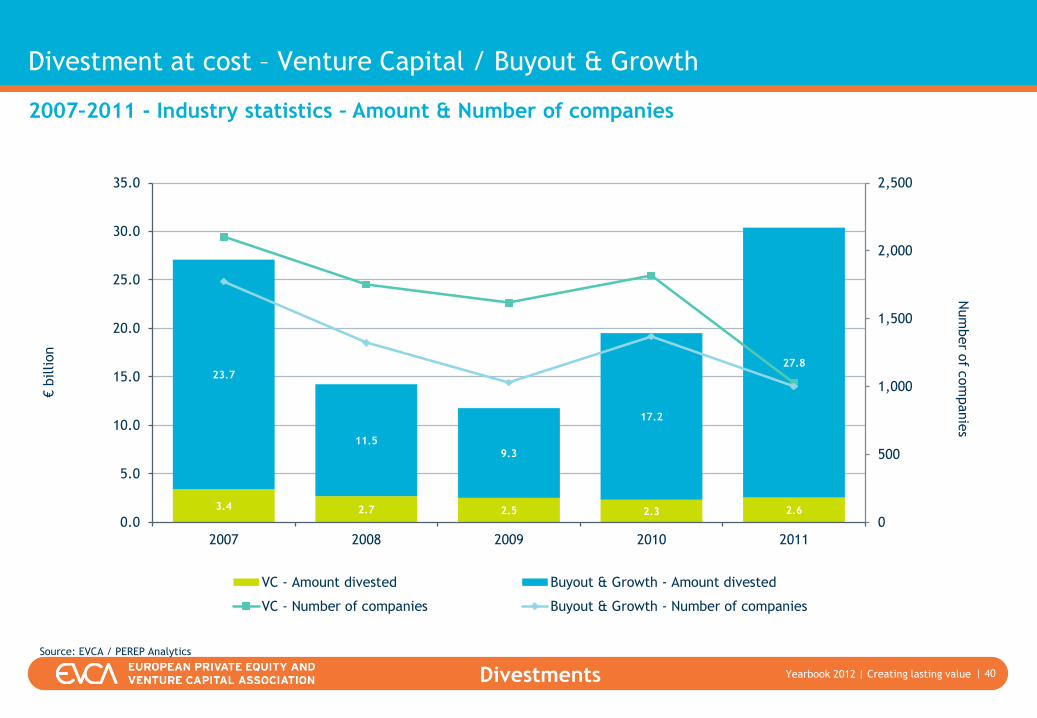
• In 2011 30 bn EUR were divested showing a 50% increase compared to the previous year and almost reaching the 2006 peak. This
increase was triggered by the Buyout & Growth segment which accounted for 92% of the total amount. More than 2000 companies
were divested of which Venture Capital and Buyout & Growth had about an equal share.
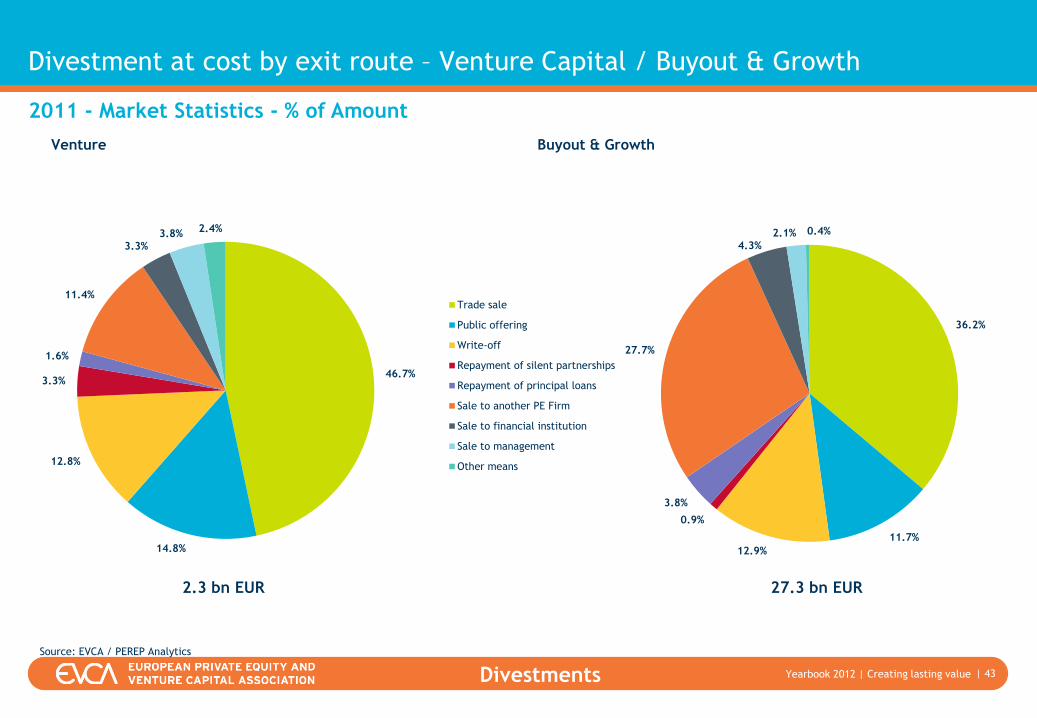
• The most preferred exit routs were Trade sale and Secondary sale, together representing more than 60% of the market in terms of
amount divested.
Fundraising
Investments
Divestments
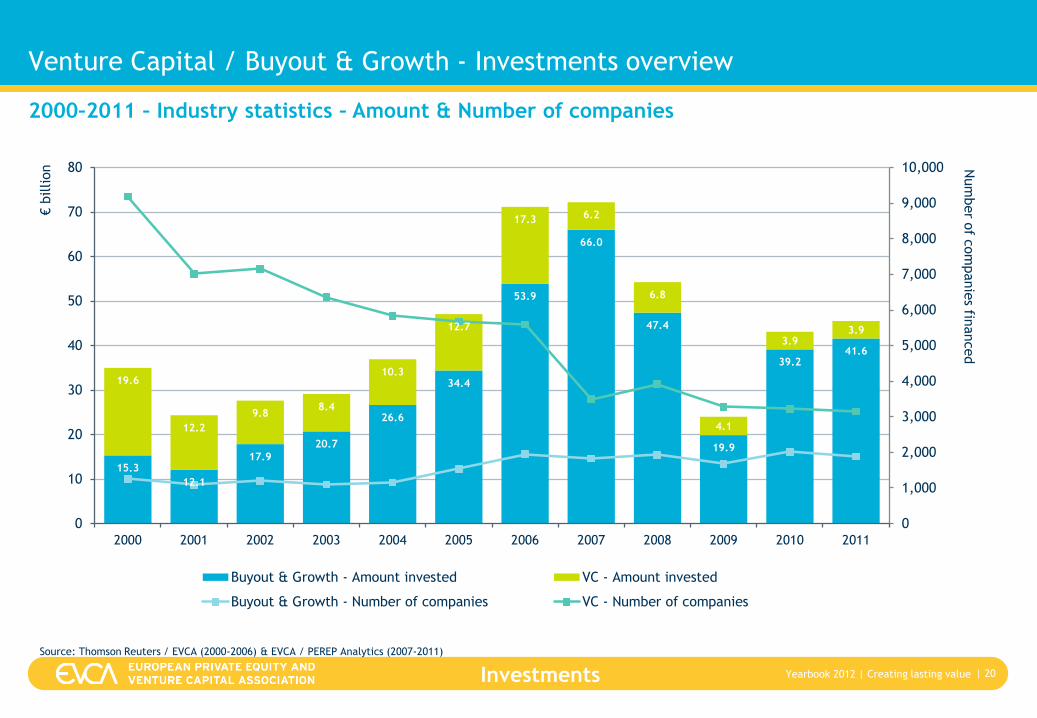
• Investments remained stable at 46 bn EUR showing a 6% increase from 2010. This figure resembles the investment level of 2005.
Buyout & Growth accounted for 91% of the total amount invested.
• In 2011 more than 4,800 companies received investments in Europe out of which SMEs accounted for 85% with an average
investment per company of 3m EUR. More than 60% of these investments were attribute to Venture Capital.
• The three most targeted sectors by number of companies in 2011 were Life sciences, Computer & consumer electronics and
Communications together accounting for 50% of the total. The stage focus split reveals a sector specificity in case of Venture
Capital (Life sciences, Computer & consumer electronics and Communications) and a more homogeneous distribution for Buyout &
Growth.
• In 2011 overall fundraising increased by 80% to 40 bn EUR compared to the previous year, matching 2001 level. VC contributed to
this trend with its 50% increase compared to 2010. The buyout & growth segment almost grew by 100% compared to 2010 and
attributed for 30 bn EUR. More than half of the buyout amount raised came from pension funds, banks and fund of funds.
| Creating lasting value YearBook 2011 | Creating lasting value Yearbook 2012
Overview - Fundraising, Investments & Divestments
| 4
2000–2011 - Industry statistics - Amount
48
40
28 27 27
72
112
80 80
18
22
40
35
2428 29
37
47
71 72
54
24
4346
913
1114
20
3033
27
1412
20
30
0
20
40
60
80
100
120
2000 2001 2002 2003 2004 2005 2006 2007 2008 2009 2010 2011
€billion
Funds Raised Investments Divestments
Source: Thomson Reuters / EVCA (2000-2006) & EVCA / PEREP Analytics (2007-2011)
Fundraising
Fundraising Statistics explained:
• Current direct funds under management monitored are primarily focused on investments in Europe.
• Funds raised are recorded in the country of the advisory team that is raising/managing the fund (“industry
statistics”).
• The funds included in the statistics are: private equity funds making direct private equity investments,
mezzanine private equity funds, co-investment funds, rescue/turnaround funds.
• The following funds are excluded from the statistics: infrastructure funds, real estate funds, distress debt
funds, primary funds-of-funds, secondary funds-of-funds.
| Creating lasting value YearBook 2011 | Creating lasting value Yearbook 2012 Fundraising
Glossary – Fundraising
| 6
Fund stage focus:
• Early-stage fund: A venture capital fund focused on investing in
companies in the early stages of their lives
• Later-stage fund: A venture capital fund focused on investing in
later-stage companies in need of expansion capital
• Balanced fund: A venture capital fund focused on both early-stage
and development, with no particular concentration on either
• Growth fund: Funds whose strategy is to invest in or acquire
relatively mature companies that are looking for capital to expand
or restructure operations
• Buyout fund: A fund whose strategy is to acquire other businesses
• Mezzanine fund: A fund that provides (generally subordinated) debt
to facilitate the financing of buyouts, frequently alongside a right to
some of the equity upside
• Generalist fund: a funds with either a stated focus of investing in
all stages of private equity investment, or with a broad area of
investment activity
Type of investors:
• Corporate investor: Corporations that produce products
(manufacturing companies) or deliver non-financial services
• Endowment: An institution that is bestowed money (and possibly
other assets) via a donation with the stipulation to invest it and use
the gains for specific objectives so that the principal remains intact
• Family office: An office that provides services such as investment
management and other services (accounting, tax and financial
advice etc.) to one or several families
• Foundations: A non-profit organisation through which private wealth
is contributed and distributed for public purpose (most often
charitable purposes)
• Fund of funds: A private equity fund that primarily takes equity
positions in other funds
• Other asset manager: Financial institutions (other than bank,
endowment, family office, foundation, insurance company or
pension fund) managing a pool of capital by investing it across asset
classes with the purpose to generate financial returns
• Government agencies: Country, regional, governmental and
European agencies or institutions for innovation and development
(including structures such as the EBRD or EIF)
• Sovereign wealth funds: state-owned investment fund managing a
pool of money derived from a country's reserves
NB: In the following presentation, unclassified figures concerning the type of
investors have been extrapolated.
Independent and captive funds:
• “Captive funds” refers to funds that are 100% owned by the parent
organisation, while “independent funds” relates to semi-captive
funds (those in which the parent owns less than 100%) as well as
wholly independent funds.
| Creating lasting value YearBook 2011 | Creating lasting value Yearbook 2012 Fundraising
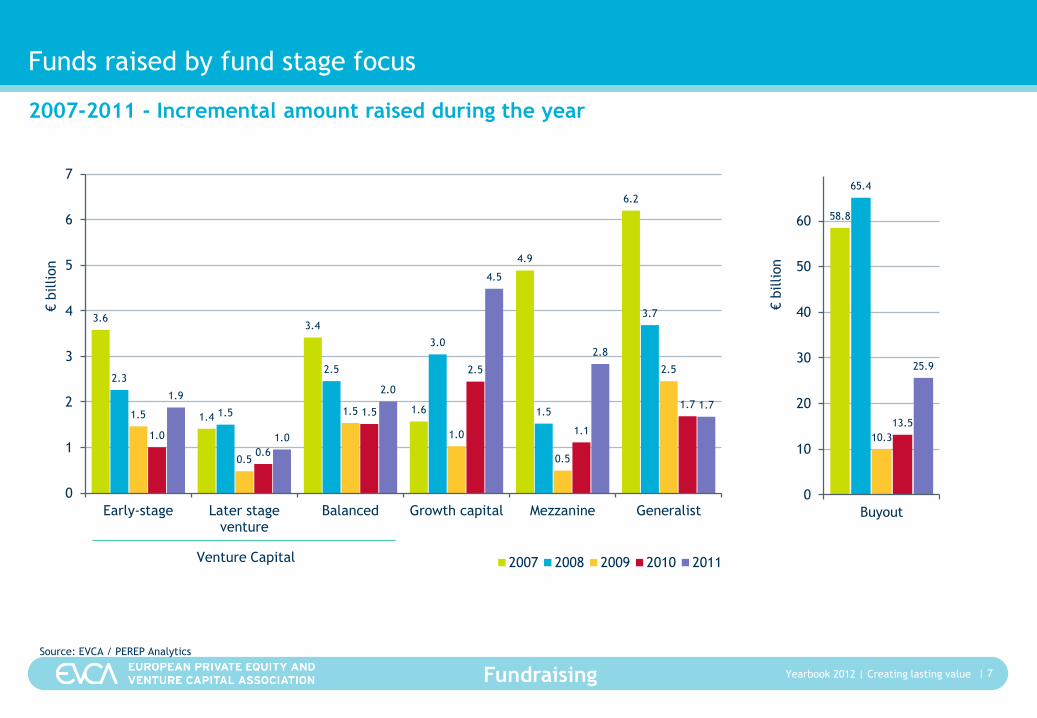
3.6
1.4
3.4
1.6
4.9
6.2
2.3
1.5
2.5
3.0
1.5
3.7
1.5
0.5
1.5
1.0
0.5
2.5
1.0
0.6
1.5
2.5
1.1
1.71.9
1.0
2.0
4.5
2.8
1.7
0
1
2
3
4
5
6
7
Early-stage Later stageventure
Balanced Growth capital Mezzanine Generalist
€billion
2007 2008 2009 2010 2011
Funds raised by fund stage focus
| 7
2007-2011 - Incremental amount raised during the year
Source: EVCA / PEREP Analytics
Venture Capital
58.8
65.4
10.3
13.5
25.9
0
10
20
30
40
50
60
Buyout
€billion
| Creating lasting value YearBook 2011 | Creating lasting value Yearbook 2012 Fundraising
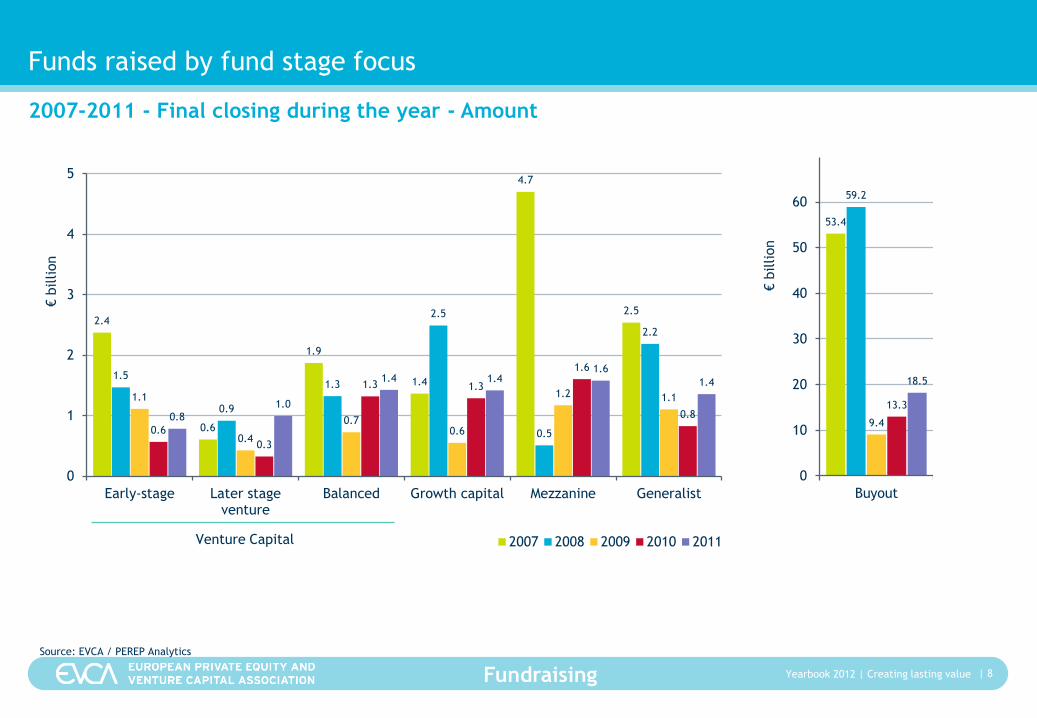
2.4
0.6
1.9
1.4
4.7
2.5
1.5
0.9
1.3
2.5
0.5
2.2
1.1
0.4
0.70.6
1.2 1.1
0.6
0.3
1.3 1.3
1.6
0.80.8
1.0
1.4 1.41.6
1.4
0
1
2
3
4
5
Early-stage Later stageventure
Balanced Growth capital Mezzanine Generalist
€billion
2007 2008 2009 2010 2011
Funds raised by fund stage focus
| 8
Source: EVCA / PEREP Analytics
Venture Capital
2007-2011 - Final closing during the year - Amount
53.4
59.2
9.4
13.3
18.5
0
10
20
30
40
50
60
Buyout
€billion
| Creating lasting value YearBook 2011 | Creating lasting value Yearbook 2012 Fundraising
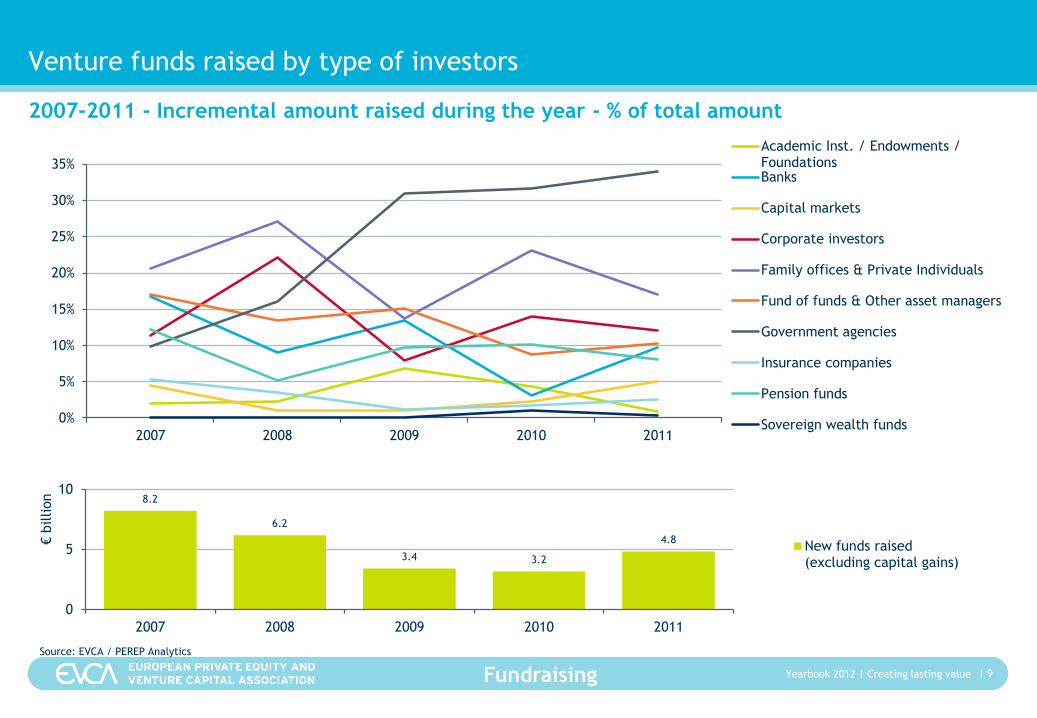
Venture funds raised by type of investors
| 9
2007-2011 - Incremental amount raised during the year - % of total amount
Source: EVCA / PEREP Analytics
8.2
6.2
3.4 3.2
4.8
0
5
10
2007 2008 2009 2010 2011
€billion
New funds raised(excluding capital gains)
0%
5%
10%
15%
20%
25%
30%
35%
2007 2008 2009 2010 2011
Academic Inst. / Endowments /FoundationsBanks
Capital markets
Corporate investors
Family offices & Private Individuals
Fund of funds & Other asset managers
Government agencies
Insurance companies
Pension funds
Sovereign wealth funds
| Creating lasting value YearBook 2011 | Creating lasting value Yearbook 2012 Fundraising
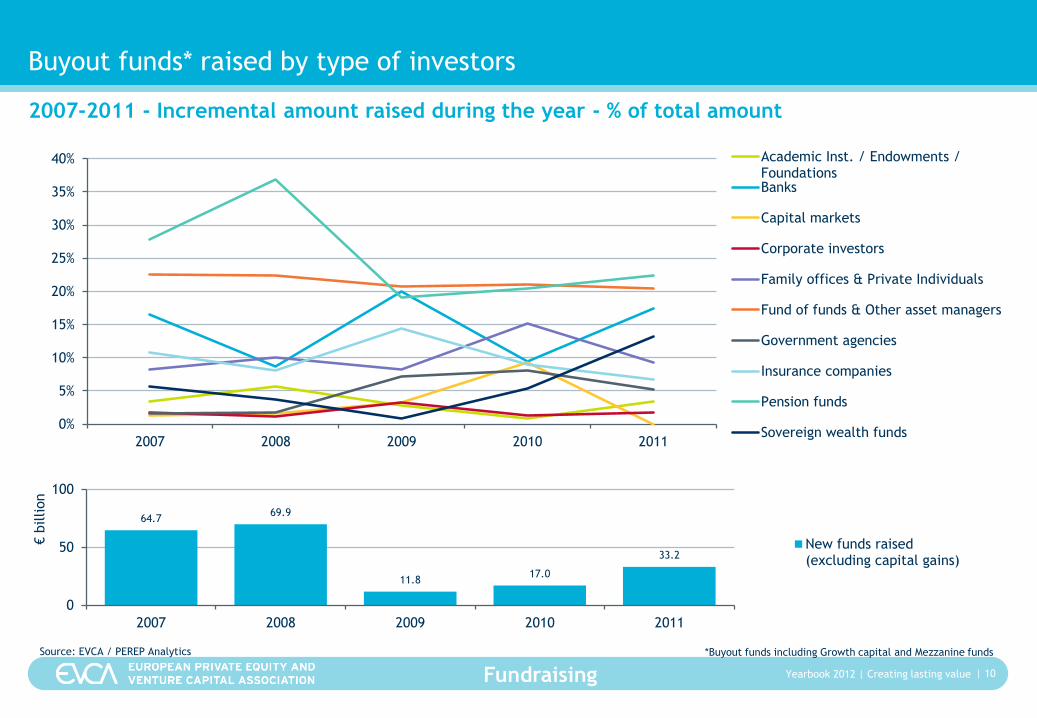
Buyout funds* raised by type of investors
| 10
2007-2011 - Incremental amount raised during the year - % of total amount
Source: EVCA / PEREP Analytics
64.769.9
11.817.0
33.2
0
50
100
2007 2008 2009 2010 2011
€billion
New funds raised(excluding capital gains)
*Buyout funds including Growth capital and Mezzanine funds
0%
5%
10%
15%
20%
25%
30%
35%
40%
2007 2008 2009 2010 2011
Academic Inst. / Endowments /FoundationsBanks
Capital markets
Corporate investors
Family offices & Private Individuals
Fund of funds & Other asset managers
Government agencies
Insurance companies
Pension funds
Sovereign wealth funds
| Creating lasting value YearBook 2011 | Creating lasting value Yearbook 2012 Fundraising
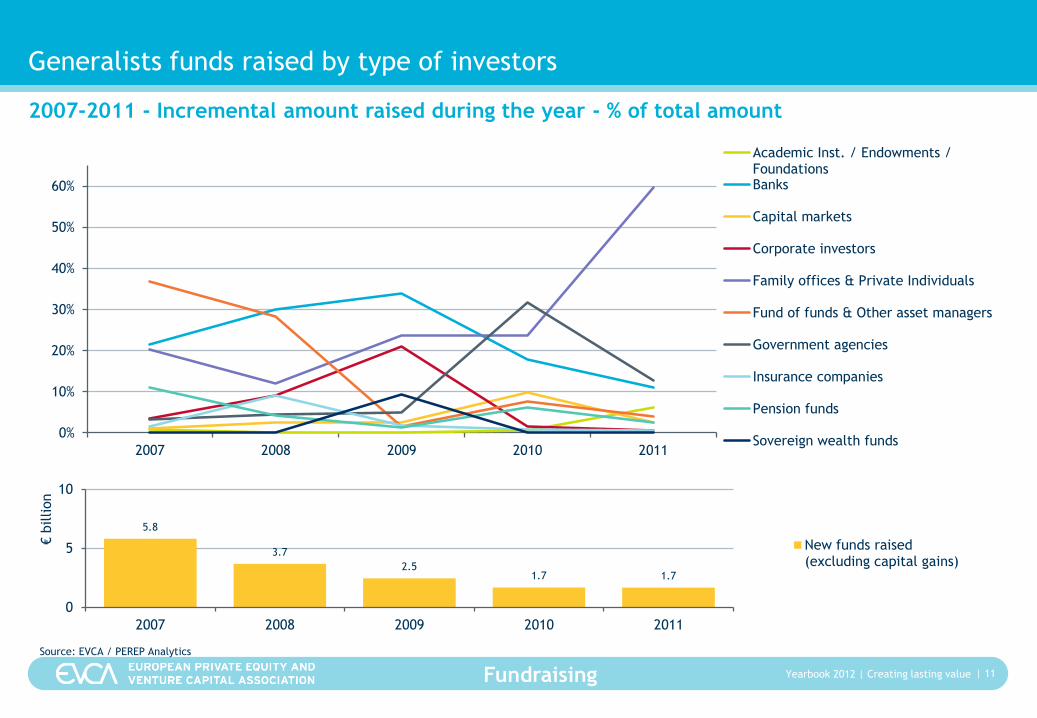
Generalists funds raised by type of investors
| 11
2007-2011 - Incremental amount raised during the year - % of total amount
Source: EVCA / PEREP Analytics
5.8
3.7
2.51.7 1.7
0
5
10
2007 2008 2009 2010 2011
€billion
New funds raised(excluding capital gains)
0%
10%
20%
30%
40%
50%
60%
2007 2008 2009 2010 2011
Academic Inst. / Endowments /FoundationsBanks
Capital markets
Corporate investors
Family offices & Private Individuals
Fund of funds & Other asset managers
Government agencies
Insurance companies
Pension funds
Sovereign wealth funds
| Creating lasting value YearBook 2011 | Creating lasting value Yearbook 2012 Fundraising
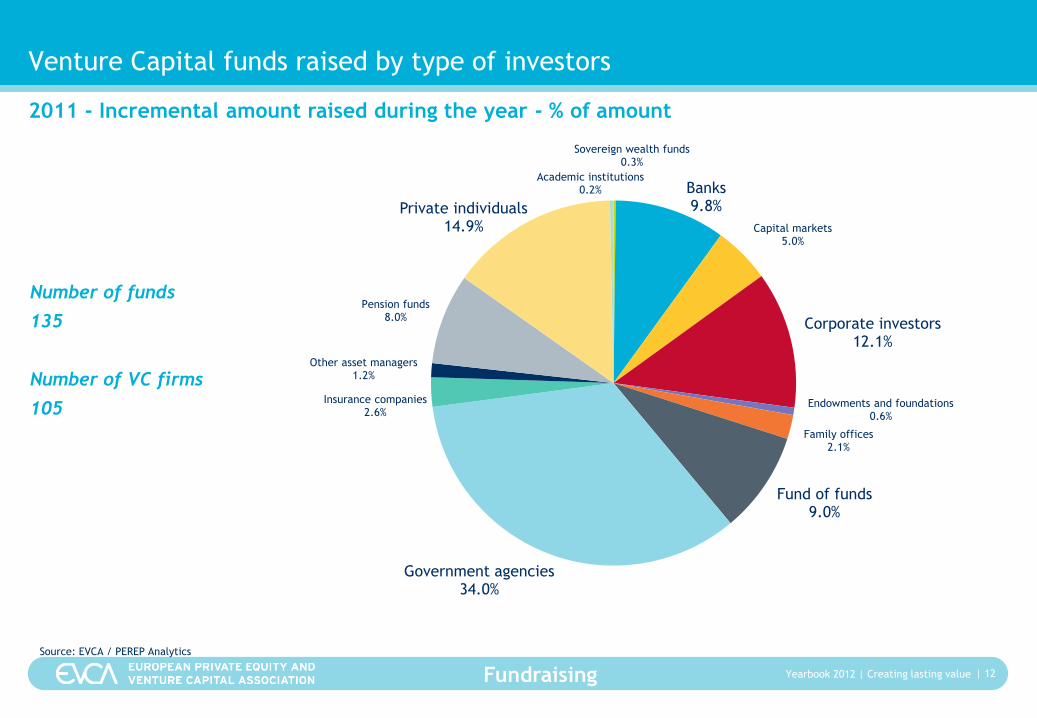
Academic institutions0.2% Banks
9.8%
Capital markets5.0%
Corporate investors12.1%
Endowments and foundations0.6%
Family offices2.1%
Fund of funds9.0%
Government agencies34.0%
Insurance companies2.6%
Other asset managers1.2%
Pension funds8.0%
Private individuals14.9%
Sovereign wealth funds0.3%
Venture Capital funds raised by type of investors
| 12
Number of funds
135
Number of VC firms
105
2011 - Incremental amount raised during the year - % of amount
Source: EVCA / PEREP Analytics
| Creating lasting value YearBook 2011 | Creating lasting value Yearbook 2012 Fundraising
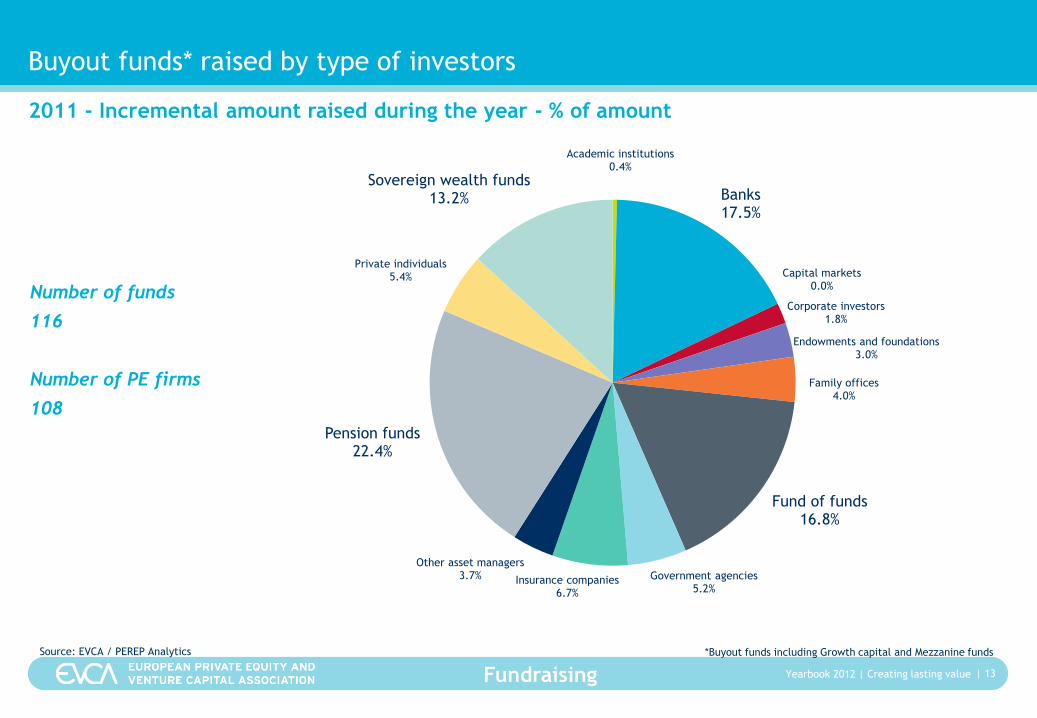
Academic institutions0.4%
Banks17.5%
Capital markets0.0%
Corporate investors1.8%
Endowments and foundations3.0%
Family offices4.0%
Fund of funds16.8%
Government agencies5.2%
Insurance companies6.7%
Other asset managers3.7%
Pension funds22.4%
Private individuals5.4%
Sovereign wealth funds13.2%
Buyout funds* raised by type of investors
| 13
Number of funds
116
Number of PE firms
108
2011 - Incremental amount raised during the year - % of amount
Source: EVCA / PEREP Analytics *Buyout funds including Growth capital and Mezzanine funds
| Creating lasting value YearBook 2011 | Creating lasting value Yearbook 2012 Fundraising
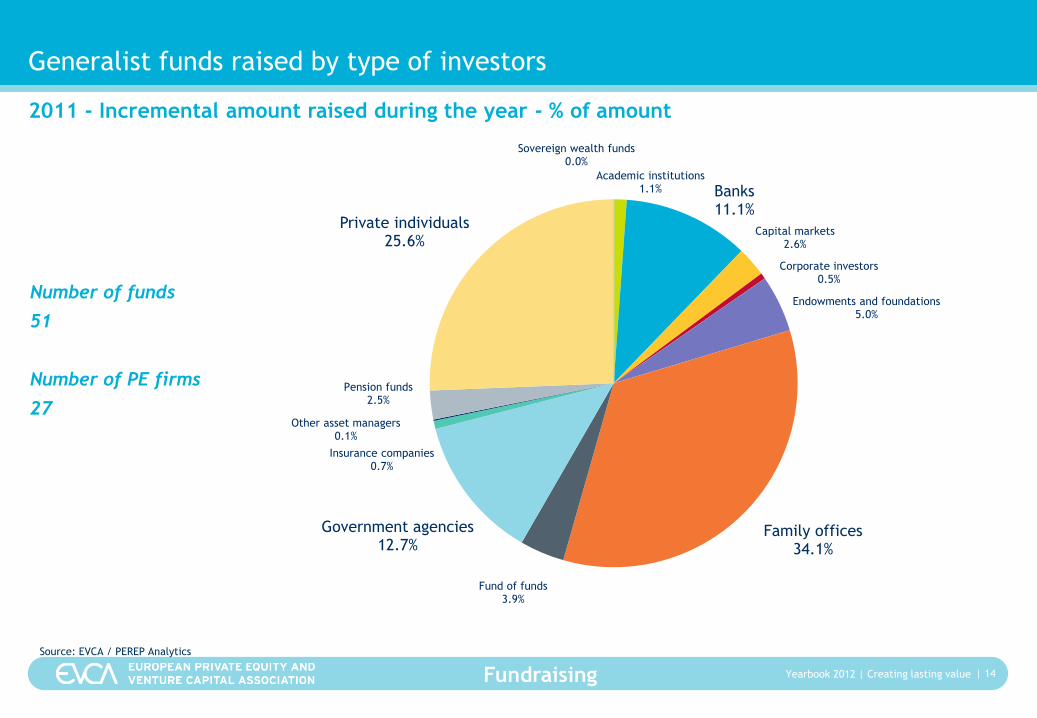
Academic institutions1.1% Banks
11.1%
Capital markets2.6%
Corporate investors0.5%
Endowments and foundations5.0%
Family offices34.1%
Fund of funds3.9%
Government agencies12.7%
Insurance companies0.7%
Other asset managers0.1%
Pension funds2.5%
Private individuals25.6%
Sovereign wealth funds0.0%
Generalist funds raised by type of investors
| 14
Number of funds
51
Number of PE firms
27
2011 - Incremental amount raised during the year - % of amount
Source: EVCA / PEREP Analytics
| Creating lasting value YearBook 2011 | Creating lasting value Yearbook 2012 Fundraising
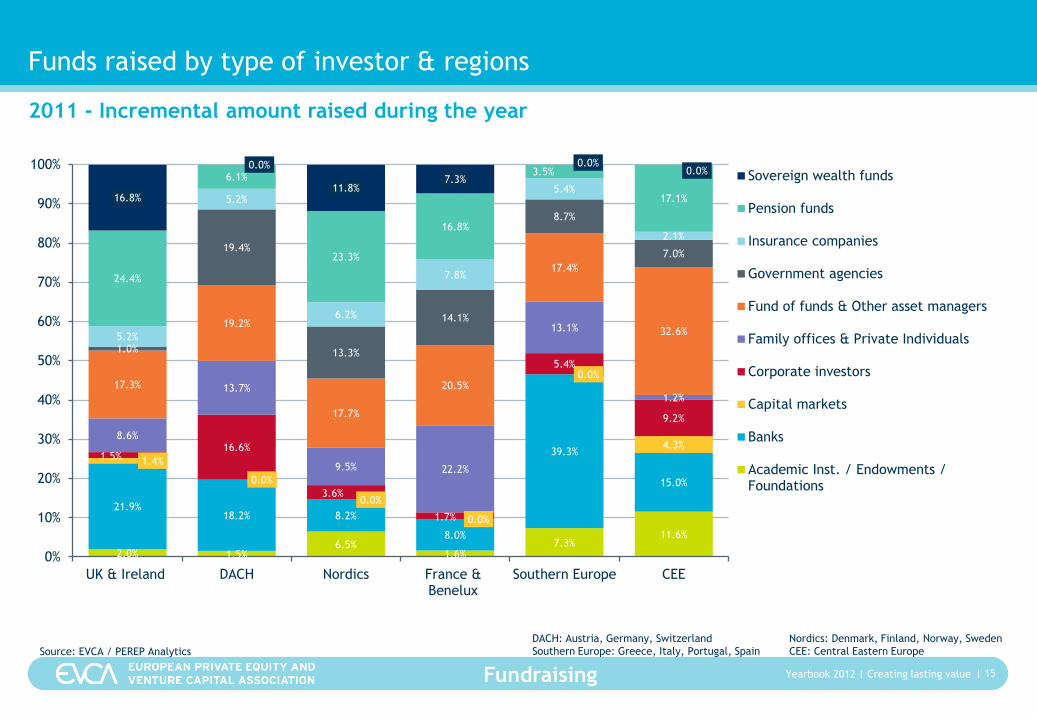
Funds raised by type of investor & regions
| 15
2011 - Incremental amount raised during the year
Source: EVCA / PEREP Analytics
2.0% 1.5%6.5%
1.6%7.3%
11.6%
21.9%18.2% 8.2%
8.0%
39.3%
15.0%
1.4%
0.0%
0.0%
0.0%
0.0%
4.3%1.5%
16.6%
3.6%
1.7%
5.4%
9.2%
8.6%
13.7%
9.5% 22.2%
13.1%
1.2%
17.3%
19.2%
17.7%
20.5%
17.4%
32.6%
1.0%
19.4%
13.3%
14.1%
8.7%
7.0%
5.2%
5.2%
6.2%
7.8%
5.4%
2.1%
24.4%
6.1%
23.3%
16.8%
3.5%
17.1%16.8%
0.0%
11.8%7.3%
0.0%0.0%
0%
10%
20%
30%
40%
50%
60%
70%
80%
90%
100%
UK & Ireland DACH Nordics France &Benelux
Southern Europe CEE
Sovereign wealth funds
Pension funds
Insurance companies
Government agencies
Fund of funds & Other asset managers
Family offices & Private Individuals
Corporate investors
Capital markets
Banks
Academic Inst. / Endowments /Foundations
DACH: Austria, Germany, Switzerland
Southern Europe: Greece, Italy, Portugal, Spain
Nordics: Denmark, Finland, Norway, Sweden
CEE: Central Eastern Europe
| Creating lasting value YearBook 2011 | Creating lasting value Yearbook 2012 Fundraising
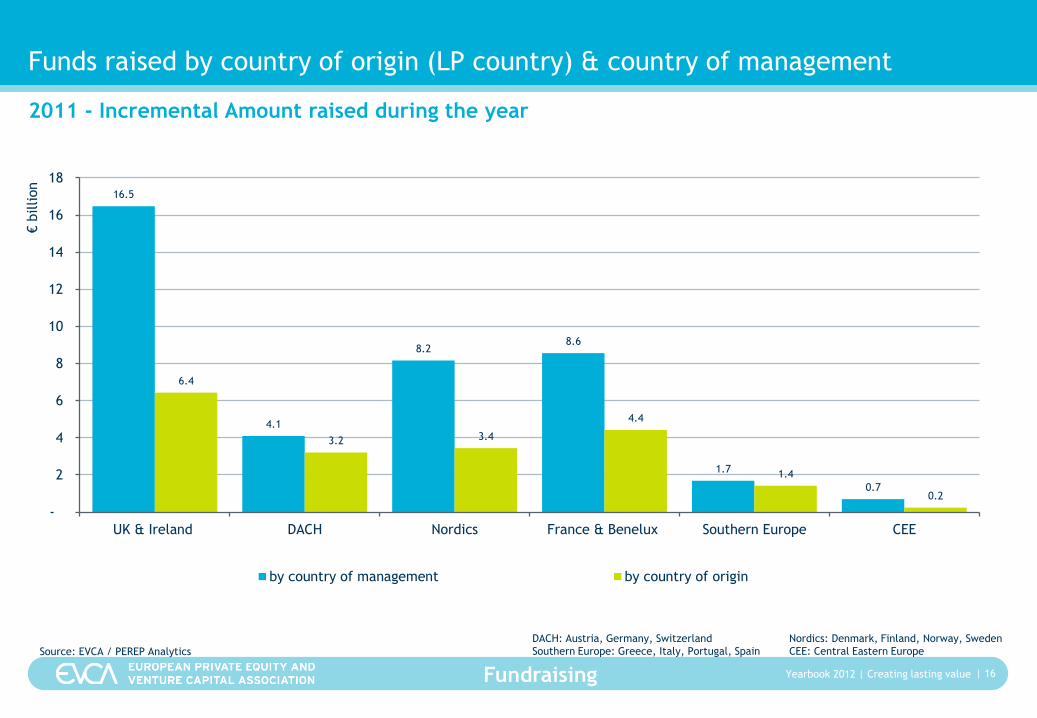
Funds raised by country of origin (LP country) & country of management
| 16
2011 - Incremental Amount raised during the year
Source: EVCA / PEREP Analytics
16.5
4.1
8.28.6
1.7
0.7
6.4
3.2 3.4
4.4
1.4
0.2
-
2
4
6
8
10
12
14
16
18
UK & Ireland DACH Nordics France & Benelux Southern Europe CEE
€billion
by country of management by country of origin
DACH: Austria, Germany, Switzerland
Southern Europe: Greece, Italy, Portugal, Spain
Nordics: Denmark, Finland, Norway, Sweden
CEE: Central Eastern Europe
| Creating lasting value YearBook 2011 | Creating lasting value Yearbook 2012 Fundraising
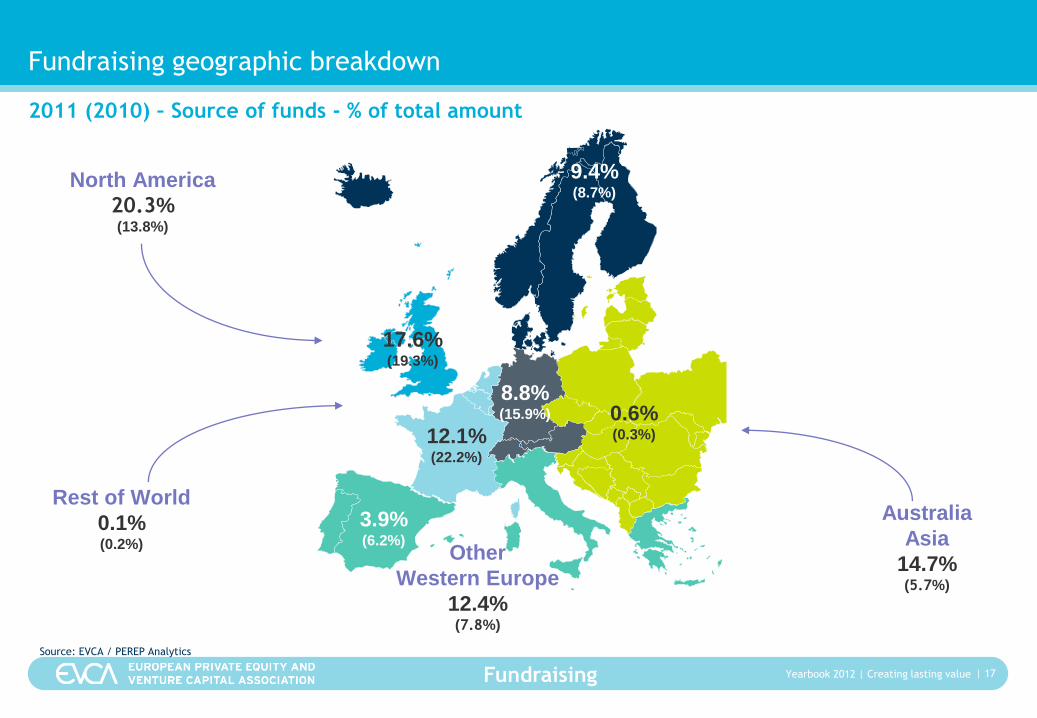
Fundraising geographic breakdown
| 17
17.6% (19.3%)
12.1% (22.2%)
0.6% (0.3%)
Rest of World
0.1% (0.2%)
Australia
Asia
14.7% (5.7%)
North America
20.3% (13.8%)
Other
Western Europe
12.4% (7.8%)
8.8% (15.9%)
3.9% (6.2%)
9.4% (8.7%)
2011 (2010) – Source of funds - % of total amount
Source: EVCA / PEREP Analytics
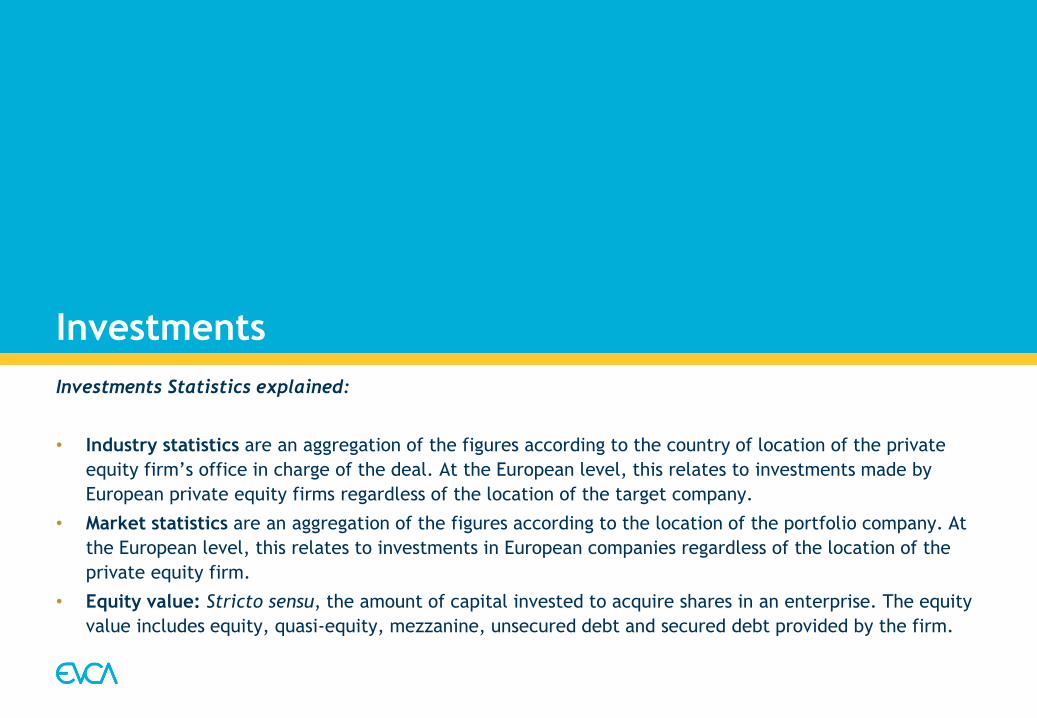
Investments
Investments Statistics explained:
• Industry statistics are an aggregation of the figures according to the country of location of the private
equity firm’s office in charge of the deal. At the European level, this relates to investments made by
European private equity firms regardless of the location of the target company.
• Market statistics are an aggregation of the figures according to the location of the portfolio company. At
the European level, this relates to investments in European companies regardless of the location of the
private equity firm.
• Equity value: Stricto sensu, the amount of capital invested to acquire shares in an enterprise. The equity
value includes equity, quasi-equity, mezzanine, unsecured debt and secured debt provided by the firm.
| Creating lasting value YearBook 2011 | Creating lasting value Yearbook 2012 Investments
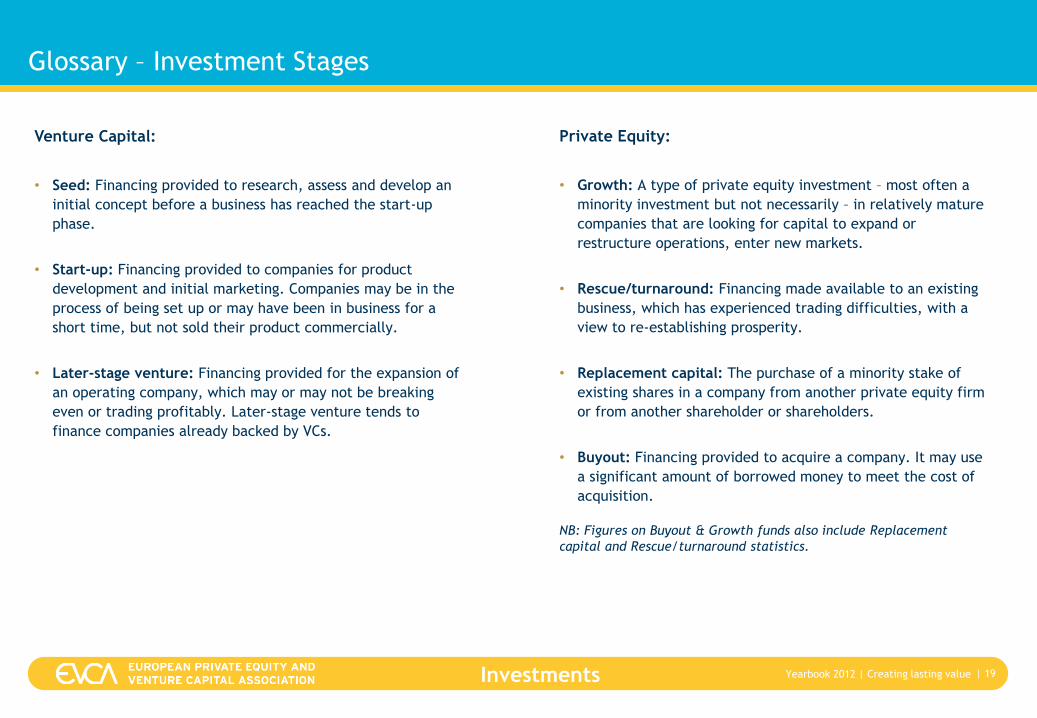
Glossary – Investment Stages
| 19
Venture Capital:
• Seed: Financing provided to research, assess and develop an
initial concept before a business has reached the start-up
phase.
• Start-up: Financing provided to companies for product
development and initial marketing. Companies may be in the
process of being set up or may have been in business for a
short time, but not sold their product commercially.
• Later-stage venture: Financing provided for the expansion of
an operating company, which may or may not be breaking
even or trading profitably. Later-stage venture tends to
finance companies already backed by VCs.
Private Equity:
• Growth: A type of private equity investment – most often a
minority investment but not necessarily – in relatively mature
companies that are looking for capital to expand or
restructure operations, enter new markets.
• Rescue/turnaround: Financing made available to an existing
business, which has experienced trading difficulties, with a
view to re-establishing prosperity.
• Replacement capital: The purchase of a minority stake of
existing shares in a company from another private equity firm
or from another shareholder or shareholders.
• Buyout: Financing provided to acquire a company. It may use
a significant amount of borrowed money to meet the cost of
acquisition.
NB: Figures on Buyout & Growth funds also include Replacement
capital and Rescue/turnaround statistics.
| Creating lasting value YearBook 2011 | Creating lasting value Yearbook 2012 Investments
Venture Capital / Buyout & Growth - Investments overview
| 20
2000–2011 – Industry statistics – Amount & Number of companies
Source: Thomson Reuters / EVCA (2000-2006) & EVCA / PEREP Analytics (2007-2011)
15.3
12.1
17.9
20.7
26.6
34.4
53.9
66.0
47.4
19.9
39.241.6
19.6
12.2
9.88.4
10.3
12.7
17.3 6.2
6.8
4.1
3.93.9
0
1,000
2,000
3,000
4,000
5,000
6,000
7,000
8,000
9,000
10,000
0
10
20
30
40
50
60
70
80
2000 2001 2002 2003 2004 2005 2006 2007 2008 2009 2010 2011
Num
ber o
f com
panie
s financed
€billion
Buyout & Growth - Amount invested VC - Amount invested
Buyout & Growth - Number of companies VC - Number of companies
| Creating lasting value YearBook 2011 | Creating lasting value Yearbook 2012 Investments
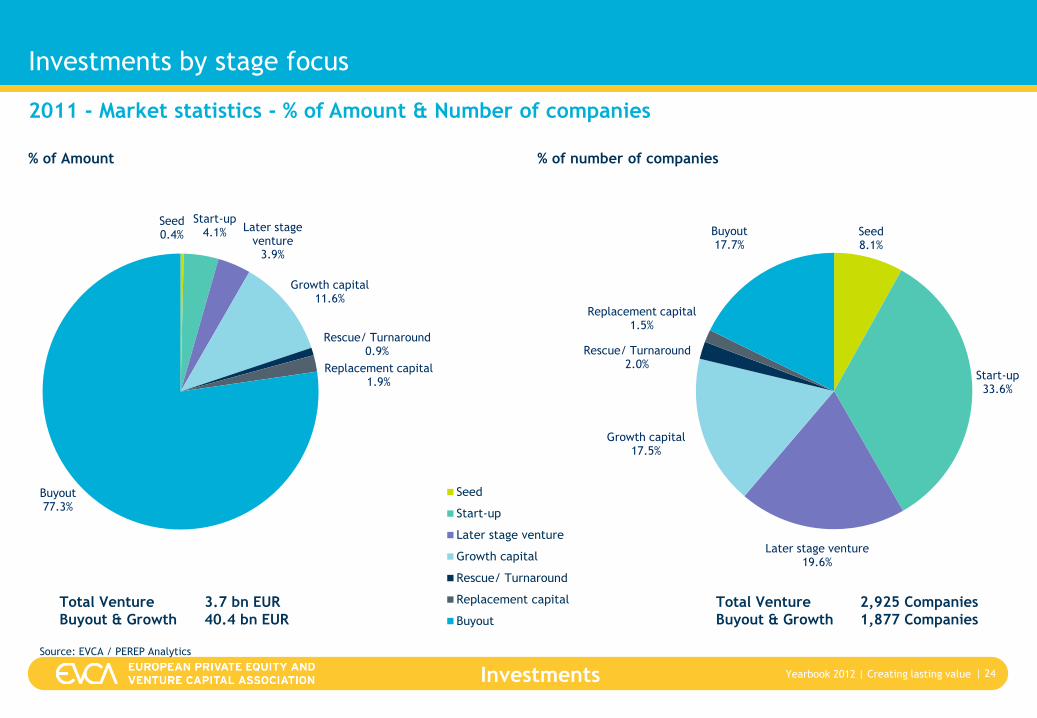
Investments by stage focus
| 21
2007-2011 - Market statistics – Amount
Source: EVCA / PEREP Analytics
57.7
37.5
12.3
29.5
34.1
1.7 1.4 2.0 1.70.90.5 0.3 0.7 0.5 0.4
5.0
7.3
4.56.4
5.13.5 3.8
1.8 1.8 1.72.2 2.5 1.9 1.8 1.80.2 0.3 0.1 0.1 0.2
0
10
20
30
40
50
60
2007 2008 2009 2010 2011
€billion
Buyout Replacement capital Rescue/Turnaround Growth capital Later stage venture Start-up Seed
Venture Capital
| Creating lasting value YearBook 2011 | Creating lasting value Yearbook 2012 Investments
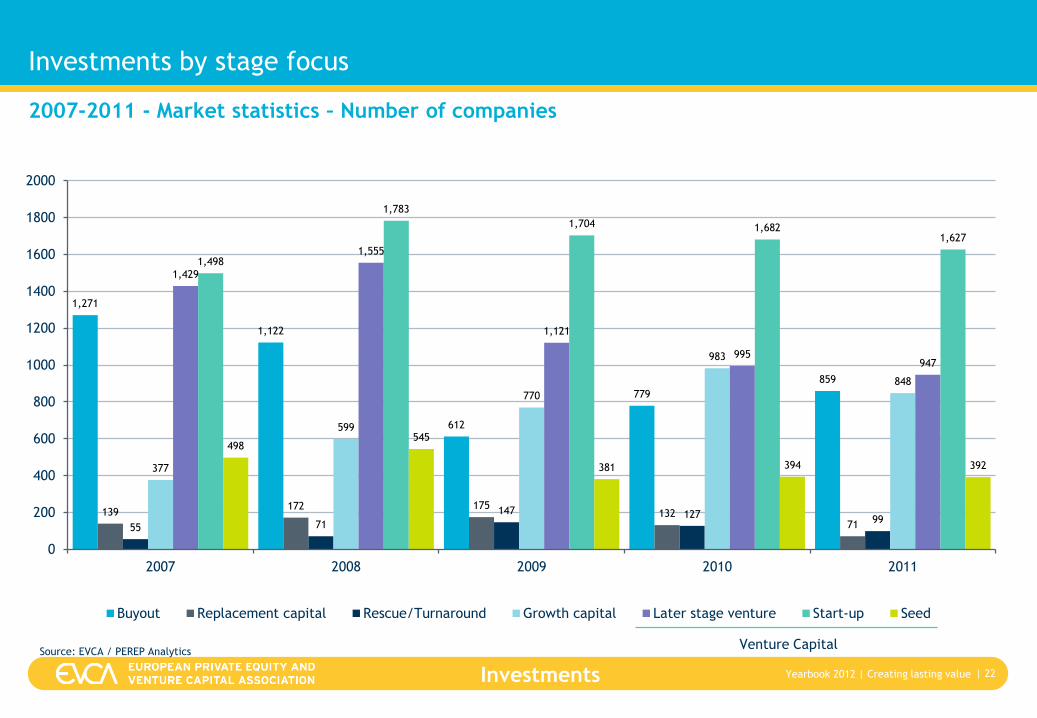
Investments by stage focus
| 22
2007-2011 - Market statistics – Number of companies
Source: EVCA / PEREP Analytics
1,271
1,122
612
779
859
139172 175
1327155 71
147 12799
377
599
770
983
848
1,429
1,555
1,121
995947
1,498
1,783
1,704 1,6821,627
498545
381 394 392
0
200
400
600
800
1000
1200
1400
1600
1800
2000
2007 2008 2009 2010 2011
Buyout Replacement capital Rescue/Turnaround Growth capital Later stage venture Start-up Seed
Venture Capital
| Creating lasting value YearBook 2011 | Creating lasting value Yearbook 2012 Investments
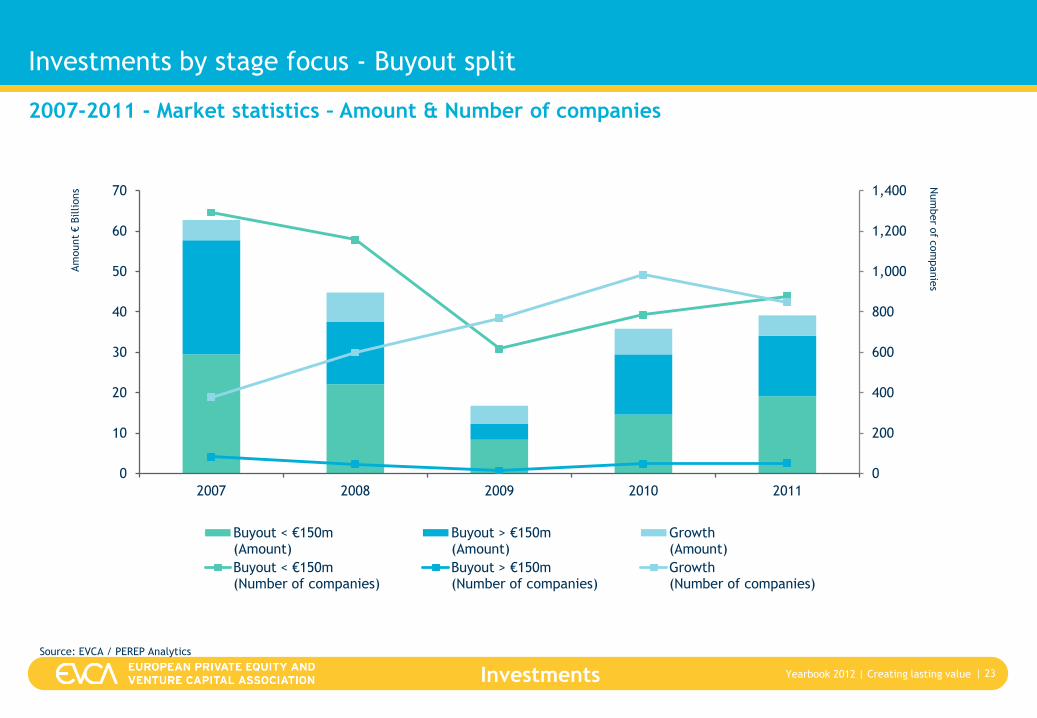
Investments by stage focus - Buyout split
| 23
Source: EVCA / PEREP Analytics
2007-2011 - Market statistics – Amount & Number of companies
0
200
400
600
800
1,000
1,200
1,400
0
10
20
30
40
50
60
70
2007 2008 2009 2010 2011
Num
ber o
f com
panie
s
Am
ount
€Billions
Buyout < €150m (Amount)
Buyout > €150m(Amount)
Growth(Amount)
Buyout < €150m (Number of companies)
Buyout > €150m (Number of companies)
Growth(Number of companies)
| Creating lasting value YearBook 2011 | Creating lasting value Yearbook 2012 Investments
Investments by stage focus
| 24
% of Amount % of number of companies
2011 - Market statistics - % of Amount & Number of companies
Source: EVCA / PEREP Analytics
Seed0.4%
Start-up4.1% Later stage
venture3.9%
Growth capital11.6%
Rescue/ Turnaround0.9%
Replacement capital1.9%
Buyout77.3%
Seed
Start-up
Later stage venture
Growth capital
Rescue/Turnaround
Replacementcapital
Buyout
Seed8.1%
Start-up33.6%
Later stage venture19.6%
Growth capital17.5%
Rescue/ Turnaround2.0%
Replacement capital1.5%
Buyout17.7% Seed
Start-up
Later stage venture
Growth capital
Rescue/Turnaround
Replacementcapital
Buyout
Seed0.4%
Start-up4.1%
Later stage venture
3.9%Growth capital11.6%Rescue/ Turnaround
0.9%Replacement capital1.9%
Buyout77.3%
Seed
Start-up
Later stage venture
Growth capital
Rescue/ Turnaround
Replacement capital
Buyout
Total Venture 3.7 bn EUR
Buyout & Growth 40.4 bn EUR
Total Venture 2,925 Companies
Buyout & Growth 1,877 Companies
| Creating lasting value YearBook 2011 | Creating lasting value Yearbook 2012 Investments
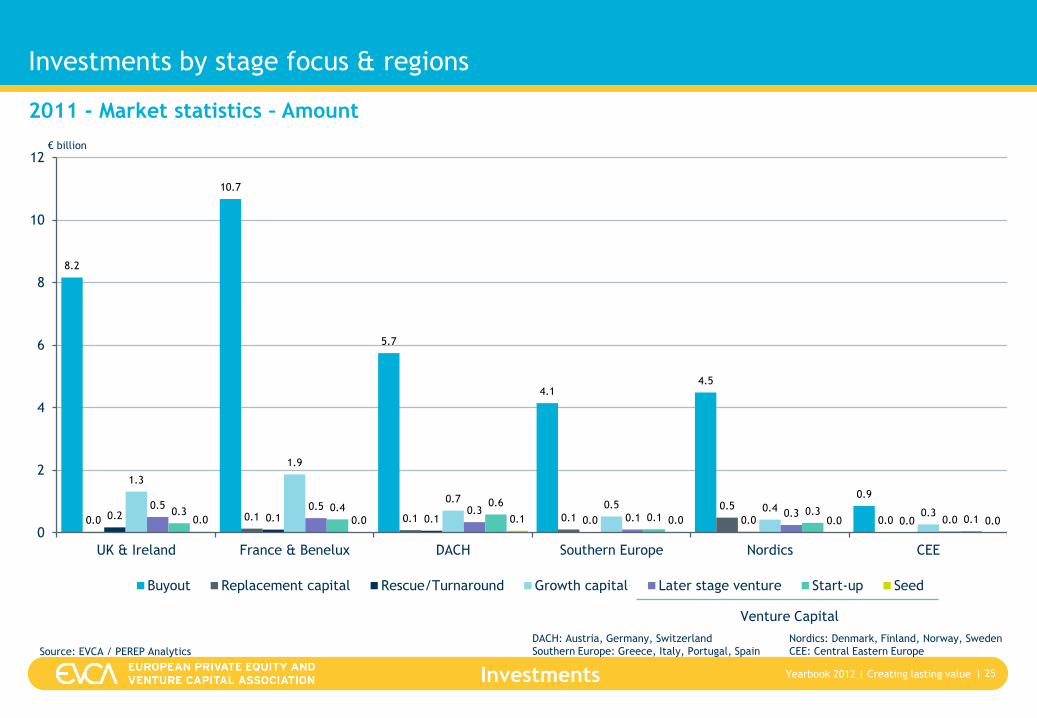
Investments by stage focus & regions
| 25
2011 - Market statistics – Amount
Source: EVCA / PEREP Analytics
8.2
10.7
5.7
4.14.5
0.9
0.0 0.1 0.1 0.10.5
0.00.2 0.1 0.1 0.0 0.0 0.0
1.3
1.9
0.70.5 0.4 0.3
0.5 0.5 0.30.1 0.3
0.00.3 0.4 0.6
0.10.3
0.10.0 0.0 0.1 0.0 0.0 0.0
0
2
4
6
8
10
12
UK & Ireland France & Benelux DACH Southern Europe Nordics CEE
€ billion
Buyout Replacement capital Rescue/Turnaround Growth capital Later stage venture Start-up Seed
DACH: Austria, Germany, Switzerland
Southern Europe: Greece, Italy, Portugal, Spain
Nordics: Denmark, Finland, Norway, Sweden
CEE: Central Eastern Europe
Venture Capital
| Creating lasting value YearBook 2011 | Creating lasting value Yearbook 2012 Investments
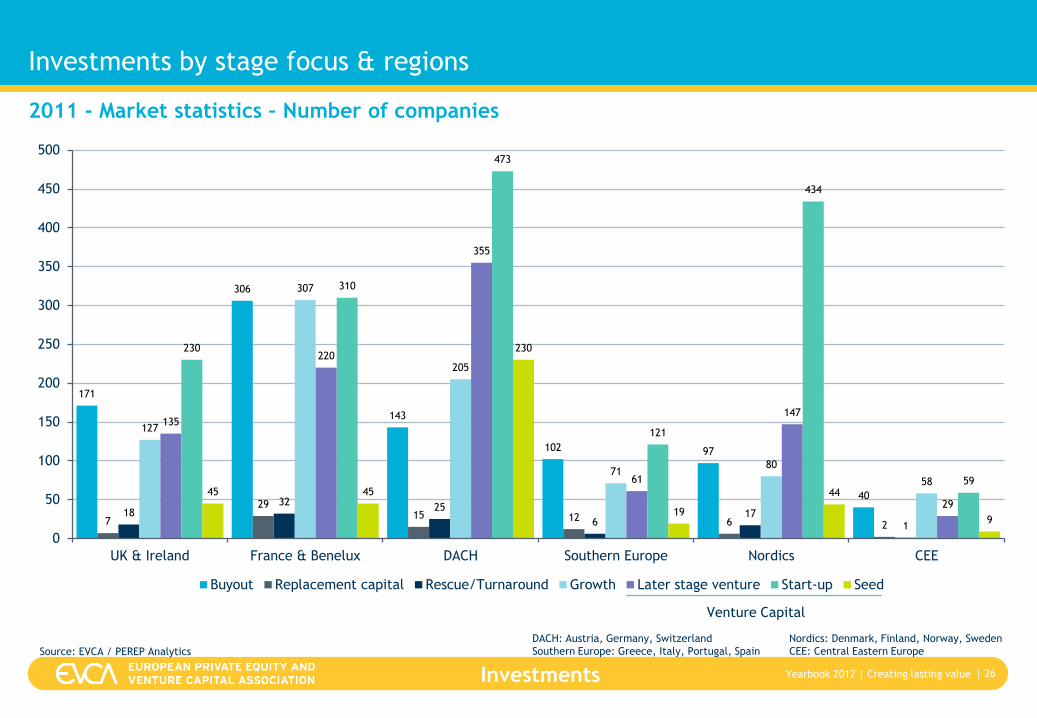
Investments by stage focus & regions
| 26
2011 - Market statistics – Number of companies
Source: EVCA / PEREP Analytics
171
306
143
102 97
40
7
2915 12 6 2
1832
25
617
1
127
307
205
7180
58
135
220
355
61
147
29
230
310
473
121
434
5945 45
230
19
44
9
0
50
100
150
200
250
300
350
400
450
500
UK & Ireland France & Benelux DACH Southern Europe Nordics CEE
Buyout Replacement capital Rescue/Turnaround Growth Later stage venture Start-up Seed
Venture Capital
DACH: Austria, Germany, Switzerland
Southern Europe: Greece, Italy, Portugal, Spain
Nordics: Denmark, Finland, Norway, Sweden
CEE: Central Eastern Europe
| Creating lasting value YearBook 2011 | Creating lasting value Yearbook 2012 Investments
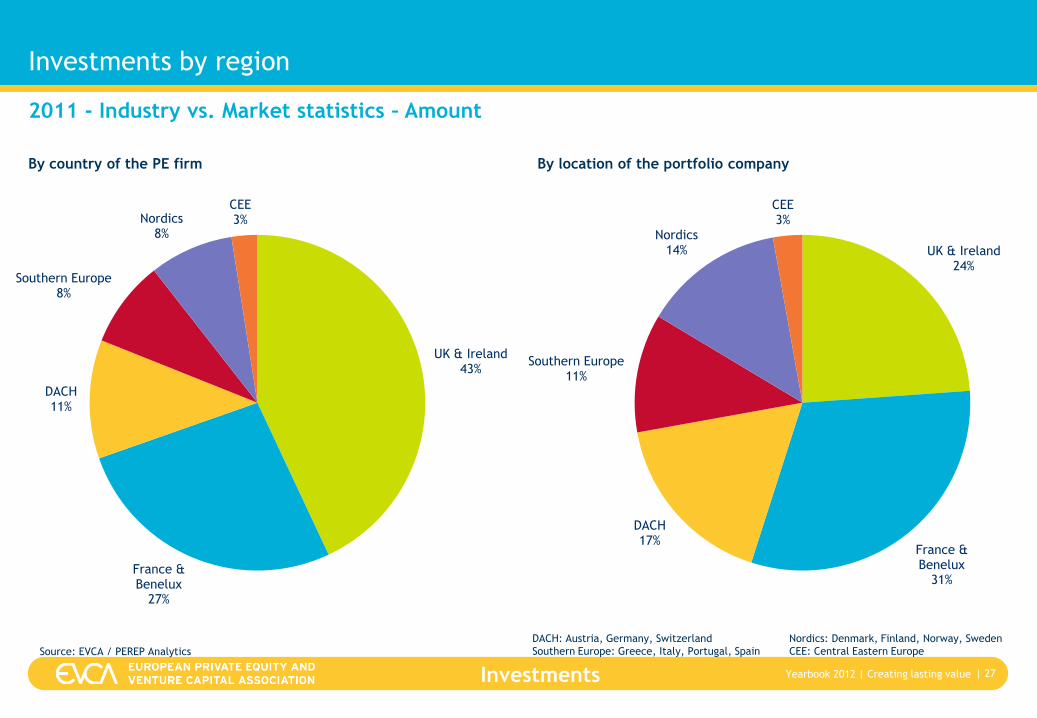
Investments by region
| 27
By country of the PE firm By location of the portfolio company
2011 - Industry vs. Market statistics – Amount
Source: EVCA / PEREP Analytics
UK & Ireland43%
France & Benelux
27%
DACH11%
Southern Europe8%
Nordics8%
CEE3%
UK & Ireland24%
France & Benelux
31%
DACH17%
Southern Europe11%
Nordics14%
CEE3%
DACH: Austria, Germany, Switzerland
Southern Europe: Greece, Italy, Portugal, Spain
Nordics: Denmark, Finland, Norway, Sweden
CEE: Central Eastern Europe
| Creating lasting value YearBook 2011 | Creating lasting value Yearbook 2012 Investments
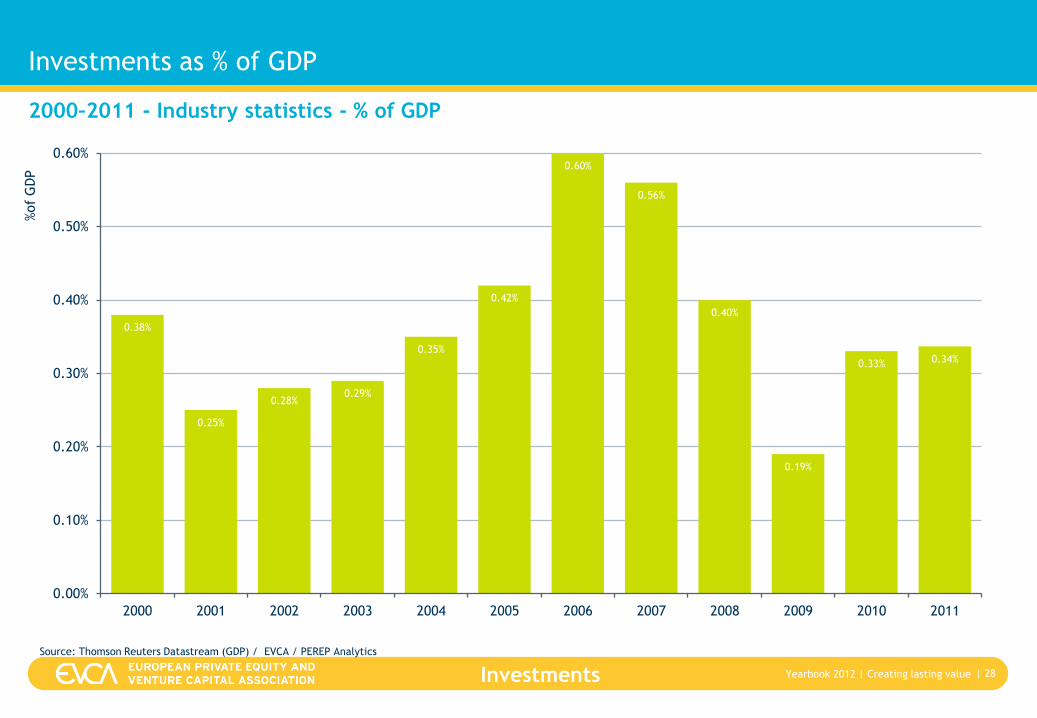
Investments as % of GDP
| 28
2000–2011 - Industry statistics - % of GDP
Source: Thomson Reuters Datastream (GDP) / EVCA / PEREP Analytics
0.38%
0.25%
0.28%0.29%
0.35%
0.42%
0.60%
0.56%
0.40%
0.19%
0.33% 0.34%
0.00%
0.10%
0.20%
0.30%
0.40%
0.50%
0.60%
2000 2001 2002 2003 2004 2005 2006 2007 2008 2009 2010 2011
%of
GD
P
| Creating lasting value YearBook 2011 | Creating lasting value Yearbook 2012 Investments
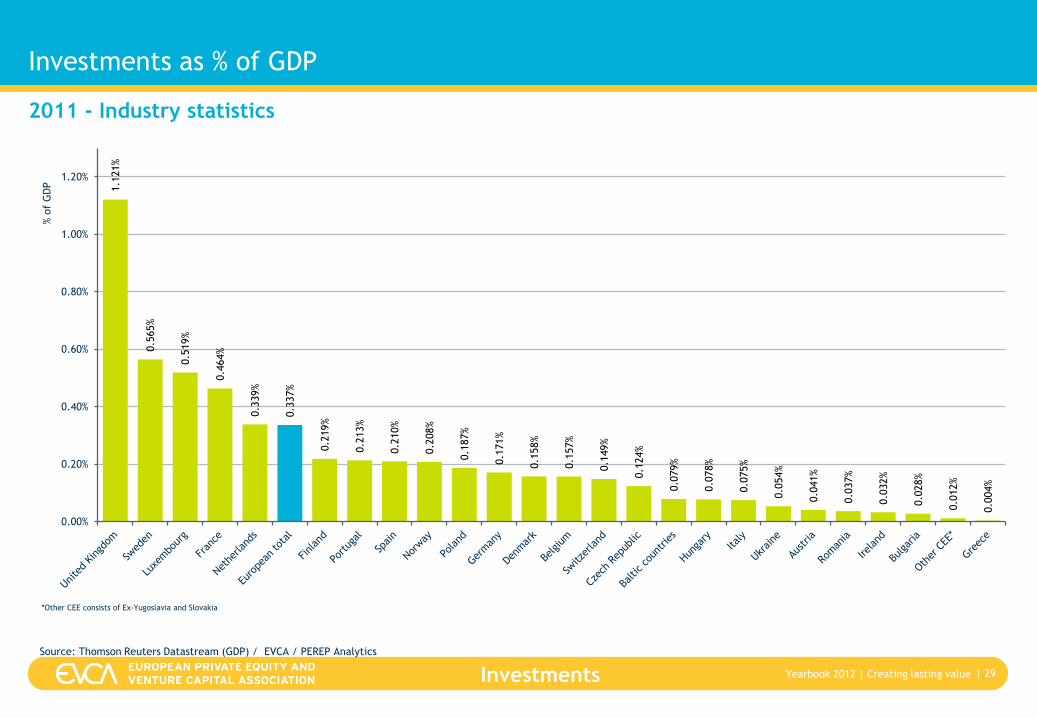
Investments as % of GDP
| 29
*Other CEE consists of Ex-Yugoslavia and Slovakia
2011 - Industry statistics 1.1
21%
0.5
65%
0.5
19%
0.4
64%
0.3
39%
0.3
37%
0.2
19%
0.2
13%
0.2
10%
0.2
08%
0.1
87%
0.1
71%
0.1
58%
0.1
57%
0.1
49%
0.1
24%
0.0
79%
0.0
78%
0.0
75%
0.0
54%
0.0
41%
0.0
37%
0.0
32%
0.0
28%
0.0
12%
0.0
04%
0.00%
0.20%
0.40%
0.60%
0.80%
1.00%
1.20%
% o
f G
DP
Source: Thomson Reuters Datastream (GDP) / EVCA / PEREP Analytics
| Creating lasting value YearBook 2011 | Creating lasting value Yearbook 2012 Investments
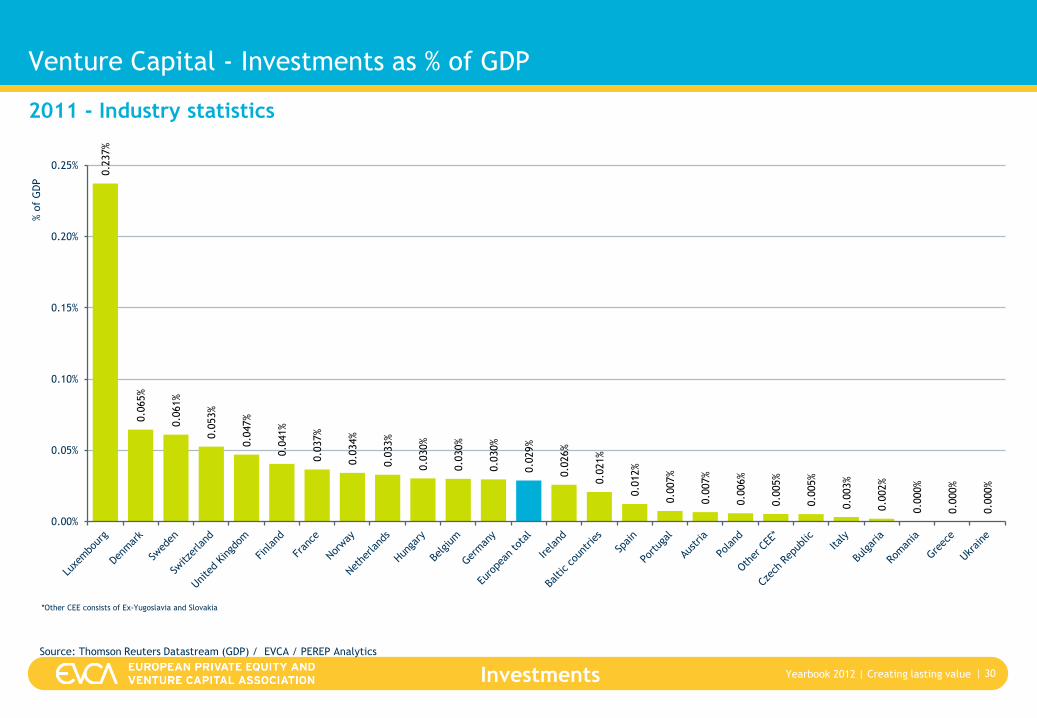
Venture Capital - Investments as % of GDP
| 30
2011 - Industry statistics
*Other CEE consists of Ex-Yugoslavia and Slovakia
0.2
37%
0.0
65%
0.0
61%
0.0
53%
0.0
47%
0.0
41%
0.0
37%
0.0
34%
0.0
33%
0.0
30%
0.0
30%
0.0
30%
0.0
29%
0.0
26%
0.0
21%
0.0
12%
0.0
07%
0.0
07%
0.0
06%
0.0
05%
0.0
05%
0.0
03%
0.0
02%
0.0
00%
0.0
00%
0.0
00%
0.00%
0.05%
0.10%
0.15%
0.20%
0.25%
% o
f G
DP
Source: Thomson Reuters Datastream (GDP) / EVCA / PEREP Analytics
| Creating lasting value YearBook 2011 | Creating lasting value Yearbook 2012 Investments
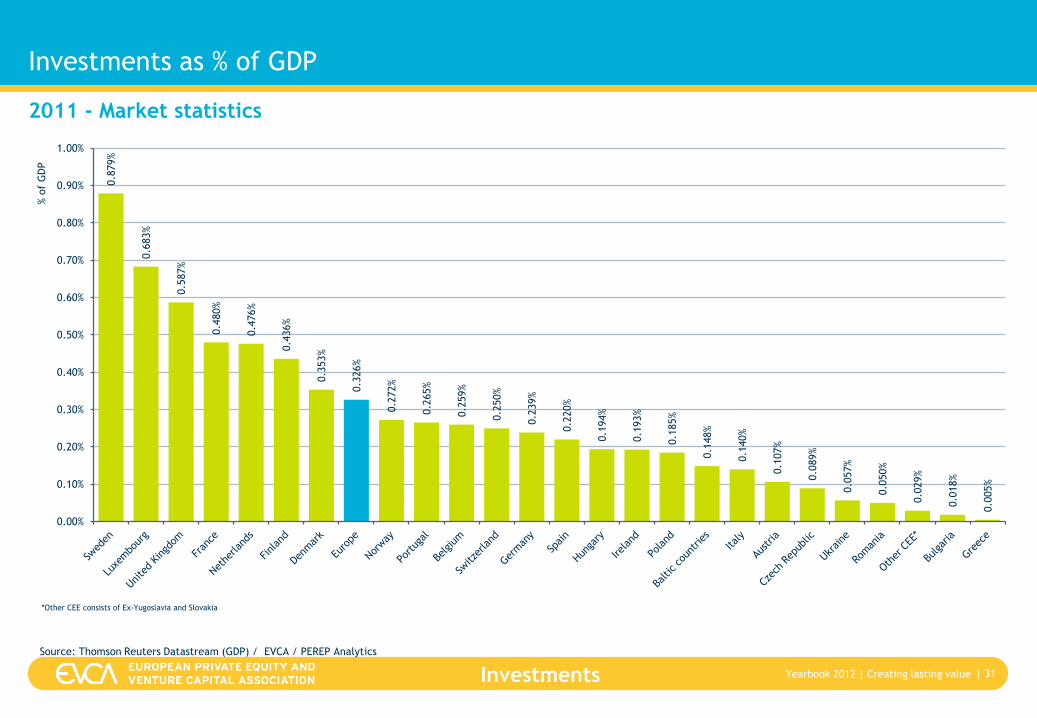
Investments as % of GDP
| 31
2011 - Market statistics
*Other CEE consists of Ex-Yugoslavia and Slovakia
0.8
79%
0.6
83%
0.5
87%
0.4
80%
0.4
76%
0.4
36%
0.3
53%
0.3
26%
0.2
72%
0.2
65%
0.2
59%
0.2
50%
0.2
39%
0.2
20%
0.1
94%
0.1
93%
0.1
85%
0.1
48%
0.1
40%
0.1
07%
0.0
89%
0.0
57%
0.0
50%
0.0
29%
0.0
18%
0.0
05%
0.00%
0.10%
0.20%
0.30%
0.40%
0.50%
0.60%
0.70%
0.80%
0.90%
1.00%
% o
f G
DP
Source: Thomson Reuters Datastream (GDP) / EVCA / PEREP Analytics
| Creating lasting value YearBook 2011 | Creating lasting value Yearbook 2012 Investments
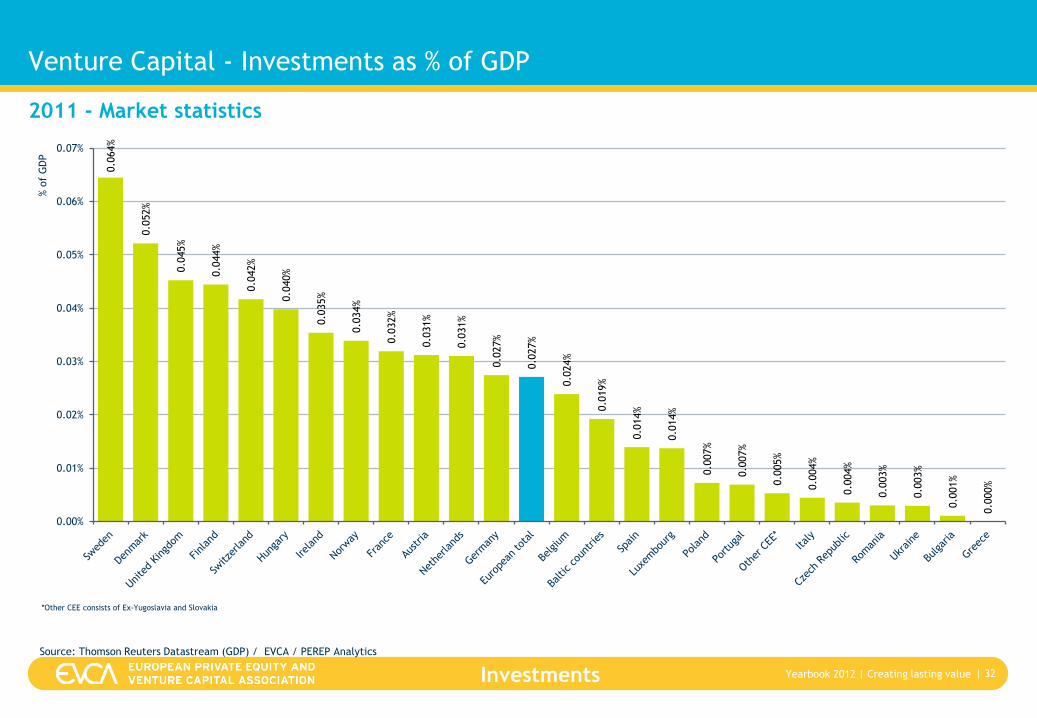
Venture Capital - Investments as % of GDP
| 32
2011 - Market statistics
*Other CEE consists of Ex-Yugoslavia and Slovakia
0.0
64%
0.0
52%
0.0
45%
0.0
44%
0.0
42%
0.0
40%
0.0
35%
0.0
34%
0.0
32%
0.0
31%
0.0
31%
0.0
27%
0.0
27%
0.0
24%
0.0
19%
0.0
14%
0.0
14%
0.0
07%
0.0
07%
0.0
05%
0.0
04%
0.0
04%
0.0
03%
0.0
03%
0.0
01%
0.0
00%
0.00%
0.01%
0.02%
0.03%
0.04%
0.05%
0.06%
0.07%
% o
f G
DP
Source: Thomson Reuters Datastream (GDP) / EVCA / PEREP Analytics
| Creating lasting value YearBook 2011 | Creating lasting value Yearbook 2012 Investments
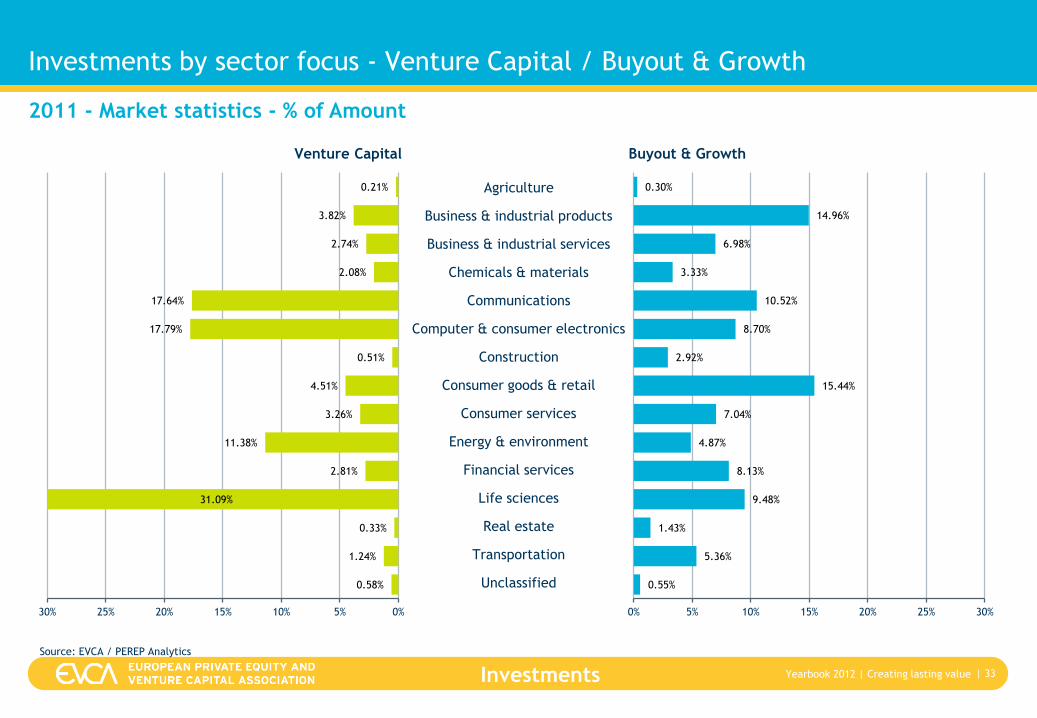
Investments by sector focus - Venture Capital / Buyout & Growth
| 33
Venture Capital Buyout & Growth
2011 - Market statistics - % of Amount
Source: EVCA / PEREP Analytics
Agriculture
Business & industrial products
Business & industrial services
Chemicals & materials
Communications
Computer & consumer electronics
Construction
Consumer goods & retail
Consumer services
Energy & environment
Financial services
Life sciences
Real estate
Transportation
Unclassified 0.58%
1.24%
0.33%
31.09%
2.81%
11.38%
3.26%
4.51%
0.51%
17.79%
17.64%
2.08%
2.74%
3.82%
0.21%
0%5%10%15%20%25%30%
0.55%
5.36%
1.43%
9.48%
8.13%
4.87%
7.04%
15.44%
2.92%
8.70%
10.52%
3.33%
6.98%
14.96%
0.30%
0% 5% 10% 15% 20% 25% 30%
| Creating lasting value YearBook 2011 | Creating lasting value Yearbook 2012 Investments
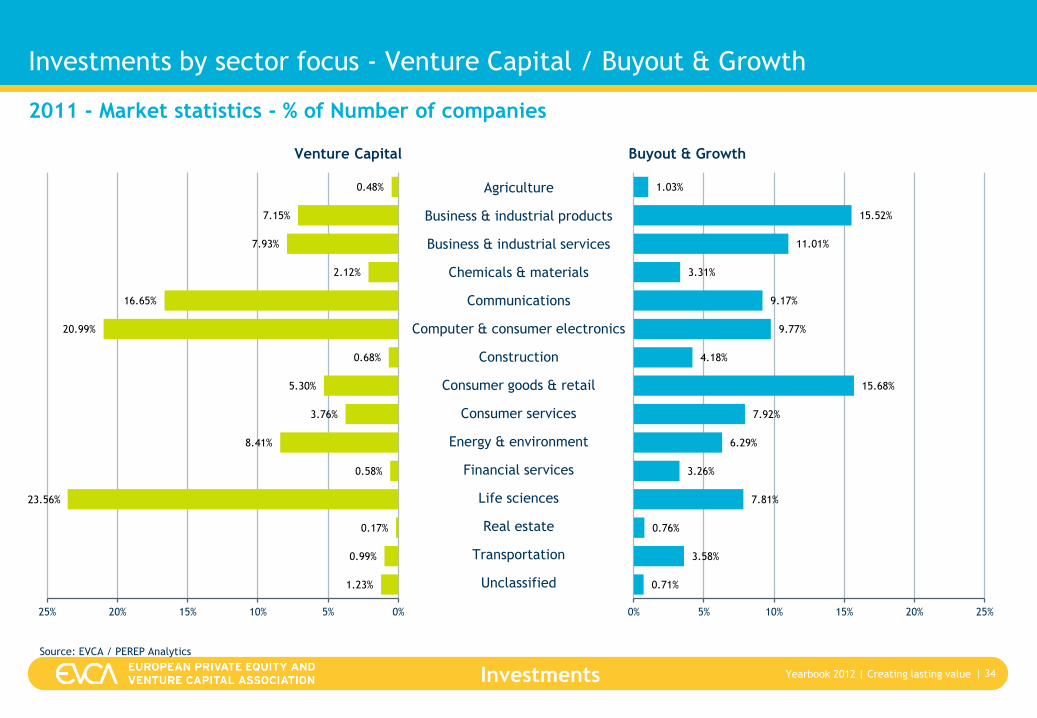
Investments by sector focus - Venture Capital / Buyout & Growth
| 34
Venture Capital Buyout & Growth
2011 - Market statistics - % of Number of companies
Source: EVCA / PEREP Analytics
Agriculture
Business & industrial products
Business & industrial services
Chemicals & materials
Communications
Computer & consumer electronics
Construction
Consumer goods & retail
Consumer services
Energy & environment
Financial services
Life sciences
Real estate
Transportation
Unclassified 1.23%
0.99%
0.17%
23.56%
0.58%
8.41%
3.76%
5.30%
0.68%
20.99%
16.65%
2.12%
7.93%
7.15%
0.48%
0%5%10%15%20%25%
0.71%
3.58%
0.76%
7.81%
3.26%
6.29%
7.92%
15.68%
4.18%
9.77%
9.17%
3.31%
11.01%
15.52%
1.03%
0% 5% 10% 15% 20% 25%
| Creating lasting value YearBook 2011 | Creating lasting value Yearbook 2012 Investments
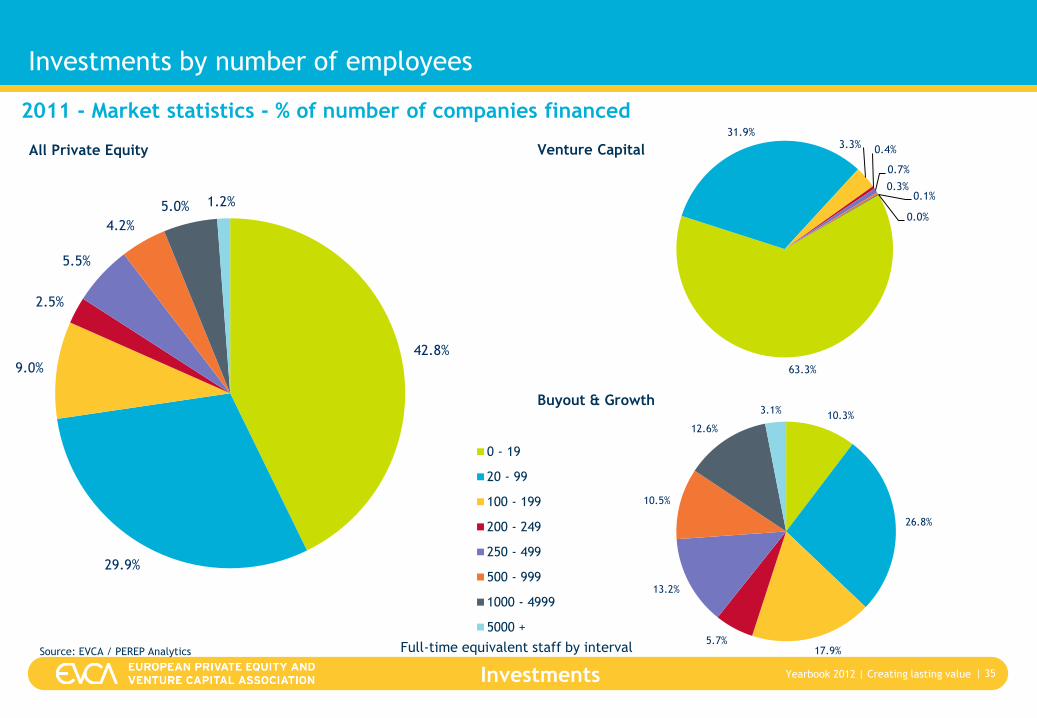
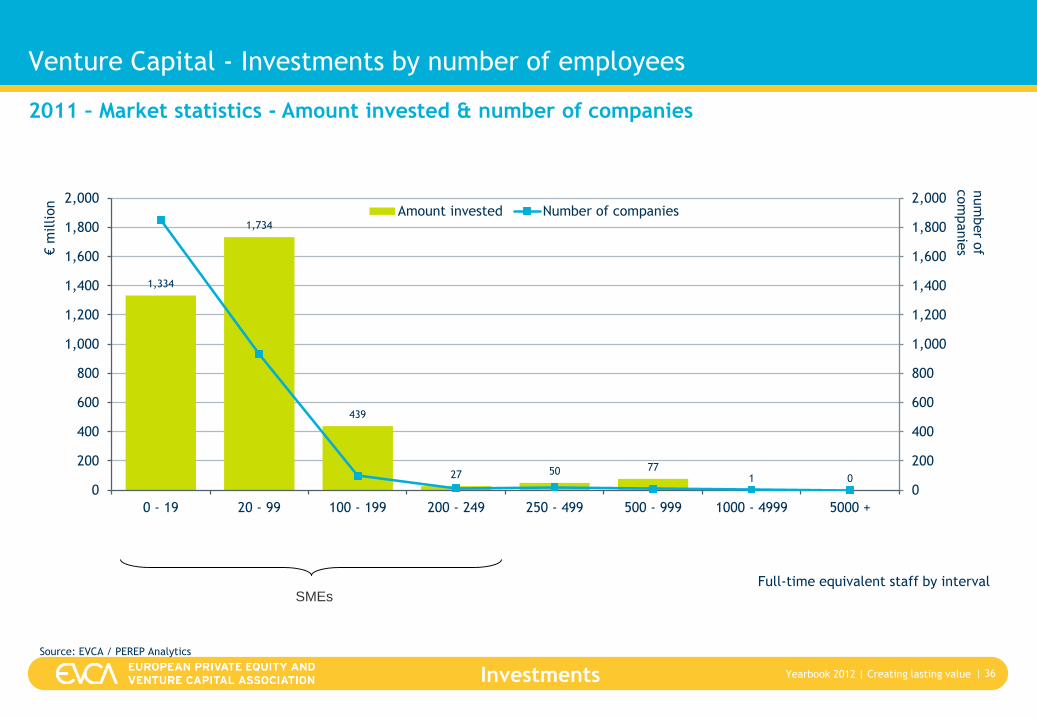
Investments by number of employees
| 35
Full-time equivalent staff by interval
2011 - Market statistics - % of number of companies financed
Source: EVCA / PEREP Analytics
Venture Capital
Buyout & Growth
All Private Equity
63.3%
31.9%3.3%
0.4%
0.7%
0.3%0.1%
0.0%
10.3%
26.8%
17.9%5.7%
13.2%
10.5%
12.6%
3.1%
42.8%
29.9%
9.0%
2.5%
5.5%
4.2%
5.0% 1.2%
0 - 19
20 - 99
100 - 199
200 - 249
250 - 499
500 - 999
1000 - 4999
5000 +
42.8%
29.9%
9.0%
2.5%
5.5%
4.2%
5.0% 1.2%
0 - 19
20 - 99
100 - 199
200 - 249
250 - 499
500 - 999
1000 - 4999
5000 +
| Creating lasting value YearBook 2011 | Creating lasting value Yearbook 2012 Investments
Venture Capital - Investments by number of employees
| 36
Full-time equivalent staff by interval
2011 – Market statistics - Amount invested & number of companies
Source: EVCA / PEREP Analytics
1,334
1,734
439
27 50 771 0
0
200
400
600
800
1,000
1,200
1,400
1,600
1,800
2,000
0
200
400
600
800
1,000
1,200
1,400
1,600
1,800
2,000
0 - 19 20 - 99 100 - 199 200 - 249 250 - 499 500 - 999 1000 - 4999 5000 +
num
ber o
f com
panie
s€m
illion
Amount invested Number of companies
SMEs
| Creating lasting value YearBook 2011 | Creating lasting value Yearbook 2012 Investments
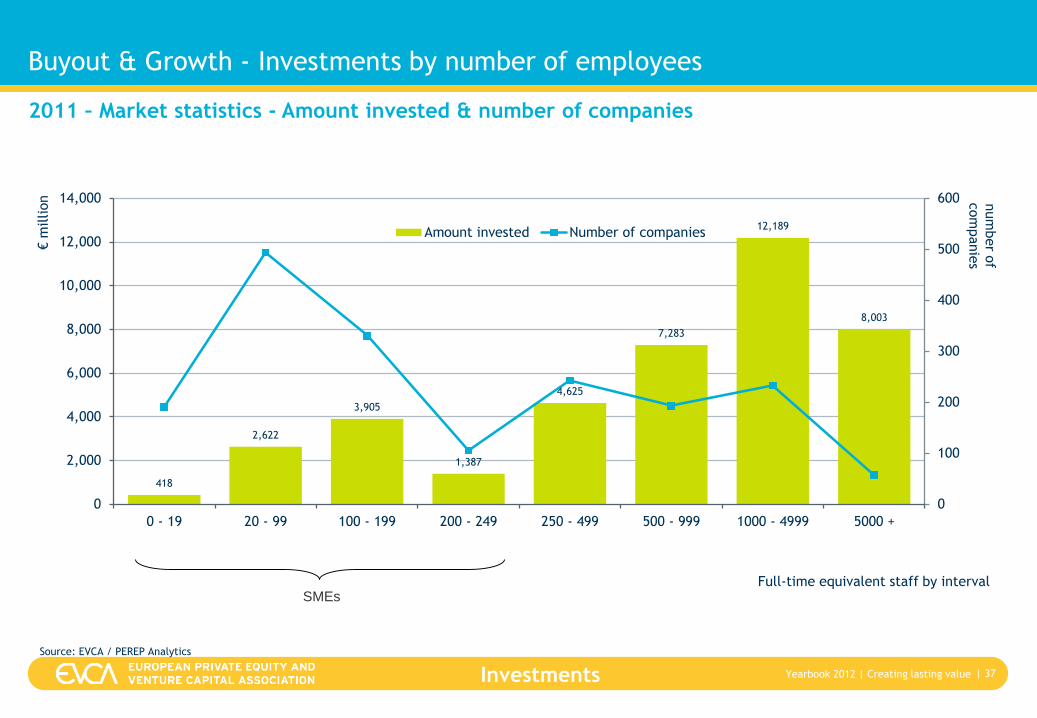
Buyout & Growth - Investments by number of employees
| 37
2011 – Market statistics - Amount invested & number of companies
Source: EVCA / PEREP Analytics
418
2,622
3,905
1,387
4,625
7,283
12,189
8,003
0
100
200
300
400
500
600
0
2,000
4,000
6,000
8,000
10,000
12,000
14,000
0 - 19 20 - 99 100 - 199 200 - 249 250 - 499 500 - 999 1000 - 4999 5000 +
num
ber o
f com
panie
s
€m
illion
Amount invested Number of companies
SMEsFull-time equivalent staff by interval
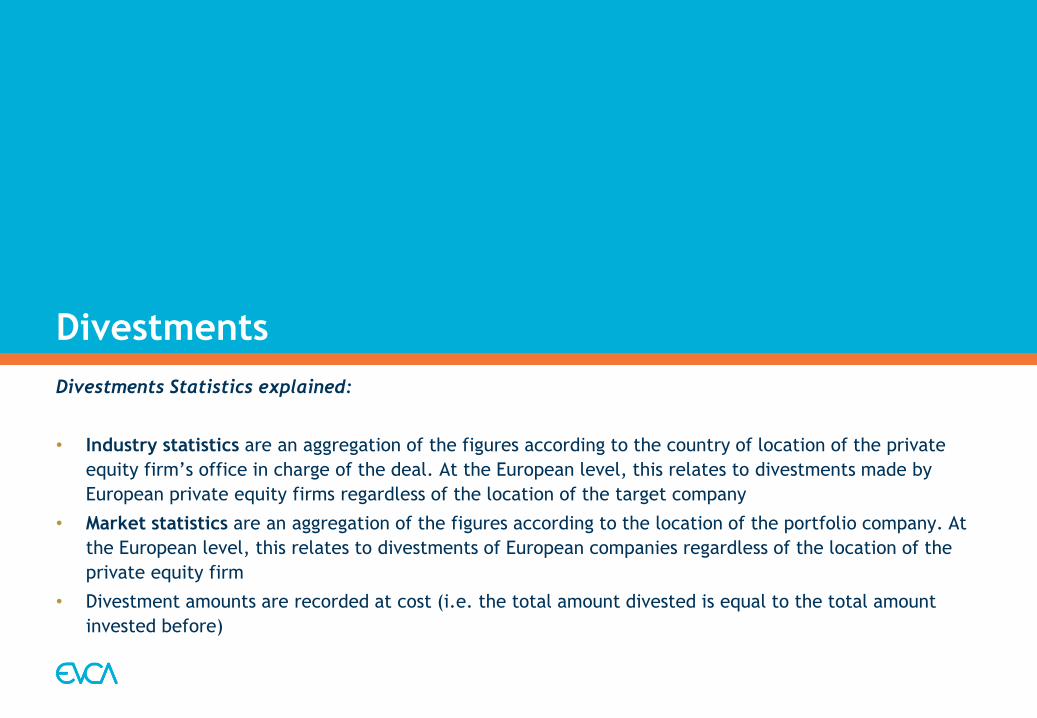
Divestments
Divestments Statistics explained:
• Industry statistics are an aggregation of the figures according to the country of location of the private
equity firm’s office in charge of the deal. At the European level, this relates to divestments made by
European private equity firms regardless of the location of the target company
• Market statistics are an aggregation of the figures according to the location of the portfolio company. At
the European level, this relates to divestments of European companies regardless of the location of the
private equity firm
• Divestment amounts are recorded at cost (i.e. the total amount divested is equal to the total amount
invested before)
| Creating lasting value YearBook 2011 | Creating lasting value Yearbook 2012 Divestments
Glossary – Divestment Stages
| 39
• Divestment by public offering: the sale or distribution of a company’s shares to the public for the first time by listing the
company on the stock exchange, also includes sale of quoted shares after a lock-up period
• Repayment of principal loans: If a private equity firm provided loans or bought preference shares in the company at the time of
investment, then their repayment according to the amortisation schedule represents a decrease of the financial claim of the
firm into the company, and hence a divestment.
• Repayment of silent partnership: A silent partnership belongs to the so-called mezzanine financing instruments. It is similar to
a long-term bank loan but, in contrast to a loan, a silent partnership is subject to a subordination clause, so that in the event of
insolvency all other creditors are paid before the silent partner. The company has to repay the partnership and has to pay
interest and possibly a profit-related compensation. The subordination clause gives the capital the status of equity despite its
loan character. This financing instrument is frequently used in Germany.
• Sale to another private equity house: See sale to financial institution.
• Sale to financial institution: The sale of company shares to banks, insurance companies, pension funds, endowments,
foundations and other asset managers other than private equity firms.
• Trade sale: The sale of company shares to industrial investors.
• Divestment by write-off: The total or partial write-down of a portfolio company’s value to zero or a symbolic amount (sales for
a nominal amount) with the consequent exit from the company or reduction of the share owned. The value of the investment is
eliminated and the return to investors is equal or close to -100%.
| Creating lasting value YearBook 2011 | Creating lasting value Yearbook 2012 Divestments
Divestment at cost – Venture Capital / Buyout & Growth
| 40
2007–2011 - Industry statistics – Amount & Number of companies
Source: EVCA / PEREP Analytics
3.4 2.7 2.5 2.3 2.6
23.7
11.5
9.3
17.2
27.8
0
500
1,000
1,500
2,000
2,500
0.0
5.0
10.0
15.0
20.0
25.0
30.0
35.0
2007 2008 2009 2010 2011
Num
ber o
f com
panie
s
€billion
VC - Amount divested Buyout & Growth - Amount divested
VC - Number of companies Buyout & Growth - Number of companies
| Creating lasting value YearBook 2011 | Creating lasting value Yearbook 2012 Divestments
Divestment at cost by exit route
| 41
2007-2011 - Industry Statistics - Amount at cost
Source: EVCA / PEREP Analytics
7.0
5.5
3.3
4.4
11.2
2.6
0.7
1.4
2.3
3.9
0.8 0.9
4.1 4.0 3.9
0.2 0.2 0.1 0.10.3
4.0
0.9
0.40.7
1.2
9.2
4.1
1.0
6.3
7.8
1.3
0.70.5 0.5
1.3
0.7 0.7 0.60.8 0.7
1.3
0.70.3 0.4
0.2
0
2
4
6
8
10
12
2007 2008 2009 2010 2011
€billion
Trade sale Public offering Write-off
Repayment of silent partnerships Repayment of principal loans Sale to another PE Firm
Sale to financial institution Sale to management Other means
| Creating lasting value YearBook 2011 | Creating lasting value Yearbook 2012 Divestments
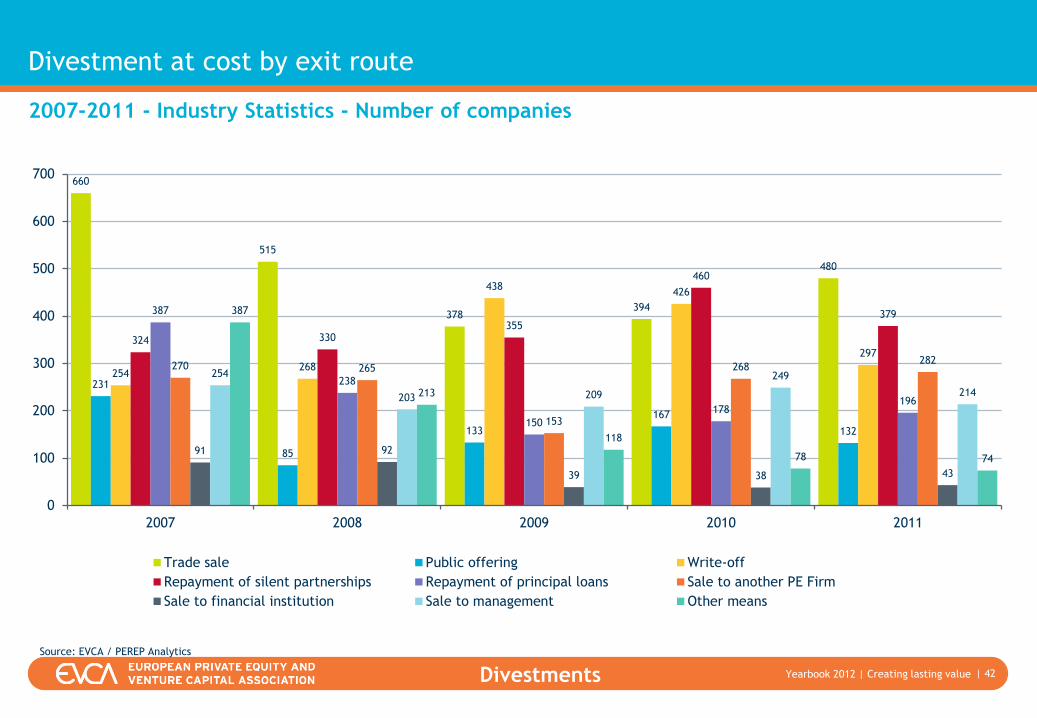
Divestment at cost by exit route
| 42
2007-2011 - Industry Statistics - Number of companies
Source: EVCA / PEREP Analytics
660
515
378394
480
231
85
133
167
132
254268
438426
297
324 330355
460
379387
238
150
178196
270 265
153
268282
91 92
39 38 43
254
203 209
249
214
387
213
118
78 74
0
100
200
300
400
500
600
700
2007 2008 2009 2010 2011
Trade sale Public offering Write-off
Repayment of silent partnerships Repayment of principal loans Sale to another PE Firm
Sale to financial institution Sale to management Other means
| Creating lasting value YearBook 2011 | Creating lasting value Yearbook 2012 Divestments
Divestment at cost by exit route – Venture Capital / Buyout & Growth
| 43
Buyout & Growth Venture
2011 - Market Statistics - % of Amount
Source: EVCA / PEREP Analytics
46.7%
14.8%
12.8%
3.3%
1.6%
11.4%
3.3%3.8% 2.4%
Trade sale
Public offering
Write-off
Repayment of silent partnerships
Repayment of principal loans
Sale to another PE Firm
Sale to financial institution
Sale to management
Other means
46.7%
14.8%
12.8%
3.3%
1.6%
11.4%
3.3%3.8%
2.4%
Trade sale
Public offering
Write-off
Repayment of silent partnerships
Repayment of principal loans
Sale to another PE Firm
Sale to financial institution
Sale to management
Other means
36.2%
11.7%
12.9%
0.9%
3.8%
27.7%
4.3%2.1% 0.4%
27.3 bn EUR 2.3 bn EUR
| Creating lasting value YearBook 2011 | Creating lasting value Yearbook 2012 Divestments
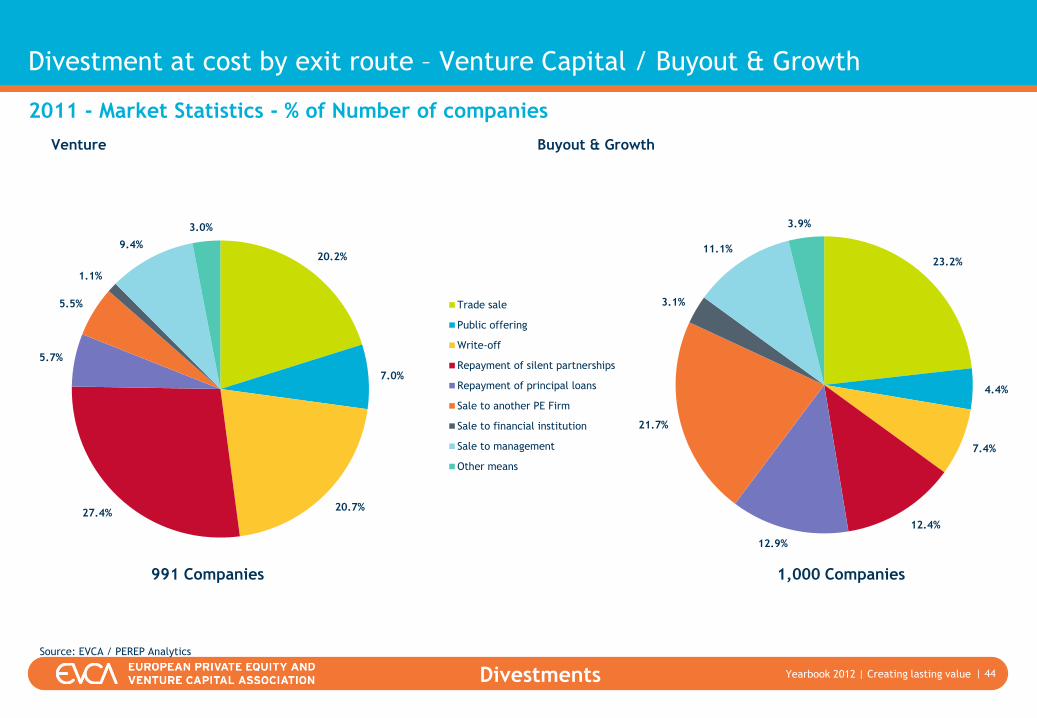
Divestment at cost by exit route – Venture Capital / Buyout & Growth
| 44
Venture Buyout & Growth
2011 - Market Statistics - % of Number of companies
Source: EVCA / PEREP Analytics
46.7%
14.8%
12.8%
3.3%
1.6%
11.4%
3.3%3.8% 2.4%
Trade sale
Public offering
Write-off
Repayment of silent partnerships
Repayment of principal loans
Sale to another PE Firm
Sale to financial institution
Sale to management
Other means
20.2%
7.0%
20.7%27.4%
5.7%
5.5%
1.1%
9.4%
3.0%
Trade sale
Public offering
Write-off
Repayment of silent partnerships
Repayment of principal loans
Sale to another PE Firm
Sale to financial institution
Sale to management
Other means
23.2%
4.4%
7.4%
12.4%
12.9%
21.7%
3.1%
11.1%
3.9%
991 Companies 1,000 Companies
| Creating lasting value YearBook 2011 | Creating lasting value Yearbook 2012 Divestments
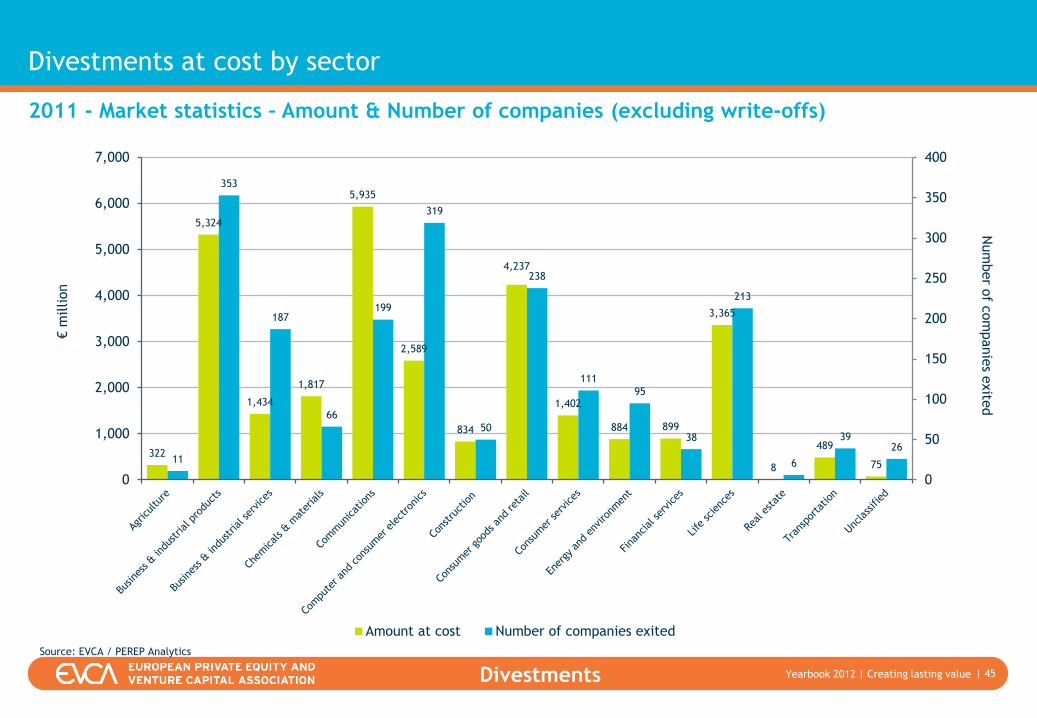
Divestments at cost by sector
| 45
2011 - Market statistics – Amount & Number of companies (excluding write-offs)
Source: EVCA / PEREP Analytics
322
5,324
1,434
1,817
5,935
2,589
834
4,237
1,402
884 899
3,365
8
489
7511
353
187
66
199
319
50
238
111
95
38
213
6
3926
0
50
100
150
200
250
300
350
400
0
1,000
2,000
3,000
4,000
5,000
6,000
7,000
Num
ber o
f com
panie
s exite
d€
million
Amount at cost Number of companies exited
| Creating lasting value YearBook 2011 | Creating lasting value Yearbook 2012 Divestments
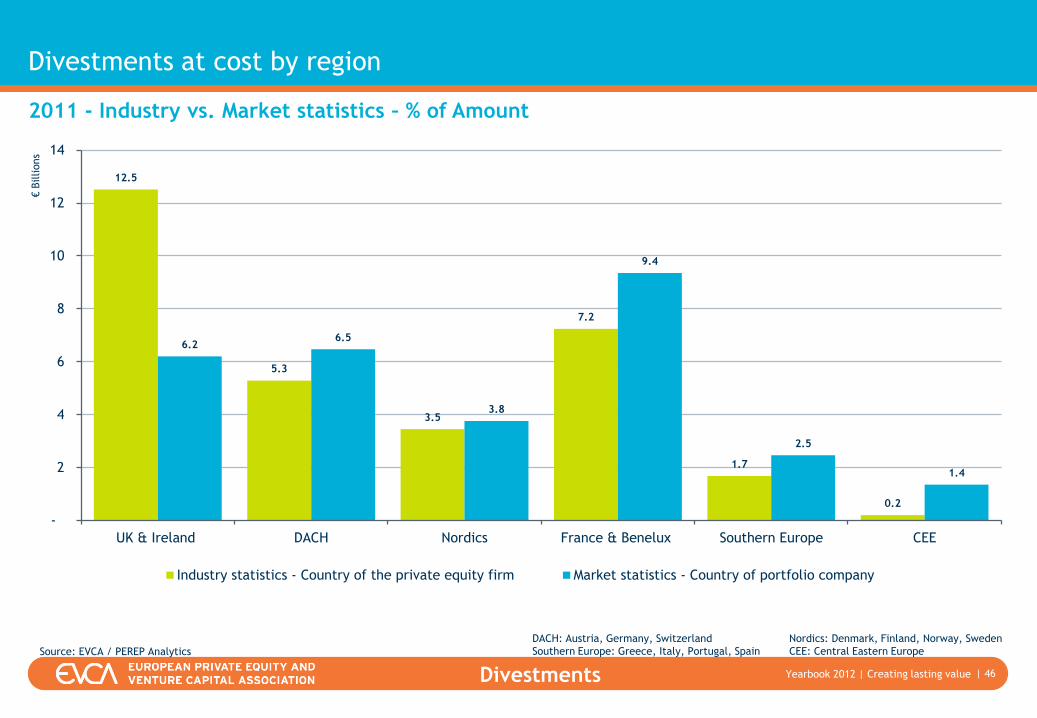
Divestments at cost by region
| 46
2011 - Industry vs. Market statistics – % of Amount
12.5
5.3
3.5
7.2
1.7
0.2
6.26.5
3.8
9.4
2.5
1.4
-
2
4
6
8
10
12
14
UK & Ireland DACH Nordics France & Benelux Southern Europe CEE
€Billions
Industry statistics - Country of the private equity firm Market statistics - Country of portfolio company
Source: EVCA / PEREP Analytics
DACH: Austria, Germany, Switzerland
Southern Europe: Greece, Italy, Portugal, Spain
Nordics: Denmark, Finland, Norway, Sweden
CEE: Central Eastern Europe
| Creating lasting value YearBook 2011 | Creating lasting value Yearbook 2012
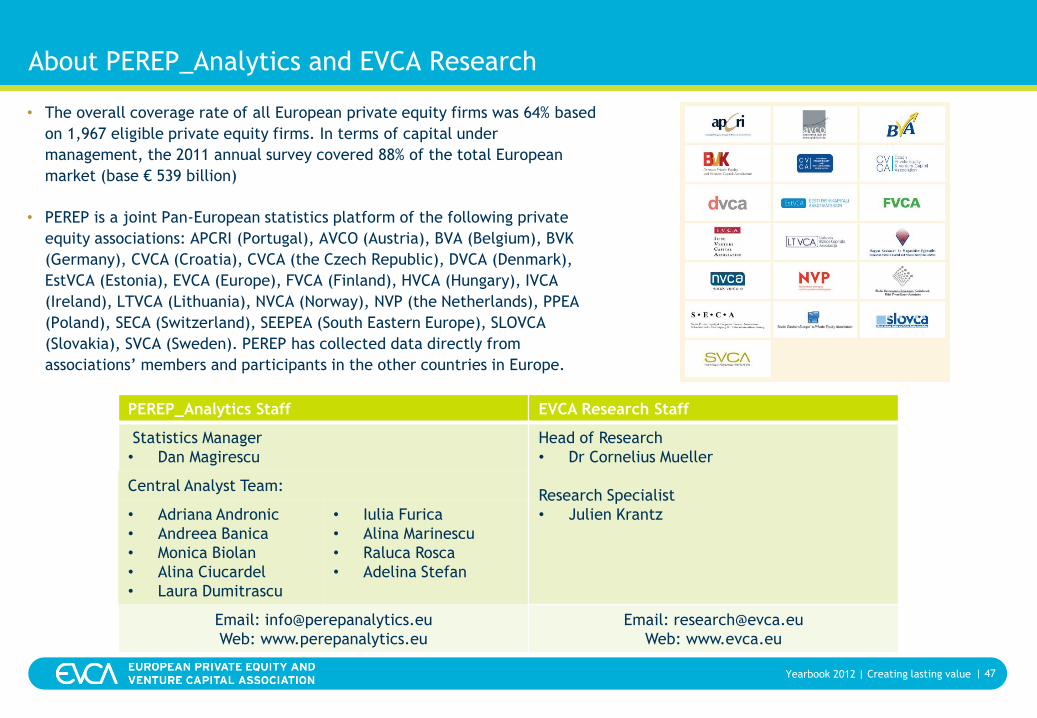
About PEREP_Analytics and EVCA Research
| 47
• The overall coverage rate of all European private equity firms was 64% based
on 1,967 eligible private equity firms. In terms of capital under
management, the 2011 annual survey covered 88% of the total European
market (base € 539 billion)
• PEREP is a joint Pan-European statistics platform of the following private
equity associations: APCRI (Portugal), AVCO (Austria), BVA (Belgium), BVK
(Germany), CVCA (Croatia), CVCA (the Czech Republic), DVCA (Denmark),
EstVCA (Estonia), EVCA (Europe), FVCA (Finland), HVCA (Hungary), IVCA
(Ireland), LTVCA (Lithuania), NVCA (Norway), NVP (the Netherlands), PPEA
(Poland), SECA (Switzerland), SEEPEA (South Eastern Europe), SLOVCA
(Slovakia), SVCA (Sweden). PEREP has collected data directly from
associations’ members and participants in the other countries in Europe.
PEREP_Analytics Staff EVCA Research Staff
Statistics Manager
• Dan Magirescu
Head of Research
• Dr Cornelius Mueller
Research Specialist
• Julien Krantz
Central Analyst Team:
• Adriana Andronic
• Andreea Banica
• Monica Biolan
• Alina Ciucardel
• Laura Dumitrascu
• Iulia Furica
• Alina Marinescu
• Raluca Rosca
• Adelina Stefan
Email: [email protected]
Web: www.perepanalytics.eu
Email: [email protected]
Web: www.evca.eu
EVCA European Private Equity and Venture Capital Association
Bastion Tower
Place du Champs de Mars 5
B – 1050 Brussels – Belgium
www.evca.eu
Tel: +32 2 715 00 20