Embed Size (px)
Citation preview

Year One Canopy Report March 2019

1
Executive Summary In 2017, the Washington State Liquor and Cannabis Board (WSLCB) requested specific information about the statewide utilization of licensed cannabis canopy space. The Canopy Project was developed to collect relevant data from all producers and accurately analyze current use of licensed space. Methods of quantitative data collection were jointly developed and tested by the Canopy Analyst Team (CAT), including but not limited to, the investigation into the use of drone platforms for outdoor canopy measurement. During the first year the CAT attempted to survey 1,155 licensees. The CAT completed 792 surveys, encountered 254 licensees that reported no canopy, and was unable to survey 109 licensees. The 792 completed surveys consisted of 778 staff surveys and 14 drone surveys. The data indicates that, on average, both indoor and outdoor canopy space is underutilized. The team did encounter licensees producing above their allotted licensed canopy space however those observations were a small percentage of all observations. Detailed results and interpretation is available in the quantitative data section of this report. Introduction WAC 314-55-010 (30) defines plant canopy as: Plant canopy means the square footage dedicated to live plant production, such as maintaining mother plants, propagating plants from seed to plant tissue, clones, vegetative or flowering area. Plant canopy does not include areas such as space used for the storage of fertilizers, pesticides, or other products, quarantine, office space, etc. In accordance with this definition the agency has further defined licensed canopy space by tier structure in WAC 314-55-075 (6):
The maximum amount of space for marijuana production cannot exceed the amount licensed. Applicants must designate on their operating plan the size category of the production premises and the amount of actual square footage in their premises that will be designated as plant canopy. There are three categories as follows: (a) Tier 1 – Less than two thousand square feet; (b) Tier 2 – Two thousand square feet up to ten thousand square feet; and (c) Tier 3 – Ten thousand square feet up to thirty thousand square feet.
The WSLCB receives information about canopy from both licensing documents and the traceability system. Licensing documentation for cannabis producers provides the first data point for the canopy survey through production facility operating and floor plans. The traceability system stores the inventory records of cannabis plants currently being

2
cultivated at a given facility. Neither of these systems provide firsthand information about how licensed space is being utilized to grow cannabis. The CAT supplements traceability and licensing documentation by gathering firsthand observations of the licensed canopy. This data can be utilized to more thoroughly analyze and develop rules, policies, and to create tools for the WSLCB to better understand the production of cannabis within the industry. Data Collection Canopy survey data collection consists of collecting measurements, indicating the type of growing methodology and performing simple inventory of live cannabis plants present on the premises at the day of site visit. Due to the specificity of task, time constraints, and limited staff, the most effective method of data collection was to estimate plant dimensions for groups of plants if they were reasonably similar. Acknowledging that the data in the quantitative data section of this report are primarily estimates is key to understanding and use of the canopy survey results. One of the most valuable project outcomes was an opportunity to collect and analyze qualitative data from cannabis producers. The qualitative data section contains summarized thoughts from conversations team members had while interacting with cannabis producers, questions asked during survey visits, challenges and concerns that licensees expressed. These topics are closely related to agency policy conversations regarding canopy and this report offers recommendations where clarification could benefit the agency and licensees. These recommendations will focus on the following topics: 1. Canopy measurement 2. Canopy utilization 3. Canopy space vs yield Quantitative Data Methods The canopy survey began with method trials and, after a short period, the team drafted its survey procedure and data collection methods.1 Rather than measuring every cannabis plant individually, the canopy team designed a methodology that would utilize plant dimensions for groups of plants if they were reasonably similar. In addition to capturing plant dimensions, the canopy team also recorded general methods and conditions in which the cannabis was being grown. While the survey was not optional, surveys were scheduled in advance with licensees. The data from this survey can inform the Board about the general use and description of cannabis canopy statewide. It seems likely that it may be looked at in other contexts so
1Director’s Office Division Policy #550 Surveying Cannabis Canopy Director’s Office Division Policy #550A Scheduling Canopy Surveys Director’s Office Division Task #550A-1 Preparing and Conducting the Canopy Survey

3
it is important to outline the advantages and disadvantages of the survey methods so the data provided can be used correctly in most circumstances. Advantages The main advantages of these methods are leveraged towards the project purpose of providing a state wide description of the state of canopy to the board. Using estimation was crucial in achieving the number of surveys the canopy team was able to complete. When measuring individual plants canopy team members surveyed cannabis at the rate of about 470 plants per hour. After the team began to estimate the dimensions of similar plants, this rate increased by a factor of almost two (approximately 890 plants per hour). The canopy team was able to take observations at 86 percent of facilities in the state with active canopy.2 If the team had continued to survey each plant individually, it seems likely that they would have covered significantly less ground. The other main advantage of the canopy team’s survey method is that it provides significant context to the measurements taken in the field. This means that the survey measurements can be disaggregated into categories based off tier, grow structure, water and nutrient delivery, flowering or vegetative state, and a handful of other categories. The intent is that the canopy information is detailed enough to provide adequate description while not being overly specific or time consuming to collect. Disadvantages The main disadvantages are mostly relevant to purposes outside of the stated goal of the project. It is important to acknowledge that the physical dimensions of cannabis at a given location are based on plant measurement of a representative sample. The sample measurements are applied to the overall grow providing an estimate of the size of each plant. This means that while the data should give a good general idea about the level of canopy at a given grow, it does not reflect a hand measurement of each individual plant. Additionally, canopy survey data may understate full canopy at a location where the survey took observations on immature full term crops.3 In order to make it to as many licensed producers as possible, and attempt to capture the most accurate data, the canopy team began surveying outdoor producers in May 2018.
4 2 792 canopy surveys conducted( 778 staff surveys and 14 drone surveys), 254 licenses without active canopy, 109 licenses not surveyed 3 Full term crop refers to a crop of cannabis that is transitioned into a flowering state off of the natural change of the seasons as opposed to crops that are artificially forced into flower through artificial light/light deprivation. 4 Photograph of an outdoor producer growing a full term crop.

4
Survey Results Tier Distribution: Over the course of the first year the canopy team conducted 778 staff canopy surveys and 14 drone surveys. The team also made contact with 254 licensees that claimed to have no active canopy during the survey. There were an additional 109 licensees that the canopy team was unable to survey. This totals 1155 licenses which falls just short of the 1179 currently active producer licenses.5 The difference between these two totals likely reflects turnover in licensed producers and the completion of the producer licensing process. Of the 792 producers surveyed 17 percent were Tier 1, 45 percent were Tier 2, and 38 percent were Tier 3. The majority of Tier 1 and Tier 2 producers were indoor. Tier 3 producers were fairly evenly split between indoor and outdoor leaning toward outdoor production.
Canopy Utilization: The majority of active canopy square footage observed was split between indoor and outdoor Tier 3 producers who represent approximately 70 percent of all active canopy observed. Comparing the licensed space to observed canopy at these locations, these producers were utilizing on average 38 percent of their licensed space. Tier 2 producers occupied 28 percent of observed active canopy and appeared to be using 42 percent of their licensed canopy space. This trend follows to tier 1 producers who constitute 3 percent of total observed canopy and on average occupied 41 percent of their licensed canopy space.
5 Retrieved 11/20/2018, reflects all active issued and all active pending licenses as of this date. This number should change as licensee are closed or transition between parties so it should be viewed as an approximate total of licensed producers.
Count of Surveyed ProducersCount Of Producers Percentage of Total
Tier 1 Producer 135 17.05%Greenhouse 7 0.88%Indoor 117 14.77%Outdoor 11 1.39%Tier 2 Producer 353 44.57%Greenhouse 19 2.40%Hoop House 15 1.89%Indoor 235 29.67%Outdoor 84 10.61%Tier 3 Producer 304 38.38%Greenhouse 29 3.66%Hoop House 22 2.78%Indoor 119 15.03%Outdoor 134 16.92%Grand Total 792 100.00%

5
The chart on the following page provides a breakdown of observed canopy use by tier and by facility type. The first column reflects what percentage of the total active canopy that particular category represents. The second column is the sum total of all of the active canopy observed for that particular category. The third column shows the total plants observed for each category. The fourth column shows the sum total of the licensed canopy space for the observed producers in those categories. The final column shows the proportion of active canopy to licensed canopy for that category.
6
Proportion of Total Active CanopyTotal Active Canopy Area
Total PlantsTotal Licensed Canopy Area
Proportion Licensed Area Used
Tier 1 Producer2.8%
116,189
45,218
281,171
41%Greenhouse
0.1%6,015
2,553
12,800
47%
Indoor 2.4%
96,155
40,939
247,971
39%O
utdoor0.3%
14,018
1,726
20,400
69%Tier 2 Producer
27.5%1,121,089
358,941
2,694,717
42%
Greenhouse1.6%
64,938
15,613
151,800
43%Hoop House
1.6%67,063
15,636
143,500
47%
Indoor 15.7%
641,053
243,501
1,655,084
39%O
utdoor8.5%
348,035
84,191
744,333
47%Tier 3 Producer
69.7%2,840,917
652,540
7,621,811
37%
Greenhouse4.5%
184,124
55,841
777,180
24%Hoop House
8.1%331,124
57,988
541,987
61%
Indoor 19.2%
783,245
318,889
2,605,641
30%O
utdoor37.8%
1,542,424
219,822
3,697,003
42%Grand Total
100%4,078,195
1,056,699
10,597,699
38%
Observed Canopy Area (SQ
FT)

7
Licenses Not Surveyed The CAT encountered 254 licenses throughout the first year of the project who reported to have no active canopy. The team recorded a general explanation for no active canopy for each of these licenses. The following table provides a breakdown of these licenses by tier and explanation the canopy team received.
Of the licensees with no active canopy WSLCB Licensing records show 67 licenses have been discontinued during the course of the survey year. This leaves 187 licensees with an active license and reported no canopy. There were 109 licensees that the canopy team was not able to survey. The CAT failed to survey these licensees for various reasons such as: multiple scheduling attempts with no response, safety concerns, and time factors. Over the course of the survey 10 of these licenses have been discontinued, resulting in 99 active licenses which were not surveyed as part of year one data collection. Over Canopy There were 48 surveys for which canopy figures were in excess of allowed tier square footage. Some of these appeared over by a handful of square feet while others were twice their allowed space. To properly interpret this group it is important to remember that the canopy survey methods were not designed to make determinations of canopy compliance at a specific license and that the survey was not able to observe all the outdoor canopy when it was at its largest. So this list should not be viewed as determinate or exhaustive. The top 10 licensees in raw square footage from this list are tier three producers and they range from 5,000 to 21,000 over according the canopy survey. Nine are outdoor producers and one is an indoor producer. Characteristics from these cases can provide helpful insight into where production over canopy may occur. Interpretation During the course of the project the canopy team consistently observed less active canopy than what was licensed. The canopy survey takes in measurements of the plants present while the survey is being conducted which means that the data can reflect turn over and change in productions space better than a simple floor plan. For example, if a facility has three flowering rooms on its floor plan, but in reality only has two that are fully operational, the canopy survey would capture this difference and show less active canopy for that facility.
Teir Intending to Grow Selling Moving Closing Grand Total1 28 11 13 11 632 44 15 23 26 1083 34 14 21 14 83
Grand Total 106 40 57 51 254
Count Of Producers With No Active Canopy

8
Conversely outdoor canopy surveys that were conducted earlier in the growing season would provide canopy measurements on immature plants and therefore may reflect an underestimate of that facilities canopy at harvest. At both indoor and outdoor producers, canopy should fluctuate as plants grow to the desired shape for production. At indoor facilities operating with a rolling harvest schedule any observation would constitute a generally accurate observation of full canopy. At outdoor facilities operating a single full term crop, only observations of the canopy after the initial flower stretch could provide any kind of accurate estimate of canopy size. With these two reservations in mind there are some simple adjustments that can be made with fairly reasonable assumptions. If the licenses that reported no active canopy are added into the total licensed canopy space, the proportion of active to licensed space drops from 38 to 32 percent6. By adding in licenses with no active canopy the percentage of total canopy utilized should be expected to fall. We can attempt to account for the survey missing the full size of outdoor canopy space by projecting with the survey data to determine the average size of a mature outdoor plant and the number of outdoor plants surveyed. Assuming an average plant size of 13 square feet7 multiplied by the total the number of plants surveyed at outdoor grows, produces a projection of 4,066,329 square feet of outdoor canopy. This projection is an increase to total outdoor canopy, which agrees with our assumptions that our observations underestimate of outdoor canopy space. Combing these two adjustments projects that approximately 67 percent of outdoor licensed space and 49 percent of total licensed space is being utilized. Neither of these adjustments attempted to incorporate the 109 licenses not surveyed due to a lack of data on those licenses’ canopy. Even accounting for adjustments, there appears to be less canopy in cultivation than has been licensed by the WSLCB. In speaking to licensees the team has heard a number of possible explanations for the current state of canopy. The general narrative includes: it is expensive to develop canopy space, market prices for cannabis have been consistently declining, access to capital investment is problematic, and the traceability transition has been difficult. Qualitative Data To facilitate surveys, canopy specialists worked directly with licensees in the field. That experience granted each team member with a wealth of qualitative information about producers. In order to capture and parse all of this information each canopy specialist made a lists of the most common questions, concerns, and challenges they would hear about in the field. The following section discusses items that are common between the lists of each canopy specialist. 6 The 187 licenses that the canopy team had reports of no active canopy represent 2,131,182 square feet of licensed canopy space. 7 Mean value (13.3, +/- 0.13, 95% confidence) derived from all mature (150-180 days old) outdoor observations of non-ruderalis cannabis plants.

9
Over Production Licensees expressed concerns about over production. It was common for licensees to state a belief that there was too much cannabis on the market and that some producers were growing more than they were allowed. The data shows that few farms are growing outside of their licensed space and that many farms are growing less than their maximum. The canopy survey data does not contain yield figures to connect canopy space to the level of production. Under Canopy Licensees were generally concerned that the WSLCB may decrease their canopy due to under use. As outlined in the quantitative section, many facilities appear to be using less space than what they are licensed for so it makes sense that the team would encounter concerns about under use. Canopy Measurement Licensees often asked canopy team members “How do you measure cannabis canopy?” and “What will this data be used for?” The intent of this project is to collect firsthand observations of canopy in order to make better informed decisions related to it. How we measured canopy is outlined in the data section, but it is just one way that canopy can be measured. Methods for canopy measurement is concerning to licensees because without clear direction for how canopy is measured it is difficult to make marginal choices about cultivating more or less cannabis. Traceability System Licensees would often point to the traceability system transition and market access as common points of challenge. The first year of the canopy project coincides with the move to contingency reporting and the canopy team was conducting surveys during the Leaf rollout. Market Access A prominent challenge for licensees was getting product to the retail market and on shelves. Producers suggested multiple avenues to improve market access including: increasing the number of retail outlets, allowing for producers to retail product, and farmers markets. Marketing cannabis appeared to be a challenge for many licenses. Licenses said that often new flower products were evaluated by stores on the most accessible retail indicators of quality: price, THC concentration, and bag appeal. New skews of products can be brought to market relatively quickly due to the short time it takes to cultivate cannabis and shelf-space is not expanding, so it seems likely that this problem will persist and products will continue to be evaluated with these retail indicators. Drone Survey In addition to the canopy survey, the canopy team also investigated the possible use of a remote drone platform for measuring outdoor canopy. A drone platform could provide highly accurate information on outdoor canopy in a short amount of time. Time savings
10
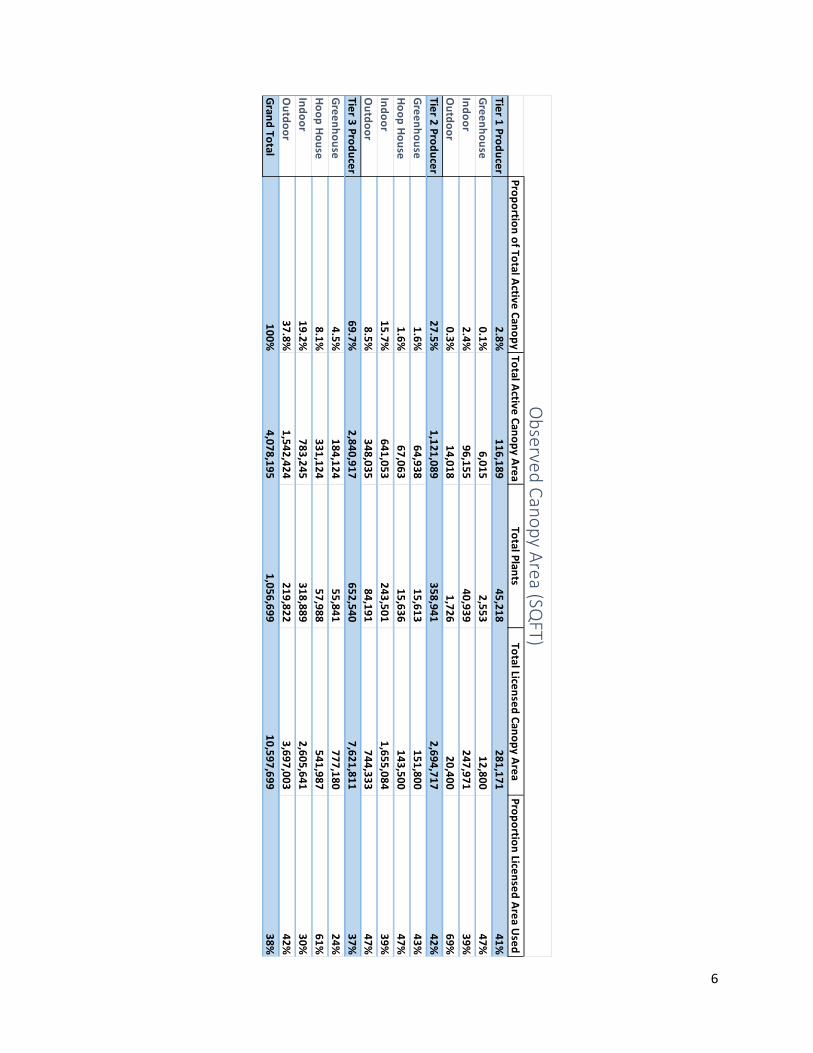
are critically important for outdoor canopy observation as many outdoor facilities grow a single seasonal crop. This means that much of the outdoor canopy is only fully filled out for a few months preceding the outdoor harvest. Due to this seasonal aspect of outdoor canopy there is a limited time to cover a large number of licenses over a wide geographic area. To start the canopy team reached out to the Department of Natural Resources (DNR) who are using drones to gather information on tree stands. Part of the information that DNR collects is tree counts and a canopy measurements. This application is similar to cannabis canopy measurement and DNR was willing to provide assistance.
8 The canopy team coordinated with the DNR to test the feasibility of drone use for canopy measurement over two days. This first day WSLCB and DNR went to a single licensed producer and took canopy observations both by hand and with the drone platform. The second day WSLCB and DNR visited 30 licensees and took observations with just the drone platform at 14 of those producers. Day One The main objective of the first day was to determine if drone canopy measurement was possible and if so what type of time savings could be expected with drone use. The WSLCB canopy team members conducted canopy measurement by hand on the ground while the DNR drone pilot conducted multiple flights at a variety of heights. The
8 Example of DNR’s tree canopy work.

11
drone measured the cultivation space in 3 minutes thirty seconds and determined that there was 14,194 square feet of cannabis in cultivation.9 It took 45 minutes to measure and estimate the radius of each individual plant and those measurements produced an overall estimate of 10,230 square feet. It took 10 minutes to measure the perimeter of the hoop houses in the growing space and that measurement produced an estimate of 20,100 square feet. This result appeared to be a clear indication of the general promise of the drone platform.
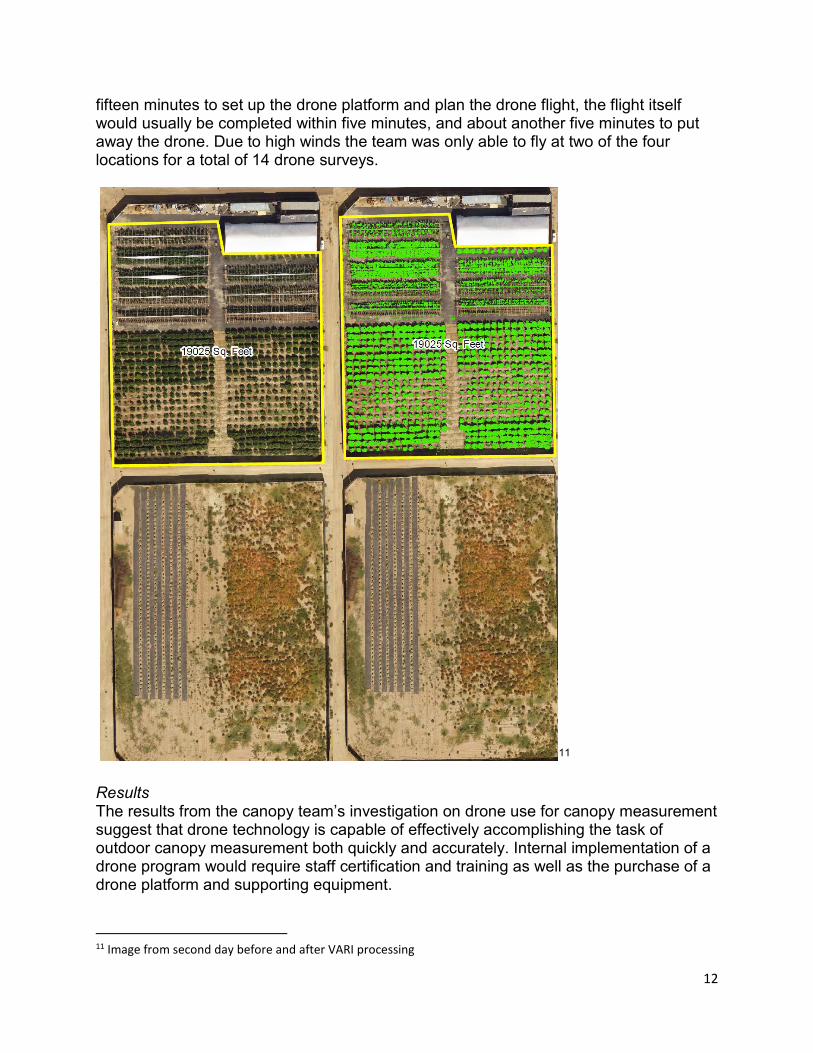
10 Day Two The focus of the second day was to test what the actual workflow and implementation of drone surveys would look like. To accomplish this a team member and a DNR drone pilot drove to four grow complexes in the Yakima valley totaling 30 licensed producers. These complexes were selected to play to the strengths of the technology since the drone would be most time efficient if it could survey multiple producers in a single flight. Once the drone pilot and the Canopy Specialist arrived at a complex it would take about 9 Drone Images were processed into a georeferenced orthomosaic image and then active canopy was determined by analysis against a visible atmospherically resistance index (VARI) 10 Orthomosaic image produced from first day drone footage. Red boxes determine where the VARI is applied. Green area was determined to be vegetative growth by comparison to the VARI.
12
fifteen minutes to set up the drone platform and plan the drone flight, the flight itself would usually be completed within five minutes, and about another five minutes to put away the drone. Due to high winds the team was only able to fly at two of the four locations for a total of 14 drone surveys.
11 Results The results from the canopy team’s investigation on drone use for canopy measurement suggest that drone technology is capable of effectively accomplishing the task of outdoor canopy measurement both quickly and accurately. Internal implementation of a drone program would require staff certification and training as well as the purchase of a drone platform and supporting equipment. 11 Image from second day before and after VARI processing

13
Recommendations Through conducting the canopy survey a number of outstanding policy questions and topics related to canopy were raised. This section provides a brief summary of each along with recommendations. Canopy Measurement Canopy is defined as square footage dedicated to the production of live plants.12 In April of 2017, the canopy team proposed measuring canopy by the square footage dedicated to live plant production on an official operating plan, submitted by the licensee, which is approved and retained by the WSLCB. After testing a number of methods to measure canopy, the team stands by this recommendation as it would allow for straight forward canopy inspection through comparison of reality to a floor plan document. In addition, a clear answer about how WSLCB measures canopy will help producers to make informed choices about their cultivation space and aid any effort to curb overproduction. Floor Plans Currently WAC require that the WSLCB must be supplied with “a floor plan or site plan drawn to scale which illustrates the entire operation being proposed”13 and that applicants must designate on their operating plan “the amount of actual square footage in their premise that will be designated as plant canopy.”14 After studying a number of floor plans currently available we believe that more specific floor plan documentation should be required for licensees who have exceeded their canopy space. Exceeding Canopy Limit From the canopy survey observations approximately 4 percent of licensees were growing in excess of their maximum square footage. Generally, the data skews moderately toward outdoor grows as the higher proportion over canopy. A relevant note is that outdoor canopy space is more difficult to measure than indoor. Indoor grows require artificial light which clearly defines the space dedicated to plant production and allows for multiple harvests during a 12 month period. In order to control and effectively monitor canopy, the team recommends establishing defined methods of indoor and outdoor canopy measurement and employing drone platforms for measurement of outdoor facilities. Underutilization of Canopy Current WAC states licensees must produce 50 percent of the canopy space listed in their operating plan by the end the first year of operation or the WSLCB may reduce the tier of licensure. 15The survey data suggests that many facilities would have insufficient canopy space to satisfy this requirement. Enforcing this WAC as written would be
12 WAC 314-55-010 13 WAC 314-55-020 (11)(a) 14 WAC 314-55-075 (6) 15 WAC 314-55-075

14
difficult due to the prevalence of underutilization of canopy and likely produce unintended effects on the market. Canopy vs Yield Canopy is the major production control in the Washington market so it makes sense that there is an expectation of a strong connection between canopy and yield; however, yield appears to be a highly complex outcome to project and not possible given current data. The size of the canopy is one factor in the production equation for a given producer, but there are other important factors such as plant varieties, cultivation methods, pest management, skill, environment, number of harvests, etc. Each of these variables can have drastic effects on yield and in some instances likely a stronger effect than canopy size. For example some indoor canopy is harvested up to five times a year while some outdoor canopy may only have a single harvest. This means that the connection between canopy and yield is not direct. Maintaining Canopy as a Production Control Canopy square footage still has many clear advantages as a production control. Canopy does not dictate cultivation techniques like a plant count would dictate less dense planting. Since canopy is only one part in the yield equation, innovative and hardworking licenses have the opportunity to seek out the highest level of production without risking hitting some imposed yield limit. Canopy limits also prevent any single license from expanding to a scale where they could levy disproportionate influence across the entire market. Production Method Consistently through the project the canopy team has run into differences between indoor and outdoor producers that make them distinct from one another in terms of canopy. The rules on canopy make no distinction between indoor and outdoor producers however they are very different and rule changes will likely affect them in disparate ways.
###

![Traceability for Sustainable Trade - UNECE · Traceability for Sustainable Trade] ECE/TRADE/429 2 . 1.2 The Purpose of the Traceability Framework . Current traceability systems are](https://img.pdfslide.us/doc/110x75/5e8a3f92a86eb50a5f7cd6db/traceability-for-sustainable-trade-unece-traceability-for-sustainable-trade-ecetrade429.jpg)


![A Survey on Usage Scenarios for Requirements Traceability ... · traceability support that suits practical needs [21]. With traceability practice, we mean the way in which traceability](https://img.pdfslide.us/doc/110x75/5ecd70c9403ddd79964b64ed/a-survey-on-usage-scenarios-for-requirements-traceability-traceability-support.jpg)