Embed Size (px)
Citation preview

Ravenna Training and Logistics Site (RTLS)
Route 80 Tank Farm Wetlands Mitigation Area
Charlestown Township, Portage County, Ohio
November, 2011
Year Five
Monitoring and Management Report

Year Five Monitoring and Management Report
Ravenna Training and Logistics Site (RTLS) Route 80 Tank Farm Wetlands Mitigation Area Charlestown Township, Portage County, Ohio
November, 2011
Prepared for: State of Ohio Adjutant General’s Department 2825 West Dublin-Granville Road Columbus, Ohio 43235-2789 614-336-6568
Prepared by: Davey Resource Group A Division of The Davey Tree Expert Company 1500 North Mantua Street P.O. Box 5193 Kent, Ohio 44240 800-828-8312

Davey Resource Group i November, 2011
Table of Contents Introduction.................................................................................................................................................... 1
Mitigation Site Description ............................................................................................................................. 1
Review of Mitigation Parameters and Monitoring Methodology.................................................................... 2
Monitoring Data—Year Five (2011) Results ................................................................................................. 4
Maintenance Concerns and Discussion ........................................................................................................ 7
Summary ....................................................................................................................................................... 7
References and Professional Staff ............................................................................................................... 7
Tables 1. Species Contained in Wetland Seed Mix ............................................................................................... 2 2. Summary of Results ............................................................................................................................... 5
Appendices A. Location of Study Area on Highway Map
B. Isolated Wetlands Ohio EPA Permit Approval
C. As-Built and 2011 Year Five Map
D. Photographs, Quadrat Descriptions, and Vegetation Coverage
E. Vegetation, Soils, and Hydrology Data Sheets for Each Monitoring Point
F. Definition of Wetlands Vegetation Indicator Status (from Reed, 1988)
G. 2011 Year Five Vegetation Communities Map
H. Plant Species Found at Ravenna Training and Logistics Site (RTLS) Route 80, Tank Farm Wetlands Mitigation Site
I. ORAM Form for Mitigation Wetland
J. VIBI Data
K. Animal Species Found at Ravenna Training and Logistics Site (RTLS) Route 80, Tank Farm Wetlands Mitigation Site
L. References Cited
M. Resumes of Professional Staff
Davey Resource Group 1 November, 2011
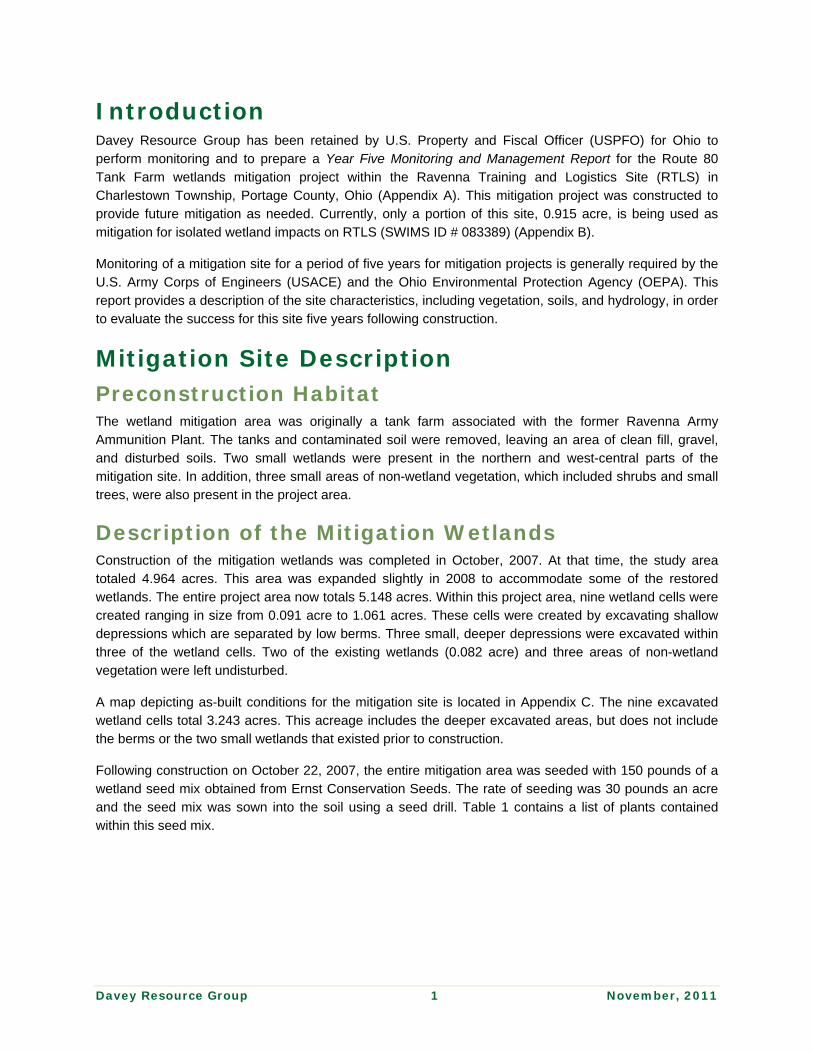
Introduction Davey Resource Group has been retained by U.S. Property and Fiscal Officer (USPFO) for Ohio to perform monitoring and to prepare a Year Five Monitoring and Management Report for the Route 80 Tank Farm wetlands mitigation project within the Ravenna Training and Logistics Site (RTLS) in Charlestown Township, Portage County, Ohio (Appendix A). This mitigation project was constructed to provide future mitigation as needed. Currently, only a portion of this site, 0.915 acre, is being used as mitigation for isolated wetland impacts on RTLS (SWIMS ID # 083389) (Appendix B).
Monitoring of a mitigation site for a period of five years for mitigation projects is generally required by the U.S. Army Corps of Engineers (USACE) and the Ohio Environmental Protection Agency (OEPA). This report provides a description of the site characteristics, including vegetation, soils, and hydrology, in order to evaluate the success for this site five years following construction.
Mitigation Site Description Preconstruction Habitat The wetland mitigation area was originally a tank farm associated with the former Ravenna Army Ammunition Plant. The tanks and contaminated soil were removed, leaving an area of clean fill, gravel, and disturbed soils. Two small wetlands were present in the northern and west-central parts of the mitigation site. In addition, three small areas of non-wetland vegetation, which included shrubs and small trees, were also present in the project area.
Description of the Mitigation Wetlands Construction of the mitigation wetlands was completed in October, 2007. At that time, the study area totaled 4.964 acres. This area was expanded slightly in 2008 to accommodate some of the restored wetlands. The entire project area now totals 5.148 acres. Within this project area, nine wetland cells were created ranging in size from 0.091 acre to 1.061 acres. These cells were created by excavating shallow depressions which are separated by low berms. Three small, deeper depressions were excavated within three of the wetland cells. Two of the existing wetlands (0.082 acre) and three areas of non-wetland vegetation were left undisturbed.
A map depicting as-built conditions for the mitigation site is located in Appendix C. The nine excavated wetland cells total 3.243 acres. This acreage includes the deeper excavated areas, but does not include the berms or the two small wetlands that existed prior to construction.
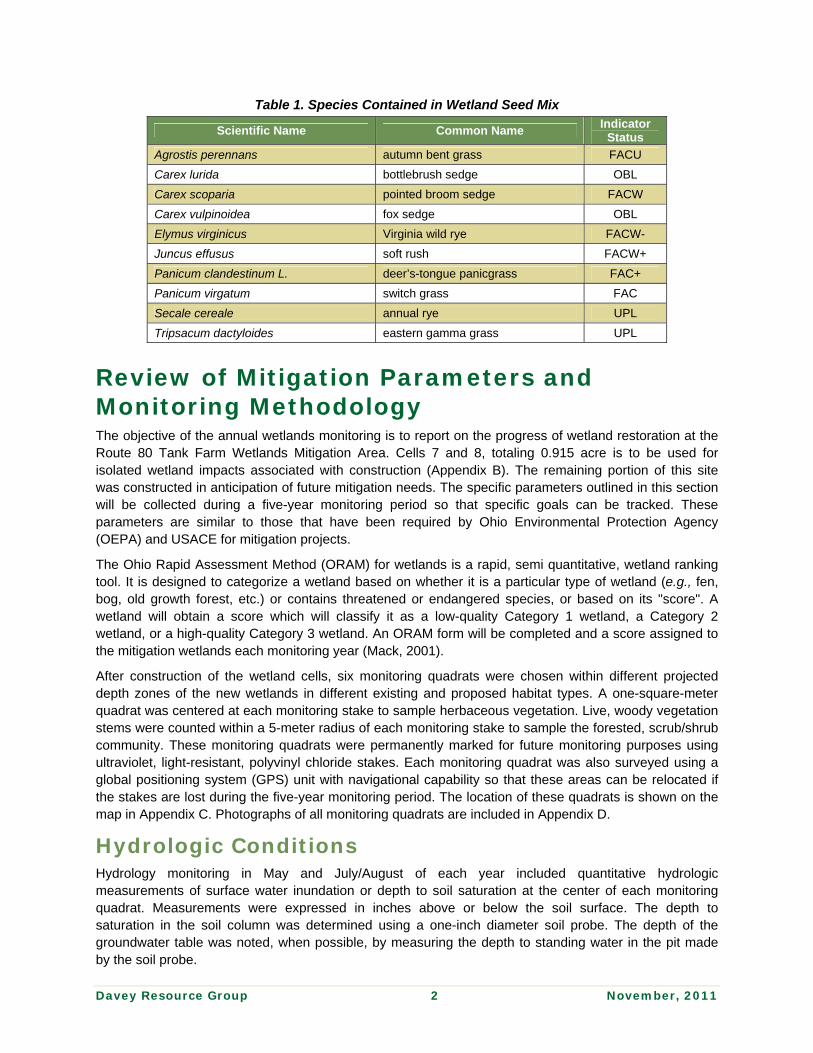
Following construction on October 22, 2007, the entire mitigation area was seeded with 150 pounds of a wetland seed mix obtained from Ernst Conservation Seeds. The rate of seeding was 30 pounds an acre and the seed mix was sown into the soil using a seed drill. Table 1 contains a list of plants contained within this seed mix.
Davey Resource Group 2 November, 2011
Table 1. Species Contained in Wetland Seed Mix
Scientific Name Common Name Indicator
Status
Agrostis perennans autumn bent grass FACU
Carex lurida bottlebrush sedge OBL
Carex scoparia pointed broom sedge FACW
Carex vulpinoidea fox sedge OBL
Elymus virginicus Virginia wild rye FACW-
Juncus effusus soft rush FACW+
Panicum clandestinum L. deer’s-tongue panicgrass FAC+
Panicum virgatum switch grass FAC
Secale cereale annual rye UPL
Tripsacum dactyloides eastern gamma grass UPL
Review of Mitigation Parameters and Monitoring Methodology The objective of the annual wetlands monitoring is to report on the progress of wetland restoration at the Route 80 Tank Farm Wetlands Mitigation Area. Cells 7 and 8, totaling 0.915 acre is to be used for isolated wetland impacts associated with construction (Appendix B). The remaining portion of this site was constructed in anticipation of future mitigation needs. The specific parameters outlined in this section will be collected during a five-year monitoring period so that specific goals can be tracked. These parameters are similar to those that have been required by Ohio Environmental Protection Agency (OEPA) and USACE for mitigation projects.
The Ohio Rapid Assessment Method (ORAM) for wetlands is a rapid, semi quantitative, wetland ranking tool. It is designed to categorize a wetland based on whether it is a particular type of wetland (e.g., fen, bog, old growth forest, etc.) or contains threatened or endangered species, or based on its "score". A wetland will obtain a score which will classify it as a low-quality Category 1 wetland, a Category 2 wetland, or a high-quality Category 3 wetland. An ORAM form will be completed and a score assigned to the mitigation wetlands each monitoring year (Mack, 2001).
After construction of the wetland cells, six monitoring quadrats were chosen within different projected depth zones of the new wetlands in different existing and proposed habitat types. A one-square-meter quadrat was centered at each monitoring stake to sample herbaceous vegetation. Live, woody vegetation stems were counted within a 5-meter radius of each monitoring stake to sample the forested, scrub/shrub community. These monitoring quadrats were permanently marked for future monitoring purposes using ultraviolet, light-resistant, polyvinyl chloride stakes. Each monitoring quadrat was also surveyed using a global positioning system (GPS) unit with navigational capability so that these areas can be relocated if the stakes are lost during the five-year monitoring period. The location of these quadrats is shown on the map in Appendix C. Photographs of all monitoring quadrats are included in Appendix D.
Hydrologic Conditions Hydrology monitoring in May and July/August of each year included quantitative hydrologic measurements of surface water inundation or depth to soil saturation at the center of each monitoring quadrat. Measurements were expressed in inches above or below the soil surface. The depth to saturation in the soil column was determined using a one-inch diameter soil probe. The depth of the groundwater table was noted, when possible, by measuring the depth to standing water in the pit made by the soil probe.
Davey Resource Group 3 November, 2011
The hydrologic goal is to achieve a mixture of areas which have seasonally to regularly inundated to saturated hydrologic regimes (Environmental Laboratory, 1987). The hydrology definitions refer to hydroperiods greater than 12.5 percent to 25 percent of the growing season for a seasonally inundated or saturated area, and greater than 25 percent to 75 percent of the growing season for a regularly inundated or saturated area. Wetland areas were planned in which a variety of water depths will be present from early spring to summer ranging from saturated soils to soils inundated with up to two feet of water.
Vegetation Information regarding plant species composition and percent cover within the monitoring quadrats was collected in July/August of each monitoring year. Plant identification resources used include Braun (1967, 1989), Newcomb (1977), and Weishaupt (1971).
The Floristic Quality Assessment Index (FQAI) is a value given to wetlands to assess the nativeness of an area based on the presence of conservative species (Andreas, 1995). The values are based upon how sensitive the plants are and whether or not they are indigenous to the area. A FQAI score was calculated during each monitoring year.
The Vegetation Index of Biotic Integrity (VIBI) is an intensive statistical wetlands monitoring methodology used by OEPA at mitigation sites that measures the ecological condition of wetlands. Monitoring protocols will follow the Integrated Wetland Assessment Program: Part 9: Field Manual for the Vegetation Index of Biotic Integrity for Wetlands v. 1.4 (Mack, 2007). Using the vegetation and hydrogeomorphic classes of the wetlands in conjunction with the VIBI data, inferences can be made regarding the wetlands’ functions and performance level.
One VIBI focus plot was established in the mitigation wetlands. A VIBI score was calculated for the site each monitoring year.
The following invasive species were taken from the Ohio Department of Natural Resources Division of Natural Areas and Preserves top ten invasive species list of 2007. Percent areal vegetative cover of these species, if present, was measured1:
Alliaria petiolata garlic mustard
Elaeagnus umbellate autumn-olive
Lonicera japonica Japanese honeysuckle
Lonicera maackii, L. morrowii , L tatarica bush honeysuckles
Lythrum salicaria purple loosestrife
Phalaris arundinacea reed canary grass
Phragmites australis giant reed
Polygonum cuspidatum Japanese knotweed
Rhamnus frangula, R. cathartica buckthorns
Rosa multiflora multiflora rose
The vegetation goals set were used to evaluate wet meadow and emergent marsh habitats on the site. This area is expected to develop into a wet meadow with small areas of emergent marsh within the deeper excavated areas. A dominance of hydrophytic vegetation is expected within the mitigation wetlands. To extrapolate percent hydrophytic and invasive vegetation cover data over the entire mitigation site, a list of all species was recorded at each monitoring quadrat and assigned a percent areal coverage (Appendix D). This information was confirmed by visual observation of species coverage.
1 Source: http://www.dnr.state.oh.us/dnap/invasive/invasivebrochure/tabid/2007/Default.aspx

Davey Resource Group 4 November, 2011
Soils Routine monitoring data collected in July of each year included the determination of soil characteristics at each monitoring quadrat. Soil samples were taken at a depth of approximately 10 inches using a 1-inch diameter soil probe. Collection methods adhered to those outlined in the Corps of Engineers Wetlands Delineation Manual (Environmental Laboratory, 1987) and soil chromas were determined with a Munsell Color Chart (Munsell Color, 1994).
The wetland areas are expected to contain hydric soils chromas. Any soils that do not contain hydric soil indicators are expected to convert to hydric chromas or demonstrate characteristics of developing hydric indicators by the end of the monitoring period.
Monitoring Data—Year Five (2011) Results The objective of the Year Five Monitoring and Management Report is to document conditions five years after construction activities in order to evaluate the progression and success of wetlands conversion, and to determine if the site has met its performance goals.
This site was visited on May 9 and August 1, 2011 by Todd Crandall. During these site visits, the extent of the mitigation wetlands were mapped and vegetation, soils, and hydrology were assessed at each of the six monitoring quadrats. Photographs of each stake and vegetation, water depth, and soils data collected at each monitoring stake are found in Appendix D.
A wetlands map that depicts the mitigation site with photograph locations and the extent of the mitigation wetlands in Year Five is located in Appendix C. A total of 3.137 acres of wetlands were delineated on May 9, 2011. Soils, hydrology, and vegetation data sheets from the wetland delineation are located in Appendix E. The locations of the wetland delineation sample points are shown on the map in Appendix C. These wetlands were identified within the individual wetland cells and outside the cells, if conditions were appropriate. Some wetlands have merged during the monitoring period and they are labeled on the map as combined cells.
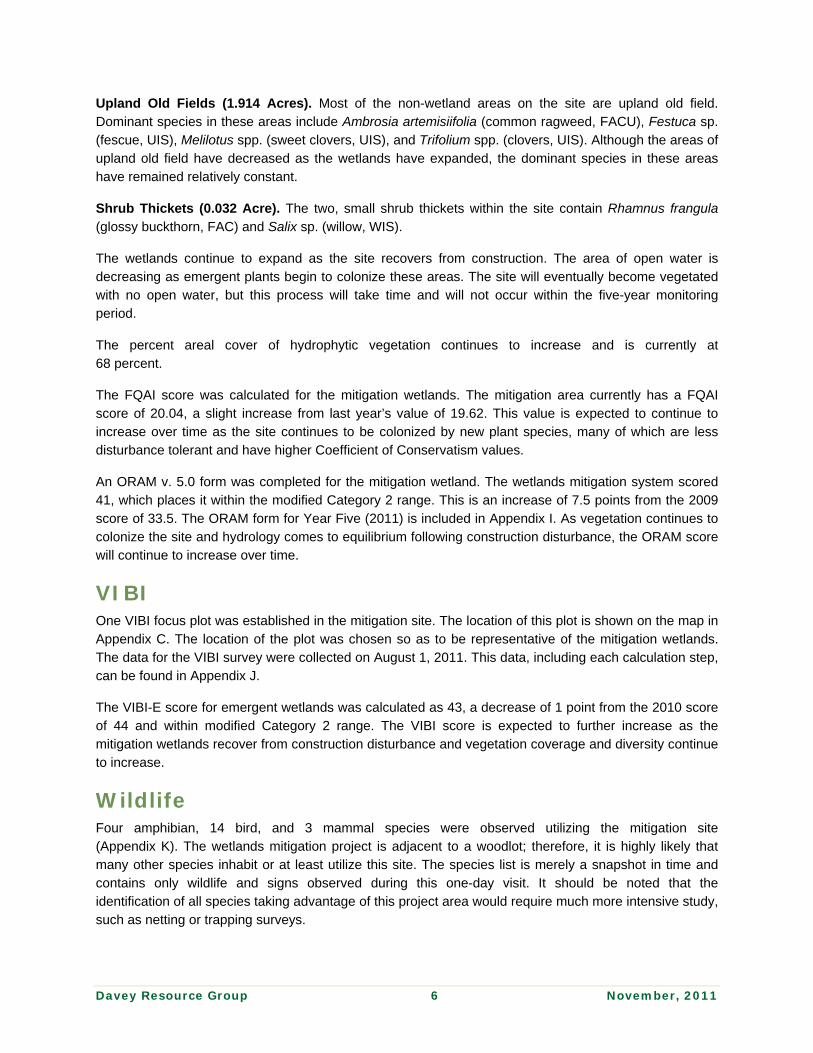
Table 2 summarizes the mitigation project’s five-year monitoring parameters and provides a concise look at the fifth year’s results.
Davey Resource Group 5 November, 2011
Table 2. Summary of Results
Monitoring Results 2007
(Year One) 2008
(Year Two) 2009
(Year Three) 2010
(Year Four) 2011
(Year Five)
Acreage of wetlands created 01 2.5562 2.5362 2.6252 3.1372
ORAM v. 5.0 score 25.5
(Category 1) 29.5
(Category 1)
32.5 (1-2 gray
zone)
33.5 (1-2 gray
zone)
41 (modified 2)
Percent unvegetated open water - 27% 18% 14% 8%
Total number of plant species 38 91 124 139 146
Total number of FAC, FACW, and OBL wetlands plant species3
22 48 67 76 80
FQAI Score 9.07 14.58 17.89 19.62 20.04
Percent areal cover of hydrophytic vegetation4
<1% 30% 29% 60% 68%
VIBI-E score 0 23 30 44 43
Percent areal cover invasive species <1% <1% <1% <1% 7.5%
Total number of wildlife species 6 10 15 18 21 1 Acreage of wetland cells created was 3.243 acres; however, wetland criteria were not present in Year One. 2 Mitigation acreage does not include the two existing wetlands, totaling 0.082 acre. 3 Wetland indicator status definitions are located in Appendix F. 4 Calculated using percent cover data collected for each of the six monitoring quadrats.
Hydrologic Conditions Standing water was observed over much of the site in 2011. During the May monitoring, water levels ranged from saturated soils to 14 inches of standing water. In August, standing water was observed at 3 quadrats, saturated soils at 2 quadrats, and no hydrological indicators at the remaining quadrat. Unvegetated open water throughout the site equals 0.248 acre.
Vegetation Wetlands vegetation has colonized the mitigation area. The following is a description for each plant community type including the size and dominant plant species identified in 2011. These areas are depicted on the vegetation community map located in Appendix G. A vegetation list for all species identified at the Route 80 Tank Farm Wetlands Mitigation Site is located in Appendix H.
Marshes (1.159 Acres). In the marsh areas, Typha latifolia (broad-leaved cattail, OBL) is dominant in most of the shallow marsh areas. Other species such as Juncus acuminatus (sharp-fruited rush, OBL), Juncus effusus (soft rush, FACW+), and Ludwigia palustris (water-purslane, OBL) are also dominant in some of these areas. These conditions have changed very little since 2010.
Wet Meadows (1.613 Acres). Juncus effusus (soft rush, FACW+) is dominant in many of the wet meadow areas. Other dominant species include Carex spp. (sedges) and Verbena hastata (blue vervain, FACW+).
Scrub/Shrub Wetlands (0.182 Acre). A small portion of the site is a scrub/shrub wetland. Dominant species in this area include Rhamnus frangula (glossy buckthorn, FAC) and Salix sp. (willow, WIS).
Davey Resource Group 6 November, 2011
Upland Old Fields (1.914 Acres). Most of the non-wetland areas on the site are upland old field. Dominant species in these areas include Ambrosia artemisiifolia (common ragweed, FACU), Festuca sp. (fescue, UIS), Melilotus spp. (sweet clovers, UIS), and Trifolium spp. (clovers, UIS). Although the areas of upland old field have decreased as the wetlands have expanded, the dominant species in these areas have remained relatively constant.
Shrub Thickets (0.032 Acre). The two, small shrub thickets within the site contain Rhamnus frangula (glossy buckthorn, FAC) and Salix sp. (willow, WIS).
The wetlands continue to expand as the site recovers from construction. The area of open water is decreasing as emergent plants begin to colonize these areas. The site will eventually become vegetated with no open water, but this process will take time and will not occur within the five-year monitoring period.
The percent areal cover of hydrophytic vegetation continues to increase and is currently at 68 percent.
The FQAI score was calculated for the mitigation wetlands. The mitigation area currently has a FQAI score of 20.04, a slight increase from last year’s value of 19.62. This value is expected to continue to increase over time as the site continues to be colonized by new plant species, many of which are less disturbance tolerant and have higher Coefficient of Conservatism values.
An ORAM v. 5.0 form was completed for the mitigation wetland. The wetlands mitigation system scored 41, which places it within the modified Category 2 range. This is an increase of 7.5 points from the 2009 score of 33.5. The ORAM form for Year Five (2011) is included in Appendix I. As vegetation continues to colonize the site and hydrology comes to equilibrium following construction disturbance, the ORAM score will continue to increase over time.
VIBI One VIBI focus plot was established in the mitigation site. The location of this plot is shown on the map in Appendix C. The location of the plot was chosen so as to be representative of the mitigation wetlands. The data for the VIBI survey were collected on August 1, 2011. This data, including each calculation step, can be found in Appendix J.
The VIBI-E score for emergent wetlands was calculated as 43, a decrease of 1 point from the 2010 score of 44 and within modified Category 2 range. The VIBI score is expected to further increase as the mitigation wetlands recover from construction disturbance and vegetation coverage and diversity continue to increase.
Wildlife Four amphibian, 14 bird, and 3 mammal species were observed utilizing the mitigation site (Appendix K). The wetlands mitigation project is adjacent to a woodlot; therefore, it is highly likely that many other species inhabit or at least utilize this site. The species list is merely a snapshot in time and contains only wildlife and signs observed during this one-day visit. It should be noted that the identification of all species taking advantage of this project area would require much more intensive study, such as netting or trapping surveys.
Davey Resource Group 7 November, 2011
Maintenance Concerns and Discussion The successional process on the site continues, with more areas becoming vegetated and perennial species replacing annual species. The area of open water continues to decrease and is expected to eventually be covered with vegetation. The yearly increases in wetland acreage, plant species diversity, Coefficient of Conservatism values, ORAM, and VIBI scores demonstrate that the ecological quality of the wetlands is increasing over time.
The areal cover of invasive species has shown an increase from 2010. Phragmites australis (giant reed, FACW) is found in a few areas of the mitigation site and has significantly spread since 2010. Some of the cattails which are developing colonies within the areas of deeper water are Typha angustifolia (narrow-leaved cattail, OBL), which is another invasive species. This situation should be monitored in 2012, and control of invasive species colonies is recommended to prevent their further spread.
Portions of the site, including parts of the VIBI focus plot, are dominated by cattails, primarily Typha latifolia (broad-leaved cattail, OBL). The cattails are beginning to form monocultures which are excluding other native and desirable hydrophytes and are likely responsible for the slight decrease in the VIBI score this year. Elimination of some of the cattail monocultures combined with planting and/or seeding of other native hydrophytes should be considered.
Summary Davey Resource Group has been retained by USPFO for Ohio to perform monitoring and to prepare a Year Five Monitoring and Management Report for the wetlands mitigation project within the Ravenna Training and Logistics Site at the Route 80 Tank Farm Wetlands Mitigation Site in Charlestown Township, Portage County, Ohio. A portion of this site, 0.915 acre is to be used as mitigation for isolated wetland impacts associated with construction on RTLS. The remaining acreage is to be used for future mitigation.
The site was visited on May 9 and August 1, 2011 to collect data for the Year Five Monitoring and Management Report.
A total of 146 plant species were found on the site this year, of which 80 are wetlands species. The FQAI score of 20.04 has shown yearly increases over the five year monitoring period. Four amphibian, 14 bird, and 3 mammal species were observed utilizing the mitigation site.
Using the ORAM form, the wetlands mitigation system scored a 41 which falls within the modified Category 2 range. The VIBI-E score for emergent wetlands is 43, which is a decrease of 1 point from the 2010 score, and also is within the modified Category 2 range.
Percent areal cover of hydrophytic vegetation is 68 percent, which is an increase of 8 percent from 2010. Marsh and wet meadow plant communities have formed within the mitigation area. Open water continues to decrease and now comprises 8 percent of the total area of restored wetland.
The cover of invasive species, including Phragmites australis (common reed, FACW) and Typha angustifolia (narrow-leaved cattail, OBL), has increased to 7.5 percent this year. Future control of invasive species is recommended.
The mitigation wetlands have shown yearly increases over the five-year monitoring period for most of the parameters that were measured. The wetland will continue to increase in diversity and vegetation cover over time. A total of 3.137 acres of Category 2 wetlands have been created. The acreage and category meet the goals for the isolated wetlands mitigation. This report for Year Five concludes our monitoring of the site.
References and Professional Staff Appendix L contains a list of references consulted while conducting this study and Appendix M lists Davey Resource Group professionals involved.

Davey Resource Group November, 2011
Appendix ALocation of Study Area on Highway Map
UV303
UV88
UV59
UV5
UV88
88
303
5
88Vair
Newton Falls
Gre
enle
af
Nic
ho
ls
Ravenna Arsenal
Fre
edo
m Sla
gle
Rocksprin
g
Lim
eri
dge
Mccormick
Ber
ry
Asb
ury
Kna
pp
Ga
rre
tt
Smalley
King
Wygle
Linda
Crow
Han
na
Bea
ver
Brid
le
Kna
pp
Smalley
Freedom Air Field
West Branch State ParkWest Branch State Park
FRA ADDED
Conrail C
hessie Railroad
FR
A A
DD
ED
HHi innk kl leey y CC
rreeeekk
SS aa nn dd CC rr ee ee kk
0.5 0 0.5 10.25
Miles
Study Area
Site Location: Ravenna Training and Logistics Site (RTLS)
Source: ESRIRedlands, California
Route 80 Tank FarmWetlands Mitigation AreaCharlestown Township, Portage County, Ohio

Davey Resource Group November, 2011
Appendix B Isolated Wetlands Ohio EPA Permit Approval

THE ADJUTANT GENERAL’S DEPARTMENT RAVENNA TRAINING AND LOGISTICS SITE
1438 State Route 534 SW Newton Falls, OH 44444
Mitigation Proposal
for RTI Group 2 Heavy Equipment Training Area Isolated Wetlands Fill Permit
I. Mitigation Requirement: The Ohio Army National Guard (OHARNG) is required to mitigate for filling of 0.06 acres of category 2 forested wetland and 0.44 acres of category 1 non-forested wetland as identified in this Pre-Activity Notice (PAN). In accordance with division (F) of rule 3745-1-54 of the Ohio Administrative code the forested wetland must be mitigated at a ratio of 2:1 and the non-forested wetland at a ratio of 1.5:1. The total mitigation required is (0.06 x 2) + (0.44 x 1.5) = 0.78 acres. II. Mitigation Site Description: The wetland mitigation site is with the same watershed as the fill site – 05030103 (Mahoning River). The mitigation was actually constructed in the fall of 2007 in conjunction with an Army funded project. At that time the OHARNG was finalizing the Environmental Assessment for standing up an Engineer School at the RTLS, of which the Group 2 Heavy Equipment Training Area project is a part, and we knew wetland mitigation would be needed. When the opportunity to have the Army construct our mitigation presented itself we could not pass it up. Both the Ohio EPA and the US Army Corps of Engineers (USACE) were contacted for consultation during the planning phase of the mitigation site. The Ohio EPA indicated that they were not able to assist unless the OHARNG had a fill permit pending and directed us to the USACE. The USACE did not respond when contacted.
The mitigation site was a former Defense Logistics Agency (DLA) strategic materials storage area within the RTLS where dry materials were stored in large above ground storage tanks. The materials were removed and the site was slated for fill and leveling. The site showed the propensity to hold water and looked like a good site for wetland creation so the OHARNG requested that instead of filling the site that wetlands be created. Because there was no added cost to the contract the Army modified their scope of work and had their contractor turn the Route 80 Tank Farm Area into a wetland. Nine (9) shallow basins were created within the mitigation area and were seeded with a combination upland/wetland seed mix.
Included with this mitigation proposal is an excerpt from the Final Completion Report for
the DLA Route 80 Tank Removal and an as built map of the wetland mitigation area from that same report. Also included is the Year One Monitoring and Management Report of the mitigation site. This report was done shortly after the construction and provides detailed information on the mitigation.
III. Mitigation Goal and Monitoring: The goal of the mitigation is to create a minimum of 0.78 acres of category 2 or better wetland. Most of the basins are expected to develop into emergent wet meadow type wetlands with the basins near the eastern edge probably developing into scrub shrub and forested wetlands as seed from adjacent areas is introduced. The OHARNG intends to allow wetland diversity to develop as seed is introduced and will only control invasive and non-native species.
The OHARNG has a contract in place with Davey Resources Group to monitor the wetland over a five year period to ensure proper development.
IV. Protection of the Wetland Mitigation: The RTLS is federally owned property controlled by the United States Property and Fiscal Officer (USP&FO) for Ohio who is a representative of the National Guard Bureau (NGB) in Alexandria, VA. The property is licensed to the OHARNG who manages the property and natural resources for NGB. The OHARNG and NGB are required to comply with State and Federal environmental laws and regulations to include the protection of wetlands. All OHARNG activities on the training site that involve earth moving, construction, development and off-road activity are coordinated and reviewed by environmental personnel to ensure wetlands are avoided as much as possible, unavoidable impacts are minimized, and mitigation sites are protected.
The OHARNG has an active Natural Resources Management Program at the RTLS and is required by the SIKES Act Improvement Act to have an Integrated Natural Resources Management Plan (INRMP). This plan is developed in cooperation with, and with the signatory concurrence of, the U.S. Fish and Wildlife Service (USF&WS) and the Ohio Department of Natural (DNR) Resources. The INRMP is reviewed by the OHARNG, USF&WS, and Ohio DNR annually and updated every five years as necessary. It has visibility with agencies outside of the NGB and OHARNG and is an appropriate venue to document and track protection of wetland mitigation areas. The OHARNG will develop GIS data and a Wetland Mitigation Map for insertion into the INRMP that identifies all wetland mitigation sites at the RTLS and earmarks them for protection and maintenance as wetlands in perpetuity. Mitigation site protection will be monitored by the OHARNG environmental staff and by annual reviews of the RTLS INRMP.
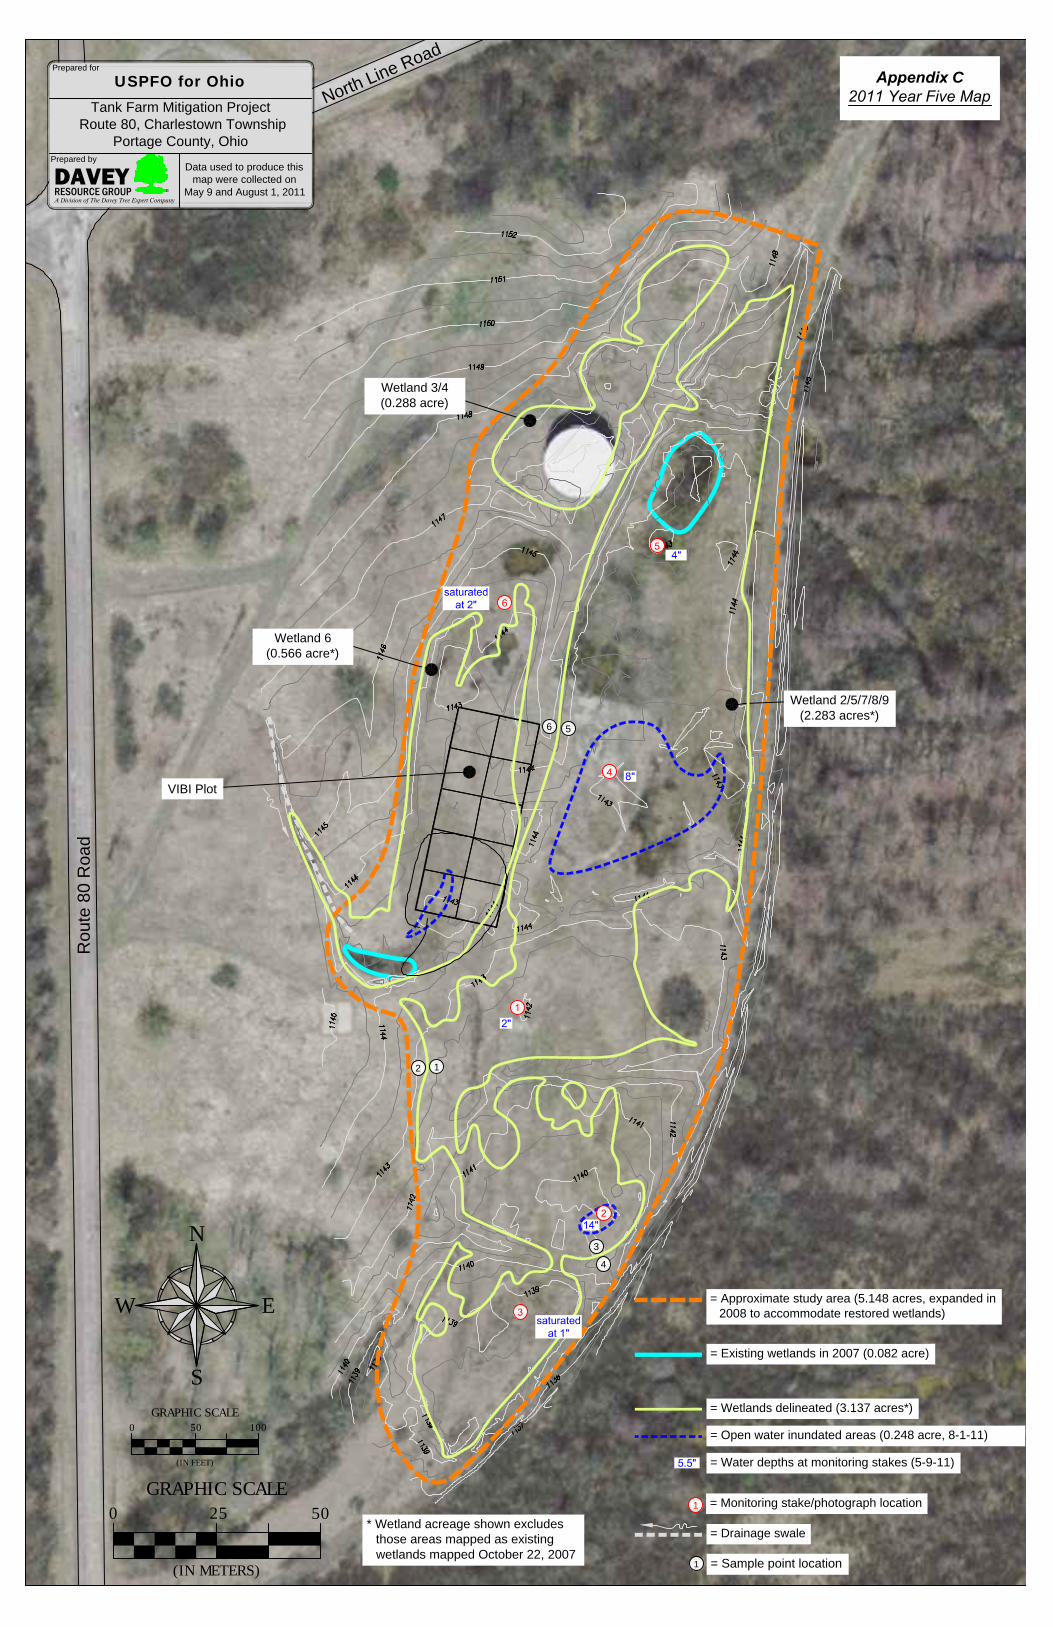
= Approximate study area (5.148 acres, expanded in2008 to accommodate restored wetlands)
= Existing wetlands in 2007 (0.082 acre)
= Monitoring stake/photograph location1
= Wetlands delineated (3.137 acres*)
= Open water inundated areas (0.248 acre, 8-1-11)
= Water depths at monitoring stakes (5-9-11)
= Drainage swale
Appendix C2011 Year Five Map
50GRAPHIC SCALE
0 25
(IN METERS)
North Line Road
Tank Farm Mitigation Project Route 80, Charlestown Township
Portage County, Ohio
USPFO for OhioPrepared for
* Wetland acreage shown excludesthose areas mapped as existingwetlands mapped October 22, 2007
N
S
EW
100GRAPHIC SCALE
0 50
(IN FEET)
Rou
te 8
0 R
oad
Data used to produce thismap were collected on
May 9 and August 1, 2011
Prepared by
A Division of The Davey Tree Expert Company
DAVEYRESOURCE GROUP ®
Wetland 6(0.566 acre*)
VIBI Plot
Wetland 3/4(0.288 acre)
Wetland 2/5/7/8/9(2.283 acres*)
1
4
3
6 5
2
= Sample point location1

Davey Resource Group November, 2011
Appendix D Photographs, Quadrat Descriptions, and Vegetation Coverage
Davey Resource Group November, 2011
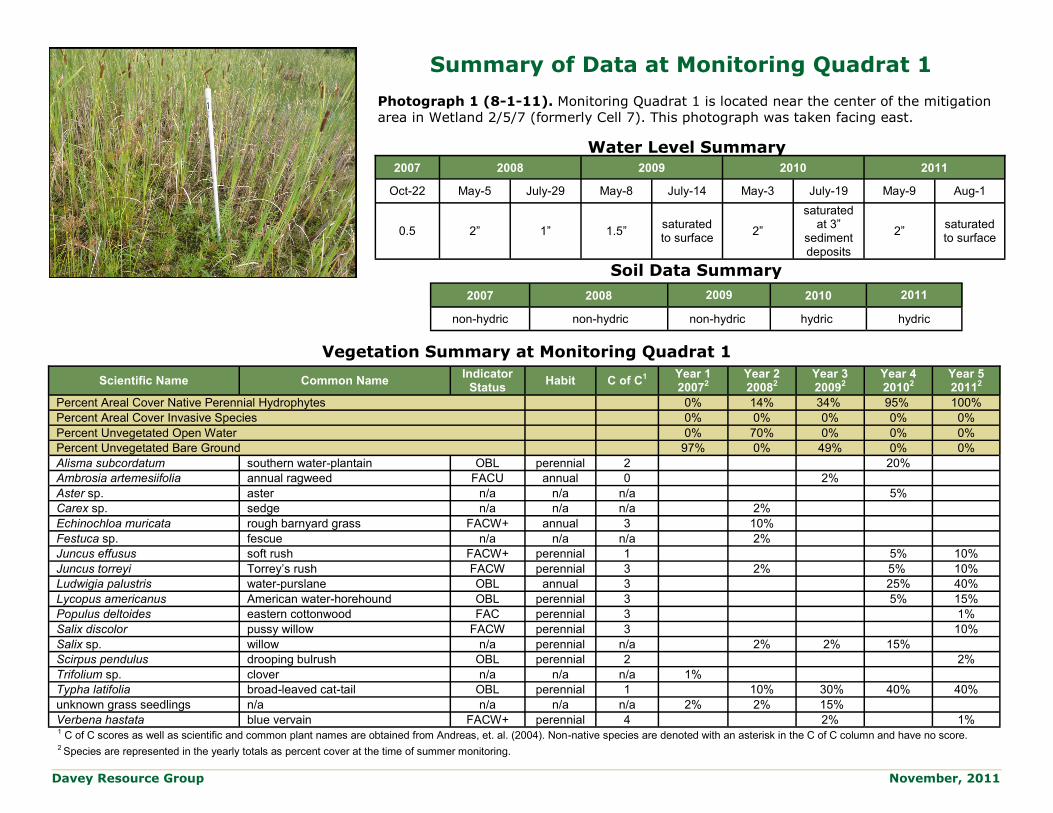
Summary of Data at Monitoring Quadrat 1
Photograph 1 (8-1-11). Monitoring Quadrat 1 is located near the center of the mitigation
area in Wetland 2/5/7 (formerly Cell 7). This photograph was taken facing east.
Vegetation Summary at Monitoring Quadrat 1
Scientific Name Common Name Indicator
Status Habit C of C1
Year 1 20072
Year 2 20082
Year 3 20092
Year 4 20102
Year 5 20112
Percent Areal Cover Native Perennial Hydrophytes 0% 14% 34% 95% 100%
Percent Areal Cover Invasive Species 0% 0% 0% 0% 0%
Percent Unvegetated Open Water 0% 70% 0% 0% 0%
Percent Unvegetated Bare Ground 97% 0% 49% 0% 0%
Alisma subcordatum southern water-plantain OBL perennial 2 20%
Ambrosia artemesiifolia annual ragweed FACU annual 0 2%
Aster sp. aster n/a n/a n/a 5%
Carex sp. sedge n/a n/a n/a 2%
Echinochloa muricata rough barnyard grass FACW+ annual 3 10%
Festuca sp. fescue n/a n/a n/a 2%
Juncus effusus soft rush FACW+ perennial 1 5% 10%
Juncus torreyi Torrey’s rush FACW perennial 3 2% 5% 10%
Ludwigia palustris water-purslane OBL annual 3 25% 40%
Lycopus americanus American water-horehound OBL perennial 3 5% 15%
Populus deltoides eastern cottonwood FAC perennial 3 1%
Salix discolor pussy willow FACW perennial 3 10%
Salix sp. willow n/a perennial n/a 2% 2% 15%
Scirpus pendulus drooping bulrush OBL perennial 2 2%
Trifolium sp. clover n/a n/a n/a 1%
Typha latifolia broad-leaved cat-tail OBL perennial 1 10% 30% 40% 40%
unknown grass seedlings n/a n/a n/a n/a 2% 2% 15%
Verbena hastata blue vervain FACW+ perennial 4 2% 1% 1 C of C scores as well as scientific and common plant names are obtained from Andreas, et. al. (2004). Non-native species are denoted with an asterisk in the C of C column and have no score. 2 Species are represented in the yearly totals as percent cover at the time of summer monitoring.
Soil Data Summary
2007 2008 2009 2010 2011
non-hydric non-hydric non-hydric hydric hydric
2007 2008 2009 2010 2011
Oct-22 May-5 July-29 May-8 July-14 May-3 July-19 May-9 Aug-1
0.5 2” 1” 1.5” saturated to surface
2”
saturated at 3”
sediment deposits
2” saturated to surface
Water Level Summary

Davey Resource Group November, 2011
Summary of Data at Monitoring Quadrat 2
Photograph 2 (8-1-11). Monitoring Quadrat 2 is located in the southeast-
ern portion of the mitigation wetlands in Wetland 8. This photograph was
taken facing southeast.
Vegetation Summary at Monitoring Quadrat 2
Scientific Name Common Name Indicator
Status Habit C of C1
Year 1 20072
Year 2 20082
Year 3 20092
Year 4 20102
Year 5 20112
Percent Areal Cover Native Perennial Hydrophytes 0% 0% 0% 40% 5%
Percent Areal Cover Invasive Species 0% 0% 0% 0% 25%
Percent Unvegetated Open Water 100% 100% 100% 60% 70%
Percent Unvegetated Bare Ground 0% 0% 0% 0% 0%
no vegetation n/a n/a n/a n/a 100%
Alisma subcordatum southern water-plantain OBL perennial 2 5% 5%
Chara sp. stonewort n/a n/a n/a 25% 25% X
Typha angustifolia narrow-leaved cat-tail OBL perennial * 25%
Typha latifolia broad-leaved cat-tail OBL perennial 1 10% 30% 35%
1 C of C scores as well as scientific and common plant names are obtained from Andreas, et. al. (2004). Non-native species are denoted with an asterisk in the C of C column and have no score.
2 Species are represented in the yearly totals as percent cover at the time of summer monitoring. Species denoted with an “x” are present during spring monitoring but not during summer monitoring.
Soil Data Summary
2007 2008 2009 2010 2011
non-hydric non-hydric non-hydric hydric hydric
2007 2008 2009 2010 2011
Oct-22 May-5 July-29 May-8 July-14 May-3 July-19 May-9 Aug-1
14” 14” 14” 16” 10” 14” 7” 14” 4”
Water Level Summary

Davey Resource Group November, 2010
Summary of Data at Monitoring Quadrat 3
Photograph 3 (8-1-11). Monitoring Quadrat 3 is located in the southern portion of the mitigation area in Wetland 9. This photograph was taken facing west.
Vegetation Summary at Monitoring Quadrat 3
Scientific Name Common Name Indicator Status Habit C of C
1 Year 1 20072
Year 2 20082
Year 3 20092
Year 4 20102
Year 5 20112
Percent Areal Cover Native Perennial Hydrophytes 0% 67% 32% 100% 87% Percent Areal Cover Invasive Species 5% 10% 10% 0% 0% Percent Unvegetated Open Water 0% 0% 0% 0% 0% Percent Unvegetated Bare Ground 73% 0% 0% 0% 0%
Achillea millefolium yarrow FACU perennial 1 2% 5% Agrostis gigantea redtop FACW perennial * 30% 10% 25% 20% Apocynum cannabinum Indian hemp FACU perennial 1 5% 15% 10% 5% 25% Carex lurida bottlebrush sedge OBL perennial 3 5%
Carex sp. sedge n/a n/a n/a 5% Cyperus esculentus yellow nut-sedge FACW perennial 0 5% Daucus carota Queen-Anne’s-lace UPL biennial * 3% 30% 2% Eleagnus umbellata (shrub) autumn-olive FACU perennial * 5% 10% 10% Festuca sp. fescua n/a n/a n/a 5% Fragaria virginiana wild strawberry FACU perennial 1 1% 5% 5% 5% 5% Holcus lanatus velvet grass FACU perennial * 5% 5% 10% Hypericum sp. St. John’s wort n/a n/a n/a 5%
Juncus effusus soft rush FACW+ perennial 1 10% 10%
Juncus tenuis path rush FAC- perennial 1 20% 10%
Lycopus americanus American water-horehound OBL perennial 3 5%
Malus sp. crabapple sp. n/a n/a n/a 1% Medicago lupulina black medick UPL annual * 30% 5% Melilotus sp. sweet clover n/a biennial * 1% 10% 2% Panicum clandestinum deer’s-tongue panic grass FAC+ perennial 2 10%
Panicum dichotomiflorum fall panic grass FACW- annual 0 5%
Panicum virgatum switch grass FAC perennial 4 5%
Poa sp. grass sp. n/a n/a n/a 15% 15% Populus deltoides eastern cottonwood FAC perennial 3 1% 2% 10% Populus deltoides (shrub) eastern cottonwood FAC perennial 3 30%
Populus tremuloides (shrub) quaking aspen FACU perennial 2 10% 15% 15% 25% Potentilla simplex old field cinquefoil FACU- perennial 1 2% 5% 5% Pycnanthemum tenuifolium narrow-leaved mountain-mint FACW perennial 4 5% 5%
Rudbeckia hirta black-eyed Susan FACU- perennial 1 5% 10% 2% Salix discolor pussy willow FACW perennial 3 10%
Salex etigua (shrub) sandbar willow OBL perennial 1 35%
Salix sp. willow n/a perennial n/a 10% 35% Salix sp. (shrub) willow n/a perennial n/a 30%
Scirpus pendulus drooping bulrush OBL perennial 2 10% Sisyrinchium angustifolium stout blue-eyed grass FACW- perennial 2 10%
Solidago canadensis Canada goldenrod FACU perennial 1 5% 15% 10% 10% Solidago juncea plume goldenrod UPL perennial 2 2% Solidago rugosa rough goldenrod FAC perennial 2 10% 10% 2% Solidago sp. goldenrod N/A n/a n/a 15% Trifolium sp. clover n/a n/a n/a 2%
Water Level Summary
2007 2008 2009 2010 2011
Oct-22 May-5 July-29 May-8 July-14 May-3 July-19 May-9 Aug-1
- sat. to surface
sat. to surface
sat. to surface
- sat. to
surface
watermarks, sediment deposits
sat. at 1” water at 5”
blackened leaves
Soil Data Summary
2007 2008 2009 2010 2011
hydric hydric hydric hydric hydric
1 C of C scores as well as scientific and common plant names are obtained from Andreas, et. al. (2004). Non-native species are denoted with an asterisk in the C of C column and have no score.
2 Species are represented in the yearly totals as percent cover at the time of summer monitoring.
Davey Resource Group November, 2011
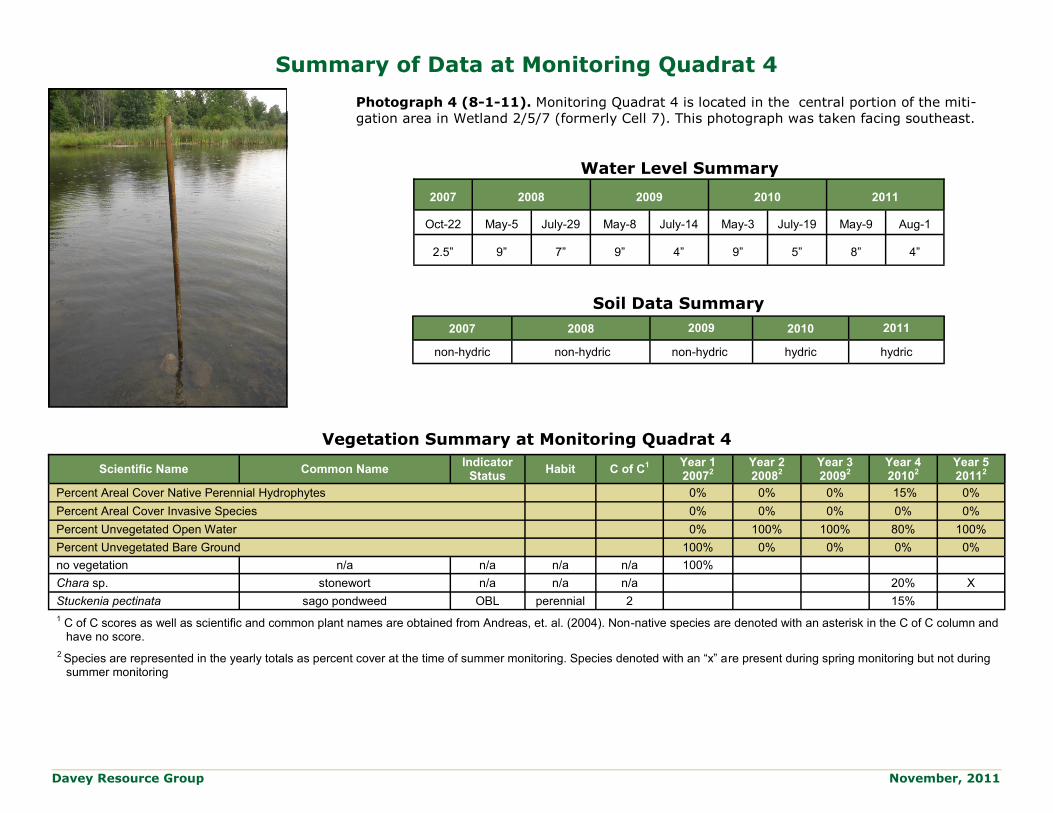
Summary of Data at Monitoring Quadrat 4
Photograph 4 (8-1-11). Monitoring Quadrat 4 is located in the central portion of the miti-
gation area in Wetland 2/5/7 (formerly Cell 7). This photograph was taken facing southeast.
Vegetation Summary at Monitoring Quadrat 4
Scientific Name Common Name Indicator
Status Habit C of C1
Year 1 20072
Year 2 20082
Year 3 20092
Year 4 20102
Year 5 20112
Percent Areal Cover Native Perennial Hydrophytes 0% 0% 0% 15% 0%
Percent Areal Cover Invasive Species 0% 0% 0% 0% 0%
Percent Unvegetated Open Water 0% 100% 100% 80% 100%
Percent Unvegetated Bare Ground 100% 0% 0% 0% 0%
no vegetation n/a n/a n/a n/a 100%
Chara sp. stonewort n/a n/a n/a 20% X
Stuckenia pectinata sago pondweed OBL perennial 2 15%
1 C of C scores as well as scientific and common plant names are obtained from Andreas, et. al. (2004). Non-native species are denoted with an asterisk in the C of C column and have no score.
2 Species are represented in the yearly totals as percent cover at the time of summer monitoring. Species denoted with an “x” are present during spring monitoring but not during summer monitoring
Soil Data Summary
2007 2008 2009 2010 2011
non-hydric non-hydric non-hydric hydric hydric
2007 2008 2009 2010 2011
Oct-22 May-5 July-29 May-8 July-14 May-3 July-19 May-9 Aug-1
2.5” 9” 7” 9” 4” 9” 5” 8” 4”
Water Level Summary

Davey Resource Group November, 2011
Summary of Data at Monitoring Quadrat 5
Photograph 5 (9-1-11). Monitoring Quadrat 5 is located in in the northern
portion of the mitigation area in Wetland 2/5/7 (formerly Cell 7). This pho-
tograph was taken facing north.
Vegetation Summary at Monitoring Quadrat 5
Scientific Name Common Name Indicator
Status Habit C of C1
Year 1 20072
Year 2 20082
Year 3 20092
Year 4 20102
Year 5 20112
Percent Areal Cover Native Perennial Hydrophytes 0% 57% 80% 55% 80%
Percent Areal Cover Invasive Species 0% 10% 0% 5% 20%
Percent Unvegetated Open Water 80% 0% 0% 0% 0%
Percent Unvegetated Bare Ground 10% 0% 0% 0% 0%
Alisma subcordatum southern water-plantain OBL perennial 2 30% 25% 25% 10%
Eleagnus umbellata autumn-olive FACU perennial * 10%
Eleocharis obtusa blunt spike-rush OBL annual 1 40% 25% 20% 10%
Juncus acuminatus sharp-fruited rush OBL perennial 4 20% 20%
Juncus torreyi Torrey’s rush FACW perennial 3
Lemna minor common duckweed OBL annual 3 X 5%
Ludwigia palustris water-purslane OBL annual 3 15% 40% 30% 25%
Phragmites australis giant reed FACW perennial 0 5%
Populus deltoides eastern cottonwood FAC perennial 3 15% 20%
Salix sp. willow n/a n/a n/a 10%
Typha latifolia broad-leaved cat-tail OBL perennial 1 2% 15% 10% 25%
unknown grass seedlings n/a n/a n/a n/a 10% 25%
1 C of C scores as well as scientific and common plant names are obtained from Andreas, et. al. (2004). Non-native species are denoted with an asterisk in the C of C column and have no score.
2 Species are represented in the yearly totals as percent cover at the time of summer monitoring. Species denoted with an “x” are present during spring monitoring but not during summer monitoring
Soil Data Summary
2007 2008 2009 2010 2011
non-hydric non-hydric non-hydric hydric hydric
Water Level Summary
2007 2008 2009 2010 2011
Oct-22 May-5 July-29 May-8 July-14 May-3 July-19 May-9 Aug-1
5.5” 7” 5” 6” 2.5” 4” 4” 7” 1”
Davey Resource Group November, 2010
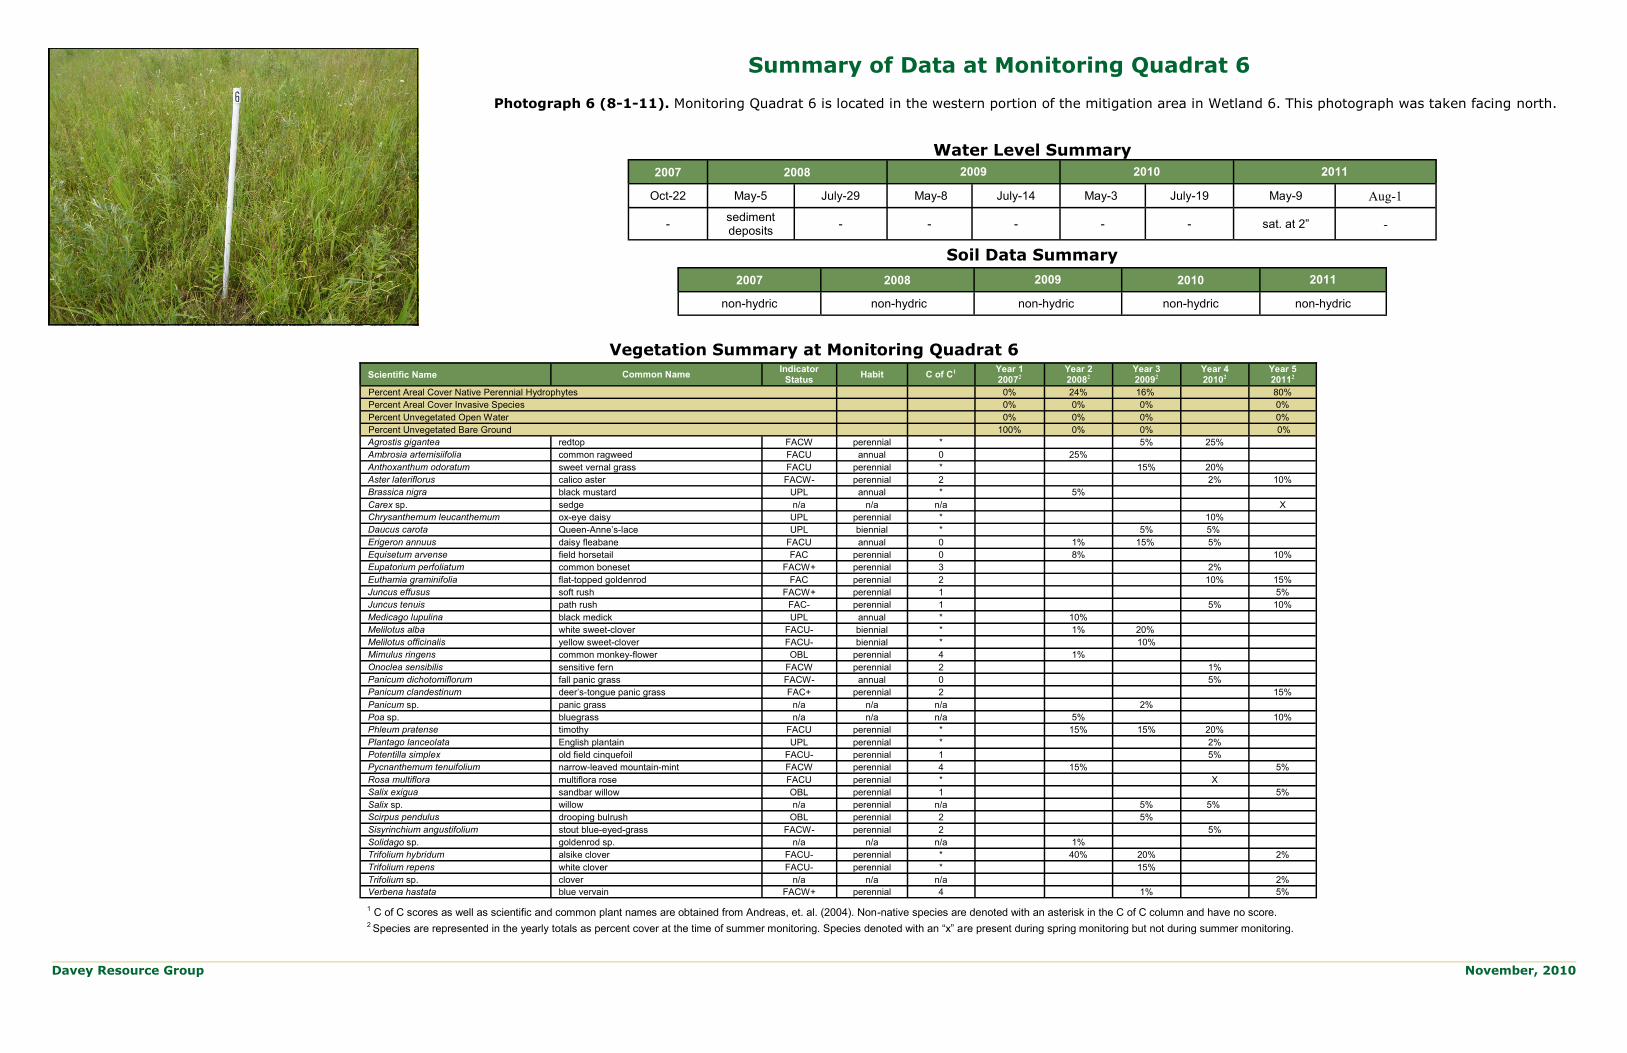
Summary of Data at Monitoring Quadrat 6
Photograph 6 (8-1-11). Monitoring Quadrat 6 is located in the western portion of the mitigation area in Wetland 6. This photograph was taken facing north.
Water Level Summary 2007 2008 2009 2010 2011
Oct-22 May-5 July-29 May-8 July-14 May-3 July-19 May-9 Aug-1
- sediment deposits
- - - - - sat. at 2” -
Soil Data Summary
2007 2008 2009 2010 2011
non-hydric non-hydric non-hydric non-hydric non-hydric
Vegetation Summary at Monitoring Quadrat 6
Scientific Name Common Name Indicator
Status Habit C of C1 Year 1
20072
Year 2 20082
Year 3 20092
Year 4 20102
Year 5 20112
Percent Areal Cover Native Perennial Hydrophytes 0% 24% 16% 80%
Percent Areal Cover Invasive Species 0% 0% 0% 0%
Percent Unvegetated Open Water 0% 0% 0% 0%
Percent Unvegetated Bare Ground 100% 0% 0% 0%
Agrostis gigantea redtop FACW perennial * 5% 25%
Ambrosia artemisiifolia common ragweed FACU annual 0 25%
Anthoxanthum odoratum sweet vernal grass FACU perennial * 15% 20%
Aster lateriflorus calico aster FACW- perennial 2 2% 10%
Brassica nigra black mustard UPL annual * 5%
Carex sp. sedge n/a n/a n/a X
Chrysanthemum leucanthemum ox-eye daisy UPL perennial * 10%
Daucus carota Queen-Anne’s-lace UPL biennial * 5% 5%
Erigeron annuus daisy fleabane FACU annual 0 1% 15% 5%
Equisetum arvense field horsetail FAC perennial 0 8% 10%
Eupatorium perfoliatum common boneset FACW+ perennial 3 2%
Euthamia graminifolia flat-topped goldenrod FAC perennial 2 10% 15%
Juncus effusus soft rush FACW+ perennial 1 5%
Juncus tenuis path rush FAC- perennial 1 5% 10%
Medicago lupulina black medick UPL annual * 10%
Melilotus alba white sweet-clover FACU- biennial * 1% 20%
Melilotus officinalis yellow sweet-clover FACU- biennial * 10%
Mimulus ringens common monkey-flower OBL perennial 4 1%
Onoclea sensibilis sensitive fern FACW perennial 2 1%
Panicum dichotomiflorum fall panic grass FACW- annual 0 5%
Panicum clandestinum deer’s-tongue panic grass FAC+ perennial 2 15%
Panicum sp. panic grass n/a n/a n/a 2%
Poa sp. bluegrass n/a n/a n/a 5% 10%
Phleum pratense timothy FACU perennial * 15% 15% 20%
Plantago lanceolata English plantain UPL perennial * 2%
Potentilla simplex old field cinquefoil FACU- perennial 1 5%
Pycnanthemum tenuifolium narrow-leaved mountain-mint FACW perennial 4 15% 5%
Rosa multiflora multiflora rose FACU perennial * X
Salix exigua sandbar willow OBL perennial 1 5%
Salix sp. willow n/a perennial n/a 5% 5%
Scirpus pendulus drooping bulrush OBL perennial 2 5%
Sisyrinchium angustifolium stout blue-eyed-grass FACW- perennial 2 5%
Solidago sp. goldenrod sp. n/a n/a n/a 1%
Trifolium hybridum alsike clover FACU- perennial * 40% 20% 2%
Trifolium repens white clover FACU- perennial * 15%
Trifolium sp. clover n/a n/a n/a 2%
Verbena hastata blue vervain FACW+ perennial 4 1% 5%
1 C of C scores as well as scientific and common plant names are obtained from Andreas, et. al. (2004). Non-native species are denoted with an asterisk in the C of C column and have no score. 2 Species are represented in the yearly totals as percent cover at the time of summer monitoring. Species denoted with an “x” are present during spring monitoring but not during summer monitoring.
Davey Resource Group November, 2011
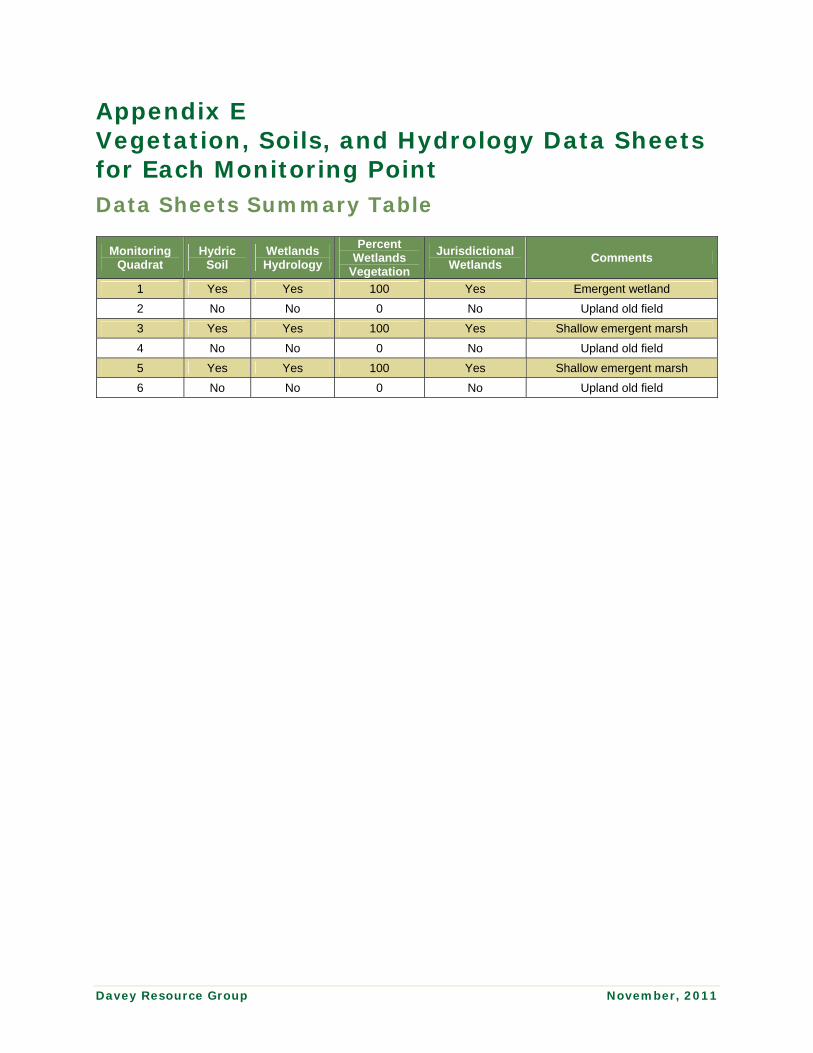
Appendix E Vegetation, Soils, and Hydrology Data Sheets for Each Monitoring Point Data Sheets Summary Table
Monitoring Quadrat
Hydric Soil
Wetlands Hydrology
Percent Wetlands
Vegetation
Jurisdictional Wetlands
Comments
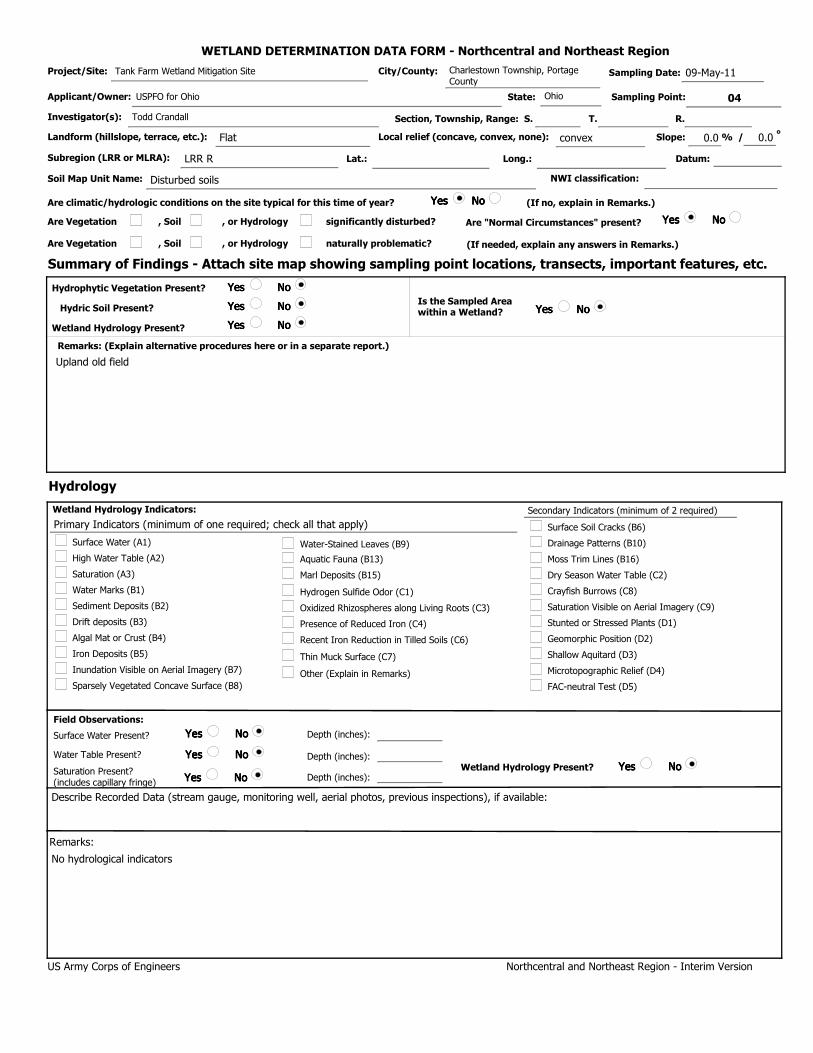
1 Yes Yes 100 Yes Emergent wetland
2 No No 0 No Upland old field
3 Yes Yes 100 Yes Shallow emergent marsh
4 No No 0 No Upland old field
5 Yes Yes 100 Yes Shallow emergent marsh
6 No No 0 No Upland old field

01
09-May-11
0.0
YesYesYesYes NoNoNoNo
YesYesYesYes NoNoNoNo
YesYesYesYes NoNoNoNo
YesYesYesYes NoNoNoNo
YesYesYesYes NoNoNoNo
YesYesYesYes NoNoNoNo
Lat.:
Hydric Soil Present?
Sampling Point:
Summary of Findings - Attach site map showing sampling point locations, transects, important features, etc.
State:
°Landform (hillslope, terrace, etc.):
T.
(If no, explain in Remarks.)
Are Vegetation
Are "Normal Circumstances" present?
Datum:
naturally problematic?
Are climatic/hydrologic conditions on the site typical for this time of year?
Hydrophytic Vegetation Present?
Remarks: (Explain alternative procedures here or in a separate report.)
R.
Are Vegetation
Long.:
significantly disturbed?
Local relief (concave, convex, none): Slope:
Investigator(s):
(If needed, explain any answers in Remarks.)
City/County:
, Soil
% /
Soil Map Unit Name:
, or Hydrology
, Soil , or Hydrology
NWI classification:
Subregion (LRR or MLRA):
Project/Site:
Wetland Hydrology Present?
Section, Township, Range: S.
Is the Sampled Areawithin a Wetland?
Applicant/Owner:
Sampling Date:
WETLAND DETERMINATION DATA FORM - Northcentral and Northeast Region
Emergent wetland
Tank Farm Wetland Mitigation Site
USPFO for Ohio
Todd Crandall
Flat
LRR R
Disturbed soils
Charlestown Township, Portage County
Ohio
concave 0.0
1
YesYesYesYes NoNoNoNo
YesYesYesYes NoNoNoNo
YesYesYesYes NoNoNoNoYesYesYesYes NoNoNoNo
Hydrology
Surface Water (A1)
High Water Table (A2)
Saturation (A3)
Water Marks (B1)
Sediment Deposits (B2)
Drift deposits (B3)
Algal Mat or Crust (B4)
Dry Season Water Table (C2)
Hydrogen Sulfide Odor (C1)
Oxidized Rhizospheres along Living Roots (C3)
Presence of Reduced Iron (C4)
Recent Iron Reduction in Tilled Soils (C6)
Other (Explain in Remarks)
Drainage Patterns (B10)Water-Stained Leaves (B9)
Saturation Visible on Aerial Imagery (C9)
Crayfish Burrows (C8)
Moss Trim Lines (B16)
Primary Indicators (minimum of one required; check all that apply)
Wetland Hydrology Indicators:
Field Observations:
Surface Water Present?
Water Table Present?
Saturation Present?(includes capillary fringe)
Depth (inches):
Depth (inches):
Depth (inches):Wetland Hydrology Present?
Describe Recorded Data (stream gauge, monitoring well, aerial photos, previous inspections), if available:
Remarks:
Secondary Indicators (minimum of 2 required)
Iron Deposits (B5)
Surface Soil Cracks (B6)
Stunted or Stressed Plants (D1)
Inundation Visible on Aerial Imagery (B7)
Sparsely Vegetated Concave Surface (B8)
Thin Muck Surface (C7) Shallow Aquitard (D3)
FAC-neutral Test (D5)
Northcentral and Northeast Region - Interim VersionUS Army Corps of Engineers
Geomorphic Position (D2)
Microtopographic Relief (D4)
Marl Deposits (B15)
Aquatic Fauna (B13)

0
0
0
0
0
20
40
20
20
0
0
0
0
0
0
0
0
0
0
YesYesYesYes NoNoNoNo
40.0%
0.0%
40.0%
0.0%
100.0%
0
0.0%
20.0% OBL
40.0% FACW+
20 20
20.0% FAC
60 120
20.0% FACW
20 60
0 0
0 0
0.0%
100 200
0.0%
2.000
0.0%
0.0%
0.0%
0.0%
0.0%
0.0%
0.0%
0.0%
100
0
Northcentral and Northeast Region - Interim Version
Woody Vine Stratum
(B)(B)(B)(B)
= Total Cover
IndicatorStatus
= Total Cover
Prevalence Index is ≤3.0
HydrophyticVegetationPresent?
US Army Corps of Engineers
VEGETATION - Use scientific names of plants
Dominance Test worksheet:
Total Number of DominantSpecies Across All Strata:
Prevalence Index worksheet:
Prevalence Index = B/A =
(A/B)
1 Indicators of hydric soil and wetland hydrology mustbe present, unless disturbed or problematic.
Problematic Hydrophytic Vegetation 1 (Explain)
Herb Stratum
= Total Cover
Number of Dominant SpeciesThat are OBL, FACW, or FAC:
Hydrophytic Vegetation Indicators:
Remarks: (Include photo numbers here or on a separate sheet.)
OBL speciesOBL speciesOBL speciesOBL species
FACW speciesFACW speciesFACW speciesFACW species
FAC speciesFAC speciesFAC speciesFAC species
FACU speciesFACU speciesFACU speciesFACU species
UPL speciesUPL speciesUPL speciesUPL species
Column Totals:Column Totals:Column Totals:Column Totals:
x 1 = x 1 = x 1 = x 1 =
x 2 =x 2 =x 2 =x 2 =
x 3 =x 3 =x 3 =x 3 =
x 4 = x 4 = x 4 = x 4 =
x 5 = x 5 = x 5 = x 5 =
(A)(A)(A)(A)
(A)
Percent of dominant SpeciesThat Are OBL, FACW, or FAC:
Total % Cover of: Multiply by:
(B)
1.2.3.4.5.6.7.8.9.
10.11.12.
Tree Stratum
*Indicator suffix = National status or professional decision assigned because Regional status not defined by FWS.
Absolute% Cover
Dominance Test is > 50%
DominantSpecies?Rel.Strat.Cover
1
1
1
1.2.3.4.
0
0
0
0
0
0.0%
0.0%
0.0%
0.0%
0
0.0%
= Total Cover
Sapling/Shrub Stratum
1.2.3.4.5.6.7.
0
0
0.0%
0.0%
1.2.3.4.5.6.7.
0
0
0.0%
0.0%
0
0
0.0%
0.0%
Definitions of Vegetation Strata:
Tree - Woody plants, 3 in. (7.6 cm) or more in diameter at breast height (DBH), regardless of height.
Sapling/shrub - Woody plants less than 3 in. DBH and greater than 3.28 ft (1m) tall..
Herb - All herbaceous (non-woody) plants, regardless of size, and woody plants less than 3.28 ft tall.
Woody vine - All woody vines greater than 3.28 ft in height.
01Sampling Point:
)
)
)
)
Morphological Adaptations 1 (Provide supporting data in Remarks or on a separate sheet)
Rapid Test for Hydrophytic Vegetation
(Plot size:
(Plot size:
(Plot size: 5 feet
(Plot size:
Typha latifoliaTypha latifoliaTypha latifoliaTypha latifolia
Juncus effususJuncus effususJuncus effususJuncus effusus
Euthamia graminifoliaEuthamia graminifoliaEuthamia graminifoliaEuthamia graminifolia
Agrostis albaAgrostis albaAgrostis albaAgrostis alba1

01Soil Sampling Point:
Profile Description: (Describe to the depth needed to document the indicator or confirm the absence of indicators.)
Matrix Redox Features
Type
YesYesYesYes NoNoNoNo
Hydric Soil Indicators: Indicators for Problematic Hydric Soils :
Restrictive Layer (if observed):
Hydric Soil Present?
Indicators of hydrophytic vegetation and wetland hydrology must be present, unless disturbed or problematic.
Histosol (A1)
Histic Epipedon (A2)
Black Histic (A3)
Hydrogen Sulfide (A4)
Depleted Below Dark Surface (A11)
Thick Dark Surface (A12)
Sandy Muck Mineral (S1)
Sandy Gleyed Matrix (S4)
Sandy Redox (S5)
Stripped Matrix (S6)
Loamy Gleyed Matrix (F2)
Depleted Matrix (F3)
Redox Dark Surface (F6)
Depleted Dark Surface (F7)
Other (Explain in Remarks)
Type:
Depth (inches):
Remarks:
US Army Corps of Engineers Northcentral and Northeast Region - Interim Version
Dark Surface (S7) (LRR R, MLRA 149B)
Stratified Layers (A5)
Polyvalue Below Surface (S8) (LRR R, MLRA 149B)
Redox Depressions (F8)
1
1
3
3
Thin Dark Surface (S9) (LRR R, MLRA 149B)
Iron-Manganese Masses (F12) (LRR K, L, R)
Mesic Spodic (TA6) (MLRA 144A, 145, 149B)
2 cm Muck (A10) (LRR K, L, MLRA 149B)
Piedmont Floodplain Soils (F19) (MLRA 149B)
Red Parent Material (TF2)
Very Shallow Dark Surface (TF12)
Type: C=Concentration. D=Depletion. RM=Reduced Matrix, CS=Covered or Coated Sand Grains ²Location: PL=Pore Lining. M=Matrix
Polyvalue Below Surface (S8) (LRR K, L)
Dark Surface (S7) (LRR K, L) Loamy Mucky Mineral (F1) LRR K, L)
Coast Prairie Redox (A16) (LRR K, L, R)
5 cm Mucky Peat or Peat (S3) (LRR K, L, R)
Thin Dark Surface (S9) (LRR K, L)
gravel and rock below 7"
0-1
1-7 10YR
10YR 4/3
4/2 95% 10YR 5/6 5% C PL Silt Loam
% RemarksTextureLoc²% Color (moist) Color (moist)
Depth(inches)

02
09-May-11
0.0
YesYesYesYes NoNoNoNo
YesYesYesYes NoNoNoNo
YesYesYesYes NoNoNoNo
YesYesYesYes NoNoNoNo
YesYesYesYes NoNoNoNo
YesYesYesYes NoNoNoNo
Lat.:
Hydric Soil Present?
Sampling Point:
Summary of Findings - Attach site map showing sampling point locations, transects, important features, etc.
State:
°Landform (hillslope, terrace, etc.):
T.
(If no, explain in Remarks.)
Are Vegetation
Are "Normal Circumstances" present?
Datum:
naturally problematic?
Are climatic/hydrologic conditions on the site typical for this time of year?
Hydrophytic Vegetation Present?
Remarks: (Explain alternative procedures here or in a separate report.)
R.
Are Vegetation
Long.:
significantly disturbed?
Local relief (concave, convex, none): Slope:
Investigator(s):
(If needed, explain any answers in Remarks.)
City/County:
, Soil
% /
Soil Map Unit Name:
, or Hydrology
, Soil , or Hydrology
NWI classification:
Subregion (LRR or MLRA):
Project/Site:
Wetland Hydrology Present?
Section, Township, Range: S.
Is the Sampled Areawithin a Wetland?
Applicant/Owner:
Sampling Date:
WETLAND DETERMINATION DATA FORM - Northcentral and Northeast Region
Upland old field
Tank Farm Wetland Mitigation Site
USPFO for Ohio
Todd Crandall
Flat
LRR R
Disturbed soils
Charlestown Township, Portage County
Ohio
flat
0.0
YesYesYesYes NoNoNoNo
YesYesYesYes NoNoNoNo
YesYesYesYes NoNoNoNoYesYesYesYes NoNoNoNo
Hydrology
Surface Water (A1)
High Water Table (A2)
Saturation (A3)
Water Marks (B1)
Sediment Deposits (B2)
Drift deposits (B3)
Algal Mat or Crust (B4)
Dry Season Water Table (C2)
Hydrogen Sulfide Odor (C1)
Oxidized Rhizospheres along Living Roots (C3)
Presence of Reduced Iron (C4)
Recent Iron Reduction in Tilled Soils (C6)
Other (Explain in Remarks)
Drainage Patterns (B10)Water-Stained Leaves (B9)
Saturation Visible on Aerial Imagery (C9)
Crayfish Burrows (C8)
Moss Trim Lines (B16)
Primary Indicators (minimum of one required; check all that apply)
Wetland Hydrology Indicators:
Field Observations:
Surface Water Present?
Water Table Present?
Saturation Present?(includes capillary fringe)
Depth (inches):
Depth (inches):
Depth (inches):Wetland Hydrology Present?
Describe Recorded Data (stream gauge, monitoring well, aerial photos, previous inspections), if available:
Remarks:
Secondary Indicators (minimum of 2 required)
Iron Deposits (B5)
Surface Soil Cracks (B6)
Stunted or Stressed Plants (D1)
Inundation Visible on Aerial Imagery (B7)
Sparsely Vegetated Concave Surface (B8)
Thin Muck Surface (C7) Shallow Aquitard (D3)
FAC-neutral Test (D5)
Northcentral and Northeast Region - Interim VersionUS Army Corps of Engineers
Geomorphic Position (D2)
Microtopographic Relief (D4)
Marl Deposits (B15)
Aquatic Fauna (B13)
No hydrological indicators

0
0
0
0
0
20
20
20
0
0
0
0
0
0
0
0
0
0
0
YesYesYesYes NoNoNoNo
00.0%
0.0%
30.0%
0.0%
0.0%
0
0.0%
33.3% UPL
33.3% FACU
0 0
33.3% FACU-
0 0
0.0%
0 0
40 160
20 100
0.0%
60 260
0.0%
4.333
0.0%
0.0%
0.0%
0.0%
0.0%
0.0%
0.0%
0.0%
60
0
Northcentral and Northeast Region - Interim Version
Woody Vine Stratum
(B)(B)(B)(B)
= Total Cover
IndicatorStatus
= Total Cover
Prevalence Index is ≤3.0
HydrophyticVegetationPresent?
US Army Corps of Engineers
VEGETATION - Use scientific names of plants
Dominance Test worksheet:
Total Number of DominantSpecies Across All Strata:
Prevalence Index worksheet:
Prevalence Index = B/A =
(A/B)
1 Indicators of hydric soil and wetland hydrology mustbe present, unless disturbed or problematic.
Problematic Hydrophytic Vegetation 1 (Explain)
Herb Stratum
= Total Cover
Number of Dominant SpeciesThat are OBL, FACW, or FAC:
Hydrophytic Vegetation Indicators:
Remarks: (Include photo numbers here or on a separate sheet.)
OBL speciesOBL speciesOBL speciesOBL species
FACW speciesFACW speciesFACW speciesFACW species
FAC speciesFAC speciesFAC speciesFAC species
FACU speciesFACU speciesFACU speciesFACU species
UPL speciesUPL speciesUPL speciesUPL species
Column Totals:Column Totals:Column Totals:Column Totals:
x 1 = x 1 = x 1 = x 1 =
x 2 =x 2 =x 2 =x 2 =
x 3 =x 3 =x 3 =x 3 =
x 4 = x 4 = x 4 = x 4 =
x 5 = x 5 = x 5 = x 5 =
(A)(A)(A)(A)
(A)
Percent of dominant SpeciesThat Are OBL, FACW, or FAC:
Total % Cover of: Multiply by:
(B)
1.2.3.4.5.6.7.8.9.
10.11.12.
Tree Stratum
*Indicator suffix = National status or professional decision assigned because Regional status not defined by FWS.
Absolute% Cover
Dominance Test is > 50%
DominantSpecies?Rel.Strat.Cover
1
1
1
1.2.3.4.
0
0
0
0
0
0.0%
0.0%
0.0%
0.0%
0
0.0%
= Total Cover
Sapling/Shrub Stratum
1.2.3.4.5.6.7.
0
0
0.0%
0.0%
1.2.3.4.5.6.7.
0
0
0.0%
0.0%
0
0
0.0%
0.0%
Definitions of Vegetation Strata:
Tree - Woody plants, 3 in. (7.6 cm) or more in diameter at breast height (DBH), regardless of height.
Sapling/shrub - Woody plants less than 3 in. DBH and greater than 3.28 ft (1m) tall..
Herb - All herbaceous (non-woody) plants, regardless of size, and woody plants less than 3.28 ft tall.
Woody vine - All woody vines greater than 3.28 ft in height.
02Sampling Point:
)
)
)
)
Morphological Adaptations 1 (Provide supporting data in Remarks or on a separate sheet)
Rapid Test for Hydrophytic Vegetation
(Plot size:
(Plot size:
(Plot size: 5 feet
(Plot size:
Daucus carotaDaucus carotaDaucus carotaDaucus carota
Dactylis glomerataDactylis glomerataDactylis glomerataDactylis glomerata
Trifolium hybridumTrifolium hybridumTrifolium hybridumTrifolium hybridum
Festuca sp. (40 percent) also present
1

02Soil Sampling Point:
Profile Description: (Describe to the depth needed to document the indicator or confirm the absence of indicators.)
Matrix Redox Features
Type
YesYesYesYes NoNoNoNo
Hydric Soil Indicators: Indicators for Problematic Hydric Soils :
Restrictive Layer (if observed):
Hydric Soil Present?
Indicators of hydrophytic vegetation and wetland hydrology must be present, unless disturbed or problematic.
Histosol (A1)
Histic Epipedon (A2)
Black Histic (A3)
Hydrogen Sulfide (A4)
Depleted Below Dark Surface (A11)
Thick Dark Surface (A12)
Sandy Muck Mineral (S1)
Sandy Gleyed Matrix (S4)
Sandy Redox (S5)
Stripped Matrix (S6)
Loamy Gleyed Matrix (F2)
Depleted Matrix (F3)
Redox Dark Surface (F6)
Depleted Dark Surface (F7)
Other (Explain in Remarks)
Type:
Depth (inches):
Remarks:
US Army Corps of Engineers Northcentral and Northeast Region - Interim Version
Dark Surface (S7) (LRR R, MLRA 149B)
Stratified Layers (A5)
Polyvalue Below Surface (S8) (LRR R, MLRA 149B)
Redox Depressions (F8)
1
1
3
3
Thin Dark Surface (S9) (LRR R, MLRA 149B)
Iron-Manganese Masses (F12) (LRR K, L, R)
Mesic Spodic (TA6) (MLRA 144A, 145, 149B)
2 cm Muck (A10) (LRR K, L, MLRA 149B)
Piedmont Floodplain Soils (F19) (MLRA 149B)
Red Parent Material (TF2)
Very Shallow Dark Surface (TF12)
Type: C=Concentration. D=Depletion. RM=Reduced Matrix, CS=Covered or Coated Sand Grains ²Location: PL=Pore Lining. M=Matrix
Polyvalue Below Surface (S8) (LRR K, L)
Dark Surface (S7) (LRR K, L) Loamy Mucky Mineral (F1) LRR K, L)
Coast Prairie Redox (A16) (LRR K, L, R)
5 cm Mucky Peat or Peat (S3) (LRR K, L, R)
Thin Dark Surface (S9) (LRR K, L)
gravel and rock below 10"
0-2
2-10 10YR
10YR 4/2
4/3 95% 10YR 5/6 5% C PL Silt Loam
Silt Loam
% RemarksTextureLoc²% Color (moist) Color (moist)
Depth(inches)

03
09-May-11
0.0
YesYesYesYes NoNoNoNo
YesYesYesYes NoNoNoNo
YesYesYesYes NoNoNoNo
YesYesYesYes NoNoNoNo
YesYesYesYes NoNoNoNo
YesYesYesYes NoNoNoNo
Lat.:
Hydric Soil Present?
Sampling Point:
Summary of Findings - Attach site map showing sampling point locations, transects, important features, etc.
State:
°Landform (hillslope, terrace, etc.):
T.
(If no, explain in Remarks.)
Are Vegetation
Are "Normal Circumstances" present?
Datum:
naturally problematic?
Are climatic/hydrologic conditions on the site typical for this time of year?
Hydrophytic Vegetation Present?
Remarks: (Explain alternative procedures here or in a separate report.)
R.
Are Vegetation
Long.:
significantly disturbed?
Local relief (concave, convex, none): Slope:
Investigator(s):
(If needed, explain any answers in Remarks.)
City/County:
, Soil
% /
Soil Map Unit Name:
, or Hydrology
, Soil , or Hydrology
NWI classification:
Subregion (LRR or MLRA):
Project/Site:
Wetland Hydrology Present?
Section, Township, Range: S.
Is the Sampled Areawithin a Wetland?
Applicant/Owner:
Sampling Date:
WETLAND DETERMINATION DATA FORM - Northcentral and Northeast Region
Shallow emergent marsh
Tank Farm Wetland Mitigation Site
USPFO for Ohio
Todd Crandall
Flat
LRR R
Disturbed soils
Charlestown Township, Portage County
Ohio
concave
0.0
3YesYesYesYes NoNoNoNo
YesYesYesYes NoNoNoNo
YesYesYesYes NoNoNoNoYesYesYesYes NoNoNoNo
Hydrology
Surface Water (A1)
High Water Table (A2)
Saturation (A3)
Water Marks (B1)
Sediment Deposits (B2)
Drift deposits (B3)
Algal Mat or Crust (B4)
Dry Season Water Table (C2)
Hydrogen Sulfide Odor (C1)
Oxidized Rhizospheres along Living Roots (C3)
Presence of Reduced Iron (C4)
Recent Iron Reduction in Tilled Soils (C6)
Other (Explain in Remarks)
Drainage Patterns (B10)Water-Stained Leaves (B9)
Saturation Visible on Aerial Imagery (C9)
Crayfish Burrows (C8)
Moss Trim Lines (B16)
Primary Indicators (minimum of one required; check all that apply)
Wetland Hydrology Indicators:
Field Observations:
Surface Water Present?
Water Table Present?
Saturation Present?(includes capillary fringe)
Depth (inches):
Depth (inches):
Depth (inches):Wetland Hydrology Present?
Describe Recorded Data (stream gauge, monitoring well, aerial photos, previous inspections), if available:
Remarks:
Secondary Indicators (minimum of 2 required)
Iron Deposits (B5)
Surface Soil Cracks (B6)
Stunted or Stressed Plants (D1)
Inundation Visible on Aerial Imagery (B7)
Sparsely Vegetated Concave Surface (B8)
Thin Muck Surface (C7) Shallow Aquitard (D3)
FAC-neutral Test (D5)
Northcentral and Northeast Region - Interim VersionUS Army Corps of Engineers
Geomorphic Position (D2)
Microtopographic Relief (D4)
Marl Deposits (B15)
Aquatic Fauna (B13)

0
0
0
0
0
80
10
10
0
0
0
0
0
0
0
0
0
0
0
YesYesYesYes NoNoNoNo
10.0%
0.0%
10.0%
0.0%
100.0%
0
0.0%
80.0% OBL
10.0% OBL
100 100
10.0% OBL
0 0
0.0%
0 0
0 0
0 0
0.0%
100 100
0.0%
1.000
0.0%
0.0%
0.0%
0.0%
0.0%
0.0%
0.0%
0.0%
100
0
Northcentral and Northeast Region - Interim Version
Woody Vine Stratum
(B)(B)(B)(B)
= Total Cover
IndicatorStatus
= Total Cover
Prevalence Index is ≤3.0
HydrophyticVegetationPresent?
US Army Corps of Engineers
VEGETATION - Use scientific names of plants
Dominance Test worksheet:
Total Number of DominantSpecies Across All Strata:
Prevalence Index worksheet:
Prevalence Index = B/A =
(A/B)
1 Indicators of hydric soil and wetland hydrology mustbe present, unless disturbed or problematic.
Problematic Hydrophytic Vegetation 1 (Explain)
Herb Stratum
= Total Cover
Number of Dominant SpeciesThat are OBL, FACW, or FAC:
Hydrophytic Vegetation Indicators:
Remarks: (Include photo numbers here or on a separate sheet.)
OBL speciesOBL speciesOBL speciesOBL species
FACW speciesFACW speciesFACW speciesFACW species
FAC speciesFAC speciesFAC speciesFAC species
FACU speciesFACU speciesFACU speciesFACU species
UPL speciesUPL speciesUPL speciesUPL species
Column Totals:Column Totals:Column Totals:Column Totals:
x 1 = x 1 = x 1 = x 1 =
x 2 =x 2 =x 2 =x 2 =
x 3 =x 3 =x 3 =x 3 =
x 4 = x 4 = x 4 = x 4 =
x 5 = x 5 = x 5 = x 5 =
(A)(A)(A)(A)
(A)
Percent of dominant SpeciesThat Are OBL, FACW, or FAC:
Total % Cover of: Multiply by:
(B)
1.2.3.4.5.6.7.8.9.
10.11.12.
Tree Stratum
*Indicator suffix = National status or professional decision assigned because Regional status not defined by FWS.
Absolute% Cover
Dominance Test is > 50%
DominantSpecies?Rel.Strat.Cover
1
1
1
1.2.3.4.
0
0
0
0
0
0.0%
0.0%
0.0%
0.0%
0
0.0%
= Total Cover
Sapling/Shrub Stratum
1.2.3.4.5.6.7.
0
0
0.0%
0.0%
1.2.3.4.5.6.7.
0
0
0.0%
0.0%
0
0
0.0%
0.0%
Definitions of Vegetation Strata:
Tree - Woody plants, 3 in. (7.6 cm) or more in diameter at breast height (DBH), regardless of height.
Sapling/shrub - Woody plants less than 3 in. DBH and greater than 3.28 ft (1m) tall..
Herb - All herbaceous (non-woody) plants, regardless of size, and woody plants less than 3.28 ft tall.
Woody vine - All woody vines greater than 3.28 ft in height.
03Sampling Point:
)
)
)
)
Morphological Adaptations 1 (Provide supporting data in Remarks or on a separate sheet)
Rapid Test for Hydrophytic Vegetation
(Plot size:
(Plot size:
(Plot size: 5 feet
(Plot size:
Typha latifoliaTypha latifoliaTypha latifoliaTypha latifolia
Alisma plantago-aquaticaAlisma plantago-aquaticaAlisma plantago-aquaticaAlisma plantago-aquatica
Ludwigia palustrisLudwigia palustrisLudwigia palustrisLudwigia palustris1

03Soil Sampling Point:
Profile Description: (Describe to the depth needed to document the indicator or confirm the absence of indicators.)
Matrix Redox Features
Type
YesYesYesYes NoNoNoNo
Hydric Soil Indicators: Indicators for Problematic Hydric Soils :
Restrictive Layer (if observed):
Hydric Soil Present?
Indicators of hydrophytic vegetation and wetland hydrology must be present, unless disturbed or problematic.
Histosol (A1)
Histic Epipedon (A2)
Black Histic (A3)
Hydrogen Sulfide (A4)
Depleted Below Dark Surface (A11)
Thick Dark Surface (A12)
Sandy Muck Mineral (S1)
Sandy Gleyed Matrix (S4)
Sandy Redox (S5)
Stripped Matrix (S6)
Loamy Gleyed Matrix (F2)
Depleted Matrix (F3)
Redox Dark Surface (F6)
Depleted Dark Surface (F7)
Other (Explain in Remarks)
Type:
Depth (inches):
Remarks:
US Army Corps of Engineers Northcentral and Northeast Region - Interim Version
Dark Surface (S7) (LRR R, MLRA 149B)
Stratified Layers (A5)
Polyvalue Below Surface (S8) (LRR R, MLRA 149B)
Redox Depressions (F8)
1
1
3
3
Thin Dark Surface (S9) (LRR R, MLRA 149B)
Iron-Manganese Masses (F12) (LRR K, L, R)
Mesic Spodic (TA6) (MLRA 144A, 145, 149B)
2 cm Muck (A10) (LRR K, L, MLRA 149B)
Piedmont Floodplain Soils (F19) (MLRA 149B)
Red Parent Material (TF2)
Very Shallow Dark Surface (TF12)
Type: C=Concentration. D=Depletion. RM=Reduced Matrix, CS=Covered or Coated Sand Grains ²Location: PL=Pore Lining. M=Matrix
Polyvalue Below Surface (S8) (LRR K, L)
Dark Surface (S7) (LRR K, L) Loamy Mucky Mineral (F1) LRR K, L)
Coast Prairie Redox (A16) (LRR K, L, R)
5 cm Mucky Peat or Peat (S3) (LRR K, L, R)
Thin Dark Surface (S9) (LRR K, L)
0-3
3-12 10YR
10YR 4/1
4/2 95% 10YR 5/6 5% C PL Silt Loam
Silt Loam
% RemarksTextureLoc²% Color (moist) Color (moist)
Depth(inches)
04
09-May-11
0.0
YesYesYesYes NoNoNoNo
YesYesYesYes NoNoNoNo
YesYesYesYes NoNoNoNo
YesYesYesYes NoNoNoNo
YesYesYesYes NoNoNoNo
YesYesYesYes NoNoNoNo
Lat.:
Hydric Soil Present?
Sampling Point:
Summary of Findings - Attach site map showing sampling point locations, transects, important features, etc.
State:
°Landform (hillslope, terrace, etc.):
T.
(If no, explain in Remarks.)
Are Vegetation
Are "Normal Circumstances" present?
Datum:
naturally problematic?
Are climatic/hydrologic conditions on the site typical for this time of year?
Hydrophytic Vegetation Present?
Remarks: (Explain alternative procedures here or in a separate report.)
R.
Are Vegetation
Long.:
significantly disturbed?
Local relief (concave, convex, none): Slope:
Investigator(s):
(If needed, explain any answers in Remarks.)
City/County:
, Soil
% /
Soil Map Unit Name:
, or Hydrology
, Soil , or Hydrology
NWI classification:
Subregion (LRR or MLRA):
Project/Site:
Wetland Hydrology Present?
Section, Township, Range: S.
Is the Sampled Areawithin a Wetland?
Applicant/Owner:
Sampling Date:
WETLAND DETERMINATION DATA FORM - Northcentral and Northeast Region
Upland old field
Tank Farm Wetland Mitigation Site
USPFO for Ohio
Todd Crandall
Flat
LRR R
Disturbed soils
Charlestown Township, Portage County
Ohio
convex
0.0
YesYesYesYes NoNoNoNo
YesYesYesYes NoNoNoNo
YesYesYesYes NoNoNoNoYesYesYesYes NoNoNoNo
Hydrology
Surface Water (A1)
High Water Table (A2)
Saturation (A3)
Water Marks (B1)
Sediment Deposits (B2)
Drift deposits (B3)
Algal Mat or Crust (B4)
Dry Season Water Table (C2)
Hydrogen Sulfide Odor (C1)
Oxidized Rhizospheres along Living Roots (C3)
Presence of Reduced Iron (C4)
Recent Iron Reduction in Tilled Soils (C6)
Other (Explain in Remarks)
Drainage Patterns (B10)Water-Stained Leaves (B9)
Saturation Visible on Aerial Imagery (C9)
Crayfish Burrows (C8)
Moss Trim Lines (B16)
Primary Indicators (minimum of one required; check all that apply)
Wetland Hydrology Indicators:
Field Observations:
Surface Water Present?
Water Table Present?
Saturation Present?(includes capillary fringe)
Depth (inches):
Depth (inches):
Depth (inches):Wetland Hydrology Present?
Describe Recorded Data (stream gauge, monitoring well, aerial photos, previous inspections), if available:
Remarks:
Secondary Indicators (minimum of 2 required)
Iron Deposits (B5)
Surface Soil Cracks (B6)
Stunted or Stressed Plants (D1)
Inundation Visible on Aerial Imagery (B7)
Sparsely Vegetated Concave Surface (B8)
Thin Muck Surface (C7) Shallow Aquitard (D3)
FAC-neutral Test (D5)
Northcentral and Northeast Region - Interim VersionUS Army Corps of Engineers
Geomorphic Position (D2)
Microtopographic Relief (D4)
Marl Deposits (B15)
Aquatic Fauna (B13)
No hydrological indicators
0
0
0
0
0
30
20
10
10
0
0
0
0
0
0
0
0
0
0
YesYesYesYes NoNoNoNo
00.0%
0.0%
20.0%
0.0%
0.0%
0
0.0%
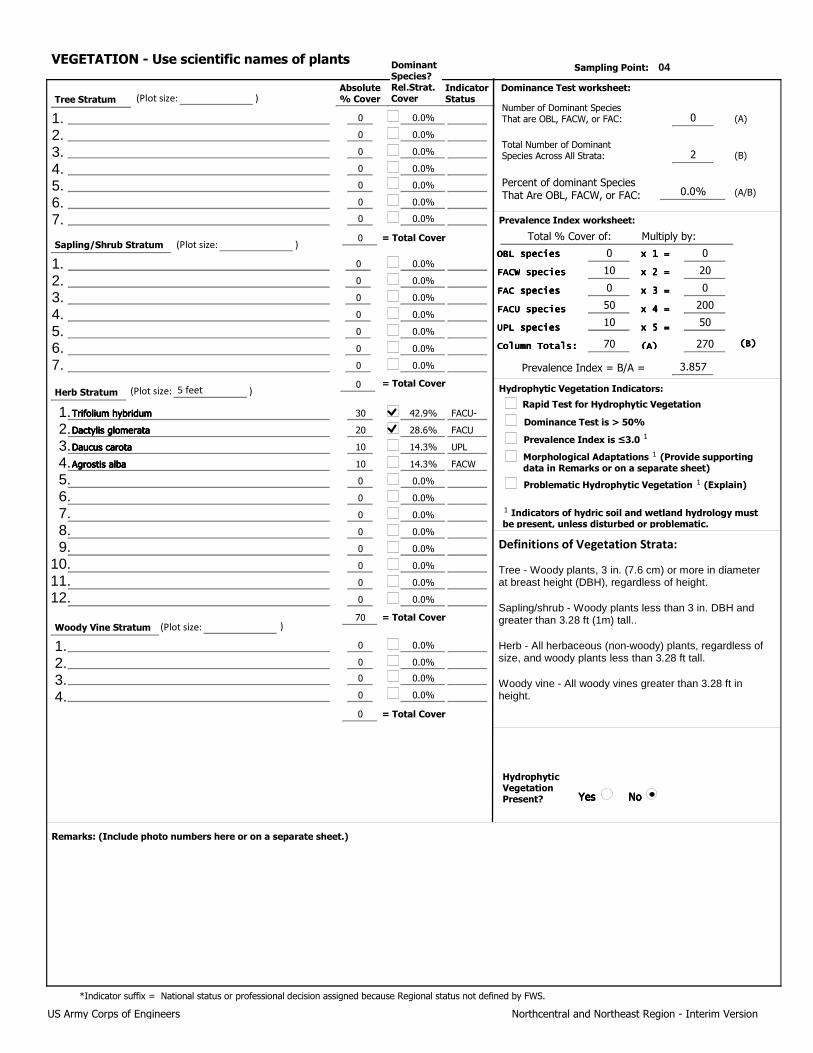
42.9% FACU-
28.6% FACU
0 0
14.3% UPL
10 20
14.3% FACW
0 0
50 200
10 50
0.0%
70 270
0.0%
3.857
0.0%
0.0%
0.0%
0.0%
0.0%
0.0%
0.0%
0.0%
70
0
Northcentral and Northeast Region - Interim Version
Woody Vine Stratum
(B)(B)(B)(B)
= Total Cover
IndicatorStatus
= Total Cover
Prevalence Index is ≤3.0
HydrophyticVegetationPresent?
US Army Corps of Engineers
VEGETATION - Use scientific names of plants
Dominance Test worksheet:
Total Number of DominantSpecies Across All Strata:
Prevalence Index worksheet:
Prevalence Index = B/A =
(A/B)
1 Indicators of hydric soil and wetland hydrology mustbe present, unless disturbed or problematic.
Problematic Hydrophytic Vegetation 1 (Explain)
Herb Stratum
= Total Cover
Number of Dominant SpeciesThat are OBL, FACW, or FAC:
Hydrophytic Vegetation Indicators:
Remarks: (Include photo numbers here or on a separate sheet.)
OBL speciesOBL speciesOBL speciesOBL species
FACW speciesFACW speciesFACW speciesFACW species
FAC speciesFAC speciesFAC speciesFAC species
FACU speciesFACU speciesFACU speciesFACU species
UPL speciesUPL speciesUPL speciesUPL species
Column Totals:Column Totals:Column Totals:Column Totals:
x 1 = x 1 = x 1 = x 1 =
x 2 =x 2 =x 2 =x 2 =
x 3 =x 3 =x 3 =x 3 =
x 4 = x 4 = x 4 = x 4 =
x 5 = x 5 = x 5 = x 5 =
(A)(A)(A)(A)
(A)
Percent of dominant SpeciesThat Are OBL, FACW, or FAC:
Total % Cover of: Multiply by:
(B)
1.2.3.4.5.6.7.8.9.
10.11.12.
Tree Stratum
*Indicator suffix = National status or professional decision assigned because Regional status not defined by FWS.
Absolute% Cover
Dominance Test is > 50%
DominantSpecies?Rel.Strat.Cover
1
1
1
1.2.3.4.
0
0
0
0
0
0.0%
0.0%
0.0%
0.0%
0
0.0%
= Total Cover
Sapling/Shrub Stratum
1.2.3.4.5.6.7.
0
0
0.0%
0.0%
1.2.3.4.5.6.7.
0
0
0.0%
0.0%
0
0
0.0%
0.0%
Definitions of Vegetation Strata:
Tree - Woody plants, 3 in. (7.6 cm) or more in diameter at breast height (DBH), regardless of height.
Sapling/shrub - Woody plants less than 3 in. DBH and greater than 3.28 ft (1m) tall..
Herb - All herbaceous (non-woody) plants, regardless of size, and woody plants less than 3.28 ft tall.
Woody vine - All woody vines greater than 3.28 ft in height.
04Sampling Point:
)
)
)
)
Morphological Adaptations 1 (Provide supporting data in Remarks or on a separate sheet)
Rapid Test for Hydrophytic Vegetation
(Plot size:
(Plot size:
(Plot size: 5 feet
(Plot size:
Trifolium hybridumTrifolium hybridumTrifolium hybridumTrifolium hybridum
Dactylis glomerataDactylis glomerataDactylis glomerataDactylis glomerata
Daucus carotaDaucus carotaDaucus carotaDaucus carota
Agrostis albaAgrostis albaAgrostis albaAgrostis alba1
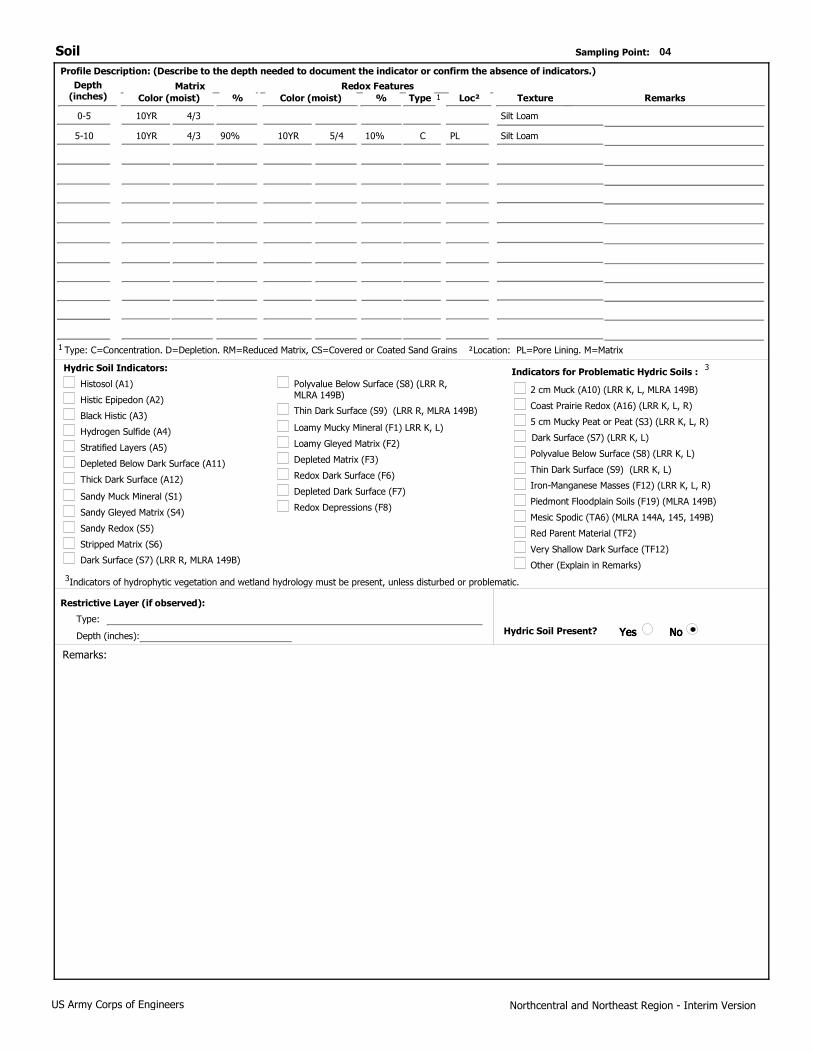
04Soil Sampling Point:
Profile Description: (Describe to the depth needed to document the indicator or confirm the absence of indicators.)
Matrix Redox Features
Type
YesYesYesYes NoNoNoNo
Hydric Soil Indicators: Indicators for Problematic Hydric Soils :
Restrictive Layer (if observed):
Hydric Soil Present?
Indicators of hydrophytic vegetation and wetland hydrology must be present, unless disturbed or problematic.
Histosol (A1)
Histic Epipedon (A2)
Black Histic (A3)
Hydrogen Sulfide (A4)
Depleted Below Dark Surface (A11)
Thick Dark Surface (A12)
Sandy Muck Mineral (S1)
Sandy Gleyed Matrix (S4)
Sandy Redox (S5)
Stripped Matrix (S6)
Loamy Gleyed Matrix (F2)
Depleted Matrix (F3)
Redox Dark Surface (F6)
Depleted Dark Surface (F7)
Other (Explain in Remarks)
Type:
Depth (inches):
Remarks:
US Army Corps of Engineers Northcentral and Northeast Region - Interim Version
Dark Surface (S7) (LRR R, MLRA 149B)
Stratified Layers (A5)
Polyvalue Below Surface (S8) (LRR R, MLRA 149B)
Redox Depressions (F8)
1
1
3
3
Thin Dark Surface (S9) (LRR R, MLRA 149B)
Iron-Manganese Masses (F12) (LRR K, L, R)
Mesic Spodic (TA6) (MLRA 144A, 145, 149B)
2 cm Muck (A10) (LRR K, L, MLRA 149B)
Piedmont Floodplain Soils (F19) (MLRA 149B)
Red Parent Material (TF2)
Very Shallow Dark Surface (TF12)
Type: C=Concentration. D=Depletion. RM=Reduced Matrix, CS=Covered or Coated Sand Grains ²Location: PL=Pore Lining. M=Matrix
Polyvalue Below Surface (S8) (LRR K, L)
Dark Surface (S7) (LRR K, L) Loamy Mucky Mineral (F1) LRR K, L)
Coast Prairie Redox (A16) (LRR K, L, R)
5 cm Mucky Peat or Peat (S3) (LRR K, L, R)
Thin Dark Surface (S9) (LRR K, L)
0-5
5-10 10YR
10YR 4/3
4/3 90% 10YR 5/4 10% C PL Silt Loam
Silt Loam
% RemarksTextureLoc²% Color (moist) Color (moist)
Depth(inches)
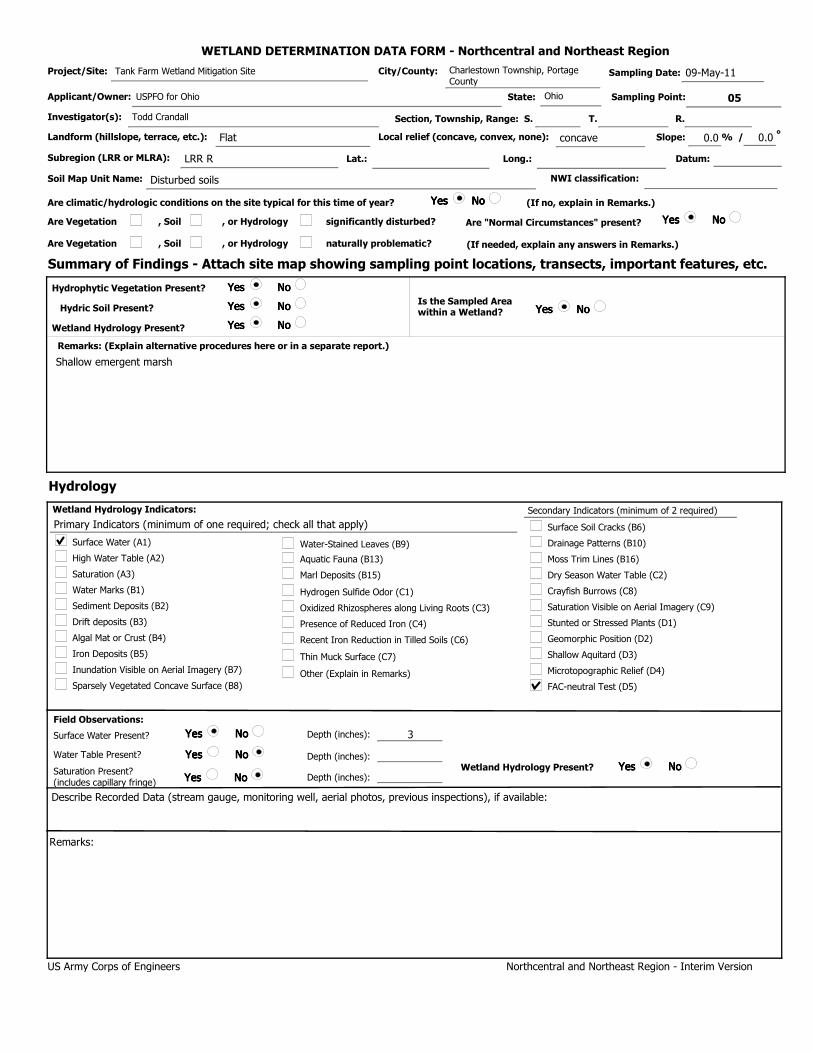
05
09-May-11
0.0
YesYesYesYes NoNoNoNo
YesYesYesYes NoNoNoNo
YesYesYesYes NoNoNoNo
YesYesYesYes NoNoNoNo
YesYesYesYes NoNoNoNo
YesYesYesYes NoNoNoNo
Lat.:
Hydric Soil Present?
Sampling Point:
Summary of Findings - Attach site map showing sampling point locations, transects, important features, etc.
State:
°Landform (hillslope, terrace, etc.):
T.
(If no, explain in Remarks.)
Are Vegetation
Are "Normal Circumstances" present?
Datum:
naturally problematic?
Are climatic/hydrologic conditions on the site typical for this time of year?
Hydrophytic Vegetation Present?
Remarks: (Explain alternative procedures here or in a separate report.)
R.
Are Vegetation
Long.:
significantly disturbed?
Local relief (concave, convex, none): Slope:
Investigator(s):
(If needed, explain any answers in Remarks.)
City/County:
, Soil
% /
Soil Map Unit Name:
, or Hydrology
, Soil , or Hydrology
NWI classification:
Subregion (LRR or MLRA):
Project/Site:
Wetland Hydrology Present?
Section, Township, Range: S.
Is the Sampled Areawithin a Wetland?
Applicant/Owner:
Sampling Date:
WETLAND DETERMINATION DATA FORM - Northcentral and Northeast Region
Shallow emergent marsh
Tank Farm Wetland Mitigation Site
USPFO for Ohio
Todd Crandall
Flat
LRR R
Disturbed soils
Charlestown Township, Portage County
Ohio
concave
0.0
3YesYesYesYes NoNoNoNo
YesYesYesYes NoNoNoNo
YesYesYesYes NoNoNoNoYesYesYesYes NoNoNoNo
Hydrology
Surface Water (A1)
High Water Table (A2)
Saturation (A3)
Water Marks (B1)
Sediment Deposits (B2)
Drift deposits (B3)
Algal Mat or Crust (B4)
Dry Season Water Table (C2)
Hydrogen Sulfide Odor (C1)
Oxidized Rhizospheres along Living Roots (C3)
Presence of Reduced Iron (C4)
Recent Iron Reduction in Tilled Soils (C6)
Other (Explain in Remarks)
Drainage Patterns (B10)Water-Stained Leaves (B9)
Saturation Visible on Aerial Imagery (C9)
Crayfish Burrows (C8)
Moss Trim Lines (B16)
Primary Indicators (minimum of one required; check all that apply)
Wetland Hydrology Indicators:
Field Observations:
Surface Water Present?
Water Table Present?
Saturation Present?(includes capillary fringe)
Depth (inches):
Depth (inches):
Depth (inches):Wetland Hydrology Present?
Describe Recorded Data (stream gauge, monitoring well, aerial photos, previous inspections), if available:
Remarks:
Secondary Indicators (minimum of 2 required)
Iron Deposits (B5)
Surface Soil Cracks (B6)
Stunted or Stressed Plants (D1)
Inundation Visible on Aerial Imagery (B7)
Sparsely Vegetated Concave Surface (B8)
Thin Muck Surface (C7) Shallow Aquitard (D3)
FAC-neutral Test (D5)
Northcentral and Northeast Region - Interim VersionUS Army Corps of Engineers
Geomorphic Position (D2)
Microtopographic Relief (D4)
Marl Deposits (B15)
Aquatic Fauna (B13)

0
0
0
0
0
80
10
0
0
0
0
0
0
0
0
0
0
0
0
YesYesYesYes NoNoNoNo
10.0%
0.0%
10.0%
0.0%
100.0%
0
0.0%
88.9% OBL
11.1% FACW
80 80
0.0%
10 20
0.0%
0 0
0 0
0 0
0.0%
90 100
0.0%
1.111
0.0%
0.0%
0.0%
0.0%
0.0%
0.0%
0.0%
0.0%
90
0
Northcentral and Northeast Region - Interim Version
Woody Vine Stratum
(B)(B)(B)(B)
= Total Cover
IndicatorStatus
= Total Cover
Prevalence Index is ≤3.0
HydrophyticVegetationPresent?
US Army Corps of Engineers
VEGETATION - Use scientific names of plants
Dominance Test worksheet:
Total Number of DominantSpecies Across All Strata:
Prevalence Index worksheet:
Prevalence Index = B/A =
(A/B)
1 Indicators of hydric soil and wetland hydrology mustbe present, unless disturbed or problematic.
Problematic Hydrophytic Vegetation 1 (Explain)
Herb Stratum
= Total Cover
Number of Dominant SpeciesThat are OBL, FACW, or FAC:
Hydrophytic Vegetation Indicators:
Remarks: (Include photo numbers here or on a separate sheet.)
OBL speciesOBL speciesOBL speciesOBL species
FACW speciesFACW speciesFACW speciesFACW species
FAC speciesFAC speciesFAC speciesFAC species
FACU speciesFACU speciesFACU speciesFACU species
UPL speciesUPL speciesUPL speciesUPL species
Column Totals:Column Totals:Column Totals:Column Totals:
x 1 = x 1 = x 1 = x 1 =
x 2 =x 2 =x 2 =x 2 =
x 3 =x 3 =x 3 =x 3 =
x 4 = x 4 = x 4 = x 4 =
x 5 = x 5 = x 5 = x 5 =
(A)(A)(A)(A)
(A)
Percent of dominant SpeciesThat Are OBL, FACW, or FAC:
Total % Cover of: Multiply by:
(B)
1.2.3.4.5.6.7.8.9.
10.11.12.
Tree Stratum
*Indicator suffix = National status or professional decision assigned because Regional status not defined by FWS.
Absolute% Cover
Dominance Test is > 50%
DominantSpecies?Rel.Strat.Cover
1
1
1
1.2.3.4.
0
0
0
0
0
0.0%
0.0%
0.0%
0.0%
0
0.0%
= Total Cover
Sapling/Shrub Stratum
1.2.3.4.5.6.7.
0
0
0.0%
0.0%
1.2.3.4.5.6.7.
0
0
0.0%
0.0%
0
0
0.0%
0.0%
Definitions of Vegetation Strata:
Tree - Woody plants, 3 in. (7.6 cm) or more in diameter at breast height (DBH), regardless of height.
Sapling/shrub - Woody plants less than 3 in. DBH and greater than 3.28 ft (1m) tall..
Herb - All herbaceous (non-woody) plants, regardless of size, and woody plants less than 3.28 ft tall.
Woody vine - All woody vines greater than 3.28 ft in height.
05Sampling Point:
)
)
)
)
Morphological Adaptations 1 (Provide supporting data in Remarks or on a separate sheet)
Rapid Test for Hydrophytic Vegetation
(Plot size:
(Plot size:
(Plot size: 5 feet
(Plot size:
Typha latifoliaTypha latifoliaTypha latifoliaTypha latifolia
Phragmites australisPhragmites australisPhragmites australisPhragmites australis
1

05Soil Sampling Point:
Profile Description: (Describe to the depth needed to document the indicator or confirm the absence of indicators.)
Matrix Redox Features
Type
YesYesYesYes NoNoNoNo
Hydric Soil Indicators: Indicators for Problematic Hydric Soils :
Restrictive Layer (if observed):
Hydric Soil Present?
Indicators of hydrophytic vegetation and wetland hydrology must be present, unless disturbed or problematic.
Histosol (A1)
Histic Epipedon (A2)
Black Histic (A3)
Hydrogen Sulfide (A4)
Depleted Below Dark Surface (A11)
Thick Dark Surface (A12)
Sandy Muck Mineral (S1)
Sandy Gleyed Matrix (S4)
Sandy Redox (S5)
Stripped Matrix (S6)
Loamy Gleyed Matrix (F2)
Depleted Matrix (F3)
Redox Dark Surface (F6)
Depleted Dark Surface (F7)
Other (Explain in Remarks)
Type:
Depth (inches):
Remarks:
US Army Corps of Engineers Northcentral and Northeast Region - Interim Version
Dark Surface (S7) (LRR R, MLRA 149B)
Stratified Layers (A5)
Polyvalue Below Surface (S8) (LRR R, MLRA 149B)
Redox Depressions (F8)
1
1
3
3
Thin Dark Surface (S9) (LRR R, MLRA 149B)
Iron-Manganese Masses (F12) (LRR K, L, R)
Mesic Spodic (TA6) (MLRA 144A, 145, 149B)
2 cm Muck (A10) (LRR K, L, MLRA 149B)
Piedmont Floodplain Soils (F19) (MLRA 149B)
Red Parent Material (TF2)
Very Shallow Dark Surface (TF12)
Type: C=Concentration. D=Depletion. RM=Reduced Matrix, CS=Covered or Coated Sand Grains ²Location: PL=Pore Lining. M=Matrix
Polyvalue Below Surface (S8) (LRR K, L)
Dark Surface (S7) (LRR K, L) Loamy Mucky Mineral (F1) LRR K, L)
Coast Prairie Redox (A16) (LRR K, L, R)
5 cm Mucky Peat or Peat (S3) (LRR K, L, R)
Thin Dark Surface (S9) (LRR K, L)
0-3
3-8 10YR
10YR 4/1
4/1 90% 10YR 5/6 5% C PL Silt Loam
Loam
% RemarksTextureLoc²% Color (moist) Color (moist)
Depth(inches)

06
09-May-11
0.0
YesYesYesYes NoNoNoNo
YesYesYesYes NoNoNoNo
YesYesYesYes NoNoNoNo
YesYesYesYes NoNoNoNo
YesYesYesYes NoNoNoNo
YesYesYesYes NoNoNoNo
Lat.:
Hydric Soil Present?
Sampling Point:
Summary of Findings - Attach site map showing sampling point locations, transects, important features, etc.
State:
°Landform (hillslope, terrace, etc.):
T.
(If no, explain in Remarks.)
Are Vegetation
Are "Normal Circumstances" present?
Datum:
naturally problematic?
Are climatic/hydrologic conditions on the site typical for this time of year?
Hydrophytic Vegetation Present?
Remarks: (Explain alternative procedures here or in a separate report.)
R.
Are Vegetation
Long.:
significantly disturbed?
Local relief (concave, convex, none): Slope:
Investigator(s):
(If needed, explain any answers in Remarks.)
City/County:
, Soil
% /
Soil Map Unit Name:
, or Hydrology
, Soil , or Hydrology
NWI classification:
Subregion (LRR or MLRA):
Project/Site:
Wetland Hydrology Present?
Section, Township, Range: S.
Is the Sampled Areawithin a Wetland?
Applicant/Owner:
Sampling Date:
WETLAND DETERMINATION DATA FORM - Northcentral and Northeast Region
Upland old field
Tank Farm Wetland Mitigation Site
USPFO for Ohio
Todd Crandall
Flat
LRR R
Disturbed soils
Charlestown Township, Portage County
Ohio
convex
0.0
YesYesYesYes NoNoNoNo
YesYesYesYes NoNoNoNo
YesYesYesYes NoNoNoNoYesYesYesYes NoNoNoNo
Hydrology
Surface Water (A1)
High Water Table (A2)
Saturation (A3)
Water Marks (B1)
Sediment Deposits (B2)
Drift deposits (B3)
Algal Mat or Crust (B4)
Dry Season Water Table (C2)
Hydrogen Sulfide Odor (C1)
Oxidized Rhizospheres along Living Roots (C3)
Presence of Reduced Iron (C4)
Recent Iron Reduction in Tilled Soils (C6)
Other (Explain in Remarks)
Drainage Patterns (B10)Water-Stained Leaves (B9)
Saturation Visible on Aerial Imagery (C9)
Crayfish Burrows (C8)
Moss Trim Lines (B16)
Primary Indicators (minimum of one required; check all that apply)
Wetland Hydrology Indicators:
Field Observations:
Surface Water Present?
Water Table Present?
Saturation Present?(includes capillary fringe)
Depth (inches):
Depth (inches):
Depth (inches):Wetland Hydrology Present?
Describe Recorded Data (stream gauge, monitoring well, aerial photos, previous inspections), if available:
Remarks:
Secondary Indicators (minimum of 2 required)
Iron Deposits (B5)
Surface Soil Cracks (B6)
Stunted or Stressed Plants (D1)
Inundation Visible on Aerial Imagery (B7)
Sparsely Vegetated Concave Surface (B8)
Thin Muck Surface (C7) Shallow Aquitard (D3)
FAC-neutral Test (D5)
Northcentral and Northeast Region - Interim VersionUS Army Corps of Engineers
Geomorphic Position (D2)
Microtopographic Relief (D4)
Marl Deposits (B15)
Aquatic Fauna (B13)
No hydrological indicators
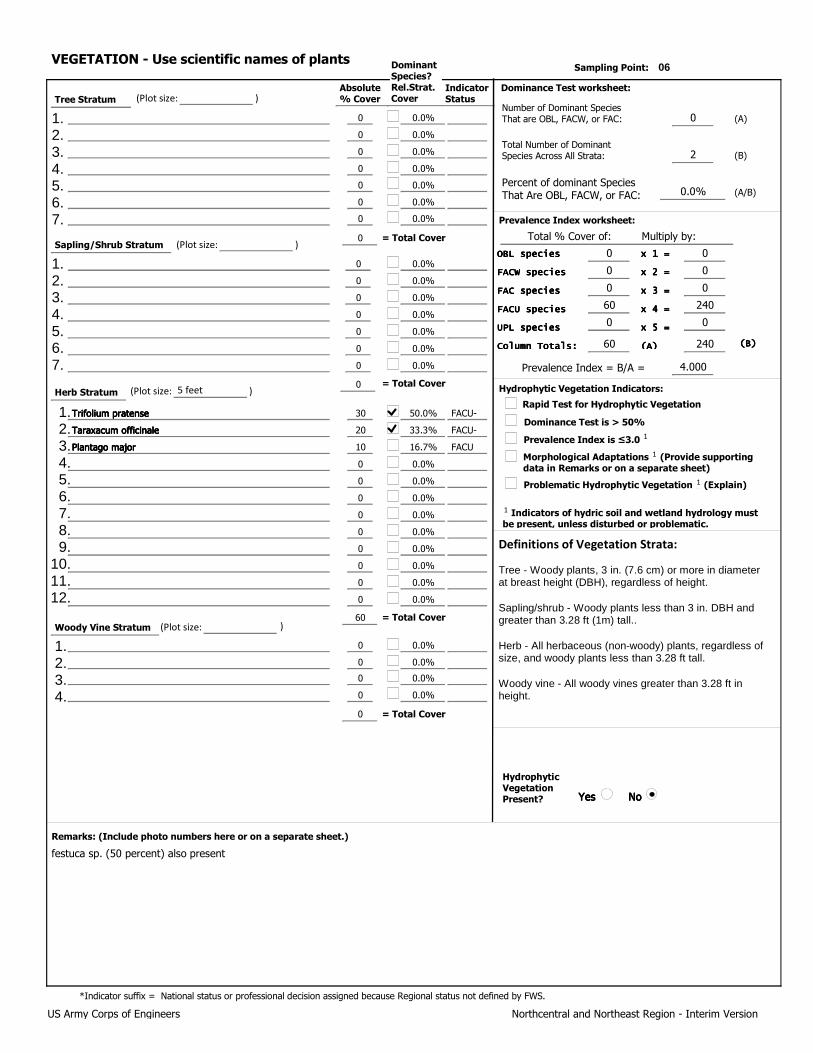
0
0
0
0
0
30
20
10
0
0
0
0
0
0
0
0
0
0
0
YesYesYesYes NoNoNoNo
00.0%
0.0%
20.0%
0.0%
0.0%
0
0.0%
50.0% FACU-
33.3% FACU-
0 0
16.7% FACU
0 0
0.0%
0 0
60 240
0 0
0.0%
60 240
0.0%
4.000
0.0%
0.0%
0.0%
0.0%
0.0%
0.0%
0.0%
0.0%
60
0
Northcentral and Northeast Region - Interim Version
Woody Vine Stratum
(B)(B)(B)(B)
= Total Cover
IndicatorStatus
= Total Cover
Prevalence Index is ≤3.0
HydrophyticVegetationPresent?
US Army Corps of Engineers
VEGETATION - Use scientific names of plants
Dominance Test worksheet:
Total Number of DominantSpecies Across All Strata:
Prevalence Index worksheet:
Prevalence Index = B/A =
(A/B)
1 Indicators of hydric soil and wetland hydrology mustbe present, unless disturbed or problematic.
Problematic Hydrophytic Vegetation 1 (Explain)
Herb Stratum
= Total Cover
Number of Dominant SpeciesThat are OBL, FACW, or FAC:
Hydrophytic Vegetation Indicators:
Remarks: (Include photo numbers here or on a separate sheet.)
OBL speciesOBL speciesOBL speciesOBL species
FACW speciesFACW speciesFACW speciesFACW species
FAC speciesFAC speciesFAC speciesFAC species
FACU speciesFACU speciesFACU speciesFACU species
UPL speciesUPL speciesUPL speciesUPL species
Column Totals:Column Totals:Column Totals:Column Totals:
x 1 = x 1 = x 1 = x 1 =
x 2 =x 2 =x 2 =x 2 =
x 3 =x 3 =x 3 =x 3 =
x 4 = x 4 = x 4 = x 4 =
x 5 = x 5 = x 5 = x 5 =
(A)(A)(A)(A)
(A)
Percent of dominant SpeciesThat Are OBL, FACW, or FAC:
Total % Cover of: Multiply by:
(B)
1.2.3.4.5.6.7.8.9.
10.11.12.
Tree Stratum
*Indicator suffix = National status or professional decision assigned because Regional status not defined by FWS.
Absolute% Cover
Dominance Test is > 50%
DominantSpecies?Rel.Strat.Cover
1
1
1
1.2.3.4.
0
0
0
0
0
0.0%
0.0%
0.0%
0.0%
0
0.0%
= Total Cover
Sapling/Shrub Stratum
1.2.3.4.5.6.7.
0
0
0.0%
0.0%
1.2.3.4.5.6.7.
0
0
0.0%
0.0%
0
0
0.0%
0.0%
Definitions of Vegetation Strata:
Tree - Woody plants, 3 in. (7.6 cm) or more in diameter at breast height (DBH), regardless of height.
Sapling/shrub - Woody plants less than 3 in. DBH and greater than 3.28 ft (1m) tall..
Herb - All herbaceous (non-woody) plants, regardless of size, and woody plants less than 3.28 ft tall.
Woody vine - All woody vines greater than 3.28 ft in height.
06Sampling Point:
)
)
)
)
Morphological Adaptations 1 (Provide supporting data in Remarks or on a separate sheet)
Rapid Test for Hydrophytic Vegetation
(Plot size:
(Plot size:
(Plot size: 5 feet
(Plot size:
Trifolium pratenseTrifolium pratenseTrifolium pratenseTrifolium pratense
Taraxacum officinaleTaraxacum officinaleTaraxacum officinaleTaraxacum officinale
Plantago majorPlantago majorPlantago majorPlantago major
festuca sp. (50 percent) also present
1

06Soil Sampling Point:
Profile Description: (Describe to the depth needed to document the indicator or confirm the absence of indicators.)
Matrix Redox Features
Type
YesYesYesYes NoNoNoNo
Hydric Soil Indicators: Indicators for Problematic Hydric Soils :
Restrictive Layer (if observed):
Hydric Soil Present?
Indicators of hydrophytic vegetation and wetland hydrology must be present, unless disturbed or problematic.
Histosol (A1)
Histic Epipedon (A2)
Black Histic (A3)
Hydrogen Sulfide (A4)
Depleted Below Dark Surface (A11)
Thick Dark Surface (A12)
Sandy Muck Mineral (S1)
Sandy Gleyed Matrix (S4)
Sandy Redox (S5)
Stripped Matrix (S6)
Loamy Gleyed Matrix (F2)
Depleted Matrix (F3)
Redox Dark Surface (F6)
Depleted Dark Surface (F7)
Other (Explain in Remarks)
Type:
Depth (inches):
Remarks:
US Army Corps of Engineers Northcentral and Northeast Region - Interim Version
Dark Surface (S7) (LRR R, MLRA 149B)
Stratified Layers (A5)
Polyvalue Below Surface (S8) (LRR R, MLRA 149B)
Redox Depressions (F8)
1
1
3
3
Thin Dark Surface (S9) (LRR R, MLRA 149B)
Iron-Manganese Masses (F12) (LRR K, L, R)
Mesic Spodic (TA6) (MLRA 144A, 145, 149B)
2 cm Muck (A10) (LRR K, L, MLRA 149B)
Piedmont Floodplain Soils (F19) (MLRA 149B)
Red Parent Material (TF2)
Very Shallow Dark Surface (TF12)
Type: C=Concentration. D=Depletion. RM=Reduced Matrix, CS=Covered or Coated Sand Grains ²Location: PL=Pore Lining. M=Matrix
Polyvalue Below Surface (S8) (LRR K, L)
Dark Surface (S7) (LRR K, L) Loamy Mucky Mineral (F1) LRR K, L)
Coast Prairie Redox (A16) (LRR K, L, R)
5 cm Mucky Peat or Peat (S3) (LRR K, L, R)
Thin Dark Surface (S9) (LRR K, L)
0-4
4-12 10YR
10YR 4/3
4/3 90% 10YR 5/4 10% C PL Silt Loam
Silt Loam
% RemarksTextureLoc²% Color (moist) Color (moist)
Depth(inches)

Davey Resource Group November, 2011
Appendix F Definition of Wetlands Vegetation Indicator Status (from Reed, 1988) Obligate Wetlands (OBL). Occur almost always (estimated probability is greater than 99%) under natural conditions in wetlands.
Facultative Wetlands (FACW). Usually occur in wetlands (estimated probability 67–99%) but occasionally found in non-wetlands.
Facultative (FAC). Equally likely to occur in wetlands or non-wetlands (estimated probability 34–66%).
Facultative Upland (FACU). Usually occur in non-wetlands (estimated probability 67–99%) but occasionally found in wetlands (estimated probability 1–33%).
Obligate Upland (UPL). Occur in wetlands in another region, but occur almost always (estimated probability > 99%) under natural conditions in non-wetlands in the region specified. If a species does not occur in wetlands in any region, it is not on the National List.
Species for which little or no information was available to base an indicator status were assigned a no indicator (NI) status. An asterisk (*) after the indicator status indicates that the indicator status was based on limited ecological information.
The wetlands indicator categories should not be equated to degrees of wetness. Many obligate wetlands species occur in permanently or semipermanently flooded wetlands, but a number of obligates also occur and some are restricted to wetlands that are only temporarily or seasonally flooded. The facultative upland species include a diverse collection of plants that range from weedy species adapted to exist in a number of environmentally stressful or disturbed sites (including wetlands) to species in which a portion of the gene pool (an ecotype) always occurs in wetlands. Both the weedy and ecotype representatives of the facultative upland category occur in seasonally and semipermanently flooded wetlands.
Davey Resource Group has added two additional indicators for situations when plants can only be identified to genus. A Wetlands Indicator Species (WIS) is a plant that is most likely obligate wetlands, facultative wetlands, or facultative. An Upland Indicator Species (UIS) is a plant that is most likely indicative of upland or facultative upland conditions. These additional indicators are used when species identification is not possible. A variety of factors are part of the UIS and WIS assignments. Indicator statuses of all locally occurring members of the genus in question are considered, as are the health and size of the population and the indicator status of nearby plants.
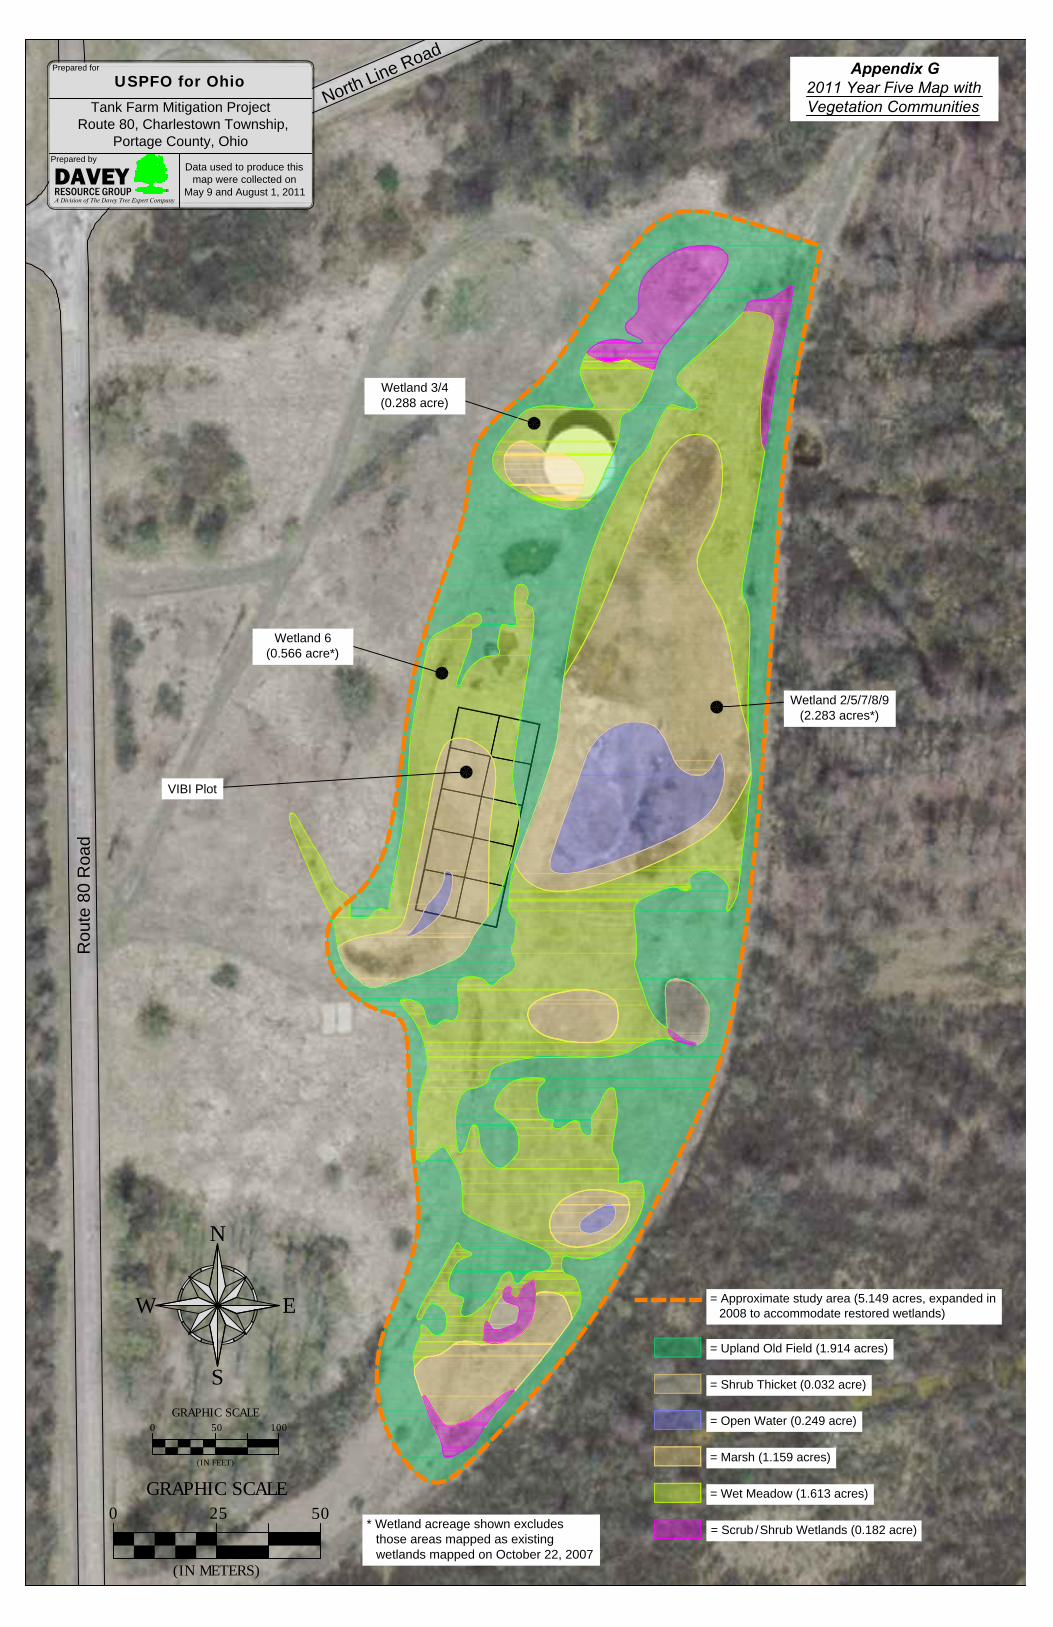
= Approximate study area (5.149 acres, expanded in2008 to accommodate restored wetlands)
50GRAPHIC SCALE
0 25
(IN METERS)
North Line Road
Tank Farm Mitigation Project Route 80, Charlestown Township,
Portage County, Ohio
USPFO for OhioPrepared for
* Wetland acreage shown excludesthose areas mapped as existingwetlands mapped on October 22, 2007
= Scrub / Shrub Wetlands (0.182 acre)
N
S
EW
100GRAPHIC SCALE
0 50
(IN FEET)
Rou
te 8
0 R
oad
Data used to produce thismap were collected on
May 9 and August 1, 2011
Prepared by
A Division of The Davey Tree Expert Company
DAVEYRESOURCE GROUP ®
= Wet Meadow (1.613 acres)
= Marsh (1.159 acres)
= Open Water (0.249 acre)
= Shrub Thicket (0.032 acre)
= Upland Old Field (1.914 acres)
Appendix G2011 Year Five Map withVegetation Communities
Wetland 6(0.566 acre*)
VIBI Plot
Wetland 3/4(0.288 acre)
Wetland 2/5/7/8/9(2.283 acres*)
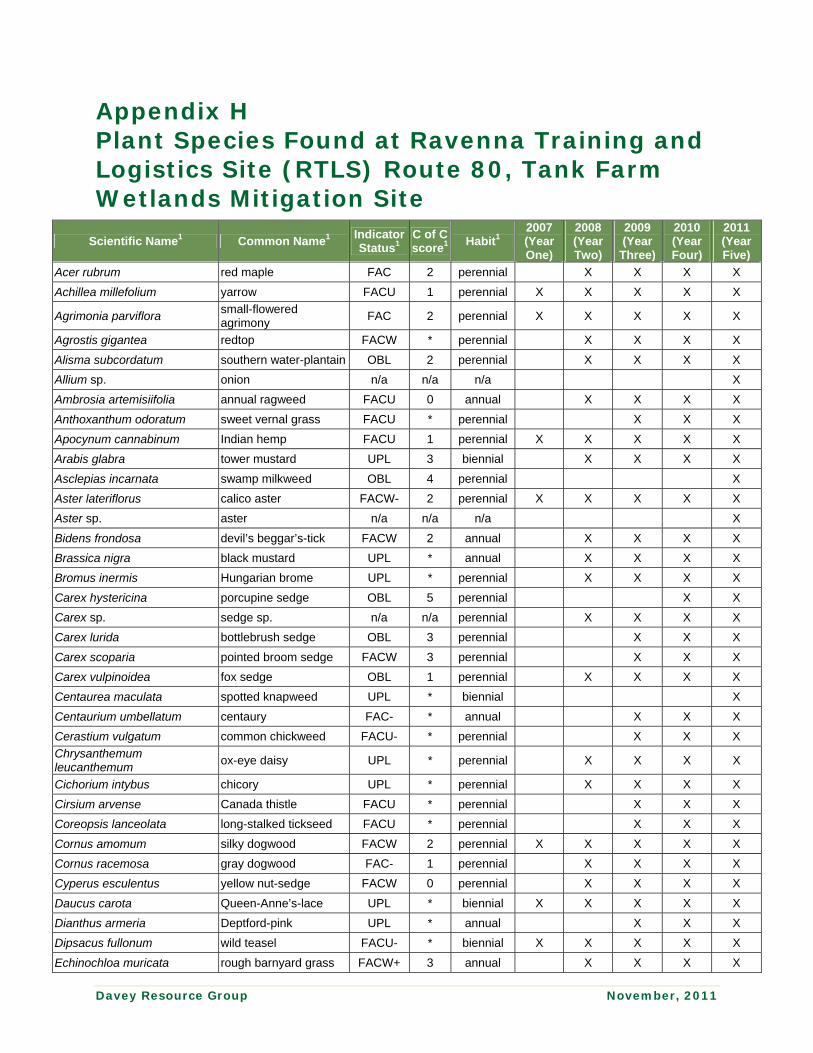
Davey Resource Group November, 2011
Appendix H Plant Species Found at Ravenna Training and Logistics Site (RTLS) Route 80, Tank Farm Wetlands Mitigation Site
Scientific Name1 Common Name1 Indicator Status1
C of C score1 Habit1
2007(Year One)
2008 (Year Two)
2009 (Year
Three)
2010 (Year Four)
2011 (Year Five)
Acer rubrum red maple FAC 2 perennial X X X X
Achillea millefolium yarrow FACU 1 perennial X X X X X
Agrimonia parviflora small-flowered agrimony
FAC 2 perennial X X X X X
Agrostis gigantea redtop FACW * perennial X X X X
Alisma subcordatum southern water-plantain OBL 2 perennial X X X X
Allium sp. onion n/a n/a n/a X
Ambrosia artemisiifolia annual ragweed FACU 0 annual X X X X
Anthoxanthum odoratum sweet vernal grass FACU * perennial X X X
Apocynum cannabinum Indian hemp FACU 1 perennial X X X X X
Arabis glabra tower mustard UPL 3 biennial X X X X
Asclepias incarnata swamp milkweed OBL 4 perennial X
Aster lateriflorus calico aster FACW- 2 perennial X X X X X
Aster sp. aster n/a n/a n/a X
Bidens frondosa devil’s beggar’s-tick FACW 2 annual X X X X
Brassica nigra black mustard UPL * annual X X X X
Bromus inermis Hungarian brome UPL * perennial X X X X
Carex hystericina porcupine sedge OBL 5 perennial X X
Carex sp. sedge sp. n/a n/a perennial X X X X
Carex lurida bottlebrush sedge OBL 3 perennial X X X
Carex scoparia pointed broom sedge FACW 3 perennial X X X
Carex vulpinoidea fox sedge OBL 1 perennial X X X X
Centaurea maculata spotted knapweed UPL * biennial X
Centaurium umbellatum centaury FAC- * annual X X X
Cerastium vulgatum common chickweed FACU- * perennial X X X
Chrysanthemum leucanthemum
ox-eye daisy UPL * perennial X X X X
Cichorium intybus chicory UPL * perennial X X X X
Cirsium arvense Canada thistle FACU * perennial X X X
Coreopsis lanceolata long-stalked tickseed FACU * perennial X X X
Cornus amomum silky dogwood FACW 2 perennial X X X X X
Cornus racemosa gray dogwood FAC- 1 perennial X X X X
Cyperus esculentus yellow nut-sedge FACW 0 perennial X X X X
Daucus carota Queen-Anne’s-lace UPL * biennial X X X X X
Dianthus armeria Deptford-pink UPL * annual X X X
Dipsacus fullonum wild teasel FACU- * biennial X X X X X
Echinochloa muricata rough barnyard grass FACW+ 3 annual X X X X
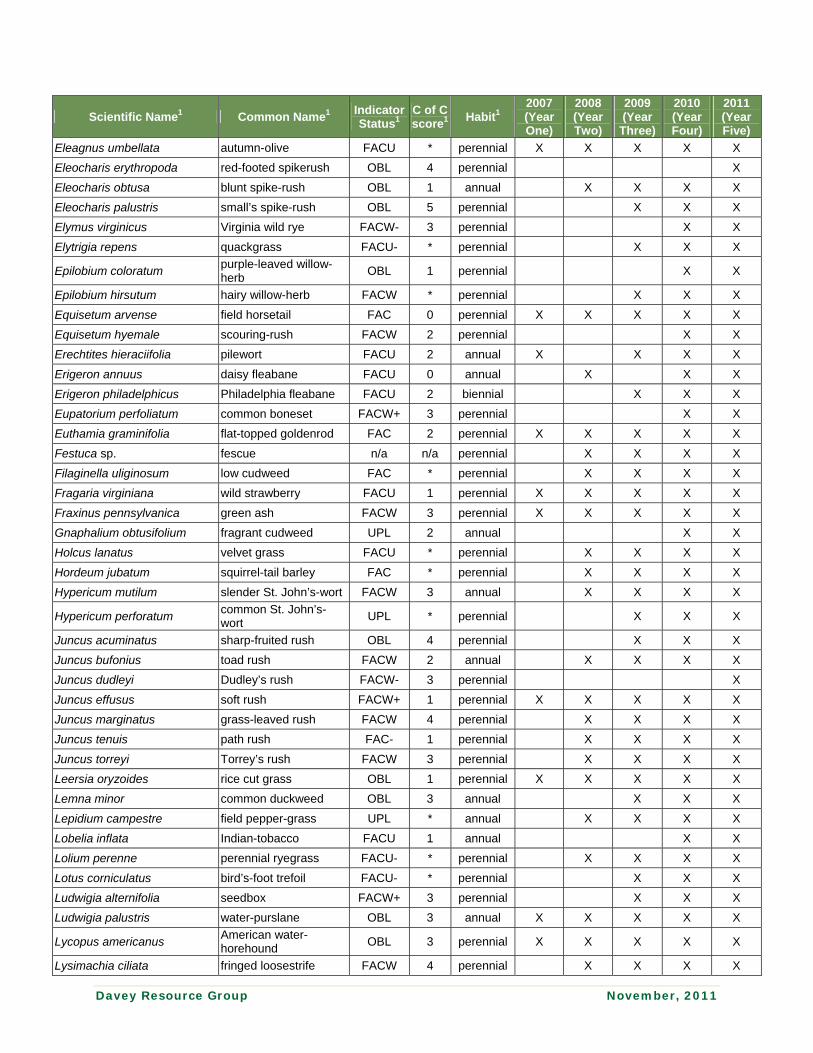
Davey Resource Group November, 2011
Scientific Name1 Common Name1 Indicator Status1
C of C score1 Habit1
2007(Year One)
2008 (Year Two)
2009 (Year
Three)
2010 (Year Four)
2011 (Year Five)
Eleagnus umbellata autumn-olive FACU * perennial X X X X X
Eleocharis erythropoda red-footed spikerush OBL 4 perennial X
Eleocharis obtusa blunt spike-rush OBL 1 annual X X X X
Eleocharis palustris small’s spike-rush OBL 5 perennial X X X
Elymus virginicus Virginia wild rye FACW- 3 perennial X X
Elytrigia repens quackgrass FACU- * perennial X X X
Epilobium coloratum purple-leaved willow-herb
OBL 1 perennial X X
Epilobium hirsutum hairy willow-herb FACW * perennial X X X
Equisetum arvense field horsetail FAC 0 perennial X X X X X
Equisetum hyemale scouring-rush FACW 2 perennial X X
Erechtites hieraciifolia pilewort FACU 2 annual X X X X
Erigeron annuus daisy fleabane FACU 0 annual X X X
Erigeron philadelphicus Philadelphia fleabane FACU 2 biennial X X X
Eupatorium perfoliatum common boneset FACW+ 3 perennial X X
Euthamia graminifolia flat-topped goldenrod FAC 2 perennial X X X X X
Festuca sp. fescue n/a n/a perennial X X X X
Filaginella uliginosum low cudweed FAC * perennial X X X X
Fragaria virginiana wild strawberry FACU 1 perennial X X X X X
Fraxinus pennsylvanica green ash FACW 3 perennial X X X X X
Gnaphalium obtusifolium fragrant cudweed UPL 2 annual X X
Holcus lanatus velvet grass FACU * perennial X X X X
Hordeum jubatum squirrel-tail barley FAC * perennial X X X X
Hypericum mutilum slender St. John’s-wort FACW 3 annual X X X X
Hypericum perforatum common St. John’s-wort
UPL * perennial X X X
Juncus acuminatus sharp-fruited rush OBL 4 perennial X X X
Juncus bufonius toad rush FACW 2 annual X X X X
Juncus dudleyi Dudley’s rush FACW- 3 perennial X
Juncus effusus soft rush FACW+ 1 perennial X X X X X
Juncus marginatus grass-leaved rush FACW 4 perennial X X X X
Juncus tenuis path rush FAC- 1 perennial X X X X
Juncus torreyi Torrey’s rush FACW 3 perennial X X X X
Leersia oryzoides rice cut grass OBL 1 perennial X X X X X
Lemna minor common duckweed OBL 3 annual X X X
Lepidium campestre field pepper-grass UPL * annual X X X X
Lobelia inflata Indian-tobacco FACU 1 annual X X
Lolium perenne perennial ryegrass FACU- * perennial X X X X
Lotus corniculatus bird’s-foot trefoil FACU- * perennial X X X
Ludwigia alternifolia seedbox FACW+ 3 perennial X X X
Ludwigia palustris water-purslane OBL 3 annual X X X X X
Lycopus americanus American water-horehound
OBL 3 perennial X X X X X
Lysimachia ciliata fringed loosestrife FACW 4 perennial X X X X

Davey Resource Group November, 2011
Scientific Name1 Common Name1 Indicator Status1
C of C score1 Habit1
2007(Year One)
2008 (Year Two)
2009 (Year
Three)
2010 (Year Four)
2011 (Year Five)
Lysimachia nummularia moneywort OBL * perennial X X X X
Malus sp. crabapple n/a n/a perennial X X X X
Medicago lupulina black medick UPL * annual X X X X
Melilotus alba white sweet-clover FACU- * biennial X X X X
Melilotus officinalis yellow sweet-clover FACU- * biennial X X X X
Melilotus sp. sweet-clover n/a * biennial X X X X X
Mimulus ringens common monkey-flower
OBL 4 perennial X X X X X
Najas minor Eurasian water-nymph OBL * annual X X X X
Onoclea sensibilis sensitive fern FACW 2 perennial X X X X
Panicum capillare witch grass FAC- 1 annual X X X X
Panicum clandestinum deer’s-tongue panic grass
FAC+ 2 perennial X X
Panicum dichotomiflorum fall panic grass FACW- 0 annual X X X
Panicum virgatum switch grass FAC 4 perennial X X
Penstemon digitalis foxglove beard-tongue FAC 2 perennial X X X X
Penthorum sedoides ditch-stonecrop OBL 2 perennial X
Phalaris arundinacea reed canary grass FACW+ 0 perennial X X X
Phleum pratense timothy FACU * perennial X X X X
Phragmites australis giant reed FACW 0 perennial X X X X X
Phyla lanceolata fog-fruit OBL 3 perennial X X
Phytolacca americana pokeweed FACU+ 1 perennial X X X X X
Plantago lanceolata English plantain UPL * perennial X X X X
Plantago major common plantain FACU * perennial X X X X
Poa sp. bluegrass n/a n/a perennial X X X X
Polygonum pensylvanicum pinkweed FACW 0 annual X X X X X
Populus deltoides eastern cottonwood FAC 3 perennial X X X X
Populus tremuloides quaking aspen FACU 2 perennial X X X X X
Potamogeton nodosus long-leaved pondweed OBL 3 perennial X X X X
Potentilla simplex old field cinquefoil FACU- 1 perennial X X X X X
Prunella vulgaris self-heal FACU+ 0 perennial X X X X
Prunus virginiana choke cherry FACU 2 perennial X X X
Pycnanthemum tenuifolium narrow-leaved mountain-mint
FACW 4 perennial X X X X
Pyrus coronaria wild crabapple UPL 3 perennial X X X X
Rhamnus frangula glossy buckthorn FAC * perennial X X X X X
Rorippa palustris yellow-cress OBL 2 annual X X X
Rubus allegheniensis common blackberry FACU- 1 perennial X X X X X
Rubus flagellaris northern dewberry FACU 1 perennial X X
Rudbeckia hirta black-eyed Susan FACU- 1 perennial X X X
Rumex crispus curly dock FACU * perennial X X X
Salix amygdaloides peach-leaved willow FACW 3 perennial X X X
Salix discolor pussy willow FACW 3 perennial X X X X X
Salix exigua sandbar willow OBL 1 perennial X X X

Davey Resource Group November, 2011
Scientific Name1 Common Name1 Indicator Status1
C of C score1 Habit1
2007(Year One)
2008 (Year Two)
2009 (Year
Three)
2010 (Year Four)
2011 (Year Five)
Salix sp. willow WIS n/a perennial X X X X X
Schoenoplectus tabernaemontani
soft-stemmed bulrush OBL 2 perennial X X X
Scirpus atrovirens green bulrush OBL 1 perennial X X X X
Scirpus pendulus drooping bulrush OBL 2 perennial X X X X
Scirpus polyphyllus leafy bulrush OBL 6 perennial X X X
Setaria faberi giant foxtail grass UPL * annual X X X X
Setaria glauca yellow foxtail grass FAC * annual X X X X
Sisyrinchium angustifolium stout blue-eyed-grass FACW- 2 perennial X X X
Solanum carolinense horse nettle UPL * perennial X X
Solidago canadensis Canada goldenrod FACU 1 perennial X X X X X
Solidago juncea plume goldenrod UPL 2 perennial X X X X
Solidago rugosa rough goldenrod FAC 2 perennial X X X X X
Solidago sp. goldenrod n/a n/a perennial X X X
Sparganium sp. bur-reed sp. n/a n/a perennial X X X X
Spiranthes sp. ladies-tresses n/a n/a perennial X X X
Stuckenia pectinata sago pondweed OBL 2 perennial X X X X
Toxicodendron radicans poison-ivy FAC 1 perennial X X X X X
Trifolium hybridum alsike clover FACU- * perennial X X X X
Trifolium pratense red clover FACU- * perennial X X X X
Trifolium repens white clover FACU- * perennial X X X
Trifolium sp. clover n/a n/a n/a X X X
Tussilago farfara coltsfoot FACU * perennial X X X X
Typha angustifolia narrow-leaved cat-tail OBL * perennial X X X
Typha latifiolia broad-leaved cat-tail OBL 1 perennial X X X X X
Ulmus americana American elm FACW- 2 perennial X X X X
Verbascum blattaria moth mullein UPL * biennial X X
Verbena hastata blue vervain FACW+ 4 perennial X X X X X
Viburnum recognitum northern arrow-wood FACW- 2 perennial X X X X X
Vicia tetrasperma lentil vetch FAC n/a annual X X X X 1 These data were obtained from Andreas, et al., 2004. Non-native species are denoted with an asterisk in the Coefficient of Conservation
(C of C) column and have no score.
Davey Resource Group November, 2011
Appendix I ORAM Form for Mitigation Wetland

1
Background Information
Name: Todd Crandall
Date: August 1, 2011
Affiliation: Davey Resource Group
Address: 3728 Fishcreek Road, Stow, Ohio 44224
Phone Number: 330-673-5685
E-Mail Address: [email protected]
Name of Wetland: Route 80 Tank Farm Wetlands Mitigation Site
Vegetation Communit(ies): Emergent
HGM Class(es): Depression
Location of Wetland: Include map, address, north arrow, landmarks, distances, roads, etc.
See Mitigation Monitoring Report
Lat/Long or UTM Coordinate: 41.2000, 81.1456
USGS Quad Name: Ravenna
County: Portage
Township: Charlestown
Section and Subsection: n/a
Hydrologic Unit Code: 05030103
Site Visit: May 9 and August 1, 2011
National Wetland Inventory Map: n/a
Ohio Wetland Inventory Map: n/a
Soil Survey: n/a
Delineation Report/Map: See Mitigation Monitoring Report
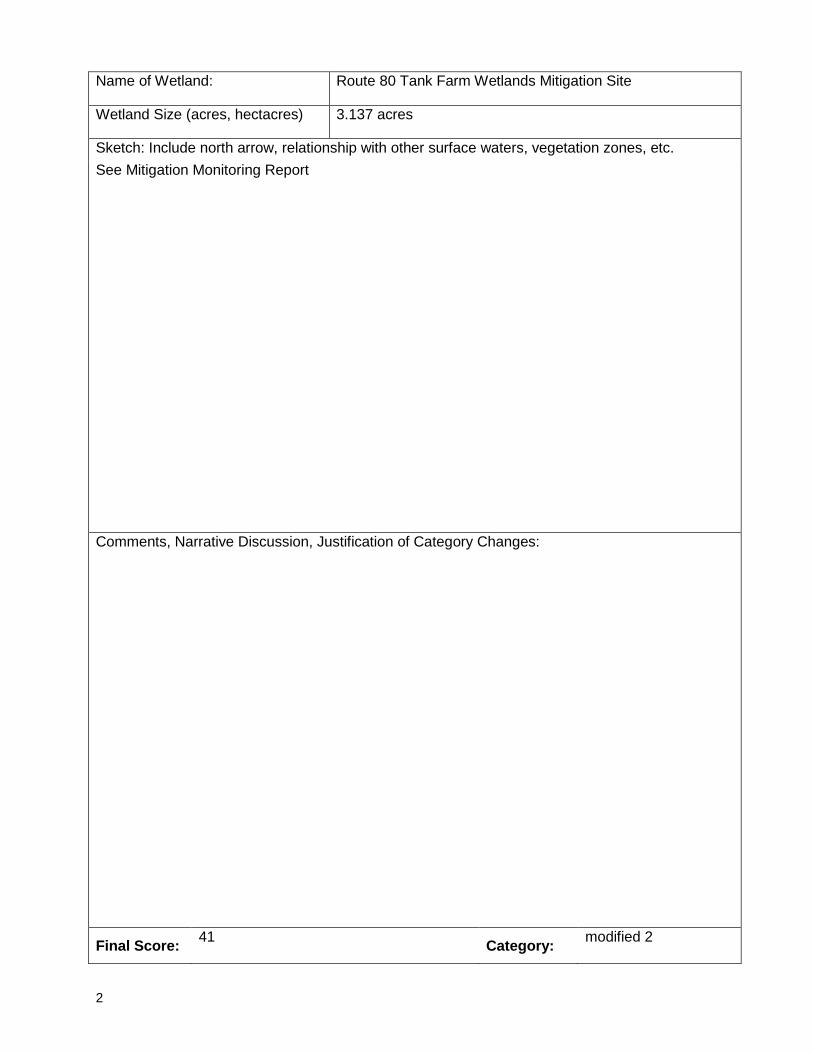
2
Name of Wetland: Route 80 Tank Farm Wetlands Mitigation Site
Wetland Size (acres, hectacres) 3.137 acres
Sketch: Include north arrow, relationship with other surface waters, vegetation zones, etc.
See Mitigation Monitoring Report
Comments, Narrative Discussion, Justification of Category Changes:
Final Score: 41
Category: modified 2

3
Scoring Boundary Worksheet
INSTRUCTIONS: The initial step in completing the ORAM is to identify the “scoring boundaries” of the wetland being
rated. In many instances, this determination will be relatively easy and the scoring boundaries will coincide with the
“jurisdictional boundaries.” For example, the scoring boundary of an isolated cattail marsh located in the middle of a
farm field will likely be the same as that wetland’s jurisdictional boundaries. In other instances, however, the scoring
boundary will not be as easily determined. Wetlands that are small or isolated from other surface waters often form
large continguous areas or heterogeneous complexes of wetland and upland. In separating wetlands for scoring
purposes, the hydrologic regime of the wetland is the main criterion that should be used. Boundaries between
contiguous or connected wetlands should be established where the volume, flow, or velocity of water moving through
the wetland changes significantly. Areas with a high degree of hydrologic interaction should be scored as a single
wetland. In determining a wetland’s scoring boundaries, use the guidelines in the ORAM Manual Section 5.0. In
certain instances, it may be difficult to establish the scoring boundary for the wetland being rated. These problem
situations include wetlands that form a patchwork on the landscape, wetlands divided by artificial boundaries like
property fences, roads, or railroad embankments, wetlands that are contiguous with streams, lakes, or rivers, and
estuarine or coastal wetlands. These situations are discussed below; however, it is recommended that Rater contact
Ohio EPA, Division of Surface Water, 401/Wetlands Section if there are additional questions or a need for further
clarification of the appropriate scoring boundaries of a particular wetland.
# Steps in properly establishing scoring boundaries Done? Not Applicable
Step 1 Identify the wetland area of interest. This may be the site of a proposed impact, a reference site, conservation site, etc.
x
Step 2
Identify the locations where there is physical evidence that hydrology changes rapidly. Such evidence includes both natural and human-induced changes, including, constrictions caused by berms or dikes, points where the water velocity changes rapidly at rapids or falls, points where significant inflows occur at the confluence of rivers, or other factors that may restrict hydrologic interaction between the wetlands or parts of a single wetland.
x
Step 3
Delineate the boundary of the wetland to be rated such that all areas of interest that are contiguous to and within the areas where the hydrology does not change significantly, i.e., areas that have a high degree of hydrologic interaction are included within the scoring boundary.
x
Step 4
Determine if artificial boundaries, such as property lines, state lines, roads, railroad embankments, etc., are present. These should not be used to establish scoring boundaries unless they coincide with areas where the hydrologic regime changes.
x
Step 5 In all instances, the Rater may enlarge the minimum scoring boundaries discussed here to score together wetlands that could be scored separately.
x
Step 6
Consult ORAM Manual Section 5.0 for how to establish scoring boundaries for wetlands that form a patchwork on the landscape, divided by artificial boundaries, contiguous to streams, lakes, or rivers, or for dual classifications.
x
End of Scoring Boundary Determination.
Begin Narrative Rating On Next Page.
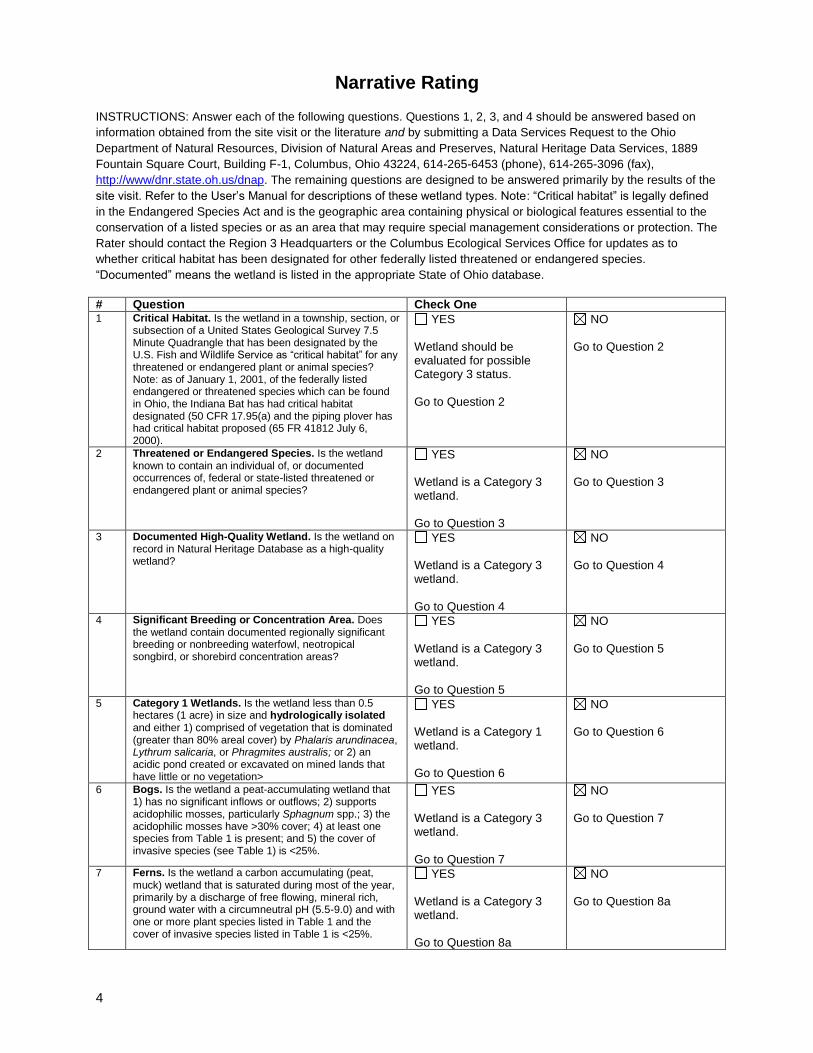
4
Narrative Rating
INSTRUCTIONS: Answer each of the following questions. Questions 1, 2, 3, and 4 should be answered based on
information obtained from the site visit or the literature and by submitting a Data Services Request to the Ohio
Department of Natural Resources, Division of Natural Areas and Preserves, Natural Heritage Data Services, 1889
Fountain Square Court, Building F-1, Columbus, Ohio 43224, 614-265-6453 (phone), 614-265-3096 (fax),
http://www/dnr.state.oh.us/dnap. The remaining questions are designed to be answered primarily by the results of the
site visit. Refer to the User’s Manual for descriptions of these wetland types. Note: “Critical habitat” is legally defined
in the Endangered Species Act and is the geographic area containing physical or biological features essential to the
conservation of a listed species or as an area that may require special management considerations or protection. The
Rater should contact the Region 3 Headquarters or the Columbus Ecological Services Office for updates as to
whether critical habitat has been designated for other federally listed threatened or endangered species.
“Documented” means the wetland is listed in the appropriate State of Ohio database.
# Question Check One 1 Critical Habitat. Is the wetland in a township, section, or
subsection of a United States Geological Survey 7.5 Minute Quadrangle that has been designated by the U.S. Fish and Wildlife Service as “critical habitat” for any threatened or endangered plant or animal species? Note: as of January 1, 2001, of the federally listed endangered or threatened species which can be found in Ohio, the Indiana Bat has had critical habitat designated (50 CFR 17.95(a) and the piping plover has had critical habitat proposed (65 FR 41812 July 6, 2000).
YES Wetland should be evaluated for possible Category 3 status. Go to Question 2
NO Go to Question 2
2 Threatened or Endangered Species. Is the wetland known to contain an individual of, or documented occurrences of, federal or state-listed threatened or endangered plant or animal species?
YES Wetland is a Category 3 wetland. Go to Question 3
NO Go to Question 3
3 Documented High-Quality Wetland. Is the wetland on record in Natural Heritage Database as a high-quality wetland?
YES Wetland is a Category 3 wetland. Go to Question 4
NO Go to Question 4
4 Significant Breeding or Concentration Area. Does the wetland contain documented regionally significant breeding or nonbreeding waterfowl, neotropical songbird, or shorebird concentration areas?
YES Wetland is a Category 3 wetland. Go to Question 5
NO Go to Question 5
5 Category 1 Wetlands. Is the wetland less than 0.5 hectares (1 acre) in size and hydrologically isolated and either 1) comprised of vegetation that is dominated (greater than 80% areal cover) by Phalaris arundinacea, Lythrum salicaria, or Phragmites australis; or 2) an acidic pond created or excavated on mined lands that have little or no vegetation>
YES Wetland is a Category 1 wetland. Go to Question 6
NO Go to Question 6
6 Bogs. Is the wetland a peat-accumulating wetland that 1) has no significant inflows or outflows; 2) supports acidophilic mosses, particularly Sphagnum spp.; 3) the acidophilic mosses have >30% cover; 4) at least one species from Table 1 is present; and 5) the cover of invasive species (see Table 1) is <25%.
YES Wetland is a Category 3 wetland. Go to Question 7
NO Go to Question 7
7 Ferns. Is the wetland a carbon accumulating (peat, muck) wetland that is saturated during most of the year, primarily by a discharge of free flowing, mineral rich, ground water with a circumneutral pH (5.5-9.0) and with one or more plant species listed in Table 1 and the cover of invasive species listed in Table 1 is <25%.
YES Wetland is a Category 3 wetland. Go to Question 8a
NO Go to Question 8a

5
8a “Old Growth Forest.” Is the wetland a forested wetland and is the forest characterized by, but not limited to, the following characteristics; overstory canopy trees of great age (exceeding at least 50% of a projected maximum attainable age for a species); little or no evidence of human-caused understory disturbance during the past 80 to 100 years; an all-aged structure and multi-layered canopies; aggregations of canopy trees interspersed with canopy gaps; and significant numbers of standing dead snags and downed logs?
YES Wetland is a Category 3 wetland. Go to Question 8b
NO Go to Question 8b
8b Mature forested wetlands. Is the wetland a forested wetland with 50% or more of the cover of upper forest canopy consisting of deciduous trees with large diameters at breast height (dbh), generally diameters greater than 45cm (17.7in) dbh?
YES Wetland should be evaluated for possible Category 3 status. Go to Question 9a
NO Go to Question 9a
9a Lake Erie coastal and tributary wetlands. Is the wetland located at an elevation less than 575 feet on the USGS map, adjacent to this elevation, or along a tributary to Lake Erie that is accessible to fish?
YES Go to Question 9b
NO Go to Question 10
9b Does the wetland’s hydrology result from measures designed to prevent erosion and the loss of aquatic plants, i.e., the wetland is partially hydrologically restricted from Lake Erie due to lakeward or landward dikes or other hydrological controls?
YES Wetland should be evaluated for possible Category 3 status. Go to Question 10
NO Go to Question 9c
9c Are Lake Erie water levels the wetland’s primary hydrological influence, i.e., the wetland is hydrologically unrestricted (no lakeward or upland border alterations), or the wetland can be characterized as an “estuarine” wetland with lake and river influenced hydrology. These include sandbar deposition wetlands, estuarine wetlands, river mouth wetlands, or those dominated by submersed aquatic vegetation.
YES Go to Question 9d
NO Go to Question 10
9d Does the wetland have a predominance of native species within its vegetation communities, although non-native or disturbance-tolerant native species can also be present.
YES Wetland is a Category 3 wetland. Go to Question 10
NO Go to Question 9e
9e Does the wetland have a predominance of non-native or disturbance-tolerant native plant species within its vegetation communities?
YES Wetland should be evaluated for possible Category 3 status. Go to Question 10
NO Go to Question 10
10 Lake Plain Sand Prairies (Oak Openings). Is the wetland located in Lucas, Fulton, Henry, or Wood Counties and can the wetland be characterized by the following description: the wetland has a sandy substrate with interspersed organic matter, a water table often within several inches of the surface, and often with a dominance of the gramineous vegetation listed in Table 1 (woody species may also be present). The Ohio Department of Natural Resources Division of Natural Areas and Preserves can provide assistance in confirming this type of wetland and its quality.
YES Wetland is a Category 3 wetland. Go to Question 11
NO Go to Question 11
11 Relict Wet Prairies. Is the wetland a relict wet prairie community dominated by some or all of the species in Table 1. Extensive prairies were formerly located in the Darby Plains (Madison and Union Counties), Sandusky Plains (Wyandot, Crawford, and Marion Counties), northwest Ohio (e.g., Erie, Huron, Lucas, Wood Counties), and portions of western Ohio Counties (e.g., Darke, Mercer, Miami, Montgomery, Van Wert, etc.)
YES Wetland should be evaluated for possible Category 3 status Complete Quantitative Rating
NO Complete Quantitative Rating
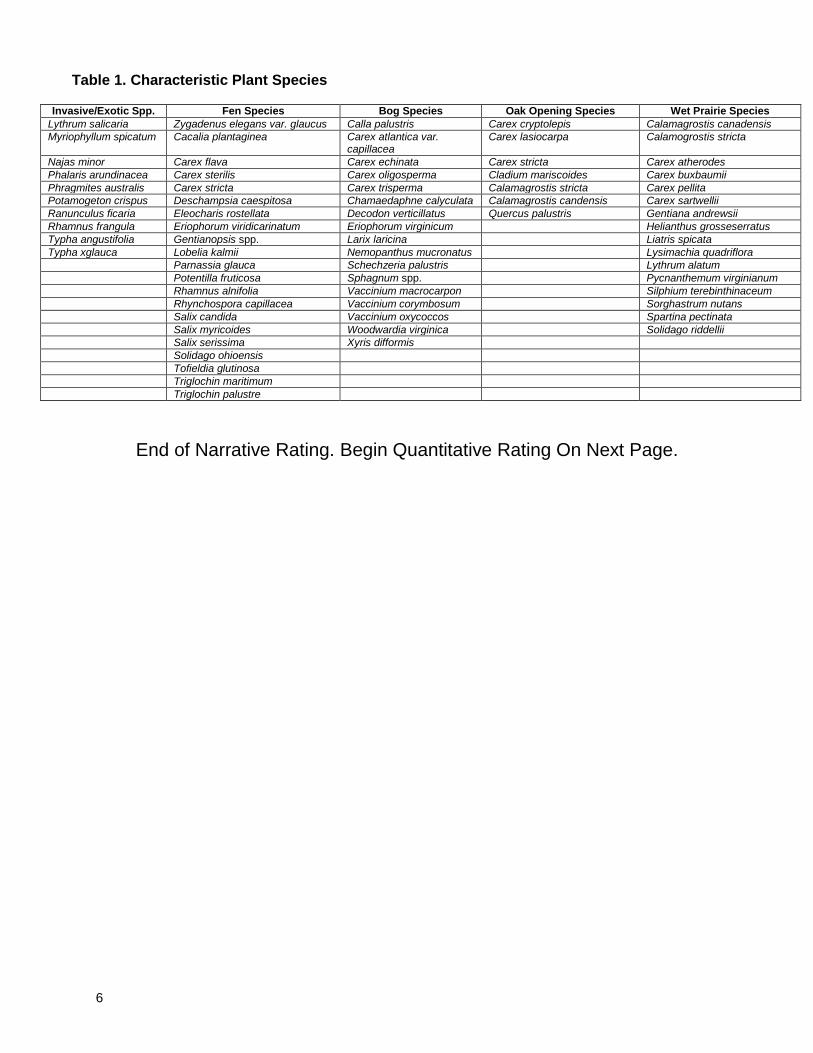
6
Table 1. Characteristic Plant Species
Invasive/Exotic Spp. Fen Species Bog Species Oak Opening Species Wet Prairie Species
Lythrum salicaria Zygadenus elegans var. glaucus Calla palustris Carex cryptolepis Calamagrostis canadensis
Myriophyllum spicatum Cacalia plantaginea Carex atlantica var. capillacea
Carex lasiocarpa Calamogrostis stricta
Najas minor Carex flava Carex echinata Carex stricta Carex atherodes
Phalaris arundinacea Carex sterilis Carex oligosperma Cladium mariscoides Carex buxbaumii
Phragmites australis Carex stricta Carex trisperma Calamagrostis stricta Carex pellita
Potamogeton crispus Deschampsia caespitosa Chamaedaphne calyculata Calamagrostis candensis Carex sartwellii
Ranunculus ficaria Eleocharis rostellata Decodon verticillatus Quercus palustris Gentiana andrewsii
Rhamnus frangula Eriophorum viridicarinatum Eriophorum virginicum Helianthus grosseserratus
Typha angustifolia Gentianopsis spp. Larix laricina Liatris spicata
Typha xglauca Lobelia kalmii Nemopanthus mucronatus Lysimachia quadriflora
Parnassia glauca Schechzeria palustris Lythrum alatum
Potentilla fruticosa Sphagnum spp. Pycnanthemum virginianum
Rhamnus alnifolia Vaccinium macrocarpon Silphium terebinthinaceum
Rhynchospora capillacea Vaccinium corymbosum Sorghastrum nutans
Salix candida Vaccinium oxycoccos Spartina pectinata
Salix myricoides Woodwardia virginica Solidago riddellii
Salix serissima Xyris difformis
Solidago ohioensis
Tofieldia glutinosa
Triglochin maritimum
Triglochin palustre
End of Narrative Rating. Begin Quantitative Rating On Next Page.

ORAM v. 5.0 Field Form Quantitative Rating
Site: August 1, 2011
Todd Crandall
3 3 Metric 1. Wetland Area (size). (max 6 pts)Subtotal Points Select one size class and assign score.
3 >50 acres (>20.2ha) (6 pts)25 to <50 acres (10.1 to <20.2ha) (5 pts)10 to <25 acres (4 to <10.1ha) (4 pts)
3 x 3 to <10 acres (1.2 to <4ha) (3 pts) 0.3 to <3 acres (0.12 to <1.2ha) (2pts)
0.1 to <0.3 acres (0.04 to <0.12ha) (1 pt) <0.1 acres (0.04ha) (0 pts)
15 12 Metric 2. Upland buffers and surrounding land use. (max 14 pts)Subtotal Points 2a. Calculate average buffer width (select one, do not double check)
12 7 x WIDE. Buffers average 50m (164ft) or more around wetland perimeter (7)
MEDIUM. Buffers average 25m to <50m (82 to <164ft) around wetland perimeter (4)5 2b NARROW. Buffers average 10m to <25m (32ft to <82ft) around wetland perimeter (1)
VERY NARROW. Buffers average <10m (<32ft) around wetland perimeter (0)
2b. Intensity of surrounding land use (select one or double check & average) VERY LOW. 2nd growth or older forest, prairie, savannah, wildlife area, etc. (7)
5 x LOW. Old field (>10 years), shrubland, young second growth forest. (5)MODERATELY HIGH. Residential, fenced pasture, park, conservation tillage, new fallow field. (3)HIGH. Urban, industrial, open pasture, row cropping, mining, construction. (1)
29.5 14.5 Metric 3. Hydrology. (max 30 pts) 3d. Duration inundation/saturation.
Subtotal Points 3a. Sources of Water. Score all that apply. (select one or double check & average)
14.5 High pH groundwater (5) Semi- to permanently inundated/saturated (4)
Other groundwater (3) 3 x Regularly inundated/saturated (3)2.5 3d 1 x Precipitation (1) 2 x Seasonally inundated (2)7 3e Seasonal/Intermittent surface water (3) Seasonally saturated in upper 30cm (12in) (1)
Perennial surface water (lake or stream) (5)3e. Modifications to natural hydrologic regime.
3b. Connectivity. Score all that apply. (select one or double check & average)100 year floodplain (1) None or none apparent (12)Between stream/lake and other human use (1) 7 x Recovered (7)
1 x Part of wetland/upland (e.g. forest), complex (1) Recovering (3)Part of riparian or upland corridor (1) Recent or no recovery (1)
3c. Maximum water depth. Select only 1. 3 x >0.7 (27.6in) (3)
0.4 to 0.7m (15.7 to 27.6in) (2)<0.4m (<15.7in) (1)
37 7.5 Metric 4. Habitat Alteration and Development. (max 20 pts.)
Subtotal Points 4a. Substrate disturbance. Score one or double check and average.
7.5 None or none apparent (4)
3 x Recovered (3) 4c. Habitat alteration. Score one or double check and average.
2.5 4a 2 x Recovering (2) None or none apparent (9)
3 4c Recent or no recovery (1) Recovered (6)
3 x Recovering (3)
4b. Habitat development. Select one. Recent or no recovery (1)
Excellent (7)
Very good (6)
Good (5)
Moderately good (4)
Fair (3)
2 x Poor to fair (2)
Poor (1)
37 subtotal this page
Route 80 Road, Charlestown Township, Portage County, Ohio Date:Route 80 Tank Farm Wetlands Mitigation SiteWetlands: Rater:
Check all disturbances observed
Check all disturbances observedditch
tile
stormwater input other- list
road bed/RR track
dikepoint source (nonstormwater)
dredgingweir
filling/grading
selective cutting
mowing
clearcuttinggrazing
farming
nutrient emrichment
sedimentationherbaceous/aquatic bed removal
dredging
shrub/sapling removal
toxic pollutantswoody debris removal
7

ORAM v. 5.0 Field Form Quantitative Rating
Site: Date: August 1, 2011
Todd Crandall
37 subtotal first page
37 0 Metric 5. Special Wetlands. (max 10 pts.)Subtotal Points Check all that apply and score as indicated
0 Bog (10 pts)
Fen (10 pts)
Old Growth Forest (10 pts)
Mature forested wetland (5 pts)
Lake Erie coastal/tributary wetland-unrestricted hydrology (10 pts)
Lake Erie coastal/tributary wetland-restricted hydrology (5 pts)
Lake Plain Sand Prairies (Oak Openings) (10 pts)
Relict Wet Prairies (10 pts)
Known occurrence state/federal threatened or endangered species (10)
Significant migatory songbird/waterfowl habitat or usage (10 pts)
Category 1 Wetland. See Question 1 of Qualitative Rating. (-10 pts)
41 4 Metric 6. Plant Communities, interspersion, microtopography. (max 20 pts.)Subtotal Points 6a. Wetland Vegetation Communities
4 Score all present using 0 to 3 scale
Aquatic bed 0
1 Emergent
Shrub
Forest
Mudflats
1 Open water
6b. Horizontal (plan view) interspersion
Select only one
High (5)
Moderately high (4)
Moderate (3)
2 x Moderately low (2)
Low (1)
None (0)
6c. Coverage of invasive plants.
Extensive >75 % cover (-5)
Moderate 25-75% cover (-3)
-1 x Sparse 5-25% cover (-1)
Nearly Absent <5% cover (0) 0
Absent (1) 1
2
6d. Microtopography 3
Score all present using 0 to 3 scale
Vegetated hummocks/tussocks
Coarse woody debris >15 cm (6") 0
Standing dead > 25 cm (10") dbh
1 Amphibian breeding pools
41 GRAND TOTAL (max 100 pts)
Narrative Description of Vegetation Quality
Other (list)
Vegetation Community Cover ScaleAbsent or comprises <0.1 ha (0.2471 acres) contiguous area
Present and either comprises small part of wetland's vegetation and is of moderate quality, or comprises a significant part but is of low quality
Present and either comprises significant part of wetland's vegetation and is of moderate quality or comprises a small part and is of high quality
Route 80 Road, Charlestown Township, Portage County, Ohio
Present and comprises significant part, or more, of wetland's vegetation and is of high quality
1
2
3
Wetland: Route 80 Tank Farm Wetlands Mitigation Site Rater:
lowLow spp diversity and/or predominance of nonnative or disturbance tolerant native species
Absent <0.1 ha (0.2471 acres)
Low 0.1 ha to <1 ha (0.2471 acres to 2.47 acres)
moderate
A predominance of native species, with nonnative spp and/or disturbance tolerant native spp absent or virtually absent, and high spp diversity and often, but not always, the presence of rare, threatened, or endangered spp
high
3 Present in moderate or greater amounts and of highest quality
Absent
Present very small amounts or if more common of marginal quality
1
Present in moderate amounts, but not of highest quality or in small amounts of highest quality
2
Refer to Table 1 ORAM long form for list.
Add or deduct points for coverage
High 4 ha (9.88 acres) or more
Microtopography Cover Scale
Mudflat and Open Water Class Quality
Moderate 1 ha to <4 ha (2.47 acres 9.88 acres)
Native spp are dominant component of the vegetation, although nonnative and/or disturbance tolerant native spp can also be present, and species diversity moderate to moderately high, but generally w/o presence of rare threatened or endangered spp
End of Quantitative Rating. Complete Categorization Worksheets.
8
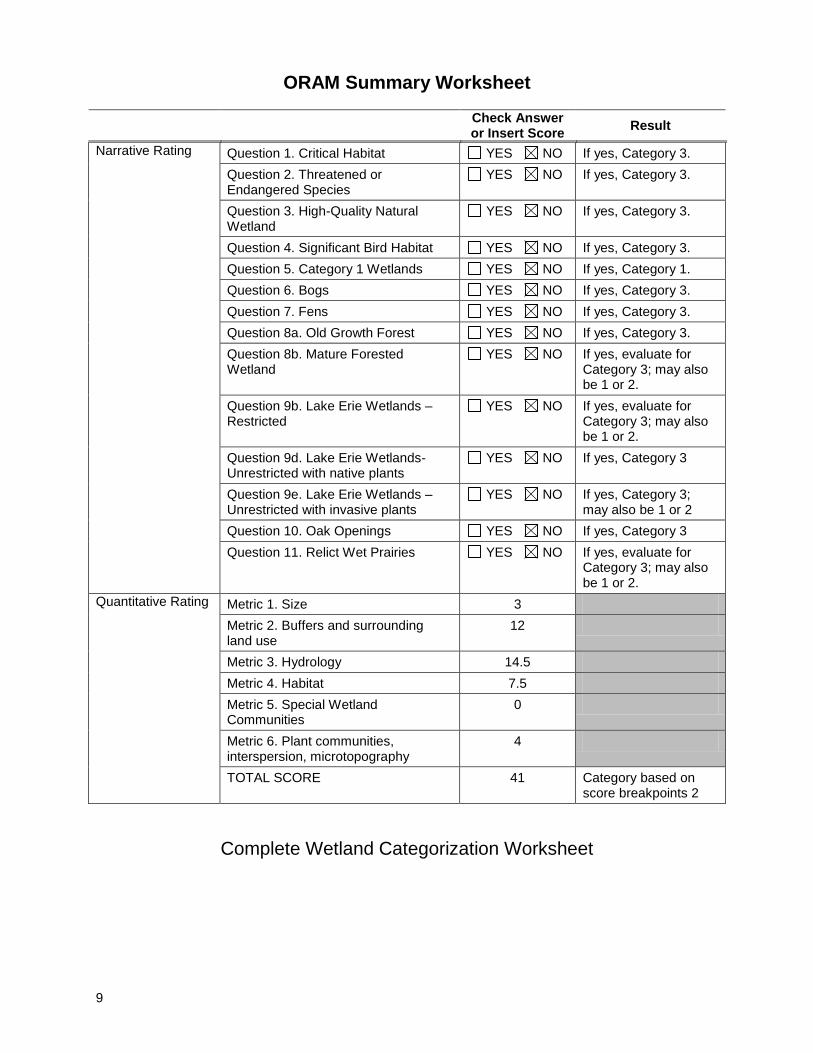
9
ORAM Summary Worksheet
Check Answer or Insert Score
Result
Narrative Rating Question 1. Critical Habitat YES NO If yes, Category 3.
Question 2. Threatened or Endangered Species
YES NO If yes, Category 3.
Question 3. High-Quality Natural Wetland
YES NO If yes, Category 3.
Question 4. Significant Bird Habitat YES NO If yes, Category 3.
Question 5. Category 1 Wetlands YES NO If yes, Category 1.
Question 6. Bogs YES NO If yes, Category 3.
Question 7. Fens YES NO If yes, Category 3.
Question 8a. Old Growth Forest YES NO If yes, Category 3.
Question 8b. Mature Forested Wetland
YES NO If yes, evaluate for Category 3; may also be 1 or 2.
Question 9b. Lake Erie Wetlands – Restricted
YES NO If yes, evaluate for Category 3; may also be 1 or 2.
Question 9d. Lake Erie Wetlands- Unrestricted with native plants
YES NO If yes, Category 3
Question 9e. Lake Erie Wetlands – Unrestricted with invasive plants
YES NO If yes, Category 3; may also be 1 or 2
Question 10. Oak Openings YES NO If yes, Category 3
Question 11. Relict Wet Prairies YES NO If yes, evaluate for Category 3; may also be 1 or 2.
Quantitative Rating Metric 1. Size 3
Metric 2. Buffers and surrounding land use
12
Metric 3. Hydrology 14.5
Metric 4. Habitat 7.5
Metric 5. Special Wetland Communities
0
Metric 6. Plant communities, interspersion, microtopography
4
TOTAL SCORE 41 Category based on score breakpoints 2
Complete Wetland Categorization Worksheet
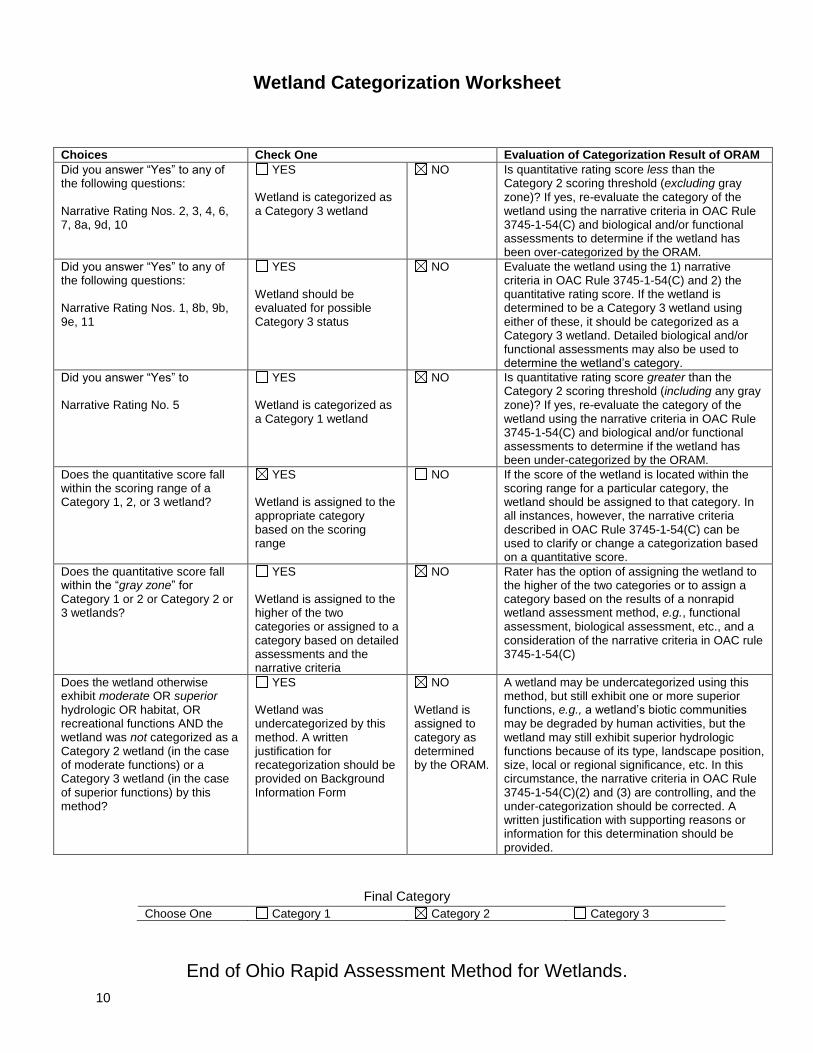
10
Wetland Categorization Worksheet
Choices Check One Evaluation of Categorization Result of ORAM
Did you answer “Yes” to any of the following questions: Narrative Rating Nos. 2, 3, 4, 6, 7, 8a, 9d, 10
YES Wetland is categorized as a Category 3 wetland
NO Is quantitative rating score less than the Category 2 scoring threshold (excluding gray zone)? If yes, re-evaluate the category of the wetland using the narrative criteria in OAC Rule 3745-1-54(C) and biological and/or functional assessments to determine if the wetland has been over-categorized by the ORAM.
Did you answer “Yes” to any of the following questions: Narrative Rating Nos. 1, 8b, 9b, 9e, 11
YES Wetland should be evaluated for possible Category 3 status
NO Evaluate the wetland using the 1) narrative criteria in OAC Rule 3745-1-54(C) and 2) the quantitative rating score. If the wetland is determined to be a Category 3 wetland using either of these, it should be categorized as a Category 3 wetland. Detailed biological and/or functional assessments may also be used to determine the wetland’s category.
Did you answer “Yes” to Narrative Rating No. 5
YES Wetland is categorized as a Category 1 wetland
NO Is quantitative rating score greater than the Category 2 scoring threshold (including any gray zone)? If yes, re-evaluate the category of the wetland using the narrative criteria in OAC Rule 3745-1-54(C) and biological and/or functional assessments to determine if the wetland has been under-categorized by the ORAM.
Does the quantitative score fall within the scoring range of a Category 1, 2, or 3 wetland?
YES Wetland is assigned to the appropriate category based on the scoring range
NO If the score of the wetland is located within the scoring range for a particular category, the wetland should be assigned to that category. In all instances, however, the narrative criteria described in OAC Rule 3745-1-54(C) can be used to clarify or change a categorization based on a quantitative score.
Does the quantitative score fall within the “gray zone” for Category 1 or 2 or Category 2 or 3 wetlands?
YES Wetland is assigned to the higher of the two categories or assigned to a category based on detailed assessments and the narrative criteria
NO Rater has the option of assigning the wetland to the higher of the two categories or to assign a category based on the results of a nonrapid wetland assessment method, e.g., functional assessment, biological assessment, etc., and a consideration of the narrative criteria in OAC rule 3745-1-54(C)
Does the wetland otherwise exhibit moderate OR superior hydrologic OR habitat, OR recreational functions AND the wetland was not categorized as a Category 2 wetland (in the case of moderate functions) or a Category 3 wetland (in the case of superior functions) by this method?
YES Wetland was undercategorized by this method. A written justification for recategorization should be provided on Background Information Form
NO Wetland is assigned to category as determined by the ORAM.
A wetland may be undercategorized using this method, but still exhibit one or more superior functions, e.g., a wetland’s biotic communities may be degraded by human activities, but the wetland may still exhibit superior hydrologic functions because of its type, landscape position, size, local or regional significance, etc. In this circumstance, the narrative criteria in OAC Rule 3745-1-54(C)(2) and (3) are controlling, and the under-categorization should be corrected. A written justification with supporting reasons or information for this determination should be provided.
Final Category
Choose One Category 1 Category 2 Category 3
End of Ohio Rapid Assessment Method for Wetlands.

Davey Resource Group November, 2011
Appendix J VIBI Data
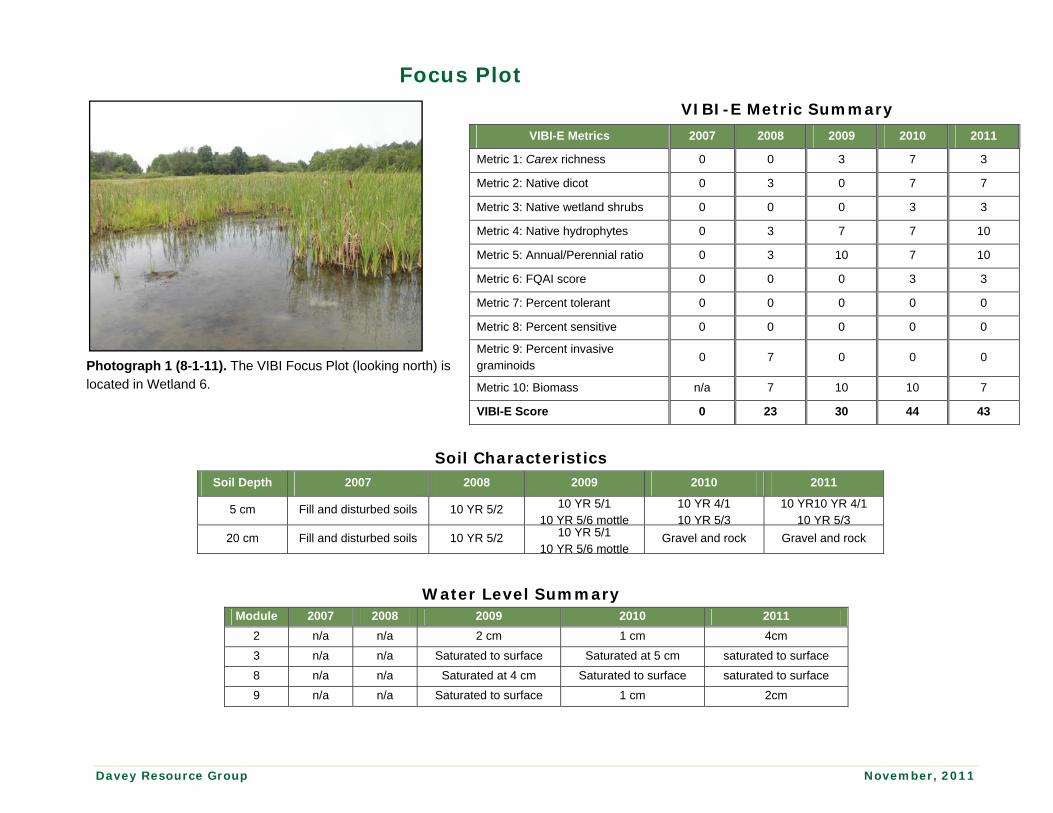
Davey Resource Group November, 2011
Focus Plot
VIBI-E Metric Summary
VIBI-E Metrics 2007 2008 2009 2010 2011
Metric 1: Carex richness 0 0 3 7 3
Metric 2: Native dicot 0 3 0 7 7
Metric 3: Native wetland shrubs 0 0 0 3 3
Metric 4: Native hydrophytes 0 3 7 7 10
Metric 5: Annual/Perennial ratio 0 3 10 7 10
Metric 6: FQAI score 0 0 0 3 3
Metric 7: Percent tolerant 0 0 0 0 0
Metric 8: Percent sensitive 0 0 0 0 0
Metric 9: Percent invasive graminoids
0 7 0 0 0
Metric 10: Biomass n/a 7 10 10 7
VIBI-E Score 0 23 30 44 43
Water Level Summary Module 2007 2008 2009 2010 2011
2 n/a n/a 2 cm 1 cm 4cm
3 n/a n/a Saturated to surface Saturated at 5 cm saturated to surface
8 n/a n/a Saturated at 4 cm Saturated to surface saturated to surface
9 n/a n/a Saturated to surface 1 cm 2cm
Photograph 1 (8-1-11). The VIBI Focus Plot (looking north) is located in Wetland 6.
Soil Characteristics
Soil Depth 2007 2008 2009 2010 2011
5 cm Fill and disturbed soils 10 YR 5/2 10 YR 5/1 10 YR 5/6 mottle
10 YR 4/1 10 YR 5/3
10 YR10 YR 4/1 10 YR 5/3
20 cm Fill and disturbed soils 10 YR 5/2 10 YR 5/1 10 YR 5/6 mottle
Gravel and rock Gravel and rock

Davey Resource Group November, 2011
Appendix K Animal Species Found at Ravenna Training and Logistics Site (RTLS) Route 80, Tank Farm Wetlands Mitigation Site
Common Name Scientific Name 2007(Year One)
2008(Year Two)
2009 (Year
Three)
2010 (Year Four)
2011 (Year Five)
AMPHIBIANS
American toad Bufo americana X X X X
gray tree frog Hyla versicolor X X X
green frog Rana clamitans X X X X X
leopard frog Rana pipiens X X
BIRDS
American robin Turdus migratorius X X X X
Baltimore oriole Icterus galbula X
barn swallow Hirundo rustica X X
yellow warbler Dendroica petechia X
black-capped chickadee Poecille atricapillus X X X
blue jay Cyanocitta cristata X X X
Canada goose Branta canadensis X X X X X
field sparrow Spizella pusilla X
goldfinch Carduelis tristis X X X
gray catbird Dumetella carolinensis X X X X
killdeer Charadrius vociferus X X X X
northern cardinal Cardinalis cardinalis X X X X
redwing blackbird Agelaius phoeniceus X X
turkey vulture Cathartes aura X X X
American crow Corvus brachyrhynchos X
tufted titmouse Baeolophus bicolor X
wild turkey Meleagris gallopavo X
MAMMALS
common raccoon Procyon lotor X X X X X
eastern cottontail Sylvilagus floridanus X
ground hog Marmota monax X X
white tail deer Odocoileus virginiana X X X X X

Davey Resource Group November, 2011
Appendix L References Cited Andreas, B. K. and R.W. Lichvar. 1995. Floristic Index for Establishing Assessment Standards: A Case
Study for Northern Ohio. Technical Report WRP-DE-8, U.S. Army Engineer Waterways Experiment Station, Vicksburg, MS. 16pp.
Andreas, Barbara K., John J. Mack, and James S. McCormac. 2004. Floristic Quality Assessment Index (FQAI) for Vascular Plants and Mosses for the State of Ohio. Ohio Environmental Protection Agency, Division of Surface Water, Wetland Ecology Group, Columbus, Ohio. 219 pp.
Braun, E. Lucy. 1967. The Monocotyledoneae: Cat-tails to Orchids. The Ohio State University Press, Columbus, Ohio. 464 pp.
Braun, E. Lucy. 1989. The Woody Plants of Ohio. The Ohio State University Press, Columbus, Ohio. 362 pp.
Environmental Laboratory. 1987. Corps of Engineers Wetlands Delineation Manual. Technical Report Y-87-1. United States Army Engineer Waterways Experiment Station, Vicksburg, Mississippi.
Mack, John J. 2001. Ohio Rapid Assessment Method for Wetlands v. 5.0, User’s Manual and Scoring Forms. OEPA Technical Report WET/2001-1. Ohio Environmental Protection Agency, Division of Surface Water, 401/Wetland Ecology Unit, Columbus, OH.
Mack, John J. 2007. Integrated Wetland Assessment Program: Part 9: Field Manual for the Vegetation Index of Biotic Integrity for Wetlands v. 1.4. OEPA Technical Report WET/2004-9. Ohio Environmental Protection Agency, Wetland Ecology Group, Division of Surface Water, Columbus, Ohio.
Newcomb, Lawrence. 1977. Newcomb’s Wildflower Guide. Little, Brown, and Co., Boston. 490 pp.
Reed, P.B., Jr. 1988. National List of Plant Species that Occur in Wetlands: National Summary. U.S. Fish and Wildlife Service Biological Report 88 (24). Available from the Superintendent of Documents, U.S.G.P.O., Washington, D.C. 20402. 244 pp.
U.S. Army Corps of Engineers. 2009. Interim Regional Supplement to the Corps of Engineers Wetland Delineation Manual: Northcentral and Northeast Region, ed. J.S. Wakeley, R.W. Lichvar, and C.V. Noble. ERDC/EL TR-09-19. Vicksburg, MS: U.S. Army Engineer Research and Development Center.
Weishaupt, Clara G. 1971. Vascular Plants of Ohio. Kendall/Hunt Publishing Co., Dubuque, Iowa. 293 pp.
Davey Resource Group November, 2011
Appendix M Resumes of Professional Staff Shawn W. Bruzda is a senior urban forester, biologist, and technical specialist with Davey Resource Group, having served in this capacity for over 10 years. Mr. Bruzda performs tree inventories for cemeteries, developments, golf courses, military bases, municipalities, museums, parks, university and corporate campuses, and zoological parks. Through these inventory projects, he has acquired extensive knowledge of tree risk assessment and has acquired expert tree identification skills, specializing in deciduous and coniferous trees and palms of the Southern United States. Mr. Bruzda is also responsible for the creation and dissemination of tree inventory management plans, as well as reports dealing with various applied urban forestry topics. Accordingly, he has developed a thorough understanding of the role tree inventories play in urban forest management. He has extensive experience with handheld and pen tablet GIS and GPS data collection units and their respective software applications. He has served as project manager on numerous large- and small-scale municipal tree inventories throughout the United States. He has also participated in the collection of data for i-Tree Streets. i-Tree Streets, developed by the U.S. Forest Service, is a model used for analyzing the benefits of urban street trees as well as the costs of managing them. Mr. Bruzda also assists with tree preservation and planting plans, as well as tree appraisals and soil analyses. As a biologist with Davey Resource Group, Mr. Bruzda focuses on ecological surveys involving fish and macroinvertebrate identification and data analysis. He is proficient with the Index of Biotic Integrity (IBI), the Modified Index of Well-Being (MIWB), and the Invertebrate Community Index (ICI), all used by Ohio Environmental Protection Agency to set minimum criteria index scores for use designations in water quality standards. He works on large- and small-scale bat survey projects, assisting with mist-net surveys, habitat evaluations, and radio tracking studies to determine foraging patterns; endangered species and habitat studies; invasive species management; secondary source reviews; technical report writing; and water quality studies. Mr. Bruzda has completed training through Ohio Environmental Protection Agency for conducting the following: Headwater Habitat Evaluation Index (HHEI); Qualitative Habitat Evaluation Index (QHEI); Ohio Rapid Assessment Method (ORAM) v.5; and Vegetation Index of Biotic Integrity (VIBI). Proficient with AutoCAD® and ArcGIS™ software, Mr. Bruzda creates maps for a wide variety of natural resource and tree-related projects. Mr. Bruzda is also responsible for safety and fleet vehicle management. He is an International Society of Arboriculture (ISA) Certified Arborist (OH-1342A). Mr. Bruzda is a graduate of Kent State University, having received a Bachelor of Science degree in biological sciences with an emphasis in aquatic ecology.
Ken Christensen is a senior biologist with more than 25 years of experience in the natural resource field. Mr. Christensen is involved in all aspects of wetlands and stream restoration projects, including design, planting, and implementation. He is also involved with the subsequent monitoring of mitigation and restoration projects to ensure that such endeavors reach an expected successful conclusion. Mr. Christensen assists in plant surveys and wetlands delineations and in the field identification of vertebrate populations, especially amphibians, reptiles, and mammals. Proficient with AutoCAD® software, Mr. Christensen is responsible for managing the Global Positioning System (GPS) data collection and AutoCAD® mapping operations for all natural resource studies. As an International Society of Arboriculture Certified Arborist (OH-0690A), he performs tree appraisals and inventories and also develops tree preservation plans. Mr. Christensen is a LEED® Accredited Professional and has received the following training: Certificate of Completion for LEED® for New Construction Technical Review Workshop from U.S. Green Building Council; Certificate of Completion for American Ecological Engineering Society Wetland Mitigation Design from Virginia Polytechnic Institute and State University; Certificate of Completion for AutoCAD® for Stream Restoration and Monitoring from North Carolina Cooperative Extension; Certificate of Completion from North Carolina Stream Restoration Institute’s Stream Classification and Assessment Program; and Certificate of Completion from North Carolina Stream Restoration Institute’s Stream Restoration Design Principles. Mr. Christensen is prequalified by the Ohio Department of Transportation for wetland mitigation. He has also completed training through Ohio Environmental Protection Agency for conducting the following: Headwater Habitat Evaluation Index (HHEI); Qualitative Habitat Evaluation Index

Davey Resource Group November, 2011
(QHEI); Ohio Rapid Assessment Method (ORAM) v.5; and Vegetation Index of Biotic Integrity (VIBI). Clients for these mitigation, stream restoration, and tree preservation projects have included the Holden Arboretum, Ohio Wetlands Foundation, Medina County Park District, Metro Parks Serving Summit County, Portage Park District, and Western Reserve Land Conservancy. He is a member of the American Ecological Engineering Society, Breakneck Creek Watershed Coalition, the Ecological Landscaping Association, the Northeast Ohio Association of Herpetologists, American Ecological Engineering Society, and Association of State Wetlands Managers. Mr. Christensen holds a Bachelor of Science degree in conservation from Kent State University.
Todd A. Crandall, M.En., is a senior wetlands scientist with 19 years of experience performing wetlands delineations in Ohio and adjacent states. Mr. Crandall also performs ecological surveys, vegetation cover mapping, plant identification, and Section 401 and 404 and isolated wetlands permitting. He also contributes to the planning and design of restoration wetlands and prepares wetland mitigation reports. Mr. Crandall is responsible for vegetation monitoring at numerous wetlands mitigation sites throughout Ohio. He has completed large-scale wetlands and natural resource inventories for the Cuyahoga Valley National Park, as well as Cuyahoga, Medina, Portage, and Summit Counties in Northeast Ohio. He is certified to perform wetlands studies by the U.S. Army Wetlands Delineator Certification Program, and is a certified Professional Wetland Scientist through the Society of Wetland Scientists. He has completed the 40-hour OSHA health and safety training (OSHA Standard 29 CFR 1910.120). Mr. Crandall has successfully completed the Ohio Department of Transportation’s (ODOT) Ecological Training hosted by the Office of Environmental Services. He is ODOT prequalified for ecological surveys and wetland mitigation. Mr. Crandall has also completed training through the Ohio Environmental Protection Agency for the following: Headwater Habitat Evaluation Index (HHEI); Qualitative Habitat Evaluation Index (QHEI); Ohio Rapid Assessment Method (ORAM) v.5; and Vegetation Index of Biotic Integrity (VIBI). He holds a Bachelor of Science degree from Hiram College in biology and a Master’s degree in environmental science from Miami University.
Jessica Hickey, M.S., is a biologist and project manager with over 9 years of experience in wetland delineation and mitigation; Section 401 and 404 permitting; stream and wetland restoration; aquatic and terrestrial surveys, including bat mist-net, habitat, and emergence studies; Phase I Environmental Site Assessments; and water quality testing. She currently assists in the coordination of wetland mitigation monitoring projects for Davey Resource Group. Ms. Hickey specializes in the federally endangered Indiana bat (Myotis sodalis) and performs mist-net surveys, habitat evaluations, and radio tracking studies to determine foraging patterns. She has prepared a Biological Assessment report for U.S. Fish and Wildlife Service assessing potential impacts to the federally endangered Indiana bat on proposed development sites. She also completes aquatic habitat studies, including fish, macroinvertebrate, and amphibian surveys. Ms. Hickey has successfully completed the Ohio Department of Transportation’s (ODOT) Ecological and Waterway Permits Training hosted by the Office of Environmental Services. She is ODOT prequalified for ecological surveys, wetland mitigation, and waterway permits. Ms. Hickey has provided planting and construction oversight for numerous wetland and stream restoration projects and has managed large-scale projects with multiple subcontractors and team members, including the Shadybrook Stream Restoration Project for Holden Arboretum and the Mud Brook Wetlands Mitigation Project for the City of Stow. Ms. Hickey has completed training through Ohio Environmental Protection Agency for the following: Headwater Habitat Evaluation Index (HHEI); Qualitative Habitat Evaluation Index (QHEI); Ohio Rapid Assessment Method (ORAM) v.5; and Vegetation Index of Biotic Integrity (VIBI). She has also completed a Geomorphology and Ecology of Stream Systems course, Bat Conservation International Bat Management training, ANABAT workshop training, and ASTM Phase I Environmental Site Assessment training. Ms. Hickey graduated from the University of Toledo with a Bachelor of Science degree in environmental science with an emphasis in biology, and holds a Master of Science degree in biology from John Carroll University.