Embed Size (px)
Citation preview
ANNUAL REPORT 2016Year ended March 31, 2016
Commercial Store Systems Business
Autom
otive Systems B
usinessLi
vin
g &
En
viro
nm
ent S
yste
ms
an
d Other B
usiness
Contents
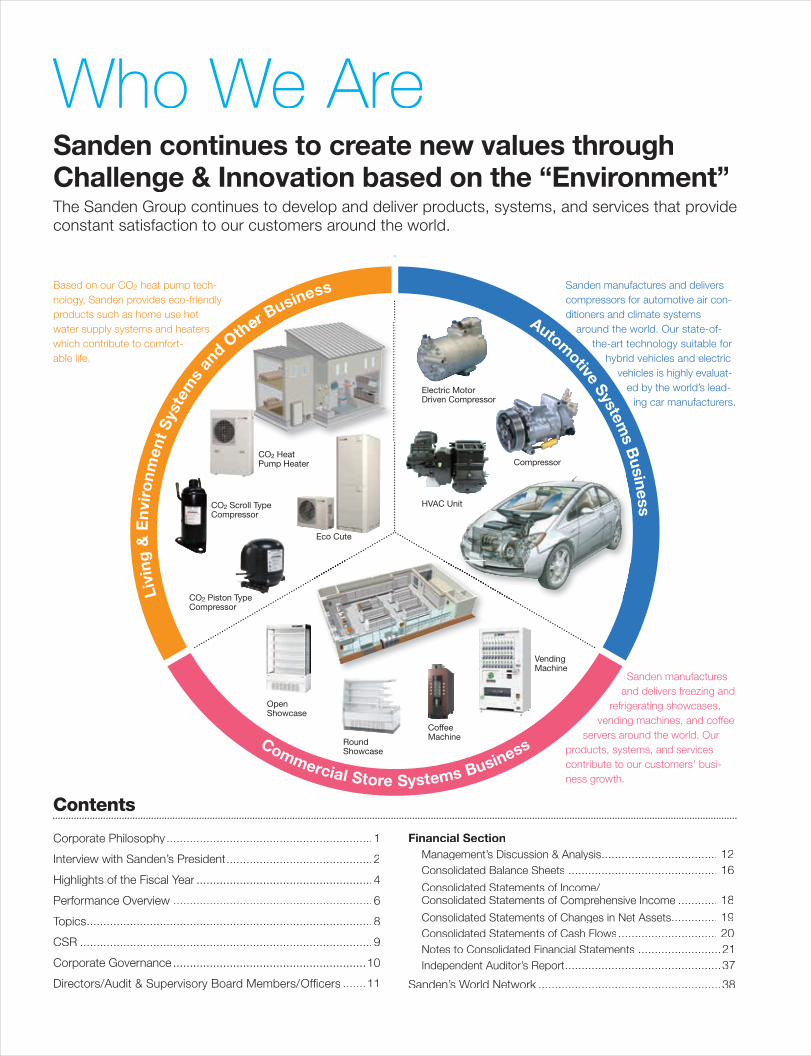
Who We AreSanden continues to create new values throughChallenge & Innovation based on the “Environment”The Sanden Group continues to develop and deliver products, systems, and services that provide constant satisfaction to our customers around the world.
Corporate Philosophy ..............................................................1
Interview with Sanden’s President ............................................2
Highlights of the Fiscal Year .....................................................4
Performance Overview ............................................................6
Topics ......................................................................................8
CSR ........................................................................................9
Corporate Governance ..........................................................10
Directors/Audit & Supervisory Board Members/Offi cers .......11
Financial SectionManagement’s Discussion & Analysis ................................... 12Consolidated Balance Sheets ............................................. 16Consolidated Statements of Income/ Consolidated Statements of Comprehensive Income ............ 18Consolidated Statements of Changes in Net Assets .............. 19Consolidated Statements of Cash Flows .............................. 20Notes to Consolidated Financial Statements .........................21Independent Auditor’s Report ...............................................37
Sanden’s World Network .......................................................Sanden’s World Network .......................................................Sanden’s World Network 38
Based on our CO2 heat pump tech-nology, Sanden provides eco-friendly products such as home use hot water supply systems and heaters which contribute to comfort-able life.
CO2 Piston Type Compressor
CO2 Scroll Type Compressor
HVAC Unit
Compressor
Electric Motor Driven Compressor
Open Showcase
Round Showcase
Vending Machine
Coffee Machine
her
Eco Cute
CO2 Heat Pump Heater
Sanden manufactures and delivers compressors for automotive air con-ditioners and climate systems
around the world. Our state-of-the-art technology suitable for
hybrid vehicles and electric vehicles is highly evaluat-
ed by the world’s lead-ing car manufacturers.
Sanden manufactures and delivers freezing and
refrigerating showcases, vending machines, and coffee
servers around the world. Our products, systems, and services contribute to our customers’ busi-ness growth.
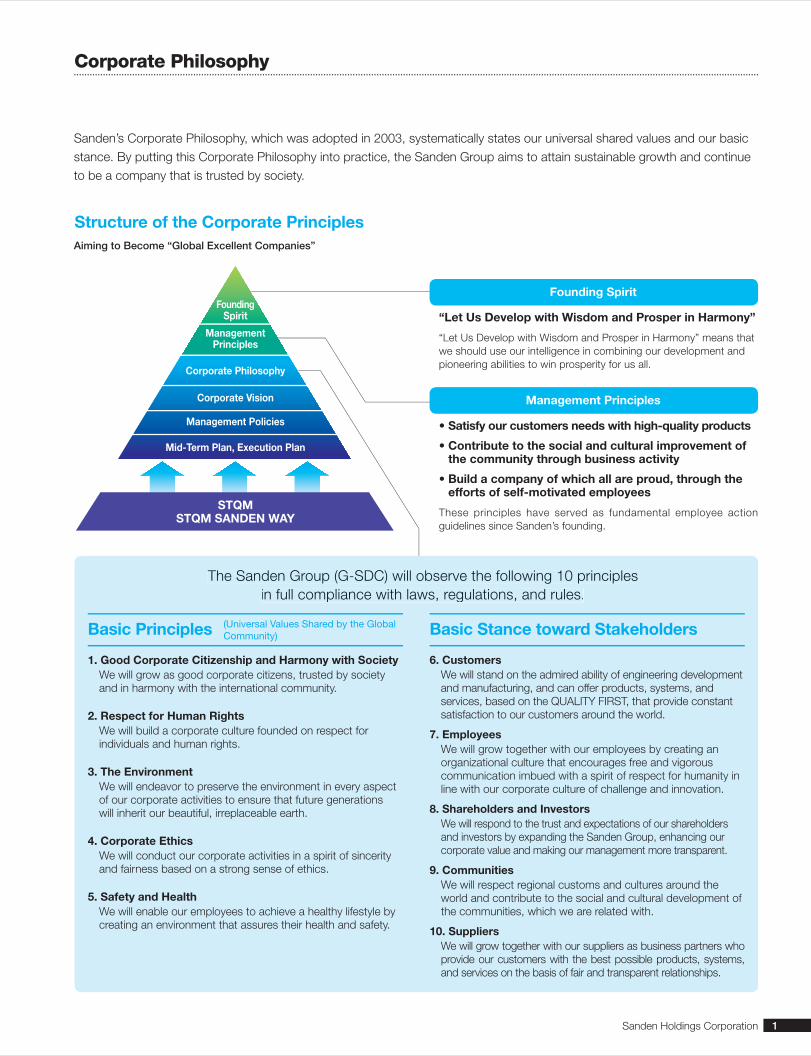
Founding Spirit
Management Principles
STQMSTQM SANDEN WAY
Corporate Philosophy
Corporate Vision
Management Policies
Mid-Term Plan, Execution Plan
Founding Spirit
Management Principles
“Let Us Develop with Wisdom and Prosper in Harmony”
“Let Us Develop with Wisdom and Prosper in Harmony” means that we should use our intelligence in combining our development and pioneering abilities to win prosperity for us all.
• Satisfy our customers needs with high-quality products
• Contribute to the social and cultural improvement of the community through business activity
• Build a company of which all are proud, through the efforts of self-motivated employees
These principles have served as fundamental employee action guidelines since Sanden’s founding.
Corporate Philosophy
The Sanden Group (G-SDC) will observe the following 10 principles in full compliance with laws, regulations, and rules.
Aiming to Become “Global Excellent Companies”
Basic Principles
1. Good Corporate Citizenship and Harmony with Society We will grow as good corporate citizens, trusted by society
and in harmony with the international community.
2. Respect for Human Rights We will build a corporate culture founded on respect for
individuals and human rights.
3. The Environment We will endeavor to preserve the environment in every aspect
of our corporate activities to ensure that future generations will inherit our beautiful, irreplaceable earth.
4. Corporate Ethics We will conduct our corporate activities in a spirit of sincerity
and fairness based on a strong sense of ethics.
5. Safety and Health We will enable our employees to achieve a healthy lifestyle by
creating an environment that assures their health and safety.
Basic Stance toward Stakeholders
6. Customers We will stand on the admired ability of engineering development
and manufacturing, and can offer products, systems, and services, based on the QUALITY FIRST, that provide constant satisfaction to our customers around the world.
7. Employees We will grow together with our employees by creating an
organizational culture that encourages free and vigorous communication imbued with a spirit of respect for humanity in line with our corporate culture of challenge and innovation.
8. Shareholders and InvestorsWe will respond to the trust and expectations of our shareholders and investors by expanding the Sanden Group, enhancing our corporate value and making our management more transparent.
9. Communities We will respect regional customs and cultures around the
world and contribute to the social and cultural development of the communities, which we are related with.
10. Suppliers We will grow together with our suppliers as business partners who provide our customers with the best possible products, systems, and services on the basis of fair and transparent relationships.
(Universal Values Shared by the Global Community)
Sanden’s Corporate Philosophy, which was adopted in 2003, systematically states our universal shared values and our basic
stance. By putting this Corporate Philosophy into practice, the Sanden Group aims to attain sustainable growth and continue
to be a company that is trusted by society.
Structure of the Corporate Principles
Sanden Holdings Corporation 1

Interview with Sanden’s President
All management and staff of the Sanden Group are working together to achieve Sanden’s Key Strategic Goals.
Kin-ei Kanda Director & President
Please review Sanden’s performance in fi scal 2015.
In fi scal 2015, ended March 31, 2016, net sales were ¥294.2 billion, operating income was ¥5.5 billion, and ordinary income amounted to ¥6.1 billion. Net income attributable to owners of the parent came to a total of ¥7.0 billion. Factors infl uencing net sales included expansion in automotive air-conditioning systems in China. However, lower sales of auto-mobiles, mainly in North America and Japan, impacted our over-all sales; also, the domestic market for Commercial Store Systems Business was weak. As a consequence of these condi-tions, changes in the market environment were greater than we had anticipated. Beginning in the current fi scal year that com-menced on April 1, 2016, since we are working to achieve steady growth, we are aware that we must respond more fl exibly and aggressively to changes in the business environment.
What were Sanden’s results by business segment?
In the Automotive Systems Business, we have moved forward with the development of cutting-edge products that accurately respond to customer needs for environmentally friendly prod-ucts. In this business, we offered value-added compressors that are more compact and lighter as well as systems that
incorporate heat pump technology. As a result, sales in Europe and Asia held fi rm, supported in part by the acquisition of new business in the Chinese market. However, overall sales were adversely affected by the decline in automobile sales in North America and Japan. As a consequence, net sales decreased 1%.
Despite lower sales, operating income rose 16%. Although there was some impact from environment-related R&D invest-ments for future development and lower sales, as a result of cost reductions through shifting to in-house production of parts and reforms in our global parts procurements structure as well as improvements in productivity, Sanden was able to report higher profi tability. In the retail store systems sector within the Commercial Store Systems Business, we offered total packages of products, sys-tems, and services that respond to changes in environmental awareness and in lifestyles. In addition, in the vending systems sector, we aggressively developed environmentally friendly products centered around our original CO2 heat pump vending machines and expanded the scope of business activities to new domains, including coffee servers. Despite these initiatives, net sales declined 12% mainly due to lower domestic demand. Operating income decreased 70% in spite of cost reductions and continued thoroughgoing activi-ties to implement business structural reforms focusing on increasing productivity.
Q
Q
2 Annual Report 2016
Interview with Sanden’s President
In the Living & Environment Systems and Other Business, we moved forward with global marketing initiatives for our heat pump hot water supply system that uses CO2 as a natural refrigerant. Moreover, we continued active capital investments in the further development of our hot water heaters and other original technologies that incorporate our environmental tech-nologies, while also taking initiatives in expanding into new business domains.
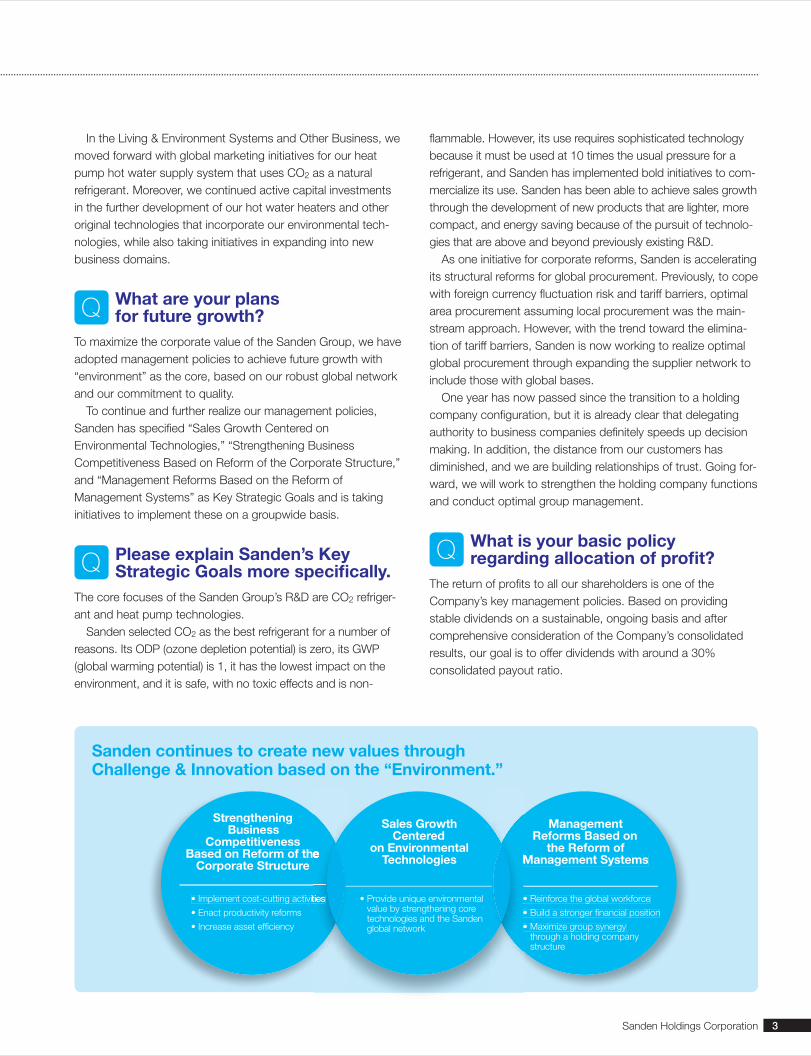
What are your plans for future growth?
To maximize the corporate value of the Sanden Group, we have adopted management policies to achieve future growth with “environment” as the core, based on our robust global network and our commitment to quality. To continue and further realize our management policies, Sanden has specifi ed “Sales Growth Centered on Environmental Technologies,” “Strengthening Business Competitiveness Based on Reform of the Corporate Structure,” and “Management Reforms Based on the Reform of Management Systems” as Key Strategic Goals and is taking initiatives to implement these on a groupwide basis.
Please explain Sanden’s Key Strategic Goals more specifi cally.
The core focuses of the Sanden Group’s R&D are CO2 refriger-ant and heat pump technologies. Sanden selected CO2 as the best refrigerant for a number of reasons. Its ODP (ozone depletion potential) is zero, its GWP (global warming potential) is 1, it has the lowest impact on the environment, and it is safe, with no toxic effects and is non-
fl ammable. However, its use requires sophisticated technology because it must be used at 10 times the usual pressure for a refrigerant, and Sanden has implemented bold initiatives to com-mercialize its use. Sanden has been able to achieve sales growth through the development of new products that are lighter, more compact, and energy saving because of the pursuit of technolo-gies that are above and beyond previously existing R&D. As one initiative for corporate reforms, Sanden is accelerating its structural reforms for global procurement. Previously, to cope with foreign currency fl uctuation risk and tariff barriers, optimal area procurement assuming local procurement was the main-stream approach. However, with the trend toward the elimina-tion of tariff barriers, Sanden is now working to realize optimal global procurement through expanding the supplier network to include those with global bases. One year has now passed since the transition to a holding company confi guration, but it is already clear that delegating authority to business companies defi nitely speeds up decision making. In addition, the distance from our customers has diminished, and we are building relationships of trust. Going for-ward, we will work to strengthen the holding company functions and conduct optimal group management.
What is your basic policy regarding allocation of profi t?
The return of profi ts to all our shareholders is one of the Company’s key management policies. Based on providing stable dividends on a sustainable, ongoing basis and after comprehensive consideration of the Company’s consolidated results, our goal is to offer dividends with around a 30% consolidated payout ratio.
Sanden continues to create new values throughChallenge & Innovation based on the “Environment.”
Q
Q Q
Strengthening Business
Competitiveness Based on Reform of the
Corporate Structure
Management Reforms Based on
the Reform of Management Systems
• Implement cost-cutting activities
• Enact productivity reforms
• Increase asset effi ciency
• Reinforce the global workforce
• Build a stronger fi nancial position
• Maximize group synergy through a holding company structure
Based on Reform of the Management Systems
• Implement cost-cutting activities • Reinforce the global workforce
• Build a stronger fi nancial position
• Maximize group synergy
Sales Growth Centered
on Environmental Technologies
• Provide unique environmental value by strengthening core technologies and the Sanden global network
Sanden Holdings Corporation 3

4 Annual Report 2016
Highlights of the Fiscal Year
Millions of yenThousands of
U.S. dollars (Note)
FY2011 FY2012 FY2013 FY2014 FY2015 FY2015
Net sales ........................................................... ¥214,282 ¥241,780 ¥274,786 ¥306,984 ¥294,237 $2,611,261
Operating income (loss) ..................................... 712 (896) 4,858 9,407 5,494 48,757Net income attributable to owners of the parent .................................................... 1,204 1,084 5,843 5,580 6,965 61,812Comprehensive income ..................................... 57 5,331 13,123 11,713 2,044 18,139
Total net assets ................................................. ¥ 48,199 ¥ 52,961 ¥ 65,651 ¥ 75,677 ¥ 75,503 $ 670,065Total assets ....................................................... 212,300 247,387 277,920 299,265 301,325 2,674,165
Net assets per share (yen and U.S. dollars) ....... ¥ 331.08 ¥ 364.35 ¥ 443.68 ¥ 510.80 ¥ 507.56 $ 4.50Net income per share (yen and U.S. dollars) ...... 8.84 7.96 42.65 40.40 50.43 0.44
Capital adequacy ratio (%) ................................. 21.3% 20.1% 22.1% 23.6% 23.3%Return on equity (%) .......................................... 2.7 2.3 10.5 8.5 9.9Price earnings ratio (%) ...................................... 30.6 47.1 10.8 13.3 6.4
Cash flows from operating activities ................... ¥ (5,227) ¥ 3,148 ¥ 18,803 ¥ 16,223 ¥ 6,304 $ 55,946 Cash flows from investing activities .................... (7,588) (16,794) (12,105) (13,301) (14,932) (132,516)Cash flows from financing activities .................... 9,432 17,740 (8,675) (2,022) 6,066 53,833 Cash and cash equivalents at end of the year ..... 14,842 19,961 19,078 20,588 17,482 155,147
Gross profit ........................................................ ¥ 35,928 ¥ 36,731 ¥ 48,101 ¥ 57,246 ¥ 53,311 $ 473,118
Gross profit ratio (%) .......................................... 16.8% 15.2% 17.5% 18.6% 18.1%Ratio of SG&A expenses (%) ............................. 16.4 15.6 15.7 15.6 16.3Total net assets ratio (%) .................................... 21.3 20.1 22.1 23.6 23.3Note: U.S. dollar figures are translated, for convenience only, at the rate of ¥112.68 to US$1.00, the effective rate of exchange prevailing on March 31, 2016.
Environmental Figures
FY2011 FY2012 FY2013 FY2014 FY2015
Energy usage (in GJ) .......................................... 2,584,768 2,676,267 2,654,591 2,764,352 2,803,609CO2 emissions (in t-CO2) ................................... 110,506 118,693 124,080 129,026 130,335
Number of Employees by Region
FY2011 FY2012 FY2013 FY2014 FY2015
Japan ................................................................ 4,197 4,344 4,432 4,340 4,168Asia-Pacific ........................................................ 2,685 4,879 5,449 5,901 5,655Americas ........................................................... 1,342 1,664 1,581 1,464 1,251Europe .............................................................. 1,647 1,672 1,818 1,810 2,152Total .................................................................. 9,871 12,559 13,280 13,515 13,226

Net Sales
(Millions of yen)
400,000
300,000
200,000
100,000
02011 (FY)2012 2013 2014 2015
214,282241,780
274,786
306,984294,237294,237
Total Assets
(Millions of yen)
400,000
300,000
200,000
100,000
02011 2012 2013 2014 2015 (FY)
212,300
247,387277,920
299,265301,325301,325
Energy Usage by Region
(GJ)
2011 2012 2013 2014 20150
500,000
1,000,000
1,500,000
2,000,000
2,500,000
3,000,000
(FY)
Japan Europe Asia-Pacific China Americas
Total Net Assets
(Millions of yen)
80,000
60,000
40,000
20,000
02011 2012 2013 2014 2015 (FY)
48,19952,961
65,651
75,677 75,50375,503
CO2 Emissions by Region
(t CO2)
2011 2012 2013 2014 2015 (FY)
25,000
0
50,000
75,000
100,000
125,000
150,000
Japan Europe Asia-Pacific China Americas
ROE
(%)
15
12
9
3
0
6
2011 2012 2013 2014 2015 (FY)
2.72.3
10.5
8.5
9.99.9
Number of Employees by Region
(Persons)
2011 2012 2013 2014 2015 (FY)
2,500
5,000
7,500
10,000
12,500
15,000
0
Japan Europe
Asia-Pacific (including China) Americas
* No companies are accounted for by the equity method.
Operating Income (Loss)
(Millions of yen)
10,000
8,000
4,000
0
-2,000
2,000
6,000
2011 2012 2013 2014 2015 (FY)
712
(896)
4,858
9,407
5,4945,494
Net Income Attributable to Owners of the Parent
(Millions of yen)
8,000
6,000
4,000
2,000
02011 2012 2013 2014 2015 (FY)
1,204 1,084
5,8435,580
6,965
Sanden Holdings Corporation 5
Highlights of the Fiscal Year
Automotive Systems Business
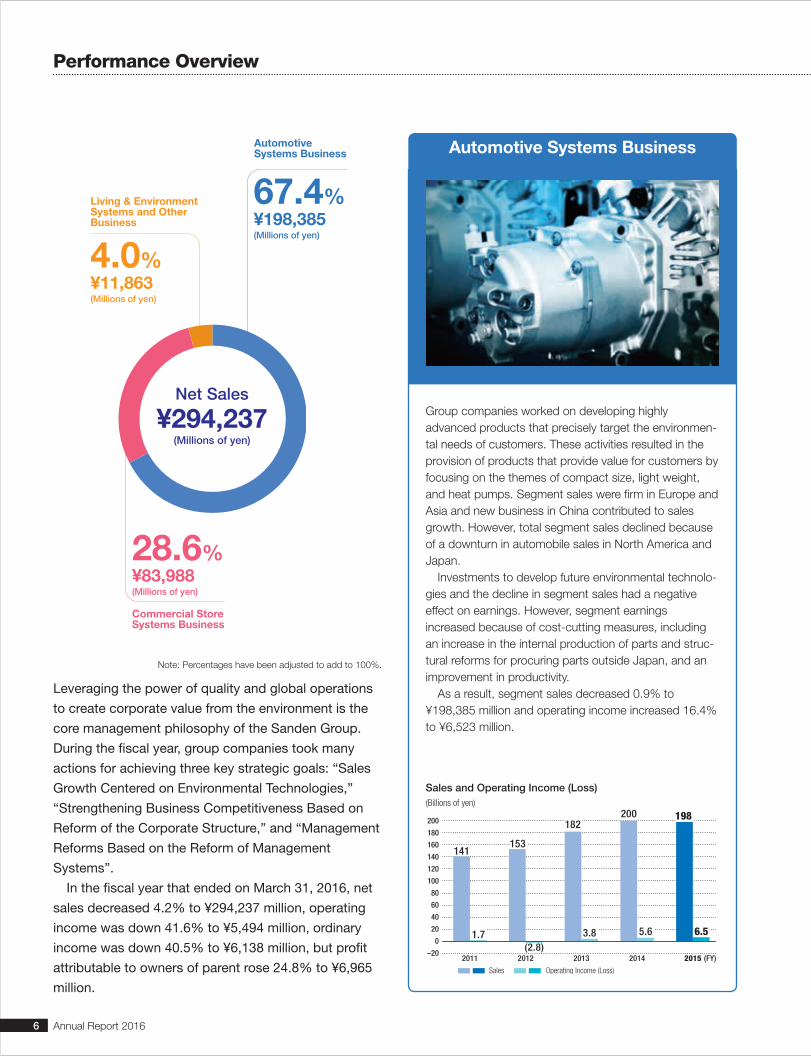
Group companies worked on developing highly advanced products that precisely target the environmen-tal needs of customers. These activities resulted in the provision of products that provide value for customers by focusing on the themes of compact size, light weight, and heat pumps. Segment sales were firm in Europe and Asia and new business in China contributed to sales growth. However, total segment sales declined because of a downturn in automobile sales in North America and Japan. Investments to develop future environmental technolo-gies and the decline in segment sales had a negative effect on earnings. However, segment earnings increased because of cost-cutting measures, including an increase in the internal production of parts and struc-tural reforms for procuring parts outside Japan, and an improvement in productivity. As a result, segment sales decreased 0.9% to ¥198,385 million and operating income increased 16.4% to ¥6,523 million.
Leveraging the power of quality and global operations
to create corporate value from the environment is the
core management philosophy of the Sanden Group.
During the fiscal year, group companies took many
actions for achieving three key strategic goals: “Sales
Growth Centered on Environmental Technologies,”
“Strengthening Business Competitiveness Based on
Reform of the Corporate Structure,” and “Management
Reforms Based on the Reform of Management
Systems”.
In the fiscal year that ended on March 31, 2016, net
sales decreased 4.2% to ¥294,237 million, operating
income was down 41.6% to ¥5,494 million, ordinary
income was down 40.5% to ¥6,138 million, but profit
attributable to owners of parent rose 24.8% to ¥6,965
million.
Note: Percentages have been adjusted to add to 100%.
Performance Overview
Sales and Operating Income (Loss) (Billions of yen)
0
80
160
40
60
120
100
20
–20
180
140
200
Sales Operating Income (Loss)
2015
198198
6.5
2011 (FY)2012 2013
141
(2.8)2014
141141153153
182200
1.7 3.8 5.6
Automotive Systems Business
Commercial Store Systems Business
Living & Environment Systems and Other Business
4.0% ¥11,863 (Millions of yen)
67.4% ¥198,385 (Millions of yen)
28.6% ¥83,988 (Millions of yen)
Net Sales
¥294,237(Millions of yen)
6 Annual Report 2016

Commercial Store Systems Business Living & Environment Systems and Other Business
The retail store systems sector continued to create comprehensive proposals combining products, systems, and services that reflect changes in customers’ interest in environmental issues and their lifestyles. Despite these activities, a decline in demand following the growth in the previous fiscal year caused this sector’s sales to decrease. In the vending systems sector, there were extensive measures to develop environmentally responsible products, chiefly vending machines incorporating our exclusive CO2 heat pump. We also expanded operations to include coffee servers and other new products. However, sales decreased primarily because of lower demand in Japan associated with capital expenditures. Although we continued to use a variety of actions for improving operations in this segment, chiefly by cutting costs and boosting productivity, the decline in sales caused earnings to fall. As a result, segment sales decreased 11.5% to ¥83,988 million and operating income was down 69.5% to ¥1,894 million.
Based on our core strategies for future growth, we are continuing to work on increasing sales of Eco Cute, a heat pump hot water supply system using a natural CO2 refrigerant, on a global scale. In addition, we continued to make substantial capital expenditures for the innova-tive technologies needed for hot water heaters and other products that use environmental technologies. The goal of these activities is extending operations to more business domains. Accompanying the rising awareness of the natural environment on a global scale, in recent years, many laws have been passed with aims that include not only reducing electric power consumption of products but also reducing the environmental burden over the full product life cycle. Sanden also, through further develop-ment of its lineup of products, is responding quickly to needs arising along with market growth.
Performance Overview
Sales and Operating Income(Billions of yen)
0
20
40
20122011 2013 2014
100
80
60
81
3.5
94
6.2
2015
83
1.8
Sales Operating Income
0.5 3.7
80
65
(FY)
Sales and Operating Income (Loss)(Billions of yen)
–3
3
6
0
20122011 2013 2015
15
9
12
9.0
(1.9)
11.511.5
(2.4)
11.811.8
(2.9)2014
11.811.8
(2.4)
Sales Operating Income (Loss)
(1.4)
8.1
(FY)
Sanden Holdings Corporation 7

April 2015: Transformation to holding company confi gurationTo enhance global management functions, increase business competitiveness, strengthen new product development, and improve group management effi ciency, the Company made the transformation to a holding company confi guration as of April 1.
May 2015: Began production of compact, energy-saving compressors for car air conditionersThe Company developed a new type of variable compressor for car air condition-ers and began to supply units to PSA Peugeot Citroen. Sanden Manufacturing Europe S.A.S. produces the units locally.
May 2015: New offi ce opens in Paris, FranceSandenVendo France Branch, a new offi ce opened in Paris, France, will engage in the Commercial Store Systems Business.
August 2015: New HVAC line begins production in the Polish plantA new production line for car air conditioners of Sanden Manufacturing Poland Sp.z o.o. began production. It will supply air conditioners to truck manufacturers in Europe.
February 2016: New production line added for compressor production in the Polish plantSanden Manufacturing Poland Sp.z o.o. has added a second compressor produc-tion line. With two lines, the Polish plant has doubled its previous capacity.
Topics
Exhibited at Global Trade Shows
The following introduces the Company’s activities from April 2015 to March 2016.
Exhibit of vending machines and coffee servers at EXPO VENDING
São Paulo, Brazil
Products using natural refrig-erants (CO2) at a Supermarket Trade Show
Tokyo, Japan
Heat pump hot water supply system on exhibit at AHR 2016 EXPO
Orlando, United States
Vending machines on display at VENDITALIA Special Exhibition
Milan, Italy
Introduction of heat pumps with cutting-edge technology and products using CO2 at Eco Products 2015
Tokyo, Japan
SN compressor
SandenVendo France
Sanden Manufacturing Poland Sp.z o.o.
SANDEN HOLDINGS CORPORATION
SA
ND
EN
AS
SA
ND
EN
AC
SA
ND
EN
RS
SA
ND
EN
LS
SA
ND
EN
EP
SA
ND
EN
AT
SA
ND
EN
BE
8 Annual Report 2016
CSR
The Sanden Group has established the principle that
“Sanden’s CSR Programs essentially put its Corporate
Philosophy into practice.”
There has been an increasing interest in companies’ CSR
activities among our stakeholders including customers world-
wide. Sanden believes that it is necessary to create frame-
works that can be implemented easily and formulate the
content of specific action plans to further its CSR activities.
Accordingly, in fiscal 2014, Sanden established its CSR
Promotion Committee.
With this committee as the focal point, the CSR issues
that the Sanden Group as a whole should address are
selected. Additionally, linkages are drawn between these
issues and the group’s Corporate Philosophy. The CSR
priority issues are then established provisionally based on
“analysis of importance for management” and “analysis of
importance from the perspective of society.”
In fiscal 2015, we prepared a mapping of the importance
of related issues in each division, and, while receiving out-
side opinions, we have been verifying Sanden’s priority CSR
issues. (Please refer to “Steps toward Identification of
Priority CSR Issues” shown on the right.)
Reconfirmation of the Corporate PhilosophyThe 10 principles of the Corporate Philosophy (5 Universal Values Shared by the Global Community and 5 items on Sanden’s Basic Stance toward Stakeholders) will be reconfirmed, and then, how these principles are being put into action in the group as a whole will be confirmed.
Selection of CSR ItemsIn this step, reference will be made to international CSR standards and guidelines as they relate to the 10 principles, and the necessary CSR activities will be selected.
Linkages between the Corporate Philosophy and CSR ItemsBy drawing linkages between the Corporate Philosophy and CSR items, the necessary action plans and schedules will be prepared in each business domain.
Analysis of Materiality for Sanden ManagementIn this step, an analysis will be made of the importance (materiality) for Sanden management of each of the CSR items that have been selected. Consideration will be given to medium-term industry trends and analyses of Sanden’s strengths and weaknesses.
Analysis of Materiality in Light of Social RequirementsThe requests and expectations of stakeholders that have been expressed to Sanden will be regarded as social requirements, and analysis will be conducted of the importance (materiality) of each of the selectedCSR items.
Identification of Priority CSR IssuesThe priority CSR issues will be identified through the six-step process described above, and a report on the process and approach will be made.
Steps toward Identification of Priority CSR Issues
CSR ActivitiesThe Sanden Group believes that it is very important for all employees to put the content of its “Corporate Philosophy”
into practice in activities every day and that putting ethics into practice is synonymous with its CSR.
June 2015/Poland
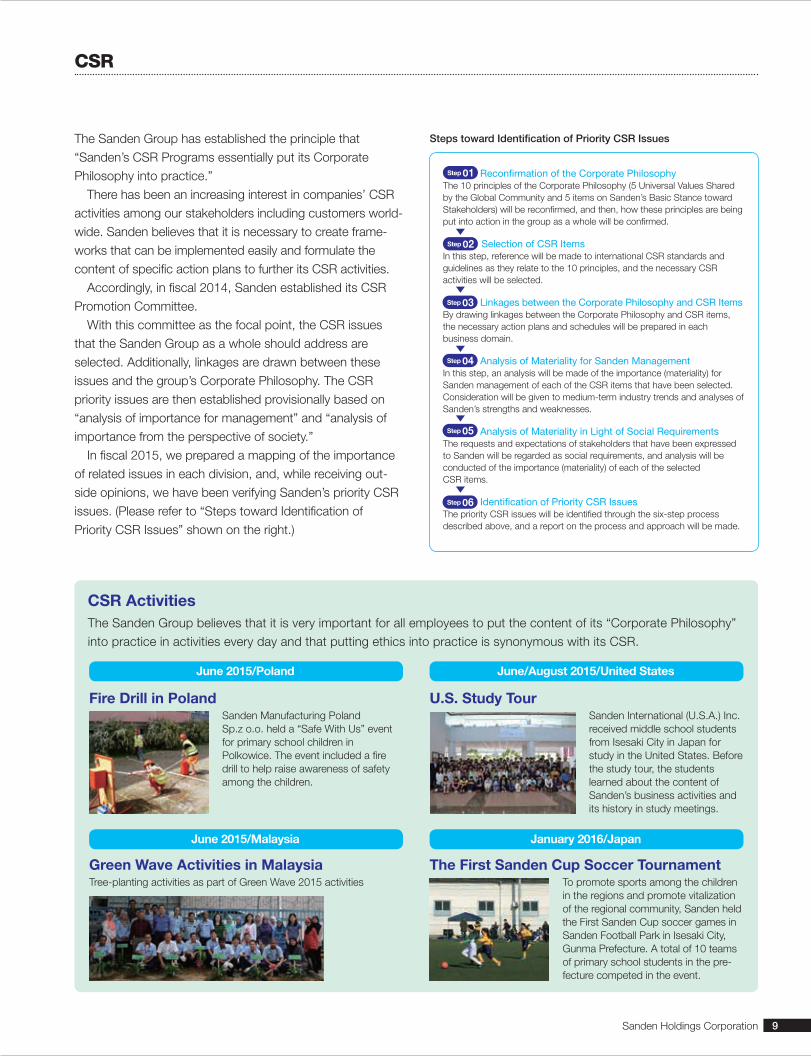
Fire Drill in PolandSanden Manufacturing Poland Sp.z o.o. held a “Safe With Us” event for primary school children in Polkowice. The event included a fire drill to help raise awareness of safety among the children.
June/August 2015/United States
U.S. Study TourSanden International (U.S.A.) Inc. received middle school students from Isesaki City in Japan for study in the United States. Before the study tour, the students learned about the content of Sanden’s business activities and its history in study meetings.
June 2015/Malaysia
Green Wave Activities in MalaysiaTree-planting activities as part of Green Wave 2015 activities
January 2016/Japan
The First Sanden Cup Soccer TournamentTo promote sports among the children in the regions and promote vitalization of the regional community, Sanden held the First Sanden Cup soccer games in Sanden Football Park in Isesaki City, Gunma Prefecture. A total of 10 teams of primary school students in the pre-fecture competed in the event.
Step 01
Step 05
Step 03
Step 02
Step 06
Step 04
Sanden Holdings Corporation 9

Corporate Governance
Fundamental Corporate Governance Policies
Employing the “company with auditors” model based on
Japan’s Corporate Law, Sanden has created a corporate
governance system that includes a Board of Directors, Audit
& Supervisory Board Members, an Audit & Supervisory
Board, and an accounting auditor.
The Board of Directors has 13 members, including
2 outside Directors, while the Audit & Supervisory Board
has 4 members, including 3 outside Audit & Supervisory
Board Members.
To strengthen management oversight functions, Sanden
appoints fully independent outside Directors and outside
Audit & Supervisory Board Members. Currently, Sanden’s 4
outside executives are certified as “independent” under the
Securities Listing Regulations of the Tokyo Stock Exchange.
By setting Directors’ terms to one year, Sanden has put in
place a system to ensure management transparency and
one that enables quick responses to changes in the market
environment. Also, by adopting an executive officer system,
the Sanden Group aims to strengthen business execution
functions and increase management efficiency. Moreover,
the Management Committee and Board of Directors deliber-
ate in a timely fashion on important matters in compliance
and risk management. Furthermore, by putting in place inter-
nal and external hot lines as an internal reporting system,
Sanden is working to strengthen risk management, corpo-
rate ethics, and legal compliance. In view of such factors as
Sanden’s business category, history, and culture, the
Company has judged that the current system is appropriate
for the corporate governance of the Sanden Group.
The Board of Directors made an analysis of whether
the Board of Directors as a whole is functioning effec-
tively from a range of different points of view, and, using
the results of this analysis, made an assessment of the
status of the Board of Directors system, composition,
operation, and other matters.
As a result, the assessment confirmed that the current
Board of Directors was functioning effectively and rec-
ognized that there were issues related to the depth of
discussions of medium- to long-term management strat-
egy and corporate plans.
Going forward, the Company should work to make the
Board of Directors more effective and take initiatives to
attain sustainable growth as well as increase corporate
value in the medium-to-long term.
General Meeting of Shareholders
Appointment/Removal Appointment/Removal
Board of Directors(13 Directors)
2 Outside Directors(2 Independent Directors)
Supervision/advice
Representative DirectorPresident
The Company
Business Companies, Subsidiaries, and Affiliated Companies
InternalAuditors
Internal Auditing
Audit & Supervisory Board(4 Audit & Supervisory Board Members)
3 Outside Audit & Supervisory Board Members
(2 Independent Audit & Supervisory Board Members)
AccountingAuditor
Accounting Auditing Auditing
ManagementCommittee
BusinessExecution
Corporate Officers
Drafting ManagementStrategies
Directors
Sanden’s Corporate Governance and Internal Control Organization Units and Their Interrelationships
As of June 2016
10 Annual Report 2016

Directors/Audit & Supervisory Board Members/Officers
DIRECTORS OFFICERS
AUDIT & SUPERVISORY BOARD MEMBERS
Masayoshi UshikuboDirector & Chairman
Kin-ei KandaDirector & President
Tsutomu SakakibaraDirector & Vice President
Mark UlfigDirector & Vice President
Katsuya NishiDirector & Vice President
Mitsunori KodakaSenior Director
Seiji ShimazakiSenior Director
Ryuhei UshikuboSenior Director
Toshio YokomuroDirector
Shinji MaruyamaDirector
Nobuhiro UmemuraDirector
Hideto OzakiDirector (outside)
Hideo HohgiDirector (outside)
Shinji IchikawaSenior Corporate Officer
Robert KhengSenior Corporate Officer
Tadashi YoshidaSenior Corporate Officer
Hiroshi TakahashiCorporate Officer
Nobuzumi FujiiCorporate Officer
Takashi ShimomuraCorporate Officer
Kenichi YamamotoCorporate Officer
Yoshihiro SaitoCorporate Officer
Takashi NogiCorporate Officer
Tsuneki FujikuraCorporate Officer
Masanori KojimaCorporate Officer
Norio KamikuraCorporate Officer
Tetsuya SatomiCorporate Officer
Akishi KimuraCorporate Officer
Yuri TsujiCorporate Officer
Mitsugi TakahashiAudit & Supervisory Board Member
Hiroshi YomoAudit & Supervisory Board Member (outside)
Ichiro YumotoAudit & Supervisory Board Member (outside)
Kazumichi MatsukiAudit & Supervisory Board Member (outside) As of June 2016
Sanden Holdings Corporation 11
Net Sales
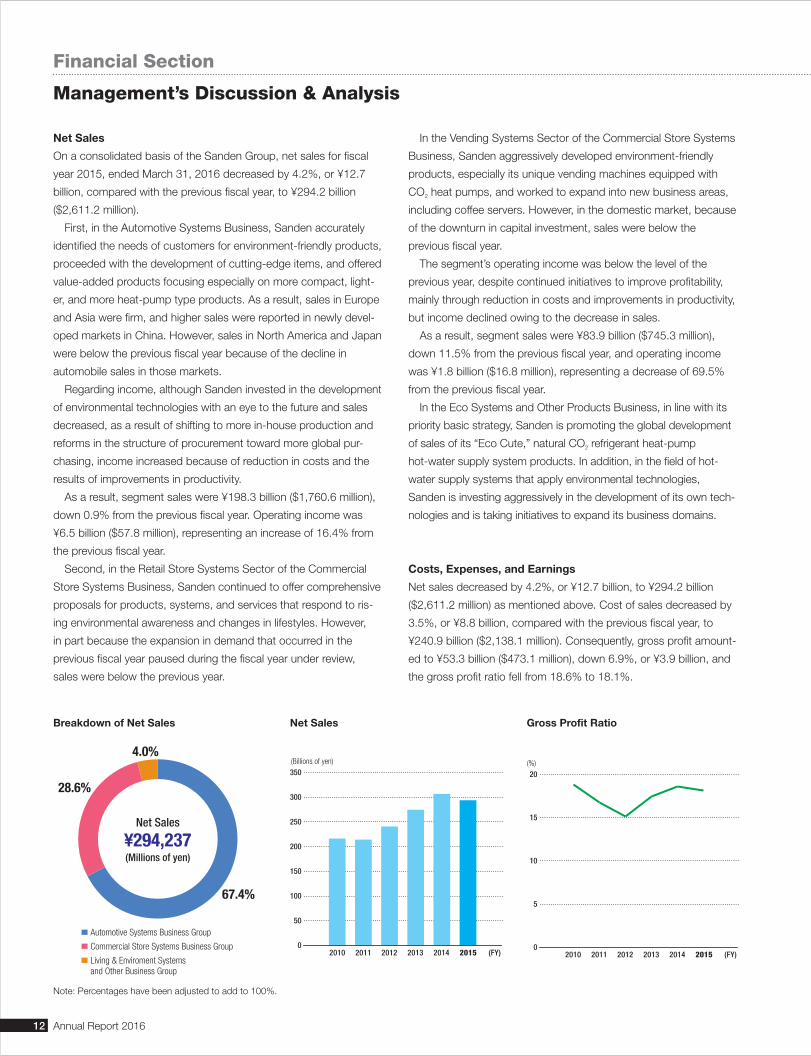
On a consolidated basis of the Sanden Group, net sales for fiscal
year 2015, ended March 31, 2016 decreased by 4.2%, or ¥12.7
billion, compared with the previous fiscal year, to ¥294.2 billion
($2,611.2 million).
First, in the Automotive Systems Business, Sanden accurately
identified the needs of customers for environment-friendly products,
proceeded with the development of cutting-edge items, and offered
value-added products focusing especially on more compact, light-
er, and more heat-pump type products. As a result, sales in Europe
and Asia were firm, and higher sales were reported in newly devel-
oped markets in China. However, sales in North America and Japan
were below the previous fiscal year because of the decline in
automobile sales in those markets.
Regarding income, although Sanden invested in the development
of environmental technologies with an eye to the future and sales
decreased, as a result of shifting to more in-house production and
reforms in the structure of procurement toward more global pur-
chasing, income increased because of reduction in costs and the
results of improvements in productivity.
As a result, segment sales were ¥198.3 billion ($1,760.6 million),
down 0.9% from the previous fiscal year. Operating income was
¥6.5 billion ($57.8 million), representing an increase of 16.4% from
the previous fiscal year.
Second, in the Retail Store Systems Sector of the Commercial
Store Systems Business, Sanden continued to offer comprehensive
proposals for products, systems, and services that respond to ris-
ing environmental awareness and changes in lifestyles. However,
in part because the expansion in demand that occurred in the
previous fiscal year paused during the fiscal year under review,
sales were below the previous year.
In the Vending Systems Sector of the Commercial Store Systems
Business, Sanden aggressively developed environment-friendly
products, especially its unique vending machines equipped with
CO2 heat pumps, and worked to expand into new business areas,
including coffee servers. However, in the domestic market, because
of the downturn in capital investment, sales were below the
previous fiscal year.
The segment’s operating income was below the level of the
previous year, despite continued initiatives to improve profitability,
mainly through reduction in costs and improvements in productivity,
but income declined owing to the decrease in sales.
As a result, segment sales were ¥83.9 billion ($745.3 million),
down 11.5% from the previous fiscal year, and operating income
was ¥1.8 billion ($16.8 million), representing a decrease of 69.5%
from the previous fiscal year.
In the Eco Systems and Other Products Business, in line with its
priority basic strategy, Sanden is promoting the global development
of sales of its “Eco Cute,” natural CO2 refrigerant heat-pump
hot- water supply system products. In addition, in the field of hot-
water supply systems that apply environmental technologies,
Sanden is investing aggressively in the development of its own tech-
nologies and is taking initiatives to expand its business domains.
Costs, Expenses, and Earnings
Net sales decreased by 4.2%, or ¥12.7 billion, to ¥294.2 billion
($2,611.2 million) as mentioned above. Cost of sales decreased by
3.5%, or ¥8.8 billion, compared with the previous fiscal year, to
¥240.9 billion ($2,138.1 million). Consequently, gross profit amount-
ed to ¥53.3 billion ($473.1 million), down 6.9%, or ¥3.9 billion, and
the gross profit ratio fell from 18.6% to 18.1%.
Financial Section
Management’s Discussion & Analysis
Breakdown of Net Sales
4.0%
28.6%
67.4%
Automotive Systems Business Group
Commercial Store Systems Business Group
Living & Enviroment Systems and Other Business Group
Net Sales
¥294,237(Millions of yen)
Gross Profit Ratio
20
5
0
10
15
2010 2011 2012 2013 2014 2015 (FY)
(%)
Net Sales
350
200
100
50
0
150
250
300
2010 2011 2012 2013 2014 2015
(Billions of yen)
(FY)
Note: Percentages have been adjusted to add to 100%.
12 Annual Report 2016

SG&A expenses decreased to ¥47.8 billion ($424.3 million), and
the ratio of SG&A expenses to net sales rose 0.7 percentage point,
to 16.3%, compared with the previous fiscal year. Research and
development (R&D) expenses, which are charged to cost of sales
and SG&A expenses, increased 0.4%, to ¥6.7 billion ($60.0 million).
The ratio of R&D expenses to net sales rose 0.1 percentage point,
to 2.3%, compared with the previous fiscal year.
Although the Company invested aggressively in the development
of environmental technology concerning CO2 compressors for
future growth, the Company recorded an increase in income due to
the effects of continuous improvements in productivity and product
cost reduction, local production, and self-manufacture that were
launched in the previous year.
Operating income amounted to ¥5.4 billion ($48.7 million),
compared with ¥9.4 billion in the previous fiscal year.
Other income (expenses) amounted to a gain of ¥2.4 billion
($21.3 million), compared with a loss of ¥1.4 billion in the previous
fiscal year.
As a result of the above factors, income before income taxes
was ¥7.9 billion ($70.1 million), compared with ¥7.9 billion in the
previous fiscal year. Net income attributable to owners of the parent
amounted to ¥6.9 billion ($61.8 million), compared with ¥5.5 billion
in the previous fiscal year. Return on equity was up from 8.5% to
9.9%.
Financial Position
Total assets at March 31, 2016 increased by ¥2.0 billion, to ¥301.3
billion ($2,674.1 million), mainly reflecting increases in inventory
assets and the effects of changes in the ownership ratios and
increases in capital in associated companies, which were partially
offset by decreases in cash and deposits and decreases in notes
and accounts receivable-trade.
Total liabilities rose by ¥2.2 billion, to ¥225.8 billion ($2,004.0
million), mainly reflecting an increase in interest-bearing debt and
other factors, which were partially offset by a decline in notes and
accounts payable-trade and other factors.
Total net assets decreased by ¥0.1 billion, to ¥75.5 billion
($670.0 million), as a result of changes in the foreign currency trans-
lation adjustment account and other factors. Thus, the total net
assets ratio was 23.3%, compared with 23.6% at the end of the
previous fiscal year.
Liquidity
(1) Cash Flows
Net cash provided by operating activities for the fiscal year under
review amounted to ¥6.3 billion ($55.9 million), which was ¥9.9 bil-
lion lower than the ¥16.2 billion reported in the previous fiscal year.
Principal factors accounting for this were a ¥7.9 billion ($70.1 mil-
lion) inflow of income before income taxes and non-controlling
interests and ¥12.3 billion ($109.8 million) in depreciation and
amortization expenses. These cash inflows were offset in part by an
increase in inventories of ¥5.0 billion ($44.7 million) and an increase
in equity in net income of unconsolidated subsidiaries and affiliates
of ¥4.1 billion ($36.8 million).
Net cash used in investing activities amounted to ¥14.9 billion
($132.5 million), which was ¥1.6 billion higher than the ¥13.3 billion
used in the previous year. Principal factors accounting for this were
purchases of property, plant and equipment, mainly for overseas
investments related to the transition to local production and
in-house production.
Financial Section
Management’s Discussion & Analysis
Net Income Attributable to Owners of the Parent
7
5
3
2
0
4
6
1
2010 2011 2012 2013 2014 2015 (FY)
(Billions of yen)
Net Income per Share
50
20
10
0
30
40
2010 2011 2012 2013 2014 2015 (FY)
(Yen)
Total Assets/Capital Adequacy Ratio
300
150
100
0
50
200
250
30
15
10
0
5
20
25
2010 2011 2012 2013 2014 2015 (FY)
(Billions of yen) (%)
Total Assets (left scale)Capital Adequacy Ratio (right scale)
Sanden Holdings Corporation 13
Net cash provided by financing activities increased to ¥6.0 billion
($53.8 million). Factors accounting for this were proceeds from
long-term loans payable of ¥13.9 billion ($123.8 million) and a net
increase in short-term loans payable of ¥6.5 billion ($57.9 million),
which were offset by the repayment of long-term loans payable of
¥10.5 billion ($93.3 million).
As a result of these cash flows, cash and cash equivalents at the
end of the fiscal year were ¥17.4 billion ($155.1 million), which was
¥3.1 billion lower than the cash and cash equivalents of ¥20.5 bil-
lion at the end of the previous fiscal year.
(2) Capital Demands
The Sanden Group requires working capital primarily for the pur-
chase of materials and parts for products manufactured by the
Sanden Group, manufacturing costs, and operating expenses such
as SG&A expenses.
Moreover, funds for capital investment are mainly required for
enhancing both local production and self-manufacture to strength-
en the global production system and developmental facilities, main-
taining and renewing facilities related to streamlining, and acquiring
molds for production. In the fiscal year under review, capital invest-
ments principally comprised investments related to the Group’s
Automotive Systems Business in Japan and overseas.
(3) Financing
With regard to financing, the Sanden Group makes decisions
according to the intended use of funds as well as the timing, dura-
tion, and the region in which the funds are required.
The Sanden Group companies principally secure the required
working capital by short-term bank loans. As of March 31, 2016,
short-term bank loans amounted to ¥52.8 billion ($469.2 million)
and were denominated primarily in Japanese yen, the U.S. dollar,
and the Euro.
Funds for production facilities are obtained through long-term
loans. As of March 31, 2016, long-term bank loans amounted to
¥76.0 billion ($675.0 million). A large part of the long-term bank
loans was borrowed with fixed interest rates from financial institu-
tions. It included ¥13.9 billion ($123.8 million), which was borrowed
during the fiscal year under review, mainly in Japan for investment
in facilities.
The Sanden Group considers interest rates, the market environ-
ment, the ratio of direct and indirect fund-raising, bond ratings, and
the business situation between financial institutions and the Sanden
Group when deciding on an appropriate long-term fund-raising
plan.
The Sanden Group aims to maintain a firm financial position and
believes the net cash provided by operating activities, indirect
financing through loans and the issuance of bonds, and direct
financing through the issuance of stock provide possible sources of
funds for future growth.
Business and Other Risks
The following is an overview of major business and other risks
faced by the Sanden Group that may significantly affect investors’
decisions. The Sanden Group examines risks and takes appropri-
ate measures to control risks. Please note that forward-looking
statements below are based on Sanden Group judgments made at
the end of the fiscal year under review.
(1) Economic Conditions
The Sanden Group mainly sells automotive air-conditioning sys-
tems, air-conditioner compressors, vending machines, and refriger-
ated showcases throughout the world. Demand for these products
is affected by economic conditions in the various countries and
regions in which these products are sold. In particular, automotive
market trends in North America, Europe, China, and elsewhere in
Asia, where we operate the Automotive Systems Business, may
affect the Sanden Group’s business results and financial position.
(2) Fluctuations in Exchange Rates
The Sanden Group’s global operations, including its Automotive
Systems Business, involve foreign currency transactions. In particu-
lar, exchange rate fluctuations in the Sanden Group’s major trans-
action currencies, the U.S. dollar and the Euro, and currency
fluctuations in China and other parts of Asia may affect the Sanden
Group’s business results and financial position.
In addition, the currencies stated in the financial statements of
consolidated overseas subsidiaries and companies accounted
for by the equity method have been translated into Japanese yen
and recorded in the Company’s consolidated financial statements.
Therefore, the translation rate may affect net income and stock-
holders’ equity as accounted for in the consolidated financial
statements.
(3) Changes in Raw Material and Parts Market Conditions
Operations of the Automotive Systems Business and the
Commercial Store Systems Business primarily involve the manufac-
ture and supply of products and systems. As these operations
involve the procurement of raw materials and parts, upswings in
these markets resulting in higher manufacturing costs may affect
the Sanden Group’s business results and financial position.
14 Annual Report 2016
(4) Natural Disasters
If the manufacturing and business bases of the Sanden Group
suffer serious damage as a result of a natural disaster such as an
earthquake, the Sanden Group’s business results and financial
position may be impacted by the halting of production activities and
delay in the deliveries of materials and parts.
(5) New Product Development
The operations of the Automotive Systems Business and the
Commercial Store Systems Business extend throughout the world
and encompass the development of cutting-edge technologies and
the application of those technologies to products. At times, the
Sanden Group may not be able to fully predict or respond to
market trends and changes, and this may have an impact on the
success of product development and market introduction. These
circumstances may affect the Sanden Group’s business results
and financial position.
(6) Potential Risks Associated with International Operations
and Entry into Overseas Markets
The operations of the Automotive Systems Business and the
Commercial Store Systems Business encompass development,
manufacturing, and sales bases located in 23 countries and regions
in North America, Europe, China, and elsewhere in Asia. Business
activities in these countries and regions are subject to the following
risks:
• Changes in and revisions to laws and regulations in countries in
which the Sanden Group operates,
• Changes in the economic and political climate,
• Unstable political situations, including wars,
• Labor disputes, and
• Marine transport-related strikes.
Any of the aforementioned events may affect the Sanden Group’s
business results and financial position.
(7) Price Competition
The Sanden Group’s operating conditions are marked by
increasingly fierce price competition in the automobile and vending
machine industries, and demands from automobile and beverage
manufacturers to lower prices intensify every year.
The Sanden Group believes that its products possess a competi-
tive advantage in terms of quality, cost, and technology. However,
in the aforementioned difficult business environment, there is no
guarantee of maintaining such advantages, including the supply
of materials and parts, and this may affect the Sanden Group’s
business results and financial position.
(8) Reliance on Customer Performance
The Sanden Group provides products to automobile and beverage
manufacturers around the world. Therefore, customer performance
and other factors that are beyond the control of the management of
the Sanden Group may affect the Group’s business results and
financial position.
(9) Limitations on Intellectual Property Protection
The Sanden Group has accumulated a wide range of proprietary
technologies, know-how, and other intellectual property through its
development activities over the long period since its establishment.
Legal restrictions in certain regions may prevent the Sanden Group
from completely protecting its intellectual property or restrain the
Sanden Group from fundamentally restricting third parties to manu-
facture imitations of the Sanden Group’s products through the use
of its intellectual property.
(10) Product Liability
The Sanden Group is continuing quality control initiatives based on
its Sanden Total Quality Management (STQM). However, product
liability claims related to items manufactured by the Sanden Group
in the past, at present, and into the future could affect the Sanden
Group’s business results and financial position.
(11) Legal and Regulatory Risks
The Sanden Group is subject to various governmental regulations in
the countries and regions in which it operates, including those relat-
ed to business investment permits, export restrictions, taxation, the
environment, and other matters. In the event that these regulations
are changed or new regulations are introduced, this could affect the
Sanden Group’s business results and financial position.
(12) Financial Covenants of Fund Procurement
The Company has entered into syndicated loan contracts with sev-
eral financial institutions for stable funding procurement, and such
contracts included certain financial covenants. If the Sanden Group
breaches such provisions, such loans may be accelerated, which
may, in turn, affect the Sanden Group’s financial condition. As
described in Note 9 to the consolidated financial statements, the
Sanden Group has not breached any of these provisions.
Sanden Holdings Corporation 15

Consolidated Balance SheetsSanden Holdings Corporation and Consolidated SubsidiariesMarch 31, 2016 and 2015
Millions of yenThousands of
U.S. dollars (Note 1)
ASSETS 2016 2015 2016
Current assets: Cash and time deposits (Notes 6, 9 and 15) ........................................................................................... ¥ 17,491 ¥ 20,597 $ 155,227 Receivables (Notes 6 and 9): Trade notes and accounts ................................................................................................................. 62,593 62,998 555,493 Unconsolidated subsidiaries and affiliates ........................................................................................... 23,374 25,399 207,436 Other ............................................................................................................................................... 5,498 4,189 48,793 Allowance for doubtful accounts ........................................................................................................ (1,863) (1,941) (16,533) Inventories (Notes 3 and 9) .................................................................................................................... 50,585 47,419 448,926 Deferred income taxes (Note 5) .............................................................................................................. 2,359 2,735 20,935 Prepaid expenses and other current assets ............................................................................................ 12,922 12,349 114,678 Total current assets .......................................................................................................................... 172,961 173,749 1,534,975
Investments and other assets: Investment securities (Notes 4 and 6): Unconsolidated subsidiaries and affiliates ........................................................................................... 21,343 13,194 189,412 Other ............................................................................................................................................... 7,860 12,565 69,755 Net defined benefit asset (Note 8) .......................................................................................................... 115 62 1,020 Deferred income taxes (Note 5) .............................................................................................................. 2,765 2,191 24,538 Intangible assets ................................................................................................................................... 4,906 4,823 43,539 Other ................................................................................................................................................... 1,816 1,828 16,116 Total investments and other assets .................................................................................................... 38,808 34,666 344,408
Property, plant and equipment, at cost (Note 9): Land .................................................................................................................................................... 18,697 19,246 165,930 Buildings and structures ........................................................................................................................ 62,489 64,096 554,570 Machinery and equipment ..................................................................................................................... 105,423 111,930 935,596 Furniture and fixtures ............................................................................................................................ 42,640 37,518 378,416 Lease assets ........................................................................................................................................ 20,885 20,140 185,347 Construction in progress ....................................................................................................................... 7,943 5,123 70,491 Total................................................................................................................................................. 258,079 258,054 2,290,370 Accumulated depreciation ..................................................................................................................... (168,523) (167,205) (1,495,589) Net property, plant and equipment ..................................................................................................... 89,555 90,849 794,772
Total assets ......................................................................................................................................... ¥301,325 ¥299,265 $2,674,165
See accompanying notes.
16 Annual Report 2016
Consolidated Balance SheetsSanden Holdings Corporation and Consolidated SubsidiariesMarch 31, 2016 and 2015
Millions of yenThousands of
U.S. dollars (Note 1)
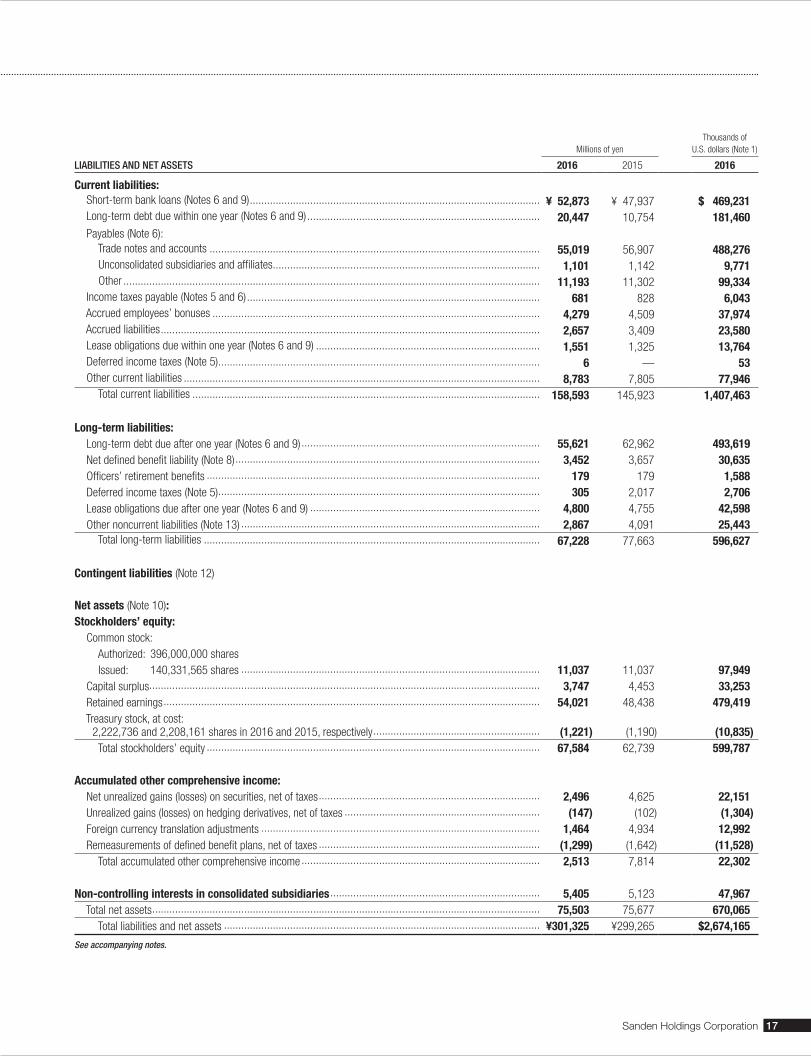
LIABILITIES AND NET ASSETS 2016 2015 2016
Current liabilities: Short-term bank loans (Notes 6 and 9) ..................................................................................................... ¥ 52,873 ¥ 47,937 $ 469,231 Long-term debt due within one year (Notes 6 and 9) ................................................................................. 20,447 10,754 181,460 Payables (Note 6): Trade notes and accounts ................................................................................................................... 55,019 56,907 488,276 Unconsolidated subsidiaries and affiliates ............................................................................................. 1,101 1,142 9,771 Other ................................................................................................................................................. 11,193 11,302 99,334 Income taxes payable (Notes 5 and 6) ...................................................................................................... 681 828 6,043 Accrued employees’ bonuses .................................................................................................................. 4,279 4,509 37,974 Accrued liabilities .................................................................................................................................... 2,657 3,409 23,580 Lease obligations due within one year (Notes 6 and 9) .............................................................................. 1,551 1,325 13,764 Deferred income taxes (Note 5) ................................................................................................................ 6 — 53 Other current liabilities ............................................................................................................................ 8,783 7,805 77,946 Total current liabilities ......................................................................................................................... 158,593 145,923 1,407,463
Long-term liabilities: Long-term debt due after one year (Notes 6 and 9) ................................................................................... 55,621 62,962 493,619 Net defined benefit liability (Note 8) .......................................................................................................... 3,452 3,657 30,635 Officers’ retirement benefits .................................................................................................................... 179 179 1,588 Deferred income taxes (Note 5) ................................................................................................................ 305 2,017 2,706 Lease obligations due after one year (Notes 6 and 9) ................................................................................ 4,800 4,755 42,598 Other noncurrent liabilities (Note 13) ........................................................................................................ 2,867 4,091 25,443 Total long-term liabilities ..................................................................................................................... 67,228 77,663 596,627
Contingent liabilities (Note 12)
Net assets (Note 10):Stockholders’ equity: Common stock: Authorized: 396,000,000 shares Issued: 140,331,565 shares ........................................................................................................ 11,037 11,037 97,949 Capital surplus........................................................................................................................................ 3,747 4,453 33,253 Retained earnings ................................................................................................................................... 54,021 48,438 479,419 Treasury stock, at cost: 2,222,736 and 2,208,161 shares in 2016 and 2015, respectively .......................................................... (1,221) (1,190) (10,835) Total stockholders’ equity .................................................................................................................... 67,584 62,739 599,787
Accumulated other comprehensive income: Net unrealized gains (losses) on securities, net of taxes ............................................................................. 2,496 4,625 22,151 Unrealized gains (losses) on hedging derivatives, net of taxes .................................................................... (147) (102) (1,304) Foreign currency translation adjustments ................................................................................................. 1,464 4,934 12,992 Remeasurements of defined benefit plans, net of taxes ............................................................................. (1,299) (1,642) (11,528) Total accumulated other comprehensive income ................................................................................... 2,513 7,814 22,302
Non-controlling interests in consolidated subsidiaries ......................................................................... 5,405 5,123 47,967 Total net assets ....................................................................................................................................... 75,503 75,677 670,065 Total liabilities and net assets .............................................................................................................. ¥301,325 ¥299,265 $2,674,165
See accompanying notes.
Sanden Holdings Corporation 17
Consolidated Statements of IncomeSanden Holdings Corporation and Consolidated SubsidiariesYears ended March 31, 2016 and 2015
Millions of yenThousands of
U.S. dollars (Note 1)
2016 2015 2016
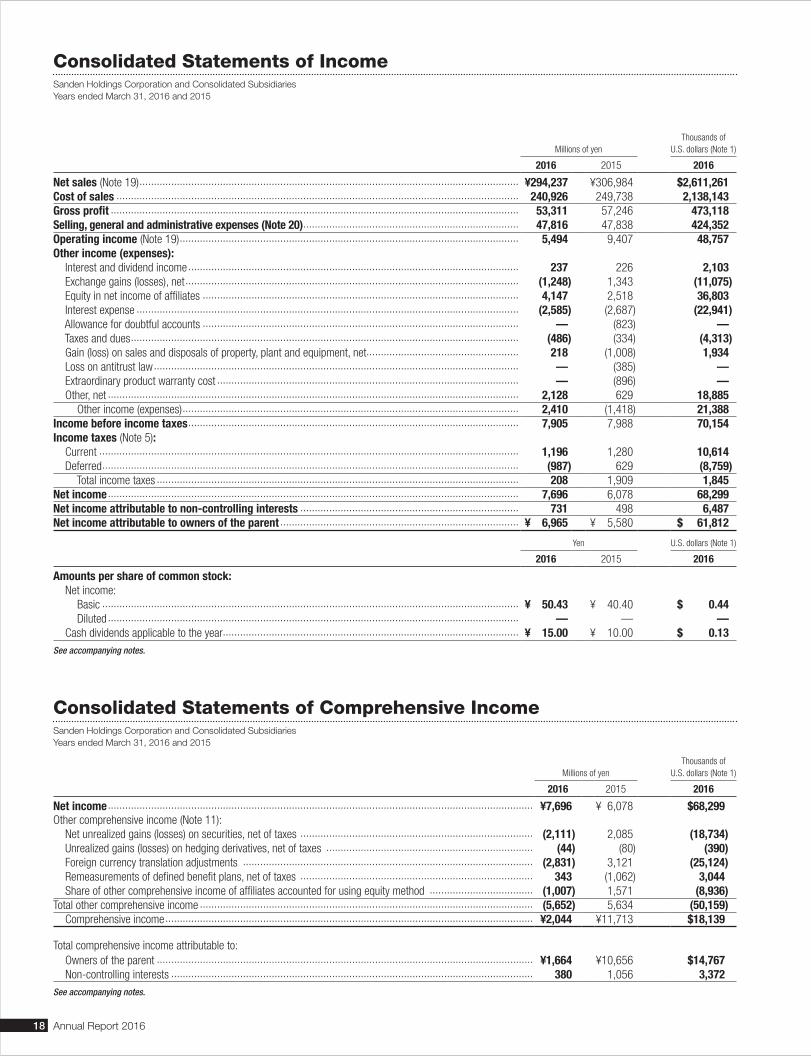
Net sales (Note 19) .................................................................................................................................... ¥294,237 ¥306,984 $2,611,261Cost of sales ............................................................................................................................................ 240,926 249,738 2,138,143Gross profit .............................................................................................................................................. 53,311 57,246 473,118Selling, general and administrative expenses (Note 20) ........................................................................... 47,816 47,838 424,352Operating income (Note 19) ...................................................................................................................... 5,494 9,407 48,757Other income (expenses): Interest and dividend income ................................................................................................................... 237 226 2,103 Exchange gains (losses), net .................................................................................................................... (1,248) 1,343 (11,075) Equity in net income of affiliates .............................................................................................................. 4,147 2,518 36,803 Interest expense ..................................................................................................................................... (2,585) (2,687) (22,941) Allowance for doubtful accounts .............................................................................................................. — (823) — Taxes and dues ....................................................................................................................................... (486) (334) (4,313) Gain (loss) on sales and disposals of property, plant and equipment, net..................................................... 218 (1,008) 1,934 Loss on antitrust law ............................................................................................................................... — (385) — Extraordinary product warranty cost ......................................................................................................... — (896) — Other, net ............................................................................................................................................... 2,128 629 18,885 Other income (expenses) ..................................................................................................................... 2,410 (1,418) 21,388Income before income taxes ................................................................................................................... 7,905 7,988 70,154Income taxes (Note 5): Current .................................................................................................................................................. 1,196 1,280 10,614 Deferred ................................................................................................................................................. (987) 629 (8,759) Total income taxes .............................................................................................................................. 208 1,909 1,845Net income ............................................................................................................................................... 7,696 6,078 68,299Net income attributable to non-controlling interests ............................................................................ 731 498 6,487Net income attributable to owners of the parent ................................................................................... ¥ 6,965 ¥ 5,580 $ 61,812
Yen U.S. dollars (Note 1)
2016 2015 2016
Amounts per share of common stock: Net income: Basic ................................................................................................................................................. ¥ 50.43 ¥ 40.40 $ 0.44 Diluted ............................................................................................................................................... — — — Cash dividends applicable to the year....................................................................................................... ¥ 15.00 ¥ 10.00 $ 0.13 See accompanying notes.
Consolidated Statements of Comprehensive IncomeSanden Holdings Corporation and Consolidated SubsidiariesYears ended March 31, 2016 and 2015
Millions of yenThousands of
U.S. dollars (Note 1)
2016 2015 2016
Net income .................................................................................................................................................... ¥7,696 ¥ 6,078 $68,299Other comprehensive income (Note 11): Net unrealized gains (losses) on securities, net of taxes ................................................................................. (2,111) 2,085 (18,734) Unrealized gains (losses) on hedging derivatives, net of taxes ........................................................................ (44) (80) (390) Foreign currency translation adjustments ..................................................................................................... (2,831) 3,121 (25,124) Remeasurements of defined benefit plans, net of taxes ................................................................................. 343 (1,062) 3,044 Share of other comprehensive income of affiliates accounted for using equity method .................................... (1,007) 1,571 (8,936)Total other comprehensive income .................................................................................................................... (5,652) 5,634 (50,159) Comprehensive income ................................................................................................................................ ¥2,044 ¥11,713 $18,139
Total comprehensive income attributable to: Owners of the parent ................................................................................................................................... ¥1,664 ¥10,656 $14,767 Non-controlling interests .............................................................................................................................. 380 1,056 3,372See accompanying notes.
18 Annual Report 2016

Consolidated Statements of Changes in Net AssetsSanden Holdings Corporation and Consolidated SubsidiariesYears ended March 31, 2016 and 2015
Millions of yen
Stockholders’ equity Accumulated other comprehensive income
As of March 31, 2015Common
stockCapital surplus
Retained earnings
Treasury stock, at cost
Total stockholders’
equity
Net unrealized gains (losses) on securities, net of taxes
Unrealized gains (losses) on hedging derivatives, net of taxes
Foreign currency
translation adjustments
Remeasure-ments of defined
benefit plans, net of taxes
Total accumulated
other comprehensive
income
Non-controlling interests in
consolidated subsidiaries
Total net assets
Balance at beginning of year ¥11,037 ¥4,453 ¥44,239 ¥(1,178) ¥58,553 ¥2,532 ¥ (22) ¥ 807 ¥ (579) ¥2,738 ¥4,359 ¥65,651Net income attributable to owners of the parent ................................................ — — 5,580 — 5,580 — — — — — — 5,580Cash dividends paid (¥10.00 per share) ....... — — (1,382) — (1,382) — — — — — — (1,382)Increase in net unrealized gains (losses) on securities, net of taxes .......................... — — — — — 2,093 — — — 2,093 — 2,093Decrease due to changes in fair value of hedging derivatives ............................... — — — — — — (80) — — (80) — (80)Adjustments from translation of foreign currency financial statements ......... — — — — — — — 4,126 — 4,126 — 4,126Remeasurements of defined benefit plans .... — — — — — — — — (1,062) (1,062) — (1,062)Increase in non-controlling interests ............. — — — — — — — — — — 764 764Disposal of treasury stock ............................ — 0 — 0 0 — — — — — — 0Acquisition of treasury stock ........................ — — — (12) (12) — — — — — — (12)
Balance at end of year............................. ¥11,037 ¥4,453 ¥48,438 ¥(1,190) ¥62,739 ¥4,625 ¥(102) ¥4,934 ¥(1,642) ¥7,814 ¥5,123 ¥75,677
Millions of yen
Stockholders’ equity Accumulated other comprehensive income
As of March 31, 2016Common
stockCapital surplus
Retained earnings
Treasury stock, at cost
Total stockholders’
equity
Net unrealized gains (losses) on securities, net of taxes
Unrealized gains (losses) on hedging derivatives, net of taxes
Foreign currency
translation adjustments
Remeasure-ments of defined
benefit plans, net of taxes
Total accumulated
other comprehensive
income
Non-controlling interests in
consolidated subsidiaries
Total net assets
Balance at beginning of year ¥11,037 ¥4,453 ¥48,438 ¥(1,190) ¥62,739 ¥4,625 ¥(102) ¥4,934 ¥(1,642) ¥7,814 ¥5,123 ¥75,677Change in treasury shares of parent arising from transactions with non-controlling
shareholders ............................................ — (731) — — (731) — — — — — — (731)Net income attributable to owners of the parent ............................................. — — 6,965 — 6,965 — — — — — — 6,965Cash dividends paid (¥15.00 per share) ....... — — (1,381) — (1,381) — — — — — — (1,381)Increase in net unrealized gains (losses) on securities, net of taxes .......................... — — — — — (2,128) — — — (2,128) — (2,128)Decrease due to changes in fair value of hedging derivatives ............................... — — — — — — (44) — — (44) — (44)Adjustments from translation of foreign currency financial statements .................... — — — — — — — (3,470) — (3,470) — (3,470)Remeasurements of defined benefit plans .... — — — — — — — — 343 343 — 343Increase in non-controlling interests ............. — — — — — — — — — — 281 281Disposal of treasury stock ............................ — 24 — 456 481 — — — — — — 481Acquisition of treasury stock ........................ — — — (488) (488) — — — — — — (488)Balance at end of year................................. ¥11,037 ¥3,747 ¥54,021 ¥(1,221) ¥67,584 ¥2,496 ¥(147) ¥1,464 ¥(1,299) ¥2,513 ¥5,405 ¥75,503
Thousands of U.S. dollars (Note 1)
Stockholders’ equity Accumulated other comprehensive income
As of March 31, 2016Common
stockCapital surplus
Retained earnings
Treasury stock, at cost
Total stockholders’
equity
Net unrealized gains (losses) on securities, net of taxes
Unrealized gains (losses) on hedging derivatives, net of taxes
Foreign currency
translation adjustments
Remeasure-ments of defined
benefit plans, net of taxes
Total accumulated
other comprehensive
income
Non-controlling interests in
consolidated subsidiaries
Total net assets
Balance at beginning of year $97,949 $39,518 $429,872 $(10,560) $556,789 $41,045 $ (905) $43,787 $(14,572) $69,346 $45,465 $671,609Change in treasury shares of parent arising from transactions with non-controlling
shareholders ............................................ — (6,487) — — (6,487) — — — — — — (6,487)Net income attributable to owners of the parent ............................................. — — 61,812 — 61,812 — — — — — — 61,812Cash dividends paid ($0.13 per share) ......... — — (12,255) — (12,255) — — — — — — (12,255)Increase in net unrealized gains (losses) on securities, net of taxes .......................... — — — — — (18,885) — — — (18,885) — (18,885)Decrease due to changes in fair value of hedging derivatives ............................... — — — — — — (390) — — (390) — (390)Adjustments from translation of foreign currency financial statements .................... — — — — — — — (30,795) — (30,795) — (30,795)Remeasurements of defined benefit plans .... — — — — — — — — 3,044 3,044 — 3,044Increase in non-controlling interests ............. — — — — — — — — — — 2,493 2,493Disposal of treasury stock ............................ — 212 — 4,046 4,268 — — — — — — 4,268Acquisition of treasury stock ........................ — — — (4,330) (4,330) — — — — — — (4,330)Balance at end of year................................. $97,949 $33,253 $479,419 $(10,835) $599,787 $22,151 $(1,304) $12,992 $(11,528) $22,302 $47,967 $670,065
See accompanying notes.
Sanden Holdings Corporation 19

Consolidated Statements of Cash FlowsSanden Holdings Corporation and Consolidated SubsidiariesYears ended March 31, 2016 and 2015
Millions of yenThousands of
U.S. dollars (Note 1)
2016 2015 2016
Cash flows from operating activities: Income before income taxes ....................................................................................................................... ¥ 7,905 ¥ 7,988 $ 70,154 Adjustments to reconcile net income to net cash provided by operating activities:
Depreciation and amortization ................................................................................................................ 12,374 11,694 109,815 Amortization of goodwill ......................................................................................................................... 166 160 1,473 Equity in net income of unconsolidated subsidiaries and affiliates ............................................................. (4,147) (2,518) (36,803) Loss (gain) on sales and disposals of property, plant and equipment, net ................................................... (218) 1,008 (1,934) Decrease (increase) in assets:
Trade accounts and notes receivable .................................................................................................. (1,147) (6,181) (10,179) Inventories ........................................................................................................................................ (5,045) 852 (44,772) Accounts receivable–other ................................................................................................................. (1,043) (1,191) (9,256) Allowance for doubtful accounts ......................................................................................................... 10 964 88 Other current assets .......................................................................................................................... (430) 1,431 (3,816) Increase (decrease) in liabilities:
Trade accounts and notes payable ...................................................................................................... (592) 1,509 (5,253) Accrued employees’ bonuses ............................................................................................................. (165) 803 (1,464) Accounts payable–other ..................................................................................................................... (874) 1,493 (7,756) Other current liabilities and long-term liabilities ................................................................................... 184 (539) 1,632 Income taxes paid.................................................................................................................................. (1,762) (896) (15,637) Other, net .............................................................................................................................................. 1,090 (355) 9,673 Net cash flows from operating activities .............................................................................................. 6,304 16,223 55,946Cash flows from investing activities: Purchases of property, plant and equipment ................................................................................................ (11,141) (12,353) (98,872) Proceeds from sale of property, plant and equipment ................................................................................... 1,690 686 14,998 Purchases of intangible assets .................................................................................................................... (950) (1,092) (8,430) Other, net .................................................................................................................................................. (4,530) (542) (40,202) Net cash flows from investing activities ............................................................................................... (14,932) (13,301) (132,516)Cash flows from financing activities: Net increase in short-term bank loans ......................................................................................................... 6,528 3,817 57,933 Proceeds from long-term debt .................................................................................................................... 13,960 12,274 123,890 Repayment of long-term debt ..................................................................................................................... (10,516) (15,050) (93,326) Repayment of lease obligations................................................................................................................... (1,713) (1,410) (15,202) Cash dividends paid ................................................................................................................................... (1,381) (1,382) (12,255) Proceeds from stock issuance to non-controlling shareholders ..................................................................... — 195 — Other, net .................................................................................................................................................. (811) (466) (7,197) Net cash flows from financing activities............................................................................................... 6,066 (2,022) 53,833Effect of exchange rate changes on cash and cash equivalents ................................................................ (544) 610 (4,827)Net increase (decrease) in cash and cash equivalents ........................................................................... (3,106) 1,510 (27,564)Cash and cash equivalents at beginning of year ...................................................................................... 20,588 19,078 182,712Cash and cash equivalents at end of year (Note 15) .................................................................................. ¥17,482 ¥20,588 $155,147
See accompanying notes.
20 Annual Report 2016
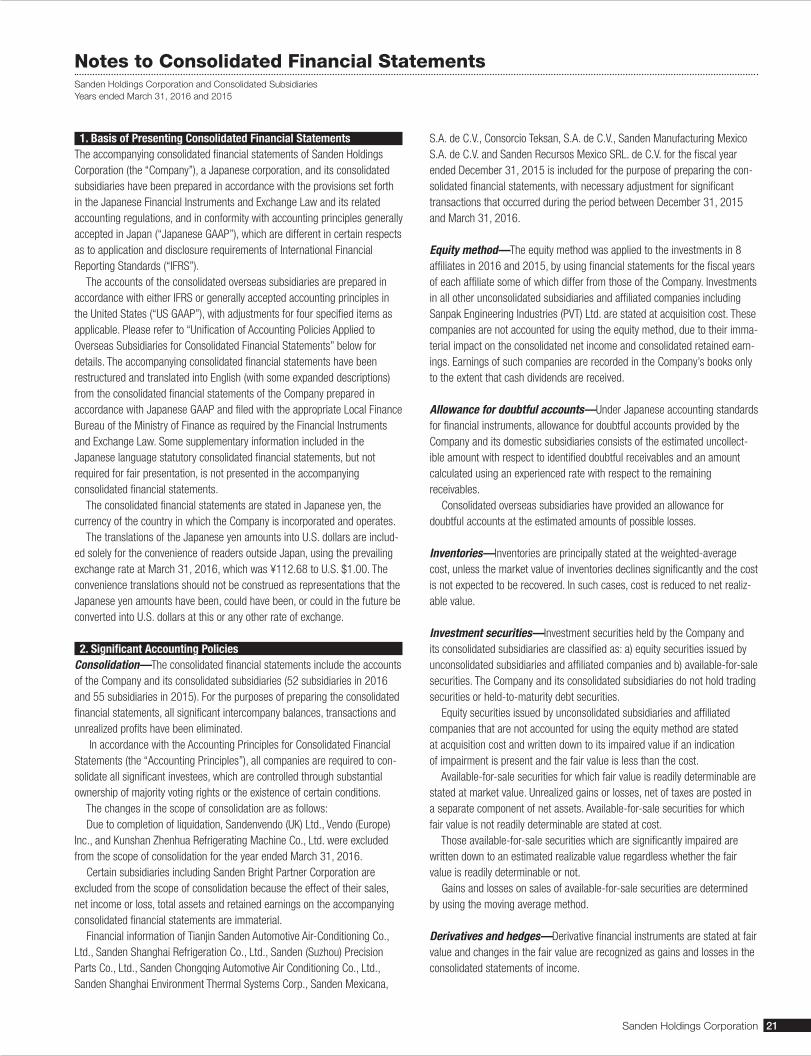
Notes to Consolidated Financial StatementsSanden Holdings Corporation and Consolidated SubsidiariesYears ended March 31, 2016 and 2015
1. Basis of Presenting Consolidated Financial StatementsThe accompanying consolidated financial statements of Sanden Holdings Corporation (the “Company”), a Japanese corporation, and its consolidated subsidiaries have been prepared in accordance with the provisions set forth in the Japanese Financial Instruments and Exchange Law and its related accounting regulations, and in conformity with accounting principles generally accepted in Japan (“Japanese GAAP”), which are different in certain respects as to application and disclosure requirements of International Financial Reporting Standards (“IFRS”). The accounts of the consolidated overseas subsidiaries are prepared in accordance with either IFRS or generally accepted accounting principles in the United States (“US GAAP”), with adjustments for four specified items as applicable. Please refer to “Unification of Accounting Policies Applied to Overseas Subsidiaries for Consolidated Financial Statements” below for details. The accompanying consolidated financial statements have been restructured and translated into English (with some expanded descriptions) from the consolidated financial statements of the Company prepared in accordance with Japanese GAAP and filed with the appropriate Local Finance Bureau of the Ministry of Finance as required by the Financial Instruments and Exchange Law. Some supplementary information included in the Japanese language statutory consolidated financial statements, but not required for fair presentation, is not presented in the accompanying consolidated financial statements. The consolidated financial statements are stated in Japanese yen, the currency of the country in which the Company is incorporated and operates. The translations of the Japanese yen amounts into U.S. dollars are includ-ed solely for the convenience of readers outside Japan, using the prevailing exchange rate at March 31, 2016, which was ¥112.68 to U.S. $1.00. The convenience translations should not be construed as representations that the Japanese yen amounts have been, could have been, or could in the future be converted into U.S. dollars at this or any other rate of exchange.
2. Significant Accounting PoliciesConsolidation—The consolidated financial statements include the accounts of the Company and its consolidated subsidiaries (52 subsidiaries in 2016 and 55 subsidiaries in 2015). For the purposes of preparing the consolidated financial statements, all significant intercompany balances, transactions and unrealized profits have been eliminated. In accordance with the Accounting Principles for Consolidated Financial Statements (the “Accounting Principles”), all companies are required to con-solidate all significant investees, which are controlled through substantial ownership of majority voting rights or the existence of certain conditions. The changes in the scope of consolidation are as follows: Due to completion of liquidation, Sandenvendo (UK) Ltd., Vendo (Europe) Inc., and Kunshan Zhenhua Refrigerating Machine Co., Ltd. were excluded from the scope of consolidation for the year ended March 31, 2016. Certain subsidiaries including Sanden Bright Partner Corporation are excluded from the scope of consolidation because the effect of their sales, net income or loss, total assets and retained earnings on the accompanying consolidated financial statements are immaterial. Financial information of Tianjin Sanden Automotive Air-Conditioning Co., Ltd., Sanden Shanghai Refrigeration Co., Ltd., Sanden (Suzhou) Precision Parts Co., Ltd., Sanden Chongqing Automotive Air Conditioning Co., Ltd., Sanden Shanghai Environment Thermal Systems Corp., Sanden Mexicana,
S.A. de C.V., Consorcio Teksan, S.A. de C.V., Sanden Manufacturing Mexico S.A. de C.V. and Sanden Recursos Mexico SRL. de C.V. for the fiscal year ended December 31, 2015 is included for the purpose of preparing the con-solidated financial statements, with necessary adjustment for significant transactions that occurred during the period between December 31, 2015 and March 31, 2016.
Equity method—The equity method was applied to the investments in 8 affiliates in 2016 and 2015, by using financial statements for the fiscal years of each affiliate some of which differ from those of the Company. Investments in all other unconsolidated subsidiaries and affiliated companies including Sanpak Engineering Industries (PVT) Ltd. are stated at acquisition cost. These companies are not accounted for using the equity method, due to their imma-terial impact on the consolidated net income and consolidated retained earn-ings. Earnings of such companies are recorded in the Company’s books only to the extent that cash dividends are received.
Allowance for doubtful accounts—Under Japanese accounting standards for financial instruments, allowance for doubtful accounts provided by the Company and its domestic subsidiaries consists of the estimated uncollect-ible amount with respect to identified doubtful receivables and an amount calculated using an experienced rate with respect to the remaining receivables. Consolidated overseas subsidiaries have provided an allowance for doubtful accounts at the estimated amounts of possible losses.
Inventories—Inventories are principally stated at the weighted-average cost, unless the market value of inventories declines significantly and the cost is not expected to be recovered. In such cases, cost is reduced to net realiz-able value.
Investment securities—Investment securities held by the Company and its consolidated subsidiaries are classified as: a) equity securities issued by unconsolidated subsidiaries and affiliated companies and b) available-for-sale securities. The Company and its consolidated subsidiaries do not hold trading securities or held-to-maturity debt securities. Equity securities issued by unconsolidated subsidiaries and affiliated companies that are not accounted for using the equity method are stated at acquisition cost and written down to its impaired value if an indication of impairment is present and the fair value is less than the cost. Available-for-sale securities for which fair value is readily determinable are stated at market value. Unrealized gains or losses, net of taxes are posted in a separate component of net assets. Available-for-sale securities for which fair value is not readily determinable are stated at cost. Those available-for-sale securities which are significantly impaired are written down to an estimated realizable value regardless whether the fair value is readily determinable or not. Gains and losses on sales of available-for-sale securities are determined by using the moving average method.
Derivatives and hedges—Derivative financial instruments are stated at fair value and changes in the fair value are recognized as gains and losses in the consolidated statements of income.
Sanden Holdings Corporation 21
If derivative financial instruments are used as hedges and meet certain hedging criteria, the gains or losses resulting from changes in the fair value of the derivatives are recorded in accumulated comprehensive income in the consolidated balance sheets until the related gains and losses on the hedged items are recognized. If interest rate swaps used by the Company and its consolidated domestic subsidiaries meet certain hedge criteria, the net settlement of interest under such interest rate swaps is reported as a component of interest on related hedged assets or liabilities (the “Exceptional method”). The Company and its consolidated subsidiaries use forward exchange contracts, currency swaps, interest rate swaps and commodity swaps mainly for the purpose of mitigating (i) fluctuation risk of foreign currency exchange rates with respect to receivables in foreign currency and future transactions in foreign currency, (ii) fluctuation risk of interest rates with respect to long-term debt, and (iii) fluctuation risk of commodity prices of raw materials. The Company and its consolidated subsidiaries evaluate hedge effective-ness annually by comparing the cumulative changes in fair value of hedged items with the corresponding changes in the hedging derivatives, except for interest rate swaps to which the Exceptional method applies.
Property, plant and equipment—Property, plant and equipment are stated at cost. Depreciation is computed using the straight-line method. For the Company and its consolidated domestic subsidiaries, depreciation of assets whose acquisition costs are between ¥100 thousand and ¥200 thousand is provided using the straight-line method over three years. Estimated useful lives are as follows: Buildings and structures 8 to 50 years Machinery and equipment 3 to 13 years
Goodwill and intangible assets—Goodwill is amortized over a period of five years using the straight-line method. Intangible assets are amortized using the straight-line method over the estimated useful lives.
Long-lived assets impairment—Long-lived assets are reviewed for impairment whenever events or changes in circumstances indicate the carry-ing amount of an asset or asset group may not be recoverable. An impair-ment loss is recognized if the carrying amount of an asset or asset group exceeds the sum of the undiscounted future cash flows expected to result from the continued use and eventual disposition of the asset or asset group. The impairment loss is measured as the amount by which the carrying amount of an asset or asset group exceeds its recoverable amount, which is the higher of the discounted cash flows from the continued use and eventual disposition of the asset or asset group or the net selling price at disposition. The impairment of assets for certain overseas subsidiaries is accounted for in accordance with either International Financial Reporting Standards or gener-ally accepted accounting principles in the United States, which requires long-lived assets and certain identifiable intangibles to be held and used by an entity to be reviewed for impairment whenever events of changes in circum-stances indicate that the carrying amount of an asset may not be recoverable.
Accounting for lease transactions as lessee—For the finance leases that do not transfer ownership, the Company and its consolidated subsidiar-ies account for them in the same manner as usual acquisitions. Depreciation of leased assets is computed using the straight-line method over the lease period with zero residual value.
Income taxes—The provision for income taxes is computed based on pretax income included in the consolidated statements of income. Deferred tax assets and liabilities are recognized for the expected future tax conse-quences of temporary differences between the accounting and tax basis of assets and liabilities. A valuation allowance is recorded to reduce deferred tax assets to the extent that it is no longer probable that relevant tax benefit will be realized.
Retirement benefits—The Company’s consolidated subsidiaries have adopted the benefit formula basis for calculation of projected benefit obliga-tion incurred in the current fiscal year. Prior service costs are recognized in the consolidated statements of income using the straight-line method begin-ning from the fiscal year in which they are incurred, over years within average residual periods of service of employees. Actuarial gains and losses are recognized in the consolidated statements of income using the straight-line method beginning from the next fiscal year after the year in which they are incurred, over years within the average residual periods of service of employ-ees. The Company recognizes actuarial gains and losses in the fiscal year when they are incurred.
Provision for directors’ stock compensation—Provision for directors’ stock compensation represents the amounts for future payments of the Company’s stock to directors. The provision is recognized based on the amount that is expected to be paid, which is determined using the points allocated to each director as prescribed in the Company’s share delivery policy.
Foreign currency translation—Under Japanese GAAP, all receivables and payables denominated in foreign currencies are translated at the exchange rate prevailing at the year-end, and differences arising from translation are included in the consolidated statements of income.
Translation of financial statements of overseas subsidiaries—The balance sheet accounts of overseas subsidiaries and affiliated companies are translated into Japanese yen at the year-end rates. Annual revenue and expense accounts are accumulated amounts of quarterly figures that are translated at the quarterly average rates of exchange. The increase and decrease in net assets resulting from this translation procedure were reported as foreign currency translation adjustments in other comprehensive income and non-controlling interests in consolidated subsidiaries.
Unification of Accounting Policies Applied to Overseas Subsidiaries for Consolidated Financial Statements—The Company adopted Practical Issues Task Force No. 18, entitled the “Practical Solution on Unification of Accounting Policies Applied to Overseas Subsidiaries for Consolidated Financial Statements” (as amended on March 26, 2015, “PITF No. 18”). PITF No. 18 provides as follows: 1) the accounting policies and procedures applied to a parent company and its subsidiaries for similar transactions and events under similar circumstances should, in principle, be unified for the preparation of the consolidated financial statements; 2) financial statements prepared by overseas subsidiaries in accordance with either IFRS or US GAAP tentatively may be used for the consolidation process; and 3) the following items should be adjusted in the consolidation process so that net income is accounted for in accordance with Japanese GAAP unless they are not material:
22 Annual Report 2016

(i) Amortization of goodwill(ii) Actuarial gain and loss of defined benefit plans recognized outside profit
or loss(iii) Capitalization of intangible assets arising from development phases(iv) Fair value measurement of investment properties and the revaluation
model for property, plant and equipment, and intangible assets
Consolidated statements of cash flows—In preparing the consolidated statements of cash flows, cash on hand, readily available deposits and highly liquid short-term investments with maturities not exceeding three months at the time of purchase are considered to be cash and cash equivalents.
Amounts per share—Basic net income per share of common stock is com-puted using the weighted-average number of shares of common stock out-standing during the year. Diluted net income per share of common stock is computed using the weighted-average number of shares of common stock outstanding during the year after giving effect to the dilutive potential of the shares of common stock to be issued upon the exercise of warrants. Cash dividends per share represent actual amounts declared as applicable to the respective years.
Revenue recognition—The Company and its consolidated domestic sub-sidiaries generate revenue principally through the sales of finished products. In the Automotive Systems Business and the Other Business, sales revenue is recognized when products are shipped and the customer takes ownership. In the Commercial Store Systems Business, sales revenue is principally recog-nized when products are shipped. However, certain products require installa-tion by the Company and its consolidated domestic subsidiaries and, in such cases, sales revenue is recognized when the installation is completed.
Reclassifications—Certain previous year amounts have been reclassified to conform to the 2016 presentation to reflect the changes of importance on some accounts. This reclassification had no impact on previously reported results of operations or retained earnings.
Change in accounting policies(Adoption of revised accounting standards for business combinations in the fiscal year ended March 31, 2016)Effective from the fiscal year ended March 31, 2016, the Company and its consolidated domestic subsidiaries have applied “Revised Accounting Standard for Business Combinations” (Accounting Standards Board of Japan (“ASBJ”) Statement No. 21, September 13, 2013 (hereinafter, “Statement No. 21”)), “Revised Accounting Standard for Consolidated Financial Statements” (ASBJ Statement No. 22, September 13, 2013 (hereinafter, “Statement No. 22”)) and “Revised Accounting Standard for Business Divestitures” (ASBJ Statement No. 7, September 13, 2013 (hereinafter, “Statement No. 7”)) (together, the “Business Combination Accounting Standards”). As a result, the Company changed its accounting policies to recognize in capital surplus the differences arising from the changes in the Company’s ownership interest of subsidiaries over which the Company continues to maintain control and to record acquisition related costs as expenses in the fiscal year in which the costs are incurred. In addition, the Company changed its accounting policy for the reallocation of acquisition costs due to the completion following provi-sional accounting to reflect such reallocation in the consolidated financial
statements for the fiscal year in which the business combination took place. The Company also changed the presentation of net income and the term “non-controlling interests” is used instead of “minority interests”. Certain amounts in the prior year comparative information were reclassified to conform to such changes in the current year presentation. With regard to the application of the Business Combination Accounting Standards, the Company followed the provisional treatments in Article 58-2 (4) of Statement No. 21, Article 44-5 (4) of Statement No. 22 and Article 57-4 (4) of Statement No. 7 with application from the beginning of the fiscal year ended March 31, 2016 prospectively. As a result of the above application, capital surplus as of March 31, 2016 decreased by ¥731 million ($6,487 thousand). Impact of this change on income before income taxes for the fiscal year ended March 31, 2016 is immaterial. In the consolidated statement of cash flows, cash flows from acquisition or disposal of shares of subsidiaries with no changes in the scope of consolida-tion are included in “Cash flows from financing activities” and cash flows from acquisition related costs for shares of subsidiaries with changes in the scope of consolidation or costs related to acquisition or disposal of shares of subsidiaries with no changes in the scope of consolidation are included in “Cash flows from operating activities”. Capital surplus in the consolidated statement of changes in net assets as of March 31, 2016 decreased by ¥731 million ($6,487 thousand). In addition, impact on per share information is disclosed in “16. Earnings per Share.”
Additional information(Stock remuneration plan for directors)Based on a resolution by the meeting of the board of directors on August 7, 2015, the Company introduced a performance-linked stock compensation scheme, which employs a scheme referred to as the “Executive Compensation BIP Trust” (hereinafter, the “BIP”), for directors and corporate officers who have entered into an engagement agreement with the Company (excluding directors and corporate officers residing overseas, outside direc-tors and part-time directors) (hereinafter, “Directors”), for the purpose of increasing their awareness of contributing to the growth in business results and corporate value in the medium-to-long term. Accounting treatment of the trust is in line with the “Practical Solution on Transactions of Delivering the Company’s Own Stock to Employees, etc. through Trusts” (ASBJ Practical Issues Task Force No. 30, March 26, 2015).(1) Overview of the transactionThe Company entrusts money equivalent to remuneration of Directors under the BIP. The Company’s shares will be acquired using the entrusted money and delivered to Directors based on the attainment of management objectives and their rank. Directors are eligible to receive the Company’s shares, in principle, when they retire.
(2) The remaining balance of the Company’s own stock in the trustsThe Company records the remaining balance of the Company’s own stock in the trusts as treasury stock in the section of net assets by the carrying amount (excluding the amount of ancillary expenses) in the trust. The carrying amount and the number of shares of such treasury stock as of March 31, 2016 are ¥478 million ($4,242 thousand) and 837,411 shares, respectively.
Sanden Holdings Corporation 23
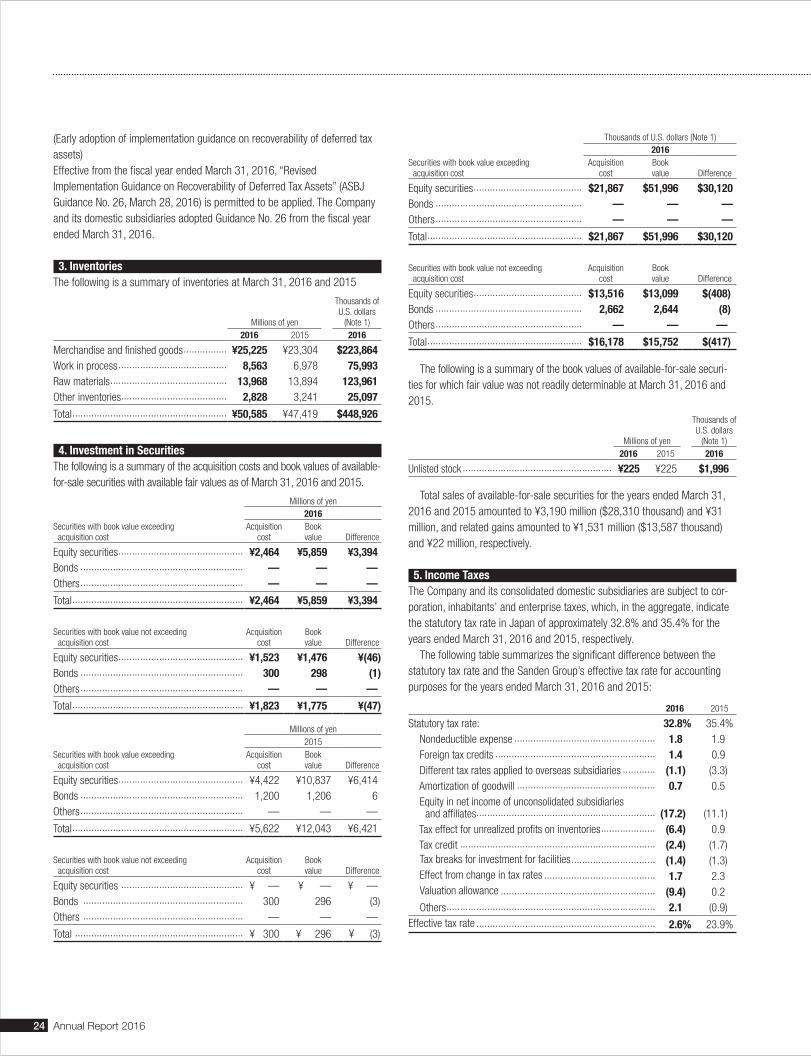
(Early adoption of implementation guidance on recoverability of deferred tax assets)Effective from the fiscal year ended March 31, 2016, “Revised Implementation Guidance on Recoverability of Deferred Tax Assets” (ASBJ Guidance No. 26, March 28, 2016) is permitted to be applied. The Company and its domestic subsidiaries adopted Guidance No. 26 from the fiscal year ended March 31, 2016.
3. InventoriesThe following is a summary of inventories at March 31, 2016 and 2015
Millions of yen
Thousands of U.S. dollars
(Note 1)2016 2015 2016
Merchandise and finished goods ................ ¥25,225 ¥23,304 $223,864Work in process ........................................ 8,563 6,978 75,993Raw materials ........................................... 13,968 13,894 123,961Other inventories ....................................... 2,828 3,241 25,097
Total ......................................................... ¥50,585 ¥47,419 $448,926
4. Investment in SecuritiesThe following is a summary of the acquisition costs and book values of available-for-sale securities with available fair values as of March 31, 2016 and 2015.
Millions of yen2016
Securities with book value exceeding acquisition cost
Acquisition cost
Book value Difference
Equity securities .............................................. ¥2,464 ¥5,859 ¥3,394Bonds ............................................................ — — —Others ............................................................ — — —
Total ............................................................... ¥2,464 ¥5,859 ¥3,394
Securities with book value not exceeding acquisition cost
Acquisition cost
Book value Difference
Equity securities .............................................. ¥1,523 ¥1,476 ¥(46)Bonds ............................................................ 300 298 (1)Others ............................................................ — — —
Total ............................................................... ¥1,823 ¥1,775 ¥(47)
Millions of yen2015
Securities with book value exceeding acquisition cost
Acquisition cost
Book value Difference
Equity securities .............................................. ¥4,422 ¥10,837 ¥6,414Bonds ............................................................ 1,200 1,206 6 Others ............................................................ — — —
Total ............................................................... ¥5,622 ¥12,043 ¥6,421
Securities with book value not exceeding acquisition cost
Acquisition cost
Book value Difference
Equity securities ............................................. ¥ — ¥ — ¥ —Bonds ........................................................... 300 296 (3)Others ........................................................... — — —
Total .............................................................. ¥ 300 ¥ 296 ¥ (3)
Thousands of U.S. dollars (Note 1)2016
Securities with book value exceeding acquisition cost
Acquisition cost
Book value Difference
Equity securities ........................................ $21,867 $51,996 $30,120Bonds ...................................................... — — —Others ...................................................... — — —
Total ......................................................... $21,867 $51,996 $30,120
Securities with book value not exceeding acquisition cost
Acquisition cost
Book value Difference
Equity securities ........................................ $13,516 $13,099 $(408)Bonds ...................................................... 2,662 2,644 (8)Others ...................................................... — — —
Total ......................................................... $16,178 $15,752 $(417)
The following is a summary of the book values of available-for-sale securi-ties for which fair value was not readily determinable at March 31, 2016 and 2015.
Millions of yen
Thousands of U.S. dollars
(Note 1)2016 2015 2016
Unlisted stock ....................................................... ¥225 ¥225 $1,996
Total sales of available-for-sale securities for the years ended March 31, 2016 and 2015 amounted to ¥3,190 million ($28,310 thousand) and ¥31 million, and related gains amounted to ¥1,531 million ($13,587 thousand) and ¥22 million, respectively.
5. Income TaxesThe Company and its consolidated domestic subsidiaries are subject to cor-poration, inhabitants’ and enterprise taxes, which, in the aggregate, indicate the statutory tax rate in Japan of approximately 32.8% and 35.4% for the years ended March 31, 2016 and 2015, respectively. The following table summarizes the significant difference between the statutory tax rate and the Sanden Group’s effective tax rate for accounting purposes for the years ended March 31, 2016 and 2015:
2016 2015
Statutory tax rate: 32.8% 35.4% Nondeductible expense .................................................... 1.8 1.9 Foreign tax credits ........................................................... 1.4 0.9 Different tax rates applied to overseas subsidiaries ............ (1.1) (3.3) Amortization of goodwill ................................................... 0.7 0.5 Equity in net income of unconsolidated subsidiaries
and affiliates.................................................................. (17.2) (11.1) Tax effect for unrealized profits on inventories .................... (6.4) 0.9 Tax credit ........................................................................ (2.4) (1.7) Tax breaks for investment for facilities ............................... (1.4) (1.3) Effect from change in tax rates ......................................... 1.7 2.3 Valuation allowance ......................................................... (9.4) 0.2 Others ............................................................................. 2.1 (0.9)Effective tax rate .................................................................. 2.6% 23.9%
24 Annual Report 2016
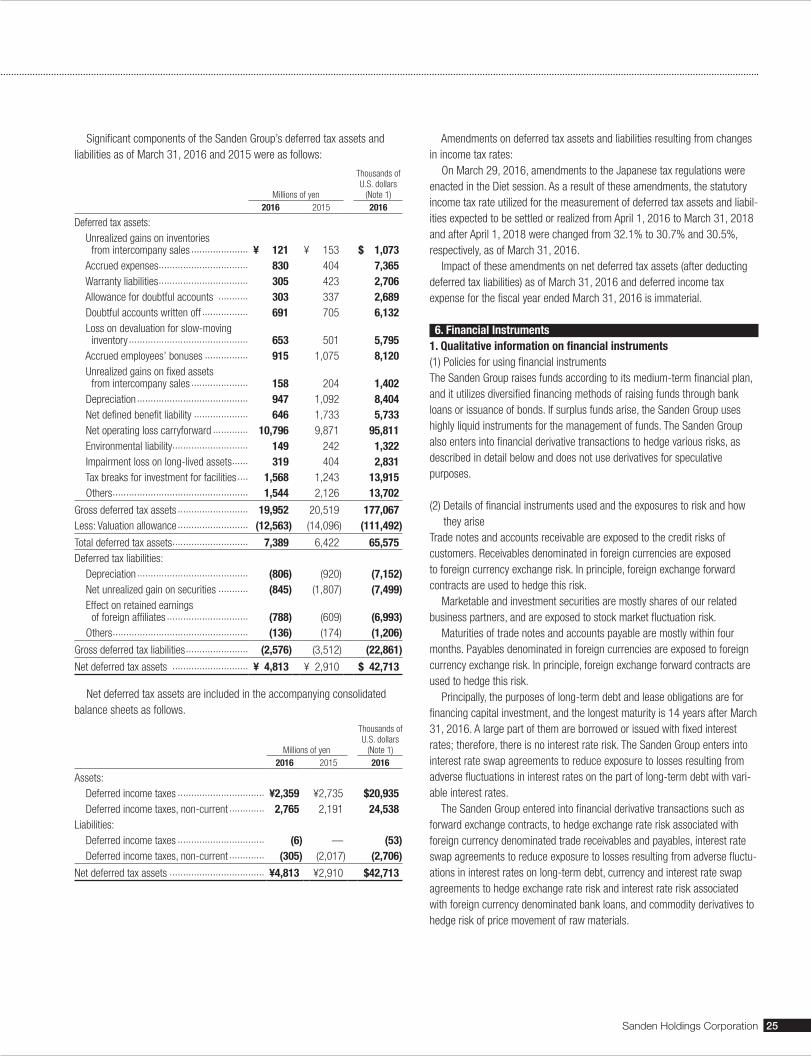
Significant components of the Sanden Group’s deferred tax assets and liabilities as of March 31, 2016 and 2015 were as follows:
Millions of yen
Thousands of U.S. dollars
(Note 1)2016 2015 2016
Deferred tax assets: Unrealized gains on inventories
from intercompany sales ..................... ¥ 121 ¥ 153 $ 1,073 Accrued expenses ................................. 830 404 7,365 Warranty liabilities ................................. 305 423 2,706 Allowance for doubtful accounts ........... 303 337 2,689 Doubtful accounts written off ................. 691 705 6,132 Loss on devaluation for slow-moving
inventory ............................................ 653 501 5,795 Accrued employees’ bonuses ................ 915 1,075 8,120 Unrealized gains on fixed assets
from intercompany sales ..................... 158 204 1,402 Depreciation ......................................... 947 1,092 8,404 Net defined benefit liability .................... 646 1,733 5,733 Net operating loss carryforward ............. 10,796 9,871 95,811 Environmental liability............................ 149 242 1,322 Impairment loss on long-lived assets ...... 319 404 2,831 Tax breaks for investment for facilities .... 1,568 1,243 13,915 Others .................................................. 1,544 2,126 13,702
Gross deferred tax assets .......................... 19,952 20,519 177,067Less: Valuation allowance .......................... (12,563) (14,096) (111,492)
Total deferred tax assets ............................ 7,389 6,422 65,575Deferred tax liabilities: Depreciation ......................................... (806) (920) (7,152) Net unrealized gain on securities ........... (845) (1,807) (7,499) Effect on retained earnings
of foreign affiliates .............................. (788) (609) (6,993) Others .................................................. (136) (174) (1,206)
Gross deferred tax liabilities ....................... (2,576) (3,512) (22,861)
Net deferred tax assets ............................ ¥ 4,813 ¥ 2,910 $ 42,713
Net deferred tax assets are included in the accompanying consolidated balance sheets as follows.
Millions of yen
Thousands of U.S. dollars
(Note 1)2016 2015 2016
Assets: Deferred income taxes ................................ ¥2,359 ¥2,735 $20,935 Deferred income taxes, non-current ............. 2,765 2,191 24,538Liabilities: Deferred income taxes ................................ (6) — (53) Deferred income taxes, non-current ............. (305) (2,017) (2,706)
Net deferred tax assets ................................... ¥4,813 ¥2,910 $42,713
Amendments on deferred tax assets and liabilities resulting from changes in income tax rates: On March 29, 2016, amendments to the Japanese tax regulations were enacted in the Diet session. As a result of these amendments, the statutory income tax rate utilized for the measurement of deferred tax assets and liabil-ities expected to be settled or realized from April 1, 2016 to March 31, 2018 and after April 1, 2018 were changed from 32.1% to 30.7% and 30.5%, respectively, as of March 31, 2016. Impact of these amendments on net deferred tax assets (after deducting deferred tax liabilities) as of March 31, 2016 and deferred income tax expense for the fiscal year ended March 31, 2016 is immaterial.
6. Financial Instruments1. Qualitative information on financial instruments(1) Policies for using financial instrumentsThe Sanden Group raises funds according to its medium-term financial plan, and it utilizes diversified financing methods of raising funds through bank loans or issuance of bonds. If surplus funds arise, the Sanden Group uses highly liquid instruments for the management of funds. The Sanden Group also enters into financial derivative transactions to hedge various risks, as described in detail below and does not use derivatives for speculative purposes.
(2) Details of financial instruments used and the exposures to risk and how they arise
Trade notes and accounts receivable are exposed to the credit risks of customers. Receivables denominated in foreign currencies are exposed to foreign currency exchange risk. In principle, foreign exchange forward contracts are used to hedge this risk. Marketable and investment securities are mostly shares of our related business partners, and are exposed to stock market fluctuation risk. Maturities of trade notes and accounts payable are mostly within four months. Payables denominated in foreign currencies are exposed to foreign currency exchange risk. In principle, foreign exchange forward contracts are used to hedge this risk. Principally, the purposes of long-term debt and lease obligations are for financing capital investment, and the longest maturity is 14 years after March 31, 2016. A large part of them are borrowed or issued with fixed interest rates; therefore, there is no interest rate risk. The Sanden Group enters into interest rate swap agreements to reduce exposure to losses resulting from adverse fluctuations in interest rates on the part of long-term debt with vari-able interest rates. The Sanden Group entered into financial derivative transactions such as forward exchange contracts, to hedge exchange rate risk associated with foreign currency denominated trade receivables and payables, interest rate swap agreements to reduce exposure to losses resulting from adverse fluctu-ations in interest rates on long-term debt, currency and interest rate swap agreements to hedge exchange rate risk and interest rate risk associated with foreign currency denominated bank loans, and commodity derivatives to hedge risk of price movement of raw materials.
Sanden Holdings Corporation 25
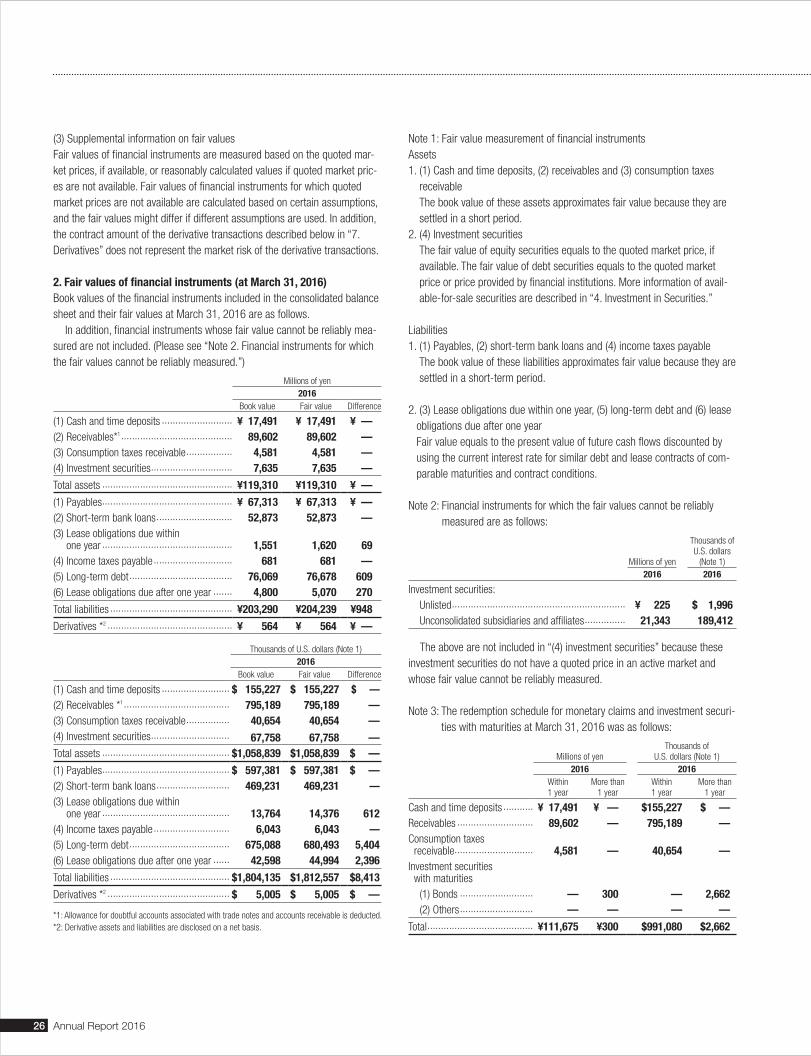
Note 1: Fair value measurement of financial instrumentsAssets1. (1) Cash and time deposits, (2) receivables and (3) consumption taxes
receivable The book value of these assets approximates fair value because they are settled in a short period.
2. (4) Investment securities The fair value of equity securities equals to the quoted market price, if available. The fair value of debt securities equals to the quoted market price or price provided by financial institutions. More information of avail-able-for-sale securities are described in “4. Investment in Securities.”
Liabilities1. (1) Payables, (2) short-term bank loans and (4) income taxes payable
The book value of these liabilities approximates fair value because they are settled in a short-term period.
2. (3) Lease obligations due within one year, (5) long-term debt and (6) lease obligations due after one year Fair value equals to the present value of future cash flows discounted by using the current interest rate for similar debt and lease contracts of com-parable maturities and contract conditions.
Note 2: Financial instruments for which the fair values cannot be reliably measured are as follows:
Millions of yen
Thousands of U.S. dollars
(Note 1)2016 2016
Investment securities: Unlisted ................................................................ ¥ 225 $ 1,996 Unconsolidated subsidiaries and affiliates ............... 21,343 189,412
The above are not included in “(4) investment securities” because these investment securities do not have a quoted price in an active market and whose fair value cannot be reliably measured.
Note 3: The redemption schedule for monetary claims and investment securi-ties with maturities at March 31, 2016 was as follows:
Millions of yenThousands of
U.S. dollars (Note 1)2016 2016
Within1 year
More than1 year
Within1 year
More than1 year
Cash and time deposits ........... ¥ 17,491 ¥ — $155,227 $ —Receivables ............................ 89,602 — 795,189 —Consumption taxes receivable ............................. 4,581 — 40,654 —Investment securities with maturities (1) Bonds ........................... — 300 — 2,662 (2) Others ........................... — — — —
Total ....................................... ¥111,675 ¥300 $991,080 $2,662
(3) Supplemental information on fair valuesFair values of financial instruments are measured based on the quoted mar-ket prices, if available, or reasonably calculated values if quoted market pric-es are not available. Fair values of financial instruments for which quoted market prices are not available are calculated based on certain assumptions, and the fair values might differ if different assumptions are used. In addition, the contract amount of the derivative transactions described below in “7. Derivatives” does not represent the market risk of the derivative transactions.
2. Fair values of financial instruments (at March 31, 2016)Book values of the financial instruments included in the consolidated balance sheet and their fair values at March 31, 2016 are as follows. In addition, financial instruments whose fair value cannot be reliably mea-sured are not included. (Please see “Note 2. Financial instruments for which the fair values cannot be reliably measured.”)
Millions of yen2016
Book value Fair value Difference
(1) Cash and time deposits .......................... ¥ 17,491 ¥ 17,491 ¥ —(2) Receivables*1 ......................................... 89,602 89,602 —(3) Consumption taxes receivable ................. 4,581 4,581 —(4) Investment securities .............................. 7,635 7,635 —
Total assets ................................................ ¥119,310 ¥119,310 ¥ —
(1) Payables ................................................ ¥ 67,313 ¥ 67,313 ¥ —(2) Short-term bank loans ............................ 52,873 52,873 —(3) Lease obligations due within
one year ................................................ 1,551 1,620 69(4) Income taxes payable ............................. 681 681 —(5) Long-term debt ...................................... 76,069 76,678 609(6) Lease obligations due after one year ....... 4,800 5,070 270
Total liabilities ............................................. ¥203,290 ¥204,239 ¥948
Derivatives *2 .............................................. ¥ 564 ¥ 564 ¥ —
Thousands of U.S. dollars (Note 1)2016
Book value Fair value Difference
(1) Cash and time deposits ......................... $ 155,227 $ 155,227 $ —(2) Receivables *1 ....................................... 795,189 795,189 —(3) Consumption taxes receivable ................ 40,654 40,654 —(4) Investment securities ............................. 67,758 67,758 —Total assets ............................................... $1,058,839 $1,058,839 $ —
(1) Payables ............................................... $ 597,381 $ 597,381 $ —(2) Short-term bank loans ........................... 469,231 469,231 —(3) Lease obligations due within
one year ............................................... 13,764 14,376 612(4) Income taxes payable ............................ 6,043 6,043 —(5) Long-term debt ..................................... 675,088 680,493 5,404(6) Lease obligations due after one year ...... 42,598 44,994 2,396
Total liabilities ............................................ $1,804,135 $1,812,557 $8,413
Derivatives *2 ............................................. $ 5,005 $ 5,005 $ —
*1: Allowance for doubtful accounts associated with trade notes and accounts receivable is deducted.*2: Derivative assets and liabilities are disclosed on a net basis.
26 Annual Report 2016
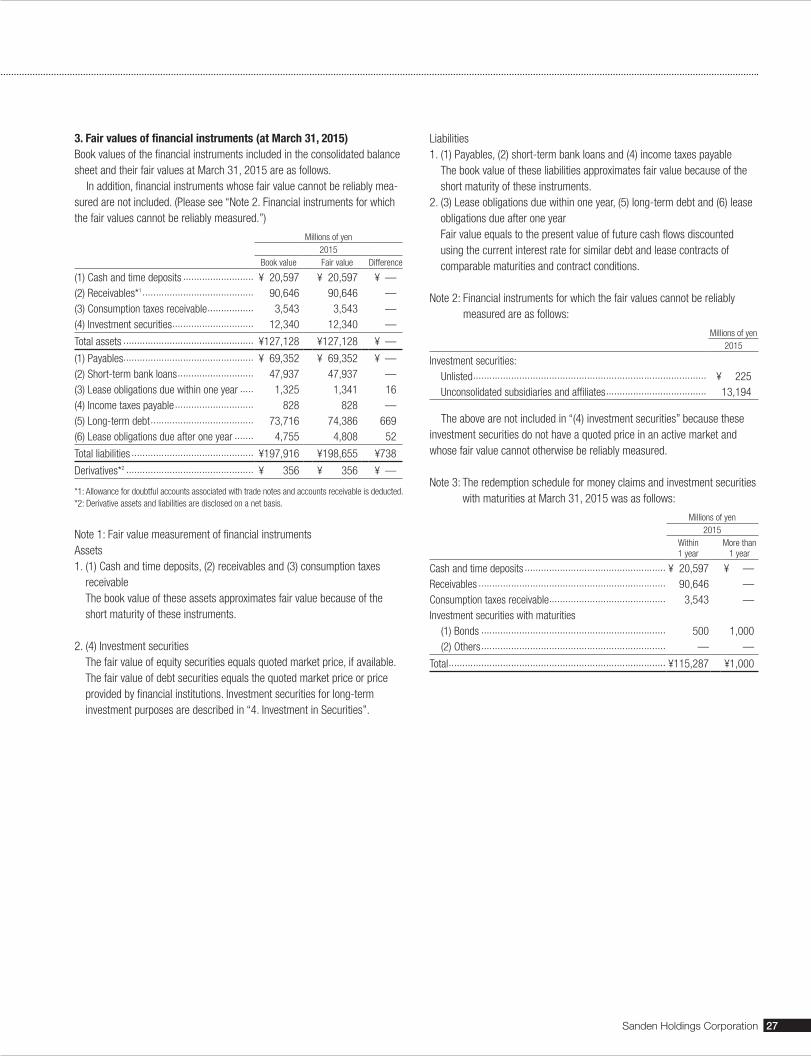
3. Fair values of financial instruments (at March 31, 2015)Book values of the financial instruments included in the consolidated balance sheet and their fair values at March 31, 2015 are as follows. In addition, financial instruments whose fair value cannot be reliably mea-sured are not included. (Please see “Note 2. Financial instruments for which the fair values cannot be reliably measured.”)
Millions of yen2015
Book value Fair value Difference
(1) Cash and time deposits .......................... ¥ 20,597 ¥ 20,597 ¥ —(2) Receivables*1 ......................................... 90,646 90,646 —(3) Consumption taxes receivable ................. 3,543 3,543 —(4) Investment securities .............................. 12,340 12,340 —
Total assets ................................................ ¥127,128 ¥127,128 ¥ —
(1) Payables ................................................ ¥ 69,352 ¥ 69,352 ¥ —(2) Short-term bank loans ............................ 47,937 47,937 —(3) Lease obligations due within one year ..... 1,325 1,341 16(4) Income taxes payable ............................. 828 828 —(5) Long-term debt ...................................... 73,716 74,386 669(6) Lease obligations due after one year ....... 4,755 4,808 52
Total liabilities ............................................. ¥197,916 ¥198,655 ¥738
Derivatives*2 ............................................... ¥ 356 ¥ 356 ¥ —
*1: Allowance for doubtful accounts associated with trade notes and accounts receivable is deducted.*2: Derivative assets and liabilities are disclosed on a net basis.
Note 1: Fair value measurement of financial instrumentsAssets1. (1) Cash and time deposits, (2) receivables and (3) consumption taxes
receivable The book value of these assets approximates fair value because of the short maturity of these instruments.
2. (4) Investment securities The fair value of equity securities equals quoted market price, if available. The fair value of debt securities equals the quoted market price or price provided by financial institutions. Investment securities for long-term investment purposes are described in “4. Investment in Securities”.
Liabilities1. (1) Payables, (2) short-term bank loans and (4) income taxes payable
The book value of these liabilities approximates fair value because of the short maturity of these instruments.
2. (3) Lease obligations due within one year, (5) long-term debt and (6) lease obligations due after one year Fair value equals to the present value of future cash flows discounted using the current interest rate for similar debt and lease contracts of comparable maturities and contract conditions.
Note 2: Financial instruments for which the fair values cannot be reliably measured are as follows:
Millions of yen2015
Investment securities: Unlisted ...................................................................................... ¥ 225 Unconsolidated subsidiaries and affiliates ..................................... 13,194
The above are not included in “(4) investment securities” because these investment securities do not have a quoted price in an active market and whose fair value cannot otherwise be reliably measured.
Note 3: The redemption schedule for money claims and investment securities with maturities at March 31, 2015 was as follows:
Millions of yen2015
Within1 year
More than1 year
Cash and time deposits .................................................... ¥ 20,597 ¥ —Receivables ..................................................................... 90,646 —Consumption taxes receivable ........................................... 3,543 —Investment securities with maturities (1) Bonds .................................................................... 500 1,000 (2) Others .................................................................... — —
Total ................................................................................ ¥115,287 ¥1,000
Sanden Holdings Corporation 27
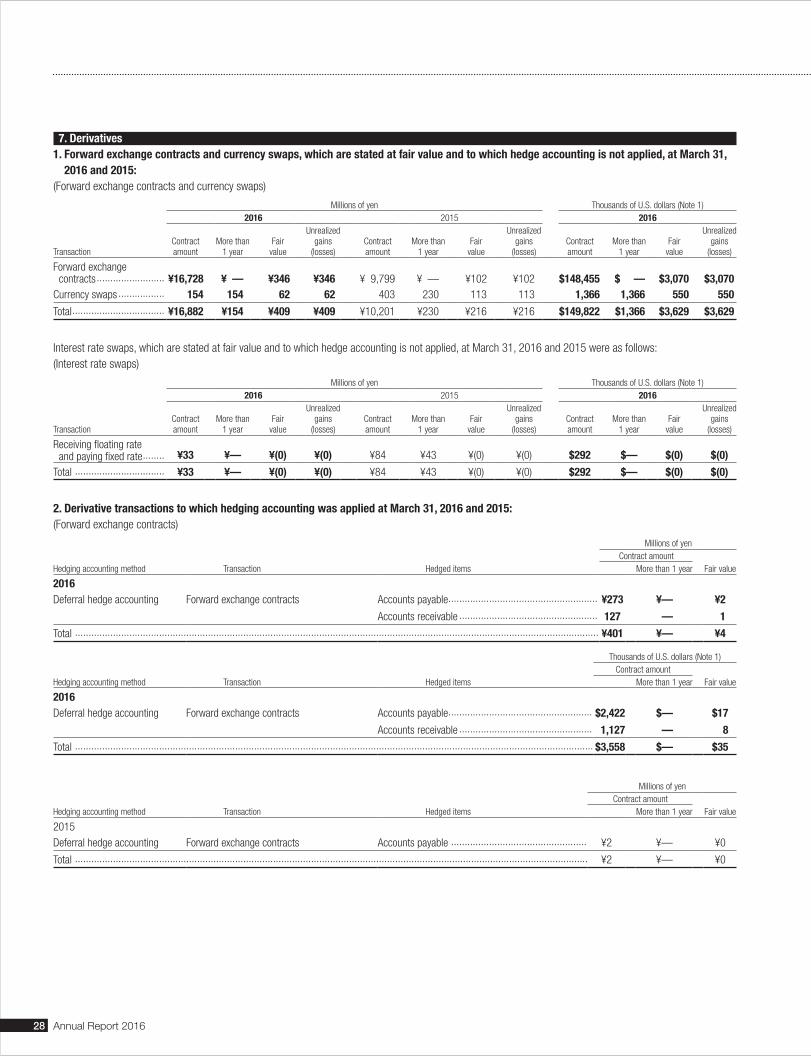
7. Derivatives1. Forward exchange contracts and currency swaps, which are stated at fair value and to which hedge accounting is not applied, at March 31,
2016 and 2015:(Forward exchange contracts and currency swaps)
Millions of yen Thousands of U.S. dollars (Note 1)2016 2015 2016
TransactionContract amount
More than 1 year
Fair value
Unrealized gains
(losses)Contract amount
More than 1 year
Fair value
Unrealized gains
(losses)Contract amount
More than 1 year
Fair value
Unrealized gains
(losses)
Forward exchange contracts ......................... ¥16,728 ¥ — ¥346 ¥346 ¥ 9,799 ¥ — ¥102 ¥102 $148,455 $ — $3,070 $3,070Currency swaps ................. 154 154 62 62 403 230 113 113 1,366 1,366 550 550
Total .................................. ¥16,882 ¥154 ¥409 ¥409 ¥10,201 ¥230 ¥216 ¥216 $149,822 $1,366 $3,629 $3,629
Interest rate swaps, which are stated at fair value and to which hedge accounting is not applied, at March 31, 2016 and 2015 were as follows:(Interest rate swaps)
Millions of yen Thousands of U.S. dollars (Note 1)2016 2015 2016
TransactionContract amount
More than 1 year
Fair value
Unrealized gains
(losses)Contract amount
More than 1 year
Fair value
Unrealized gains
(losses)Contract amount
More than 1 year
Fair value
Unrealized gains
(losses)
Receiving floating rate and paying fixed rate ........ ¥33 ¥— ¥(0) ¥(0) ¥84 ¥43 ¥(0) ¥(0) $292 $— $(0) $(0)
Total ................................. ¥33 ¥— ¥(0) ¥(0) ¥84 ¥43 ¥(0) ¥(0) $292 $— $(0) $(0)
2. Derivative transactions to which hedging accounting was applied at March 31, 2016 and 2015:(Forward exchange contracts)
Millions of yenContract amount
Fair valueHedging accounting method Transaction Hedged items More than 1 year
2016Deferral hedge accounting Forward exchange contracts
Accounts payable ....................................................... ¥273 ¥— ¥2
Accounts receivable ................................................... 127 — 1
Total ................................................................................................................................................................................................. ¥401 ¥— ¥4
Thousands of U.S. dollars (Note 1)Contract amount
Fair valueHedging accounting method Transaction Hedged items More than 1 year
2016Deferral hedge accounting Forward exchange contracts Accounts payable ..................................................... $2,422 $— $17
Accounts receivable ................................................. 1,127 — 8
Total ............................................................................................................................................................................................... $3,558 $— $35
Millions of yenContract amount
Fair valueHedging accounting method Transaction Hedged items More than 1 year
2015Deferral hedge accounting Forward exchange contracts Accounts payable .................................................. ¥2 ¥— ¥0
Total ............................................................................................................................................................................................. ¥2 ¥— ¥0
28 Annual Report 2016
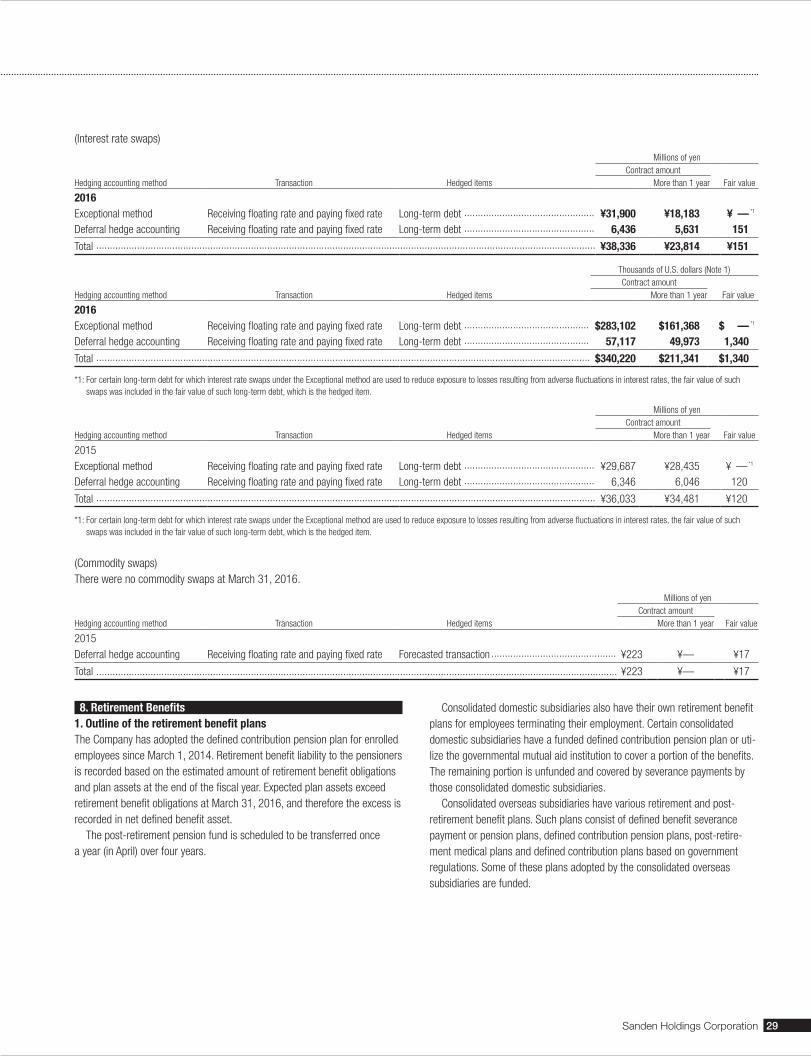
(Interest rate swaps)
Millions of yenContract amount
Fair valueHedging accounting method Transaction Hedged items More than 1 year
2016Exceptional method Receiving floating rate and paying fixed rate Long-term debt ................................................ ¥31,900 ¥18,183 *1¥ —Deferral hedge accounting Receiving floating rate and paying fixed rate Long-term debt ................................................ 6,436 5,631 151
Total ........................................................................................................................................................................................ ¥38,336 ¥23,814 ¥151
Thousands of U.S. dollars (Note 1)Contract amount
Fair valueHedging accounting method Transaction Hedged items More than 1 year
2016Exceptional method Receiving floating rate and paying fixed rate Long-term debt .............................................. $283,102 $161,368 *1$ —Deferral hedge accounting Receiving floating rate and paying fixed rate Long-term debt .............................................. 57,117 49,973 1,340
Total ...................................................................................................................................................................................... $340,220 $211,341 $1,340
*1: For certain long-term debt for which interest rate swaps under the Exceptional method are used to reduce exposure to losses resulting from adverse fluctuations in interest rates, the fair value of such swaps was included in the fair value of such long-term debt, which is the hedged item.
Millions of yenContract amount
Fair valueHedging accounting method Transaction Hedged items More than 1 year
2015Exceptional method Receiving floating rate and paying fixed rate Long-term debt ................................................ ¥29,687 ¥28,435 *1¥ —Deferral hedge accounting Receiving floating rate and paying fixed rate Long-term debt ................................................ 6,346 6,046 120
Total ........................................................................................................................................................................................ ¥36,033 ¥34,481 ¥120
*1: For certain long-term debt for which interest rate swaps under the Exceptional method are used to reduce exposure to losses resulting from adverse fluctuations in interest rates, the fair value of such swaps was included in the fair value of such long-term debt, which is the hedged item.
(Commodity swaps)There were no commodity swaps at March 31, 2016.
Millions of yenContract amount
Fair valueHedging accounting method Transaction Hedged items More than 1 year
2015 Deferral hedge accounting Receiving floating rate and paying fixed rate Forecasted transaction .............................................. ¥223 ¥— ¥17
Total ................................................................................................................................................................................................ ¥223 ¥— ¥17
8. Retirement Benefits1. Outline of the retirement benefit plansThe Company has adopted the defined contribution pension plan for enrolled employees since March 1, 2014. Retirement benefit liability to the pensioners is recorded based on the estimated amount of retirement benefit obligations and plan assets at the end of the fiscal year. Expected plan assets exceed retirement benefit obligations at March 31, 2016, and therefore the excess is recorded in net defined benefit asset. The post-retirement pension fund is scheduled to be transferred once a year (in April) over four years.
Consolidated domestic subsidiaries also have their own retirement benefit plans for employees terminating their employment. Certain consolidated domestic subsidiaries have a funded defined contribution pension plan or uti-lize the governmental mutual aid institution to cover a portion of the benefits. The remaining portion is unfunded and covered by severance payments by those consolidated domestic subsidiaries. Consolidated overseas subsidiaries have various retirement and post- retirement benefit plans. Such plans consist of defined benefit severance payment or pension plans, defined contribution pension plans, post-retire-ment medical plans and defined contribution plans based on government regulations. Some of these plans adopted by the consolidated overseas subsidiaries are funded.
Sanden Holdings Corporation 29
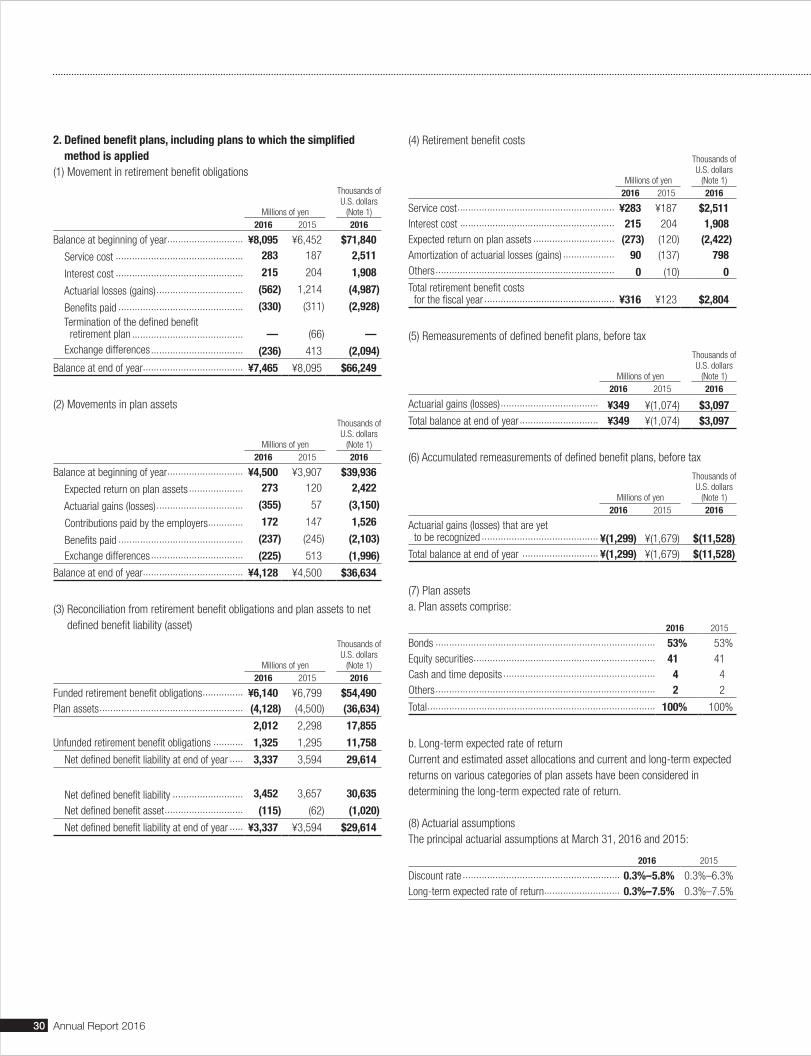
2. Defined benefit plans, including plans to which the simplified method is applied
(1) Movement in retirement benefit obligations
Millions of yen
Thousands of U.S. dollars
(Note 1)2016 2015 2016
Balance at beginning of year ............................ ¥8,095 ¥6,452 $71,840
Service cost ............................................... 283 187 2,511
Interest cost ............................................... 215 204 1,908
Actuarial losses (gains) ................................ (562) 1,214 (4,987)
Benefits paid .............................................. (330) (311) (2,928) Termination of the defined benefit
retirement plan ......................................... — (66) — Exchange differences .................................. (236) 413 (2,094)
Balance at end of year..................................... ¥7,465 ¥8,095 $66,249
(2) Movements in plan assets
Millions of yen
Thousands of U.S. dollars
(Note 1)2016 2015 2016
Balance at beginning of year ............................ ¥4,500 ¥3,907 $39,936
Expected return on plan assets .................... 273 120 2,422
Actuarial gains (losses) ................................ (355) 57 (3,150)
Contributions paid by the employers............. 172 147 1,526
Benefits paid .............................................. (237) (245) (2,103)
Exchange differences .................................. (225) 513 (1,996)
Balance at end of year..................................... ¥4,128 ¥4,500 $36,634
(3) Reconciliation from retirement benefit obligations and plan assets to net defined benefit liability (asset)
Millions of yen
Thousands of U.S. dollars
(Note 1)2016 2015 2016
Funded retirement benefit obligations ............... ¥6,140 ¥6,799 $54,490Plan assets ..................................................... (4,128) (4,500) (36,634)
2,012 2,298 17,855
Unfunded retirement benefit obligations ........... 1,325 1,295 11,758
Net defined benefit liability at end of year ..... 3,337 3,594 29,614
Net defined benefit liability .......................... 3,452 3,657 30,635
Net defined benefit asset ............................. (115) (62) (1,020)
Net defined benefit liability at end of year ..... ¥3,337 ¥3,594 $29,614
(4) Retirement benefit costs
Millions of yen
Thousands of U.S. dollars
(Note 1)2016 2015 2016
Service cost .......................................................... ¥283 ¥187 $2,511Interest cost ......................................................... 215 204 1,908Expected return on plan assets .............................. (273) (120) (2,422)Amortization of actuarial losses (gains) ................... 90 (137) 798Others .................................................................. 0 (10) 0Total retirement benefit costs for the fiscal year ................................................ ¥316 ¥123 $2,804
(5) Remeasurements of defined benefit plans, before tax
Millions of yen
Thousands of U.S. dollars
(Note 1)2016 2015 2016
Actuarial gains (losses) .................................... ¥349 ¥(1,074) $3,097Total balance at end of year ............................. ¥349 ¥(1,074) $3,097
(6) Accumulated remeasurements of defined benefit plans, before tax
Millions of yen
Thousands of U.S. dollars
(Note 1)2016 2015 2016
Actuarial gains (losses) that are yet to be recognized ........................................... ¥(1,299) ¥(1,679) $(11,528)Total balance at end of year ............................ ¥(1,299) ¥(1,679) $(11,528)
(7) Plan assetsa. Plan assets comprise:
2016 2015
Bonds ................................................................................. 53% 53%Equity securities ................................................................... 41 41Cash and time deposits ........................................................ 4 4Others ................................................................................. 2 2
Total .................................................................................... 100% 100%
b. Long-term expected rate of returnCurrent and estimated asset allocations and current and long-term expected returns on various categories of plan assets have been considered in determining the long-term expected rate of return.
(8) Actuarial assumptionsThe principal actuarial assumptions at March 31, 2016 and 2015:
2016 2015
Discount rate .......................................................... 0.3%–5.8% 0.3%–6.3%Long-term expected rate of return............................ 0.3%–7.5% 0.3%–7.5%
30 Annual Report 2016

consolidated financial statements of the Company which are prepared and presented in accordance with Japanese GAAP.
The Sanden Group continued to meet these financial covenants at March 31, 2016 and 2015. The following assets were pledged as collateral for short-term bank loans of ¥1,624 million ($14,412 thousand) and long-term debt of ¥2,853 million ($25,319 thousand) at March 31, 2016 and short-term bank loans of ¥1,729 million and long-term debt of ¥3,727 million at March 31, 2015.
Millions of yen
Thousands of U.S. dollars
(Note 1)2016 2015 2016
Inventories and other ....................................... ¥3,469 ¥ 3,672 $30,786Land and buildings and structures, machinery and equipment, etc., net ............... 5,899 7,573 52,351
Total ............................................................... ¥9,369 ¥11,245 $83,146
The aggregate annual maturities of lease obligations at March 31, 2016 were as follows:
Year ending March 31, Millions of yen
Thousands of U.S. dollars
(Note 1)
2017 ....................................................................... ¥1,551 $13,7642018 ....................................................................... 1,497 13,2852019 ....................................................................... 1,034 9,1762020 ....................................................................... 792 7,0282021 ....................................................................... 600 5,3242022 and thereafter .................................................. 875 7,765
10. Net AssetsUnder the Japanese Corporate Law (the “Law”), the entire amount paid for new shares is required to be designated as common stock. However, a company may, by a resolution of the Board of Directors, designate an amount not exceeding one-half of the amount paid of the new shares as additional paid-in capital, which is included in capital surplus. The Law provides that a 10% dividend shall be appropriated as additional paid-in capital or legal earnings reserve until the aggregate amount of addi-tional paid-in capital and the legal earnings reserve equals 25% of common stock. The legal earnings reserve is included in retained earnings in the accompanying consolidated balance sheets. Under the Law, the legal earn-ings reserve and additional paid-in capital could be used to eliminate or reduce a deficit by a resolution at the stockholders’ meeting. Additional paid-in capital and the legal earnings reserve may not be distributed as dividends. However, all additional paid-in capital and the entire legal earnings reserve may be transferred to other capital surplus and retained earnings, respective-ly, which are potentially available for dividends. The maximum amount that the Company can distribute as dividends is calculated based on the non-consolidated financial statements of the Company in accordance with the Law. At the annual stockholders’ meeting held on June 22, 2016, the stockholders approved the distribution of divi-dends amounting to ¥2,092 million ($18,565 thousand). Such appropriations have not been accrued in the consolidated financial statements as of March 31, 2016. Such appropriations are recognized in the period in which they are approved by the stockholders.
3. Defined contribution plansContributions to defined contribution plans of the Company and its consoli-dated subsidiaries were ¥2,382 million ($21,139 thousand) and ¥2,521 mil-lion for the fiscal years ended March 31, 2016 and 2015, respectively.
4. Assets not transferred to the defined contribution pension planAssets of ¥1,229 million ($10,906 thousand), which were not transferred to the defined contribution pension plan at March 31, 2016, were recorded in other accounts payable (current liabilities). Assets of ¥2,835 million, which were not transferred to the defined contribution pension plan at March 31, 2015, were recorded in other accounts payable (current liabilities) and long-term other accounts payable (long-term liabilities).
9. Short-Term Borrowings, Long-Term Debt and Lease ObligationsShort-term bank loans bore weighted-average interest rates of 1.58% and 1.95% at March 31, 2016 and 2015, respectively. Long-term debt at March 31, 2016 and 2015 consisted of the following:
Millions of yen
Thousands of U.S. dollars
(Note 1)2016 2015 2016
Loans from banks, insurance companies and agricultural cooperatives, bearing
weighted-average rates of 1.56% and 1.89% at March 31, 2016 and 2015, respectively ............................. ¥76,069 ¥73,716 $675,088
76,069 73,716 675,088Less: Amount due within one year ............... 20,447 10,754 181,460
Amount due after one year ......................... ¥55,621 ¥62,962 $493,619
The aggregate annual maturities of long-term debt at March 31, 2016 were as follows:
Year ending March 31, Millions of yen
Thousands of U.S. dollars
(Note 1)
2017 ....................................................................... ¥20,447 $181,4602018 ....................................................................... 30,057 266,7462019 ....................................................................... 11,656 103,4432020 ....................................................................... 8,328 73,9082021 ....................................................................... 4,812 42,7052022 and thereafter .................................................. 766 6,798
The Company has entered into syndicated-loan contracts with several financial institutions. Financial covenants included in the contracts are as follows:Contracts at September 16, 2011 (¥10.0 billion of long-term debt due within one year) (1) The amount of total net assets (excluding foreign currency translation
adjustments) on the consolidated balance sheet at the end of each fiscal year and the interim period shall be over ¥39.5 billion and 70% compared with the latest period; and
(2) Ordinary losses on the consolidated statements of income for each fiscal year (after fiscal year ended March 31, 2012) shall not be recorded for three consecutive years. The amount of total net assets on the consolidated balance sheet as well as ordinary losses on the consolidated statements of income men-tioned above, to be referred to for the financial covenants, are those in
Sanden Holdings Corporation 31
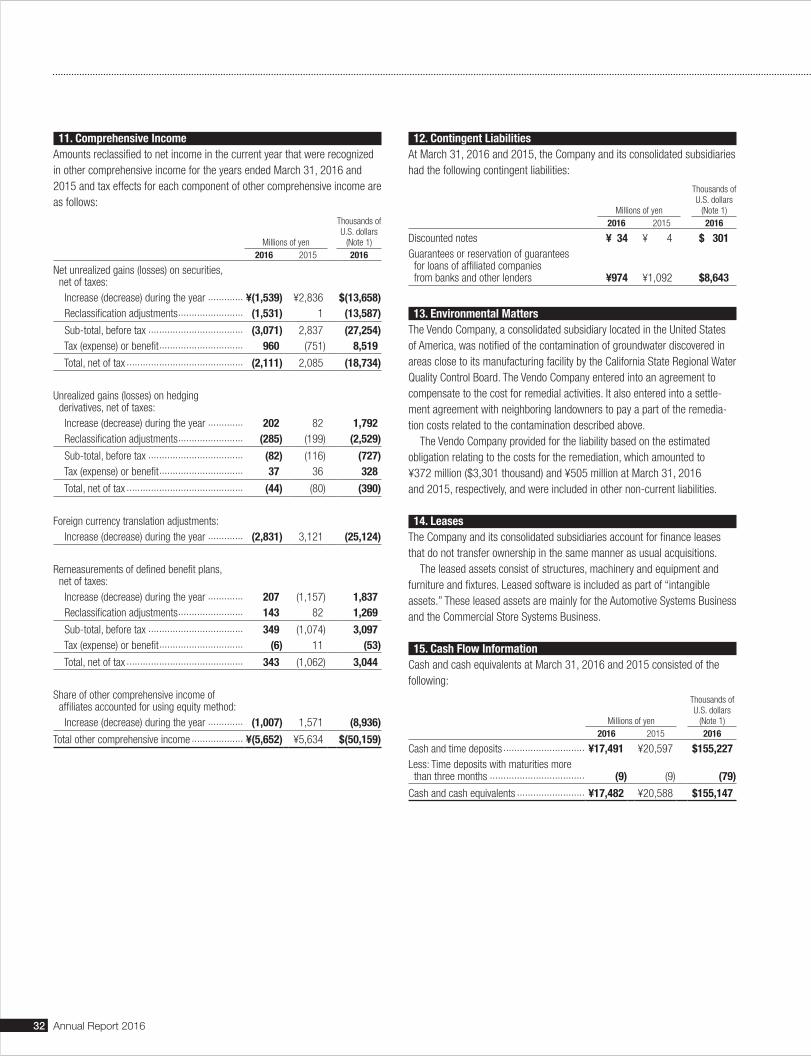
11. Comprehensive IncomeAmounts reclassified to net income in the current year that were recognized in other comprehensive income for the years ended March 31, 2016 and 2015 and tax effects for each component of other comprehensive income are as follows:
Millions of yen
Thousands of U.S. dollars
(Note 1)2016 2015 2016
Net unrealized gains (losses) on securities, net of taxes: Increase (decrease) during the year ............. ¥(1,539) ¥2,836 $(13,658) Reclassification adjustments ........................ (1,531) 1 (13,587)
Sub-total, before tax ................................... (3,071) 2,837 (27,254) Tax (expense) or benefit ............................... 960 (751) 8,519
Total, net of tax ........................................... (2,111) 2,085 (18,734)
Unrealized gains (losses) on hedging derivatives, net of taxes: Increase (decrease) during the year ............. 202 82 1,792 Reclassification adjustments ........................ (285) (199) (2,529)
Sub-total, before tax ................................... (82) (116) (727) Tax (expense) or benefit ............................... 37 36 328
Total, net of tax ........................................... (44) (80) (390)
Foreign currency translation adjustments: Increase (decrease) during the year ............. (2,831) 3,121 (25,124)
Remeasurements of defined benefit plans, net of taxes: Increase (decrease) during the year ............. 207 (1,157) 1,837 Reclassification adjustments ........................ 143 82 1,269
Sub-total, before tax ................................... 349 (1,074) 3,097 Tax (expense) or benefit ............................... (6) 11 (53)
Total, net of tax ........................................... 343 (1,062) 3,044
Share of other comprehensive income of affiliates accounted for using equity method: Increase (decrease) during the year ............. (1,007) 1,571 (8,936)
Total other comprehensive income ................... ¥(5,652) ¥5,634 $(50,159)
12. Contingent LiabilitiesAt March 31, 2016 and 2015, the Company and its consolidated subsidiaries had the following contingent liabilities:
Millions of yen
Thousands of U.S. dollars
(Note 1)2016 2015 2016
Discounted notes ¥ 34 ¥ 4 $ 301Guarantees or reservation of guarantees for loans of affiliated companies
from banks and other lenders ¥974 ¥1,092 $8,643
13. Environmental MattersThe Vendo Company, a consolidated subsidiary located in the United States of America, was notified of the contamination of groundwater discovered in areas close to its manufacturing facility by the California State Regional Water Quality Control Board. The Vendo Company entered into an agreement to compensate to the cost for remedial activities. It also entered into a settle-ment agreement with neighboring landowners to pay a part of the remedia-tion costs related to the contamination described above. The Vendo Company provided for the liability based on the estimated obligation relating to the costs for the remediation, which amounted to ¥372 million ($3,301 thousand) and ¥505 million at March 31, 2016 and 2015, respectively, and were included in other non-current liabilities.
14. LeasesThe Company and its consolidated subsidiaries account for finance leases that do not transfer ownership in the same manner as usual acquisitions. The leased assets consist of structures, machinery and equipment and furniture and fixtures. Leased software is included as part of “intangible assets.” These leased assets are mainly for the Automotive Systems Business and the Commercial Store Systems Business.
15. Cash Flow InformationCash and cash equivalents at March 31, 2016 and 2015 consisted of the following:
Millions of yen
Thousands of U.S. dollars
(Note 1)2016 2015 2016
Cash and time deposits .............................. ¥17,491 ¥20,597 $155,227Less: Time deposits with maturities more than three months ................................... (9) (9) (79)
Cash and cash equivalents ......................... ¥17,482 ¥20,588 $155,147
32 Annual Report 2016

16. Amounts per ShareNet assets and income per share as at and for the years ended March 31, 2016 and 2015, respectively, are as follows:
YenU.S. dollars
(Note 1)2016 2015 2016
Net assets per share ................................... ¥507.56 ¥510.80 $4.50Net income per share .................................. 50.43 40.40 0.44
Basic and diluted net income per share of common stock for the years ended March 31, 2016 and 2015 have been computed based on the following:
Number of shares2016 2015
Weighted-average number of shares of common stock ............................................... 138,114,721 138,132,950
Millions of yen
Thousands of U.S. dollars
(Note 1)2016 2015 2016
Net income attributable to owners of the parent ............................................... ¥6,965 ¥5,580 $61,812 Net income attributable to owners of the parent relating to common stock ........ 6,965 5,580 61,812
YenU.S. dollars
(Note 1)2016 2015 2016
Basic net income per share of common stock ............................................ ¥50.43 ¥40.40 $0.44
There was no diluted net income per common share for the years ended March 31, 2016 and 2015 as the Company did not have common stock with potential dilutive effect. The Company’s shares held by the executive compensation BIP Trust are recorded as treasury stock in shareholders’ equity which are deducted from the weighted-average number of shares outstanding during the year for the purpose of calculating net income per share for the year ended March 31, 2016. The weighted-average number of shares held by the trust was 488,887 shares for the year ended March 31, 2016 and the total number of shares held by the trust at the balance sheet date was 837,411 shares as of March 31, 2016. As described in “Change in Accounting Policies”, the Company and its consolidated domestic subsidiaries adopted the Business Combination Accounting Standards in the fiscal year ended March 31, 2016. As a result, net assets per share decreased by ¥5.29, while impact of this adoption on net income per share is immaterial.
17. Business CombinationFor the year ended March 31, 2016Transaction under common controlAdditional acquisition of shares in subsidiary1. Outline of the transaction(1) Name and business of the company under the transaction
Sanden Shanghai Refrigeration Co., Ltd.(2) Date of the transaction
September 30, 2015 (deemed acquisition date)(3) Legal form of the transaction
Acquisition of shares from non-controlling shareholders(4) Name after the transaction
Unchanged(5) Other matters related to the transaction
Percentage of voting rights of shares additionally acquired was 49.0% and the ownership percentage of the Company after the acquisition became 100.0%. The purpose of this additional acquisition was to estab-lish bases for expanding sales and production of Commercial Store Systems Business in China.
2. Outline of accounting policy appliedThe Company accounted for the acquisition as a transaction with non-con-trolling shareholders within a transaction under common control in compli-ance with ASBJ Statement No. 21 and the “Revised Guidance on Accounting Standard for Business Combinations and Accounting Standard for Business Divestitures” (ASBJ Guidance No. 10, September 13, 2013).
3. Additional acquisition of shares in subsidiaryAcquisition cost and consideration paidCash ¥645 million ($5,724 thousand)
4. Changes in the portion held by the Company in connection with the transactions with non-controlling shareholders
(1) Major reasons for changes in capital surplus Additional acquisition of the subsidiary’s share
(2) Decreases in capital surplus due to transactions with non-controlling shareholders ¥731 million ($6,487 thousand)
For the year ended March 31, 2015There was no significant business combination.
Sanden Holdings Corporation 33
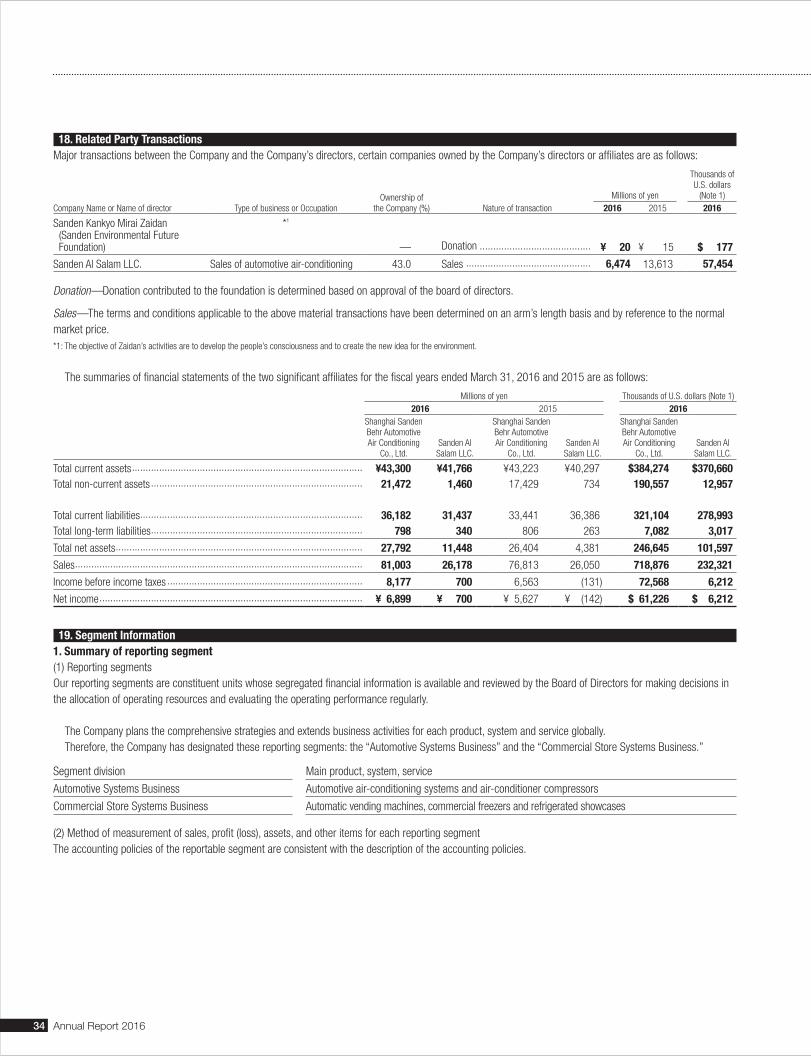
18. Related Party TransactionsMajor transactions between the Company and the Company’s directors, certain companies owned by the Company’s directors or affiliates are as follows:
Company Name or Name of director Type of business or OccupationOwnership of
the Company (%) Nature of transactionMillions of yen
Thousands of U.S. dollars
(Note 1)2016 2015 2016
Sanden Kankyo Mirai Zaidan (Sanden Environmental Future
Foundation)
*1
— Donation ......................................... ¥ 20 ¥ 15 $ 177
Sanden Al Salam LLC. Sales of automotive air-conditioning 43.0 Sales .............................................. 6,474 13,613 57,454
Donation—Donation contributed to the foundation is determined based on approval of the board of directors.
Sales—The terms and conditions applicable to the above material transactions have been determined on an arm’s length basis and by reference to the normal market price.*1: The objective of Zaidan’s activities are to develop the people’s consciousness and to create the new idea for the environment.
The summaries of financial statements of the two significant affiliates for the fiscal years ended March 31, 2016 and 2015 are as follows:
Millions of yen Thousands of U.S. dollars (Note 1)2016 2015 2016
Shanghai Sanden Behr Automotive Air Conditioning
Co., Ltd.Sanden Al Salam LLC.
Shanghai Sanden Behr Automotive Air Conditioning
Co., Ltd.Sanden Al Salam LLC.
Shanghai Sanden Behr Automotive Air Conditioning
Co., Ltd.Sanden Al Salam LLC.
Total current assets ..................................................................................... ¥43,300 ¥41,766 ¥43,223 ¥40,297 $384,274 $370,660Total non-current assets .............................................................................. 21,472 1,460 17,429 734 190,557 12,957
Total current liabilities .................................................................................. 36,182 31,437 33,441 36,386 321,104 278,993Total long-term liabilities .............................................................................. 798 340 806 263 7,082 3,017
Total net assets ........................................................................................... 27,792 11,448 26,404 4,381 246,645 101,597
Sales .......................................................................................................... 81,003 26,178 76,813 26,050 718,876 232,321
Income before income taxes ........................................................................ 8,177 700 6,563 (131) 72,568 6,212
Net income ................................................................................................. ¥ 6,899 ¥ 700 ¥ 5,627 ¥ (142) $ 61,226 $ 6,212
19. Segment Information1. Summary of reporting segment(1) Reporting segmentsOur reporting segments are constituent units whose segregated financial information is available and reviewed by the Board of Directors for making decisions in the allocation of operating resources and evaluating the operating performance regularly.
The Company plans the comprehensive strategies and extends business activities for each product, system and service globally. Therefore, the Company has designated these reporting segments: the “Automotive Systems Business” and the “Commercial Store Systems Business.”
Segment division Main product, system, service
Automotive Systems Business Automotive air-conditioning systems and air-conditioner compressors
Commercial Store Systems Business Automatic vending machines, commercial freezers and refrigerated showcases
(2) Method of measurement of sales, profit (loss), assets, and other items for each reporting segmentThe accounting policies of the reportable segment are consistent with the description of the accounting policies.
34 Annual Report 2016
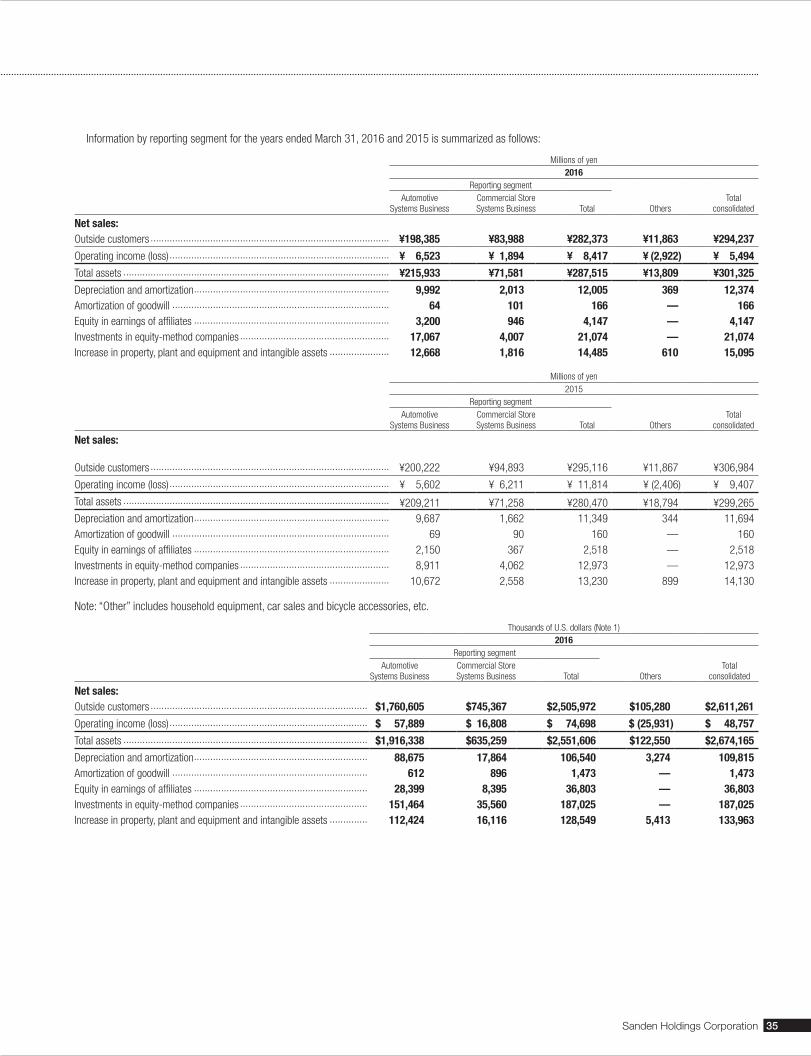
Information by reporting segment for the years ended March 31, 2016 and 2015 is summarized as follows:
Millions of yen2016
Reporting segmentAutomotive
Systems BusinessCommercial Store Systems Business Total Others
Totalconsolidated
Net sales:Outside customers ........................................................................................ ¥198,385 ¥83,988 ¥282,373 ¥11,863 ¥294,237
Operating income (loss) ................................................................................. ¥ 6,523 ¥ 1,894 ¥ 8,417 ¥ (2,922) ¥ 5,494
Total assets .................................................................................................. ¥215,933 ¥71,581 ¥287,515 ¥13,809 ¥301,325
Depreciation and amortization ........................................................................ 9,992 2,013 12,005 369 12,374Amortization of goodwill ................................................................................ 64 101 166 — 166Equity in earnings of affiliates ........................................................................ 3,200 946 4,147 — 4,147Investments in equity-method companies ....................................................... 17,067 4,007 21,074 — 21,074Increase in property, plant and equipment and intangible assets ...................... 12,668 1,816 14,485 610 15,095
Millions of yen2015
Reporting segmentAutomotive
Systems BusinessCommercial Store Systems Business Total Others
Total consolidated
Net sales:
Outside customers ........................................................................................ ¥200,222 ¥94,893 ¥295,116 ¥11,867 ¥306,984
Operating income (loss) ................................................................................. ¥ 5,602 ¥ 6,211 ¥ 11,814 ¥ (2,406) ¥ 9,407
Total assets .................................................................................................. ¥209,211 ¥71,258 ¥280,470 ¥18,794 ¥299,265Depreciation and amortization ........................................................................ 9,687 1,662 11,349 344 11,694Amortization of goodwill ................................................................................ 69 90 160 — 160Equity in earnings of affiliates ........................................................................ 2,150 367 2,518 — 2,518Investments in equity-method companies ....................................................... 8,911 4,062 12,973 — 12,973Increase in property, plant and equipment and intangible assets ...................... 10,672 2,558 13,230 899 14,130
Note: “Other” includes household equipment, car sales and bicycle accessories, etc.
Thousands of U.S. dollars (Note 1)2016
Reporting segmentAutomotive
Systems BusinessCommercial Store Systems Business Total Others
Totalconsolidated
Net sales:Outside customers ................................................................................ $1,760,605 $745,367 $2,505,972 $105,280 $2,611,261
Operating income (loss) ......................................................................... $ 57,889 $ 16,808 $ 74,698 $ (25,931) $ 48,757
Total assets .......................................................................................... $1,916,338 $635,259 $2,551,606 $122,550 $2,674,165
Depreciation and amortization ................................................................ 88,675 17,864 106,540 3,274 109,815Amortization of goodwill ........................................................................ 612 896 1,473 — 1,473Equity in earnings of affiliates ................................................................ 28,399 8,395 36,803 — 36,803Investments in equity-method companies ............................................... 151,464 35,560 187,025 — 187,025Increase in property, plant and equipment and intangible assets .............. 112,424 16,116 128,549 5,413 133,963
Sanden Holdings Corporation 35
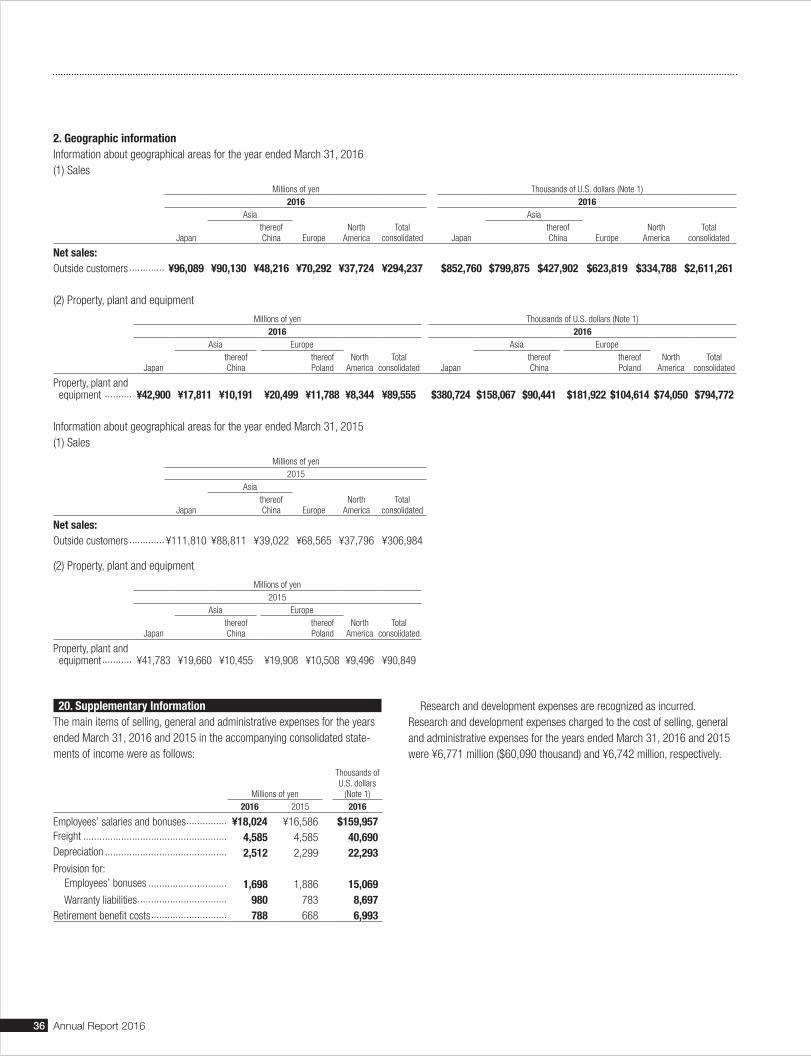
2. Geographic informationInformation about geographical areas for the year ended March 31, 2016(1) Sales
Millions of yen Thousands of U.S. dollars (Note 1)2016 2016
Japan
Asia
EuropeNorth
AmericaTotal
consolidated Japan
Asia
EuropeNorth
AmericaTotal
consolidatedthereof China
thereof China
Net sales:Outside customers ............. ¥96,089 ¥90,130 ¥48,216 ¥70,292 ¥37,724 ¥294,237 $852,760 $799,875 $427,902 $623,819 $334,788 $2,611,261
(2) Property, plant and equipment
Millions of yen Thousands of U.S. dollars (Note 1)2016 2016
Japan
Asia EuropeNorth
AmericaTotal
consolidated Japan
Asia EuropeNorth
AmericaTotal
consolidatedthereof China
thereof Poland
thereof China
thereof Poland
Property, plant and equipment .......... ¥42,900 ¥17,811 ¥10,191 ¥20,499 ¥11,788 ¥8,344 ¥89,555 $380,724 $158,067 $90,441 $181,922 $104,614 $74,050 $794,772
Information about geographical areas for the year ended March 31, 2015(1) Sales
Millions of yen2015
Japan
Asia
EuropeNorth
AmericaTotal
consolidatedthereof China
Net sales:Outside customers ............. ¥111,810 ¥88,811 ¥39,022 ¥68,565 ¥37,796 ¥306,984
(2) Property, plant and equipment
Millions of yen2015
Japan
Asia EuropeNorth
AmericaTotal
consolidatedthereof China
thereof Poland
Property, plant and equipment ........... ¥41,783 ¥19,660 ¥10,455 ¥19,908 ¥10,508 ¥9,496 ¥90,849
20. Supplementary InformationThe main items of selling, general and administrative expenses for the years ended March 31, 2016 and 2015 in the accompanying consolidated state-ments of income were as follows:
Millions of yen
Thousands of U.S. dollars
(Note 1)2016 2015 2016
Employees’ salaries and bonuses ............... ¥18,024 ¥16,586 $159,957Freight ..................................................... 4,585 4,585 40,690Depreciation ............................................. 2,512 2,299 22,293Provision for: Employees’ bonuses ............................. 1,698 1,886 15,069 Warranty liabilities ................................. 980 783 8,697Retirement benefit costs ............................ 788 668 6,993
Research and development expenses are recognized as incurred. Research and development expenses charged to the cost of selling, general and administrative expenses for the years ended March 31, 2016 and 2015 were ¥6,771 million ($60,090 thousand) and ¥6,742 million, respectively.
36 Annual Report 2016

Independent Auditor’s Report
Sanden Holdings Corporation 37
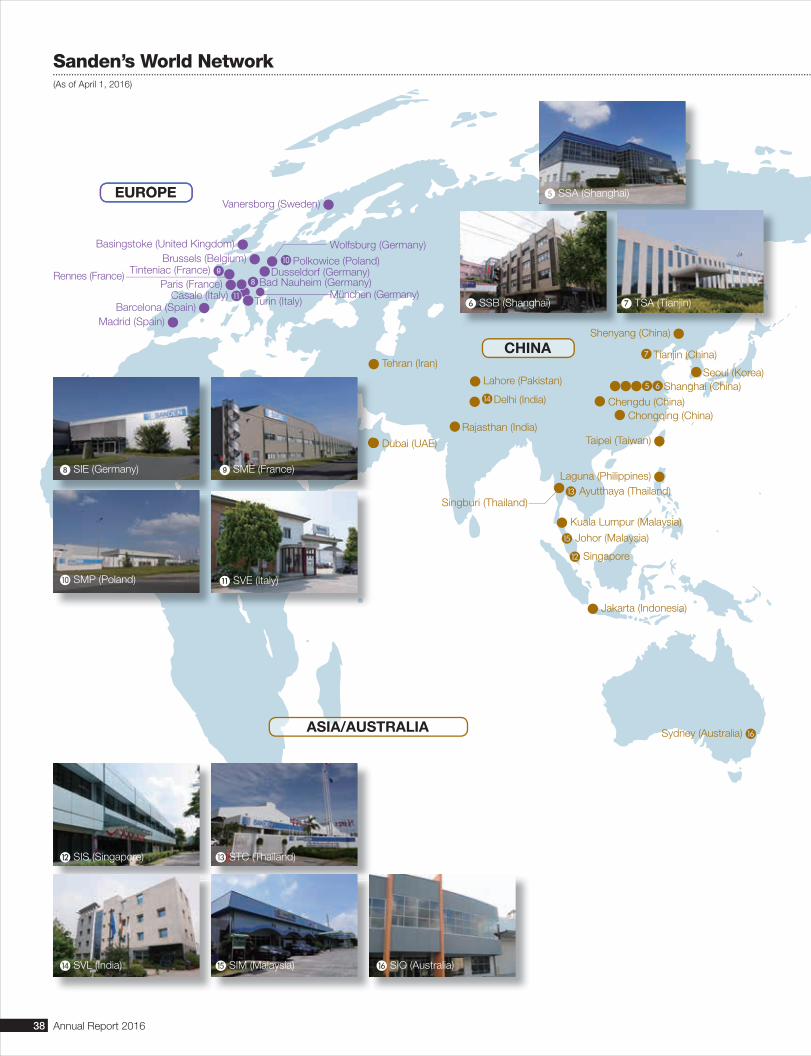
Sanden’s World Network(As of April 1, 2016)
Vanersborg (Sweden) �
Basingstoke (United Kingdom) �Brussels (Belgium) �
Paris (France) �Rennes (France) Tinteniac (France) �
Sydney (Australia) �
Barcelona (Spain) �
� Polkowice (Poland)
� Delhi (India)
� Singapore
� Ayutthaya (Thailand)Singburi (Thailand)
� Tianjin (China)
� Seoul (Korea)����� Shanghai (China)
Shenyang (China) �
� Chengdu (China)� Chongqing (China)
� Kuala Lumpur (Malaysia)
� Jakarta (Indonesia)
� Johor (Malaysia)
Taipei (Taiwan) �
Laguna (Philippines) �
� Bad Nauheim (Germany)�Dusseldorf (Germany)
Wolfsburg (Germany)
München (Germany)� Turin (Italy)
� Tehran (Iran)
� Lahore (Pakistan)
� Rajasthan (India)� Dubai (UAE)
Madrid (Spain) �
�
� SSA (Shanghai)
� SSB (Shanghai) � TSA (Tianjin)
� SIE (Germany)
� SIS (Singapore)
� SVL (India)
� STC (Thailand)�
� SIM (Malaysia) � SIO (Australia)
� SME (France)
� SMP (Poland) � SVE (Italy)
Casale (Italy) �
38 Annual Report 2016
EUROPEEUROPEEUROPE
CHINA
ASIA/AUSTRALIA

Sanden’s World Network(As of April 1, 2016)
� Seoul (Korea) � Wylie (USA)
about 30km
� Dallas (USA)
�� Saltillo (Mexico)
São Paulo (Brazil)
� Detroit (USA)
Sanden Road
Kagoshima
� Utsunomiya
� Chiba
Yokohama
Shizuoka
Okayama
Hiroshima
Takamatsu
Matsuyama
SaitamaTokyo
Toyohashi
�
�
��
�
�
� Sendai
� Shiwa Iwate
� Kumakoto
Niigata�
�
Matsumoto
�Suita �
Sales Offi ces Head Offi ce � Plant / Factory � Sales branch
� Sapporo
�
�
Fukuoka �
Kanazawa �
Nagoya �
� SIA (USA) � SVA (USA)
� SMM (Mexico)
� SMX (Mexico)
MaebashiIsesaki
�
�
Naha�
Tokyo Head Offi ce
A Virtual Road which depicts Sanden growth over our 70-year historyOver the years, we have grown in a manner which is consistent with our Management Policy, “Environment” “Global” “Quality”. Each facility serves a purpose aligned with the policy.
Akagi Plant (Maebashi, Gunma) DUN-COYA (Maebashi, Gunma)
SGCT (Isesaki, Gunma)Head Offi ce (Isesaki, Gunma)History Museum (Isesaki, Gunma)
Yattajima Plant (Isesaki, Gunma)
Communication Plaza(Honjyo, Saitama)
Sanden Holdings Corporation 39
JAPAN
AMERICAS
Maebashi
Isesaki
Honjo
Printed in Japan
Akihabara Daibiru Building,1-18-13 Soto Kanda, Chiyoda-ku, Tokyo, Japan 101-8583
Phone: +81-(0)3-5209-3231
URL: http://www.sanden.co.jp/english/index.html