Embed Size (px)
Citation preview

Collector AB (publ) 556560-0797, Interim Report January–September 2017
YEAR-END REPORT 2017

1Collector AB (publ) 556560-0797, Year-end Report January–December 2017
Year-end Report 2017JANUARY–DECEMBER 2017 (COMPARED WITH JANUARY–DECEMBER 2016)
• Total income increased by 28 percent, amounting to SEK 1,933 million (1,513)• Earnings after tax (EAT) increased by 28 percent, amounting to SEK 517 million (405)• Return on equity (RoE) was 18 percent (20) • Earnings per share increased to SEK 5.03 (4.09)• Continued strong growth with increased quality in the credit portfolio, SEK 19,507 million (13,242),
up 47 percent %• Continued strong growth for Real estate credits, Factoring & company credits and Personal loans• Credit loss level of 1.1 percent (1.1) • Liza Nyberg took over as CEO in September 2017 • Maria Lykken Ljungdahl is new CFO from October 2017• Launch of the Spira app, which simplifies saving in shares• Diversification of the financing structure implemented through MTN programme (framework amount,
SEK 5,000 million), issuance of bond (SEK 800 million) and Tier 2 bond (SEK 500 million), and convertible subordinated debenture loan of SEK 100 million.
THE FOURTH QUARTER (COMPARED WITH THE FOURTH QUARTER OF 2016)
• Total income increased by 23 percent, amounting to SEK 530 million (431)• Earnings after tax (EAT) increased by 8 percent, amounting to SEK 129 million (120)• Earnings per share increased to SEK 1.26 (1.17)• Strong growth for Factoring & company• The Board of Directors proposes that no dividends be paid for the financial year 2017,
which is in line with the adopted dividend policy.
INCOMEFull year 2017
1,933 +28%SEK MILLION
EARNINGS AFTER TAXFull year 2017
517 +28%SEK MILLION
RETURN ON EQUITY (ROE)31 December 2017
18%TOTAL CAPITAL RATIO31 December 2017
17%

2Collector AB (publ) 556560-0797, Year-end Report January–December 2017
Key ratios
IFRS key ratios, SEK million Q4 2017 Q4 2016 ∆ % Full year 2017
Full year 2016 ∆ %
Income 530 431 23 1,933 1,513 28
Earnings per share, SEK, 1) 1.26 1.17 7 5.03 4.09 23
Non-IFRS key ratios, SEK million Q4 2017 Q4 2016 ∆ % Full year 2017
Full year 2016 ∆ %
Organic growth, %2) 23 27 28 27
Operating earnings 199 176 13 784 599 31
Average number of shares,3) 102,690,502 101,574,361 102,690,502 95,421,404
Capital base4) 3,338 2,390 40 3,338 2,390 40
Equity 3,079 2,566 20 3,079 2,566 20
Total capital ratio, %5) 16.8 17.6 16.8 17.6
Return on total assets, 6) 0.6 0.8 2.3 2.7
Return on equity (RoE), %7) 18.1 20.0 18.1 20.0
Equity per share, SEK8) 30 25 20 30 25 20
Equity to assets ratio, %9) 14 17 14 17
Credit losses, %10) 1.1 1.1 1.1 1.1
The C/I ratio 11) 0.49 0.49 0.47 0.50
Average number of full-time employees12) 382 349 9 376 329 14
Investments in intangible fixed assets 33 36 121 102
Earnings before tax (EBT) 170 155 10 668 521 28
Earnings after tax (EAT) 129 120 8 517 405 28
1) The period’s earnings after tax attributable to the period’s average number of outstanding ordinary shares, before and after dilution. Earnings per share have also been restated for prior periods to reflect the bonus issue element in connection with new issues of shares.2) Growth, excluding acquisitions and currency effects.3) The period’s average number of ordinary shares before and after dilution. The number of shares has been adjusted retroactively according to a resolution by split of shares.4) See Note 5 on page 18. 5) Capital base divided by total capital requirement. Refers to the financial group of companies. See Note 5 on page 18. 6) Earnings after tax divided by total assets at the end of the period.7) Earnings after tax in relation to average equity. Rolling 12 months. 8) Equity divided by the number of outstanding shares at the end of the period. The number of shares has adjusted retroactively according to a resolution by the Annual General Meeting split of shares. 9) Equity divided by total capital at the end of the period. 10) Credit losses in relation to lending and other accounts receivable. Rolling 12 months. 11) Total expenses before credit losses, according to the Swedish Annual Accounts Act for Credit Institutions and Securities Companies (ÅRKL)12) Including employees on fixed-term contracts, but not on parental leave or a leave of absence.
3Collector AB (publ) 556560-0797, Year-end Report January–December 2017
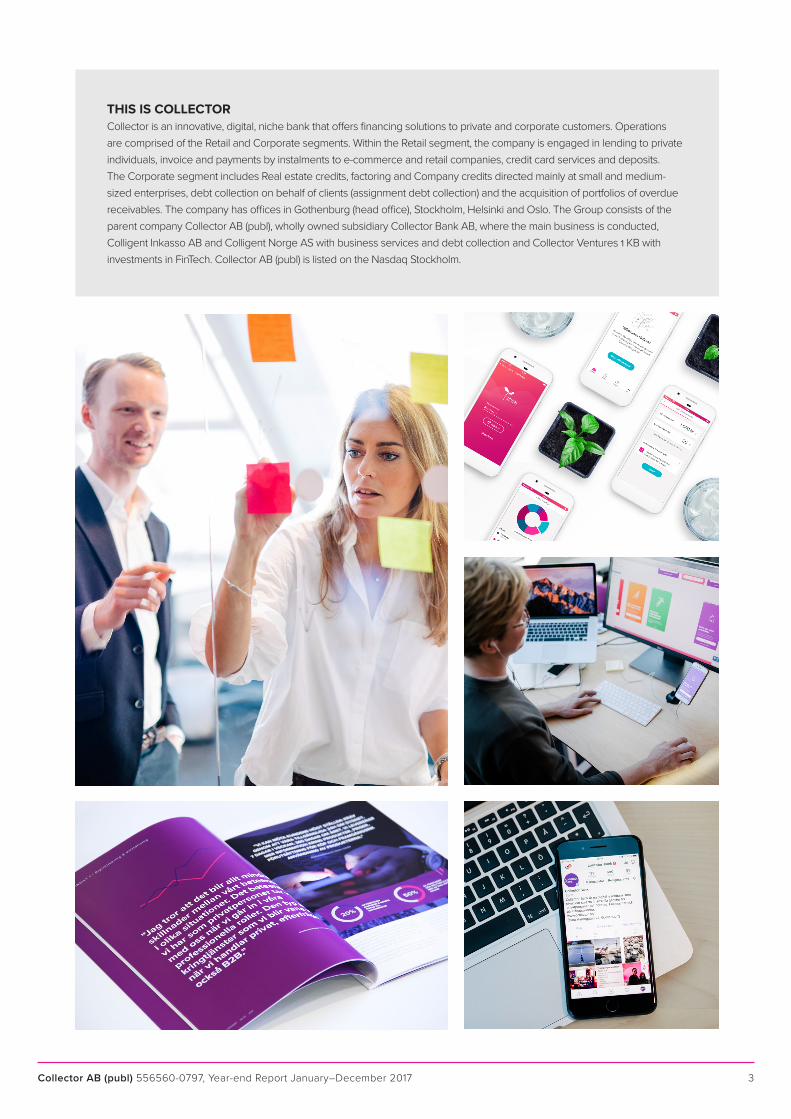
THIS IS COLLECTORCollector is an innovative, digital, niche bank that offers financing solutions to private and corporate customers. Operations are comprised of the Retail and Corporate segments. Within the Retail segment, the company is engaged in lending to private individuals, invoice and payments by instalments to e-commerce and retail companies, credit card services and deposits. The Corporate segment includes Real estate credits, factoring and Company credits directed mainly at small and medium-sized enterprises, debt collection on behalf of clients (assignment debt collection) and the acquisition of portfolios of overdue receivables. The company has offices in Gothenburg (head office), Stockholm, Helsinki and Oslo. The Group consists of the parent company Collector AB (publ), wholly owned subsidiary Collector Bank AB, where the main business is conducted, Colligent Inkasso AB and Colligent Norge AS with business services and debt collection and Collector Ventures 1 KB with investments in FinTech. Collector AB (publ) is listed on the Nasdaq Stockholm.

4Collector AB (publ) 556560-0797, Year-end Report January–December 2017
Continued strong growthCollector continues to deliver strong growth. Once again, we have surpassed previous years. It is gratifying to be able to report that 2017 be-came our most successful year to date financially.During 2017, we invested considerable amounts in implementing new regulations such as PSD 2, GDPR and IFRS 9, especially during the last quarter of the year. Naturally, being able to report the same growth rate as before, despite these necessary investments, is particularly satisfying. Income increased by 28 percent and amounted to SEK 1,933 million, and earnings after tax was SEK 517 million, an increase of 28 percent. Developments have been good in both the Corporate and Retail segments, both in the last quarter and during the year as a whole. Within the Corporate segment, our lending has continued to develop very well, with a good inflow of new customers in Sweden and the rest of the Nordic countries. In particular, factoring and company credits to medium-sized companies have increased. On the private side, Retail, development in Sweden has been good, although we have deliberately lowered the growth rate of Personal loans compared with the previous year. The Retail segment also includes our e-commerce solutions (B2B+B2C), which have been a strong contributing factor to the good development. During the quarter and after its end, several important agreements were entered into, and even more dialogues with major customers have approached the final phase. As a benchmark against other leading players in the market, we offer our customers a high conversion rate thanks to our checkout function. Intensive development has enabled us to enter the Retail segment with digital innovations, such as the Spira app – a collaboration with Aktiein-vest with saving in shares on a monthly basis made simple. Much effort has also been focused on Collector’s app, where we now present our complete Retail offering for private customers in one interface.
Real estate creditsDuring autumn, property market worries were highly discussed in the media. Of Collector’s total lending, 30 percent consists of real estate credits.
The part of the property portfolio comprising real estate developers accounts for less than 5 percent of our total lending, distributed among a few larger players. In addition to growing cities in Sweden, the portfolio also includes quality properties in Finland, Norway and Denmark. We are generally very selective in our choice of bor-rowers, properties and regions. Given the good property expertise among Collector’s manage-ment and board, the risks are low and have been thoroughly analyzed.
Development and sustainabilityIt is clear that consumption of financial services continues to change, especially among private individuals, but also among small and medi-um-sized companies. Collector’s aim is to be among the leading players in the digital trans-formation by continuing to develop technology and business models. We, therefore, maintain an agile approach to working with digital innovation, usually directly with customers through solid business transactions – and always with a focus on low risk. Sustainability is a strategic prerequisite for our business model. During the quarter, we increased this focus with concerted efforts to identify the sustainability issues most important to us. Our first sustainability report is now in place.
Power of innovation under regulated developmentDuring the fourth quarter, we made considerable financial investments toward implementing the new regulations GDPR, PSD2 and IFRS9. New security requirements and open APIs are expected to increase IT expenses. However, we have developed our solutions to also ensure they provide us with new business opportunities. With the development of our new app launched at the beginning of the year, we have prepared for the new payment services directive PSD2. When the directive is introduced, it will allow us to provide financial services to customers with accounts at other banks, both private individuals and companies. To this end, we have now launched “Collector Open Banking”
Collector AcademyWe have also been strongly focused on further strengthening our employer brand, both to recruit new employees and to retain valuable skills. As a step in finding new IT talent, we have launched the intensive programme Collector Academy in collaboration with Academic Work. Through a tailor-made 12-week course, 15 participants will be trained in systems development, starting in March. The education period is followed with a one-year trainee programme. Collector Academy further strengthens our attractiveness as an employer and is part of ensuring our workplace always remains at the forefront of digital technology and innovation.
Strong growth in e-commerce is expected Early this autumn, we began work on the Convert report, which examines the business-to-business (B2B) e-commerce market. Before the report was begun, we knew that B2B was far behind business- to-consumer (B2C). It was assumed this was due to the companies on the purchasing side not yet being ready. However, it quickly became apparent that the opposite was true. Market expectations are high, while the companies on the selling side are hesitant to launch e-commerce. One reason may be that the technical and financial tools for B2B are far behind the consumer segment. Therefore, Collector’s launch of a checkout function at the end of 2017 is a particularly positive develop- ment. The solution, adapted for B2B application, provides a buying experience equivalent to private consumer standards. I am certain we will quite soon see a major shift in how companies conduct purchases with other companies – in which digital interfaces will play a crucial role.
A comment from our CEO
Liza Nyberg CEO

5Collector AB (publ) 556560-0797, Year-end Report January–December 2017
The Group’s developmentIncome and earnings January–DecemberCollector showed continued strong growth in 2017. Total income increased by 28 percent, compared with the corresponding period in 2016, and amounted to SEK 1,933 million (1,513). Organic growth, excluding currency effects, amounted to 27 percent. Earnings before tax (EBT) increased by 28 percent, amounting to SEK 668 million (521). Earnings after tax (EAT) increased by 28 percent to SEK 517 million (405), corresponding to a return on equity (RoE) of 18 percent (20). The improvement in earnings is explained by strong income growth mainly in Real estate credits, Factoring and Corporate credits, as well as Personal loans. Earnings per share increased by 23 percent to SEK 5.03 (4.09). Income and earnings for the fourth quarterCollector had continued strong growth in the fourth quarter, although at a slightly lower rate than in the previous quarter. Total income increased by 23 percent compared with the fourth quarter of 2016 and amounted to SEK 530 million (431). Organic growth in the quarter, excluding currency effects, amounted to 23 percent. During the fourth quarter, major investments have been made in new products and systems development as well as adapt- ation to safety and regulatory changes, which has affected earnings negatively. Earnings before tax (EBT) increased by 10 percent, amounting to SEK 170 million (155). Earnings after tax (EAT) increased by 8 percent to SEK 129 million (120). Earnings per share for the quarter increased by 7 percent to SEK 1.26 (1.17).
ExpensesThe cost/income ratio (C/I) has improved to 0.47 during 2017 (0.50) despite the major non-recurring expenses for regulatory adjustments and systems development included in the fourth quarter. Parts of the year have been characterized by excess liquidity which, in combination with bond financing, increased interest expenses. Other expenses decreased due to the dissolution of excess provisions for the deposit guarantee during the third quarter.
CreditportfolioThe total credit portfolio amounts to SEK 19,507 million (13,242) and has increased by more than SEK 6 billion in the past year, corresponding to 47 percent. The increase is primarily due to the product areas Real estate credits, Personal loans, Factoring and company credits. The average duration/maturity is 36 months for Real estate credits and Personal Loans and 24 months for Factoring and corporate loans. The quality of the total loan portfolio and the relationship between healthy receivables in relation to doubtful receivables continues to improve.
Credit losses The credit loss ratio for the rolling 12 months amounted to 1.1 percent (1.1) at the end of the period.
Liquidity and financial investmentsAs at 31 December, cash and cash equivalents amounted to 1,533 million (1,021). Collector’s excess liquidity is invested in Swedish municipal bonds and deposited in accounts in Nordic banks. As at the end of the period, consolidated financial investments amounted to SEK 939 million (362). Of this, SEK 125 million (40) involved investments in Fintech companies through Collector Ventures.
FundingThe negative interest rate situation continues to provide attractive funding options. In 2017, strategic diversification of the financing structure was implemented to reduce refinancing risk, as well as obtain more financing sources and maturities. Collector finances its operations to 82 percent with deposits from the public, which as at the end of the period amounted to SEK million 15,310 (11,345). In March 2017, the first issue was made under the MTN programme (framework amount 5,000 MSEK), a three-year bond of 800 MSEK. In June 2017, an SEK 500 million Tier 2 bond was issued with a maturity of ten years, with the possibility of early redemption after five years. Issued certificates amounted to SEK 2,035 million (806) as at the end of the period. Collector also has bank credits of SEK 800 million, which have been untapped throughout 2017.
Capital and total capital ratioCollector has received permission from the Swedish Financial Supervisory Authority to include earnings for the year in the capital base. A review has been performed of the earnings for the period, which have therefore been taken into consideration in the capital base. The capital base for the financial group of companies amounted to SEK 3,338 million by the end of the period (2,390), and the capital requirement amounted to SEK 1,591 million (1,087). The SEK 500 million Tier 2 bond issued in June 2017 has been included in the capital base as supple-mentary capital. The total capital ratio was 16.8 percent (17.6) as at the end of December. The Common Equity Tier 1 capital ratio amounts to 14.3 percent (13.8) and the Equity Tier 1 capital ratio to 14.3 percent (17.6). During the year, Collector issued a convertible debenture loan of SEK 100 million. Evaluation shows that without adjustment of terms, no part will be classified as Tier 1 capital in the capital base.

6Collector AB (publ) 556560-0797, Year-end Report January–December 2017
External income for the private segment increased by 22 percent during the year and amounted to SEK 1,260 million (1,036).Earnings before tax (EBT) increased by 11 percent, amounting to SEK 368 million (333).
Payment solutions for e-commerce and retail chains had somewhat lower volumes than expected. Verkkokauppa, one of Finland’s largest e-commerce companies, implemented our payment services during the fourth quarter. One of Sweden’s fastest growing e-commerce companies, NA-KD, is starting up in early January 2018. Collector’s focus on business-to-business (B2B) e-commerce generated significant customer interest during the year and is expected to generate volume growth in 2018.
Personal loans had strong growth, especially in the first three quarters. The rate of new contracts was somewhat lower during the last quarter of the year, due to a deliberate customer strategy combined with subdued market conditions and tougher competition, especially in Sweden.
We carried out continued improvements to the quality of the loan portfolio. The accept-ance level for new lending in Sweden decreased from 47 percent to 38 percent.
Cards had a weaker development during the year but showed positive trends in the second half of the year. A new Product Area Manager was appointed in November. Efforts to increase cross-selling through the product area’s own channels are expected to increase volumes in 2018.
The deposit balance increased by almost SEK 4 billion and amounted to SEK 15,310 million (11,345) at year-end. A new brokerage model for collaborative partners was implemented during the year and has, at the same cost, entailed higher interest rates for end customers. Savings accounts in Finland were reopened in the fourth quarter.
In 2017, Collector has sought solutions for offering residential mortgages to private individuals as a completely digital service. This product is scheduled to be launched in 2018 once it has been adapted to regulations for digital services.
DEVELOPMENT IN THE RETAIL SEGMENT
Great potential within e-commerce
The B2B initiative has generated significant interest during the year.
PRODUCTS
• Payment solutions for e-commerce and retail chains (B2B+B2C)
• Personal loans
• Cards – Collector Easyliving and Collector Easycard
• Savings accounts in Sweden and Finland

7Collector AB (publ) 556560-0797, Year-end Report January–December 2017
During 2017, the Corporate segment continued to show strong earnings and profitability growth. External income increased by 41 percent during the year and amounted to SEK 674 million (478). Earnings before tax (EBT) in the Corporate segment amounted to SEK 300 million (188), an increase of 60 percent.
Real estate credits experienced significant volume growth in the first six months, which diminished in the second half of the year due to the general turmoil in the Swedish housing market. Of the total credit portfolio, real estate credits accounted for approximately 30 percent and real estate developers only 5 percent. Of the real estate properties, approximately 77 percent are already sold through credit granted. In 2017, income from the property credit portfolio continued to increase, both in terms of total income and in contribution margin.
During the year, Factoring and company credits showed high growth both in terms
of total income and contribution margin. The deal with Rossignol, which began in March, built up the maximum credit volume in the fourth quarter. Collector has also entered into agreements with several other major customers, which have contributed to the strong growth in the product area during the year. There has been good development in Norway with several major customers in the pipeline, which is expected to have a positive effect in 2018.
Collector’s collection agency Colligent had continued strong growth in a mature market. Positive development with legal services is linked to assignment debt collection on the property side. During the fourth quarter, the position has been strengthened by offering services to existing and new factoring customers in Collector.
Acquired receivables had a weaker development due to few new acquisitions as a result of a significant increases in prices in the market.
DEVELOPMENT IN THE CORPORATE SEGMENT
Continued strong growth
PRODUCTS
• Factoring and company credits
• Real estate credits
• Assignment debt collection
• Acquisition of portfolios – acquired receivables
Earnings before tax (EBT) for the business segment increased by 60 percent.

8Collector AB (publ) 556560-0797, Year-end Report January–December 2017
OtherMaterial risks and uncertainty factorsThrough its operations, Collector is exposed to a number of different financial risks: primarily credit risk, market risk (currency risk and interest rate risk), liquidity risk and financing risk, operational risk and reputation risk. The Group’s overall risk management policy focuses on the unpredictability of the financial markets, and it strives to minimize potentially unfavourable influences on the Group’s financial results. The Group utilizes derivative instruments for some risk exposure. Risk management is taken care of by the Group’s management according to policies established by the Board. The Board estab-lishes written policies for overall risk management and for specific areas such as currency risk, interest rate risk, credit risk, operational risk and the use of derivatives and similar financial instruments. The Group’s risk structure and its risk, liquidity and capital management are described in detail in Collector’s Annual Report. After that, there have been no significant changes except as reported in this Interim Report.
Effects of transition to IFRS 9IFRS 9, which is the new accounting standard for financial instruments, gained legal force on 1 January 2018 and replaces IAS 39. In simplified terms, the standard entails that the company recognizes impairment at the time of payment of credit and estimates the expected credit losses, which requires further assessment regarding change in credit risk and forward-looking information. In accordance with the new standard, Collector has classified assets and liabilities and developed models for calculating expected credit losses. IFRS 9 will entail in-creasing, and advancing in time, the provisions for anticipated credit losses, as well as a reduction in equity, but it will not affect cash flow or underlying credit risk. The transition increases provisions for credit losses by SEK 221 million and entails a reduction in equity by the corresponding amount after tax. Collector has resolved to apply transitional rules and informed the Swedish Financial Supervisory Authority (FI) accordingly. The transition method will be used without retroactive application of comparative data. The application of the transitional rules implies a gradual phasing-in during 2018–2022, and the capital adequacy impact is therefore considered to be insignificant.
Financial group of companiesThe Parent Company, Collector AB (publ), is part of a financial group of companies (consolidated situation) that includes the subsidiaries Collector Bank AB, Collector Ventures 1 KB och Colligent Norge AS. All companies are fully consolidated. The entire financial group of companies is under the supervision of the Swedish Financial Supervisory Authority, and it is subject to the Swedish Financial Supervisory Authority’s regulations regarding capital adequacy and large exposures. Colligent Inkasso AB is a wholly owned subsidiary of Collector AB (publ), but is not included in the financial group of companies. EmployeesThe average number of full-time employees for the 2017 full-year period was 376 (FTE), an increase of 14 percent. The number of
full-time employees includes employees on fixed-term contracts, but not on parental leave or a leave of absence.
Parent CompanyThe Parent Company is a holding company. Operating income for the full year totalled SEK 79 million (65) and pertains to intra-Group administrative services. Earnings before tax (EBT) amounted to SEK 9 million (7) for the full year and earnings after tax (EAT) were SEK 9 million (5). Operating income for the fourth quarter of 2017 amounted to SEK 24 million (18). Earnings before tax (EBT) amounted to SEK 16 million (15). Earnings after tax (EAT) were in the amount of SEK 16 million (11) for the fourth quarter. The Parent Company’s cash and cash equivalents totalled SEK 24 million (5), and equity totalled SEK 1,232 million (1,223), as at 31 December 2017.
The Collector shareCollectors share (“COLL”) was listed on the Nasdaq Stockholm, Mid Cap list in June 2015 with the listing price of SEK 55. As at 29 December 2017, the closing price for the Collector share was SEK 81.25, which corresponds to a market value of SEK 8.3 billion. The number of shareholders at the end of the period was approximately 5,800.
Share capitalAs at 30 December 2017, share capital amounted to SEK 10,269,050, divided into 102,690,502 ordinary shares. The Company has one (1) class of shares. Every share entitles the owner to one vote at the General Meeting.
DividendAccording to the adopted dividend policy, Collector will focus on medium-term growth, which means that dividends may be low or not occur at all in the medium term.
Relationships with related partiesCollector provides debt collection services to Balder and issues real estate credits for Garden Growth and Bronsporten Invest AB, as well as company credits for NA-KD One World and Transfer Galaxy. These transactions take place on market terms. Deposits are also made by related parties and in accordance with applicable market terms for Collector’s deposit accounts.
Annual General Meeting The Annual General Meeting will be held on Tuesday, 24 April 2018 at 3:00 p.m. CET at Collector’s new headquarters, Lilla Bommen 11 in Gothenburg. Notice of the Annual General Meeting will be published no earlier than six, and no later than four, weeks prior to the Annual General Meeting The Annual Report is expected to be available on the website as of 3 April 2018.
Nomination CommitteeThe Nomination Committee consists of Chairman of the Board Lena Apler, representing Helichrysum Gruppen AB, Erik Selin, representing Fastighets AB Balder, Rolf Lundström, representing StrategiQ Capital AB and Fabian Hielte, representing Ernström Finans AB. Lena Apler has been appointed Chairman of the Nomination Committee. Shareholders who wish to contact the Nomination Committee before the Annual General Meeting must do so in writing to Malin Alevåg no later than 16 February 2018, by e-mail to [email protected] (with the headline: “To the Nomination Committee”) or by letter to Collector AB, ATT: Nomination Committee, Box 11914, 404 39 Gothenburg.
Presentation to investors, analysts and the mediaA live telephone conference will be held on 9 February 2018 at 10:00 a.m. (CET) where CEO Liza Nyberg will present the report. The presentation will be held in Swedish and will be broadcast live at: https://tv.streamfabriken.com/collector-q4-2017. To partici-pate in the telephone conference, please call +46 8 5664 2664 2 44,203,008 or +9810 20 3008 9802. The switchboard opens at 9:55 a.m. (CET). The presentation material will be available afterwards on our website www.collector.se.
ShareholdersFastighets AB BalderStrategiQ Capital ABSwedbank Robur fonderErnström Finans ABHelichrysum gruppen ABAndra AP-fondenHandelsbanken fonderMuirfield Invest AktiebolagVante ABOther shareholdersTotal
%44.07%12.72%6.15 %5.36% 3.82%3.20%3.06%1.46%1.36%
18.80%100 %
Ownership structure 31 Dec. 2017
9Collector AB (publ) 556560-0797, Year-end Report January–December 2017
The Board of Directors and the CEO affirm that this Interim Report provides an accurate overview of the operations, financial position and performance of the Group and the Parent Company, and describes the significant risks and uncertainties faced by the Parent Company and the companies in the Group.
This Interim Report has not been reviewed by the company’s auditors.
Gothenburg, 9 February 2018
Board, CEO
Lena Apler, Chairman
Erik Selin, Vice Chairman
Azita Shariaty
Christoffer Lundström
Cecilia Lager
Anna Settman
Patrik Reuterskiöld
Liza Nyberg, CEO
CONTACT For further information, please contact:
CEO Liza Nyberg | Phone: +46 739-10 00 00 | E-mail: [email protected]
CFO Maria Lykken Ljungdahl | Tel: +46 768-90 45 00 | E-mail: [email protected]
IR Clara Bolinder-Lundberg | Tel: +46 709-18 84 43 | E-mail: [email protected]
This information is such information that Collector AB is obliged to publish under the EU Market Abuse Regulation and the Securities Market Act. The information was issued for publication by the above contact persons on 9 February 2018 at 08:15 a.m. CET.
Future reporting dates
Interim Report January–March 2018 24 April 2018 Annual General Meeting 2018 24 April 2018Interim Report January–June 2018 19 July 2018Interim Report January–September 2018 25 October 2018

10Collector AB (publ) 556560-0797, Year-end report January–December 2017
Amounts in SEK million Note Q4 2017 Q4 2016Full year
2017Full year
2016
Income 2 530 431 1,933 1,513
530 431 1,933 1,513
Operating expenses
Personnel costs –68 –57 –246 –211
Depreciation of property, plant and equipment and amortization of intangible fixed assets
–17 –12 –60 –40
Other profit/loss – net – – – 0
Other expenses 4 –246 –186 –843 –663
Operating expenses –331 –255 –1,149 –914
Operating earnings 199 176 784 599
Earnings from financial items
Earnings from sales of subsidiaries – – – –
Financial income 8 0 14 0
Financial expenses –37 –21 –130 –78
Earnings after interest and tax 170 155 668 521
Income tax –41 –35 –151 –116
Earnings for the year 129 120 517 405
Attributable to:
The Parent Company’s shareholders 129 120 517 405
Holdings without controlling influence 0 – 0 –
129 120 517 405
Earnings per share for earnings attributable to the Parent Company’sshareholders during the period (expressed in SEK per share)
– Before dilution 1.26 1.17 5.03 4.09
– After dilution 1.26 1.17 5.03 4.09
Q4 2017 Q4 2016Full year
2017Full year
2016
Earnings for the year 129 120 517 405
Other comprehensive income – – – –
Items that later can be reversed in the income statement:
Exchange rate differences –2 –2 –4 4
Total comprehensive income for the period 127 118 513 409
Attributable to:
– The Parent Company’s shareholders 127 118 513 409
– Non-controlling interests 0 – 0 –
127 118 513 409
STATEMENT OF COMPREHENSIVE INCOME
Group
INCOME STATEMENT
Group

11Collector AB (publ) 556560-0797, Year-end report January–December 2017
Amounts in SEK millionFull year
2017Full year
2016
ASSETS
Non-current assets
Property, plant and equipment
Equipment 10 10
10 10
Intangible fixed assets
Capitalized expenses for development work 216 151
Goodwill 71 72
287 223
Financial non-current assets
Financial investments 939 362
Deferred tax asset – 1
Lending and other receivables 9,563 7,408
10,502 7,771
Total non-current assets 10,799 8,004
Current assets
Lending and other receivables 9,944 5,834
Derivative instruments 26 33
Other receivables 69 263
Cash and cash equivalents 1,533 1,021
Total current assets 11,572 7,151
TOTAL ASSETS 22,371 15,155
EQUITY AND LIABILITIES
Equity
Share capital (102,690,502 shares) 10 10
Reserves –6 –2
Other contributed capital 1,313 1,313
Retained earnings, incl. earnings for the year 1,762 1,245
Total equity 3,079 2,566
Non-current liabilities
Borrowing 264 119
Securities issued 1,344 –
Other non-current liabilities 2 –
Deferred tax liabilities 121 87
1,731 206
Current liabilities
Accounts payable 34 32
Accrued expenses and deferred income 203 112
Current tax liabilities 91 66
Other current liabilities 152 141
Borrowing 15,046 11,226
Securities issued 2,035 806
17,561 12,383
TOTAL EQUITY AND LIABILITIES 22,371 15,155
BALANCE SHEET
Group
12Collector AB (publ) 556560-0797, Year-end report January–December 2017
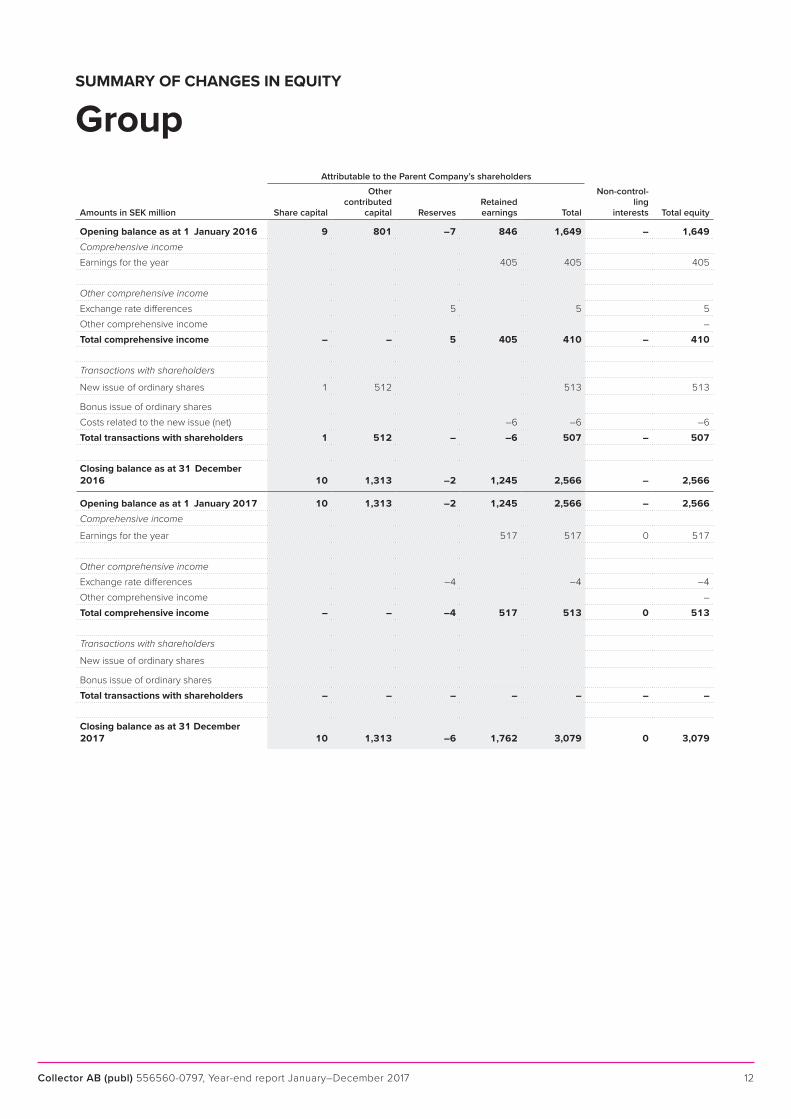
Attributable to the Parent Company’s shareholders
Amounts in SEK million Share capital
Other contributed
capital ReservesRetained earnings Total
Non-control-ling
interests Total equity
Opening balance as at 1 January 2016 9 801 –7 846 1,649 – 1,649Comprehensive income
Earnings for the year 405 405 405
Other comprehensive income
Exchange rate differences 5 5 5
Other comprehensive income –
Total comprehensive income – – 5 405 410 – 410
Transactions with shareholders
New issue of ordinary shares 1 512 513 513
Bonus issue of ordinary shares
Costs related to the new issue (net) –6 –6 –6
Total transactions with shareholders 1 512 – –6 507 – 507
Closing balance as at 31 December 2016 10 1,313 –2 1,245 2,566 – 2,566
Opening balance as at 1 January 2017 10 1,313 –2 1,245 2,566 – 2,566Comprehensive income
Earnings for the year 517 517 0 517
Other comprehensive income
Exchange rate differences –4 –4 –4
Other comprehensive income –
Total comprehensive income – – –4 517 513 0 513
Transactions with shareholders
New issue of ordinary shares
Bonus issue of ordinary shares
Total transactions with shareholders – – – – – – –
Closing balance as at 31 December 2017 10 1,313 –6 1,762 3,079 0 3,079
SUMMARY OF CHANGES IN EQUITY
Group

13Collector AB (publ) 556560-0797, Year-end report January–December 2017
CASH FLOW STATEMENT
GroupSEK million Q4 2017 Q4 2016 Full year 2017 Full year 2016
Operating activitiesEarnings after interest and tax 170 155 668 521
Adjustments for items not included in the cash flow, etc.
– Credit losses 57 34 189 120
– Depreciation/amortization 17 12 60 40
– Capital gains/losses – – – 0
– Unrealized exchange rate differences –118 –53 –46 –239
– Revaluation bonds 0 1 4 –1
– Other –16 –1 –45 –35
– Interest –36 –35 4 –21
74 113 834 385Taxes paid –8 –8 –91 –64
Cash flow from operating activities before changes in working capital 66 105 743 321
Cash flow from changes in working capital
Increase(+)/Decrease(–) in non-current and current operating receivables –1,076 –1,955 –6,185 –4,450
Increase(+)/Decrease(–) in operating liabilities 96 –15 104 -161
Cash flow from operating activities –914 –1,865 –5,338 –4,290
Investing activitiesDisposal of subsidiaries – – – 0
Acquisition of intangible fixed assets –33 –35 –121 –101
Acquisition of property, plant and equipment –1 0 –4 –5
Divestment of property, plant and equipment – – – –
Acquisition of financial assets –116 –215 –609 –958
Divestment of financial assets 15 140 36 746
Cash flow from investing activities –135 –110 –698 –318
Financing activitiesNew issue – 505 – 505
Change in deposits from the public 783 1,550 6,547 4,297
Dividend paid – – – –
Cash flow from financing activities 783 2,055 6,547 4,802
Cash flow for the year –266 80 511 194
Cash and cash equivalents at the start of the year 1,800 948 1,021 825
Exchange rate differences in cash and cash equivalents –1 –7 1 2
Cash and cash equivalents at the end of the year 1,533 1,021 1,533 1,021

14Collector AB (publ) 556560-0797, Year-end report January–December 2017
Notes on accounting principles and notes to the financial statementsGeneral accounting principles
The Interim Report is prepared in accordance with IFRS/IAS 34, and the Swedish Financial Supervisory Authority’s Regulations and General Guidelines on Annual Accounts for Credit Institutions and Securities Companies (FFFS 2008:25, Chapter 7, Sections 2–3, and Chapter 8), the Annual Accounts Act for Credit Institutions and Securities Companies ( Chapter 7, Sections 7–8) and the Swedish Financial Reporting Board’s recommendation RFR 1 Supplementary Accounting Rules for Groups have been taken into consideration.
No new or revised IFRS or interpretations by IFRIC have had any effect on the Group’s financial position, earnings or disclosures. The accounting principles and bases for assessments in the Interim Report are consistent with those applied in the 2016 Annual Report.
For the Parent Company, the Swedish Annual Accounts Act (ÅRL) and the Swedish Financial Reporting Board’s recommendation RFR 2 Accounting for Legal Entities have been applied.
Income Statement according to the Swedish Annual Accounts Act for Credit Institutions (ÅRKL)
Note 1
Amounts in SEK million Q4 2017 Q4 2016Full year
2017Full year
2016
Operating income
Income from interest 472 373 1,711 1,297
Interest expenses –37 –21 –130 –78
Commission income 4 5 15 16
Commission expenses –54 –42 –197 –142
Other operating income 62 53 221 200
Total operating income 447 368 1,620 1,293
Operating expenses
General administration costs –115 –89 –393 –325
Depreciation of property, plant and equipment and amortization of intangible fixed assets –17 –12 –60 –40
Other operating costs –88 –79 –310 –287
Total expenses before credit losses –220 –180 –763 –652
Earnings before credit losses 227 188 857 641
Credit losses, net –57 –33 –189 –120
Operating earnings according to the Swedish Annual Accounts Act for Credit Institutions and Securities Companies (ÅRKL) 170 155 668 521
Tax on earnings for the year –41 –35 –151 –116
Earnings for the year 129 120 517 405
C/I ratio 0.49 0.49 0.47 0.50

15Collector AB (publ) 556560-0797, Year-end report January–December 2017
Income per significant type of income
Note 2
Amounts in SEK million Q4 2017 Q4 2016 Full year 2017 Full year 2016
Group
Credit management 26 27 107 103
Commission income 4 5 15 16
Income from interest 464 373 1,697 1,297
Other income 36 26 114 97
530 431 1,933 1,513

16Collector AB (publ) 556560-0797, Year-end report January–December 2017
Segment reporting
Note 3
Amounts in SEK million (Q4 2017) Retail Corporate EliminationsCollector
Group
Income, external customers 333 197 – 530
Income, internal 24 16 –40 0
Total income 357 213 –40 530
Earnings before tax 80 90 0 170
Lending and other receivables 10,411 9,096 0 19,507
Amounts in SEK million (Q4 2016) Retail Corporate EliminationsCollector
Group
Income, external customers 290 141 – 431
Income, internal 22 11 –33 0
Total income 312 152 –33 431
Earnings before tax 94 61 – 155
Lending and other receivables 8,244 4,998 – 13,242
Amounts in SEK million (full year 2017) Retail Corporate EliminationsCollector
Group
Income, external customers 1,260 674 – 1,933
Income, internal 87 50 –136 0
Total income 1,346 723 –136 1,933
Earnings before tax 368 300 – 668
Lending and other receivables 10,411 9,096 – 19,507
Amounts in SEK million (full year 2016) Retail Corporate EliminationsCollector
Group
Income, external customers 1,036 478 – 1,513
Income, internal 79 36 –116 0
Total income 1,115 514 –116 1,513
Earnings before tax 333 188 – 521
Lending and other receivables 8,244 4,998 – 13,242
17Collector AB (publ) 556560-0797, Year-end report January–December 2017
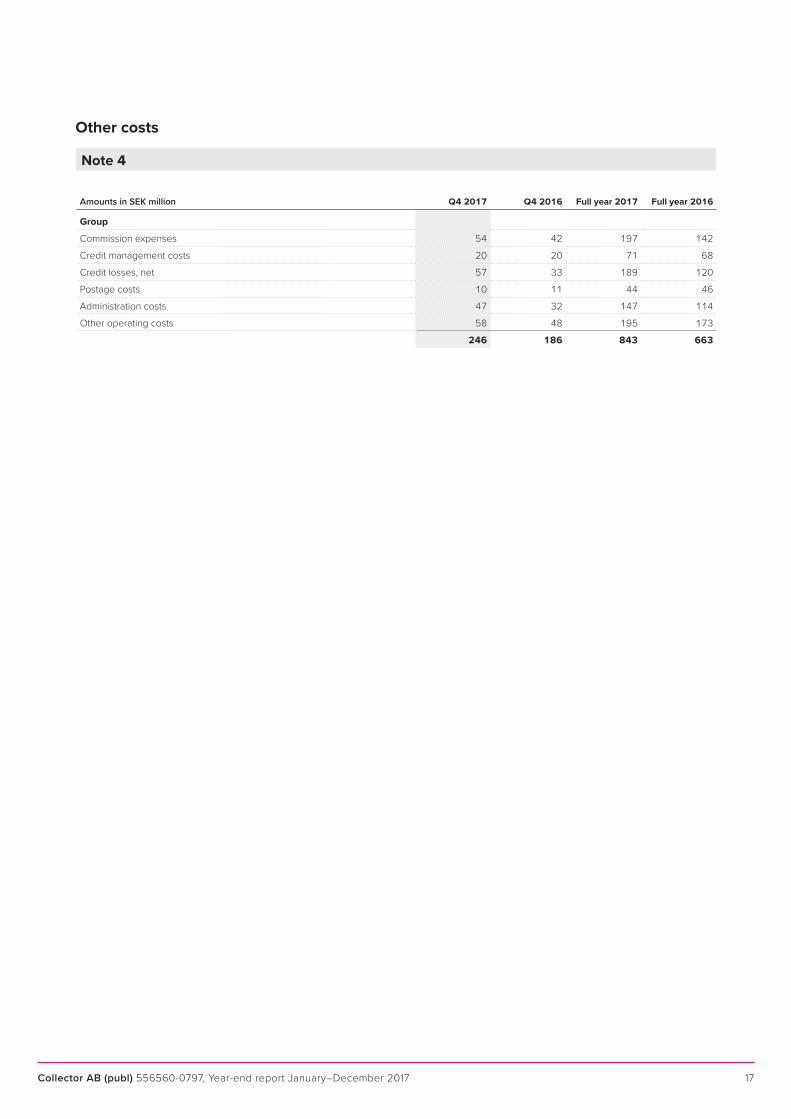
Other costs
Note 4
Amounts in SEK million Q4 2017 Q4 2016 Full year 2017 Full year 2016
Group
Commission expenses 54 42 197 142
Credit management costs 20 20 71 68
Credit losses, net 57 33 189 120
Postage costs 10 11 44 46
Administration costs 47 32 147 114
Other operating costs 58 48 195 173
246 186 843 663
18Collector AB (publ) 556560-0797, Year-end report January–December 2017
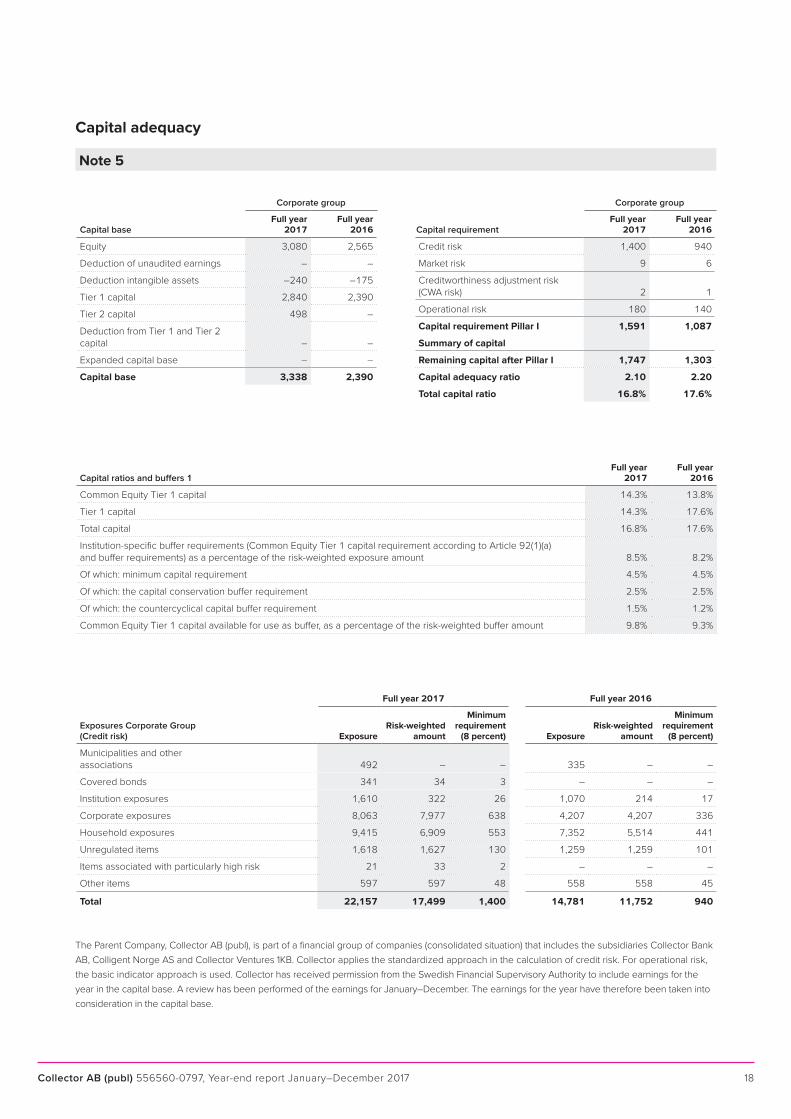
Capital adequacy
Corporate group
Capital requirementFull year
2017Full year
2016
Credit risk 1,400 940
Market risk 9 6
Creditworthiness adjustment risk (CWA risk) 2 1
Operational risk 180 140
Capital requirement Pillar I 1,591 1,087
Summary of capital
Remaining capital after Pillar I 1,747 1,303
Capital adequacy ratio 2.10 2.20
Total capital ratio 16.8% 17.6%
Full year 2017 Full year 2016
Exposures Corporate Group (Credit risk) Exposure
Risk-weighted amount
Minimum requirement
(8 percent) ExposureRisk-weighted
amount
Minimum requirement
(8 percent)
Municipalities and other associations 492 – – 335 – –
Covered bonds 341 34 3 – – –
Institution exposures 1,610 322 26 1,070 214 17
Corporate exposures 8,063 7,977 638 4,207 4,207 336
Household exposures 9,415 6,909 553 7,352 5,514 441
Unregulated items 1,618 1,627 130 1,259 1,259 101
Items associated with particularly high risk 21 33 2 – – –
Other items 597 597 48 558 558 45
Total 22,157 17,499 1,400 14,781 11,752 940
The Parent Company, Collector AB (publ), is part of a financial group of companies (consolidated situation) that includes the subsidiaries Collector Bank AB, Colligent Norge AS and Collector Ventures 1KB. Collector applies the standardized approach in the calculation of credit risk. For operational risk, the basic indicator approach is used. Collector has received permission from the Swedish Financial Supervisory Authority to include earnings for the year in the capital base. A review has been performed of the earnings for January–December. The earnings for the year have therefore been taken into consideration in the capital base.
Corporate group
Capital baseFull year
2017Full year
2016
Equity 3,080 2,565
Deduction of unaudited earnings – –
Deduction intangible assets –240 –175
Tier 1 capital 2,840 2,390
Tier 2 capital 498 –
Deduction from Tier 1 and Tier 2 capital – –
Expanded capital base – –
Capital base 3,338 2,390
Note 5
Capital ratios and buffers 1Full year
2017Full year
2016
Common Equity Tier 1 capital 14.3% 13.8%
Tier 1 capital 14.3% 17.6%
Total capital 16.8% 17.6%
Institution-specific buffer requirements (Common Equity Tier 1 capital requirement according to Article 92(1)(a) and buffer requirements) as a percentage of the risk-weighted exposure amount 8.5% 8.2%
Of which: minimum capital requirement 4.5% 4.5%
Of which: the capital conservation buffer requirement 2.5% 2.5%
Of which: the countercyclical capital buffer requirement 1.5% 1.2%
Common Equity Tier 1 capital available for use as buffer, as a percentage of the risk-weighted buffer amount 9.8% 9.3%

19Collector AB (publ) 556560-0797, Year-end report January–December 2017
Calculation of fair value
The table below shows financial instruments measured at fair value, based on how the classification in the fair value hierarchy was made. The levels are defined as follows: • Quoted prices (unadjusted) in active markets for identical assets or liabilities (Level 1) • Inputs other than quoted prices included in Level 1 that are observable for the asset or liability, either directly (for example, as prices) or indirectly (for example, derived from prices) (Level 2). • Inputs for the asset or liability that are not based on observable market data (i.e. unobservable data) (Level 3)
The following table shows the Group’s financial assets and liabilities measured at fair value as at 31 December 2017.
Level 1 Level 2 Level 3 Total
Assets
Financial assets measured at fair value via the income statement
Derivative instruments – 26 – 26
Financial investments – 814 125 939
Total assets – 840 125 965
Liabilities
Financial liabilities measured at fair value via the income statement
Derivative instruments – fair value option – 2 – 2
Derivative instruments held for trading (currency derivatives) – – – –
Total liabilities – 2 – 2
The following table shows the Group’s financial assets and liabilities measured at fair value as at 31 December 2016.
Level 1 Level 2 Level 3 Total
Assets
Financial assets measured at fair value via the income statement
Derivative instruments – 33 – 33
Financial investments – 322 40 362
Total assets – 355 40 395
Liabilities
Financial liabilities measured at fair value via the income statement
Derivative instruments held for trading (currency derivatives) – – – –
Total liabilities – – – –
For other financial assets and liabilities, the carrying amount corresponds to the estimated fair value in all material respects.
Note 6

20Collector AB (publ) 556560-0797, Year-end report January–December 2017
Income Statement, Parent CompanyAmounts in SEK million Q4 2017 Q4 2016
Full year 2017
Full year 2016
Operating income 24 18 79 65
Operating expenses
Other external costs –25 –18 –76 –63
Depreciation of property, plant and equipment and amortization of intangible fixed assets –3 –3 –13 –13
Operating earnings –4 –3 –10 –11
Earnings from financial itemsEarnings from holdings in Group companies – – – 0
Interest income and similar items 9 0 9 0
Interest expenses and similar items –3 0 –4 0
Earnings after interest and tax 2 –3 –5 –11
AppropriationsAppropriations, other 14 18 14 18
Earnings before tax 16 15 9 7
Income tax 0 –4 0 –2
Earnings for the year 16 11 9 5
Parent CompanyINCOME STATEMENT
21Collector AB (publ) 556560-0797, Year-end report January–December 2017
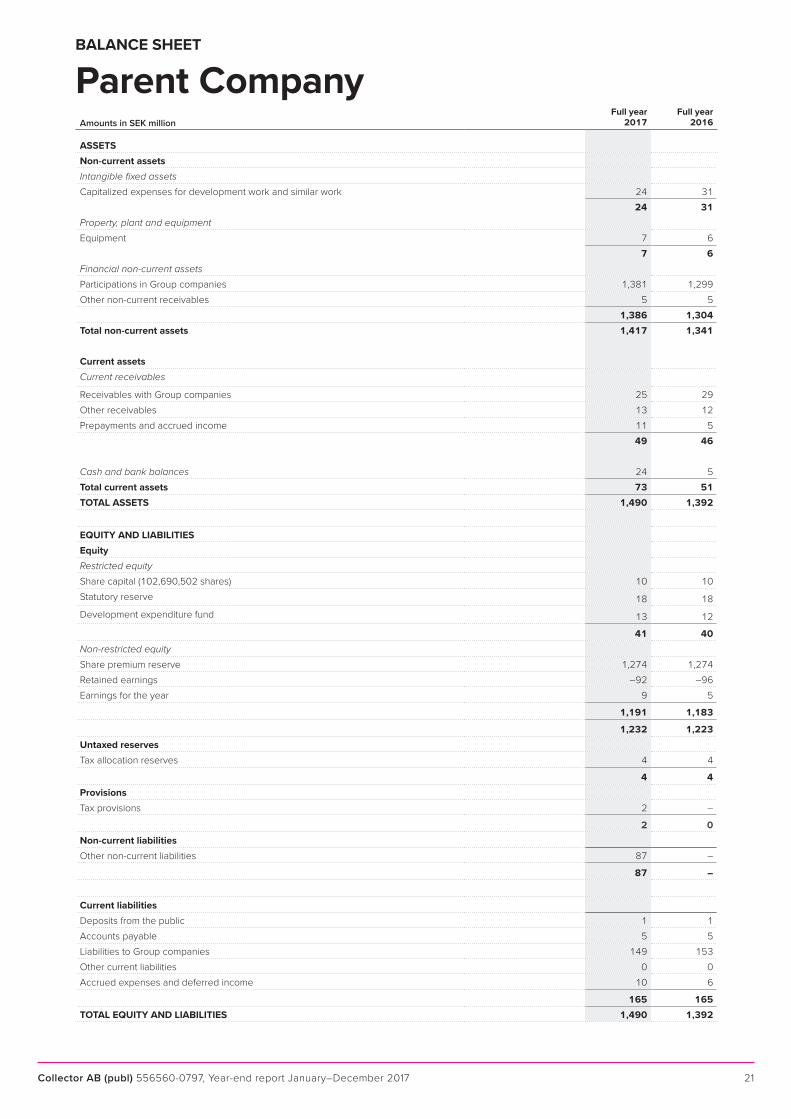
Parent CompanyBALANCE SHEET
Amounts in SEK millionFull year
2017Full year
2016
ASSETSNon-current assetsIntangible fixed assets
Capitalized expenses for development work and similar work 24 31
24 31Property, plant and equipment
Equipment 7 6
7 6Financial non-current assets
Participations in Group companies 1,381 1,299
Other non-current receivables 5 5
1,386 1,304Total non-current assets 1,417 1,341
Current assetsCurrent receivables
Receivables with Group companies 25 29
Other receivables 13 12
Prepayments and accrued income 11 5
49 46
Cash and bank balances 24 5
Total current assets 73 51TOTAL ASSETS 1,490 1,392
EQUITY AND LIABILITIESEquityRestricted equity
Share capital (102,690,502 shares) 10 10
Statutory reserve 18 18
Development expenditure fund 13 12
41 40Non-restricted equity
Share premium reserve 1,274 1,274
Retained earnings –92 –96
Earnings for the year 9 5
1,191 1,183
1,232 1,223Untaxed reservesTax allocation reserves 4 4
4 4ProvisionsTax provisions 2 –
2 0Non-current liabilitiesOther non-current liabilities 87 –
87 –
Current liabilitiesDeposits from the public 1 1
Accounts payable 5 5
Liabilities to Group companies 149 153
Other current liabilities 0 0
Accrued expenses and deferred income 10 6
165 165TOTAL EQUITY AND LIABILITIES 1,490 1,392