Embed Size (px)
Citation preview

GOVERNMENT OF PAKISTAN MINISTRY OF FINANCE
REVENUE DIVISION ISLAMABAD
YEAR BOOK 2006-2007

Fiscal Research and Statistics (FR&S) Wing, FBR The Revenue Division Year Book 2006-07 has been prepared by the Research Team of the FR&S Wing and includes:
1. Dr. Ather Maqsood Ahmed
Member, Fiscal Research and Statistics 2. Robina Ather Ahmed
Chief (FR&S) 3. Umar Wahid
Secretary (FR&S-I) 4. Sharfuddin Pirzada
Secretary (FR&S-II) 5. Mir Ahmed Khan
Second Secretary (FR&S-I) 6. Naeem Ahmed
Second Secretary (FR&S-II) Contact: Editor of the Series: Dr. Ather Maqsood Ahmed Member, Fiscal Research and Statistics e-mail: [email protected] Phone: (051)-920-4436 Fax: (051)-921-9211 February 2008

Our Vision To be Modern, Progressive, Effective, Autonomous and Credible Organization for Optimizing Revenue by Providing Quality Service and Promoting Compliance with Tax and Related Laws.
Our Mission
Enhance the Capacity of the Tax System to Collect Due Taxes through Application of Modern Techniques, Providing Taxpayer Assistance and by Creating a Motivated, Satisfied Dedicated and Professional Workforce
Our Values Integrity
Professionalism Teamwork Courtesy Fairness
Transparency Responsiveness

Table of Contents
Pages Foreword i Chapter 1: The Structure of Revenue Organization 1 Chapter 2: Prime Minister’s Goals/ Targets Initiative
and FBR Achievements 7 o Tax Revenue Target 8 o Broadening of Tax Base 9 o Liquidation of Refunds 10 o Establishment of Model Units 10 o Effective Dispute Resolution 11 o Other Important Achievements 11
Chapter 3: FBR Revenue Collection vis-à-vis Targets 21 Chapter 4: Tax Administration Reform Program 35 Chapter 5: Concluding Observations 41 Special Events 43
President General Pervez Musharraf and Prime Minister Shaukat Aziz visit FBR 44 President’s Address in National Conference on Tax Administration Reform Program 47 The Prime Minister Shaukat Aziz inaugurates IC3 terminal 51
Statistical Appendix 54-62

Revenue Division Year Book 2006-07 i
Foreword The Federal Board of Revenue has successfully surpassed the assigned target of Rs. 835 billion for fiscal year 2006-07. This is the fifth consecutive year that the start-of-the-year-target has been accomplished. The buoyant tax collection has not only enabled FBR to surpass its target, it has also resulted into marked improvement in Tax/GDP ratio from 9.4% in 2005-06 to 9.7% in 2006-07. In fact, this is the 2nd consecutive year that the Tax/GDP ratio has increased by 0.3% per year, which is consistent with the ten-year revenue vision of the organization. Surely, the unprecedented outcome signals an improvement in the tax structure, which has become more responsive to growth and discretionary tax measures. The current edition of Revenue Division Year Book 2006-07, third in the series, presents an elaborate analysis of Goals and Targets assigned to FBR under the Prime Minister’s Goal/Target initiative. For FBR, Resource Mobilization has been at the top of the Goal/Target initiative list. Therefore, the volume provides a detailed analysis of tax collection. Besides providing an up-date on various projects/ initiatives under the tax administration reform program (TARP), the Year Book also highlights the details of major events that took place during the year. It was a special occasion in the history of FBR when the President and the Prime Minister of Pakistan visited FBR to provide guideline to senior management on its ten-year revenue vision. The President was also kind enough to be among the participants of the First Tax Reform Conference held in Karachi during the year. While deeply commending the efforts of research team of FBR for the preparation and publication of Revenue Division Year Book 2006-07, I invite our valued readers to offer their comments on this effort.
(M. Abdullah Yusuf) Secretary General Revenue Division/ Chairman, FBR
.
Revenue Division Year Book 2006-07 1
Chapter 1
The Structure of the Revenue Organization
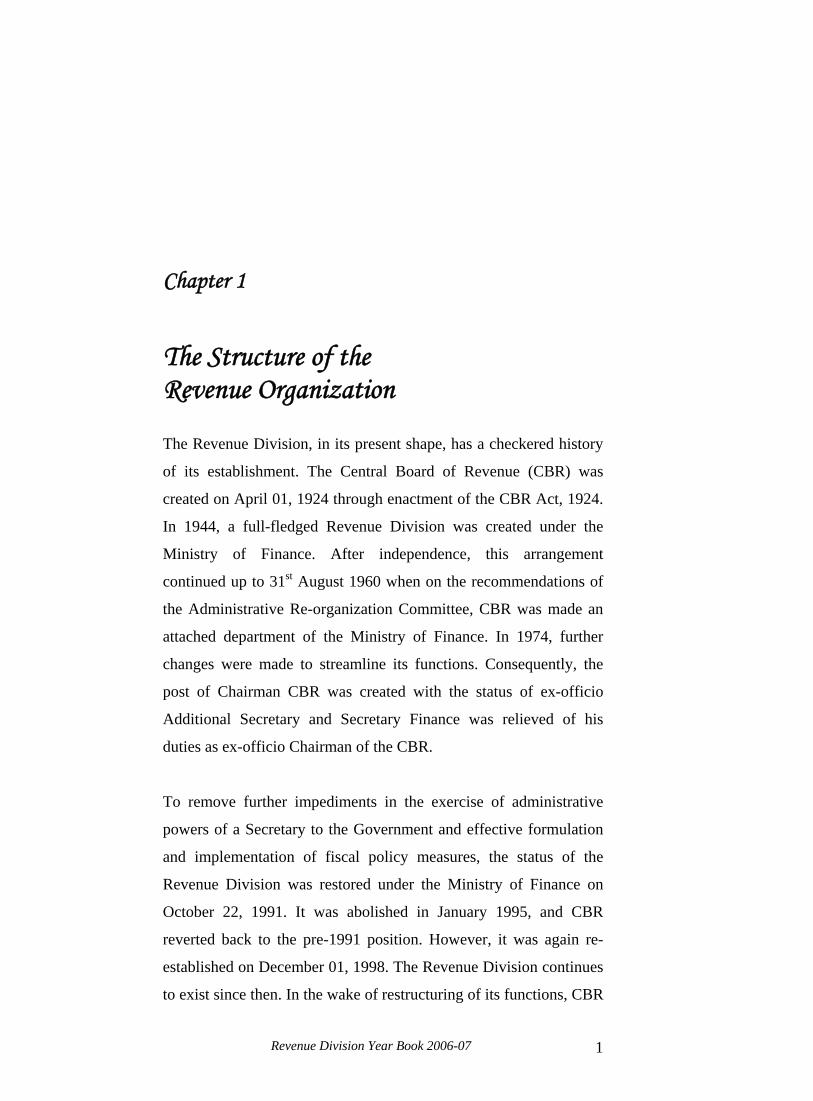
The Revenue Division, in its present shape, has a checkered history
of its establishment. The Central Board of Revenue (CBR) was
created on April 01, 1924 through enactment of the CBR Act, 1924.
In 1944, a full-fledged Revenue Division was created under the
Ministry of Finance. After independence, this arrangement
continued up to 31st August 1960 when on the recommendations of
the Administrative Re-organization Committee, CBR was made an
attached department of the Ministry of Finance. In 1974, further
changes were made to streamline its functions. Consequently, the
post of Chairman CBR was created with the status of ex-officio
Additional Secretary and Secretary Finance was relieved of his
duties as ex-officio Chairman of the CBR.
To remove further impediments in the exercise of administrative
powers of a Secretary to the Government and effective formulation
and implementation of fiscal policy measures, the status of the
Revenue Division was restored under the Ministry of Finance on
October 22, 1991. It was abolished in January 1995, and CBR
reverted back to the pre-1991 position. However, it was again re-
established on December 01, 1998. The Revenue Division continues
to exist since then. In the wake of restructuring of its functions, CBR

Revenue Division Year Book 2006-07 2
has adopted new Act under which it has been renamed as Federal
Board of Revenue (FBR) since July 2007.
Functions of Revenue Division/ FBR In the existing setup, the Chairman, FBR, being the executive head
of the Board as well as Secretary of the Revenue Division1 has the
responsibilities of:
• Formulation and administration of taxation policy; • Levy and collection of federal taxes; • Quasi-judicial function of hearing of appeals; • Enter into double-taxation treaties with other countries; • Liaise with all Ministries as well as Chambers of Trade and
Industry; and • Provide an up-date on FBR activities to the President and the
Prime Minister of Pakistan.
Organizational Set-up In the present setup, the Secretary General, Revenue Division/
Chairman, FBR is assisted by the three Line Members (one each for
Direct Taxes, Sales Tax and Federal Excise Duties, and Customs),
three Support Members (Legal, Tax Policy and Reforms, and
Administration and Coordination); and five Functional Members
(Human Resource Management, Information Management System,
Audit, Facilitation and Taxpayers Education, and Fiscal Research
and Statistics). The functional members have been inducted from the
private sector as part of the restructuring of the FBR and its field
1 The present Chairman also holds the position of Secretary General, Revenue Division.

Revenue Division Year Book 2006-07 3
formations. Besides this top tier, senior management also includes
various Director General and Chief Collector positions (Figure 1).
During 2006-07, the indirect taxes (sales tax, federal excise duties,
and customs) were handled by 19 Collectorates situated all across
the country and two Large Taxpayer Offices (LTUs). Now all
internal taxes, i.e., income and corporate taxes, sales tax (GST) and
Federal Excise have nearly been co-located within Regional Tax
Offices (RTOs), and trade related taxes are increasingly being
handled by Model Customs Collectorates (MCCs) with two regional
hubs at Karachi and Lahore.

Revenue Division Year Book 2006-07 4
Secretary General / Chairman FBR and Members photographed with President, Prime Minister, Advisor to the Prime Minister, and Minister of State on Finance & Revenue
Front Row (Left to Right):, Mr. Salman Nabi (Member DT), Mr. Omar Ayub Khan (MOS), Mr. Shaukat Aziz (Prime Minister), General Pervez Musharraf (President of Pakistan),
Mr. Abdullah Yusuf (Secretary General/ Chairman), Dr. Salman Shah (Advisor), Maj. Gen ® Muhammad Yasin (Member Administration)
Back Row (Left to Right): Mr. Shahid Rahim (Member Customs), Mr. Mohammad Talha (Member HRM), Mr. Abdul Razzaque (Member Audit), Mr. Mumtaz Ahmad (Member Legal), Mr. Aamir Z. Chaudhary (Member IMS), Mr. Habib Fakhruddin (Member Tax Policy & Reforms), Ms. Mussarat Jabeen (Member Sales Tax and Federal Excise),
Dr. Ather Maqsood Ahmed (Member Fiscal Research & Statistics), and Mr.Hafeez Mughal (PRO).

Revenue Division Year Book 2006-07 5
The names of Secretaries/ Ex-officio Chairmen, full time Chairmen;
Secretary General Revenue Division/ Chairmen and Vice Chairmen,
who headed the Revenue Division/ CBR from August 14, 1947
onwards, are presented below for ready reference.
Finance Secretaries/ Ex-Officio Chairman, CBR 1) Sir Victor Turner 14.08.1947 01.02.1950 2) Mr. Abdul Qadir 01.02.1950 25.02.1952 3) Mr. Mumtaz Hasan 25.02.1952 01.11.1958 4) Mr. H. A. Majid 01.11.1958 29.07.1960 5) Mr. M. Ayub 29.07.1960 19.06.1961 6) Mr. Mumtaz Mirza 19.06.1961 06.03.1963 7) Mr. M. M. Ahmed 06.03.1963 30.05.1966 8) Mr. Ghulam Ishaq Khan 31.05.1966 08.09.1970 9) Mr. A.G.N. Kazi 08.09.1970 10.10.1971 Chairman, CBR 1) Mr. M. Zulfiqar 11.10.1971 17.11.1973 2) Mr. Riaz Ahmad 17.11.1973 30.09.1974 3) Mr. M. Zulfiqar 01.10.1974 12.11.1975 4) Mr. N.M. Qureshi 12.11.1975 14.12.1980 5) Mr. Fazlur Rahman Khan 14.12.1980 11.08.1985 6) Mr. I.A. Imtiazi 11.08.1985 20.08.1988 7) Syed Aitezazuddin Ahmed 20.08.1988 02.01.1989 8) Mr. Ghulam Yazdani Khan 22.01.1989 11.08.1990 9) Mr. Ahadullah Akmal 16.08.1990 24.07.1991 10) Mr. Sajjad Hasan 24.07.1991 03.10.1991 Secretary Revenue Division/ Chairman, CBR 1) Mr. Sajjad Hasan 03.10.1991 03.11.1992 2) Mr. M. Mubeen Ahsan 03.11.1992 03.05.1993 3) Qazi M. Alimullah 03.05.1993 17.07.1993 4) Mr. Javed Talat 26.07.1993 01.07.1994 5) Mr. A.R. Siddiqi 11.07.1994 11.01.1995

Revenue Division Year Book 2006-07 6
Chairman, CBR 1) Mr. Alvi Abdul Rahim 13.07.1995 28.08.1996 2) Mr. Shamim Ahmed 28.08.1996 11.11.1996 3) Mr. Hafeezullah Ishaq 11.11.1996 02.01.1998 4) Mr. Moinuddin Khan 02.01.1998 06.11.1998 Secretary Revenue Division/ Chairman, CBR/ FBR 1) Mian Iqbal Farid 07.11.1998 06.11.1999 2) Mr. Riaz Hussain Naqvi 08.11.1999 02.07.2001 3) Mr. Riaz Ahmad Malik 03.07.2001 11.03.2004 4) Mr. M. Abdullah Yusuf 12.03.2004 14.06.2006 Secretary General Revenue Division/ Chairman, CBR/ FBR 1) Mr. M. Abdullah Yusuf 14.06.2006 To-date
Revenue Division Year Book 2006-07 7
Chapter 2
Achievements on Prime Minister’s Goals - Targets Initiative
FBR during the past few years has under taken wide ranging reforms
on policy and administrative side. In order to keep track of these
developments, the Prime Minister Secretariat started the Goal-
Target Initiative in 2004-05. Since then a progress report on the
selected indicators is being submitted regularly to the PM Secretariat
on quarterly basis. Like previous years, FBR has accomplished most
of the goals/ targets fixed for 2006-07. Following is the list of
assigned goals and targets.
1. Collection of Federal Tax Receipts more than the assigned budgetary targets;
2. Broadening of Income Tax base by 20% at the end of the year;
3. Broadening of Sales Tax base by 10% at the end of the year;
4. Liquidation of Income Tax refunds by 40% at close of the year;
5. Liquidation of Sales Tax refunds by 40% at close of the year;
6. Establishment of model tax units;
7. Effective Dispute Resolution (all taxes) – Reduction of Pending Appeals;2
2 Besides these Targets, the update on Installation of Scanners and adoption of Crash Program for Assessment of under and over-invoicing was also monitored by the Prime Minister Secretariat.

Revenue Division Year Book 2006-07 8
Tax Revenue Target Unlike past performance, the FBR has been successfully achieving
the start of the year targets since 2002-03 (Graph 1). During 2006-
07, the revenue organization was able to mobilize resources to the
tune of Rs. 847.2 billion against the target of Rs. 835 billion,
entailing higher collection of Rs.12.2 billion. The (net) collection
has been 18.8% higher than Rs.713.4 billion collected during last
year, resulting into improvement in Tax/GDP ratio by 0.3
percentage points. This achievement has been consistent with the
overall ten year revenue vision of the organization presented to the
President and Prime Minister of Pakistan when they visited FBR on
February 22, 2007.
Graph 1: FBR Collection vs Revenue Target
458.9510
590
690
835
460.6520.8
590.4
713.4
847.2
0100200300400500600700800900
02-03 03-04 04-05 05-06 06-07
Rs.
Bill
ion
Target Collection
This is the fifth consecutive year that the assigned target has been
surpassed. The remarkable performance by FBR has been possible
due to multiple factors including the overall stability and growth of
the economy resulting into robust growth in tax bases and efficiency

Revenue Division Year Book 2006-07 9
gains emanating from tax policy and administrative reforms that
have changed the culture of tax collection from full-assessment to
self-assessment. Now the focus is on reduction and rationalization of
tax and tariff rates on the one hand and facilitating environment for
taxpayers to understand tax obligations on the other.
Broadening of Tax Base Income Tax: Ever since the initiation of the reform program, the
number of return filers is increasing gradually. From a modest
number of close a million return filers, the number has increased to
1.81 million in 2006-07. Similarly, there has been a substantial
increase in voluntary compliance due to various initiatives. The
promulgation of the Income Tax Ordinance, 2001 was the first step
towards this objective. This together with simplified rules and
procedures has enabled taxpayers to comply relatively easily. At the
same time, a simplified system of self-assessment (USAS) has been
introduced. Under the USAS all the taxpayers automatically qualify
for self-assessment. The returns filed by them are considered as final
unless their cases are selected for audit through pre-announced audit
parameters.
Sales Tax (GST): Within the GST regime, a number of steps have
been taken in order to broaden the tax base. These include
introduction of simplified schemes for small taxpayers, and
broadening the coverage of tax, by bringing various services into the
tax net so that the burden of taxation is shared by all sectors that are
also contributing to GDP. Furthermore, an ‘outreach’ program has

Revenue Division Year Book 2006-07 10
been developed and launched in collaboration with trade
associations to educate small and medium traders and business
concerns about their tax responsibilities. With the help of these
measures, the number of registered persons has increased from
116,686 in 2005-06 to 128,380 in 2006-07, showing a growth of
10%.
Liquidation of Refunds (Income Tax and Sales Tax) In the light of continuous complaints regarding delayed disposal of
refunds, both from the taxpayers and tax collectors, the entire
system required revisiting. The implementation of STARR/
STREAMS project under the tax administration reforms program
was the initial break through. Since then the system has been further
enhanced and has now been up-graded with a new system CREAST.
Currently, the automated refund processing system based on risk
assessment – the RRAS (Risk-based Refund Analysis System) is
running successfully and has helped in substantial liquidation of
pending refund claims. Similarly, within the income tax system, the
Tax Management System is being used to process refund claims and
payments. During 2006-07, an amount of Rs.32.2 billion was issued
to 195,820 claimants and resultantly the pendency was reduced to
only Rs.7 billion.
Establishment of Model Tax Offices
The future set up of field formations envisages a clear segregation
into internal (domestic) taxes and international trade taxes. The
domestic taxes will operate through Regional Tax Offices (RTOs),

Revenue Division Year Book 2006-07 11
whereas the international trade taxes will be handled by Model
Custom Collectorates. The One-Customs setup will be gradually
replaced by PaCCS currently being used within the CARE project.
Most of the RTOs are now in place where the offices of Income and
Sales Tax and excise duties have been co-located. Similarly,
sufficient progress has been made on MCCs and appointments of
Chief Collector North and South have also been made.
Effective Dispute Resolution FBR has made tremendous progress in disposing off pending
appeals. Around 46,537 were decided in 2004-05. As a result, only
4175 cases were pending on July 2006. By June 2007 30,920 cases
including the pending cases have been decided and there is no
further long-term pendency. The new strategy of FBR is that all new
appeals and adjudication cases should be settled within 90 days of
their filing as per law. This policy has been actively pursued to
provide relief to the taxpayers. Similarly, as a result of hectic efforts
a large number of cases at the higher legal fora have also been
decided.
Other Important Achievements
Crash Program for under and over-invoicing Under and over-invoicing is an international phenomenon. The complexity in technical calculation and the delicacy of it usually leads to tax evasion. In order to curb this menace, FBR has established the Valuation Wing so that assessment of the imports is carried out on scientific lines all across the country.

Revenue Division Year Book 2006-07 12
e-Filing: During the last decade, the electronic transfer of business information has expanded very rapidly in the world. Tax return is no exception and electronic filing has become a common practice in most of the advanced world. As part of major initiative to facilitate taxpayers and collect and process data more accurately, FBR has introduced e-filing of income and sales tax returns from December 2005. As expected, this initiative has been widely been appreciated and majority of FBR corporate clients are now using this facility, which has also reduced their cost of compliance substantially.
Simplification of Tax Return Forms: The cumbersome and
lengthy tax return forms both of sales tax and income tax have been
simplified and reduced to one page only. The new tax returns forms
will be applicable from September 2008. The requirement of
annexure with returns has been done away with especially for the
corporate taxpayers filing their returns electronically. However, if
deemed necessary at the time of desk audit a need is felt for detailed
accounts, the same would be requested from the relevant taxpayer.

Revenue Division Year Book 2006-07 13
Table: Goals/Targets Monitoring and Evaluation Report for Revenue Division Financial Year 2006-07
FY 2006-07 S.No. Goals/Targets
Q1 Q2 Q3 Q4
Comp. Status Review
G: 1 Revenue collection of Rs. 690 billion(FY 05-06)
Actual Collection during FY2005-06 was Rs. 713.4 billion
T: 1 Collection of Rs. 145.5 billion Yes
T: 2 Cumulative : Rs. 308.6 billion Yes
T: 3 Cumulative : Rs. 476.4 billion Yes
T: 4
Additional Rs. 213.6 billion to achieve target of Rs. 690 billion Yes
Revenue collection of Rs. 835 billion(FY 06-07)
T: 5 Collection of Rs. 178.4 billion
Collected Rs. 183.9
billion Yes Target Achieved
T: 6 Cumulative : Rs. 381.1 billion
Collected Rs. 410.5
billion Yes Target Achieved
T: 7 Cumulative : Rs. 579.8 billion
Collected Rs. 597.0
billion Yes Target Achieved
T: 8
Additional Rs. 255.2 billion to achieve target of Rs. 835 billion
Collected Rs. 847.2
billion
Target for FY: 2006-07 Rs. 835 Billion Collection Rs. 847.2 Billion Target Achieved
G: 2
Broadening of Taxpayers Base: Increase income tax return filers by 20% (Filers End June 2005: 1.23 million) (FY 2005-06)
Total return filers at the end of FY: have been increased to 1.49 million.
T: 1 Increase in income tax return filers by 5% Yes

Revenue Division Year Book 2006-07 14
T: 2
Ensure increase in income tax return filers by another 5% Yes
T: 3
Ensure increase in income tax return filers by another 5% Yes
T: 4
Increase in income tax return filers by 5% to achieve cumulative increase of 20% Yes
Broadening of Taxpayers Base: Increase income tax return filers by 20% (Filers End June 2006: 1.49 million) (FY 2006-07)
T: 5 Increase in income tax return filers by 5%
1.45 million returns
received.
Yes
September to September growth in return filing has been 25.6%. Target achieved.
T: 6
Ensure increase in income tax return filers by another 5%
1.51 million returns
received.
Yes
December to December growth in return filing has been 18.9%. Target achieved.
T: 7
Ensure increase in income tax return filers by another 5%
1.66 million returns
received.
Yes March to March growth in return filing has been 22%. Target achieved.
T: 8
Increase in income tax return filers by 5% to achieve cumulative increase of 20%
1.81 million returns
received.
Yes
FY;2006-06 to FY:2006-07 growth in return filing has been 21.5%. Target achieved.
G: 3
Broadening of Taxpayers Base: Increase sales tax registration by 15% (Base:101,851) (FY 05-06)
At the end of the FY:2005-06 total new registration added to base figure has reached to 1,16,686
T: 1 Increase in sales tax return filers by 3% Yes

Revenue Division Year Book 2006-07 15
T: 2
Ensure increase in sales tax return filers by another 4% Yes
T: 3
Ensure increase in sales tax return filers by another 4% Yes
T: 4
Increase in sales tax return filers by 4% to achieve cumulative increase of 15% Yes
Broadening of Taxpayers Base: Increase sales tax registration by 10% (Base:1,16,686) (FY 06-07)
T: 5 Increase in sales tax return filers by 2%
New registration = 2650
Yes Target for the Quarter= 2334 Achievement = 2650 Target achieved.
T: 6
Ensure increase in sales tax return filers by another 3%
New registration=2750
Yes
At the end of 2nd Quarter 5400 new registration has been made against the target of 5835. Thus target Achievement has been 92.5%
T: 7
Ensure increase in sales tax return filers by another 2%
New registration=2574
Yes
Target of new registration for 3rd Quarter= 2334. New registrations = 2574 Target Achieved
T: 8
Increase in sales tax return filers by 3% to achieve cumulative increase of 10%
New registration=3720
Yes
Target of new registration for Fy:2006-07= 11669. New registrations = 11694 . Target achieved
G: 4
Liquidation of Refunds: Reduce stocks of available refunds of income tax. Opening Balance (Rs. 13.4 billion Non Banking) (FY 05-06)
Closing Balance has been reduced to Rs. 8.04 billion
Revenue Division Year Book 2006-07 16
T: 1 Reduce stock of available refunds by 10% Yes
T: 2
Reduce stock of available refunds by additional 10% Yes
T: 3
Reduce stock of available refunds by additional 10% Yes
T: 4
Reduce stock of available refunds by additional 10% Yes
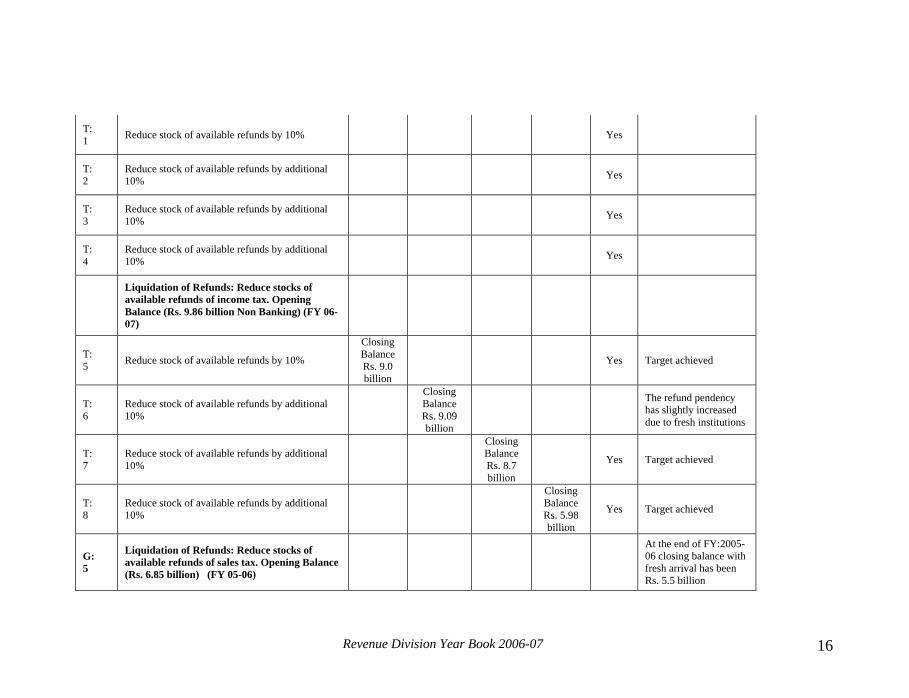
Liquidation of Refunds: Reduce stocks of available refunds of income tax. Opening Balance (Rs. 9.86 billion Non Banking) (FY 06-07)
T: 5 Reduce stock of available refunds by 10%
Closing Balance Rs. 9.0 billion
Yes Target achieved
T: 6
Reduce stock of available refunds by additional 10%
Closing Balance Rs. 9.09 billion
The refund pendency has slightly increased due to fresh institutions
T: 7
Reduce stock of available refunds by additional 10%
Closing Balance Rs. 8.7 billion
Yes Target achieved
T: 8
Reduce stock of available refunds by additional 10%
Closing Balance Rs. 5.98 billion
Yes Target achieved
G: 5
Liquidation of Refunds: Reduce stocks of available refunds of sales tax. Opening Balance (Rs. 6.85 billion) (FY 05-06)
At the end of FY:2005-06 closing balance with fresh arrival has been Rs. 5.5 billion

Revenue Division Year Book 2006-07 17
T: 1 Reduce stock of available refunds by 10% Yes
T: 2
Reduce stock of available refunds by additional 10% Yes
T: 3
Reduce stock of available refunds by additional 10% Yes
T: 4
Reduce stock of available refunds by additional 10% Yes
Liquidation of Refunds: Reduce stocks of available refunds of sales tax. Opening Balance (Rs. 5.5 billion) (FY 06-07)
T: 5 Reduce stock of available refunds by 10%
Closing Balance Rs. 4.5 billion
(*)
Yes
Target achieved. (*) Relates to refund paid out of the balance stock at the end of 4th Quarter of FY: 2005-06.
T: 6
Reduce stock of available refunds by additional 10%
Closing Balance Rs. 2.0 billion
Yes Do
T: 7
Reduce stock of available refunds by additional 10%
Closing Balance Rs. 0.8 billion
Yes Do
T: 8
Reduce stock of available refunds by additional 10%
Closing Balance Rs. 0.4 billion
Yes Target achieved
G: 6
Improvement of efficiency of organization and promote taxpayer facilitation: Establishment of model tax units.(FY 05-06)
Target achieved
T: 1 Establish one MTU Yes

Revenue Division Year Book 2006-07 18
T: 2
One-Customs concept to be rolled out at 12-Stations Yes
Improvement of efficiency of organization and promote taxpayer facilitation: Establishment of model tax units. (FY 2006-07)
T: 5 Establishment of 3 RTOs and 3 TFCs
3 RTOs and 3TFCs are Functional
Yes On Target
T: 6 Establishment of 2 RTOs and 2 TFCs
2 RTOs and 2TFCs are Functional
Yes On Target
T: 7 Establishment of 5 RTOs and 5 TFCs No
Target missed and to be rolled out in FY:2007-08
T: 8 Establishment of 2 RTOs and 2 TFCs
T: 9 Establishment of 1 RTOs and 1 TFCs
T: 10 Establishment of 20 Additional TFCs No
Target missed and to be rolled out in FY:2007-08
T: 11 Establishment of 1 Model Customs Collectorate No
Target missed and to be rolled out in FY:2007-08
T: 12 Establishment of 5 Model Customs Collectorates
T: 13 Establishment of 2 Model Customs Collectorates
T: 14 Establishment of 2 Model Customs Collectorates
T: 15 Establishment of one LTU. No
Target missed and to be rolled out in FY:2007-08

Revenue Division Year Book 2006-07 19
G: 7
Effective dispute resolution (all taxes): Reduce the pending appeals (at all stages) (Baseline: Number of cases as of July 1, 2005: 6,919) (FY 2005-06)
Total number 6934 pending appeals have been disposed off during FY:2005-06.
T: 1 Reduce the pending appeals (at all stages) by 50% Yes
T: 2
Finalization of appeals and adjudication cases within 90 days of their filing as prescribed in the law.
Yes
T: 3
Finalization of appeals and adjudication cases within 90 days of their filing as prescribed in the law.
Yes
T: 4
Finalization of appeals and adjudication cases within 90 days of their filing as prescribed in the law.
Yes
Effective dispute resolution (all taxes): Reduce the pending appeals (at all stages) (Baseline: Number of cases as of July 1, 2006: 4175 ) (FY 2006-07)
T: 5
Finalization of appeals and adjudication cases within 90 days of their filing as prescribed in the law.
Appeals decided= 3379 cases
Yes
Total with Fresh institutions = 4830 . Decided= 3379 cases. Target Achieved
T: 6
Finalization of appeals and adjudication cases within 90 days of their filing as prescribed in the law.
Appeals decided= 8771
Yes
Total number of 12,150 appeals at all stages hav been decided at the end of December,2006. There is no pendency, CBR is current with appeal cases.
T: 7
Finalization of appeals and adjudication cases within 90 days of their filing as prescribed in the law.
Appeals decided= 7403
Yes
Total number of 20,347 have been decided at the end of March,2007. Ttarget achieved.
T: 8
Finalization of appeals and adjudication cases within 90 days of their filing as prescribed in the law.
Appeals decided= 19,045
Total number of 30,920 cases have been decided at the end of Fy: 2006-07. Target

Revenue Division Year Book 2006-07 20
achieved.
G: 8 Adoption of E-Government Strategy(FY 05-06)
E- filing of income tax and sales tax returns has started. E-clearance of goods at customs stations also started.
T: 1 Initiative towards e-government Yes
G: 9 Installation of Scanners at various customs stations Target Achieved.
T: 1 Installation at Port Qasim Karachi Yes
T: 2 Installation at NLC, Mughalpura Port Lahore Yes
Installation at Jamrud Scanner installed Yes
T: 3 Installation at Wahga, Chaman, and Sust
G: 10
Crash program for assessment of under and over invoicing Target Achieved.
T: 1 Custom to custom cooperation Yes
T: 2 Setting of Post Custom Assessment (PCA) Yes
T: 3 Purchase of valuation modules. Yes
-----------

Revenue Division Year Book 2006-07
21
Chapter 3
FBR Revenue Collection vis-à-vis Target
The final collection of Rs. 847.2 billion during 2006-07 exceeds the
target of Rs. 835 billion by Rs. 12.2 billion or higher by 1.5% (Table
1). The feature that FBR has surpassed the start-of-the-year revenue
target for the fifth year in a row is not only encouraging from
effective economic management standpoint, it is even more
inspiring as it reflects improved tax management and compliance
without putting undue burden on taxpayers. Nonetheless, it is also
pertinent to mention that in view of the unprecedented performance
of income and corporate taxes during 2006-07 and due to sluggish
growth of GST and customs duties, the start-of-the-year targets of
individual taxes were revised during the year without altering the
overall target.
The outcome reveals that the net collection of direct taxes has
exceeded the original target by 26.1% and the upwardly revised
target has also been surpassed by 4.9%. Regrettably, a similar
performance could not be recorded for indirect taxes. Whereas the
collection of excise duties exceeded the original target by 3.9%, it
remained short of the revised target by a small margin of Rs. 0.2
billion only. On the other hand, the year-end collection of GST and
customs duties missed the respective original as well as revised
targets due to constantly shrinking base.

Revenue Division Year Book 2006-07
22
Table 1: A Comparison of Collection vis-à-vis Targets Difference from Revised
Targets
Revised Targets
(Rs. Billion)
Collection: 2006-07
(Rs. Billion) Absolute Percent
Direct Taxes 318.0 333.7 15.7 4.9
Sales Tax (GST) 311.0 309.4 -1.6 -0.5
Federal Excise 72.0 71.8 -0.2 -0.3
Customs Duties 134.0 132.3 -1.7 -1.3
All Taxes 835.0 847.2 12.2 1.5 Source: FBR Data Bank Revenue Collection in 2006-07 vis-à-vis 2005-06
The gross and net collection during 2006-07 has been Rs.929.4
billion and Rs. 847.2 billion, showing an increase of 16.4% and
18.8%, respectively over 2005-06. In the process of crossing the Rs.
800 billion threshold, several interesting features have emerged,
some of which are presented below.
Firstly, the net collection has more than doubled within a short span
of six years starting from Rs. 404.6 billion in 2001-02 (Table 2). The
increase of around Rs. 134 billion over and above last year’s net
collection of Rs. 713.4 billion has been the highest in a single year
since FY: 47-48. Previously an increase of Rs. 123 billion was
observed during 2005-06. This confirms that there is a definite
improvement in tax effort.
Secondly, the buoyant tax collection has not only enabled FBR to
surpass its target, it has also resulted into marked improvement in
Tax/GDP ratio from 9.4% in 2005-06 to 9.7% in 2006-07. In fact,
this is the 2nd consecutive year that the Tax/GDP ratio has increased

Revenue Division Year Book 2006-07
23
by 0.3% per year, which is consistent with the ten-year revenue
vision of the organization. Surely, the unprecedented outcome
signals an improvement in the tax structure, which unlike previous
years is becoming more responsive to growth and discretionary tax
measures.
Thirdly, the income and corporate taxes have emerged as the leading
contributors to federal tax receipts followed fairly closely by GST.
There is a subtle change in the tax mix as 76% of entire net
collection now originates from income and consumption taxes.
Fourthly, riding on the overwhelming performance of the corporate
sector, especially banking and, oil and gas sectors, the direct taxes
have recorded an unprecedented growth of 48.3% during the year. In
fact, this high growth performance was sustained all through the
year. Similarly, the continuous strong domestic demand was largely
instrumental in achieving 29.9% growth in excise duties. However,
a similar strength was not achieved in the case of domestic sales tax,
as quite unexpectedly, the growth in gross as well as net collection
remained below 10%. Regarding import related taxes, namely, sales
tax at import stage and customs duties, there has been an adverse
revenue impact of slowdown of imports and dutiable imports, even
though some may appreciate this decline on account of improvement
in the balance of trade position.
Finally, it will not be out of merit to mention that a number of
additional factors have also been responsible for improved revenue

Revenue Division Year Book 2006-07
24
performance during the past few years. These include the lowering
of tax and tariff rates of capital goods to promote investment and
boost economic activity in the country, reduction of up-front cost of
doing business through automation of business processes,
continuous reduction in corporate tax rates to cultivate corporate
culture, drastic reduction in litigation burden, and most importantly,
offering a hassle-free environment to the taxpayers through
dedicated tax units and efficient workforce.
Table 2: A Comparison of Net Collection in 2006-07 and 2005-06 (Rs. Billion)
Difference
Collection 2006-07
Collection 2005-06 Absolute Percent
Direct Taxes 333.7 225.0 108.7 48.3
Sales Tax (GST) 309.4 294.8 14.6 5.0
Federal Excise 71.8 55.3 16.5 29.9
Customs Duties 132.3 138.4 -6.1 -4.4
All Taxes 847.2 713.4 133.8 18.8 Source: FBR Data Bank
Detailed Analysis of Individual Taxes
Direct Taxes: The direct taxes have surpassed the original as well as
upwardly revised targets of Rs. 264.7 billion and Rs. 318 billion,
respectively. The net collection has recorded an all time high growth
of 48.3% whereas the overall growth in gross collection has been
41.3% (Table 3). In terms of value, the net collection has reached
Rs. 333.7 billion, which is Rs. 108.7 billion higher than last year.
Some of the important features of direct taxes are as follows.

Revenue Division Year Book 2006-07
25
Firstly, compared to 2003-04 when the net collection was Rs. 165
billion, there has been more than 100% increase in net collection
within a short span of three years, which is a sure sign of
improvement in the taxation system in general and of direct taxes in
particular. Consequently, the direct tax to GDP ratio has increased
from 3% in 2005-06 to 3.8% in 2006-07.
Table 3: Head-wise Performance of Direct Taxes (Rs. Billion)
2006-07 2005-06 Change (%)
Voluntary Payments 165.2 87.4 89.0
Collection on Demand 11.0 16.8 -34.5
Deductions at Source (WHT) 170.7 139.6 22.3
Gross Receipts 346.9 243.7 42.3
Refunds 32.2 34.0 -5.3
Other DT 19.0 15.3 24.2
Net Direct Taxes 333.7 225.0 48.3
Secondly, the refund pendency of direct taxes has almost been
exhausted. To completely liquidate pending refunds, Rs. 32.2 billion
have been paid back to taxpayers during 2006-07 in addition to Rs.
34 billion paid during 2005-06. This change is expected to have a
favorable impact on corporate performance in coming years.
Thirdly, with improved tax efforts and effective implementation of
tax policy and administrative reforms, the share of direct taxes in
federal tax receipts has increased from around 15% in early 1990s to
32% in 2000-01. It has now touched new heights of 39.4% in 2006-
07 (Graph 2). One of the implications of this change has been that
direct taxes have now emerged as the leading revenue contributors

Revenue Division Year Book 2006-07
26
of federal tax receipts – a transition that had always been desired on
equity and efficiency grounds.
Fourthly, through a combination of policy interventions, such as the
introduction of Universal Self-assessment (USAS) and revised
regime of advance tax Payments on the one hand, and better human
resource management on the other, the voluntary compliance has
improved tremendously.
Fifthly, with improvement in voluntary compliance, the reliance of
income and corporate taxes on withholding taxes (WHT) has
decreased from 57.3% in 2005-06 to 49.2% in 2006-07. This feature
together with improvement in the share of direct taxes in total
federal tax receipts confirms that the overall taxation system in
Pakistan is becoming less and less regressive as compared to earlier
years.
Graph-2 Historical Performance of Direct Taxes
10.314.4
6.6 8.7 11.1
22.7
48.3
31.835.3 33 31.7 31.1 31.5
39.4
0
10
20
30
40
50
60
2000-01 2001-02 2002-03 2003-04 20004-05 2005-06 2006-07
Growth(%) Share (%)

Revenue Division Year Book 2006-07
27
Finally, two additional achievements during 2006-07 are the
enhancement of direct tax base and the completion of the process of
re-organization of field offices on functional lines. With 20%
increase in tax base, the number of NTN holders has jumped from
2.1 million to 2.52 million during the last two years.
Sales Tax: GST is now operating as a value added tax and a vital
source of federal tax revenues collection. The gross and net
collection of sales tax during 2006-07 stood at Rs. 346.4 billion and
Rs. 309.4 billion, entailing growth of 5.9% and 5% respectively over
last year. Although the revised target of sales tax has been achieved
to the extent of 99.5%, but the overall collection has remained below
the expected level – for both of the components of sales tax i.e.,
sales tax domestic and sales tax imports. Consequently, the share of
sales tax in FBR tax collection has also declined from 41.3% in
2005-06 to 36.5% in 2006-07. Some of the factors that have
impeded the desired outcome were: (a) less than expected growth in
imports, (b) decline in collection from two leading revenue spinners,
namely, the automobile industry and the iron & steel sector, and (c)
huge refund payments to energy sector combined with significant
refunds to textile sector despite zero-rating of export oriented five
industries (Table 4).
Collection of Sales Tax (Domestic) and Major Revenue Spinners:
The net collection from sales tax (domestic) [ST (D)] recorded an
overall growth of 8.2% partly due to 14.3% increase in refund

Revenue Division Year Book 2006-07
28
payments. It appears that improved economic activity could not be
translated into better compliance by the sales tax registered persons.
It could very well be due to the prevalent stagnation in ST (D)
operations, whereby the continuous risk of heavy dependence on
small number of revenue spinners has not been mitigated.
The sectoral analysis confirms the premise that the GST tax base
remains narrow. Around 90% of net receipts (Rs. 119.8 billion out
of Rs. 133.5 billion), and 80% of gross receipts (Rs. 135.9 billion
out of Rs. 170.5 billion) have been generated by only fifteen revenue
spinners. The major players include telecom services, POL products,
natural gas, sugar, cigarettes, services, LPG, cement, beverages, auto
parts, iron & steel and gases & acids. Of fifteen major commodities,
eleven have recorded a positive growth and there has been a decline
in gross receipts on account of two utilities, cement, and motor cars.
Table 4: Collection and Growth of GST: 2006-07 (Rs. Billion)
Collection/ Refunds Growth (%) Sources of GST Gross Refund Net Gross Refund Net
Import Stage 175.9 0.0 175.9 2.6 -27.6 2.6
Domestic Production & Sales 170.5 37.0 133.5 9.5 14.3 8.2
GST (Total) 346.3 37.0 309.4 5.9 14.5 4.9
Sales Tax at Import Stage: For clarity sake, it is worthwhile to state
that the collection of sales tax at import stage [ST (M)] crucially
depends on the composition and volume of imports. Many items
including raw materials have been zero-rated in recent years to
promote industrial activity. Others, including food items and related

Revenue Division Year Book 2006-07
29
essential products are sales tax exempt. Since the share of ST (M) in
total sales tax collection has always been significant, fluctuations in
imports leave an impact on tax receipts. This has precisely happened
during 2006-07 when a lower growth in value of imports has been
registered and consequently, the share of ST (M) has declined by
around three percentage point as compared to last year. In fact, the
overall growth of 8.1% in value of imports further declined to 6.8% as
far as sales taxable value is concerned. This has been due to decline in
customs duty collection which is included in the base value to
determine the sales taxable value. Moreover, a decline in effective
rate of ST (M) from 9.2% in 2005-06 to 8.8% in 2006-07, partly due
to the on-going process of tariff rationalization and improvement in
tariff escalation, had further contributed towards lowering the growth
of collection to 2.6% only.3
The contribution of major commodity groups of ST (M) collection
shows that nearly 87% of tax receipts have been generated by fifteen
items. Within these, a double-digit growth has been recorded in POL
products, edible oil, mechanical machinery, plastic products, organic
chemicals, aluminum products, and paper & paper board. Nine out
of 15 revenue spinners have added Rs. 21.2 billion to this collection
as compared to last year. However, a sharp decline in collection has
been noticed in the case of vehicles (by Rs. 5.4 billion), iron and
steel (by Rs. 3.1 billion), and sugar (by Rs. 4.2 billion). The
3 Technically stating, for sales tax at import stage, the taxable value is determined by including customs duty in the value of imports. Therefore, all changes in tariff structure that result in reduction in customs duty in a particular year compared to when change was not effective leads not only to reduction in customs duties, but also to reduction in sales tax and withholding tax on imports.

Revenue Division Year Book 2006-07
30
outcome of the latter two has been quite anticipated, as the extra
demand during preceding year due to domestic shortages has
leveled-off. However, while ST (M) from iron & steel sector has
declined by Rs. 3.4 billion, the ST (D) has increased by only Rs. 700
million, indicating that contrary to expectations 100% substitution
between the two components did not take place. Contrary to this, the
decline in collection from sugar has been as per a priori
expectations; it declined from Rs. 15.4 billion in 2005-06 to Rs. 13.5
billion in 2006-07 due to less import requirement.
The decline in ST (M) from vehicles has been due to change in
policy regime whereby the age of imported old and second-hand
vehicles was restricted to five years. Moreover, the slowdown in one
of the manufacturing/ assembling units was also responsible for
decreased imports of CKD/SKD units, thereby resulting into
reduced import-related taxes. Similarly, the decline in collection on
account of electrical machinery has been due to policy changes that
resulted into zero-rating of most of these products. Finally, the
increase in international prices of fuels appears to have a significant
impact on the relative strength of POL products – the share of this
group has increased from 35% in 2005-06 to 41% in 2006-07.
Federal Excise Duties (FED): This source of revenue has started to
regain importance due to widening of its base by inclusion of
additional services into FED net. Its share has increased from 7.7%
in 2005-06 to 8.5% in 2006-07 (Graph 3). The net collection
indicates that Rs. 71.8 billion have been collected during 2006-07,

Revenue Division Year Book 2006-07
31
showing an increase of Rs. 16.5 billion over previous year. The
growth in collection has been 29.9%.
Graph 3: Historical Trend of FED Collection (Share %) in Total Revenue
12.5 11.79.7 8.7 9.0
7.7 8.5 8.9
00-01 01-02 02-03 03-04 04-05 05-06 06-07 07-08(BE)
Traditionally the major sources of FED revenue are cigarettes,
cement, natural gas, POL products and beverages. The inclusion of
services in this group has been a recent phenomenon. These six
items have contributed around 90% of total FED collection during
2006-07. Among these commodities, cigarette was the top most
contributors followed by cement, natural gas, and beverages. The
collection from cigarettes has recorded 17.1% growth during 2006-
07. A robust growth of over 20% has also been witnessed by
cement, POL and beverages. Looking at the rationale, it has been
found that a significant growth of 23.5% in cement was due to
higher production to cater rising demand. Incidentally, the
production of cement increased by 21.1% during July-May 2006-07.
The higher collection from cigarettes was possible due to increase in
the retail prices of the cigarettes during 2006-07. The outcome also
reveals that the anti-smoking drives are falling on deaf ears, as there
is no visible decline in demand. The growth in FED from beverages
can be attributed to more than 28% growth in production, which
Revenue Division Year Book 2006-07
32
also, albeit indirectly confirms rising demand of the beverages in the
country. Finally, the FED collection has declined in the case of
natural gas due to its less extraction from fields located in the
Balochistan province.
Customs Duties: Historically, the collection of Customs Duties
(CD) has been an important source of federal tax revenues. Within
the new international environment of low duties and the emergence
of sales tax, the reliance on customs duties in indirect taxes has
already declined as a source of revenue. Similar to other countries,
in Pakistan too, the structure of tariff has undergone extensive
changes during the past one and a half decades. The tariff rates have
been rationalized and reduced to a great extent to encourage local
industries to be more competitive. After reducing the maximum rate
to 25%, the issue of tariff escalation has been dealt quite extensively
during the last three years. Resultantly, more and more primary and
semi-manufactured commodities are drifting down to lower slabs.
Of course, these changes are not without revenue cost. Nonetheless,
these policy measures are necessary to generate greater efficiency in
the system.
Regarding revenue collection during 2006-07, it may be recalled
that during the past few years the imports were growing in excess of
30% due to unprecedented surge in domestic demand. The
expansion of the economy, particularly the industrial sector, was
taking place at a rapid pace. However, during 2006-07, despite
reduction in tariff rates for raw materials and machinery, the overall

Revenue Division Year Book 2006-07
33
growth in the imports has slowed down to around 8% and the rate of
growth of dutiable imports retarded to -4.1%. Consequently, hefty
shortfall in CD collection was recorded during the year. The gross
and net collection reduced to Rs. 145 billion and Rs. 132.3 billion
respectively, yielding decline in CD by 7.5% and 4.4%,
respectively. An in-depth sectoral analysis has been carried out in
the following for 15 major commodity groups that constitute around
75% of the CD. The significance of these items can be judged from
the fact that they cover 75% of total import value and 84% of
dutiable import value. The relative significance of each of these
commodity groups within CD is highlighted in Graph 4.
Graph 4 :Commodity-wise Distribution of CD
Ot he r, 30.8
R ubbe r pr oduc t s , 1 . 1C of f e e , T e a e t c , 1 . 1
Ma n ma de f i l a me nt s , 1 . 0
Dye s , P a in t s e t c . , 1 . 1
Mis c . C he mic a l P r oduc t s , 1. 2
Othe r s , 25 . 4
El Ma c hine ry, 7.7
P OL P roduc t s, 10.4
Edible Oils, 10.9
Ve hic le s, 19.5
P a pe r & P a pe rboa rd, 2.4
Iron & S t e e l, 3.7
P la st ic s , 3.7
Me c ha nic a l Ma c hine ry, 7.3
Orga nic Che mic a ls, 2.3Art ic le s of Iron & S t e e l,
1.3
Projections for 2007-08
Anticipating that the economy will maintain the high growth
trajectory and major taxes will also continue to display buoyant
posture, the budgetary target for 2007-08 has been set rather
ambitiously at Rs. 1025 billion, requiring an increase of 21% over

Revenue Division Year Book 2006-07
34
the provisional collection of Rs. 847.2 billion of 2006-07 (Table 5).
The projections for 2007-08 assume that GDP will grow by 7% in
real terms; inflation will stabilize at around 7.5% and total imports
to increase by 10%. Furthermore, a modest increase of 3% has been
assumed for dutiable imports. Buoyancy estimate of unity is
assumed for all federal taxes except for excise duties. Furthermore,
the projections for 2007-08 also include the expected impact of
budgetary and relief measures announced at the time of Federal
Budget.
Given that the outturn of individual taxes and growth trajectories are
materialized, the projections for 2007-08 will result into following
tax mix of individual taxes: Direct Taxes 39.5%, GST 37.3%,
Federal Excise 9.6%, and Customs Duties 13.7%. The most
significant change in this outcome is that there will be a further
decline in the share of customs duties compared to 2006-07 at the
expense of FED whose share will increase due to expansion of base
– from imposition of 1% additional duty and extension of FED to all
non-fund services of financial institutions.
Table 5: A Comparison of Baseline Collection and Projections
Collection 2006-07
(Rs. Billion)
Projections 2007-08
(Rs. Billion) Addition
(Rs. Billion) Growth
(%)
Direct Taxes 333.7 405.0 71.3 21.4
Sales Tax 309.4 382.0 72.6 23.5
Federal Excise 71.8 98.0 26.2 36.5
Customs Duties 132.3 140.0 7.7 5.8
All Taxes 847.2 1,025.0 177.8 21.0

Revenue Division Year Book 2006-07
35
Chapter 4
Tax Administration Reform Program (TARP): An Update The implementation phase of the ongoing reform program of FBR is
on track. After successful restructuring of the FBR Headquarter,
significant progress has been made on physical infrastructure,
especially the establishment of model tax offices in the shape of
LTUs, RTOs, and MCCs. The FBR Act has been enacted. The major
emphasis is now on automation of key business processes – the IT
related initiatives and HR initiatives. The objective of this note is to
provide an up-date on various programs to physical and technical
areas within TARP.
FEDERAL BOARD OF REVENUE ACT, 2007
The Federal Board of Revenue Act, 2007 will help in further
speeding up the reform process through quick decision making with
more autonomy.
Automated Tax Payment System
FBR Collection Automation Project (CAP) has replaced traditional
Challan based tax payment receipt system at National Bank of
Pakistan (NBP) and State Bank of Pakistan (SBP). Originally the
banks used to receive tax payments along with a four-part Challan
Form, a signed and stamped tier of which was returned to taxpayer
for future reference. As a back-office function, these Challans were
then sent to local FBR Data Processing Center (DPC)/ Collectorate

Revenue Division Year Book 2006-07
36
for electronic data capturing. In order to improve the quality of
electronic tax collection information, the CAP was launched in start
of 2005 with objectives of improved data quality and timely
availability of information for FBR.
CAP Phase – 1 (Completed)
Through this phase of CAP, the traditional tax payment through
Challan Forms is replaced by single part Tax Payment Input form.
The information from the Tax Payment Input Form is electronically
captured at the bank’s Tax Collection Counter. Various parts of
information provided on Tax Payment Input Form by taxpayer are
verified (against FBR master data) while it is being captured such as
taxpayer’s identity, payment type, collection jurisdiction etc. After
the data entry is completed, a signed and stamped Computerized
Payment Receipt (CPR) is provided to taxpayer. The electronic
collection data from all bank branches is transmitted to bank’s head
office at the end of working day. At the start of next working day,
this data is merged at bank head office and sent to FBR through
secure data transfer. The received data is then used for loading into
FBR central data repository, sent to DPC for uploading into their
servers and for production of various collection reports being shared
by various departments of FBR.
CAP Phase – 2 (In progress)
As further improvements of services to taxpayer, PRAL has
developed an Electronic Payment Portal (e-FBR Portal, an internet
based Tax Payment Input Form recording facility) where taxpayer is

Revenue Division Year Book 2006-07
37
allowed to fill his/ her payment details from any Personal Computer
(PC) at home or work. After the verification of information being
captured, the taxpayer is issued a reference number to the
information entered. The taxpayer is then advised to approach a
nearest bank branch’s Tax Collection Counter.
The bank cashier accesses the payment details (entered by taxpayer)
using the reference number provided by taxpayer and prints the CPR
after the required payment is received. Advantages of CAP Phase-2
over previous approach are fast processing of payment collection
since no data entry is involved and reduced chances of error since
the data is being entered by taxpayer. The data transfer to FBR
follows the same route as mentioned under CAP Phase-1.
CAP Phase – 3 (Future Planning)
As further improvement to existing process, PRAL has initiated
linking the payment information with bank’s Electronic Transaction
Processing Interface for its customers.
Using the banks transaction processing system, the account holders
(and taxpayers) will be allowed to make tax payments through
transfer from their bank accounts. The obvious advantages of this
approach are elimination of taxpayer’s visit to bank’s Tax Collection
Counter and streamlined documentation of transaction.
In order to facilitate the taxpayers, the FBR has simplified and
automated the process of payment of income tax, sales tax and
Revenue Division Year Book 2006-07
38
federal excise duty. The FBR has introduced a single page return for
the payment of these taxes for all registered persons in lieu of ten
returns forms, one for corporate and one for non corporate tax
payers. The FBR has also introduced the concept of electronic filing
of income tax, sales tax and federal excise returns as well as with
holding tax statement through the computerized system.
Record Cleansing
The cleansing of record/data has been one of top priorities of the
Income Tax and Sales Tax Administrations during last couple of
years. The Income tax has updated the data of taxpayers and keeps it
as an ongoing process. Sales tax side during 2005-2006 has updated
the data of NTN of 71000 registered persons out of 82324 operative
return filers. All the Regional tax offices have cleansed their records
and weeded out the old records whereas, the Collectorates have been
provided with the list of large and medium category of taxpayers.
The FBR has also undertaken a hectic exercise to weed-out the old
and undesired record. This exercise is being conducted at field
offices and at FBR (HQ) simultaneously. At FBR (HQ), the next
phase in this regard is file archiving and digitizing for which all files
are to be scanned and put in to a Content Management Sever.
Automated System of Refund in Sales Tax
The FBR started the process of automation of payment of sales tax
refund in the year 2002-2003 and in this regard a central data base
namely, STARR, was established. The central data base contained
the data of profiles of all sales tax registered persons, data of

Revenue Division Year Book 2006-07
39
monthly sales tax returns filled by the sales tax registered persons
and data relating to all Goods Declarations (bills of entry and
shipping bills). The STARR system was further enhanced and a new
system namely STREAMS was introduced which has now been up-
graded with a new system CREAST. The new automated refund
processing system is based on risk assessment which is called RRAS
(Risk-based Refund Analysis System). The automated refund
processing system is running successfully and has helped in
substantial liquidation of pending refund claims. During the period
from 01.07.2006 to 31.06.2007, the field offices have disposed off
39357 refund claims and paid Rs.36,958 million of refund to the
refund claimants.
PaCCS Project
Pakistan Automated Customs Clearance System (PaCCS) is an
integrated, web-enabled, paperless, real-time system launched on
March 23, 2005 and is successfully working for Customs clearance
of Containerized imported and exported cargo through Karachi,
Pakistan, and Qasim International Container Terminals – KICT,
PICT and QICT.
During the transitional period of rolling out of PaCCS in all the
model customs collectorates, the system of One-Customs will
continue to operate side by side, to create conducive environment for
automation and ready to be assimilated. In addition to the 25
Customs stations already interconnected with One-Customs Link,
One-Customs Online Documents Processing System has also been

Revenue Division Year Book 2006-07
40
implemented at Sust from 2nd July 2007. Except for a few border
stations, all customs stations are now connected by One-Customs.
One-Customs now provides web based filing of imports and exports,
electronic manifest filing at airports, monitoring of transshipment
consignments, linkages of valuation rulings with appraisement
process. Other projects like the development of Risk Management
System, paperless GD Processing, customs information exchange
portal between Sust and Chinese Customs, incorporation of ATA
Carnet in One-Customs are under development.
National Tax Number (NTN)
NTN is issued to business individuals, salaried individuals, AOP and
companies through a prescribed application. It is being issued by 15
NTN Cells through out the country and request may be made online
for issuance of NTN. To facilitate the taxpayer, the processing of
application has been decentralized with effect from 01.07.2007
through respective RTOs all over the country.
Post Clearance Audit
The Federal Board of Revenue is in the process of setting up of
Customs Post Clearance Audit for imported goods. The set up
includes a central organization located in FBR (HQ) and local audit
units in respective clearance Collectorate. The central organization
will select cases on the basis of certain risk criteria and would assign
these audits to local audit units for initiation of audit.

Revenue Division Year Book 2006-07
41
Chapter 5
Concluding Observations It is a matter of great satisfaction that domestic resource
mobilization effort, especially of FBR has been focused and the
start-of-the-year revenue target for 2006-07. Despite unexpected
internal and external shocks in the shape of slowdown in imports
and extra refund claims by the energy sector, the tax revenues have
not only exceeded the assigned target, but a robust growth of around
19% has also been recorded. For the second year running the much
debated Tax/GDP has increased by 0.3%, which is consistent with
the overall long-term vision of FBR. The second major achievement
during the year has been the unprecedented performance of direct
taxes, where substantial gains have been made on account of
voluntary compliance compared to other components. In fact, the
direct taxes have finally assumed the role of leading tax in term of
revenue generation. Not only that the share of direct taxes has
increased from 30% to 40%, the direct tax to GDP ratio has also
recorded an increase of 0.8%. This change has important
implications for the overall tax structure in Pakistan, especially with
regard to progressivity and efficiencies concerns. The third
important feature of FBR performance has been the inclusion of
additional services in the tax net. The base of FED was augmented
during the year. This change though not so pronounced yet, is
expected to have favorable yield in future, as the existing
discrepancy between share of services in GDP and taxes will be
narrowed further.

Revenue Division Year Book 2006-07
42
Fourthly, reducing tax distortions has been one of the policy
objectives of FBR. In this regard further incentives have been
provided to investors and trading entities in terms of rate reduction
of raw materials and machinery to bring down the cost of doing
business in Pakistan. This fiscal stance has indeed played a positive
role in boosting economic activity in the country.
Finally, FBR has maintained the momentum of reforms, both in the
shape of policy and administrative changes. It is encouraging that
improved working environment in the shape of infrastructure and
better qualified and trained workforce have changed the work ethics.
Going forward, keeping in view the remarkable performance of
taxes and the economy, a rather ambitious target of Rs. 1,025 billion
has been set for 2007-08. The revenue organization is fully poised to
meet this challenge gracefully as has been the norm during the past
four years.

Revenue Division Year Book 2006-07
43
SPECIAL EVENTS
**********
Presentation on FBR Revenue Vision to PRESIDENT and PRIME MINISTER
On February 22, 2007
***********
PRESIDENT OF PAKISTAN Addresses to the Participants Of
Tax Reform Conference
**********
PRIME MINISTER Inaugurates the IC3 Project

Revenue Division Year Book 2006-07
44
Presentation on FBR Revenue Vision to PRESIDENT and PRIME MINISTER
The day of 22nd February 2007 will be remembered as the historic
day when the President and Prime Minster of Islamic Republic of
Pakistan together visited FBR along with state dignitaries. In fact it
was the recognition of the exceptional performance shown by the
department for last five years. It also shows the great interest and
patronage of the President in the revenue and fiscal matters of
Pakistan.
At this auspicious occasion a presentation was given by Chairman,
M. Abdullah Yusuf to the President and Prime Minister appraising
them about the current status of revenue collection, the challenges in
resource mobilization and future vision of the FBR. The Chairman
highlighted the fact that the revenue organization has not only met
the revenue target since 2002-03, on many occasions it has
surpassed the assigned target. He explained that while 25% of GDP
originates from the agriculture sector, 20% from Manufacturing and
Mining sectors and close to 55% from services sectors, the tax
collection from these three sectors has been disproportionate. The
largest statutory tax burden falls on the manufacturing and mining
sectors that, in turn, pass the tax burden on to final consumers. The
Chairman presented a roadmap of short, medium and long- term
revenue strategy fully consistent with the Macroeconomic
framework of the GOP. He committed to pursue this strategy so as
to increase the Tax/GDP ratio by 5% points in ten years time.

Revenue Division Year Book 2006-07
45
The presentation of Chairman FBR to the President and Prime Minister
The President and the Prime Minister during the Presentation by
Chairman M. Abdullah Yusuf

Revenue Division Year Book 2006-07
46
The President appreciated the FBR team managers for a wonderful
performance during last few years. He emphasized the need and
importance of raising tax revenues in accordance with the structure
of the economy for the economic development and poverty
alleviation in Pakistan. He stressed that it is the taxation structure
which can lessen the debt burden, create congenial business
environment, attract the foreign investment and eventually pave the
way for growth and prosperity. In this regard the FBR reform
program has been designed to achieve these goals. He appreciated
the dedication of the senior management for the work done on tax
policy and administrative reform project. The President asked the
FBR team to maintain the pace of effort and commitment to achieve
the long term goals and to make Pakistan a prosperous country.
The President addresses to the top management of FBR
Revenue Division Year Book 2006-07
47
National Conference on Tax Administration Reform Program
Federal Board of Revenue has successfully held two-day National
Conference on Tax Administration Reform Program (TARP) on 3rd
& 4th May 2007 at Hotel Sheraton, Karachi. The objectives of the
Conference were (a) to involve the external and internal
stakeholders at all levels in support of the Tax Administration
Reform Program, (b) to apprise them about progress and
achievements of the said Program and (c) to create the feeling of
ownership of the Tax Administration Reform Program in the private
sector. The Conference was attended by a large number of
dignitaries from all important walks of economic life. Around 1000
national and international Industrial trade and business bodies
attended the conference.
The inaugural session was chaired by Governor Sindh Dr. Ishrat-ul-
Ibad. Mr. Salman Nabi, Member (Direct Taxes) apprised the
participants regarding the unprecedented facilities provided to the
taxpayers and the benefits of USAS. The trade and Industry was
represented by the President FPCCI Mr. Tanvir Ahmed Sheikh. In
his keynote address recorded his appreciation of the FBR
performance. He emphasized that by providing level playing field
and better facilitations, the business community has now the
opportunity of innovation and expansion in their businesses.

Revenue Division Year Book 2006-07
48
Mr. Naveed A. Andrabi, President Pakistan Tax Bar Association
also chaired a session whereas an up-date on TARP was provided by
FBR Member Tax Policy and Reforms Mr. Habib Fakhruddin..
The first session started with National Anthem
A Segment of the participants of the Conference

Revenue Division Year Book 2006-07
49
The Member (Sales Tax) Mrs. Mussarat Jabeen stressed the need for
capturing value addition at every stage of the entire supply chain.
Member (Audit) Mr. Abdul Razzaq informed the participants that
the National Audit Plan and a coherent audit manual for audit of all
Federal Taxes is near completion. Mr. Masood A. Naqvi of ICAP
emphasized the need for bringing the real estate sector into tax net.
The business sector was represented by Mr. Zubair Motiwala who
not only invited questions from the floor but also shared his
innovative ideas with the participants.
Another segment of the Distinguished Participants
Member (Customs) Mr. Shahid Rahim Sheikh made a detailed
presentation on various reforms initiatives henceforth put in place
and those in the pipeline. He highlighted the significance of the
Custom administration reforms project (CARE) and explained as to
how multiple manual processes involved in clearance of goods have

Revenue Division Year Book 2006-07
50
been eliminated. Mr. S. M. Munir and Mr. Tariq Saeed also shared
their views with the participants. The Chairman FBR, Mr. M.
Abdullah Yusuf thanked the President for gracing the occasion with
his presence. The Chairman expressed the desire to raise Tax/GDP
ratio of Pakistan to the levels enjoyed by the South Asian
economies. He informed the august forum that several measures
have been taken to achieve the desired goal.
The President of Pakistan in his concluding remarks expressed
satisfaction with the growing revenues. He complemented the efforts
of FBR Chairman and his colleagues in achieving the revenue target.
He also appreciated the pace of reforms and stressed the need for a
close liaison between public and private sector, improvement in
relationship between taxpayer and tax collector, business
community, and financial experts.
Chairman FBR addresses the participants of the Conference

Revenue Division Year Book 2006-07
51
Prime Minister Inaugurates the IC3 Project On 30th April, 2007
Globalization and stiff competition among the nations regarding
imports and exports businesses, has increased the significance of
speedy delivery of traded goods to the destination manifold. The
buyers and suppliers throughout the world want swift clearance and
immediate delivery of their consignments to have edge over the
competitors. It provides a great relief and satisfaction to the trading
partners. Therefore, it is essential for a developing country like
Pakistan to upgrade its cargo terminals to facilitate the large number
of exporters and importers.
The establishment of Integrated Cargo Container Control (IC3) at
Port Qasim Karachi is a momentous start of a new era. The IC3
program is based on strategic partnership between Pakistan customs
and Unites States Customs and Border Protection under the secured
trade initiative. IC3 terminal involves joint investment of over US
$8 million by Pakistan and USA. The agreement in this regards was
signed in March 2006 between Pakistan customs and US Customs
and Border Protection.
Prime Minister of Pakistan Mr. Shaukat Aziz inaugurated the
facility on April 30th 2007.

Revenue Division Year Book 2006-07
52
The Prime Minster of Pakistan Mr. Shaukat Aziz inaugurated the IC3
terminal.
The Prime Minister and Governor Sindh are being informed about
the salient features of the Facility

Revenue Division Year Book 2006-07
53
In the inauguration speech Prime Minster expressed his pleasure on
the opening of the state of the art facility which would allow
shipment of goods from Port Qasim to be pre-cleared here and then
enter the United State without any further intervention. It will reduce
door to door time from Pakistani supplier to the US buyer. The US
is the major trading partner of Pakistan and this facility will allow
our companies here to supply just-in-time inventories to the US
companies. He further said the flow of inventories without physical
checking and waste of time gives peace of mind to the exporter and
importer as it eliminates unnecessary delay. The prime minister also
welcomed the investment from any part of the world as it is also a
source of transfer of technologies and latest expertise.
The Prime Minister Addresses the Gathering

Revenue Division Year Book 2006-07
54
STATISTICAL APPENDIX
Comparative Statements of
Month-to-Month and Progressive
Collection of
Federal Taxes 2006 - 07

Revenue Division Year Book 2006-07
55
ALL TAXES Two Year Comparative - Month to Month & Progressive Collection
(Rs. Million) FY 2005-06 FY 2006-07 COMPARISON COMPARISON AS % AGE MONTHS
GROSS Reb / Ref NET GROSS Reb / Ref NET GROSS Reb / Ref NET GROSS Reb / Ref NET 1 2 3 4 5 6 7 8 9 10 11 12 13
JULY M 41,522 6,921 34,601 54,468 8,290 46,178 12,946 1,369 11,577 31.2 19.8 33.5
AUGUST M 50,326 5,402 44,924 54,016 7,683 46,333 3,690 2,281 1,409 7.3 42.2 3.1
P 91,848 12,323 79,525 108,484 15,973 92,511 16,636 3,650 12,986 18.1 29.6 16.3
SEPTEMBER M 78,416 5,885 72,531 101,547 10,121 91,426 23,131 4,236 18,895 29.5 72.0 26.1
1st Quarter 170,264 18,208 152,056 210,031 26,094 183,937 39,767 7,886 31,881 23.4 43.3 21.0
OCTOBER M 56,273 7,098 49,175 60,399 7,087 53,312 4,126 -11 4,137 7.3 -0.2 8.4
P 226,537 25,306 201,231 270,430 33,181 237,249 43,893 7,875 36,018 19.4 31.1 17.9
NOVEMBER M 53,461 5,908 47,553 67,079 8,052 59,027 13,618 2,144 11,474 25.5 36.3 24.1
P 279,998 31,214 248,784 337,509 41,233 296,276 57,511 10,019 47,492 20.5 32.1 19.1
DECEMBER M 86,627 11,502 75,125 123,862 9,626 114,236 37,235 -1,876 39,111 43.0 -16.3 52.1
2nd Quarter 196,361 24,508 171,853 251,340 24,765 226,575 54,979 257 54,722 28.0 1.0 31.8
Upto 2nd Qtr 366,625 42,716 323,909 461,371 50,859 410,512 94,746 8,143 86,603 25.8 19.1 26.7
JANUARY M 53,366 7,445 45,921 55,594 3,434 52,160 2,228 -4,011 6,239 4.2 -53.9 13.6
P 419,991 50,161 369,830 516,965 54,293 462,672 96,974 4,132 92,842 23.1 8.2 25.1
FEBRUARY M 56,011 6,529 49,482 56,830 4,404 52,426 819 -2,125 2,944 1.5 -32.5 5.9
P 476,002 56,690 419,312 573,795 58,697 515,098 97,793 2,007 95,786 20.5 3.5 22.8
MARCH M 79,236 8,726 70,510 89,298 7,399 81,899 10,062 -1,327 11,389 12.7 -15.2 16.2
3rd Quarter 188,613 22,700 165,913 201,722 15,237 186,485 13,109 -7,463 20,572 7.0 -32.9 12.4
Upto 3rd Qtr 555,238 65,416 489,822 663,093 66,096 596,997 107,855 680 107,175 19.4 1.0 21.9
APRIL M 63,599 6,442 57,157 66,406 6,921 59,485 2,807 479 2,328 4.4 7.4 4.1
P 618,837 71,858 546,979 729,499 73,017 656,482 110,662 1,159 109,503 17.9 1.6 20.0
MAY M 69,140 5,550 63,590 70,491 4,717 65,774 1,351 -833 2,184 2.0 -15.0 3.4
P 687,977 77,408 610,569 799,990 77,734 722,256 112,013 326 111,687 16.3 0.4 18.3
JUNE M 110,582 7,709 102,873 129,383 4,403 124,980 18,801 -3,306 22,107 17.0 -42.9 21.5
4th Quarter 243,321 19,701 223,620 266,280 16,041 250,239 22,959 -3,660 26,619 9.4 -18.6 11.9
Upto 4th Qtr 798,559 85,117 713,442 929,373 82,137 847,236 130,814 -2,980 133,794 16.4 -3.5 18.8

Revenue Division Year Book 2006-07
56
DIRECT TAXES Two Year Comparative - Month to Month & Progressive Collection
(Rs. Million)
FY 2005-06 FY 2006-07 COMPARISON COMPARISON AS % AGE MONTHS Gross Reb / Ref Net Gross Reb / Ref Net Gross Reb / Ref Net Gross Reb / Ref Net
1 2 3 4 5 6 7 8 9 10 11 12 13
JULY M 8,865 1,245 7,620 11,619 1,533 10,086 2,754 288 2,466 31.1 23.1 32.4
AUGUST M 10,342 1,327 9,015 12,941 1,831 11,110 2,599 504 2,095 25.1 38.0 23.2
P 19,207 2,572 16,635 24,560 3,364 21,196 5,353 792 4,561 27.9 30.8 27.4
SEPTEMBER M 34,181 2,630 31,551 52,021 6,741 45,280 17,840 4,111 13,729 52.2 156.3 43.5
1st Quarter 53,388 5,202 48,186 76,581 10,105 66,476 23,193 4,903 18,290 43.4 94.3 38.0
OCTOBER M 12,930 1,825 11,105 17,946 1,880 16,066 5,016 55 4,961 38.8 3.0 44.7
P 66,318 7,027 59,291 94,527 11,985 82,542 28,209 4,958 23,251 42.5 70.6 39.2
NOVEMBER M 12,327 2,164 10,163 17,433 3,508 13,925 5,106 1,344 3,762 41.4 62.1 37.0
P 78,645 9,191 69,454 111,960 15,493 96,467 33,315 6,302 27,013 42.4 68.6 38.9
DECEMBER M 40,966 6,106 34,860 80,444 4,212 76,232 39,478 -1,894 41,372 96.4 -31.0 118.7
2nd Quarter 66,223 10,095 56,128 115,823 9,600 106,223 49,600 -495 50,095 74.9 -4.9 89.3
Upto 2nd Qtr 119,611 15,297 104,314 192,404 19,705 172,699 72,793 4,408 68,385 60.9 28.8 65.6
JANUARY M 12,948 2,878 10,070 13,527 1,070 12,457 579 -1,808 2,387 4.5 -62.8 23.7
P 132,559 18,175 114,384 205,931 20,775 185,156 73,372 2,600 70,772 55.4 14.3 61.9
FEBRUARY M 12,680 2,161 10,519 14,772 992 13,780 2,092 -1,169 3,261 16.5 -54.1 31.0
P 145,239 20,336 124,903 220,703 21,767 198,936 75,464 1,431 74,033 52.0 7.0 59.3
MARCH M 31,709 3,916 27,793 42,779 3,914 38,865 11,070 -2 11,072 34.9 -0.1 39.8
3rd Quarter 57,337 8,955 48,382 71,078 5,976 65,102 13,741 -2,979 16,720 24.0 -33.3 34.6
Upto 3rd Qtr 176,948 24,252 152,696 263,482 25,681 237,801 86,534 1,429 85,105 48.9 5.9 55.7
APRIL M 17,211 2,323 14,888 17,821 2,741 15,080 610 418 192 3.5 18.0 1.3
P 194,159 26,575 167,584 281,303 28,422 252,881 87,144 1,847 85,297 44.9 7.0 50.9
MAY M 16,968 2,605 14,363 20,803 978 19,825 3,835 -1,627 5,462 22.6 -62.5 38.0
P 211,127 29,180 181,947 302,106 29,400 272,706 90,979 220 90,759 43.1 0.8 49.9
JUNE M 47,862 4,821 43,041 63,865 2,834 61,031 16,003 -1,987 17,990 33.4 -41.2 41.8
4th Quarter 82,041 9,749 72,292 102,489 6,552 95,936 20,103 -3,197 23,300 24.9 -32.8 32.7
Upto 4th Qtr 258,989 34,001 224,988 365,971 32,234 333,737 106,637 -1,768 108,405 41.3 -5.2 48.3
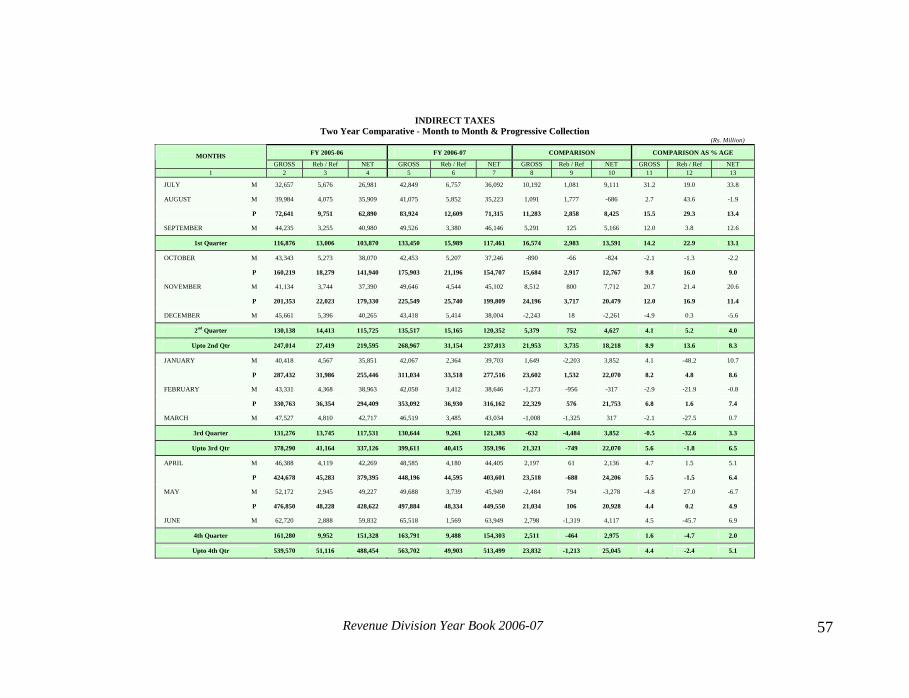
Revenue Division Year Book 2006-07
57
INDIRECT TAXES Two Year Comparative - Month to Month & Progressive Collection
(Rs. Million) FY 2005-06 FY 2006-07 COMPARISON COMPARISON AS % AGE MONTHS
GROSS Reb / Ref NET GROSS Reb / Ref NET GROSS Reb / Ref NET GROSS Reb / Ref NET 1 2 3 4 5 6 7 8 9 10 11 12 13
JULY M 32,657 5,676 26,981 42,849 6,757 36,092 10,192 1,081 9,111 31.2 19.0 33.8
AUGUST M 39,984 4,075 35,909 41,075 5,852 35,223 1,091 1,777 -686 2.7 43.6 -1.9
P 72,641 9,751 62,890 83,924 12,609 71,315 11,283 2,858 8,425 15.5 29.3 13.4
SEPTEMBER M 44,235 3,255 40,980 49,526 3,380 46,146 5,291 125 5,166 12.0 3.8 12.6
1st Quarter 116,876 13,006 103,870 133,450 15,989 117,461 16,574 2,983 13,591 14.2 22.9 13.1
OCTOBER M 43,343 5,273 38,070 42,453 5,207 37,246 -890 -66 -824 -2.1 -1.3 -2.2
P 160,219 18,279 141,940 175,903 21,196 154,707 15,684 2,917 12,767 9.8 16.0 9.0
NOVEMBER M 41,134 3,744 37,390 49,646 4,544 45,102 8,512 800 7,712 20.7 21.4 20.6
P 201,353 22,023 179,330 225,549 25,740 199,809 24,196 3,717 20,479 12.0 16.9 11.4
DECEMBER M 45,661 5,396 40,265 43,418 5,414 38,004 -2,243 18 -2,261 -4.9 0.3 -5.6
2nd Quarter 130,138 14,413 115,725 135,517 15,165 120,352 5,379 752 4,627 4.1 5.2 4.0
Upto 2nd Qtr 247,014 27,419 219,595 268,967 31,154 237,813 21,953 3,735 18,218 8.9 13.6 8.3
JANUARY M 40,418 4,567 35,851 42,067 2,364 39,703 1,649 -2,203 3,852 4.1 -48.2 10.7
P 287,432 31,986 255,446 311,034 33,518 277,516 23,602 1,532 22,070 8.2 4.8 8.6
FEBRUARY M 43,331 4,368 38,963 42,058 3,412 38,646 -1,273 -956 -317 -2.9 -21.9 -0.8
P 330,763 36,354 294,409 353,092 36,930 316,162 22,329 576 21,753 6.8 1.6 7.4
MARCH M 47,527 4,810 42,717 46,519 3,485 43,034 -1,008 -1,325 317 -2.1 -27.5 0.7
3rd Quarter 131,276 13,745 117,531 130,644 9,261 121,383 -632 -4,484 3,852 -0.5 -32.6 3.3
Upto 3rd Qtr 378,290 41,164 337,126 399,611 40,415 359,196 21,321 -749 22,070 5.6 -1.8 6.5
APRIL M 46,388 4,119 42,269 48,585 4,180 44,405 2,197 61 2,136 4.7 1.5 5.1
P 424,678 45,283 379,395 448,196 44,595 403,601 23,518 -688 24,206 5.5 -1.5 6.4
MAY M 52,172 2,945 49,227 49,688 3,739 45,949 -2,484 794 -3,278 -4.8 27.0 -6.7
P 476,850 48,228 428,622 497,884 48,334 449,550 21,034 106 20,928 4.4 0.2 4.9
JUNE M 62,720 2,888 59,832 65,518 1,569 63,949 2,798 -1,319 4,117 4.5 -45.7 6.9
4th Quarter 161,280 9,952 151,328 163,791 9,488 154,303 2,511 -464 2,975 1.6 -4.7 2.0
Upto 4th Qtr 539,570 51,116 488,454 563,702 49,903 513,499 23,832 -1,213 25,045 4.4 -2.4 5.1

Revenue Division Year Book 2006-07
58
SALES TAX (TOTAL) Two Year Comparative - Month to Month & Progressive Collection
(Rs. Million)
FY 2005-06 FY 2006-07 COMPARISON COMPARISON AS % AGE MONTHS GROSS Reb / Ref NET GROSS Reb / Ref NET GROSS Reb / Ref NET GROSS Reb / Ref NET
1 2 3 4 5 6 7 8 9 10 11 12 13
JULY M 19,978 4,238 15,740 28,688 4,664 24,024 8,710 426 8,284 43.6 10.1 52.6
AUGUST M 24,353 1,574 22,779 25,247 4,332 20,915 894 2,758 -1,864 3.7 175.2 -8.2
P 44,331 5,812 38,519 53,935 8,996 44,939 9,604 3,184 6,420 21.7 54.8 16.7
SEPTEMBER M 26,228 1,762 24,466 32,910 2,264 30,646 6,682 502 6,180 25.5 28.5 25.3
1st Quarter 70,559 7,574 62,985 86,845 11,260 75,585 16,286 3,686 12,600 23.1 48.7 20.0
OCTOBER M 27,204 3,628 23,576 26,031 4,057 21,974 -1,173 429 -1,602 -4.3 11.8 -6.8
P 97,763 11,202 86,561 112,876 15,317 97,559 15,113 4,115 10,998 15.5 36.7 12.7
NOVEMBER M 25,797 2,250 23,547 31,760 3,630 28,130 5,963 1,380 4,583 23.1 61.3 19.5
P 123,560 13,452 110,108 144,636 18,947 125,689 21,076 5,495 15,581 17.1 40.8 14.2
DECEMBER M 26,427 3,796 22,631 24,683 4,135 20,548 -1,744 339 -2,083 -6.6 8.9 -9.2
2nd Quarter 79,428 9,674 69,754 82,474 11,822 70,652 3,046 2,148 898 3.8 22.2 1.3
Upto 2nd Qtr 149,987 17,248 132,739 169,319 23,082 146,237 19,332 5,834 13,498 12.9 33.8 10.2
JANUARY M 25,310 3,122 22,188 26,406 1,620 24,786 1,096 -1,502 2,598 4.3 -48.1 11.7
P 175,297 20,370 154,927 195,725 24,702 171,023 20,428 4,332 16,096 11.7 21.3 10.4
FEBRUARY M 26,721 3,130 23,591 26,223 2,507 23,716 -498 -623 125 -1.9 -19.9 0.5
P 202,018 23,500 178,518 221,948 27,209 194,739 19,930 3,709 16,221 9.9 15.8 9.1
MARCH M 27,208 3,323 23,885 26,649 2,573 24,076 -559 -750 191 -2.1 -22.6 0.8
3rd Quarter 79,239 9,575 69,664 79,278 6,700 72,578 39 -2,875 2,914 0.0 -30.0 4.2
Upto 3rd Qtr 229,226 26,823 202,403 248,597 29,782 218,815 19,371 2,959 16,412 8.5 11.0 8.1
APRIL M 28,539 2,395 26,144 30,305 3,328 26,977 1,766 933 833 6.2 39.0 3.2
P 257,765 29,218 228,547 278,902 33,110 245,792 21,137 3,892 17,245 8.2 13.3 7.5
MAY M 32,101 1,555 30,546 30,414 2,989 27,425 -1,687 1,434 -3,121 -5.3 92.2 -10.2
P 289,866 30,773 259,093 309,316 36,099 273,217 19,450 5,326 14,124 6.7 17.3 5.5
JUNE M 37,371 1,666 35,705 37,108 930 36,178 -263 -736 473 -0.7 -44.2 1.3
4th Quarter 98,011 5,616 92,395 97,827 7,247 90,580 -184 1,631 -1,815 -0.2 29.0 -2.0
Upto 4th Qtr 327,237 32,439 294,798 346,424 37,029 309,395 19,187 4,590 14,597 5.9 14.1 5.0

Revenue Division Year Book 2006-07
59
SALES TAX (IMPORTS) Two Year Comparative - Month to Month & Progressive Collection
(Rs. Million)
FY 2005-06 FY 2006-07 COMPARISON COMPARISON AS % AGE MONTHS Gross Reb / Ref Net Gross Reb / Ref Net Gross Reb / Ref Net Gross Reb / Ref Net
1 2 3 4 5 6 7 8 9 10 11 12 13
JULY M 11,095 13 11,082 15,117 8 15,109 4,022 -5 4,027 36.3 -38.5 36.3
AUGUST M 13,609 22 13,587 14,852 3 14,849 1,243 -19 1,262 9.1 -86.4 9.3
P 24,704 35 24,669 29,969 11 29,958 5,265 -24 5,289 21.3 -68.6 21.4
SEPTEMBER M 14,358 2 14,356 14,792 9 14,783 434 7 427 3.0 350.0 3.0
1st Quarter 39,062 37 39,025 44,761 20 44,741 5,699 -17 5,716 14.6 -45.9 14.6
OCTOBER M 14,269 5 14,264 11,435 6 11,429 -2,834 1 -2,835 -19.9 20.0 -19.9
P 53,331 42 53,289 56,196 26 56,170 2,865 -16 2,881 5.4 -38.1 5.4
NOVEMBER M 13,122 6 13,116 16,370 3 16,367 3,248 -3 3,251 24.8 -50.0 24.8
P 66,453 48 66,405 72,566 29 72,537 6,113 -19 6,132 9.2 -39.6 9.2
DECEMBER M 14,352 9 14,343 12,792 17 12,775 -1,560 8 -1,568 -10.9 88.9 -10.9
2nd Quarter 41,743 20 41,723 40,597 26 40,571 -1,146 6 -1,152 -2.7 30.0 -2.8
Upto 2nd Qtr 80,805 57 80,748 85,358 46 85,312 4,553 -11 4,564 5.6 -19.3 5.7
JANUARY M 12,265 5 12,260 12,703 1 12,702 438 -4 442 3.6 -80.0 3.6
P 93,070 62 93,008 98,061 47 98,014 4,991 -15 5,006 5.4 -24.2 5.4
FEBRUARY M 13,095 4 13,091 13,623 3 13,620 528 -1 529 4.0 -25.0 4.0
P 106,165 66 106,099 111,684 50 111,634 5,519 -16 5,535 5.2 -24.2 5.2
MARCH M 15,026 18 15,008 14,102 4 14,098 -924 -14 -910 -6.1 -77.8 -6.1
3rd Quarter 40,386 27 40,359 40,428 8 40,420 42 -19 61 0.1 -70.4 0.2
Upto 3rd Qtr 121,191 84 121,107 125,786 54 125,732 4,595 -30 4,625 3.8 -35.7 3.8
APRIL M 13,757 2 13,755 15,467 1 15,466 1,710 -1 1,711 12.4 -50.0 12.4
P 134,948 86 134,862 141,253 55 141,198 6,305 -31 6,336 4.7 -36.0 4.7
MAY M 17,159 3 17,156 16,576 15 16,561 -583 12 -595 -3.4 400.0 -3.5
P 152,107 89 152,018 157,829 70 157,759 5,722 -19 5,741 3.8 -21.3 3.8
JUNE M 19,436 9 19,427 18,150 1 18,149 -1,286 -8 -1,278 -6.6 -88.9 -6.6
4th Quarter 50,352 14 50,338 50,193 17 50,176 -159 3 -162 -0.3 21.4 -0.3
Upto 4th Qtr 171,543 98 171,445 175,979 71 175,908 4,436 -27 4,463 2.6 -27.6 2.6

Revenue Division Year Book 2006-07
60
SALES TAX (DOMESTIC) Two Year Comparative - Month to Month & Progressive Collection
(Rs. Million)
FY 2005-06 FY 2006-07 COMPARISON COMPARISON AS % AGE MONTHS
GROSS Reb / Ref NET GROSS Reb / Ref NET GROSS Reb / Ref NET GROSS Reb / Ref NET 1 5 6 7 5 6 7 8 9 10 11 12 13
JULY M 8,883 4,225 4,658 13,571 4,656 8,915 4,688 431 4,257 52.8 10.2 91.4
AUGUST M 10,744 1,552 9,192 10,395 4,329 6,066 -349 2,777 -3,126 -3.2 178.9 -34.0
P 19,627 5,777 13,850 23,966 8,985 14,981 4,339 3,208 1,131 22.1 55.5 8.2
SEPTEMBER M 11,870 1,760 10,110 18,118 2,255 15,863 6,248 495 5,753 52.6 28.1 56.9
1st Quarter 31,497 7,537 23,960 42,084 11,240 30,844 10,587 3,703 6,884 33.6 49.1 28.7
OCTOBER M 12,935 3,623 9,312 14,596 4,051 10,545 1,661 428 1,233 12.8 11.8 13.2
P 44,432 11,160 33,272 56,680 15,291 41,389 12,248 4,131 8,117 27.6 37.0 24.4
NOVEMBER M 12,675 2,244 10,431 15,390 3,627 11,763 2,715 1,383 1,332 21.4 61.6 12.8
P 57,107 13,404 43,703 72,070 18,918 53,152 14,963 5,514 9,449 26.2 41.1 21.6
DECEMBER M 12,075 3,787 8,288 11,891 4,118 7,773 -184 331 -515 -1.5 8.7 -6.2
2nd Quarter 37,685 9,654 28,031 41,877 11,796 30,081 4,192 2,142 2,050 11.1 22.2 7.3
Upto 2nd Qtr 69,182 17,191 51,991 83,961 23,036 60,925 14,779 5,845 8,934 21.4 34.0 17.2
JANUARY M 13,045 3,117 9,928 13,703 1,619 12,084 658 -1,498 2,156 5.0 -48.1 21.7
P 82,227 20,308 61,919 97,664 24,655 73,009 15,437 4,347 11,090 18.8 21.4 17.9
FEBRUARY M 13,626 3,126 10,500 12,600 2,504 10,096 -1,026 -622 -404 -7.5 -19.9 -3.8
P 95,853 23,434 72,419 110,264 27,159 83,105 14,411 3,725 10,686 15.0 15.9 14.8
MARCH M 12,182 3,305 8,877 12,547 2,569 9,978 365 -736 1,101 3.0 -22.3 12.4
3rd Quarter 38,853 9,548 29,305 38,850 6,692 32,158 -3 -2,856 2,853 0.0 -29.9 9.7
Upto 3rd Qtr 108,035 26,739 81,296 122,811 29,728 93,083 14,776 2,989 11,787 13.7 11.2 14.5
APRIL M 14,782 2,393 12,389 14,838 3,327 11,511 56 934 -878 0.4 39.0 -7.1
P 122,817 29,132 93,685 137,649 33,055 104,594 14,832 3,923 10,909 12.1 13.5 11.6
MAY M 14,942 1,552 13,390 13,838 2,974 10,864 -1,104 1,422 -2,526 -7.4 91.6 -18.9
P 137,759 30,684 107,075 151,487 36,029 115,458 13,728 5,345 8,383 10.0 17.4 7.8
JUNE M 17,935 1,657 16,278 18,958 929 18,029 1,023 -728 1,751 5.7 -43.9 10.8
4th Quarter 47,659 5,602 42,057 47,634 7,230 40,404 -25 1,628 -1,653 -0.1 29.1 -3.9
Upto 4th Qtr 155,694 32,341 123,353 170,445 36,958 133,487 14,751 4,617 10,134 9.5 14.3 8.2

Revenue Division Year Book 2006-07
61
FEDERAL EXCISE Two Year Comparative - Month to Month & Progressive Collection
(Rs. Million) FY 2005-06 FY 2006-07 COMPARISON COMPARISON AS % AGE
MONTHS GROSS Reb / Ref NET GROSS Reb / Ref NET GROSS Reb / Ref NET GROSS Reb / Ref NET
1 5 6 7 5 6 7 8 9 10 11 12 13
JULY M 2,962 104 2,858 4,005 13 3,992 1,043 -91 1,134 35.2 -87.5 39.7
AUGUST M 4,063 2 4,061 4,635 38 4,597 572 36 536 14.1 1,800.0 13.2
P 7,025 106 6,919 8,640 51 8,589 1,615 -55 1,670 23.0 -51.9 24.1
SEPTEMBER M 5,364 44 5,320 5,400 3 5,397 36 -41 77 0.7 -93.2 1.4
1st Quarter 12,389 150 12,239 14,040 54 13,986 1,651 -96 1,747 13.3 -64.0 14.3
OCTOBER M 4,643 2 4,641 5,474 3 5,471 831 1 830 17.9 50.0 17.9
P 17,032 152 16,880 19,514 57 19,457 2,482 -95 2,577 14.6 -62.5 15.3
NOVEMBER M 4,117 1 4,116 5,558 39 5,519 1,441 38 1,403 35.0 3,800.0 34.1
P 21,149 153 20,996 25,072 96 24,976 3,923 -57 3,980 18.5 -37.3 19.0
DECEMBER M 4,405 41 4,364 5,860 3 5,857 1,455 -38 1,493 33.0 -92.7 34.2
2nd Quarter 13,165 44 13,121 16,892 45 16,847 3,727 1 3,726 28.3 2.3 28.4
Upto 2nd Qtr 25,554 194 25,360 30,932 99 30,833 5,378 -95 5,473 21.0 -49.0 21.6
JANUARY M 4,159 18 4,141 5,322 1 5,321 1,163 -17 1,180 28.0 -94.4 28.5
P 29,713 212 29,501 36,254 100 36,154 6,541 -112 6,653 22.0 -52.8 22.6
FEBRUARY M 4,890 8 4,882 5,592 4 5,588 702 -4 706 14.4 -50.0 14.5
P 34,603 220 34,383 41,846 104 41,742 7,243 -116 7,359 20.9 -52.7 21.4
MARCH M 5,277 14 5,263 5,981 2 5,979 704 -12 716 13.3 -85.7 13.6
3rd Quarter 14,326 40 14,286 16,895 7 16,888 2,569 -33 2,602 17.9 -82.5 18.2
Upto 3rd Qtr 39,880 234 39,646 47,827 106 47,721 7,947 -128 8,075 19.9 -54.7 20.4
APRIL M 5,710 5 5,705 7,024 9 7,015 1,314 4 1,310 23.0 80.0 23.0
P 45,590 239 45,351 54,851 115 54,736 9,261 -124 9,385 20.3 -51.9 20.7
MAY M 6,189 2 6,187 7,329 11 7,318 1,140 9 1,131 18.4 450.0 18.3
P 51,779 241 51,538 62,180 126 62,054 10,401 -115 10,516 20.1 -47.7 20.4
JUNE M 3,739 5 3,734 9,760 9 9,751 6,021 4 6,017 161.1 80.0 161.1
4th Quarter 15,638 12 15,626 24,113 29 24,084 8,475 17 8,458 54.2 141.7 54.1
Upto 4th Qtr 55,518 246 55,272 71,940 135 71,805 16,422 -111 16,533 29.6 -45.1 29.9

Revenue Division Year Book 2006-07
62
C U S T O M S Two Year Comparative - Month to Month & Progressive Collection
(Rs. Million)
FY 2005-06 FY 2006-07 COMPARISON COMPARISON AS % AGE MONTHS
GROSS Reb / Ref NET GROSS Reb / Ref NET GROSS Reb / Ref NET GROSS Reb / Ref NET 1 5 6 7 5 6 7 8 9 10 11 12 13
JULY M 9,717 1,334 8,383 10,156 2,080 8,076 439 746 -307 4.5 55.9 -3.7
AUGUST M 11,568 2,499 9,069 11,193 1,482 9,711 -375 -1,017 642 -3.2 -40.7 7.1
P 21,285 3,833 17,452 21,349 3,562 17,787 64 -271 335 0.3 -7.1 1.9
SEPTEMBER M 12,643 1,449 11,194 11,216 1,113 10,103 -1,427 -336 -1,091 -11.3 -23.2 -9.7
1st Quarter 33,928 5,282 28,646 32,565 4,675 27,890 -1,363 -607 -756 -4.0 -11.5 -2.6
OCTOBER M 11,496 1,643 9,853 10,948 1,147 9,801 -548 -496 -52 -4.8 -30.2 -0.5
P 45,424 6,925 38,499 43,513 5,822 37,691 -1,911 -1,103 -808 -4.2 -15.9 -2.1
NOVEMBER M 11,220 1,493 9,727 12,328 875 11,453 1,108 -618 1,726 9.9 -41.4 17.7
P 56,644 8,418 48,226 55,841 6,697 49,144 -803 -1,721 918 -1.4 -20.4 1.9
DECEMBER M 14,829 1,559 13,270 12,875 1,276 11,599 -1,954 -283 -1,671 -13.2 -18.2 -12.6
2nd Quarter 37,545 4,695 32,850 36,151 3,298 32,853 -1,394 -1,397 3 -3.7 -29.8 0.0
Upto 2nd Qtr 71,473 9,977 61,496 68,716 7,973 60,743 -2,757 -2,004 -753 -3.9 -20.1 -1.2
JANUARY M 10,949 1,427 9,522 10,339 743 9,596 -610 -684 74 -5.6 -47.9 0.8
P 82,422 11,404 71,018 79,055 8,716 70,339 -3,367 -2,688 -679 -4.1 -23.6 -1.0
FEBRUARY M 11,720 1,230 10,490 10,243 901 9,342 -1,477 -329 -1,148 -12.6 -26.7 -10.9
P 94,142 12,634 81,508 89,298 9,617 79,681 -4,844 -3,017 -1,827 -5.1 -23.9 -2.2
MARCH M 15,042 1,473 13,569 13,889 910 12,979 -1,153 -563 -590 -7.7 -38.2 -4.3
3rd Quarter 37,711 4,130 33,581 34,471 2,554 31,917 -3,240 -1,576 -1,664 -8.6 -38.2 -5.0
Upto 3rd Qtr 109,184 14,107 95,077 103,187 10,527 92,660 -5,997 -3,580 -2,417 -5.5 -25.4 -2.5
APRIL M 12,139 1,719 10,420 11,256 843 10,413 -883 -876 -7 -7.3 -51.0 -0.1
P 121,323 15,826 105,497 114,443 11,370 103,073 -6,880 -4,456 -2,424 -5.7 -28.2 -2.3
MAY M 13,882 1,388 12,494 11,945 739 11,206 -1,937 -649 -1,288 -14.0 -46.8 -10.3
P 135,205 17,214 117,991 126,388 12,109 114,279 -8,817 -5,105 -3,712 -6.5 -29.7 -3.1
JUNE M 21,610 1,217 20,393 18,650 630 18,020 -2,960 -587 -2,373 -13.7 -48.2 -11.6
4th Quarter 47,631 4,324 43,307 41,851 2,212 39,639 -5,780 -2,112 -3,668 -12.1 -48.8 -8.5
Upto 4th Qtr 156,815 18,431 138,384 145,038 12,739 132,299 -11,777 -5,692 -6,085 -7.5 -30.9 -4.4