Embed Size (px)
Citation preview

03/10/2013 1
MetrologyThe science of measurement
Year 2013-2014
Jean Virieux
The scientific investigation requires oftenquantitative measurements of physical and chemicalquantities.
Other analysis could require other evaluations: more qualitative related to subjective analysis(folded, unfolded, unclassified) which could occur as well in our Earth disciplines.
What is the most difficult one ?
The technical measurement

03/10/2013 2
MetrologyThe science of measurement
Measurements could be comparative (Jean is taller than Pierre) or could be absolute (Jean is 1.82 m high).
The second case is also a comparison with a global reference (a standard as the standard meter for example)
Relative versus absolute measurements
Examples ?

03/10/2013 3
Measurements are crucial in Earth sciencesand more specifically in M2P - GERboth in Geology and Geophysics
This presentation comes partiallyfrom teaching lectures ofJean-Paul Masson (engineer at ISTerre laboratory)
03/10/2013 4
Measurement Outline1. Measurand and output signal « o »2. External parameters3. Calibration4. Measurement errors5. Metrological characteristics of sensors6. Uncertainties estimation7. Practical estimation of uncertainties8. Standard mistakes9. Promoting results through graphics10. Theory11. Conclusion

03/10/2013 5
Documentation
See Amazon website for textbooks and Wikipedia for other writtensupport
See various websites for measurementwww.omega.com or fr.mt.com (Mettler in French!)
Other suggestions ?
Build up a bibliography ?

03/10/2013 6
experiment
osensorm
"Ce monde est pénétré des applications de la mesure ;toute connaissance,non mesurable, est frappée d'un jugement de dépréciation.Le nom de "science" se refuse de plus en plus à tout savoir intraduisible
en chiffre."Paul Valéry (1871-1945) : Poète, critique littéraire, essayiste , académicien
Measurand m: the quantity to be measured – ideal and never reached
Output signal o from the sensor (potential difference or current)
The sensor is characterized by the relation o=F(m)
We shall discuss here only a specific measurement and, whenmeasurements are performed through time, we leave the analysis the time series investigation (static case) to other trainings …
1) Measurand and output signalAny measure has an error which could not be determined

03/10/2013 7
m1 m2 m3
o3Non-linearsensor
S is the sensitivity of the sensor and has physical units related to the output signal and the measurand m
Example: flowmeterMeasurand m has units en m3/so is in VoltS is in Volt /(m3/s)
When linear sensor, the sensitivity is independent of the measurand m:S = a . m + b
Calibration curve F andsensitivity function S
Example: seismometerMeasurand m has units en m/so is in VoltS is in Volt /(m/s)
o2
o1

03/10/2013 8
Pressuresensor
StabilizedalimentationMeasurand =
pressure amperemeter
4-20 mA
Screen output (analogic)
A/D converter: conversion fromaanlog to digits
Abits
Computer Discrete values Compression Backup Visualisation
interrface
Example of a measurement workflow
Key elements in the chain for reaching the measurand: the final element gives discrete digital quantities
Measuring chain
Discussion about the music
Sigma-Delta ADC Basics

03/10/2013 9
Illustrative chain
ADC DSP DAC AnalogSignal
AnalogSignal
Digital Signal Processing
Digitizer Converter
A DAC converts an abstract finite-precision number (usually a fixed-point binary number) into a physical quantity (e.g., a voltage or a pressure). In particular, DACs are often used to convert finite-precision time series data to a continually varying physical signal.
AmplificationGainOffsetResponseNoiseSNRGlitch
coming from the sensor

03/10/2013 10
Physical, chemical and environmentalquantities that may influence the output
signal o or the calibration curve
o
For a specific measurand m, the output signal o varies with the temperature
timemorning evening
Frequent experimental perturbation parametersTemperature : often a strong impact on electronic circuits Magnetic field (terrestrial one CMP)Champ magnétique Vibrations: for many sensors related to pressure and particle velocities Hydrometryo = F (m,g1, g2, ... g i)g i are external parametersg1, g2,... g i are often taken as constants: not entirely true
Remedy : periodic calibration
2) External parametersDrift related to the temperature

03/10/2013 11
BIPMMass standard
Standard BNM3. 10-9
primer
StandardBNM1. 10-8
transfert
Metrology serviceReference:10-7
Working :10-6
Workingstandards 10-5
to10-6 for industry
Example of the cascade of standards for mass
measurements
Estimation of the relation o = F(m) often with a a graphical description and an algebricexpression (zeroes and poles of this function through a rational representation): we often call it a transfert function.
Often simple calibationOne should include all components of the acquisition chainPeriodicity : often before and after the experiment.« closure« of the calibration
3) Calibration

03/10/2013 12
Calibration curve for a pressure sensor with up and down curves for pressure
o Relation linéaireo = 0.5 m + 2R2 = 0.95
mb
o = a . m + b
The closure is performed through thre relation o = F(m) betweenthe standard of rank n+1 and the standard of rank n.Calibration certificat: o = F(m) following a strict experimentalprotocol.The standard of rank n+1 provides a known measurand.
3) Calibration

03/10/2013 13
Etalon de rang nIndication m tient lieu de mesurande
Bouteilleair comprimé
Capteur à étalonner (ou étalon de rang n+1)indication s
Manomètre indicateur
Vanne étanche
Circuit parfaitement étanche
Calibration of a pressure instrument
Case 1 : Fixed pressure generator: watertight for pressure Pressure measurement: standard rank n « connected"
3) Calibration

03/10/2013 14
Masse M1
Plateau tournant de masse M2
Section cylindre = AM1, M2, A parfaitement connus
Pression P connue
Pressure system to be calibrated
Case 2 : generator of a reference pressure:
3) Calibration

03/10/2013 15

03/10/2013 16
4) Measurement error
By repeating the measure of an object (the length of the table), we can see variations on the estimation of the measurand.We define the error as the misfit between the measureand the measurand (or the true value), even if this value could not be estimated.
External informations may help braketing this true value

03/10/2013 17
The need of a modelNot error definition without the introduction of
a model of the measurand …
Example: the length of the table does not vary with time … therefore manymeasurements may improve our estimation of the « true » value …
Without a model of an expected constant length …. Probability framework

03/10/2013 18
nm...mmm n21 Probability
densityfunction(PDF)
Output signal ooa ob
o- o+
a) systematic errors- Improper instrument: degraded response- Improper use of the instrument: wrong calibration; paraxial reading
(please follow the protocol)b) Accidental errors- Various origins- Unexpected and, therefore difficult to identifiy- Often randomized signatures
If we have a model (constant value for example of the measurand), we mayIncrease the number of measurements=> probability density function (implicit model formulation). Dispersion of measurements through standard deviation Standard deviation
1n...σ
2m)n(m
2m)2(m
2m)(m
1
Error typesExamples ?
,

03/10/2013 19
Random errorsHow to reduce systematic errors (accuracy)
How to reduce accidental (random?) errors(precision)
An accurate measurement requires a precisemeasurement
A precise measurement may be not accurate

03/10/2013 20
nm...mmm n21 Probability
densityfunction(PDF)
Output signal ooa ob
o- o+
If we have a model (constant value for example of the measurand), we mayIncrease the number of measurements=> probability density function (implicit model formulation). Dispersion of measurements through standard deviation standard deviation
1n...σ
2m)n(m
2m)2(m
2m)(m
1
The probability of having a measurand between oaand ob is given by the hashed surface.
Gaussian distribution
,

03/10/2013 21
Accuracy
s = F(m)
True value
Low uncertainty
We may have an upper limit of on the error for the probabilistic point of view
If Gaussian distribution (n independent variables), we may find o+ et o- such that
P(o ∈ [o-,o+])=95% to 99%
normemP %.5.95)2(_
m
3m
3m
%7.99)3(_
mP
Precision
Gaussian distribution

03/10/2013 22
Accuracy versus precisionThese two entities are confusing because we use the
same word in French for these two concepts.The accuracy of the measurement tells us how near/far
we are from the measurement to the true value expected from the model we have
The precision of the measurement tells us about the variability of the measurement itself without the need of any model representation
Absolute precision and relative precision
Again the table length example

03/10/2013 23
Relation between repeatability and precision
The repeatability of an instrument ischaracterized by the flatness of the probabilitydensity function
More the curve is narrow, better is the repeatability and, therefore the precision of the measurement.

03/10/2013 24
m
Capteur : pas fidèle, pas juste * Capteur : juste, pas fidèle **
dp(m)
m
dp(m)
m
Truevalue
m
Capteur : fidèle, juste ****
m
Capteur : fidèle, pas juste ***
dp(m) dp(m)
mm
mm
Classification of sensors

03/10/2013 25
Significant numbers and rulesfor rounding approximations
Explain 1,234 123,400 123,4 1.000 1.001 100,0
Rounding rules 1,24 1,27 1,2451 (2nd digit after comma) 1.2452 (2nd digit after comma)
(avoid a systematic error)

03/10/2013 26

03/10/2013 27
The error is of the order of the last selected figure of the number: Cancel out the figures which are not significative.
Do not write: pression = 4500.125843 Pa P = 1. 10-6 Pa
T = 5.025 ±0.053 N
Do write:pression = 45.0 Hecto Pa P = 10 Pa
T = 5.1 ± 0.3
When using a spreadsheet, please use the number of figures for yournumber driven by the physics.

03/10/2013 28
UncertaintiesBy repeating the measurement, we may see
variations: this disagreement is bounded by a limit which is the uncertainty and which cantake a positive or negative value.
Two kinds of uncertaintiesone comes from the operatus of measurementthe other comes from the definition of the measurand itself: this is a theoreticaluncertainty(example of the length of the table if not a rectangle!)
03/10/2013 29
The expected or formal errrorIf we are able to determine the pdf, we may
have an estimation of the inaccuracy of the measurand.
If one measurement is done, it is probable that it could not be less accurate that the formal error.
Consequently, disagreement between twomeasurements could not go beyond the formal error if we have a good description of the model.

03/10/2013 30
Estimation of errors and reductionof uncertainties
Our goal is the estimation of errors, in order to better constrain parameters of our model (which could not be the correct
Therefore, we may want to reduce measurementuncertainties for a better precision but we wantto improve our model description for a betteraccuracy

03/10/2013 31
Another way to say is that it is not possible to define it unambigously.
We may a tentative estimation
Absolute error= true value – measured value
Estimation, evalutionof upper bounds of errors
Uncertainty rectangles in x & y Practical work
y
x
x
y
Y = ax +y0a min < a <a max y min< y < ymax
Probability Density Function

03/10/2013 32
Absolute error = measured value – true valueAbsolute uncertainty: uncertainty of a quantity with physical units
l - l < true value « L » < l + l
ll
example : measurement of a water level in a tank with limnimeter.Absolute uncertainty: 0.2 mmMeasured value: 45 .3 mm45.1 mm < True value < 45.5 mmOne must write : L = 45.3mm 0.2 mm
%44.03.452.0
ll
Rule of length l
length l-L
length L+L
6) Uncertainties estimation
Relative uncertainty: uncertainty without any units dimensionless value

03/10/2013 33
Errors propagationThe error of the sum of two measurements is
equal to the sum of errors of eachindependent measurement
The error of the difference of twomeasurements is equal to the difference of errors of each independent measurement
Give the rules for the product and the division (hinttake the logarithm)

03/10/2013 34
Uncertainties propagationThe uncertainty of a sum of two independent
measurements is equal to the sum of individual uncertainties
The uncertainty of a difference of twoindependent measurements is equal to the sum of individual uncertainties
Please provide rules for the product and the division operations

03/10/2013 35
Do it using the logarithmic transformation
QVT
LogQ LogV LogT dQQ
dVV
dTT
VV
TT
Variational calculus
dVVx
dxVy
dyVz
dz
x dxy dxz dz
VVx
xVy
yVz
z
sumV = x + y - z
zz
yy
xx
VV ΔΔΔΔ
dV = dx + dy - dzV = x + y + z
VΔzΔyΔx
VΔV
03/10/2013 36
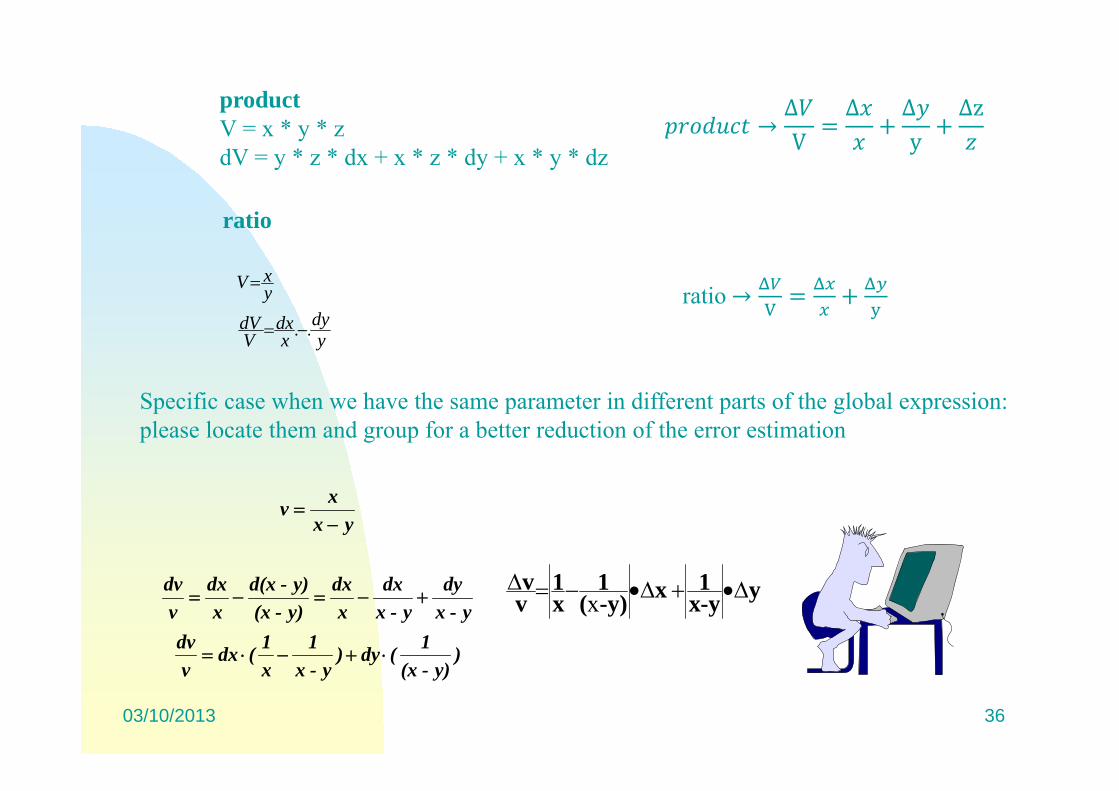
productV = x * y * zdV = y * z * dx + x * z * dy + x * y * dz
ratio
ydy
xdx
VdV
yxV
..
Specific case when we have the same parameter in different parts of the global expression: please locate them and group for a better reduction of the error estimation
)y)-(x
1(dy)y-x
1x1(dx
vdv
y-xdy
y-xdx
xdx
y)-(xy)-d(x
xdx
vdv
yxxv
y-yx1x -y)(
1x1
vv
x
→ΔV
Δ Δy
Δz
ratio→

03/10/2013 37
- Measurements in hydrodynamics: flow, velocityprecision < 5 % : oftenprecision < 2% : cautiousprecision < 0.5% : expertprecision better than 0.1% : specific standard center
- Measurements of lengthsAn operator could appreciate half the division of standardrule and 1/20 for a caliper for the initial division
- Measurements of time (or frequencies)Time of reaction of the operator and of the detection methodstandard : t = 0.05 à 1 soften t = 0.2 à 0.4 s
7) Practical estimation ofuncertainties
03/10/2013 38
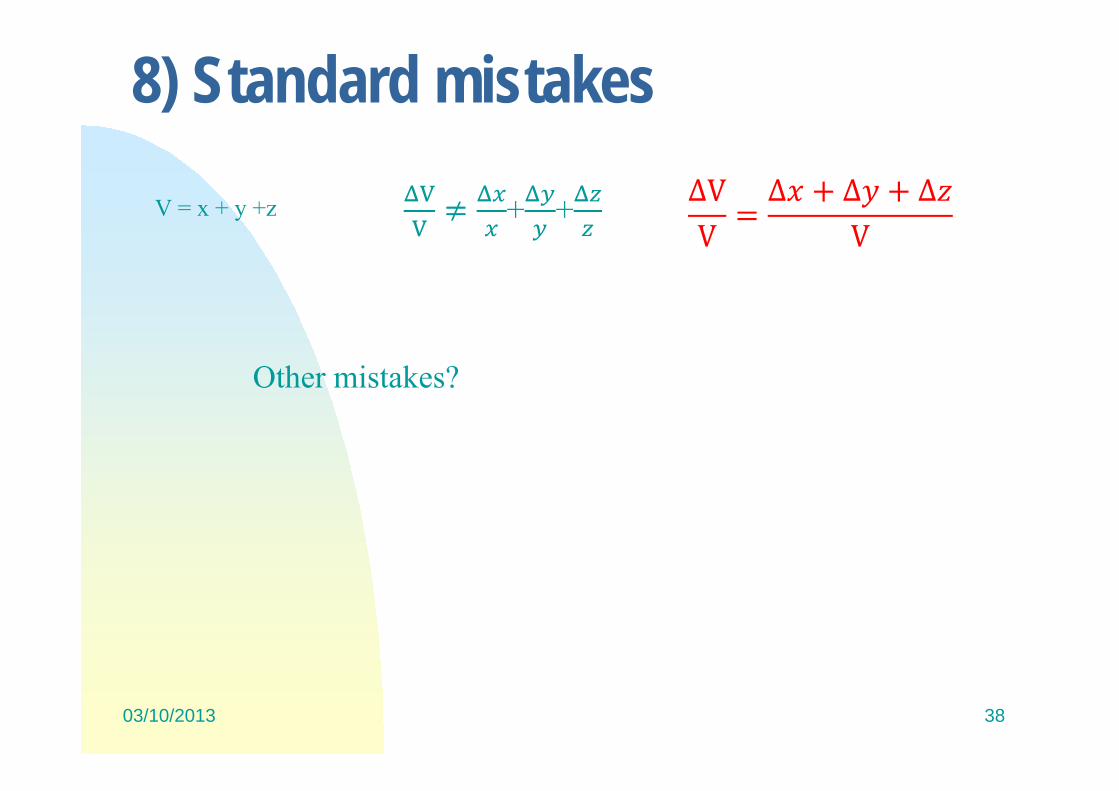
V = x + y +z
8) Standard mistakes
+ + ΔVV
Δ Δ ΔV
Other mistakes?

03/10/2013 39
3) Promoting resultsthrough graphics
Scale selectionCurve should filled up the main partReadability

03/10/2013 40
?

03/10/2013 41
Careful presentation
Caption : SHOULD BE SELF-CONSISTENT

03/10/2013 42
Readability: stamp style

03/10/2013 43
Order of magnitude: absurd or anomalousvaluesMake sure that values make sense
What is the speed of a seismic wave? What isthe age of the Earth?
Meaning of the graph

03/10/2013 44
Meaning of the plot
CAPTION: what is p and q, what is D, what to see in thispicture, what are units?
03/10/2013 45
In summary: a good plot
A plot has a title and a caption. Drawing zone should be adapted Scale selection: curve should occupied roughly 2/3 of
the spreadsheet Characters should be adapted for reading. Values in coordinates should have their units
specified (SI). If a quantitative reading is required, use a grid Curves should have uncertainty rectangles: control
EXCEL. Trend curve and correlation coefficient are welcom Values should be of the expected order Caption should help the reader seeing the picture

03/10/2013 46
A useful graph
Banc soufflerie : trainée du cylindre = f(hauteur d'eau)
y = 43,891x - 0,317R2 = 0,9994
0,00
0,50
1,00
1,50
2,00
2,50
3,00
3,50
4,00
4,50
5,00
0,000 0,020 0,040 0,060 0,080 0,100 0,120
hauteur d'eau : m
forc
e de
trai
née
: N
force mesuréepar le capteur
Linéaire (force mesuréepar le capteur)
Figure a: Measured net force along vertical line and the water levelalong the horizontal line as a pink point of measurement. A lineartrend has been found with a high correlation coefficient.

03/10/2013 47
Anthology
Le TP marche bien! Nous obtenons des erreurs tout à fait négligeables par rapport aux expériences réalisées dans d’autres TP.
résultat de traînée du cylindre : T = 6 ± 9 N C’est pourquoi le calcul manuel avec le chronomètre n’est pas si superflu
que semble l’indiquer les résultats l’air passe ensuite dans la chambre d’essai, qui, comme son nom l’indique
est le lieu ou se déroulent les essais .
En sortie de soufflerie, un système permet de modifier la vitesse en entrée « On ne peut guère que faire des suppositions dessus, tout comme le sexe
des anges… Cette méthode est à la science ce que le tire bouchon est à la boite de conserve, dans la mesure ou elle est hors de propos. En effet, si on ne connaît pas le résultat, elle ne sert à rien et si on le connaît déjà, elle ne sert pas davantage. »

03/10/2013 48
More mathematicalpresentation

03/10/2013 49
Probability distribution and reference sampling
If we have n measurements xi of a measurandx, we may expect to guess the structure of these measurements
In case of an infinite number of measurements, a distribution may explain each value: we call it the probability distribution and we considerthat the set of measurements are the reference sampling
(reference parameter = lim (discretized parameter)

03/10/2013 50
Mean, median, expected value
The determined parameter should converge towards the parameter of the referencedistribution
Mean :
Median :
Expected value :
1i
ix
1/ 2 1/ 2( ) ( ) 0.5i iP x P x
max max( ) ( )P P x
Symmetrical distribution: values will be identical

03/10/2013 51
Probability distribution1/ 2
max
The surface under the distribution is normalizedto one.
The probability of having the value x is ( )p x dx

03/10/2013 52
DeviationsThe deviation of the measurement with respect
to the mean of the reference distribution isdefined as the difference
The mean of the deviation should be equal to zero (show it)
The mean deviation is the mean of the amplitudes of deviations
i id x
1lim ( )iNx
N
lim 0iNd

03/10/2013 53
Variance and standard deviationThe variance is defined as the limit of the mean
of the square of the deviations
And the standard deviation is
2 2 2 21 1lim ( ) limi iN Nx x
N N
21lim ( )iNx
N

03/10/2013 54
SignificationThe mean with the median and with the expected
value are parameters which characterize the information we are looking for during the experiment.
In case of any distribution, we may consider thatthe mean value gives the best representation of the reality and, therefore, of the true value.
The variance and the standard deviationcharacterize the uncertainties with ourmeasurements and sample the best the fluctuations of our measurements.

03/10/2013 55
Discrete distributionWe may define a mean and a standard
deviation of the reference distribution P(x) through following expressions
22
lim ( )
lim ( )
i iN
i jN
x P x
x P x
03/10/2013 56
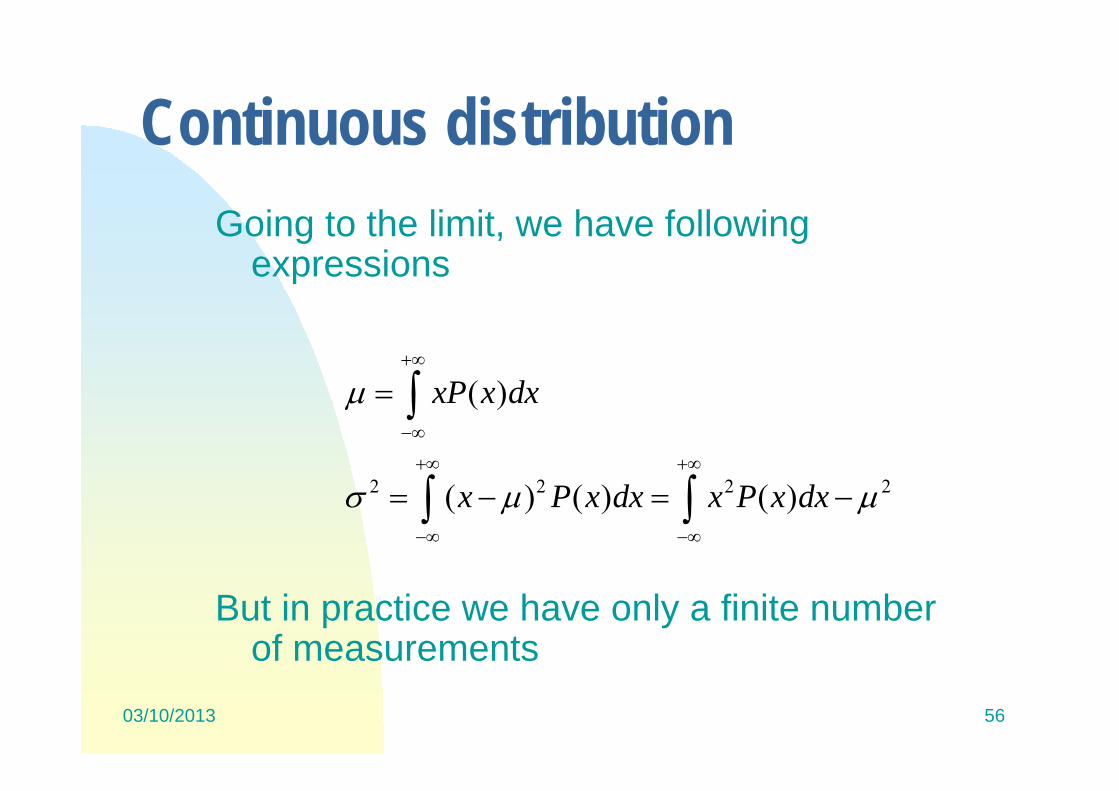
Continuous distributionGoing to the limit, we have following
expressions
But in practice we have only a finite numberof measurements
2 2 2 2
( )
( ) ( ) ( )
xP x dx
x P x dx x P x dx
03/10/2013 57
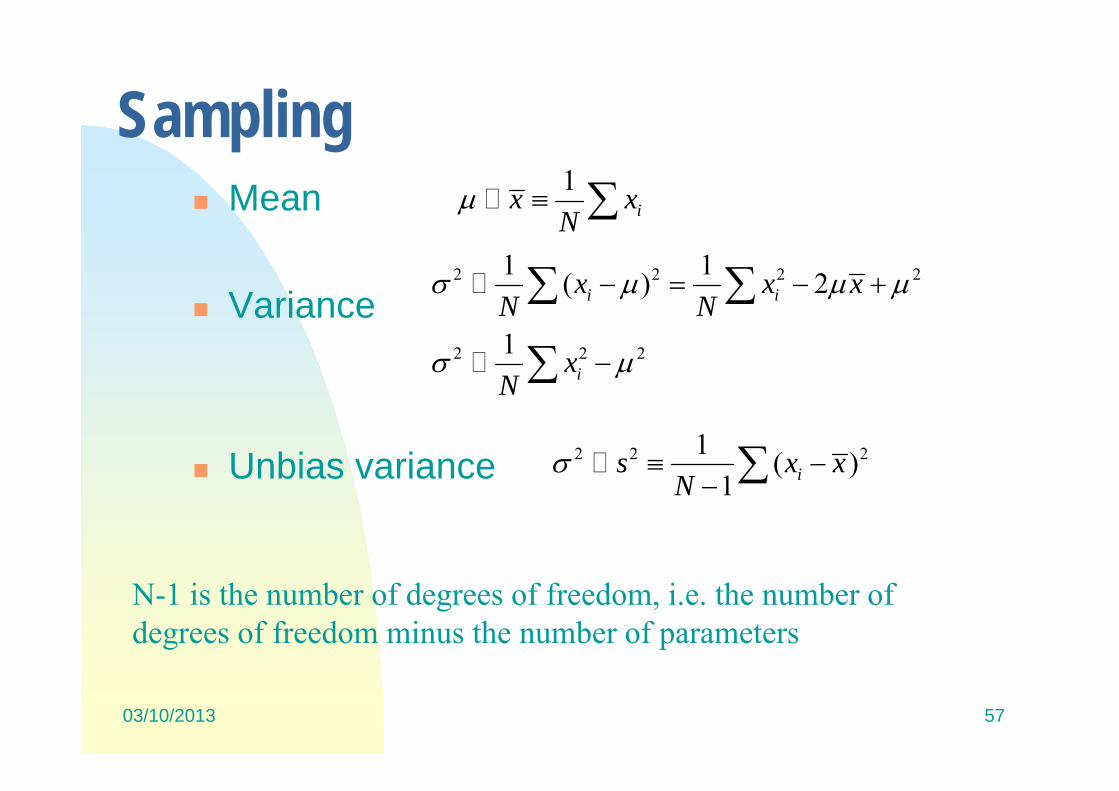
Sampling Mean
Variance
Unbias variance
1ix x
N
2 2 2 2
2 2 2
1 1( ) 2
1
i i
i
x x xN N
xN
2 2 21 ( )1 is x x
N
N-1 is the number of degrees of freedom, i.e. the number of degrees of freedom minus the number of parameters

03/10/2013 58
Normal distributionRandom errors are expected to be distributed
using the following theoretical distribution with two parameters (mean and standard deviation)
which represents the probability of measuring the value x
21 1( , , ) exp22G
xP x

03/10/2013 59
Properties of the normal distribution
Half-length is defined such that, betweenthese values, the probability is equal to 0.5, which gives
( 1/ 2 , , ) 1/ 2 ( , , )G GP P
The tangente curve where is the highest slopegives un interval of values x=±2
1/ 2( 2 , , ) ( , , )G GP e P

03/10/2013 60
Poison distributionWe may have physical phenomena as the
radioactivity which do not follow a normal/gaussian distribution but anotherlaw which is for this specific case the Poisson distribution
( , ) exp( )!
x
PP xx
The standard deviation is equal to the square root of the mean of this distribution: only one parameter.

03/10/2013 61
Gaussian Law
Poisson Law Poisson Law
Graphical presentation

03/10/2013 62
Quality testHow to estimation the correctness of the
distribution law we selectWe may consider the test of X2 which provides
an estimation of the measurementdispersion from those expected from a theoretical Gaussian distribution
If N measurements are performed and N values are obtained, we may look at the expected frequency distribution of thesevalues given by ( ) ( )j jf x NP x

03/10/2013 63
Quality testFor each value xj, we have a standard deviation
j(f) related to the uncertainty of the frequencydetermination f(xj).
We may estimate the following quantity
Value which could be equat to the number of observations and which indicate that the dispersion of frequencies should be equal for all values.
In fact, we consider the reduced value related to the number of degrees of freedom =(n-2) for the Gaussian distribution
2
22
1
( ) ( )( )
nj j
j j
f x NP xf
22 1

03/10/2013 64
Conclusion
Measurements should be givent with the uncertainties
Measurements allow to bracket the truevalue by repeating the procedure if errorsare randomly distributed.
It is crucial that other sources of errorsshould be corrected by the operatoir in the experimental protocol.

END OF THE STORY
03/10/2013 65

03/10/2013 66
-distinction entre la précision intrinsèque de l'instrument de mesure et LA PRÉCISION EFFECTIVE de la mesure.
Exemple :mesure de niveau d'une surface librelimnimètre à pointe l = 0.2 mmfluctuations de l'ordre de 1 mm = vrai l
- TOLÉRANCE DIMENSIONNELLE de réalisationplan du bureau d'étude + 0.4
orifice de diaphragme D = 134 + 0
D = 0.2 mm
ordres de grandeur : bâtiment 1cm
chaudronnerie : 5mmusinage classique : 0.1 mmusinage de précision : 0.01 mm ou mieux
7) Practical estimation ofuncertainties

03/10/2013 67
5) CARACTÉRISTIQUES MÉTROLOGIQUES D'UN CAPTEURPrécision exactitudeINDICATIONS PROCHES DE LA VALEUR VRAIE DE LA GRANDEUR À MESURER.fidèle et justePRÉCISION EN POURCENTAGE DE L'ÉTENDUE DE MESURE Etendue de mesure : EMPlage de mesure située entre les valeurs extrêmes (mini- maxi)pour lesquelles les caractéristiques métrologiques sont garanties.Capteur de pression
Non destruction 3 EMNon détérioration 1.5 EM
Nominal 1 EMDynamique : rapport entre les valeurs extrêmes de l'étendue de mesureExpression en dB : 20 log10 (Vmax / Vmin)Sensibilité : rapport entre la variation du signal de sortie et la variation dumesurande.Résolution mobilité, quantification : plus petite variation du mesurandemodifiant le signal de sortie s.Seuil : résolution autour du zéroValeur minimale de la mesure.

03/10/2013 68
étendue de mesure
Ecart de linéarité max
s
mesurande
Linéarité adéquation avec une formulation du type :s = a . m + bSensibilité indépendante de la valeur du mesurandelinéarité : caractérisée par le coefficient de corrélation
Décalage de zéro : offsetDécalage à l'origine du signal de sortie (ex : dérive thermique)
Hystérésis réversibilitéDifférence de valeurs de s suivant l'approche d'une valeur donnée variant de façon croissante ou décroissante.
Résultat quantitatif : Coefficient de corrélation1 = parfait0.9 : médiocre

03/10/2013 69
Dérive : variation monotone de la sortie pour une entrée constante
Répétabilité reproductibilité, répétitivité
Caractérisé par les différentes valeurs successives obtenues avec un mesurande constant durant un temps court devant une variationsignificative du mesurande. Finesse discrétionInfluence du capteur sur le mesurandeEx : mesure de force avec un dynamomètre : force "prélevée"Ex : mesure de déplacement optique : pas de modification du mesurande
Étendue de mesure
Ecart d'hystérésis max = h/2
s
mesurande
h
03/10/2013 70
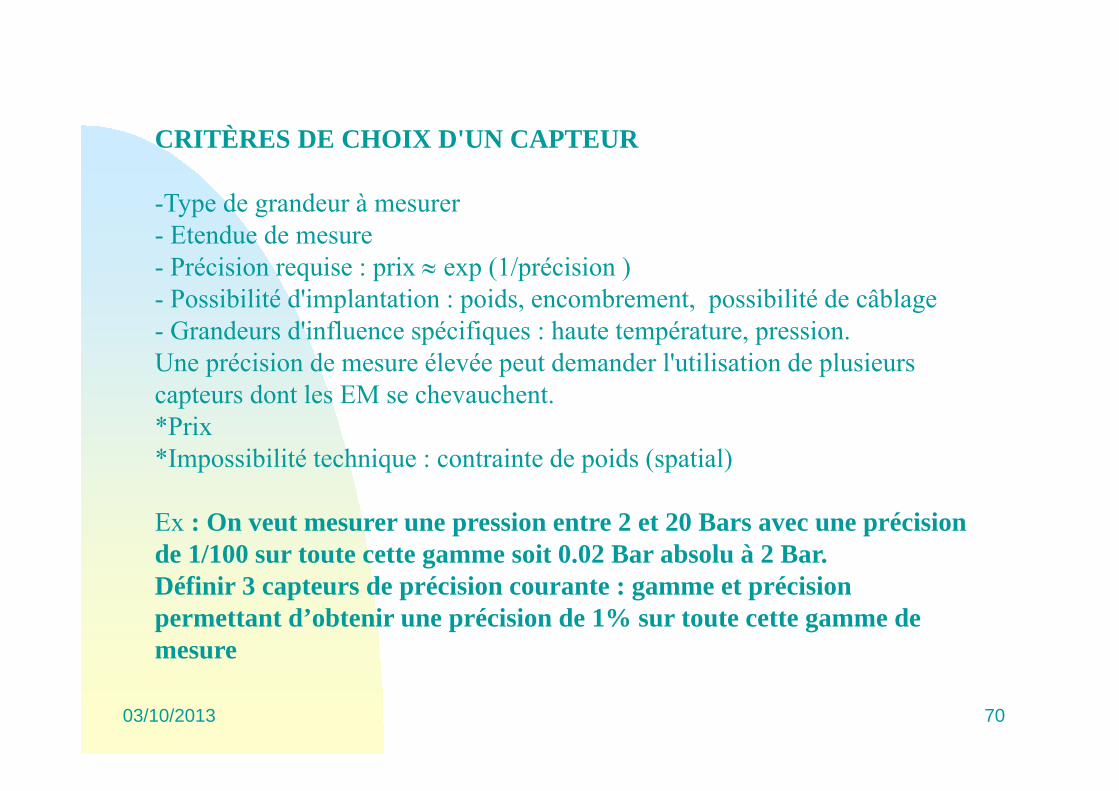
CRITÈRES DE CHOIX D'UN CAPTEUR
-Type de grandeur à mesurer- Etendue de mesure- Précision requise : prix exp (1/précision )- Possibilité d'implantation : poids, encombrement, possibilité de câblage- Grandeurs d'influence spécifiques : haute température, pression.Une précision de mesure élevée peut demander l'utilisation de plusieurs capteurs dont les EM se chevauchent.*Prix*Impossibilité technique : contrainte de poids (spatial)
Ex : On veut mesurer une pression entre 2 et 20 Bars avec une précision de 1/100 sur toute cette gamme soit 0.02 Bar absolu à 2 Bar.Définir 3 capteurs de précision courante : gamme et précision permettant d’obtenir une précision de 1% sur toute cette gamme de mesure

03/10/2013 71
capteur 0 => 20 Bars à 0.5 %10
5 102
capteur 0 => 5 Bars à 0.4 %5
20Bars
capteur 0 =>10 Bars à 0.5 %
2 Bars
solution 1 : Un seul capteur EM 20 Bars à 0.1%Prix élevésolution 2 : capteur 0 à 5 Bars à 0.4 % + capteur 0 à 10 Bars à 0.5 % + capteur 0 à 20 Bars à 0.5%

03/10/2013 72
Exemple 1Mesure de débit par mesure de volume transité pendant un temps donné t.
Q = V / t = (S.h)/t = (L .l. h) / tRemarque : 1 t au déclenchement du chronomètre + 1 t à l'arrêt du chronomètre
tΔt2h
ΔhlΔl
LΔL
QΔQ
Exemple 2On cherche à calculer le débit du ventilateur à la vitesse de rotation N0 sachant que la mesure a été effectuée à la vitesse N.Soit No la vitesse de référence visée correspondant à Qo et Pco.Soit N la vitesse correspondant à Q et PcCp est un coefficient de correction.S est la section du diaphragme (diamètre D).Pc est la différence de pression aux bornes du diaphragme mesurée par une hauteur d’alcool(masse volumique al) dans un tube en U.g est l’accélération de la pesanteur
air
PcSCpQ *2**
On sait que :
NNoQQo *
Calculez ?.QQ

03/10/2013 73
NN
NoNo
hh
gg
DD
CpCp
QoQo
NNohgDCpQo
PcSCpQ
air
air
al
al
air
al
air
21
21
21
212
****2*4
**
.*2**
2
Les grandeurs d'entrée variables (grandeurs mesurées) sontN h alcoolLes grandeurs calculées sont Q et Hs

03/10/2013 74
Cp correspond aux erreurs d'interpolation pour la détermination de Cp(à évaluer sur la courbe) et l’imprécision de cette valeur.
D correspond à la tolérance de l'usinage des diaphragmes(~ 0.2mm).
h correspond à l'erreur sur la mesure de la colonne d'alcool et sa fluctuation(~ 0.5mm).
N correspond à l'erreur sur la mesure de la vitesse de rotation et sa fluctuation. (~ 1 à 2
NN
hh
DD
CpCp
QoQo
212
Certaines erreurs sont négligeables.La masse volumique de l'alcool al, la masse volumique de l'air air(calculée dans les conditions de l’expérience), la valeur de g sont connues avec une précision très correcte (< 0.2%).No étant une valeur fixée , l'erreur est nulle par principe.