Embed Size (px)
Citation preview

Mosman Council GENERAL PURPOSE FINANCIAL STATEMENTS for the year ended 30 June 2016
Proud to be MosmanProtecting our HeritagePlanning our FutureInvolving our Community

Financial Statements 2016
page 1
Mosman Council
General Purpose Financial Statements for the year ended 30 June 2016
Contents
1. Understanding Council’s Financial Statements
2. Statement by Councillors and Management
3. Primary Financial Statements:
– Income Statement– Statement of Comprehensive Income– Statement of Financial Position– Statement of Changes in Equity– Statement of Cash Flows
4. Notes to the Financial Statements
5. Independent Auditor’s Reports:
– On the Financial Statements (Sect 417 [2]) – On the Conduct of the Audit (Sect 417 [3])
Overview
(i) These financial statements are General Purpose Financial Statements and cover the consolidated operations forMosman Council.
(ii) Mosman Council is a body politic of NSW, Australia – being constituted as a local government areaby proclamation and is duly empowered by the Local Government Act 1993 (LGA).
Council’s Statutory Charter is detailed in Paragraph 8 of the LGA and includes giving Council;
the ability to provide goods, services and facilities, and to carry out activities appropriate to the current and futureneeds of the local community and of the wider public,
the responsibility for administering regulatory requirements under the LGA and
a role in the management, improvement and development of the resources in the area.
A description of the nature of Council’s operations and its principal activities are provided in Note 2(b).
(iii) All figures presented in these financial statements are presented in Australian currency.
(iv) These financial statements were authorised for issue by the Council on 09 September 2016.Council has the power to amend and reissue these financial statements.
8
9
8385
Page
4
67
5
2
3

Financial Statements 2016_
Mosman Council General Purpose Financial Statements for the year ended 30 June 2016 Understanding Council’s financial statements
page 2
Introduction Each year, individual local governments across New South Wales are required to present a set of audited financial statements to their council and community. What you will find in the statements The financial statements set out the financial performance, financial position and cash flows of Council for the financial year ended 30 June 2016. The format of the financial statements is standard across all NSW Councils and complies with both the accounting and reporting requirements of Australian Accounting Standards and requirements as set down by the Office of Local Government. About the Councillor/Management Statement The financial statements must be certified by senior staff as ‘presenting fairly’ the Council’s financial results for the year, and are required to be adopted by Council – ensuring both responsibility for and ownership of the financial statements. About the primary financial statements The financial statements incorporate five ‘primary’ financial statements: 1. The Income Statement
This statement summarises Council’s financial performance for the year, listing all income and expenses. This statement also displays Council’s original adopted budget to provide a comparison between what was projected and what actually occurred. 2. The Statement of Comprehensive Income
This statement primarily records changes in the fair values of Council’s infrastructure, property, plant and equipment. 3. The Statement of Financial Position
An end of year snapshot of Council’s financial position indicating its assets, liabilities and equity (‘net wealth’).
4. The Statement of Changes in Equity
The overall change for the year (in dollars) of Council’s ‘net wealth’.
5. The Statement of Cash Flows
This statement indicates where Council’s cash came from and where it was spent. This statement also displays Council’s original adopted budget to provide a comparison between what was projected and what actually occurred.
About the Notes to the Financial Statements The Notes to the Financial Statements provide greater detail and additional information on the five primary financial statements. About the Auditor’s Reports Council’s financial statements are required to be audited by external accountants (that generally specialise in local government). In NSW, the auditor provides 2 audit reports: 1. An opinion on whether the financial statements
present fairly the Council’s financial performance and position, and
2. Their observations on the conduct of the audit, including commentary on the Council’s financial performance and financial position.
Who uses the financial statements? The financial statements are publicly available documents and must be presented at a Council meeting between seven days and five weeks after the date of the Audit Report. The public can make submissions to Council up to seven days subsequent to the public presentation of the financial statements. Council is required to forward an audited set of financial statements to the Office of Local Government.

page 3

Financial Statements 2016
This statement should be read in conjunction with the accompanying notes. page 4
Mosman Council
Income Statement for the year ended 30 June 2016
$ ’000
Income from continuing operationsRevenue:Rates and annual chargesUser charges and feesInterest and investment revenueOther revenuesGrants and contributions provided for operating purposesGrants and contributions provided for capital purposesOther income:Net share of interests in joint ventures andassociates using the equity method
Total income from continuing operations
Expenses from continuing operationsEmployee benefits and on-costsBorrowing costsMaterials and contractsDepreciation and amortisationImpairmentOther expensesNet losses from the disposal of assets
Total expenses from continuing operations
Operating result from continuing operations
Discontinued operations
Net profit/(loss) from discontinued operations
Net operating result for the year2
Net operating result attributable to CouncilNet operating result attributable to non-controlling interests
Net operating result for the year before grants andcontributions provided for capital purposes2
Original budget as approved by Council – refer Note 16
–
– 5,216
5,216
2,952
–
Actual 2015
Actual
23,680
503 6,115
5,216
40,064
167 150
10,023
1,920 2,264
44,547
17,227
5,387 –
5,728
97
46,512
11,911 5,166
(1,484)
45,280
5
4a 16,874
20 10,914
47,996
(1,484)
4d6,430
15,925
– 5,415
–
14,291
4e–
4c502
–
(1,484)
–
1,877
1,877
–
24–
42,670
1,877
(3,404)
Budget 1
3e,f
4d
4b
2,919
25,354 25,273
Notes
3a
3d3c
2016
425
2016
10,518
4,432
3b 10,755 526
4,871 2,545 3e,f
–
431 13,897
2,119 1,780
19
612
2
1
Operating result heavily influence by asset revaluation decrements (Note 4e). Operating Performance Ratio, measuring underlying ability to maintain expenditure within revenues, remains robust and improved in reporting period (Note 13).

Financial Statements 2016
This statement should be read in conjunction with the accompanying notes. page 5
Mosman Council
Statement of Comprehensive Income for the year ended 30 June 2016
$ ’000
Net operating result for the year (as per Income Statement)
Other comprehensive income:
Amounts which will not be reclassified subsequently to the operating resultGain (loss) on revaluation of I,PP&ETotal items which will not be reclassified subsequentlyto the operating result
Amounts which will be reclassified subsequently to the operating resultwhen specific conditions are metNil
Total other comprehensive income for the year
Total comprehensive income for the year
Total comprehensive income attributable to CouncilTotal comprehensive income attributable to non-controlling interests
5,965
5,965
Actual 2015
749
5,216
8,398 749
20b (ii) 8,398
NotesActual
(1,484)
– 6,914
749
–
8,398
6,914
2016

Financial Statements 2016
This statement should be read in conjunction with the accompanying notes. page 6
Mosman Council
Statement of Financial Position as at 30 June 2016
$ ’000
ASSETSCurrent assetsCash and cash equivalentsInvestmentsReceivablesInventoriesOtherNon-current assets classified as ‘held for sale’Total current assets
Non-current assetsInvestmentsReceivablesInventoriesInfrastructure, property, plant and equipmentInvestments accounted for using the equity methodInvestment propertyIntangible assetsTotal non-current assets
TOTAL ASSETS
LIABILITIESCurrent liabilitiesPayablesBorrowingsProvisionsTotal current liabilities
Non-current liabilitiesPayablesBorrowingsProvisionsTotal non-current liabilities
TOTAL LIABILITIES
Net assets
EQUITYRetained earningsRevaluation reservesCouncil equity interestNon-controlling equity interests
Total equity
–
423,281
8
298
122
898
474,355
10
10
4,735
467,441
467,441
211,951
7,166 –
22
24,413
–
–
– –
473,403
792
5,819
10
44,963 282
9
1011,954
480,228
48,950
433,963
17,068
–
1,746 9,770
286
13,160
1,913 3,895
60
82
18,435
–
254,006
5,978 7,452
23,030
15,578
159
255,490
163
2,000 3,685
10
474,355
474,355 –
467,441 –
20220,349 20
6a6b
10
7
25
6b
8
Notes
7
1419
8
18,540
2016
148 227
– 3,440
12,725
490,471
2015Actual Actual
498,768

Financial Statements 2016
This statement should be read in conjunction with the accompanying notes. page 7
Mosman Council
Statement of Changes in Equity for the year ended 30 June 2016
$ ’000
Opening balance (as per last year’s audited accounts)
a. Correction of prior period errorsb. Changes in accounting policies (prior year effects)
Revised opening balance (as at 1/7/15)
c. Net operating result for the year
d. Other comprehensive income – Revaluations: IPP&E asset revaluation rsve – Revaluations: other reserves – Transfers to Income Statement – Impairment (loss) reversal relating to I,PP&E – Joint ventures and associatesOther comprehensive income
Total comprehensive income (c&d)
e. Distributions to/(contributions from) non-controlling Interests
f. Transfers between equity
Equity – balance at end of the reporting period
$ ’000
Opening balance (as per last year’s audited accounts)
a. Correction of prior period errorsb. Changes in accounting policies (prior year effects)
Revised opening balance (as at 1/7/14)
c. Net operating result for the year
d. Other comprehensive income – Revaluations: IPP&E asset revaluation rsve – Revaluations: other reserves – Transfers to Income Statement – Impairment (loss) reversal relating to I,PP&E – Joint ventures and associatesOther comprehensive income
Total comprehensive income (c&d)
e. Distributions to/(contributions from) non-controlling Interests
f. Transfers between equity
Equity – balance at end of the reporting period
749
– 749 749
TotalInterest
–
749
– – –
– – – – –
–
–
–
749
–
– –
474,355
– –
6,914
–
–
– (40,529)
(1,484)
507,970
467,441
–
Non-
6,914
–
– – –
211,951
–
controlling
467,441
507,970
– –
Councilinterest
–
equity
Non-
8,398
–
–
–
8,398
–
– –
8,398
–
– –
–
(1,484)
20 (c)
20 (d)
–
–
–
(1,484)
– –
– 20b (ii) –
–
RetainedearningsNotes
– (40,529)
20b (ii)
20b (ii) –
255,490
8,398
– 8,398
296,019
19b –
20b (ii)
–
–
(Refer 20b)
–
Reserves
Reserves
8,398
–
211,951
(Refer 20b)
2016
–
–
– – –
467,441
–
211,951
20b (ii)
19b
2015
– 5,216
290,803
– 211,202
211,202 –
20b (ii)
20b (ii)
– –
20 (d)
255,490
– –
5,216
(40,529)
749 5,965
461,476 (40,529)
20b (ii) 749
–
– –
– –
467,441
5,965
–
(40,529)
–
– – – – –
Council
474,355
– –
250,274
–
–
Earnings
5,216
–
(40,529) 461,476
502,005
5,216
–
Interestcontrolling
–
EquityInterest
8,398
254,006
–
Total
220,349
–
20 (c) – – –
502,005 –
RetainedNotes
(1,484)

Financial Statements 2016
This statement should be read in conjunction with the accompanying notes. page 8
Mosman Council
Statement of Cash Flows for the year ended 30 June 2016
$ ’000
Cash flows from operating activitiesReceipts:Rates and annual chargesUser charges and feesInvestment and interest revenue receivedGrants and contributionsBonds, deposits and retention amounts receivedOtherPayments:Employee benefits and on-costsMaterials and contractsBorrowing costsBonds, deposits and retention amounts refundedOtherNet cash provided (or used in) operating activities
Cash flows from investing activitiesReceipts:Sale of investment securitiesSale of infrastructure, property, plant and equipmentDistributions received from joint ventures and associatesPayments:Purchase of investment securitiesPurchase of infrastructure, property, plant and equipmentNet cash provided (or used in) investing activities
Cash flows from financing activitiesReceipts:Proceeds from borrowings and advancesPayments:Repayment of borrowings and advancesNet cash flow provided (used in) financing activities
Net increase/(decrease) in cash and cash equivalents
Plus: cash and cash equivalents – beginning of year
Cash and cash equivalents – end of the year
Additional Information:
plus: Investments on hand – end of year
Total cash, cash equivalents and investments
Please refer to Note 11 for additional cash flow information.
6b
Notes
515
(15,266)
4,421
5,193 3,283 1,809
10,843
4,765
20152016
9,567
(33)
(1,628)
9,600
(6,260)
11a
(2,028)
–
400
(6,260)
–
–
–
–
7,855 (6,405)
4,373 –
3,995 421
25,244
Budget
(16,619)
(439) (13,163)
2016
10,448
–
(1,914)
(19,350)
14,725
2,000
12,725
13,160
13,160
–
11a
10,046
(33,000)
400
(7,056)
510
25,299
5,057
9,835
Actual
23,512
9,925
(513) (13,602) (16,678)
(6,659) (2,259)
(621) (12,092)
19,350 31,000
(5,028) (8,967) (5,060)
(1,887)
10,150
(1,887)
3,010
13,160
(435)
(1,514)
Actual
(6,304) 11b
61 32 28 –
(1,077)

Financial Statements 2016
page 9
Mosman Council
Notes to the Financial Statements for the year ended 30 June 2016
Contents of the notes accompanying the financial statements
Details
Summary of significant accounting policiesCouncil functions/activities – financial informationCouncil functions/activities – component descriptionsIncome from continuing operationsExpenses from continuing operationsGains or losses from the disposal of assetsCash and cash equivalent assetsInvestmentsRestricted cash, cash equivalents and investments – detailsReceivablesInventories and other assetsInfrastructure, property, plant and equipmentExternally restricted infrastructure, property, plant and equipmentInfrastructure, property, plant and equipment – current year impairmentsPayables, borrowings and provisionsDescription of (and movements in) provisionsStatement of cash flows – additional informationCommitments for expenditureStatement of performance measures:13a (i) Local government industry indicators (consolidated)13a (ii) Local government industry graphs (consolidated)Investment propertiesFinancial risk managementMaterial budget variationsStatement of developer contributionsContingencies and other liabilities/assets not recognisedInterests in other entities
Financial result and financial position by fund‘Held for sale’ non-current assets and disposal groupsEvents occurring after the reporting dateDiscontinued operationsIntangible assetsReinstatement, rehabilitation and restoration liabilitiesFair value measurement
Additional council disclosures
Council information and contact details
n/a – not applicable
Retained earnings, revaluation reserves, changes in accounting policies, changes in accounting estimates and errors
27 70
50
68 n/a
52
63
57
68 n/a
59
68 n/a
67
82
69 n/a
69
68 n/a
10262728
78
9(a)9(b)
28
33
38
46
61
53
Page
1
25
19
1516
20
21
49
48
42
43 n/a
18
1213
23
26
Note
22
14
10(a)10(b)
17
6(a)
4
6(c)
9(c)
11
24
2(a)
32(b)
6(b)
5
40
37
3839
45
43 n/a
44
41

Financial Statements 2016_
Mosman Council Notes to the Financial Statements for the year ended 30 June 2016 Note 1. Summary of significant accounting policies
page 10
The principal accounting policies adopted by Council in the preparation of these consolidated financial statements are set out below in order to assist in its general understanding. Under Australian Accounting Standards (AASBs), accounting policies are defined as those specific principles, bases, conventions, rules and practices applied by a reporting entity (in this case Council) in preparing and presenting its financial statements. (a) Basis of preparation (i) Background These financial statements are general purpose financial statements, which have been prepared in accordance with: Australian Accounting Standards and Australian
Accounting Interpretations issued by the Australian Accounting Standards Board,
the Local Government Act (1993) and Regulation,
and the Local Government Code of Accounting
Practice and Financial Reporting. For the purpose of preparing these financial statements, Council has been deemed to be a not-for-profit entity. (ii) Compliance with International Financial Reporting Standards (IFRSs) Because AASBs are sector neutral, some standards either:
(a) have local Australian content and prescription that is specific to the not-for-profit sector (including local government) which are not in compliance with IFRSs, or
(b) specifically exclude application by not-for-profit entities.
Accordingly, in preparing these financial statements and accompanying notes, Council has been unable to comply fully with International Accounting Standards, but has complied fully with Australian Accounting Standards.
Under the Local Government Act (LGA), Regulation and Local Government Code of Accounting Practice and Financial Reporting, it should be noted that Councils in NSW only have a requirement to comply with AASBs. (iii) New and amended standards adopted by Council There have been no new accounting standards adopted in this year’s financial statements which have had any material impact on reported financial position, performance or cash flows. (iv) Early adoption of accounting standards Council has not elected to apply any pronouncements before their operative date in the annual reporting period beginning 1 July 2015, except for AASB2015-7 Amendments to Australian Accounting Standards – Fair Value Disclosures of Not-for-Profit Public Sector Entities, which has reduced the fair value disclosures for Level 3 assets. For summary information relating to the effects of standards with future operative dates refer further to paragraph (y). (v) Basis of accounting These financial statements have been prepared under the historical cost convention except for: (i) certain financial assets and liabilities at fair
value through profit or loss and available-for-sale financial assets, which are all valued at fair value,
(ii) the write down of any asset on the basis of impairment (if warranted), and
(iii) certain classes of non-current assets (eg.
infrastructure, property, plant and equipment and investment property) that are accounted for at fair valuation.
The accrual basis of accounting has also been applied in their preparation. (vi) Changes in accounting policies Council’s accounting policies have been consistently applied to all the years presented, unless otherwise stated.

Financial Statements 2016_
Mosman Council Notes to the Financial Statements for the year ended 30 June 2016 Note 1. Summary of significant accounting policies (continued)
page 11
There have also been no changes in accounting policies when compared with previous financial statements unless otherwise stated [refer Note 20 (d)]. (vii) Critical accounting estimates The preparation of financial statements requires the use of certain critical accounting estimates (in conformity with AASBs). Accordingly this requires management to exercise its judgement in the process of applying the Council's accounting policies. Estimates and judgements are continually evaluated and are based on historical experience and other factors, including expectations of future events that may have a financial impact on Council and that are believed to be reasonable under the circumstances. Critical accounting estimates and assumptions Council makes estimates and assumptions concerning the future. The resulting accounting estimates will, by definition, seldom equal the related actual results. The estimates and assumptions that have a significant risk of causing a material adjustment to the carrying amounts of assets and liabilities within the next financial year are set out below: (i) Estimated fair values of investment properties
(ii) Estimated fair values of infrastructure, property,
plant and equipment,
(iii) Estimated remediation provisions.
Significant judgements in applying Council’s accounting policies include the impairment of receivables – Council has made significant judgements about the impairment of a number of its receivables in Note 7. (b) Revenue recognition Council recognises revenue when the amount of revenue can be reliably measured, it is probable that future economic benefits will flow to it, and specific criteria have been met for each of the Council’s activities as described below.
Council bases any estimates on historical results, taking into consideration the type of customer, the type of transaction and the specifics of each arrangement. Revenue is measured at the fair value of the consideration received or receivable. Revenue is measured on major income categories as follows: Rates, Annual Charges, Grants and Contributions Rates, annual charges, grants and contributions (including developer contributions) are recognised as revenues when the Council obtains control over the assets comprising these receipts. Control over assets acquired from rates and annual charges is obtained at the commencement of the rating year as it is an enforceable debt linked to the rateable property or, where earlier, upon receipt of the rates. A provision for the impairment on rates receivables has not been established as unpaid rates represent a charge against the rateable property that will be recovered when the property is next sold. Control over granted assets/contributed assets is normally obtained upon their receipt (or acquittal) or upon earlier notification that a grant has been secured, and is valued at their fair value at the date of transfer. Revenue from contributions is recognised when the Council either obtains control of the contribution or the right to receive it, (i) it is probable that the economic benefits comprising the contribution will flow to the Council and (ii) the amount of the contribution can be measured reliably. Where grants or contributions recognised as revenues during the financial year were obtained on condition that they be expended in a particular manner or used over a particular period and those conditions were undischarged at balance date, the unused grant or contribution is disclosed in Note 3 (g). Note 3 (g) also discloses the amount of unused grant or contribution from prior years that was expended on Council’s operations during the current year.

Financial Statements 2016_
Mosman Council Notes to the Financial Statements for the year ended 30 June 2016 Note 1. Summary of significant accounting policies (continued)
page 12
The Council has obligations to provide facilities from contribution revenues levied on developers under the provisions of s94 of the EPA Act 1979. Whilst Council generally incorporates these amounts as part of a Development Consents Order, such developer contributions are only recognised as income upon their physical receipt by Council, due to the possibility that individual development consents may not be acted upon by the applicant and accordingly would not be payable to Council. Developer contributions may only be expended for the purposes for which the contributions were required but the Council may apply contributions according to the priorities established in work schedules. A detailed note relating to developer contributions can be found at Note 17. User charges, fees and other Income User charges, fees and other income (including parking fees and fines) are recognised as revenue when the service has been provided, the payment is received, or when the penalty has been applied, whichever first occurs. A provision for the impairment of these receivables is recognised when collection in full is no longer probable. A liability is recognised in respect of revenue that is reciprocal in nature to the extent that the requisite service has not been provided as at balance date. Sale of infrastructure, property, plant and equipment The profit or loss on sale of an asset is determined when control of the asset has irrevocably passed to the buyer. Interest and rents Rental income is accounted for on a straight-line basis over the lease term. Interest income from cash and investments is accounted for using the effective interest rate at the date that interest is earned.
Dividend income Revenue is recognised when the Council’s right to receive the payment is established, which is generally when shareholders approve the dividend. Other Income Other income is recorded when the payment is due, the value of the payment is notified or the payment is received, whichever occurs first. (c) Principles of consolidation These consolidated financial statements include the financial position and performance of controlled entities from the date on which control is obtained until the date that control is lost. (i) The Consolidated Fund In accordance with the provisions of section 409(1) of the LGA 1993, all money and property received by Council is held in the Council’s consolidated fund unless it is required to be held in the Council’s trust fund. The consolidated fund and other entities through which the Council controls resources to carry on its functions have been included in the financial statements forming part of this report. The following entities have been included as part of the consolidated fund: General Purpose Operations Kimbriki (ii) The trust fund In accordance with the provisions of section 411 of the Local Government Act 1993 (as amended), a separate and distinct trust fund is maintained to account for all money and property received by the Council in trust that must be applied only for the purposes of or in accordance with the trusts relating to those monies. Trust monies and property subject to Council’s control have been included in these statements.

Financial Statements 2016_
Mosman Council Notes to the Financial Statements for the year ended 30 June 2016 Note 1. Summary of significant accounting policies (continued)
page 13
Trust monies and property held by Council but not subject to the control of Council have been excluded from these statements. A separate statement of monies held in the trust fund is available for inspection at the Council office by any person free of charge. (iii) Interests in other entities Subsidiaries Council has no interest in any subsidiaries. Joint arrangements Council has no interest in any joint arrangements. Joint ventures Joint ventures represent operational arrangements where the joint control parties have rights to the net assets of the arrangement. Any interests in joint ventures are accounted for using the equity method and are carried at cost. Under the equity method, Council’s share of the operation’s profits/(losses) are recognised in the income statement, and its share of movements in retained earnings and reserves are recognised in the balance sheet. Detailed information relating to Council’s joint ventures can be found at Note 19 (b). Associates Council has no interest in any associates. County councils Council is not a member of any county councils. Unconsolidated structured entities Council has no interest in any unconsolidated structured entities.
(d) Leases All leases entered into by Council are reviewed and classified on inception date as either a finance lease or an operating lease. Finance leases Leases of property, plant and equipment where the Council has substantially all the risks and rewards of ownership are classified as finance leases. Finance leases are capitalised at the lease’s inception at the lower of the fair value of the leased property and the present value of the minimum lease payments. The corresponding rental obligations, net of finance charges, are included in borrowings. Each lease payment is allocated between the liability outstanding and the recognition of a finance charge. The interest element of the finance charge is costed to the income statement over the lease period so as to produce a constant periodic rate of interest on the remaining balance of the liability for each period. Property, plant and equipment acquired under finance leases is depreciated over the shorter of each leased asset’s useful life and the lease term. Operating Leases Leases in which a significant portion of the risks and rewards of ownership are retained by the lessor are classified as operating leases. Payments made under operating leases (net of any incentives received from the lessor) are charged to the income statement on a straight-line basis over the period of the lease. Lease income from operating leases is recognised in income on a straight-line basis over the lease term. (e) Cash and Cash Equivalents For Statement of Cash Flows (and Statement of Financial Position) presentation purposes, cash and cash equivalents includes;

Financial Statements 2016_
Mosman Council Notes to the Financial Statements for the year ended 30 June 2016 Note 1. Summary of significant accounting policies (continued)
page 14
cash on hand, deposits held at call with financial institutions, other short-term, highly liquid investments with
original maturities of three months or less that are readily convertible to known amounts of cash and that are subject to an insignificant risk of changes in value, and
bank overdrafts. Bank overdrafts are shown within borrowings in current liabilities on the balance sheet but are incorporated into cash and cash equivalents for presentation of the Cash Flow Statement. (f) Investments and other financial assets Council (in accordance with AASB 139) classifies each of its investments into one of the following categories for measurement purposes: financial assets at fair value through profit or
loss, loans and receivables, held-to-maturity investments, and available-for-sale financial assets. Each classification depends on the purpose or intention for which the investment was acquired and at the time it was acquired. Management determines each investment classification at the time of initial recognition and re-evaluates this designation at each reporting date. (i) Financial assets at fair value through profit or loss Financial assets at fair value through profit or loss include financial assets that are ‘held for trading’. A financial asset is classified in the ‘held for trading’ category if it is acquired principally for the purpose of selling in the short term. Assets in this category are primarily classified as current assets as they are primarily held for trading and/or are expected to be realised within 12 months of the balance sheet date.
(ii) Loans and receivables Loans and receivables are non-derivative financial assets with fixed or determinable payments that are not quoted in an active market. They arise when the Council provides money, goods or services directly to a debtor with no intention (or in some cases ability) of selling the resulting receivable. They are included in current assets, except for those with maturities greater than 12 months after the balance sheet date, which are classified as non-current assets. (iii) Held-to-maturity investments Held-to-maturity investments are non-derivative financial assets with fixed or determinable payments and fixed maturities that the Council’s management has the positive intention and ability to hold to maturity. In contrast to the ‘loans and receivables’ classification, these investments are generally quoted in an active market. Held-to-maturity financial assets are included in non-current assets, except for those with maturities less than 12 months from the reporting date, which are classified as current assets. (iv) Available-for-sale financial assets Available-for-sale financial assets are non-derivatives that are either designated in this category or not classified in any of the other categories. Investments must be designated as available-for-sale if they do not have fixed maturities and fixed or determinable payments and management intends to hold them for the medium to long term. Accordingly, this classification principally comprises marketable equity securities, but can include all types of financial assets that could otherwise be classified in one of the other investment categories. They are generally included in non-current assets unless management intends to dispose of the investment within 12 months of the balance sheet date or the term to maturity from the reporting date is less than 12 months.

Financial Statements 2016_
Mosman Council Notes to the Financial Statements for the year ended 30 June 2016 Note 1. Summary of significant accounting policies (continued)
page 15
Financial assets – reclassification Council may choose to reclassify a non-derivative trading financial asset out of the held-for-trading category if the financial asset is no longer held for the purpose of selling it in the near term. Financial assets other than loans and receivables are permitted to be reclassified out of the held-for-trading category only in rare circumstances arising from a single event that is unusual and highly unlikely to recur in the near term. Council may also choose to reclassify financial assets that would meet the definition of loans and receivables out of the held-for-trading or available-for-sale categories if it has the intention and ability to hold these financial assets for the foreseeable future or until maturity at the date of reclassification. Reclassifications are made at fair value as of the reclassification date. Fair value becomes the new cost or amortised cost as applicable, and no reversals of fair value gains or losses recorded before reclassification date are subsequently made. Effective interest rates for financial assets reclassified to loans and receivables and held-to-maturity categories are determined at the reclassification date. Further increases in estimates of cash flows adjust effective interest rates prospectively. General accounting and measurement of financial instruments: (i) Initial recognition Investments are initially recognised (and measured) at fair value, plus in the case of investments not at ‘fair value through profit or loss’, directly attributable transactions costs. Purchases and sales of investments are recognised on trade-date – the date on which the Council commits to purchase or sell the asset. Financial assets are derecognised when the rights to receive cash flows from the financial assets have expired or have been transferred and the Council has transferred substantially all the risks and rewards of ownership.
(ii) Subsequent measurement Available-for-sale financial assets and financial assets at fair value through profit and loss are subsequently carried at fair value. Loans and receivables and held-to-maturity investments are carried at amortised cost using the effective interest method. Realised and unrealised gains and losses arising from changes in the fair value of the financial assets classified as ‘fair value through profit or loss’ category are included in the income statement in the period in which they arise. Unrealised gains and losses arising from changes in the fair value of non-monetary securities classified as ‘available-for-sale’ are recognised in equity in the available-for-sale investments revaluation reserve. When securities classified as ‘available-for-sale’ are sold or impaired, the accumulated fair value adjustments are included in the income statement as gains and losses from investment securities. Impairment Council assesses at each balance date whether there is objective evidence that a financial asset or group of financial assets is impaired. A financial asset or a group of financial assets is impaired and impairment losses are incurred only if there is objective evidence of impairment as a result of one or more events that occurred after the initial recognition of the asset (a ‘loss event’) and that loss event (or events) has an impact on the estimated future cash flows of the financial asset or group of financial assets that can be reliably estimated. In the case of equity securities classified as available-for-sale, a significant or prolonged decline in the fair value of a security below its cost is considered in determining whether the security is impaired. If any such evidence exists for available-for-sale financial assets, the cumulative loss – measured as the difference between the acquisition cost and the current fair value, less any impairment loss on that financial asset previously recognised in profit and loss – is removed from equity and recognised in the income statement.

Financial Statements 2016_
Mosman Council Notes to the Financial Statements for the year ended 30 June 2016 Note 1. Summary of significant accounting policies (continued)
page 16
Impairment losses recognised in the income statement on equity instruments are not reversed through the income statement. (iii) Types of investments Council has an approved Investment Policy in order to invest in accordance with (and to comply with) section 625 of the Local Government Act and s212 of the LG (General) Regulation 2005. Investments are placed and managed in accordance with the policy and having particular regard to authorised investments prescribed under the Ministerial Local Government Investment Order. Council maintains its Investment Policy in compliance with the Act and ensures that it or its representatives exercise care, diligence and skill that a prudent person would exercise in investing Council funds. Council amended its policy following revisions to the Ministerial Local Government Investment Order arising from the Cole Inquiry recommendations. Certain investments that Council holds are no longer prescribed (eg. managed funds, CDOs, and equity linked notes), however they have been retained under grandfathering provisions of the Order. These will be disposed of when most financially advantageous to Council. (g) Fair value estimation – financial instruments The fair value of financial assets and financial liabilities must be estimated for recognition and measurement or for disclosure purposes. The fair value of financial instruments traded in active markets is based on quoted market prices at the balance sheet date. The fair value of financial instruments that are not traded in an active market is determined using valuation techniques. Council uses a variety of methods and makes assumptions that are based on market conditions existing at each balance date.
Quoted market prices or dealer quotes for similar instruments are used for long-term debt instruments held. If the market for a financial asset is not active (and for unlisted securities), the Council establishes fair value by using valuation techniques. These include reference to the fair values of recent arm’s length transactions, involving the same instruments or other instruments that are substantially the same, discounted cash flow analysis, and option pricing models refined to reflect the issuer’s specific circumstances. The nominal value less estimated credit adjustments of trade receivables and payables are assumed to approximate their fair values. The fair value of financial liabilities for disclosure purposes is estimated by discounting the future contractual cash flows at the current market interest rate that is available to the Council for similar financial instruments. (h) Receivables Receivables are initially recognised at fair value and subsequently measured at amortised cost, less any provision for impairment. Receivables (excluding rates and annual charges) are generally due for settlement no more than 30 days from the date of recognition. The collectibility of receivables is reviewed on an ongoing basis. Debts that are known to be uncollectible are written off in accordance with Council’s policy. A provision for impairment (i.e. an allowance account) relating to receivables is established when objective evidence shows that Council will not be able to collect all amounts due according to the original terms of each receivable. The amount of the provision is the difference between the asset’s carrying amount and the present value of estimated future cash flows, discounted at the effective interest rate.

Financial Statements 2016_
Mosman Council Notes to the Financial Statements for the year ended 30 June 2016 Note 1. Summary of significant accounting policies (continued)
page 17
Impairment losses are recognised in the Income Statement within other expenses. When a receivable for which an impairment allowance had been recognised becomes uncollectible in a subsequent period, it is written off against the allowance account. Subsequent recoveries of amounts previously written off are credited against other expenses in the Income Statement. (i) Inventories Raw materials and stores, work in progress and finished goods Raw materials and stores, work in progress and finished goods in respect of business undertakings are all stated at the lower of cost and net realisable value. Cost comprises direct materials, direct labour and an appropriate proportion of variable and fixed overhead expenditure, the latter being allocated on the basis of normal operating capacity. Costs are assigned to individual items of inventory on the basis of weighted average costs. Net realisable value is the estimated selling price in the ordinary course of business less the estimated costs of completion and the estimated costs necessary to make the sale. Inventories held in respect of non-business undertakings have been valued at cost subject to adjustment for loss of service potential. (j) Infrastructure, property, plant and equipment (I,PP&E) Acquisition of assets Council’s non-current assets are continually revalued (over a 5-year period) in accordance with the fair valuation policy as mandated by the Office of Local Government.
At balance date, the following classes of I,PP&E were stated at their fair value: - Investment Properties – refer Note 1(o)
- Operational Land (External Valuation)
- Buildings – Specialised/Non Specialised
(External Valuation)
- Plant and Equipment (as approximated by depreciated historical cost)
- Roads Assets incl. roads, bridges and footpaths (Internal Valuation)
- Drainage Assets (External Valuation) - Community Land (External Valuation and where
appropriate internal)
- Land Improvements (Internal Valuation)
- Other Structures (External Valuations)
- Other Assets (as approximated by depreciated historical cost)
Initial recognition On initial recognition, an asset’s cost is measured at its fair value, plus all expenditure that is directly attributable to the acquisition. Where settlement of any part of an asset’s cash consideration is deferred, the amounts payable in the future are discounted to their present value as at the date of recognition (i.e. date of exchange) of the asset to arrive at fair value. The discount rate used is the Council’s incremental borrowing rate, being the rate at which a similar borrowing could be obtained from an independent financier under comparable terms and conditions. Where infrastructure, property, plant and equipment assets are acquired for no cost or for an amount other than cost, the assets are recognised in the financial statements at their fair value at acquisition date – being the amount that the asset could have been exchanged between knowledgeable willing parties in an arm’s length transaction.

Financial Statements 2016_
Mosman Council Notes to the Financial Statements for the year ended 30 June 2016 Note 1. Summary of significant accounting policies (continued)
page 18
Subsequent costs Subsequent costs are included in the asset’s carrying amount or recognised as a separate asset, as appropriate, only when it is probable that future economic benefits associated with the item will flow to Council and the cost of the item can be measured reliably. All other repairs and maintenance are charged to the income statement during the financial period in which they are incurred. Asset revaluations (including indexation) In accounting for asset revaluations relating to infrastructure, property, plant and equipment: increases in the combined carrying amounts of
asset classes arising on revaluation are credited to the asset revaluation reserve,
to the extent that a net asset class increase
reverses a decrease previously recognised via the profit or loss, then increase is first recognised in profit or loss,
net decreases that reverse previous increases of
the same asset class are first charged against revaluation reserves directly in equity to the extent of the remaining reserve attributable to the asset, with all other decreases charged to the Income Statement.
For all other assets, Council assesses at each reporting date whether there is any indication that a revalued asset’s carrying amount may differ materially from that which would be determined if the asset were revalued at the reporting date. If any such indication exists, Council determines the asset’s fair value and revalues the asset to that amount. Full revaluations are undertaken for all assets on a 5-year cycle. Capitalisation thresholds Items of infrastructure, property, plant and equipment are not capitalised unless their cost of acquisition exceeds the following;
Land - council land 100% Capitalised - open space 100% Capitalised - land under roads (purchases after 30/6/08) 100% Capitalised Plant and Equipment Office Furniture > $1,000 Office Equipment > $1,000 Other Plant and Equipment > $1,000 Buildings and Land Improvements Park Furniture and Equipment > $5,000 Building - construction/extensions 100% Capitalised - renovations > $5,000 Other Structures > $5,000 Stormwater Assets Drains and Culverts > $5,000 Other > $5,000 Transport Assets Road construction and reconstruction > $5,000 Reseal/Re-sheet and major repairs > $5,000 Other Infrastructure Assets Swimming Pools > $10,000 Other Open Space/Recreational Assets > $10,000 Other Infrastructure > $10,000 Depreciation Depreciation on Council's infrastructure, property, plant and equipment assets is calculated using the straight-line method in order to allocate an asset’s cost (net of residual values) over its estimated useful life. Land is not depreciated. Estimated useful lives for Council's I,PP&E include: Plant and Equipment - Office Equipment 5 to 10 years - Office furniture 5 to 10 years - Computer Equipment 4 years - Other plant and equipment 5 to 10 years

Financial Statements 2016_
Mosman Council Notes to the Financial Statements for the year ended 30 June 2016 Note 1. Summary of significant accounting policies (continued)
page 19
Other Equipment - Playground equipment 5 to 15 years - Benches, seats etc 10 to 20 years Buildings - Buildings 50 to 100 years Stormwater Drainage - Drainage Infrastructure 125years Transportation Assets - Sealed Roads: Surface 50 years - Sealed Roads: Structure 100 years - Unsealed roads 100 years - Road Pavements 100 years - Kerb, Gutter and Paths 95 to 100 years Other Infrastructure Assets - Other Open Space/ Recreational Assets 10 to 40 years - Retaining Walls 150 years All asset residual values and useful lives are reviewed and adjusted (if appropriate) at each reporting date. An asset’s carrying amount is written down immediately to its recoverable amount if the asset’s carrying amount is greater than its estimated recoverable amount – refer Note 1 (s) on asset impairment. Disposal and derecognition An item of property, plant and equipment is derecognised upon disposal or when no further future economic benefits are expected from its use or disposal. Any gain or loss arising on derecognition of the asset (calculated as the difference between the net disposal proceeds and the carrying amount of the asset) is included in Council’s Income Statement in the year the asset is derecognised. (k) Land Land (other than land under roads) is in accordance with Part 2 of Chapter 6 of the Local Government
Act (1993) classified as either operational or community. This classification of land is disclosed in Note 9 (a). (l) Land under roads Land under roads is land under roadways and road reserves, including land under footpaths, nature strips and median strips. Council has elected not to recognise land under roads acquired before 1 July 2008 in accordance with AASB 1051. Land under roads acquired after 1 July 2008 is recognised in accordance with AASB 116 – Property, Plant and Equipment. (m) Intangible assets Council's interest in Kimbriki Waste Services Access rights is recognised as an Intangible Asset and will be amortised over the 25 year expected life of the Asset. (n) Crown reserves Crown reserves under Council’s care and control are recognised as assets of the Council. While ownership of the reserves remains with the Crown, Council retains operational control of the reserves and is responsible for their maintenance and use in accordance with the specific purposes to which the reserves are dedicated. Improvements on Crown reserves are also recorded as assets, while maintenance costs incurred by Council and revenues relating to the reserves are recognised within Council’s Income Statement. Representations are currently being sought across state and local government to develop a consistent accounting treatment for Crown Reserves across both tiers of government.

Financial Statements 2016_
Mosman Council Notes to the Financial Statements for the year ended 30 June 2016 Note 1. Summary of significant accounting policies (continued)
page 20
(o) Investment property Investment property comprises land and/or buildings that are principally held for long-term rental yields, capital gains or both, that is not occupied by Council. Investment property is carried at fair value, representing an open-market value determined annually by external valuers. Annual changes in the fair value of investment properties are recorded in the Income Statement as part of ‘other income’. Full revaluations are carried out every year. (p) Impairment of assets All Council's I,PP&E is subject to an annual assessment of impairment. Assets that are subject to amortisation are reviewed for impairment whenever events or changes in circumstances indicate that the carrying amount may not be recoverable. An impairment loss is recognised for the amount by which the asset’s carrying amount exceeds its recoverable amount. The recoverable amount is the higher of an asset’s fair value less costs to sell and value in use. Where an asset is not held principally for cash- generating purposes (for example infrastructure assets) and would be replaced if the Council was deprived of it, then depreciated replacement cost is used as value in use, otherwise value in use is estimated by using a discounted cash flow model. Non-financial assets (other than goodwill) that suffered a prior period impairment are reviewed for possible reversal of the impairment at each reporting date. Goodwill and other intangible assets that have an indefinite useful life and are not subject to amortisation are tested annually for impairment.
(q) Payables These amounts represent liabilities and include goods and services provided to the Council prior to the end of financial year that are unpaid. The amounts for goods and services are unsecured and are usually paid within 30 days of recognition. (r) Borrowings Borrowings are initially recognised at fair value, net of transaction costs incurred. Borrowings are subsequently measured at amortised cost. Amortisation results in any difference between the proceeds (net of transaction costs) and the redemption amount being recognised in the Income Statement over the period of the borrowings using the effective interest method. Borrowings are removed from the balance sheet when the obligation specified in the contract is discharged, cancelled or expired. Borrowings are classified as current liabilities unless the Council has an unconditional right to defer settlement of the liability for at least 12 months after the balance sheet date. (s) Borrowing costs Borrowing costs are expensed (t) Provisions Provisions for legal claims, service warranties and other like liabilities are recognised when: Council has a present legal or constructive
obligation as a result of past events, it is more likely than not that an outflow of
resources will be required to settle the obligation, and
the amount has been reliably estimated.

Financial Statements 2016_
Mosman Council Notes to the Financial Statements for the year ended 30 June 2016 Note 1. Summary of significant accounting policies (continued)
page 21
Provisions are not recognised for future operating losses. Where there are a number of similar obligations, the likelihood that an outflow will be required in settlement is determined by considering the class of obligations as a whole. A provision is recognised even if the likelihood of an outflow with respect to any one item included in the same class of obligations may be small. Provisions are measured at the present value of management’s best estimate of the expenditure required to settle the present obligation at the reporting date. The discount rate used to determine the present value reflects current market assessments of the time value of money and the risks specific to the liability. The increase in the provision due to the passage of time is recognised as interest expense. (u) Employee benefits (i) Short-term obligations Short-term employee benefit obligations include liabilities for wages and salaries (including non-monetary benefits), annual leave and vesting sick leave expected to be wholly settled within the 12 months after the reporting period. Leave liabilities are recognised in the provision for employee benefits in respect of employees’ services up to the reporting date with other short term employee benefit obligations disclosed under payables. These provisions are measured at the amounts expected to be paid when the liabilities are settled. All other short-term employee benefit obligations are presented as payables. Liabilities for non-vesting sick leave are recognised at the time when the leave is taken and measured at the rates paid or payable, and accordingly no Liability has been recognised in these reports.
Wages and salaries, annual leave and vesting sick leave are all classified as current liabilities. (ii) Other long-term obligations The liability for all long service and annual leave in respect of services provided by employees up to the reporting date (which is not expected to be wholly settled within the 12 months after the reporting period) are recognised in the provision for employee benefits. These liabilities are measured at the present value of the expected future payments to be made using the projected unit credit method. Consideration is given to expected future wage and salary levels, experience of employee departures and periods of service. Expected future payments are then discounted using market yields at the reporting date based on national government bonds with terms to maturity and currency that match as closely as possible the estimated future cash outflows. Due to the nature of when and how long service leave can be taken, all long service leave for employees with 4 or more years of service has been classified as current, as it has been deemed that Council does not have the unconditional right to defer settlement beyond 12 months – even though it is not anticipated that all employees with more than 4 years service (as at reporting date) will apply for and take their leave entitlements in the next 12 months. (iii) Retirement benefit obligations All employees of the Council are entitled to benefits on retirement, disability or death. Council contributes to various defined benefit plans and defined contribution plans on behalf of its employees. Defined benefit plans A liability or asset in respect of defined benefit superannuation plans would ordinarily be recognised in the balance sheet, and measured as the present value of the defined benefit obligation at the reporting date plus unrecognised actuarial gains (less unrecognised actuarial losses) less the fair value of

Financial Statements 2016_
Mosman Council Notes to the Financial Statements for the year ended 30 June 2016 Note 1. Summary of significant accounting policies (continued)
page 22
the superannuation fund’s assets at that date and any unrecognised past service cost. The present value of the defined benefit obligation is based on expected future payments which arise from membership of the fund to the reporting date, calculated annually by independent actuaries using the projected unit credit method. Consideration is given to expected future wage and salary levels, experience of employee departures and periods of service. However, when this information is not reliably available, Council can account for its obligations to defined benefit plans on the same basis as its obligations to defined contribution plans – i.e. as an expense when they become payable. Council is party to an Industry Defined Benefit Plan under the Local Government Superannuation Scheme, named the ‘Local Government Superannuation Scheme – Pool B’. This scheme has been deemed to be a ‘multi-employer fund’ for the purposes of AASB 119. Sufficient information is not available to account for the Scheme as a defined benefit plan (in accordance with AASB 119) because the assets to the scheme are pooled together for all Councils. The last valuation of the scheme was performed by Richard Boyfield on 24 February 2016 and covers the period ended 30 June 2015. However the position is monitored annually and the actuary has estimated that as at 30 June 2016 the prior period deficit still exists. Effective from 1 July 2009, employers are required to contribute additional contributions to assist in extinguishing this deficit. The amount of employer contributions to the defined benefit section of the Local Government Superannuation Scheme and recognised as an expense and disclosed as part of superannuation expenses at Note 4 (a) for the year ending 30 June 2016 was $308,199. The amount of additional contributions included in the total employer contribution advised above is $313,151.
The share of this deficit that can be broadly attributed to Council is estimated to be in the order of $225,157 as at 30 June 2016. Council’s share of that deficiency cannot be accurately calculated as the scheme is a mutual arrangement where assets and liabilities are pooled together for all member councils. For this reason, no liability for the deficiency has been recognised in these financial statements. Council has, however, disclosed a contingent liability in Note 18 to reflect the possible obligation that may arise should the scheme require immediate payment to correct the deficiency. Defined contribution plans Contributions to defined contribution plans are recognised as an expense as they become payable. Prepaid contributions are recognised as an asset to the extent that a cash refund or a reduction in the future payments is available. (iv) Employee benefit on-costs Council has recognised at year end the aggregate on-cost liabilities arising from employee benefits, and in particular those on-cost liabilities that will arise when payment of current employee benefits is made in future periods. These amounts include superannuation and workers compensation expenses which will be payable upon the future payment of certain leave liabilities accrued as at 30/06/16. (v) Self-insurance Council does not self-insure. (w) Allocation between current and non-current assets and liabilities In the determination of whether an asset or liability is classified as current or non-current, consideration is given to the time when each asset or liability is expected to be settled.

Financial Statements 2016_
Mosman Council Notes to the Financial Statements for the year ended 30 June 2016 Note 1. Summary of significant accounting policies (continued)
page 23
The asset or liability is classified as current if it is expected to be settled within the next 12 months, being the Council’s operational cycle. Exceptions In the case of liabilities where Council does not have the unconditional right to defer settlement beyond 12 months (such as vested long service leave), the liability is classified as current even if it is not expected to be settled within the next 12 months. In the case of inventories that are ‘held for trading’, these are also classified as current even if not expected to be realised in the next 12 months. (x) Taxes The Council is exempt from both Commonwealth Income Tax and Capital Gains Tax. Council does, however, have to comply with both Fringe Benefits Tax and Goods and Services Tax (GST). Goods and Services Tax (GST) Income, expenses and assets are all recognised net of the amount of GST, except where the amount of GST incurred is not recoverable from the Australian Tax Office (ATO). In these circumstances the GST is recognised as part of the cost of acquisition of the asset or as part of the revenue / expense. Receivables and payables within the Balance Sheet are stated inclusive of any applicable GST. The net amount of GST recoverable from or payable to the ATO is included as a current asset or current liability in the Balance Sheet. Operating cash flows within the Cash Flow Statement are on a gross basis, i.e. they are inclusive of GST where applicable. Investing and financing cash flows are treated on a net basis (where recoverable from the ATO), i.e. they are exclusive of GST. Instead, the GST component of investing and financing activity cash
flows that are recoverable from or payable to the ATO are classified as operating cash flows. Commitments and contingencies are disclosed net of the amount of GST recoverable from (or payable to) the ATO. (y) New accounting standards and Interpretations issued (not yet effective) Certain new (or amended) accounting standards and interpretations have been published that are not mandatory for reporting periods ending 30 June 2016. Council has not adopted any of these standards early. Apart from the AASB disclosures below, there are no other standards that are ‘not yet effective’ that are expected to have a material impact on Council in the current or future reporting periods and on foreseeable future transactions. Council’s assessment of the impact of upcoming new standards and interpretations that are likely to have an effect are set out below. AASB 9 – Financial Instruments AASB 9 replaces AASB 139 Financial Instruments: Recognition and Measurement and has an effective date for reporting periods beginning on or after 1 January 2018 (and must be applied retrospectively). The overriding impact of AASB 9 is to change the requirements for the classification, measurement and disclosures associated with financial assets and financial liabilities. These requirements are designed to improve and simplify the approach for classification and measurement of financial assets compared with the requirements of AASB 139. Under the new requirements the four current categories of financial assets stipulated in AASB 139 will be replaced with two measurement categories: fair value, and

Financial Statements 2016_
Mosman Council Notes to the Financial Statements for the year ended 30 June 2016 Note 1. Summary of significant accounting policies (continued)
page 24
amortised cost (where financial assets will only be able to be measured at amortised cost when very specific conditions are met).
Council is yet to undertake a detailed assessment of the impact of AASB 9. AASB 15 – Revenue from Contracts with Customers and associated amending standards AASB 15 will replace AASB 118 which covers contracts for goods and services and AASB 111 which covers construction contracts. AASB 15 will introduce a 5-step process for revenue recognition with the core principle of the new standard being that entities recognise revenue so as to depict the transfer of goods or services to customers in amounts that reflect the consideration (that is, payment) to which the entity expects to be entitled in exchange for those goods or services. The changes in revenue recognition requirements in AASB 15 may cause changes to accounting policies relating to the timing and amount of revenue recorded in the financial statements, as well as additional disclosures. The effective date of this standard is for annual reporting periods beginning on or after 1 January 2018. Council is yet to undertake a detailed assessment of the impact of AASB 15. AASB ED 260 Income of Not-for-Profit Entities The AASB previously issued exposure draft AASB ED 260 on Income of Not-for-Profit Entities in April 2015. The exposure draft proposed specific not-for-profit entity requirements and guidance when applying the principles of AASB 15 to income from certain transactions. Much of the material in AASB 1004 is expected to be replaced by material included in AASB ED 260. Specific revenue items that may considerably change are Grants and Contributions. The most likely financial statement impact is the deferred recognition of Grants and Contributions (i.e.
recognition as unearned revenue [liability]) until Council has met the associated performance obligation/s relating to the Grants or Contribution. At this stage there is no specific date of release for a standard or a date of applicability. AASB16 – Leases AASB 116 Leases replaces AASB 117 Leases and some associated lease-related Interpretations. AASB 16 introduces a single lease accounting model (for lessees) that will require all leases to be accounted for on the balance sheet (ie. recognition of both a right-of-use asset and a corresponding lease) for all leases with a term of more than 12 months unless the underlying assets are determined to be of ‘low value’. There will also be detailed disclosure requirements for all lessees. The effective date of this standard is for annual reporting periods beginning on or after 1 January 2019. Council is yet to undertake a detailed assessment of the accounting impacts from AASB 16. However, based on preliminary assessments, impacts from the first time adoption of the standard are likely to include:
- a significant increase in lease assets and financial liabilities recognised on the balance sheet,
- a reduction in reported equity as the carrying amount of lease assets will reduce more quickly than the carrying amount of lease liabilities,
- lower operating cash outflows and higher financing cash flows in the statement of cash flows as principal repayments on all lease liabilities will now be included in financing activities rather than operating activities.
AASB2015-6 – Amendments to Australian Accounting Standards – Extending Related Party Disclosures to Not-for-Profit Public Sector Entities From 1 July 2016, AASB 124 Related Party Disclosures will apply to Council.

Financial Statements 2016_
Mosman Council Notes to the Financial Statements for the year ended 30 June 2016 Note 1. Summary of significant accounting policies (continued)
page 25
This means that Council will be required to disclose information about related parties and Council transactions with those related parties. Related parties will more than likely include the Mayor, Councillors and certain Council staff. In addition, the close family members of those people and any organisations that they control or are associated with will be classified as related parties (and fall under the related party reporting requirements). AASB 2014 – 3 Amendments to Australian Accounting Standards – Accounting for Acquisitions of Interests in Joint Operations [AASB 1 and AASB 11] This Standard amends AASB 11 to provide guidance on the accounting for acquisitions of interests in joint operations in which the activity constitutes a business. The amendments require: (a) the acquirer of an interest in a joint operation in
which the activity constitutes a business, as defined in AASB 3 Business Combinations, to apply all of the principles on business combinations accounting in AASB 3 and other Australian Accounting Standards except for those principles that conflict with the guidance in AASB 11, and
(b) the acquirer to disclose the information required by AASB 3 and other Australian Accounting Standards for business combinations.
The effective date of this standard is for annual reporting periods beginning on or after 1 January 2016. If a joint operation is acquired during the reporting period, then this standard clarifies the accounting for the acquisition to be in accordance with AASB 3, i.e. assets and liabilities acquired to be measured at fair value. (z) Rounding of amounts Unless otherwise indicated, amounts in the financial statements have been rounded off to the nearest thousand dollars.
(aa) Comparative figures To ensure comparability with the current reporting period’s figures, some comparative period line items and amounts may have been reclassified or individually reported for the first time within these financial statements and/or the notes. (ab) Disclaimer Nothing contained within these statements may be taken to be an admission of any liability to any person under any circumstance.

Financial Statements 2016
page 26
Mosman Council
Notes to the Financial Statements for the year ended 30 June 2016
Note 2(a). Council functions/activities – financial information
1. Includes: rates and annual charges (incl. ex-gratia), untied general purpose grants and unrestricted interest and investment income. Explanations of variances greater than 10%:2. Actual income includes art donations of $238k.3. Actual Income Includes S94 contributions $400k greater than budgeted. Expenses include revaluation decrements to Community Land (ref Note 4 E)4. 2016 Income has unbudgeted return on Joint Ventures (Note 19) 2015 Actual income includes revaluation increment to Investment Property (N14) 2016 Actual Expenses includes decrement to Investment Property (N14)* The activities "Governance" and "Corporate and risk" are aggregated in Council's strategic plan (MOSPLAN) as "Governance and risk".
211,996 Community spaces 3 5,563 6,102 7,981 7,242 8,770 7,475 (1,679) (2,668)
82 96 7,326 7,377 Library and information 179 176 182 2,190 2,179 2,120 (2,011) (2,003)
522 512 183,577 181,711 Arts and culture 2 560 883 645 1,605 1,550 1,244 (1,045) (667) (599) 343 75 5,253 4,441 Built environment 3,096 3,246 2,073 7,429 7,969 6,877 (4,333) (4,723)
65 60 58,964
27 53 215,487
58,940 Healthy environment 6,563 6,507 6,344 5,355 4,945 5,153 1,208 1,562 1,191 134 112 726 690 Transport and traffic 6,233 6,612 5,863 2,146 2,029 1,565 4,087 4,583
20 Leadership and engagement – – 69 2,478 2,573 2,585 (2,478) (2,573) Corporate and risk *4 695 960 1,591 9,429 13,307 8,591 (8,734) (12,347)
2016Actual
2015Actual
2015 2016
$ ’000 Income, expenses and assets have been directly attributed to the following functions/activities.Details of these functions/activities are provided in Note 2(b).
Income from continuing operations
Expenses from continuing operations
Total assets held (current &
non-current) Functions/activities
20162015Actual Actual Actual
Grants included in income from continuing operations
Operating result from continuing operations
Originalbudget
OriginalActual
2016 20152016(1,770)
(1,067) (1,242)
2016Actual
Originalbudget
2016Actualbudget
1,784 1,851 – –
2,857 1,597
2,901 1,773 1,770 –
1,790 3,026 Governance Community wellbeing
Actual2016
705 2015
888 – (1,597)
(1,050) (1,773)
Actual
868 – 270
4,437 4,275
–
(21,659)
(7,000) (2,516) 4,298
(4,804)
(1,938)
506
40,064
– –
40,064
150
2,061 (13,526)
5,216
(17,997)
1,877
– 167
(1,484)
18,592 19,874 20,008
1,956 489,679 497,870
– 180 21,380 19,959 – – 15
490,471
898 –
498,768
–
2,870
792 910
2,971
– 914
47,996 42,670 45,280
– 150 – 167
– –
26,538 42,670 47,996
18,592
26,337 Share of gains/(losses) in associates
General purpose income 1
continuing operations
20,008 and joint ventures (using the equity method)
Operating result from
–
24,673 Total functions and activities
19,874
46,512 44,547
Financial Statements 2016
page 27
Mosman Council
Notes to the Financial Statements for the year ended 30 June 2016
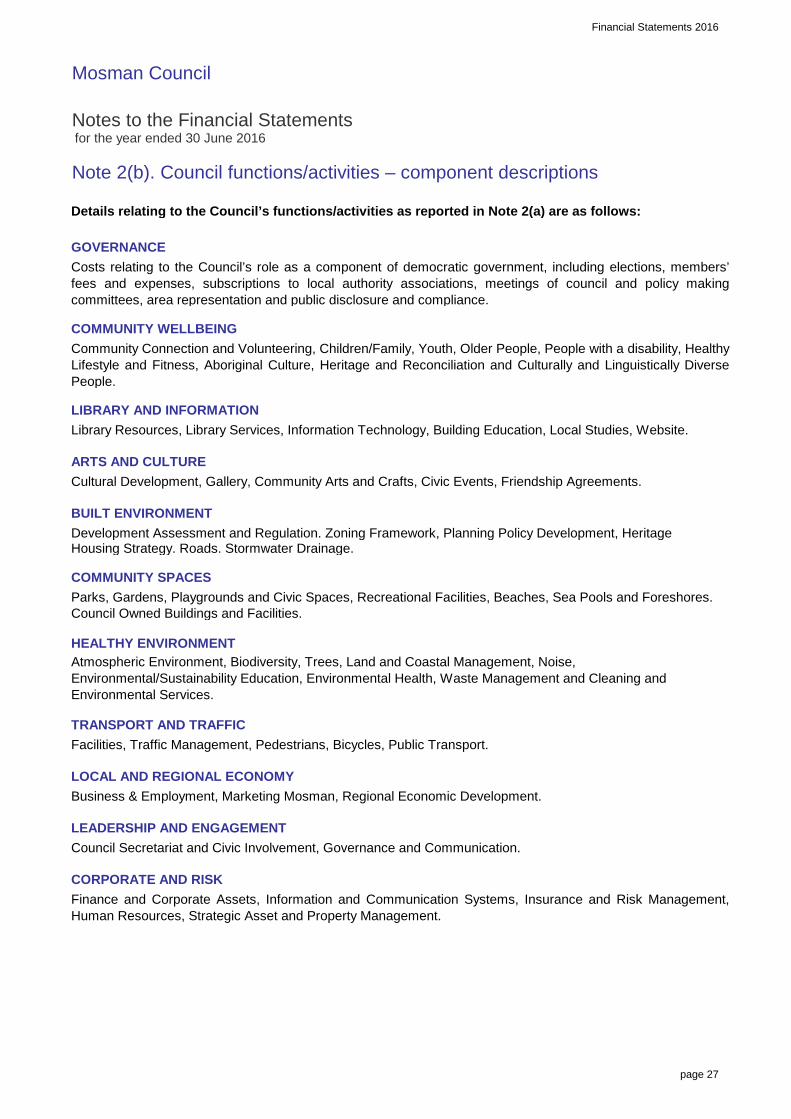
Note 2(b). Council functions/activities – component descriptions
Details relating to the Council’s functions/activities as reported in Note 2(a) are as follows:
GOVERNANCE
COMMUNITY WELLBEING
LIBRARY AND INFORMATION
ARTS AND CULTURE
BUILT ENVIRONMENT
COMMUNITY SPACES
Council Owned Buildings and Facilities.
HEALTHY ENVIRONMENT
TRANSPORT AND TRAFFIC
LOCAL AND REGIONAL ECONOMY
LEADERSHIP AND ENGAGEMENT
CORPORATE AND RISK
Costs relating to the Council’s role as a component of democratic government, including elections, members’fees and expenses, subscriptions to local authority associations, meetings of council and policy makingcommittees, area representation and public disclosure and compliance.
Community Connection and Volunteering, Children/Family, Youth, Older People, People with a disability, HealthyLifestyle and Fitness, Aboriginal Culture, Heritage and Reconciliation and Culturally and Linguistically DiversePeople.
Library Resources, Library Services, Information Technology, Building Education, Local Studies, Website.
Cultural Development, Gallery, Community Arts and Crafts, Civic Events, Friendship Agreements.
Development Assessment and Regulation. Zoning Framework, Planning Policy Development, Heritage Housing Strategy. Roads. Stormwater Drainage.
Parks, Gardens, Playgrounds and Civic Spaces, Recreational Facilities, Beaches, Sea Pools and Foreshores.
Atmospheric Environment, Biodiversity, Trees, Land and Coastal Management, Noise, Environmental/Sustainability Education, Environmental Health, Waste Management and Cleaning and Environmental Services.
Facilities, Traffic Management, Pedestrians, Bicycles, Public Transport.
Business & Employment, Marketing Mosman, Regional Economic Development.
Council Secretariat and Civic Involvement, Governance and Communication.
Finance and Corporate Assets, Information and Communication Systems, Insurance and Risk Management,Human Resources, Strategic Asset and Property Management.
Financial Statements 2016
page 28
Mosman Council
Notes to the Financial Statements for the year ended 30 June 2016
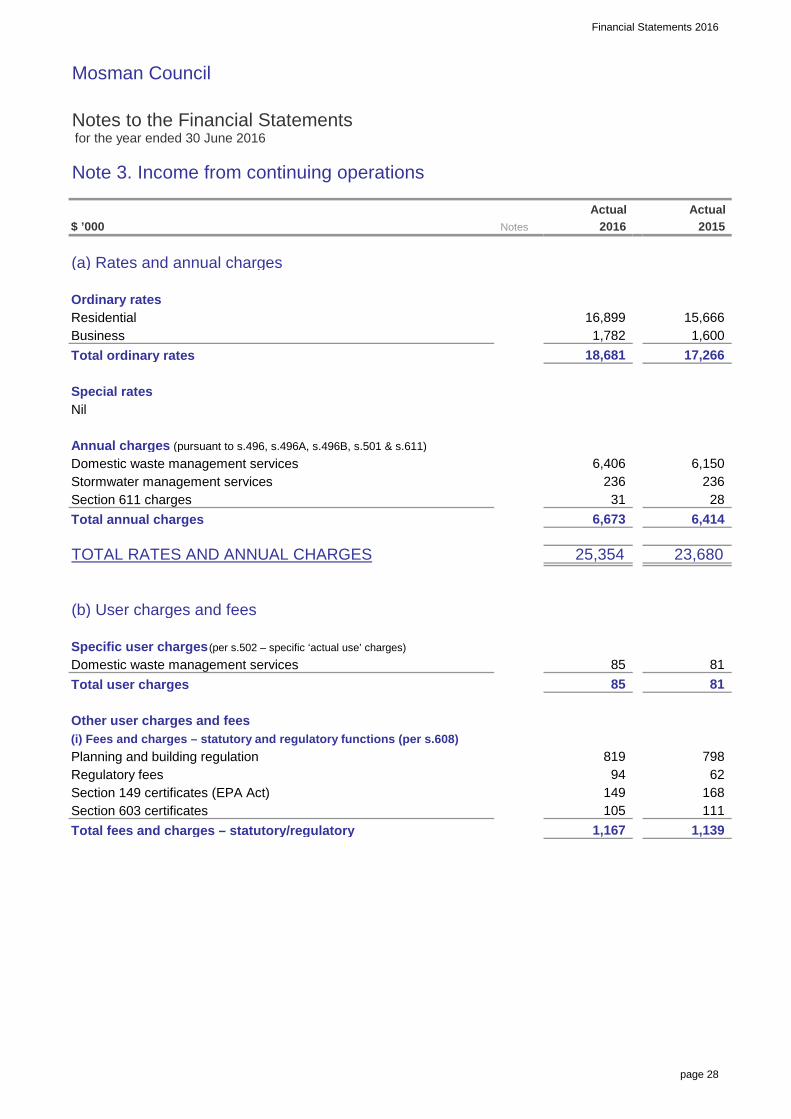
Note 3. Income from continuing operations
$ ’000
(a) Rates and annual charges
Ordinary ratesResidentialBusinessTotal ordinary rates
Special ratesNil
Annual charges (pursuant to s.496, s.496A, s.496B, s.501 & s.611)Domestic waste management servicesStormwater management servicesSection 611 chargesTotal annual charges
TOTAL RATES AND ANNUAL CHARGES
(b) User charges and fees
Specific user charges (per s.502 – specific ‘actual use’ charges)
Domestic waste management servicesTotal user charges
Other user charges and fees(i) Fees and charges – statutory and regulatory functions (per s.608)Planning and building regulationRegulatory feesSection 149 certificates (EPA Act)Section 603 certificatesTotal fees and charges – statutory/regulatory
85
819
105
94
85
18,681
25,354
6,406 6,150
31 6,673
236
6,414
23,680
81
798
Actual
16,899 1,782
Actual
17,266
15,666 1,600
Notes 2016
81
28
2015
236
1,139
149 62
168 111
1,167

Financial Statements 2016
page 29
Mosman Council
Notes to the Financial Statements for the year ended 30 June 2016
Note 3. Income from continuing operations (continued)
$ ’000
(b) User charges and fees (continued)
(ii) Fees and charges – other (incl. general user charges (per s.608))Advertising-bridgepoint bridgeArt prize feesChildren’s leisure and learningCommunity restaurantCultural centreDinghy storage racksFilming permitsFootpath occupationHoarding feesKidzone – vacationLease rentals (property)Leaseback fees – Council vehiclesMarket days (stall holders)Meals on wheelsMerchant fee recoveryMini skipsMosman Occasional Child CareOut of school careOval rentsParking fees – foreshoreParking fees – foreshore (stickers)Parking fees – on streetParking fees – resident parking scheme permitsPhotocopying – civic centrePhotocopying – libraryReserve rentsRestoration chargesSection 153 land leasesStand plant permitsVacation careVehicular crossingVehicular crossing – inspection feesWork zone feesOtherTotal fees and charges – other
TOTAL USER CHARGES AND FEES
2015
9,503 339
81
53
Actual
4
439
8
2016
290 347
10,023 10,755
1
Actual Notes
292 483
45 39
379 204 245
1,277
48
33
111 72
2,221
9
85
82 110 88
284 287 398
71
1,249
8,803
342
51 32
64
113
8
148
208
2,267
439
148 189 52 35
38 9 124 91
261 1,374
92
13 9
217 220
1,414
46 51
30 32
197
281
21
7 7 2

Financial Statements 2016
page 30
Mosman Council
Notes to the Financial Statements for the year ended 30 June 2016
Note 3. Income from continuing operations (continued)
$ ’000
(c) Interest and investment revenue (including losses)
Interest – Interest on overdue rates and annual charges (incl. special purpose rates) – Interest earned on investments (interest and coupon payment income)TOTAL INTEREST AND INVESTMENT REVENUE
Interest revenue is attributable to:Unrestricted investments/financial assets:Overdue rates and annual charges (general fund)General Council cash and investmentsRestricted investments/funds – external:Development contributions – Section 94Total interest and investment revenue recognised
(d) Other revenues
Fair value increments – investment propertiesRental income – investment propertiesFinesCommissions and agency feesLegal RecoupmentWorkers Compensation Insurance incentivesArt Gallery Sponsorhip and DonationsOtherTOTAL OTHER REVENUE
526
10
–
22
4,871 116
14
365 52
503
Actual
503
14 1,913
364
526
48
91 109
52
Notes
1,800 1,998
179
2,129
6,115 174
48
2015Actual
48
455
2,583
– 14
– –
2016
474

Financial Statements 2016
page 31
Mosman Council
Notes to the Financial Statements for the year ended 30 June 2016
Note 3. Income from continuing operations (continued)
$ ’000
(e) Grants
General purpose (untied)Financial assistance – general componentFinancial assistance – local roads componentPensioners’ rates subsidies – general componentTotal general purpose
Specific purposePensioners’ rates subsidies: – Domestic waste managementAged careChild careEnvironmental protectionExcess weight subsidyHousing and community amenitiesLibrary – per capitaLibrary – special projectsLIRS subsidyRecreation and cultureTraffic route subsidyTransport (roads to recovery)Transport (other roads and bridges funding)Total specific purposeTotal grants
Grant revenue is attributable to:– Commonwealth funding– State funding– Other funding
–
–
914
64
2,386
–
30
20162015
1,791 1,472 2,701
2,701 4
55
910
56
270
–
12 –
26
1,212
232 616
66
–
125
Operating
20
Operating
66 229
391
2015
–
348
–
– 520
2016
30
–
Capital
99 97
34
615
75
1,485
2,386
917 1,469
–
484
72
315 –
– – –
374
–
–
11 122
537
112
– 110
–
–
–
374
–
– –
–
–
484 –
110
–
270
–
–
484
Capital
–
–
270
270
–
–
270
–
– –
112 –
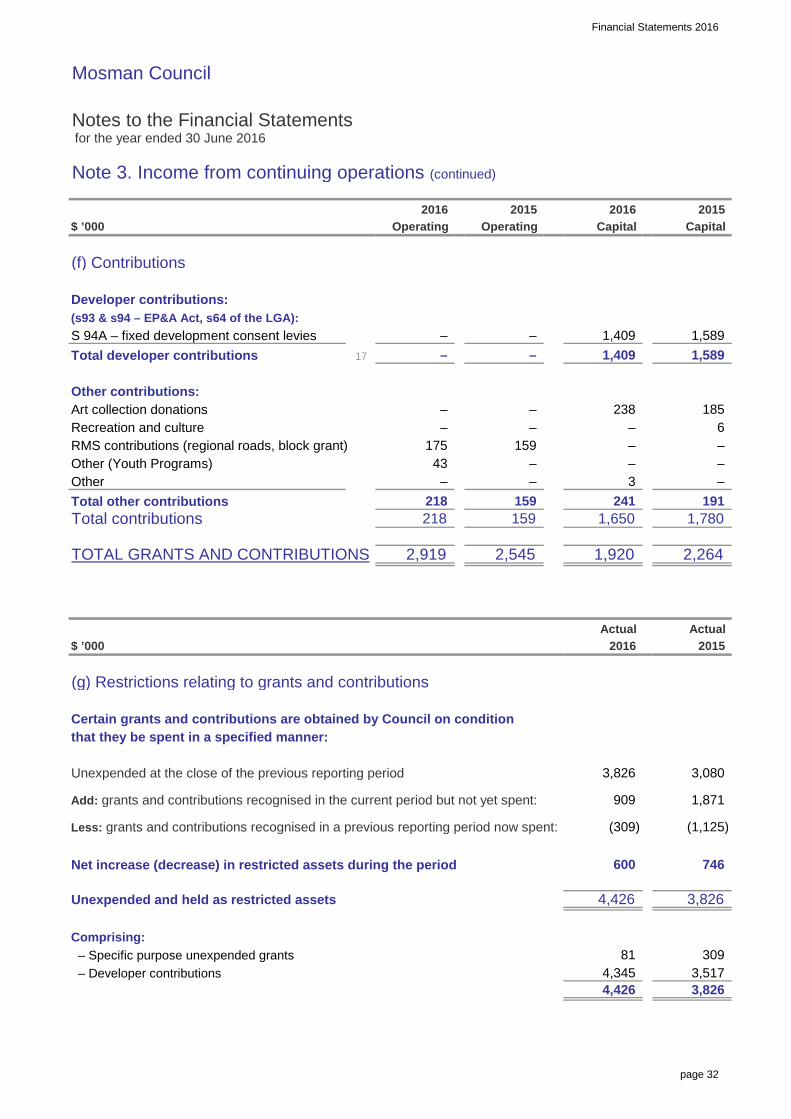
Financial Statements 2016
page 32
Mosman Council
Notes to the Financial Statements for the year ended 30 June 2016
Note 3. Income from continuing operations (continued)
$ ’000
(f) Contributions
Developer contributions:(s93 & s94 – EP&A Act, s64 of the LGA):S 94A – fixed development consent leviesTotal developer contributions
Other contributions:Art collection donationsRecreation and cultureRMS contributions (regional roads, block grant)Other (Youth Programs)OtherTotal other contributionsTotal contributions
TOTAL GRANTS AND CONTRIBUTIONS
$ ’000
(g) Restrictions relating to grants and contributions
Certain grants and contributions are obtained by Council on conditionthat they be spent in a specified manner:
Unexpended at the close of the previous reporting period
Add: grants and contributions recognised in the current period but not yet spent:
Less: grants and contributions recognised in a previous reporting period now spent:
Net increase (decrease) in restricted assets during the period
Unexpended and held as restricted assets
Comprising: – Specific purpose unexpended grants – Developer contributions
81
–
3
(309)
1,650
2016
–
159
159
–
– 43
2015
–
3,080
1,871
600
4,426
3,517
746
3,826 4,345
3,826
2,545
909
Operating
– – –
159 218
Actual
– – – 1,409
Operating
2016
4,426
175 –
17
2,264
6 –
–
2,919
218
309
3,826
191
1,920
2015
Capital Capital
1,589
185
–
238
1,780
(1,125)
2016 2015
–
Actual
241 –
1,409 1,589

Financial Statements 2016
page 33
Mosman Council
Notes to the Financial Statements for the year ended 30 June 2016
Note 4. Expenses from continuing operations
$ ’000
(a) Employee benefits and on-costs
Salaries and wagesEmployee termination costs (where material – other than vested leave paid)Travel expensesEmployee leave entitlements (ELE)Superannuation – defined contribution plansSuperannuation – defined benefit plansWorkers’ compensation insuranceFringe benefit tax (FBT) (1)
Training costs (other than salaries and wages)OtherTOTAL EMPLOYEE COSTS EXPENSED
Number of ‘full-time equivalent’ employees (FTE) at year endNumber of ‘full-time equivalent’ employees (FTE) at year end (incl. vacancies)
(b) Borrowing costs
(i) Interest bearing liability costsInterest on loansTotal interest bearing liability costs expensed
(ii) Other borrowing costsNilTOTAL BORROWING COSTS EXPENSED
Notes
1,937
2016
363
11
167
15
612
138
292 –
612
175
502
168
32
130
324
272
Actual
12,555
16,874
Actual
1,767
2015
1,150 321
502 612 502
11,982
15,925
77 32
331 1,070
(1) FBT was affected in each year by timing changes in benefit payments. Comparitive does not reflect proportionate increase in benefit payments
174
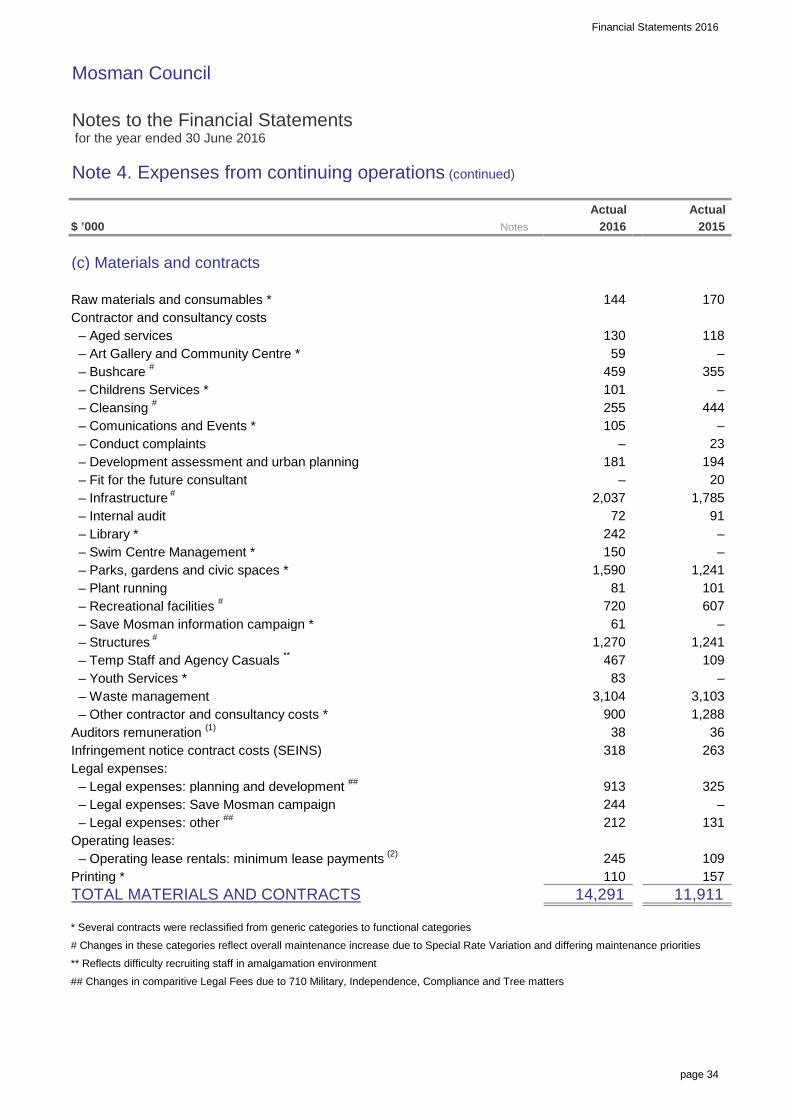
Financial Statements 2016
page 34
Mosman Council
Notes to the Financial Statements for the year ended 30 June 2016
Note 4. Expenses from continuing operations (continued)
$ ’000
(c) Materials and contracts
Raw materials and consumables *Contractor and consultancy costs – Aged services – Art Gallery and Community Centre * – Bushcare #
– Childrens Services * – Cleansing #
– Comunications and Events * – Conduct complaints – Development assessment and urban planning – Fit for the future consultant – Infrastructure #
– Internal audit – Library * – Swim Centre Management * – Parks, gardens and civic spaces * – Plant running – Recreational facilities #
– Save Mosman information campaign * – Structures #
– Temp Staff and Agency Casuals **
– Youth Services * – Waste management – Other contractor and consultancy costs *Auditors remuneration (1)
Infringement notice contract costs (SEINS)Legal expenses: – Legal expenses: planning and development ##
– Legal expenses: Save Mosman campaign – Legal expenses: other ##
Operating leases: – Operating lease rentals: minimum lease payments (2)
Printing *TOTAL MATERIALS AND CONTRACTS
* Several contracts were reclassified from generic categories to functional categories
# Changes in these categories reflect overall maintenance increase due to Special Rate Variation and differing maintenance priorities
** Reflects difficulty recruiting staff in amalgamation environment
## Changes in comparitive Legal Fees due to 710 Military, Independence, Compliance and Tree matters
–
– –
–
–
–
–
Notes
23
130
170
255
1,270
607 81
2,037
212
194
144
38
109
–
–
Actual
444
181 20
2016
72
– –
–
1,785
11,911
91
101
59
36 318
245
263
14,291
3,104 3,103 83
242 150
61
467
101
Actual
325
900
110 157
244
105
109
2015
1,288
118
131
913
459 355
1,590 1,241
1,241
720

Financial Statements 2016
page 35
Mosman Council
Notes to the Financial Statements for the year ended 30 June 2016
Note 4. Expenses from continuing operations (continued)
$ ’000
(c) Materials and contracts (continued)
1. Auditor remuneration During the year, the following fees were incurred for services provided by
the Council’s Auditor (and the Auditors of other consolidated entities):
(i) Audit and other assurance services – Audit and review of financial statements: Council’s AuditorRemuneration for audit and other assurance servicesTotal Auditor remuneration
2. Operating lease payments are attributable to:Computers
2014/15 Operating Lease amount lower due to delay in introduction of new leasing arrangements
$ ’000
(d) Depreciation, amortisation and impairment
Plant and equipmentOffice equipmentFurniture and fittingsLand improvements (depreciable)Infrastructure: – Buildings – non-specialised – Buildings – specialised – Other structures – Roads – Footpaths – Stormwater drainage – Other open space/recreational assetsOther assets – Library books – OtherIntangible assetsTOTAL DEPRECIATION ANDIMPAIRMENT COSTS EXPENSED
38 38 38
237
–
–
–
–
–
Notes
–
Actual Notes
–
– 7
2016Actual Actual
–
Impairment costs
– –
245
6
– –
–
–
–
512
–
–
– 4
–
–
–
284
132
20162015
–
–
–
178
Actual 2016
483
29
25
–
244
952 372
–
–
–
–
Actual 2015
13
16 16
896
180 196
239
2,424 2,336
25
245
Depreciation/amortisation Actual
36
109
5,415
109
5,166
36
130
4
6
2015
281
379
36

Financial Statements 2016
page 36
Mosman Council
Notes to the Financial Statements for the year ended 30 June 2016
Note 4. Expenses from continuing operations (continued)
$ ’000
(e) Other expenses
Other expenses for the year include the following:
AdvertisingBad and doubtful debtsBad and doubtful debts parking finesBank chargesCateringComputer software chargesContributions/levies to other levels of government – Department of Planning levy – Local Government NSW – NSW Fire Brigade levyCouncillor expenses – mayoral feeCouncillor expenses – councillors’ feesCouncillors’ expenses (incl. mayor) – other (excluding fees above)Donations, contributions and assistance to other organisations (Section 356)
Electricity and heating (1)
Equipment maintenanceFair value decrements – I,PP&E Fair value decrements – investment propertiesInsuranceLeases – photocopiersLeases – propertyPostageStreet lighting (2)
Subscriptions and publicationsTelephone and communicationsWaste disposal and recycling centreWaterOtherTOTAL OTHER EXPENSES
(1) Savings from joint SSROC contract(2) Maintenance component transferred to Infrastructure Contractors
36
98
966
12 9(a)
3,219
82
269
98
Notes
176
33
–
173
79
10,914
237
14
202 169
71
808 887 139
269
1,223
975
838
2016Actual
959
117
127 53
239 6,430
431
38
–
144
781
141
126
196
16
Actual
49
32
195
200
877
38
90
–
429
123
201
444
–
31
57 50
2015
76
25

Financial Statements 2016
page 37
Mosman Council
Notes to the Financial Statements for the year ended 30 June 2016
Note 5. Gains or losses from the disposal of assets
$ ’000
Property (excl. investment property)Proceeds from disposal – propertyLess: carrying amount of property assets sold/written offNet gain/(loss) on disposal
InfrastructureLess: carrying amount of infrastructure assets sold/written offNet gain/(loss) on disposal
Financial assets*Proceeds from disposal/redemptions/maturities – financial assetsLess: carrying amount of financial assets sold/redeemed/maturedNet gain/(loss) on disposal
NET GAIN/(LOSS) ON DISPOSAL OF ASSETS
(15) (15)
–
(13)
Actual
(31,000)
28
15
19,350 31,000
(20)
Notes
–
2016
–
–
(20)
(19,350)
–
(20)
2015
–
Actual

Financial Statements 2016
page 38
Mosman Council
Notes to the Financial Statements for the year ended 30 June 2016
Note 6a. – Cash assets and Note 6b. – investments
$ ’000
Cash and cash equivalents (Note 6a)Cash on hand and at bankCash-equivalent assets 1
– Deposits at call – Short-term depositsTotal cash and cash equivalents
Investments (Note 6b) – Long term depositsTotal investmentsTOTAL CASH ASSETS, CASHEQUIVALENTS AND INVESTMENTS
1 Those investments where time to maturity (from date of purchase) is < 3 mths.
Cash, cash equivalents and investments wereclassified at year end in accordance withAASB 139 as follows:
Cash and cash equivalentsa. ‘At fair value through the profit and loss’
Investmentsa. ‘Held to maturity’Investments
Note 6(b-i)Reconciliation of investmentsclassified as ‘held to maturity’AdditionsDisposals (sales and redemptions)Balance at end of year
Comprising:– Long term deposits
Total
Refer to Note 27. Fair value measurement for information regarding the fair value of investments held.
13,160
–
Notes
2016Actual
Current Actual
2016
12,000
2,000
14,725
12,725
–
725
Current
–
–
70
1,090
–
–
–
2015
–
– –
–
– 2,000
–
–
– –
(31,000)
2,000
–
2,000
2,000
–
–
33,000
6(b-i)2,000
12,725
Non-current
2,000
Actual
–
12,000 –
Actual 2015
–
–
–
Non-current
–
–
13,160
–
–
–
– (19,350)
– –
–
–
–
19,350
–
–
–
13,160

Financial Statements 2016
page 39
Mosman Council
Notes to the Financial Statements for the year ended 30 June 2016
Note 6c. Restricted cash, cash equivalents and investments – details
$ ’000
Total cash, cash equivalentsand investments
attributable to:External restrictions (refer below)
Internal restrictions (refer below)
Unrestricted
$ ’000
Details of restrictions
External restrictions – included in liabilitiesNil
External restrictions – otherDeveloper contributions – general (D)Specific purpose unexpended grants (F)Domestic waste management (G)External restrictions – otherTotal external restrictions
Internal restrictionsPlant and vehicle replacementInfrastructure replacementEmployees leave entitlementDeposits, retentions and bondsIT reserveSwim centreYouth film festival unspent contributionsYouth services IT project reserveVPA reserveTotal internal restrictions
TOTAL RESTRICTIONS
D Development contributions which are not yet expended for the provision of services and amenities in accordancewith contributions plans (refer Note 17).
F Grants which are not yet expended for the purposes for which the grants were obtained. (refer Note 1 (b)) G Water, sewerage, domestic waste management (DWM) and other special rates/levies/charges are externally
restricted assets and must be applied for the purposes for which they were raised.
– –
2015Actual
2016Actual
81
Non-current
Transfers to restrictions
5,287 5,262
restrictions
2015
–
Actual
–
balance
14,725
(690)
– –
15
–
–
979
5,877
1,451
(2,111) (941)
–
(853)
–
(13)
4,345
(999)
–
348
4,500
(18)
(157)
12,353
–
(3,110)
6,476
(309)
439 850
2,500
3,300
1,614
139
579 –
–
1,518 3,517
–
14,725
balance
Actual
–
2016
Current
840
163
2,000
416
853
157
10,549 4,914
5,287
81
18 13
5,262 5,262
309
–
–
5,877
–
–
59 70 (129)
5,877
Current Non-current
1,436
140
(999) 1,614
2016 Closing Transfers from
– 6,476
13,160
–
2,611
Opening
13,160
2,372
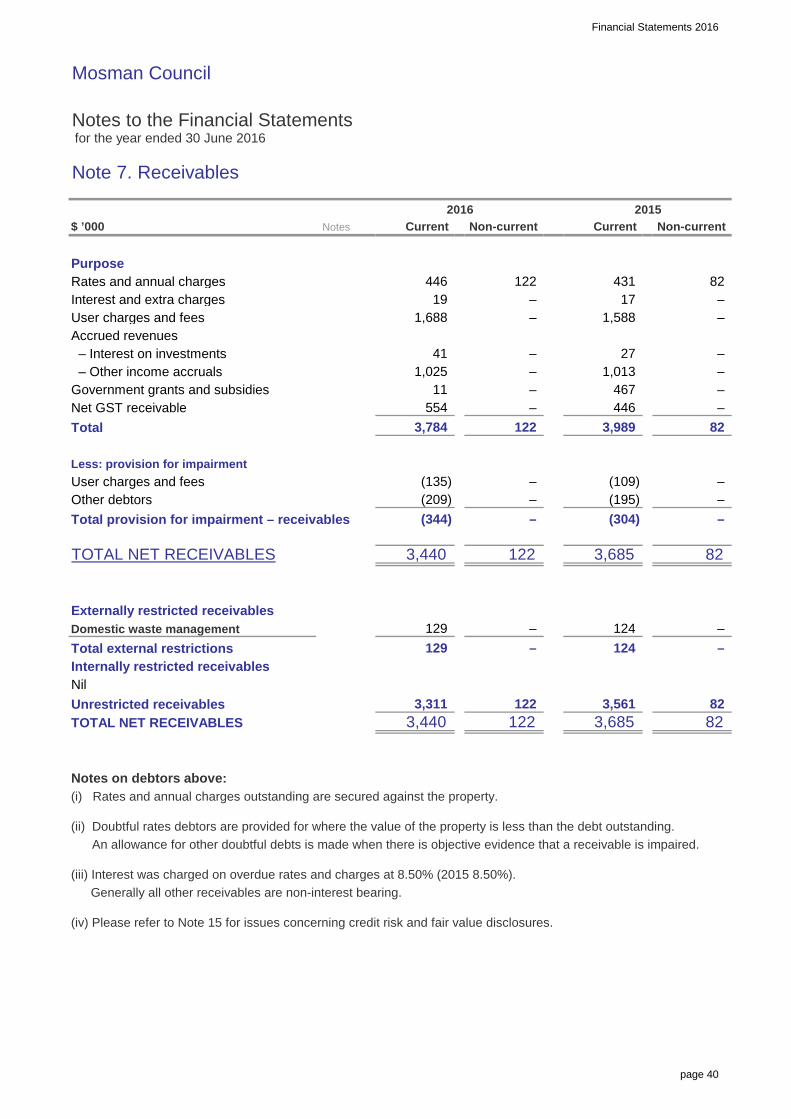
Financial Statements 2016
page 40
Mosman Council
Notes to the Financial Statements for the year ended 30 June 2016
Note 7. Receivables
$ ’000
PurposeRates and annual chargesInterest and extra chargesUser charges and feesAccrued revenues – Interest on investments – Other income accrualsGovernment grants and subsidiesNet GST receivableTotal
Less: provision for impairmentUser charges and feesOther debtorsTotal provision for impairment – receivables
TOTAL NET RECEIVABLES
Externally restricted receivablesDomestic waste managementTotal external restrictionsInternally restricted receivablesNilUnrestricted receivablesTOTAL NET RECEIVABLES
Notes on debtors above:(i) Rates and annual charges outstanding are secured against the property.
(ii) Doubtful rates debtors are provided for where the value of the property is less than the debt outstanding. An allowance for other doubtful debts is made when there is objective evidence that a receivable is impaired.
(iii) Interest was charged on overdue rates and charges at 8.50% (2015 8.50%).Generally all other receivables are non-interest bearing.
(iv) Please refer to Note 15 for issues concerning credit risk and fair value disclosures.
–
–
–
17
2015
1,013 27
431
467
–
Non-current
–
82
–
– –
(195) (109)
82
–
3,561
–
122
–
82
124 –
(209)
554 3,784
(344)
1,588
Current Notes
1,025 – 41
446
–
3,440
– 82
– – (135)
11 –
Non-current
122
122 3,989
3,685 3,311 122
3,440
– –
129 129 124
82
3,685
(304)
122 446 –
–
19
2016Current
1,688

Financial Statements 2016
page 41
Mosman Council
Notes to the Financial Statements for the year ended 30 June 2016
Note 8. Inventories and other assets
$ ’000
(a) Inventories
(i) Inventories at costStores and materialsTrading stockTotal inventories at cost
(ii) Inventories at net realisable value (NRV)Nil
TOTAL INVENTORIES
(b) Other assets
PrepaymentsTOTAL OTHER ASSETS
Externally restricted assetsThere are no restrictions applicable to the above assets.
–
–
–
163 –
–
Non-current Current
60
78
2015
163
– –
85
227
148
60
–
87
–
2016
61 148
Non-current
–
227 –
Notes Current
–

Financial Statements 2016
page 42
Mosman Council
Notes to the Financial Statements for the year ended 30 June 2016
Note 9a. Infrastructure, property, plant and equipment
At At Carrying At At Carrying
$ ’000 cost fair value depreciation impairment value cost fair value depreciation impairment value
Capital work in progress 317 – – – 317 194 – – – (106) – – – – 405 – – – 405 Plant and equipment – 2,018 1,240 – 778 330 53 (17) (196) – – – – – – 2,023 1,075 – 948 Office equipment – 975 675 – 300 77 – – (132) – – – – – – 1,032 787 – 245 Furniture and fittings – 332 215 – 117 23 – – (29) – – – – – – 354 243 – 111 Art collection – 4,621 – – 4,621 – 293 – – – – – – 304 – 5,218 – – 5,218 Land: – Operational land – 112,190 – – 112,190 – – – – – 277 557 – – – 113,024 – – 113,024 – Community land – 62,159 – – 62,159 – – – – – (277) – (1,223) – – 60,659 – – 60,659 Land improvements – depreciable – 831 154 – 677 46 – – (7) – (87) – – – – 735 106 – 629 Infrastructure: – Buildings – non-specialised – 44,739 17,118 – 27,621 422 32 – (512) – – 211 – – – 45,404 17,630 – 27,774 – Buildings – specialised – 21,799 6,930 – 14,869 183 53 – (284) – (246) – – – – 21,720 7,145 – 14,575 – Other structures – 605 229 – 376 – – – (6) – (370) – – – – – – – – – Roads – 207,877 91,554 – 116,323 2,718 596 – (2,424) 17 – – – – – 211,208 93,978 – 117,230 – Footpaths – 15,657 4,453 – 11,204 918 – – (244) – – – – – – 16,574 4,696 – 11,878 – Stormwater drainage – 64,827 14,714 – 50,113 528 – – (372) – – – – – – 65,355 15,086 – 50,269 – Other open space/recreational assets – 37,996 17,260 – 20,736 1,368 105 (11) (952) 89 703 – – 8,094 – 46,348 16,216 – 30,132 Other assets: – Heritage collections – 23 10 – 13 – – – – – – – – – – 23 10 – 13 – Library books – 2,155 1,339 – 816 227 – – (237) – – – – – – 2,377 1,571 – 806 – Other – 60 9 – 51 – – – (4) – – – – – – 60 13 – 47 TOTAL INFRASTRUCTURE,PROPERTY, PLANT AND EQUIP.
Renewals are defined as the replacement of existing assets (as opposed to the acquisition of new assets).Community Land was valued in 2010/11 using the available Valuer General rating values at the time. An average $/sqm meter figure was applied to significant non-valued parcels. VG has subsequently issued values for most of these parcels less than these estimatesRefer to Note 27. Fair value measurement for information regarding the fair value of other infrastructure, property, plant and equipment.
as at 30/6/2016
Accumulated
Revaluation decrements
to P&L
Tfrs from/(to)
investment properties
– – 433,963 768 (1,223) 8,398 405 592,114 158,556 – 7,034 (28) (5,399) 1,132
as at 30/6/2015Asset movements during the reporting period
AccumulatedWIP
transfers
Adjustmentsand
transfers
Additionsnew assets
Additionsrenewals
Carrying value
of disposals
Depreciation expense
Revaluation increments
to equity (ARR)
317 578,864 155,900 – 423,281

Financial Statements 2016
page 43
Mosman Council
Notes to the Financial Statements for the year ended 30 June 2016
Note 9b. Externally restricted infrastructure, property, plant and equipment
$ ’000
Council has no externally restricted infrastructure, property, plant and equipment.
Note 9c. Infrastructure, property, plant and equipment – current year impairments
Council has recognised no impairment losses during the reporting period nor reversed any prior period losses.Actual Actual

Financial Statements 2016
page 44
Mosman Council
Notes to the Financial Statements for the year ended 30 June 2016
Note 10a. Payables, borrowings and provisions
$ ’000
PayablesGoods and services – operating expenditureGoods and services – capital expenditurePayments received In advanceAccrued expenses: – Borrowings – Salaries and wages – Other expenditure accrualsSecurity bonds, deposits and retentionsTotal payables
BorrowingsLoans – secured 1
Total borrowings
ProvisionsEmployee benefits:Annual leaveLong service leaveSub-total – aggregate employee benefits
Total provisions
(i) Liabilities relating to restricted assets
Externally restricted assetsDomestic waste managementCurrent borrowings funded by S94Liabilities relating to externally restricted assets
Internally restricted assetsNil
Total liabilities relating to restricted assetsTotal liabilities relating to unrestricted assetsTOTAL PAYABLES, BORROWINGS AND PROVISIONS
1. Loans are secured over the general rating income of Council Disclosures on liability interest rate risk exposures, fair value disclosures and security can be found in Note 15.
2,335
2016
–
–
–
– 517 –
–
–
–
Current
–
1,744
36 47 –
–
7,069 –
Current Non-current
–
436
1,913 5,819
15,578
4,735
Notes
598 2,507
–
–
–
–
1,635
–
1,070
2015Non-current
2016
20
11,954 9,770 6,045
5,819 7,166 1,746
–
TOTAL PAYABLES, BORROWINGS AND PROVISIONS
Current Current 2015
3,895 159 286
15,578
4,735 159
– 1,560
1,746 1,913
1,766 2,969
286
7,166
18,058 377
– 235
7,452
286
124
5,978
Non-current
–
7,452 5,978
–
Non-current
18,435
– 159
3,895
7,452
129
359 377 248
359 15,219
–
18,435
– –
5,978
–

Financial Statements 2016
page 45
Mosman Council
Notes to the Financial Statements for the year ended 30 June 2016
Note 10a. Payables, borrowings and provisions (continued)
$ ’000
(ii) Current liabilities not anticipated to be settled within the next twelve months
The following liabilities, even though classified as current, are not expectedto be settled in the next 12 months.
Provisions – employees benefitsPayables – security bonds, deposits and retentions
Note 10b. Description of and movements in provisions
a. Employees leave entitlements and on-costs represents those benefits accrued and payable and an estimate of those that will become payable in the future as a result of past service.
5,350 8,311
4,894 3,128
(1,204)
Actual2015
(128) 635
2,254
4,181
Annual leave – (1,076)
Openingbalance
as at 1/7/15
Additional provisions
– Long service leave1,560
1,917 –
TOTAL
–
2016
Class of provision
–
2015
1,282 2,621
1,766
7,604
Decrease due to payments
2016
5,523
–
Closingbalance
as at 30/6/16
Unused amounts reversed
Remeasurement effects due to
discounting
2,788
Actual
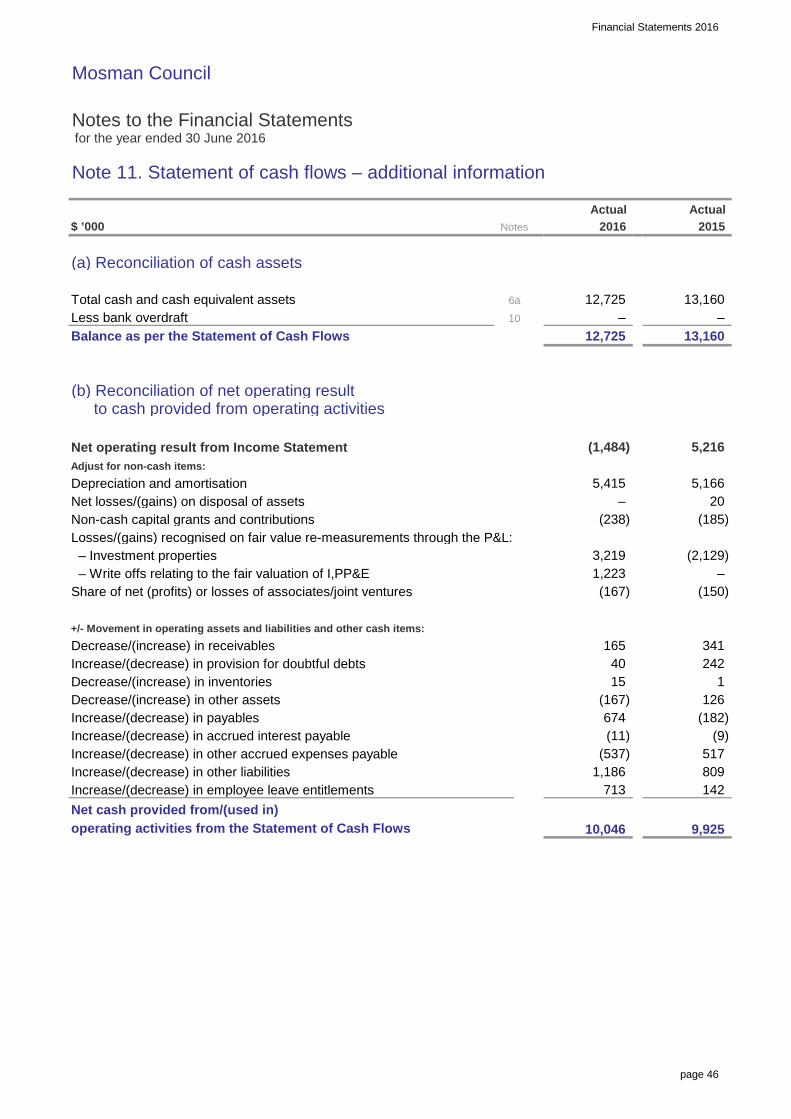
Financial Statements 2016
page 46
Mosman Council
Notes to the Financial Statements for the year ended 30 June 2016
Note 11. Statement of cash flows – additional information
$ ’000
(a) Reconciliation of cash assets
Total cash and cash equivalent assetsLess bank overdraftBalance as per the Statement of Cash Flows
(b) Reconciliation of net operating result to cash provided from operating activities
Net operating result from Income StatementAdjust for non-cash items:Depreciation and amortisationNet losses/(gains) on disposal of assetsNon-cash capital grants and contributionsLosses/(gains) recognised on fair value re-measurements through the P&L: – Investment properties – Write offs relating to the fair valuation of I,PP&EShare of net (profits) or losses of associates/joint ventures
+/- Movement in operating assets and liabilities and other cash items:Decrease/(increase) in receivablesIncrease/(decrease) in provision for doubtful debtsDecrease/(increase) in inventoriesDecrease/(increase) in other assetsIncrease/(decrease) in payablesIncrease/(decrease) in accrued interest payableIncrease/(decrease) in other accrued expenses payableIncrease/(decrease) in other liabilitiesIncrease/(decrease) in employee leave entitlementsNet cash provided from/(used in)operating activities from the Statement of Cash Flows
2015
(185)
(1,484)
165
2016
(238)
341
1,223
142
242
1,186
(9)
15
9,925 10,046
–
(167)
(2,129)
Notes
(167)
517 809
713
13,160
(11) (182) 126
(150)
1
(537)
13,160
5,415
5,216
12,725 10
6a
Actual
–
40
20
Actual
–
5,166
674
3,219
12,725 –

Financial Statements 2016
page 47
Mosman Council
Notes to the Financial Statements for the year ended 30 June 2016
Note 11. Statement of cash flows – additional information (continued)
$ ’000
(c) Non-cash investing and financing activities
Other dedications artworksTotal non-cash investing and financing activities
(d) Financing arrangements
(i) Unrestricted access was available at balance date to the following lines of credit:
Bank overdraft facilities (1)
Credit cards/purchase cardsTotal financing arrangements
1. The bank overdraft facility may be drawn at any time and may be terminated by the bank without notice.
Interest rates on overdrafts are interest rates on loans and other payables are disclosed in Note 15.
(ii) Secured loan liabilities
Loans are secured by a mortgage over future years rate revenue only.
55 145
238 238
90
185
Actual Notes
Actual 2016
185
145
2015
90 55

Financial Statements 2016
page 48
Mosman Council
Notes to the Financial Statements for the year ended 30 June 2016
Note 12. Commitments for expenditure
$ ’000
(a) Capital commitments (exclusive of GST)
Capital expenditure committed for at the reporting date but notrecognised in the financial statements as liabilities:
Property, plant and equipmentInfrastructureTotal commitments
These expenditures are payable as follows:Within the next yearTotal payable
Sources for funding of capital commitments:Internally restricted reservesTotal sources of funding
(b) Finance lease commitments
Nil
(c) Operating lease commitments (non-cancellable)
a. Commitments under non-cancellable operating leases at the reporting date, but not recognised as liabilities are payable:
Within the next yearLater than one year and not later than 5 yearsTotal non-cancellable operating lease commitments
b. Non-cancellable operating leases include the following assets: Office Equipment with an average lease term of 3 years. Contingent Rentals may be payable depending on the condition of items or usage during the lease term.
Conditions relating to operating leases:– All operating lease agreements are secured only against the leased asset.– No lease agreements impose any financial restrictions on Council regarding future debt etc.
(d) Investment property commitments
Nil
544 540
190
–
116
Notes
– 116
Actual
–
116 – 116 –
928
2015Actual
116
350 384
116 –
2016

Financial Statements 2016
page 49
Mosman Council
Notes to the Financial Statements for the year ended 30 June 2016
Note 13a(i). Statement of performance measurement – indicators (consolidated)
$ ’000
Local government industry indicators – consolidated
1. Operating performance ratioTotal continuing operating revenue (1) excluding capitalgrants and contributions less operating expensesTotal continuing operating revenue (1) excluding capitalgrants and contributions
2. Own source operating revenue ratioTotal continuing operating revenue (1)
excluding all grants and contributionsTotal continuing operating revenue (1)
3. Unrestricted current ratioCurrent assets less all external restrictions (2)
Current liabilities less specific purpose liabilities (3, 4)
4. Debt service cover ratioOperating result (1) before capital excluding interestand depreciation/impairment/amortisationPrincipal repayments (Statement of Cash Flows)plus borrowing costs (Income Statement)
5. Rates, annual charges, interest and extra charges outstanding percentageRates, annual and extra charges outstandingRates, annual and extra charges collectible
6. Cash expense cover ratioCurrent year’s cash and cash equivalentsplus all term depositsPayments from cash flow of operating andfinancing activities
Notes
(1) Excludes fair value adjustments and reversal of revaluation decrements, net gain/(loss) on sale of assets and the net share of interests in joint ventures and associates.(2) Refer Notes 6-8 inclusive. Also excludes any real estate and land for resale not expected to be sold in the next 12 months.(3) Refer to Note 10(a).(4) Refer to Note 10(a)(ii) – excludes all payables and provisions not expected to be paid in the next 12 months (incl. ELE).
Amounts
41,506
x12
0.31%1.70%44,425
6,788
4.2 mths
1.40x
2,416
2.20%
2014
88.82%
1.29x
89.56% 88.29%
4.25 mths
2.59x
Prior periodsIndicator
1.53x
1.96%
2015
3.3 mths
2016
2.38x
3,469 14,725
25,936 587
871
2016
46,345
2.81x
9,747 12,534
1.55%2.26%
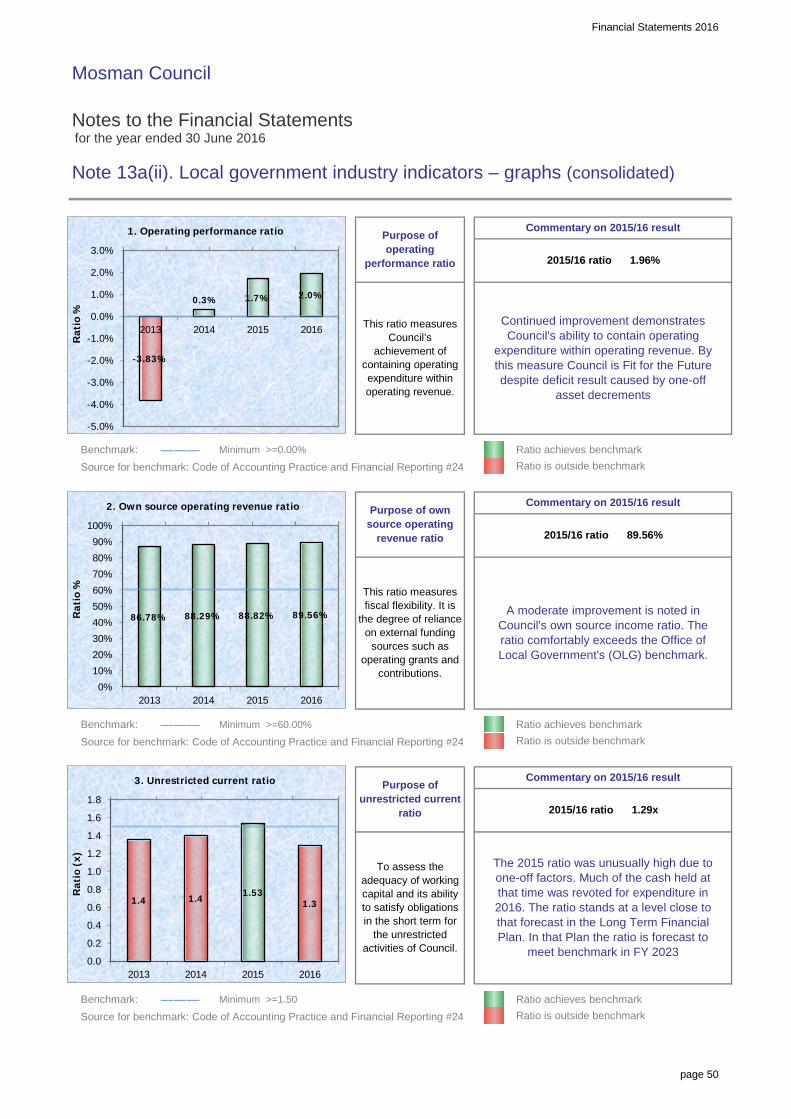
Financial Statements 2016
page 50
Mosman Council
Notes to the Financial Statements for the year ended 30 June 2016
Note 13a(ii). Local government industry indicators – graphs (consolidated)
Benchmark: ――― Minimum >=0.00% Ratio achieves benchmarkSource for benchmark: Code of Accounting Practice and Financial Reporting #24 Ratio is outside benchmark
Benchmark: ――― Minimum >=60.00% Ratio achieves benchmarkSource for benchmark: Code of Accounting Practice and Financial Reporting #24 Ratio is outside benchmark
Benchmark: ――― Minimum >=1.50 Ratio achieves benchmarkSource for benchmark: Code of Accounting Practice and Financial Reporting #24 Ratio is outside benchmark
2015/16 ratio 1.96%
2015/16 ratio 89.56%
2015/16 ratio 1.29x
Commentary on 2015/16 result
Commentary on 2015/16 result
Commentary on 2015/16 result
Purpose of unrestricted current
ratio
This ratio measures Council’s
achievement of containing operating expenditure within operating revenue.
This ratio measures fiscal flexibility. It is
the degree of reliance on external funding
sources such as operating grants and
contributions.
To assess the adequacy of working capital and its ability to satisfy obligations in the short term for
the unrestricted activities of Council.
Continued improvement demonstrates Council's ability to contain operating
expenditure within operating revenue. By this measure Council is Fit for the Future despite deficit result caused by one-off
asset decrements
Purpose of operating
performance ratio
A moderate improvement is noted in Council's own source income ratio. The ratio comfortably exceeds the Office of Local Government's (OLG) benchmark.
Purpose of own source operating
revenue ratio
The 2015 ratio was unusually high due to one-off factors. Much of the cash held at that time was revoted for expenditure in 2016. The ratio stands at a level close to that forecast in the Long Term Financial Plan. In that Plan the ratio is forecast to
meet benchmark in FY 2023
0.3% 1.7% 2.0%
-3.83%
-5.0%
-4.0%
-3.0%
-2.0%
-1.0%
0.0%
1.0%
2.0%
3.0%
2013 2014 2015 2016
Rat
io %
1. Operating performance ratio
86.78% 88.29% 88.82% 89.56%
0%
10%
20%
30%
40%
50%
60%
70%
80%
90%
100%
2013 2014 2015 2016
Rat
io %
2. Own source operating revenue ratio
1.53 1.4 1.4 1.3
0.0
0.2
0.4
0.6
0.8
1.0
1.2
1.4
1.6
1.8
2013 2014 2015 2016
Rat
io (
x)
3. Unrestricted current ratio

Financial Statements 2016
page 51
Mosman Council
Notes to the Financial Statements for the year ended 30 June 2016
Note 13a(ii). Local government industry indicators – graphs (consolidated)
Benchmark: ――― Minimum >=2.00 Ratio achieves benchmarkSource for benchmark: Code of Accounting Practice and Financial Reporting #24 Ratio is outside benchmark
Benchmark: ――― Maximum <5.00% Ratio is within BenchmarkSource for Benchmark: Code of Accounting Practice and Financial Reporting #24 Ratio is outside Benchmark
Benchmark: ――― Minimum >=3.00 Ratio achieves benchmarkSource for benchmark: Code of Accounting Practice and Financial Reporting #24 Ratio is outside benchmark
Purpose of debt service cover ratio
This ratio measures the availability of operating cash to
service debt including interest, principal and
lease payments
No substantial change on the prior reporting year. The ratio meets the relevant
benchmark.
Commentary on 2015/16 result
2015/16 ratio 2.26%
Council continues to maintain a ratio well within the OLG benchmark and is amongst
the lowest in NSW
Purpose of cash expense cover ratio
Commentary on 2015/16 result
In the reporting period Council took out one new $400k loan while greater amounts off
existing loans.
2015/16 ratio 2.81x
This liquidity ratio indicates the number of months a Council can continue paying
for its immediate expenses without
additional cash inflow.
To assess the impact of uncollected rates and annual charges on Council’s liquidity and the adequacy of
recovery efforts.
2015/16 ratio 4.25 mths
Purpose of rates and annual charges
outstanding ratio
Commentary on 2015/16 result
2.31 2.38 2.59 2.81
0.0
0.5
1.0
1.5
2.0
2.5
3.0
2013 2014 2015 2016
Rat
io (
x)
4. Debt service cover ratio
2% 2%
2% 2%
0%
1%
2%
3%
4%
5%
6%
2013 2014 2015 2016
Rat
io %
5. Rates, annual charges, interest and extra charges outstanding percentage
3.35 3.25
4.24 4.25
0.0
0.5
1.0
1.5
2.0
2.5
3.0
3.5
4.0
4.5
5.0
2013 2014 2015 2016
Rat
io (
mth
s)
6. Cash expense cover ratio
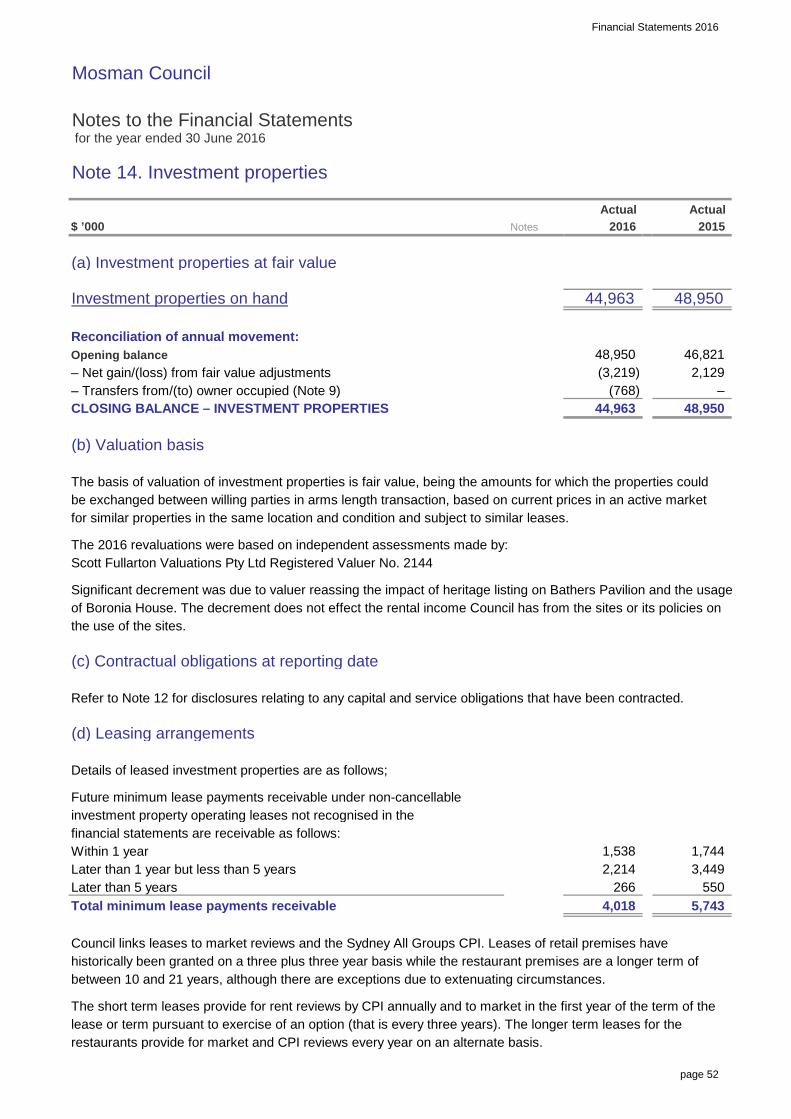
Financial Statements 2016
page 52
Mosman Council
Notes to the Financial Statements for the year ended 30 June 2016
Note 14. Investment properties
$ ’000
(a) Investment properties at fair value
Investment properties on hand
Reconciliation of annual movement:Opening balance– Net gain/(loss) from fair value adjustments– Transfers from/(to) owner occupied (Note 9)CLOSING BALANCE – INVESTMENT PROPERTIES
(b) Valuation basis
The basis of valuation of investment properties is fair value, being the amounts for which the properties couldbe exchanged between willing parties in arms length transaction, based on current prices in an active marketfor similar properties in the same location and condition and subject to similar leases.
The 2016 revaluations were based on independent assessments made by:Scott Fullarton Valuations Pty Ltd Registered Valuer No. 2144
Significant decrement was due to valuer reassing the impact of heritage listing on Bathers Pavilion and the usageof Boronia House. The decrement does not effect the rental income Council has from the sites or its policies onthe use of the sites.
(c) Contractual obligations at reporting date
Refer to Note 12 for disclosures relating to any capital and service obligations that have been contracted.
(d) Leasing arrangements
Details of leased investment properties are as follows;
Future minimum lease payments receivable under non-cancellableinvestment property operating leases not recognised in thefinancial statements are receivable as follows:Within 1 yearLater than 1 year but less than 5 yearsLater than 5 yearsTotal minimum lease payments receivable
Council links leases to market reviews and the Sydney All Groups CPI. Leases of retail premises havehistorically been granted on a three plus three year basis while the restaurant premises are a longer term ofbetween 10 and 21 years, although there are exceptions due to extenuating circumstances.
The short term leases provide for rent reviews by CPI annually and to market in the first year of the term of thelease or term pursuant to exercise of an option (that is every three years). The longer term leases for therestaurants provide for market and CPI reviews every year on an alternate basis.
Notes
(768) –
2,214
Actual 2016
44,963
2015
46,821
Actual
48,950
550
1,538
4,018
44,963
1,744
266 5,743
48,950 (3,219) 2,129
3,449
48,950

Financial Statements 2016
page 53
Mosman Council
Notes to the Financial Statements for the year ended 30 June 2016
Note 14. Investment properties (continued)
$ ’000
(e) Investment property income and expenditure – summary
Rental income from investment properties:– Minimum lease paymentsDirect operating expenses on investment properties:– that generated rental incomeNet revenue contribution from investment propertiesplus:
Fair value movement for yearTotal income attributable to investment properties
Refer to Note 27. Fair value measurement for information regarding the fair value of investment properties held.
Note 15. Financial risk management
Risk management
Council’s activities expose it to a variety of financial risks including (1) price risk, (2) credit risk, (3) liquidity riskand (4) interest rate risk.
The Council’s overall risk management program focuses on the unpredictability of financial markets and seeksto minimise potential adverse effects on the financial performance of the Council.
Council does not engage in transactions expressed in foreign currencies and is therefore not subject to foreigncurrency risk.
Financial risk management is carried out by Council’s finance section under policies approved by the Council.
A comparison by category of the carrying amounts and fair values of Council’s financial assets and financialliabilities recognised in the financial statements is presented below.
Financial assetsCash and cash equivalentsInvestments – ‘Held to maturity’ReceivablesTotal financial assets
Financial liabilitiesPayablesLoans/advancesTotal financial liabilities
3,562
9,079
3,767
9,334 7,565
–
9,334
(271)
1,913
2,129
2015
Actual Actual Notes 2016 2015
1,800
3,658
Fair value 2016
(1,521)
13,160
2,000 –
12,725
1,529
Carrying value 2015
18,287
13,160
18,413
3,562 2,000
9,079 18,921
16,927
1,698
11,356 7,565
18,287 3,767
(3,219)
12,725
11,356
16,927
18,921 18,413
2016
(215)

Financial Statements 2016
page 54
Mosman Council
Notes to the Financial Statements for the year ended 30 June 2016
Note 15. Financial risk management (continued)
$ ’000
Fair value (for the table on the previous page) is determined as follows:
– Cash and cash equivalents, receivables, payables – are estimated to be the carrying value that approximates market value.
– Borrowings and held-to-maturity investments – are based upon estimated future cash flows discounted by the current mkt interest rates applicable to assets and liabilities with similar risk profiles, unless quoted market prices are available.
– Financial assets classified (i) ‘at fair value through profit and loss’ or (ii) ‘available-for-sale’ – are based upon quoted market prices (in active markets for identical investments) at the reporting date or independent valuation.
Refer to Note 27. Fair value measurement for information regarding the fair value of financial assets and liabilities.
(a) Cash & Cash Equivalents, Financial assets 'at fair value through the profit & Loss' "Available-for-sale" financial assets & "Held-to-maturity" Investments
Council’s objective is to maximise its return on cash and investments whilst maintaining an adequate level ofliquidity and preserving capital.
Council has an investment policy which complies with the Local Government Act 1993 and Minister’s investment order. This policy is regularly reviewed by Council and it’s staff and an investment report is tabled before Councilon a monthly basis setting out the portfolio breakup and its performance.
The risks associated with the investments held are:
– Price risk – the risk that the capital value of Investments may fluctuate due to changes in market prices, whether there changes are caused by factors specific to individual financial instruments or their issuers or are caused by factors affecting similar instruments traded in a market.
– Interest rate risk – the risk that movements in interest rates could affect returns and income.
– Credit risk – the risk that the investment counterparty will not complete their obligations particular to a financial instrument, resulting in a financial loss to Council – be it of a capital or income nature.
Council manages these risks (amongst other measures) by diversifying its portfolio and only purchasinginvestments with high credit ratings or capital guarantees.
The following represents a summary of the sensitivity of Council’s Income Statement and accumulated surplus(for the reporting period) due to a change in either the price of a financial asset or the interest rates applicable.
It is assumed that the change in interest rates would have been constant throughout the reporting period.
2016Possible impact of a 1% movement in interest rates
2015Possible impact of a 1% movement in interest rates
(140) (140) Equity
132 (100)
140
132
Profit 140
Increase of values/ratesEquity
Decrease of values/rates
(100)
Profit

Financial Statements 2016
page 55
Mosman Council
Notes to the Financial Statements for the year ended 30 June 2016
Note 15. Financial risk management (continued)
$ ’000
(b) Credit risk
Council’s major receivables comprise (i) rates and annual charges and (ii) user charges and fees.
The major risk associated with these receivables is credit risk – the risk that debts due and payable to Councilmay not be repaid in full.
Council manages this risk by monitoring outstanding debt and employing stringent debt recovery procedures.It also encourages ratepayers to pay their rates by the due date through incentives.
Credit risk on rates and annual charges is minimised by the ability of Council to secure a charge over the landrelating to the debts – that is, the land can be sold to recover the debt. Council is also able to charge intereston overdue rates and annual charges at higher than market rates which further encourages the payment of debt.
There are no significant concentrations of credit risk, whether through exposure to individual customers,specific industry sectors and/or regions.
Council makes suitable provision for doubtful receivables as required and carries out credit checks on mostnon-rate debtors.
There are no material receivables that have been subjected to a re-negotiation of repayment terms.
A profile of Council’s receivables credit risk at balance date follows:
(i) Ageing of receivables – %Current (not yet overdue)
(ii) Ageing of receivables – valueRates and annual charges Other receivablesCurrent Current< 1 year overdue 0 – 30 days overdue2 – 5 years overdue 60 – 90 days overdue> 5 years overdue > 90 days overdue
(iii) Movement in provision for impairment of receivablesBalance at the beginning of the year+ new provisions recognised during the year– amounts already provided for and written off this year– amounts provided for but recovered during the yearBalance at the end of the year
Other
100%
–
100%
(17)
Other
annual
2,015
Other
100%
(1)
100%
12
568 2,323
Rates and
receivables charges
100%
receivables
– 186
–
2016 20152015
Rates and
receivables
Rates and annual
– 568
2016
513
100%
annual Other
Rates and
charges
charges annual
313
100%
– charges receivables
100%
3,558
62
(8)
304
3,338
2016
570
304
788
344
45
2015
–
251
513 442 259

Financial Statements 2016
page 56
Mosman Council
Notes to the Financial Statements for the year ended 30 June 2016
Note 15. Financial risk management (continued)
$ ’000
(c) Liquidity risk
Payables and borrowings are both subject to liquidity risk – the risk that insufficient funds may be on hand to meetpayment obligations as and when they fall due.
Council manages this risk by monitoring its cash flow requirements and liquidity levels and maintaining anadequate cash buffer.
Payment terms can (in extenuating circumstances) also be extended and overdraft facilities utilised as required.
The contractual undiscounted cash outflows (ie. principal and interest) of Council’s payables and borrowings areset out in the maturity table below:
$ ’000
Trade/other payablesLoans and advancesTotal financial liabilities
Trade/other payablesLoans and advancesTotal financial liabilities
Borrowings are also subject to interest rate risk – the risk that movements in interest rates could adverselyaffect funding costs and debt servicing requirements. Council manages this risk through the diversification ofborrowing types, maturities and interest rate structures.
The following interest rates were applicableto Council’s borrowings at balance date:
Trade/other payablesLoans and advances – fixed interest rate
Subject
11,356
2-3 Yrs
ActualTotalto no
3-4 Yrs
1,746
1-2 Yrs
7,565 11,356
1,225
≤ 1 Year > 5 Yrs
6,045
– 1,913
1,146
6,033
–
4-5 Yrs
– 3,289
882
1,145
–
–
maturity
4,287
5,202 1,713
1,225
6,045
7,069
9,334 7,565
18,921 6.05% 9,079
1,109
Averagevalue
18,413
18,921
9,079
9,334
1,146 1,421
interest rateCarrying
2,045
–
882
1,190
18,921
9,334
11,356 0.00%
1,109
–
–
0.00%
interest rate
2,045
1,145 7,565
–
1,190
2015
2016– 7,069
9,079 1,109
1,109
6.29%
value
2015Carrying
18,413
–
outflows
1,421
2016
valuescash
–
carryingpayable in:
18,413
1,713
Average

Financial Statements 2016
page 57
Mosman Council
Notes to the Financial Statements for the year ended 30 June 2016
Note 16. Material budget variations
$ ’000
Council’s original financial budget for 15/16 was adopted by the Council on 02 June 2015.
While the Income Statement included in this General Purpose Financial Report must disclose the originalbudget adopted by Council, the Local Government Act 1993 requires Council to review its financial budget on aquarterly basis, so that it is able to manage the various variations between actuals versus budget thatinvariably occur throughout the year.
This note sets out the details of material variations between Council’s original budget and its actualresults for the year as per the Income Statement – even though such variations may have been adjusted forduring each quarterly budget review.
Note that for variations* of budget to actual :Material variations represent those variances that amount to 10% or more of the original budgeted figure.F = Favourable budget variation, U = Unfavourable budget variation
$ ’000
REVENUESRates and annual charges
User charges and fees
Interest and investment revenueLate finishing works and ongoing large holdings of Bonds and Deposits contributed to larger than expected cash balances and therefore interest income.
Other revenuesParking Fines income $187k over budget due to unseasonal warm Autumn weather. Unbudgeted income from Kimbriki Investment $106k.
Operating grants and contributionsChildcare Benefit Grants budgeted in User Fees but classified Grants $168k. LIRS interest subsidy budgeted in Borrowing Costs expenses but correctly classified Operating Grants $71k. "Windfall" off-grants for CommunityServices $130k. Higher than expected RMS Operating Contributions $20k. Roads to Recovery grant $315k was budgeted as Capital Grant but is now correctly recognised as an Operating Grant.
Capital grants and contributions
Joint ventures and associates - net profits
---------- Variance* ----------
2%
F
2016
F
2016
101 24%
25,273
10,518 10,755
Actual
237
425
2016
0%
F
81
526
25,354
Budget
140
10%4,432
167
F
1,920
0%
2,919
F
4,871 439
38%
F
2,119
8%
F
1,780
167 –
800

Financial Statements 2016
page 58
Mosman Council
Notes to the Financial Statements for the year ended 30 June 2016
Note 16. Material budget variations (continued)
$ ’000
EXPENSESEmployee benefits and on-costs
Borrowing costs$71k LIRS interest subsidy (Grant Income) net-budgeted as borrowing costs. This has been changed for 16/17budget.
Materials and contracts
Depreciation and amortisation
Other expensesUnbudgeted revaluation decrements have been recognised. $1,223k decrement to Community Land due to Valuer General reassessing values due to zoning. This physical character of the land has not changed and it use in servicedelivery is unchanged. $3,217 decrement to Investment Properties due to professional valuer reassessing impact of heritage listing on Bather's Pavilion and usage of Boronia site. Rental income and use of sites not affected
Joint ventures and associates – net losses
Budget variations relating to Council’s Cash Flow Statement include:
Cash flows from operating activitiesUnbudgeted net inflow of $1,024k from Bonds and Deposits. Grants and Contributions exceed budget by $1,062kfor reasons outlined above at Grant Income, Income Statement positive variance
Cash flows from investing activitiesThis is due to Council holding two $1M dollar term deposits at 30 June which are classified as investments ratherthan cash equivalent. Also Council's capital budget was increased during the year by revotes and quarterly reviews.
Cash flows from financing activities
5,387 U5,415
2016
F
(1%)(28)
---------- Variance* ----------
2%
(71)
10,914
(394)
353 16,874
Actual
U
(7.0%)
43.2%
(1,514)
(6,260) (2,707)
F0%
(5,186)
7,855 10,046
F(1,628)
U(8,967)
114
–
(91%)
– –
502
2016
431
13,897
Budget
17,227
2016
14,291
2,191
(3%)
F27.9%
U
(16%)
U
5,728

Financial Statements 2016
page 59
Mosman Council
Notes to the Financial Statements for the year ended 30 June 2016
Note 17. Statement of developer contributions
$ ’000
Council recovers contributions, raises levies and enters into planning agreements on development works that are subject to a development consent issued by Council.All contributions must be spent/utilised for the specific purpose they were levied and any interest applicable to unspent funds must be attributed to remaining funds.
The following tables detail the receipt, interest and use of the above contributions and levies and the value of all remaining funds which are ‘restricted’ in their future use.
SUMMARY OF CONTRIBUTIONS AND LEVIES
Open space
4,345 –
Total S94 revenue under plans
3,449
–
– 1,409
Held as
(622)
Internal
(68) –
Expenditureborrowing restricted(to)/from
during
(690) 109
–
109
–
4,345
4,345
–
–
assetin year–
–
Cash
3,517
3,517
(690)
earnedContributions
received during the yearInterest
yearNon-cash
–
109
– 68
Total contributions
S94 contributions – under a plan
PURPOSE Openingbalance
68 – –
–
–
1,409 S94A levies – under a plan
(68)
1,409
–
– –
–
–
Cumulative internal
borrowings due/(payable)

Financial Statements 2016
page 60
Mosman Council
Notes to the Financial Statements for the year ended 30 June 2016
Note 17. Statement of developer contributions (continued)
$ ’000
S94 CONTRIBUTIONS – UNDER A PLAN
CONTRIBUTION PLAN
Open space
S94A LEVIES – UNDER A PLAN
CONTRIBUTION PLAN - OPEN SPACE & CAR PARKING
Open space
–
assetrestricted
Internal Held as
– –
(68) – –
–
Non-cash68
Cash
– 68 Total
4,345 4,345
(to)/fromborrowing restricted
Held as
assetduringearned
InternalExpenditure
yearduring
–
Interest
in year(68)
borrowingExpenditure
(to)/from–
Opening received during the year
–
earnedPURPOSEContributions
balance
received during the year
1,409
Opening
Total
balancePURPOSE
Non-cash3,449
yearin year
Contributions
Cash
Interest
(622) 1,409 – (622)
3,449 109 – – – 109
– –
– –
Cumulative internal
borrowings due/(payable)
Cumulative internal
borrowings due/(payable)

Financial Statements 2016
page 61
Mosman Council
Notes to the Financial Statements for the year ended 30 June 2016
Note 18. Contingencies and other assets/liabilities not recognised
$ ’000
The following assets and liabilities do not qualify for (ii) Statewide Limitedrecognition in the Statement of Financial Position, buttheir knowledge and disclosure is considered relevant Council is a member of Statewide Mutual, a mutualto the users of Council’s financial report. pool scheme providing liability insurance to local
government.
LIABILITIES NOT RECOGNISED: Membership includes the potential to share in eitherthe net assets or liabilities of the fund depending on
1. Guarantees its past performance. Council’s share of the netassets or liabilities reflects Council’s contributions to
(i) Defined benefit superannuation the pool and the result of insurance claims within contribution plans each of the fund years.
Council participates in an employer-sponsored The future realisation and finalisation of claimsdefined benefit superannuation scheme, and makes incurred but not reported to 30/6 this year may resultcontributions as determined by the superannuation in future liabilities or benefits as a result of pastscheme’s trustees. events that Council will be required to fund or share
in respectively.Member councils bear responsibility of ensuring thereare sufficient funds available to pay out the required (iii) StateCover Limitedbenefits as they fall due.
Council is a member of StateCover Mutual LimitedThe schemes most recent full actuarial review and holds a partly paid share in the entity.indicated that the net assets of the scheme werenot sufficient to meet the accrued benefits of the StateCover is a company providing workersschemes defined benefit member category with compensation insurance cover to the NSW localmember councils required to make significantly government industry and specifically Council.higher contributions in future years.
Council has a contingent liability to contribute furtherThe Local Government Superannuation Scheme equity in the event of the erosion of the company’showever is unable to provide Council with an accurate capital base as a result of the company’s pastestimate of its share of the net deficit and accordingly performance and/or claims experience or as a resultCouncil has not recorded any net liability from it’s of any increased prudential requirements from APRA.defined benefit scheme obligations in accordancewith AASB 119. These future equity contributions would be required
to maintain the company’s minimum level of netFuture contributions made to the defined benefit assets in accordance with its licence requirements.scheme to rectify the net deficit position will berecognised as an expense when they become (iv) Other guaranteespayable – similar to the accounting for definedcontributions plans. Council has provided no other guarantees other than
those listed above.

Financial Statements 2016
page 62
Mosman Council
Notes to the Financial Statements for the year ended 30 June 2016
Note 18. Contingencies and other assets/liabilities not recognised (continued)
$ ’000
LIABILITIES NOT RECOGNISED (continued): ASSETS NOT RECOGNISED:
2. Other liabilities (i) Land under roads
(i) Third party claims As permitted under AASB 1051, Council has electednot to bring to account land under roads that it
The Council is involved from time to time in various owned or controlled up to and including 30/6/08.claims incidental to the ordinary course of businessincluding claims for damages relating to its services.
Council believes that it is appropriately coveredfor all claims through its insurance coverage anddoes not expect any material liabilities to eventuate.
(ii) S94 plans
Council levies section 94/94A contributions uponvarious development across the Council area throughthe required contributions plans.
As part of these plans, Council has received fundsfor which it will be required to expend the monies inaccordance with those plans.
As well, these plans indicate proposed futureexpenditure to be undertaken by Council, which willbe funded by making levies and receipting funds infuture years or where a shortfall exists by the use ofCouncil’s general funds.
These future expenses do not yet qualify as liabilitiesas of the reporting date, but represent Council’sintention to spend funds in the manner and timingset out in those plans.
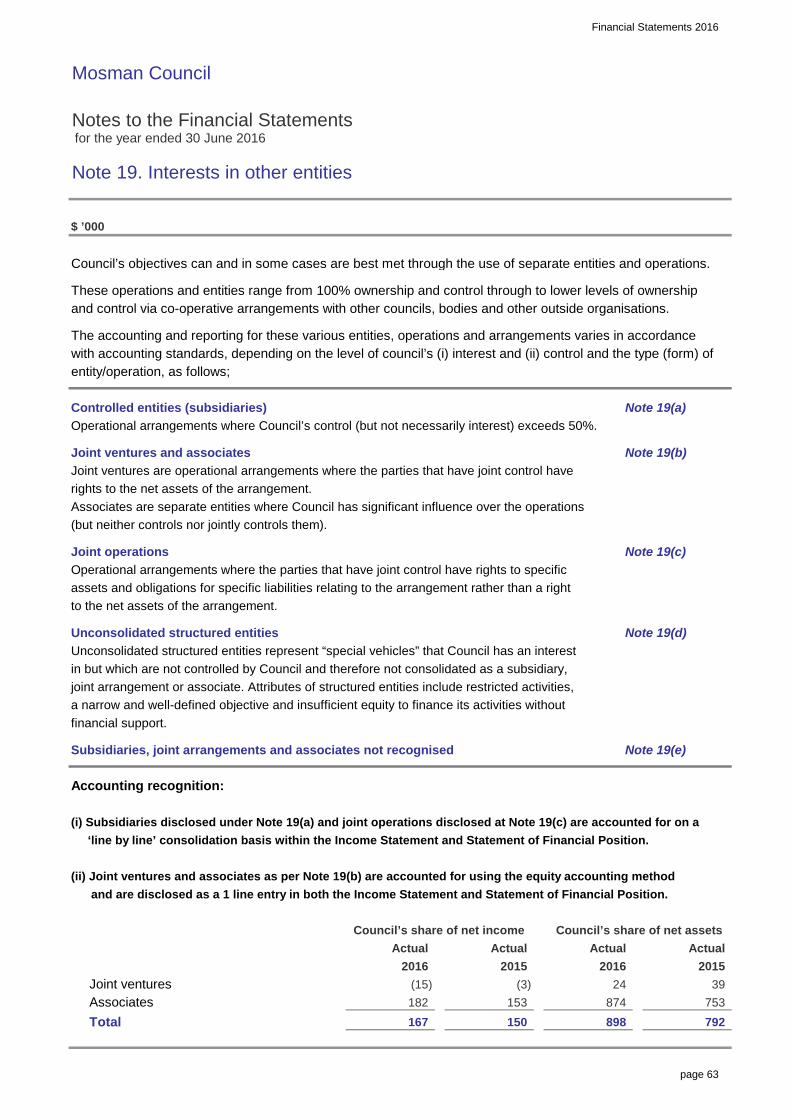
Financial Statements 2016
page 63
Mosman Council
Notes to the Financial Statements for the year ended 30 June 2016
Note 19. Interests in other entities
$ ’000
Council’s objectives can and in some cases are best met through the use of separate entities and operations.
These operations and entities range from 100% ownership and control through to lower levels of ownershipand control via co-operative arrangements with other councils, bodies and other outside organisations.
The accounting and reporting for these various entities, operations and arrangements varies in accordancewith accounting standards, depending on the level of council’s (i) interest and (ii) control and the type (form) ofentity/operation, as follows;
Controlled entities (subsidiaries) Note 19(a)Operational arrangements where Council’s control (but not necessarily interest) exceeds 50%.
Joint ventures and associates Note 19(b)Joint ventures are operational arrangements where the parties that have joint control haverights to the net assets of the arrangement.Associates are separate entities where Council has significant influence over the operations(but neither controls nor jointly controls them).
Joint operations Note 19(c)Operational arrangements where the parties that have joint control have rights to specificassets and obligations for specific liabilities relating to the arrangement rather than a rightto the net assets of the arrangement.
Unconsolidated structured entities Note 19(d)Unconsolidated structured entities represent “special vehicles” that Council has an interestin but which are not controlled by Council and therefore not consolidated as a subsidiary,joint arrangement or associate. Attributes of structured entities include restricted activities,a narrow and well-defined objective and insufficient equity to finance its activities withoutfinancial support.
Subsidiaries, joint arrangements and associates not recognised Note 19(e)
Accounting recognition:
(i) Subsidiaries disclosed under Note 19(a) and joint operations disclosed at Note 19(c) are accounted for on a ‘line by line’ consolidation basis within the Income Statement and Statement of Financial Position.
(ii) Joint ventures and associates as per Note 19(b) are accounted for using the equity accounting method and are disclosed as a 1 line entry in both the Income Statement and Statement of Financial Position.
Joint venturesAssociatesTotal 898
2015 2016
167
2016
153 874
Actual
(15)
Council’s share of net income
24
Actual
150
201539
Council’s share of net assets
753 792
Actual Actual
182 (3)
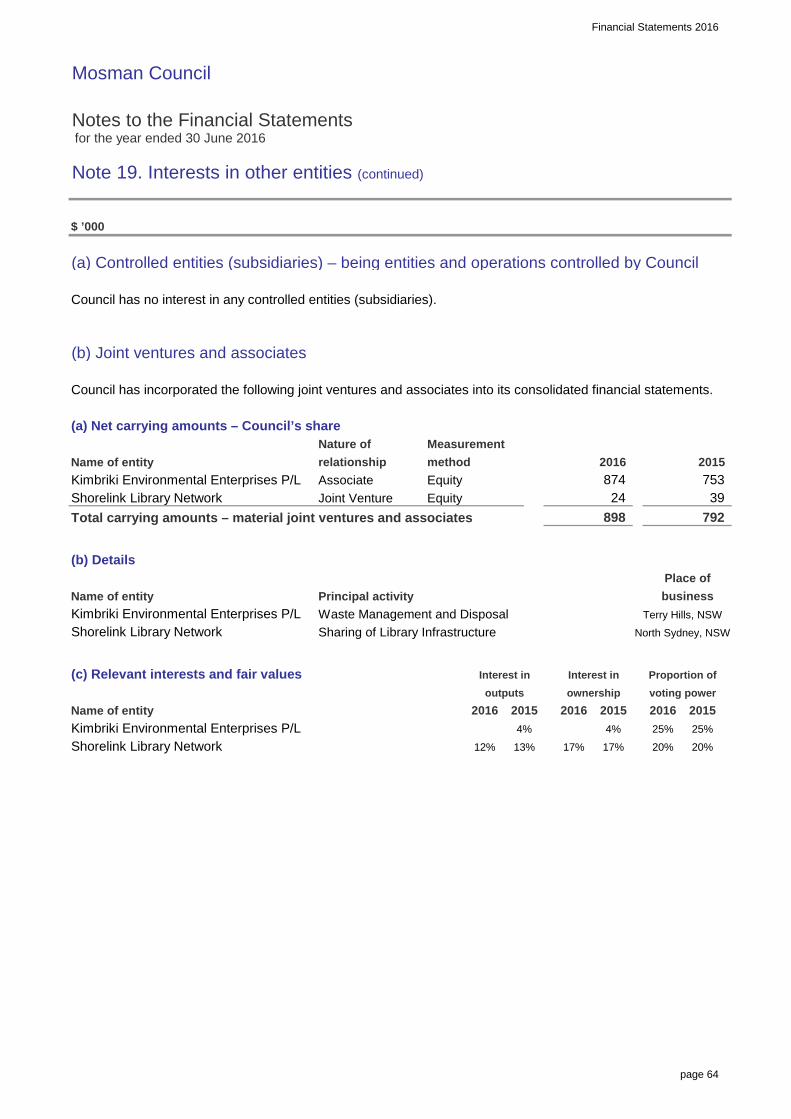
Financial Statements 2016
page 64
Mosman Council
Notes to the Financial Statements for the year ended 30 June 2016
Note 19. Interests in other entities (continued)
$ ’000
(a) Controlled entities (subsidiaries) – being entities and operations controlled by Council
Council has no interest in any controlled entities (subsidiaries).
(b) Joint ventures and associates
Council has incorporated the following joint ventures and associates into its consolidated financial statements.
(a) Net carrying amounts – Council’s share
Name of entityKimbriki Environmental Enterprises P/LShorelink Library NetworkTotal carrying amounts – material joint ventures and associates
(b) Details
Name of entity Principal activityWaste Management and DisposalSharing of Library Infrastructure
(c) Relevant interests and fair values
Name of entityKimbriki Environmental Enterprises P/LShorelink Library Network
2015method
fair value2016
Joint Venture
Place of
Interest inownership
20%13% 17%
25%
outputsInterest in
874 Equity
2016753 39 24
25%4%
relationship
20152016voting power
17%
Associate
20%
Terry Hills, NSW
North Sydney, NSW
2015 20154%
2015
Proportion of
business
12%
792
2016 2016
Measurement
Equity
898
Quoted
Nature of
Kimbriki Environmental Enterprises P/LShorelink Library Network

Financial Statements 2016
page 65
Mosman Council
Notes to the Financial Statements for the year ended 30 June 2016
Note 19. Interests in other entities (continued)
$ ’000
(b) Joint ventures and associates (continued)
(d) Summarised financial information for joint ventures and associates
Statement of financial positionCurrent assetsCash and cash equivalentsOther current assetsTotal current assetsNon-current assets
Current liabilitiesOther current liabilitiesTotal current liabilitiesNon-current liabilities
Net assets
Reconciliation of the carrying amountOpening net assets (1 July)Profit/(loss) for the periodDividends paidClosing net assets
Council’s share of net assets (%)Council’s share of net assets ($)
Statement of comprehensive incomeIncomeInterest incomeDepreciation and amortisationOther expensesProfit/(loss) for period
Total comprehensive income
Share of income – Council (%)Profit/(loss) – Council ($)Profit/(loss) due to change interest in outputs Total comprehensive income – Council ($)
Dividends received by Council
(5)
139
16,432
3.8% 17.1%
19,611
(708)
251
182 153
296 – –
6,879
4,403 1,729
(15)
11.9% 13.0%153 (10)
31,584 615 608
3,983
3,983
36,672
22,761
87
17,730
6
17.0%
229
(88) (22)
229
(3)
3.8%
2016
(3)
61 31 – –
4,743
– – –
(88)
20152016
15 220 22,133
5,307
296
Kimbriki Environmental Enterprises P/L
(515) 5 –
220
2015
(31,798) (27,549)
4,743
182 3.8%
(613) (458) – (17)
139
6,879 5,307 87 82
– 82
7,265
Shorelink Library Network
19,611 22,761
14,708 19,149 17,420
–
19,611
3.8%
384 406
874 753 24 39
4,217 4,480
229
4,743 3,983 (90) (22) (1,593) (804) – –
(22)

Financial Statements 2016
page 66
Mosman Council
Notes to the Financial Statements for the year ended 30 June 2016
Note 19. Interests in other entities (continued)
$ ’000
(b) Joint ventures and associates (continued)
(e) The nature and extent of significant restrictions relating to joint ventures and associates
Council has no day to day access to cash or investments of either entity. Council, as a shareholder, participates in cash dividends as declared by Kimbriki's Board. All interactions with Kimbriki P/L are regulated by the Kimbriki Shareholder Agreement
Shorelink is a committee formed under Section 355 of the Local Government Act NSW 1993. Interactions aregoverned by a deed of agreement. Shorelink does not generate positive cash flows and relies on annual cash contributions from member Councils
(c) Joint operations
Council has no interest in any joint operations.
(d) Unconsolidated structured entities
Council has no unconsolidated structured entities
(e) Subsidiaries, joint arrangements and associates not recognised
All subsidiaries, joint arrangements and associates have been recognised in this financial report.

Financial Statements 2016
page 67
Mosman Council
Notes to the Financial Statements for the year ended 30 June 2016
Note 20. Retained earnings, revaluation reserves, changes in accounting policies, changes in accounting estimates and errors
$ ’000
(a) Retained earnings
Movements in retained earnings were as follows:Balance at beginning of year (from previous years audited accounts)a. Net operating result for the yearBalance at end of the reporting period
(b) Revaluation reserves
(i) Reserves are represented by:
– Infrastructure, property, plant and equipment revaluation reserveTotal
(ii) Reconciliation of movements in reserves:
Infrastructure, property, plant and equipment revaluation reserve– Opening balance– Revaluations for the year– Balance at end of yearTOTAL VALUE OF RESERVES
(iii) Nature and purpose of reserves
Infrastructure, property, plant and equipment revaluation reserve– The infrastructure, property, plant and equipment revaluation reserve is used to record increments/decrement of non-current asset values due to their revaluation.
(c) Correction of error/s relating to a previous reporting period
Council made no correction of errors during the current reporting period.
(d) Voluntary changes in accounting policies
Council changed the valuation method for Community Land in the current reporting period. Prior valuations reliedheavily on a calculated $/sqm figure for parcels with no Valuer General rating valuation. The Valuer General subsequently issued values for most of these parcels and these have replaced $/sqm calculations. The effect is a $40,529k reduction in the measured values. As Council can not deal in this land (it is Crown Land)and the land's characteristics remain unchanged there is no real effect on Council's financial sustainibilty or service delivery.
In accordance with AASB 108 – Accounting Policies, Changes inAccounting Estimates and Errors, the above changes inaccounting policy have been recognised retrospectively.
These amounted to the following equity adjustments:
– Adjustments to opening equity – 1/7/15 (relating to adjustments for the 30/6/14 reporting year end and prior periods)Total prior period adjustments – accounting policy changes
2016 2015
–
220,349 211,951
(40,529)
(40,529) –
2015
211,951
254,006
296,019
749
Actual
290,803
211,951
5,216 (1,484)
Notes 2016Actual
220,349
220,349
220,349 211,951
255,490
211,202 8,398 9(a)
211,951
Financial Statements 2016
page 68
Mosman Council
Notes to the Financial Statements for the year ended 30 June 2016
Note 21. Financial result and financial position by fund
$ ’000
Council utilises only a general fund for its operations.
Note 22. ‘Held for sale’ non-current assets and disposal groups
Council did not classify any non-current assets or disposal groups as ‘held for sale’.
Note 23. Events occurring after the reporting date
Events that occur between the end of the reporting period (30 June 2016) and the date when the financialstatements are ‘authorised for issue’ have been taken into account in preparing these statements.
Council has adopted the date of receipt of the Auditors’ Report as the applicable ‘authorised for issue’ daterelating to these General Purpose Financial Statements.
Accordingly, the ‘authorised for issue’ date is 09/09/16.
Events that occur after the reporting period represent one of two types:
(i) Events that provide evidence of conditions that existed at the reporting period
These financial statements (and the figures therein) incorporate all ‘adjusting events’ that provided evidence ofconditions that existed at 30 June 2016.
(ii) Events that provide evidence of conditions that arose after the reporting period
These financial statements (and figures therein) do not incorporate any ‘non-adjusting events’ that have occurredafter 30 June 2016 and which are only indicative of conditions that arose after 30 June 2016.
Council is unaware of any material or significant ‘non-adjusting events’ that should be disclosed.
Note 24. Discontinued operations
Council has not classified any of its operations as ‘discontinued’.

Financial Statements 2016
page 69
Mosman Council
Notes to the Financial Statements for the year ended 30 June 2016
Note 25. Intangible assets
$ ’000
Intangible assets represent identifiable non-monetary assets without physical substance.
Intangible assets are as follows:
Opening values:Gross book value (1/7)
Accumulated amortisation (1/7)
Accumulated impairment (1/7)
Net book value – opening balance
Movements for the year– Amortisation charges
Closing values:Gross book value (30/6)
Accumulated amortisation (30/6)
Accumulated impairment (30/6)
TOTAL INTANGIBLE ASSETS – NET BOOK VALUE 1
1. The net book value of intangible assets represent:
– Rights to participate in Kimbriki Environmental Enterprises Pty Ltd.
Note 26. Reinstatement, rehabilitation and restoration liabilities
Council has no outstanding obligations to make, restore, rehabilitate or reinstate any of its assets/operations.
2015
392
314
(78) – –
298
(94)
Actual Actual 2016
392
282
282
298
(94)
(16)
392
(16)
(110)
282
–
298
392
–
298

Financial Statements 2016
page 70
Mosman Council
Notes to the Financial Statements for the year ended 30 June 2016
Note 27. Fair value measurement
$ ’000
The Council measures the following asset and liability classes at fair value on a recurring basis:
– Infrastructure, property, plant and equipment– Investment property
The fair value of assets and liabilities must be estimated in accordance with various accounting standards foreither recognition and measurement requirements or for disclosure purposes.
AASB 13 Fair Value Measurement requires all assets and liabilities measured at fair value to be assigned to a‘level’ in the fair value hierarchy as follows:
Level 1: Unadjusted quoted prices in active markets for identical assets or liabilities that the entity can access at the measurement date.
Level 2: Inputs other than quoted prices included within level 1 that are observable for the asset or liability, either directly or indirectly.
Level 3: Inputs for the asset or liability that are not based on observable market data (unobservable inputs).
(1) The following table presents all assets and liabilities that have been measured and recognised at fair values:
2016
Recurring fair value measurements
Investment propertiesRetail, commercial office and residentialTotal investment properties
Infrastructure, property, plant and equipmentPlant and equiptmentOffice equipmentFurniture and fittingsArt collectionOperational landCommunity landLand improvements – depreciableBuildings non-specialisedBuildings specialisedRoadsFootpathsStormwater drainageOther open space/recreational assetsHeritage collectionsLibrary booksOther assetsTotal infrastructure, property, plant and equipment
30/06/13 – –
30/06/16 – – 30,132 30,132
30/06/13 – – 14,575 14,575 30/06/15 – – 117,230 117,230
50,269 30/06/15 – – 11,878 11,878 30/06/13 – – 50,269
30/06/16 – – 5,218 5,218 30/06/13 – – 113,024 113,024 30/06/16 – – 60,659 60,659
30/06/16
30/06/16 – – 629 629
30/06/16 – – 111 111
– – 44,963 44,963
Level 3 TotalFair value measurement hierarchy
27,774
Significant
– 245
inputs
– – 433,558
27,774
– 47 47 433,558
inputsunobservableprices in observable
Date Quoted SignificantLevel 1 Level 2
– – 30/06/16 – 30/06/16 806 806 30/06/16 – – 13 13
– 245
30/06/16 – – 44,963 44,963
30/06/16 – – 948 948
valuation active mktsof latest
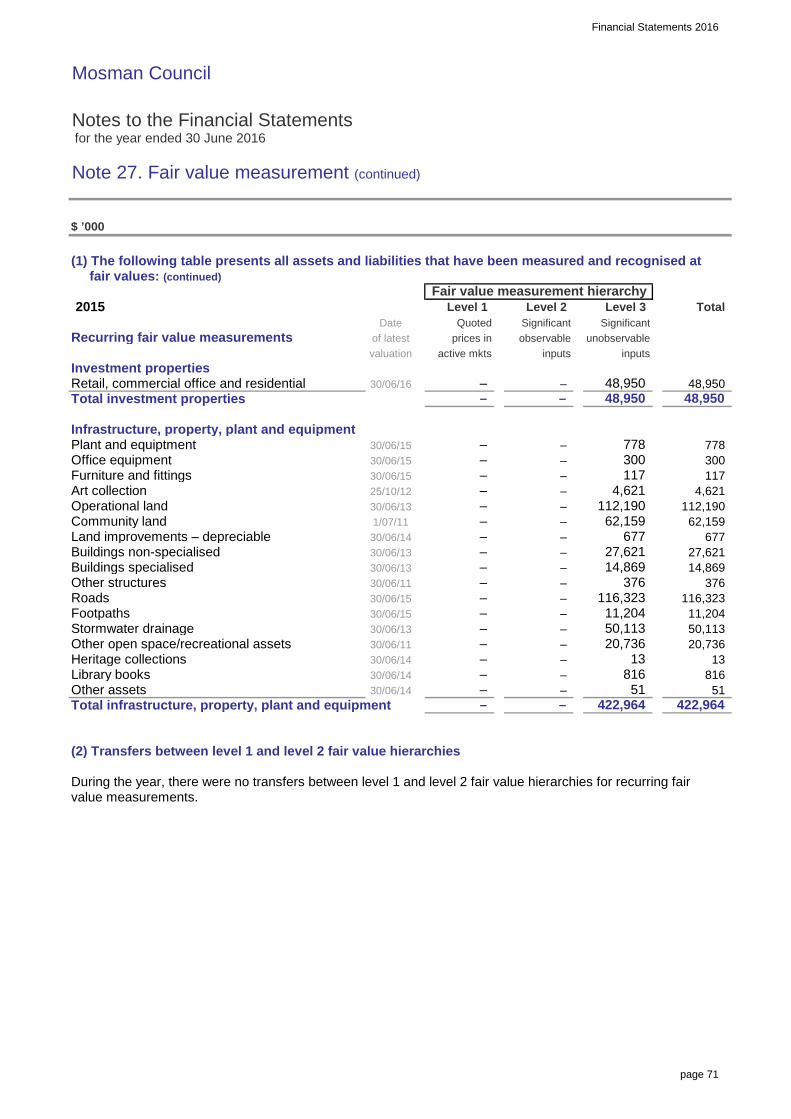
Financial Statements 2016
page 71
Mosman Council
Notes to the Financial Statements for the year ended 30 June 2016
Note 27. Fair value measurement (continued)
$ ’000
(1) The following table presents all assets and liabilities that have been measured and recognised at fair values: (continued)
2015
Recurring fair value measurements
Investment propertiesRetail, commercial office and residentialTotal investment properties
Infrastructure, property, plant and equipmentPlant and equiptmentOffice equipmentFurniture and fittingsArt collectionOperational landCommunity landLand improvements – depreciableBuildings non-specialisedBuildings specialisedOther structuresRoadsFootpathsStormwater drainageOther open space/recreational assetsHeritage collectionsLibrary booksOther assetsTotal infrastructure, property, plant and equipment
(2) Transfers between level 1 and level 2 fair value hierarchies
During the year, there were no transfers between level 1 and level 2 fair value hierarchies for recurring fairvalue measurements.
SignificantDate Quoted Significantof latest prices in observablevaluation active mkts
Level 1 Level 2
– 300 300 30/06/15 – – 117 117 25/10/12
unobservableinputs inputs
– 51 51 –
– – 778 778
422,964
30/06/16– – 48,950 48,950
30/06/1530/06/15 –
– – 4,621
Fair value measurement hierarchy
– – 48,950 48,950
Level 3 Total
4,621 30/06/13 – – 112,190 112,190 1/07/11 – – 62,159 62,159 30/06/14 – – 677 677 30/06/13 – – 27,621 27,621 30/06/13 – – 14,869 14,869 30/06/11 – – 376 376 30/06/15 – – 116,323 116,323 30/06/15 – – 11,204 11,204 30/06/13 – – 50,113 50,113 30/06/11 – – 20,736 20,736
– 422,964
– 13 13
30/06/14 – 30/06/14 – – 816 816 30/06/14 –

Financial Statements 2016_
Mosman Council Notes to the Financial Statements for the year ended 30 June 2016 Note 27. Fair value measurement (continued)
page 72
(3) Valuation techniques used to derive Level 2 and Level 3 Fair Values Where Council is unable to derive Fair Valuations using quoted market prices of identical assets (i.e. Level 1 inputs), Council instead utilises a spread of both observable inputs (Level 2 inputs) and unobservable inputs (Level 3 inputs). For all infrastructure assets Council uses a straight line pattern of consumption and brownfield approach. The Fair Valuation techniques Council has employed while utilising Level 2 and Level 3 inputs are as follows: Investment Properties Council obtains independent valuations of its investment property on an annual basis and at the end of each reporting period to ensure the financial statements reflect the most up-to-date valuation. The best evidence of fair value is the current price in an active market for similar assets. The key observable inputs to the valuation are:
• Current rental incomes, • Rent reviews, • Capitalisation rates, • Price per square meter, • Direct comparison to sales evidence, • Zoning, • Location, • Land area and configuration, and • Planning controls. The assessment of the independent valuer is that the potential impact on value, due to unobservable market inputs, is considered to be 5%. The fair value of the investment property is determined by an independent, qualified valuer on an annual basis who has experience in the location of the property. The Council reviews the valuation report and discusses significant movements with the valuer. As at 30 June 2016 the valuation of the investment property was performed by Scott Fullarton Valuations Pty Ltd, Director Scott Fullarton, FAPI, Certified Practicing Valuer, Registered Valuer No. 2144. There has been no change in the valuation process during the reporting period. Infrastructure, Property, Plant & Equipment Plant and Equipment, Office Equipment and Furniture and Fittings. Plant and Equipment, Office Equipment and Furniture and Fittings are valued at cost but are disclosed at fair value in the notes. The carrying amount of these assets is assumed to approximate fair value due to the nature of the items. Examples of assets within these classes are as follows:
• Plant and Equipment: Motor vehicles, depot tools and machinery, parking meters and domestic waste service bins.
• Office Equipment: Computer Hardware. • Furniture and Fittings: Chairs, desks and display systems.
The key unobservable input to the valuation is the remaining useful life. Council reviews the value of these assets against quoted prices for the gross current replacement cost of similar assets and by taking account of

Financial Statements 2016_
Mosman Council Notes to the Financial Statements for the year ended 30 June 2016 Note 27. Fair value measurement (continued)
page 73
the pattern of consumption and estimated remaining useful life. There has been no change to the valuation process during the reporting period. Art Collection This class comprises Council’s collection of art works. The collection was valued in June 2016 by Stella Downer Fine Art. Stella Downer is a member of the Australian Commercial Galleries association and is approved by the Department of Prime Minister and Cabinet’s Cultural Gifts Program to value art works. While it is possible to observe the broad market for works (such as auction house results or retrospective exhibitions) the valuations depend significantly on unobservable inputs such as the aesthetic value and quality of the individual works and its significance in the individual artist’s oeuvre. Operational Land This asset class comprises all of Council's land classified as Operational Land under the NSW Local Government Act 1993. The key unobservable input to the valuation is the price per square metre. The last valuation was undertaken at 30 June 2013 and was performed by Scott Fullarton Valuations Pty Ltd, Director Scott Fullarton, FAPI, Certified Practicing Valuer, Registered Valuer No. 2144. Generally, fair value is the most advantageous price reasonably obtainable by the seller and the most advantageous price reasonably obtained by the buyer. This is not necessarily the market selling price of the asset, rather, it is regarded as the maximum value that Council would rationally pay to acquire the asset if it did not hold it, taking into account quoted market price in an active and liquid market, the current market price of the same or similar asset, the cost of replacing the asset, if management intend to replace the asset, the remaining useful life and condition of the asset; and cash flows from the future use and disposal. There has been no change to the valuation process during the reporting period. Community Land Valuations of all Council's Community Land and Council managed land are based on either the land value provided by the Valuer-General or an average unit rate based on the land value for similar properties where the Valuer-General did not provide a land value having regard to the highest and best use for this land. As these rates were not considered to be observable market evidence they have been classified as Level 3. When this method was first employed for the 2010/11 Financial Statements the Valuer General had not issued values on the majority of the Community Land class. The Valuer General has subsequently issued values for most of this land at amounts significantly less than the unit rate previously estimated. There has therefore been a significant decrement to this asset class. Land Improvements – Depreciable This asset class largely comprises trees, plantings and landscaping not captured in the Open Space and Recreational Assets class. These assets may be located on parks, reserves and also within road reserves. These assets are valued at cost but are disclosed at fair value in the notes. The carrying amount of these assets is assumed to approximate fair value due to the nature of the items. Council reviews the value of these assets against quoted prices for the gross current replacement cost of similar assets and by taking account of estimated remaining useful life. There has been no change to the valuation process during the reporting period.

Financial Statements 2016_
Mosman Council Notes to the Financial Statements for the year ended 30 June 2016 Note 27. Fair value measurement (continued)
page 74
Buildings: Non-Specialised and Specialised Buildings were valued by Scott Fullarton Valuations Pty Ltd in June 2013 using the cost approach. The approach estimated the replacement cost for each building by componentising the buildings into significant parts with different useful lives and taking into account a range of factors. While all buildings were physically inspected and the unit rates based on square metres could be supported from market evidence (Level 2) other inputs (such as estimates of pattern of consumption) required extensive professional judgement and impacted significantly on the final determination of fair value. Inputs include:
• Gross replacement cost, • A breakdown of building component costs (such as structure, equipment, fittings and finishes), • Useful lives,and • Conditions
As such these assets were classified as having been valued using Level 3 valuation inputs. There has been no change to the valuation process during the reporting period. Typical useful lives and unit rates (includes overheads):
Buildings Asset Component Average Useful Life
(Years)
Average Unit Rate
Amenities/Public Toilets – Structure 78 $110,323/each Council Offices – Structure 95 $5,490,030/each Amenities/Public Toilets – Roof 50 $40,509/each Childcare Centres – Roof 47 $97,600/each Multistorey Carparks – Services 20 $1,032,200/each Community and Cultural Centres – Fixtures and Fittings
20 $249,709/each
Public Roads, Footpaths and Carparks Includes: Road pavements and formations, steps, footpaths, pram ramps and vehicle crossings, retaining walls and kerb and gutter, physical traffic devices, lines and signs and street furniture and road related carparks. Gross replacement cost for Mosman road assets were valued by Complete Urban Pty Ltd as at 30 June 2010. The condition and useful lives of the assets were assessed and calculated by Complete Urban based on site observations. An initial generic infrastructure deterioration profile was developed from limited available asset data and relevant asset management/industry information and was used to assess the rate of deterioration, remaining useful life and renewal intervention of Mosman road assets. The profile was based on the assumption that infrastructure assets generally deteriorate slightly more rapidly in its initial years after construction, with deterioration becoming reasonably constant over its mid-life, and finally deteriorating reasonably rapidly in the latter period of its life. Unit rate costs for various brownfield construction works to provide asset components were estimated based Council's Civil Works contract current at that time.

Financial Statements 2016_
Mosman Council Notes to the Financial Statements for the year ended 30 June 2016 Note 27. Fair value measurement (continued)
page 75
Fair values have been generated every subsequent financial year based on the cost approach, 'straight line' pattern of consumption and the gross replacement cost calculated by Complete Urban, with the exception of the following changes in the valuation process: Assets identified by Complete Urban as requiring priority renewal were inspected by Council staff in 2012 and 2013 to verify accuracy of remaining life estimates. Useful lives were reevaluated based on site observations and professional engineering judgment. Unit rates were refined in 2012 using Council's updated Civil Works contract so as to reflect market rates current at the time, For the reporting period of 2011/12, a 1% per annum depreciation was applied across all road assets. This was endorsed by the Asset Management Reference Group and Council Audit Committee. In this reporting period, condition inspections were carried out on the following road asset types to verify asset remaining useful life:
• Road Pavements • Footpaths and Steps • Kerb and Gutter • Retaining Walls • Street Furniture • Physical Traffic Devices • Lines and Signs
Further the unit rates where applicable for roads assets were also updated to reflect the new 2015 ‘SHOROC – Minor Capital Works’ Contract. This process was peered reviewed and endorsed by AMCL Pty Ltd and resulted in some of the useful life values being updated to reflect current asset performance. Typical useful lives and unit rates (includes overheads):
Public Road and Footpath Asset Component Useful Life (Years)
Unit Rate
Concrete Road Pavement (Reinforced 200mm thick)
120 $181.00/m2
Asphalt Road Pavement 50 $82.00/m2 Sandstone Kerb & Gutter 100 $295/m Concrete Roundabout 40 $360/m2 Gabion Retaining Wall 150 630/m2 Double Barrier Line 5 $0.72/m ‘Warning’ Traffic Sign 25 $141.75/ each Concrete Footpath (75 mm thick) 95 $73.90/m2 Asphalt Footpath (25 mm thick) 40 $36.58/m2
Carpark Asset Component Useful Life
(Years) Unit Rate
Lane and parking space line marking 5 $1.03/m Pay and Display 20 $8,600.00/each Kerb Wheelstops 15 $160.00/m

Financial Statements 2016_
Mosman Council Notes to the Financial Statements for the year ended 30 June 2016 Note 27. Fair value measurement (continued)
page 76
Stormwater Drainage Includes: Converters, headwalls, endwalls, pits and access-holes (collectively categorised as 'nodes'), pipes, culverts, drains, Stormwater Quality Improvement Devices (SQIDs) and rainwater re-use tanks. Gross replacement cost for stormwater drainage assets were valued by Cardno (NSW/ACT) Pty Ltd as at 30 June 2013. The condition and useful lives of the assets were assessed and calculated by Cardno based on site observations, including CCTV surveys, and Cardno's experience in valuation projects for various Australian water utilities. It has been assumed that relining would be the principle method of renewing pipes, rather than replacing the whole section as no collapsed or significantly deformed pipes were found during CCTV inspections. This new method of pipe renewal allows for the replacement costs of the pipes to be 'optimised' downwards SQID unit rates were developed based on first principles estimating and takes into account excavation, site establishment as well as the supply and installation costs. It also includes an additional 20% to the base unit rate to allow for 'normal' construction and installation overheads. Drains are also valued directly from first principles estimating. There is no single unit rate applied as each drain contains different dimensions. Fair value has been generated this financial year based on the cost approach and the gross replacement cost calculated by Cardno. In this reporting period, stormwater pipes were updated to reflect the requirements of AASB in regards to residual values.
Stormwater Drainage Asset Component Useful Life (Years)
Unit Rate
Stormwater Quality Improvement Devices (Model Type: Rocla Cleansall 1200)
100 $208,641.03/each
Concrete Pipe (375mm diameter, 0-1m length) based on trenching method
125 $439.92/m
Concrete Pipe (375mm diameter) based on relining method
125 $336/m
Converter (600mm length) 100 $734/each Kerb Inlet Pit (450mmx450mm, 1 m depth) 100 $1,546/each Rainwater Re-use Tank 80 Average
$624,739.00/each Other Open Space/Recreational Assets Includes:
• Jetties and seawalls (collectively categorised as 'marine assets'), • Parks, bushlands, reserves, playgrounds, unmade roads and sporting fields (collectively categorised
as 'parks and open space assets') Gross replacement cost for marine assets were valued by Opus International Consultants (NSW) Pty Ltd as at 30 June 2011, in accordance with accepted Australian Accounting Practices. The condition and useful lives of the assets were assessed and calculated by Opus personnel based on site observations, including diving inspections. In this reporting period, condition inspections were carried on all Marine Assets and the useful lives were updated to reflect current asset performance. The gross replacement costs were increased by CPI for the period 2011 - 2016.
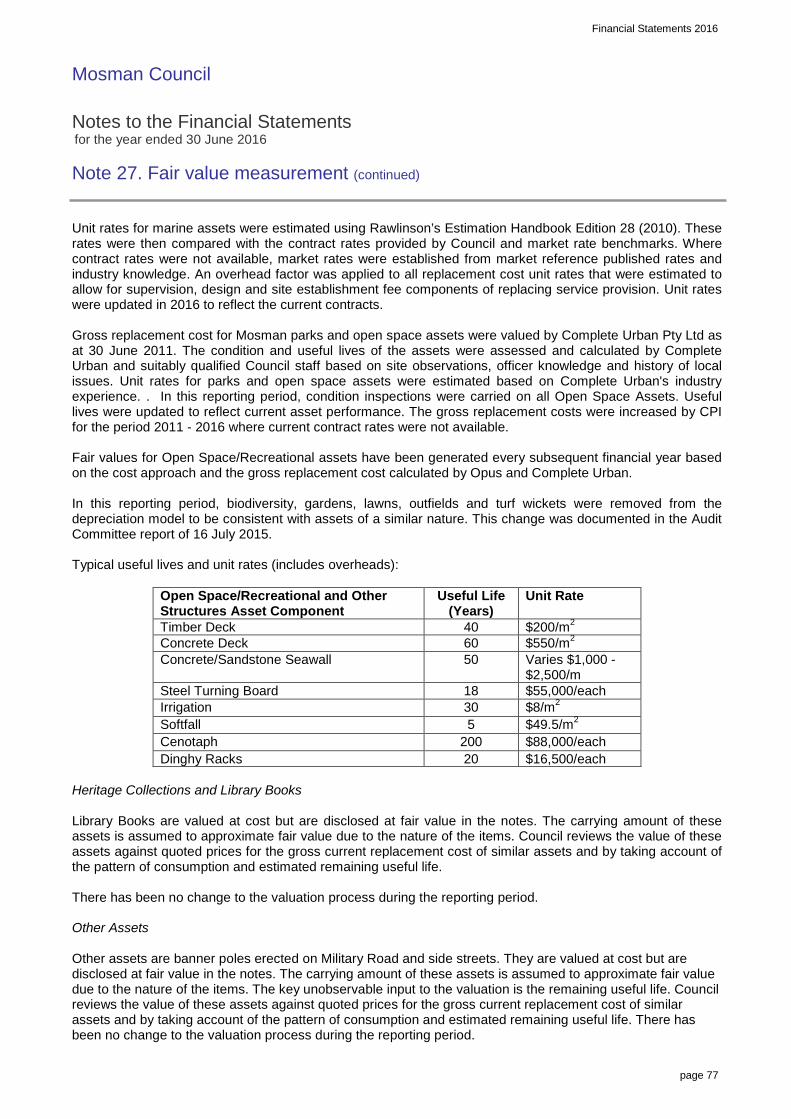
Financial Statements 2016_
Mosman Council Notes to the Financial Statements for the year ended 30 June 2016 Note 27. Fair value measurement (continued)
page 77
Unit rates for marine assets were estimated using Rawlinson’s Estimation Handbook Edition 28 (2010). These rates were then compared with the contract rates provided by Council and market rate benchmarks. Where contract rates were not available, market rates were established from market reference published rates and industry knowledge. An overhead factor was applied to all replacement cost unit rates that were estimated to allow for supervision, design and site establishment fee components of replacing service provision. Unit rates were updated in 2016 to reflect the current contracts. Gross replacement cost for Mosman parks and open space assets were valued by Complete Urban Pty Ltd as at 30 June 2011. The condition and useful lives of the assets were assessed and calculated by Complete Urban and suitably qualified Council staff based on site observations, officer knowledge and history of local issues. Unit rates for parks and open space assets were estimated based on Complete Urban's industry experience. . In this reporting period, condition inspections were carried on all Open Space Assets. Useful lives were updated to reflect current asset performance. The gross replacement costs were increased by CPI for the period 2011 - 2016 where current contract rates were not available. Fair values for Open Space/Recreational assets have been generated every subsequent financial year based on the cost approach and the gross replacement cost calculated by Opus and Complete Urban. In this reporting period, biodiversity, gardens, lawns, outfields and turf wickets were removed from the depreciation model to be consistent with assets of a similar nature. This change was documented in the Audit Committee report of 16 July 2015. Typical useful lives and unit rates (includes overheads):
Open Space/Recreational and Other Structures Asset Component
Useful Life (Years)
Unit Rate
Timber Deck 40 $200/m2 Concrete Deck 60 $550/m2 Concrete/Sandstone Seawall 50 Varies $1,000 -
$2,500/m Steel Turning Board 18 $55,000/each Irrigation 30 $8/m2 Softfall 5 $49.5/m2 Cenotaph 200 $88,000/each Dinghy Racks 20 $16,500/each
Heritage Collections and Library Books Library Books are valued at cost but are disclosed at fair value in the notes. The carrying amount of these assets is assumed to approximate fair value due to the nature of the items. Council reviews the value of these assets against quoted prices for the gross current replacement cost of similar assets and by taking account of the pattern of consumption and estimated remaining useful life. There has been no change to the valuation process during the reporting period. Other Assets Other assets are banner poles erected on Military Road and side streets. They are valued at cost but are disclosed at fair value in the notes. The carrying amount of these assets is assumed to approximate fair value due to the nature of the items. The key unobservable input to the valuation is the remaining useful life. Council reviews the value of these assets against quoted prices for the gross current replacement cost of similar assets and by taking account of the pattern of consumption and estimated remaining useful life. There has been no change to the valuation process during the reporting period.

Financial Statements 2016
page 78
Mosman Council
Notes to the Financial Statements for the year ended 30 June 2016
Note 27. Fair value measurement (continued)
$ ’000
(4). Fair value measurements using significant unobservable inputs (level 3)
a. The following tables present the changes in level 3 fair value asset classes.
Opening balance – 1/7/14
Purchases (GBV)Depreciation and impairmentOther movement (transfers from WIP)
Closing balance – 30/6/15
Purchases (GBV)Disposals (WDV)Depreciation and impairmentFV gains – Income Statement 1
Closing balance – 30/6/16
Opening balance – 1/7/14
Purchases (GBV)Disposals (WDV)Depreciation and impairmentOther movement (transfers from WIP)
Closing balance – 30/6/15
Transfers from/(to) another asset classPurchases (GBV)Depreciation and impairment
Closing balance – 30/6/16
948 245 111
Other movement (FV Decrements to Income Statment)
675
depreciable
– –
Total
(20)
fittings collection
(13)
–
629
–
–
27,774 202,086
677 27,621
– 46 454
Land
4,621
293
Total
– – (519) (7)
– 79 79
–
(496)
15
– –
Community
– (277)
113,024
778 5,816
– (357)
300
(132) (29)
23
117
specialised
211
776 (17)
500
landland
– (1,223) –
27,186
(17)
202,210 112,190 62,159
383 77
–
105 220 449
–
Operational -ments non-
186
(196)
and Office and ArtPlant Furniture
667 353 95 4,401 5,516
equipment
– (335) 47 77
– 186 (180) (130) (25)
equipment
(87)
(512)
681
(1,223)
60,659
834
–
112,190 62,159
– – – (20) –
5,218 6,522
improve- Buildings
202,647
859 874
(483)
– – – 304 304

Financial Statements 2016
page 79
Mosman Council
Notes to the Financial Statements for the year ended 30 June 2016
Note 27. Fair value measurement (continued)
$ ’000
(4). Fair value measurements using significant unobservable inputs (level 3) (continued)
a. The following tables present the changes in level 3 fair value asset classes. (continued)
Opening balance – 1/7/14
Purchases (GBV)Depreciation and impairmentFV gains – other comprehensive income
Closing balance – 30/6/15
Transfers from/(to) another asset classPurchases (GBV)Depreciation and impairment
Closing balance – 30/6/16
Opening balance – 1/7/14
Purchases (GBV)Depreciation and impairment
Closing balance – 30/6/15
Transfers from/(to) another asset classPurchases (GBV)Disposals (WDV)Depreciation and impairmentFV gains – other comprehensive income
Closing balance – 30/6/16
Opening balance – 1/7/14
Depreciation and impairment
Closing balance – 30/6/15
Depreciation and impairment
Closing balance – 30/6/16
(6) (2,424) (244)
(11)
50,269 30,132 13
72,216 21,228
376 116,323 11,204
2,289 303 2,662
(229) (370) 918
– – (4) (4) –
(246)
(284)
–
4,098 –
Total
–
space Heritage LibraryOther open
(2,958) 3,314
17
11,878 143,683
14,597
–
117,230
drainage recreational collections booksStormwater
142,772
specialised structures
382 112,103
– 4,267
70
15,080
13
528
class class class
14,869
14,575
236
(952) –
50,132
(281) (6)
843
(379) (896)
50,113
(2,336) (3,518) 749
Footpaths TotalOther
142,162
–
– (178) (2,801)
– 8,094 – – 8,094
20,736 13 816
(372)
71,678
(237) (1,561) – –
Otherhere here here assets Total
– – 55 55
(239)
RoadsBuildings
227
360 404 – 212 976 – (1,514)
81,220
– 792 – – 792
(11) – 1,473 –
806
2,228
– – – 51 51
– – – 47 47
(4) – – – (4)
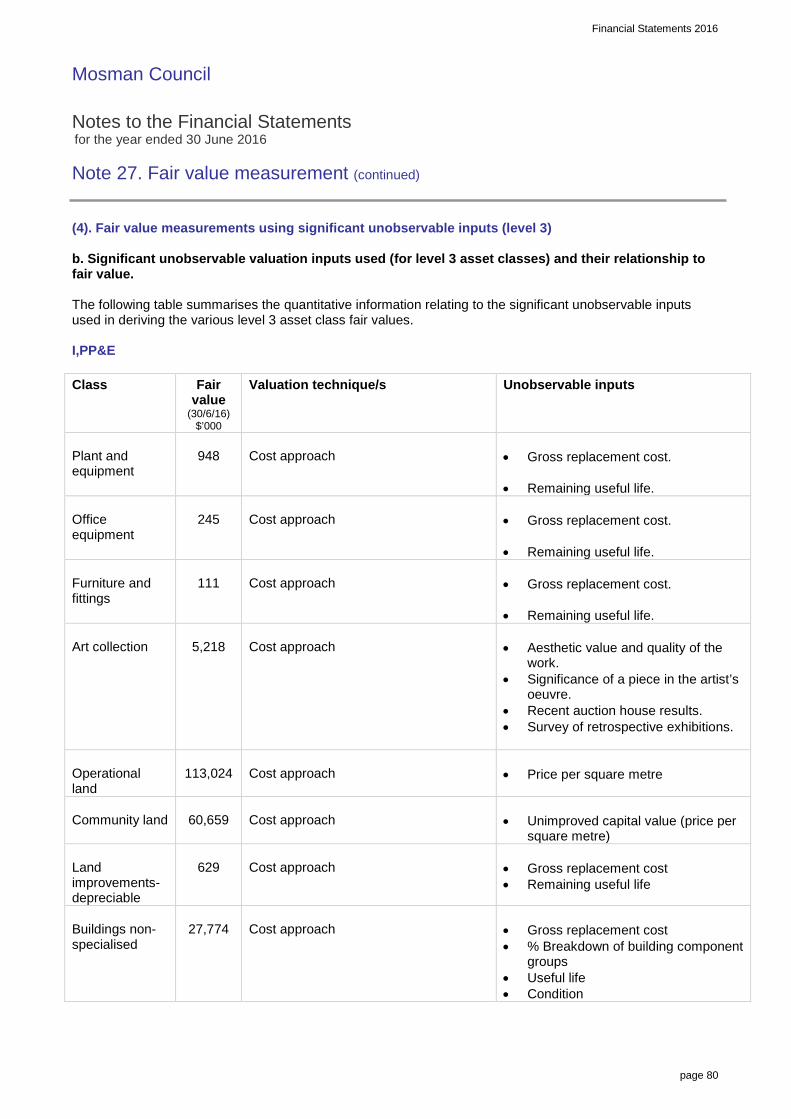
Financial Statements 2016_
Mosman Council Notes to the Financial Statements for the year ended 30 June 2016 Note 27. Fair value measurement (continued)
page 80
(4). Fair value measurements using significant unobservable inputs (level 3) b. Significant unobservable valuation inputs used (for level 3 asset classes) and their relationship to fair value. The following table summarises the quantitative information relating to the significant unobservable inputs used in deriving the various level 3 asset class fair values. I,PP&E
Class
Fair value
(30/6/16) $’000
Valuation technique/s
Unobservable inputs
Plant and equipment
948
Cost approach
• Gross replacement cost.
• Remaining useful life.
Office equipment
245
Cost approach
• Gross replacement cost.
• Remaining useful life.
Furniture and fittings
111
Cost approach
• Gross replacement cost.
• Remaining useful life.
Art collection
5,218
Cost approach
• Aesthetic value and quality of the
work. • Significance of a piece in the artist’s
oeuvre. • Recent auction house results. • Survey of retrospective exhibitions.
Operational land
113,024
Cost approach
• Price per square metre
Community land
60,659
Cost approach
• Unimproved capital value (price per
square metre) Land improvements- depreciable
629
Cost approach
• Gross replacement cost • Remaining useful life
Buildings non-specialised
27,774
Cost approach
• Gross replacement cost • % Breakdown of building component
groups • Useful life • Condition
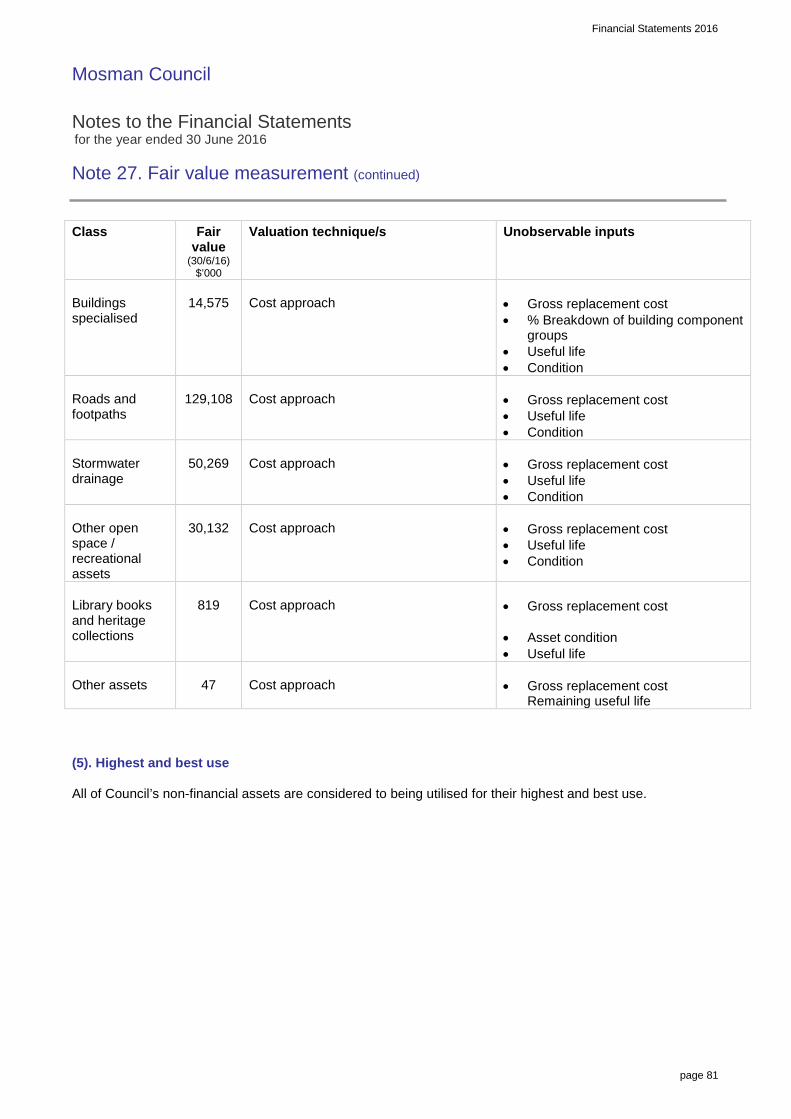
Financial Statements 2016_
Mosman Council Notes to the Financial Statements for the year ended 30 June 2016 Note 27. Fair value measurement (continued)
page 81
Class
Fair value
(30/6/16) $’000
Valuation technique/s
Unobservable inputs
Buildings specialised
14,575
Cost approach
• Gross replacement cost • % Breakdown of building component
groups • Useful life • Condition
Roads and footpaths
129,108
Cost approach
• Gross replacement cost • Useful life • Condition
Stormwater drainage
50,269
Cost approach
• Gross replacement cost • Useful life • Condition
Other open space / recreational assets
30,132
Cost approach
• Gross replacement cost • Useful life • Condition
Library books and heritage collections
819
Cost approach
• Gross replacement cost
• Asset condition • Useful life
Other assets
47
Cost approach
• Gross replacement cost
Remaining useful life (5). Highest and best use All of Council’s non-financial assets are considered to being utilised for their highest and best use.

Financial Statements 2016
page 82
Mosman Council
Notes to the Financial Statements for the year ended 30 June 2016
Note 28. Council information and contact details
Principal place of business:Civic CentreMosman Square, Spit Junction, 2088
Contact detailsMailing address: Opening hours:PO Box 211 Monday to Friday 8.30 am to 5pmSPIT JUNCTION NSW 2088
Telephone: 02 9978 4000 Internet: www.mosman.nsw.gov.auFacsimile: 02 9978 4132 Email: [email protected]
Officers Elected membersACTING GENERAL MANAGER MAYORD Johnson P Abelson
RESPONSIBLE ACCOUNTING OFFICER COUNCILLORSG Mills R Bendall
C CorriganPUBLIC OFFICER P S MenziesM Glyde L Moline
T SherlockAUDITORS P WhiteHill RogersLevel 51 Chifley SquareSydney NSW 2000
Other informationABN: 94 414 022 939

MOSMAN COUNCIL
GENERAL PURPOSE FINANCIAL STATEMENTS
INDEPENDENT AUDITORS' REPORT
REPORT ON THE FINANCIAL STATEMENTS We have audited the accompanying general purpose financial statements of Mosman Council, which comprises the Statement of Financial Position as at 30 June 2016, Income Statement, Statement of Comprehensive Income, Statement of Changes in Equity and Statement of Cash Flows for the year ended on that date, a summary of significant accounting policies and other explanatory notes and the Statement by Councillors and Management. The financial statements include the consolidated financial statements of the economic entity and the entities it controlled at year end or from time to time during the year. Responsibility of Council for the Financial Statements The Council is responsible for the preparation and fair presentation of the financial statements in accordance with Australian Accounting Standards (including the Australian Accounting Interpretations) and the Local Government Act 1993. This responsibility includes the maintenance of adequate accounting records and internal controls designed to prevent and detect fraud and error; designing, implementing and maintaining internal controls relevant to the preparation and fair presentation of the financial statements that are free from material misstatement, whether due to fraud or error; selecting and applying appropriate accounting policies; and making accounting estimates that are reasonable in the circumstances. Auditors’ Responsibility Our responsibility is to express an opinion on the financial statements based on our audit. We conducted our audit in accordance with Australian Auditing Standards. These Auditing Standards require that we comply with relevant ethical requirements relating to audit engagements and plan and perform the audit to obtain reasonable assurance whether the financial statements are free from material misstatement. Our audit responsibility does not extend to the original budget information disclosed in the Income Statement, Statement of Cash Flows, and Note 2(a) or the budget variation explanations disclosed in Note 16. Accordingly, no opinion is expressed on these matters. An audit involves performing procedures to obtain audit evidence about the amounts and disclosures in the financial statements. The procedures selected depend on the auditor's judgement, including the assessment of the risks of material misstatement of the financial statements, whether due to fraud or error. In making those risk assessments, the auditor considers internal control relevant to the entity's preparation and fair presentation of the financial statements in order to design audit procedures that are appropriate in the circumstances, but not for the purpose of expressing an opinion on the effectiveness of the Council's internal control. An audit also includes evaluating the appropriateness of accounting policies used and the reasonableness of accounting estimates made by the Council, as well as evaluating the overall presentation of the financial statements. Our audit did not involve an analysis of the prudence of business decisions made by Council or management.

2 of 2
We believe that the audit evidence we have obtained is sufficient and appropriate to provide a basis for our audit opinion. Independence In conducting our audit, we followed applicable independence requirements of Australian professional ethical pronouncements. Auditor’s Opinion In our opinion, (a) the Council's accounting records have been kept in accordance with the requirements of the Local Government
Act 1993, Chapter 13 part 3 Division 2; and (b) the financial statements:
(i) have been presented in accordance with the requirements of this Division; (ii) are consistent with the Council's accounting records; (iii) present fairly the Council's financial position, the results of its operations and its cash flows; and (iv) are in accordance with applicable Accounting Standards and other mandatory professional reporting
requirements in Australia.
(c) all information relevant to the conduct of the audit has been obtained; and (d) there are no material deficiencies in the accounting records or financial statements that we have become aware
of during the course of the audit. HILL ROGERS
BRETT HANGER Partner Dated at Sydney this 9th day of September 2016

9 September 2016 The Mayor Mosman Council PO Box 211 SPIT JUNCTION NSW 2088 Mayor,
Audit Report - Year Ended 30 June 2016
We are pleased to advise completion of the audit of Council’s books and records for the year ended 30 June 2016 and that all information required by us was readily available. We have signed our reports as required under Section 417(1) of the Local Government Act, 1993 and the Local Government Code of Accounting Practice and Financial Reporting to the General and Special Purpose Financial Statements. Our audit has been conducted in accordance with Australian Auditing Standards so as to express an opinion on both the General and Special Purpose Financial Statements of the Council. We have ensured that the financial statements have been prepared in accordance with Australian Accounting Standards, Australian Accounting Interpretations and the Local Government Code of Accounting Practice and Financial Reporting. This report on the conduct of the audit is also issued under Section 417(1) and we now offer the following comments on the financial statements and the audit; 1. RESULTS FOR THE YEAR 1.1 Operating Result The operating result for the year was a deficit of $1.484 million as compared with a surplus of $5.216 million in the previous year.

2 of 7
The following table sets out the results for the year and the extent (%) that each category of revenue and expenses contributed to the total.
2016% of
Total2015
% of
Total
Increase
(Decrease)
$000 $000 $000
Revenues before capital items
Rates & annual charges 25,354 57% 23,680 55% 1,674
User charges, fees & other revenues 15,793 35% 16,288 38% (495)
Grants & contributions provided for operating
purposes2,919 7% 2,545 6% 374
Interest & investment revenue 526 1% 503 1% 23
44,592 100% 43,016 100% 1,576
Expenses
Employee benefits & costs 16,874 35% 15,925 40% 949
Materials, contracts & other expenses 25,205 53% 18,361 46% 6,844
Depreciation, amortisation & impairment 5,415 11% 5,166 13% 249
Borrowing costs 502 1% 612 2% (110)
47,996 100% 40,064 100% 7,932
Surplus (Deficit) before capital items (3,404) 2,952 (6,356)
Grants & contributions provided for capital
purposes1,920 2,264 (344)
Net Surplus (Deficit) for the year (1,484) 5,216 (6,700)
Performance Measures 2016 2015
Operating Performance 1.96% 1.70%
Own Source Operating Revenue 89.56% 88.82% The above table shows an overall decrease of $6.7 million which can be primarily attributed to the revaluation of assets. The value of investments properties was reduced by $3.219 million; compared to an increase of $2.129 million in the previous year. Additionally, the revaluation of community land resulted in a decrement of $1.223 million being recognised in the operating result. Operating Performance measures the ability to contain operating expenditure within operating revenue excluding capital amounts. For 2016, this indicator was 1.96% and exceeded the benchmark of 0%. Own Source Operating Revenue measures the degree of reliance on external funding sources such as grants and contributions. For 2016, this indicator was 89.56% and exceeded the benchmark of 60%.

3 of 7
1.2 Funding Result As the operating result only accounts for operating income and expenditure, in reviewing the overall financial performance of Council, it is useful to consider the total source of revenues and how they were applied during the year which is illustrated in the table below.
2016 2015
Funds were provided by:- $000 $000
Operating Result (as above) (1,484) 5,216
Add back non funding items:-
- Depreciation, amortisation & impairment 5,415 5,166
- Revaluation decrements (fair valuation of I,P,P&E) 1,223 0
- Book value of non-current assets sold 28 20
- Non-cash contributions of assets acquired (238) (185)
- (Gain)/Loss of fair value to investment properties 3,219 (2,129)
- (Surplus)/Deficit in joint ventures (167) (150)
7,996 7,938
New loan borrowings 400 0
Transfers from internal reserves (net) 1,311 0
Distributions from joint ventures 61 32
Net Changes in current/non-current assets & liabilities 1,697 819
11,465 8,789
Funds were applied to:-
Purchase and construction of assets (7,928) (4,914)
Principal repaid on loans (1,914) (1,887)
Transfers to externally restricted assets (net) (602) (632)
Transfers to internal reserves (net) 0 (925)
(10,444) (8,358)
Increase/(Decrease) in Available Working Capital 1,021 431
2. FINANCIAL POSITION 2.1 Unrestricted Current Ratio The Unrestricted Current Ratio is a financial indicator specific to local government and represents Council’s ability to meet its debts and obligations as they fall due. After eliminating externally restricted assets and current liabilities not expected to be paid within the next 12 months net current assets amounted to $2.787 million representing a factor of 1.29 to 1. 2014 2015 2016
Ratio 1.40 1.53 1.29
0.0
0.5
1.0
1.5
2.0
Unrestricted Current Ratio
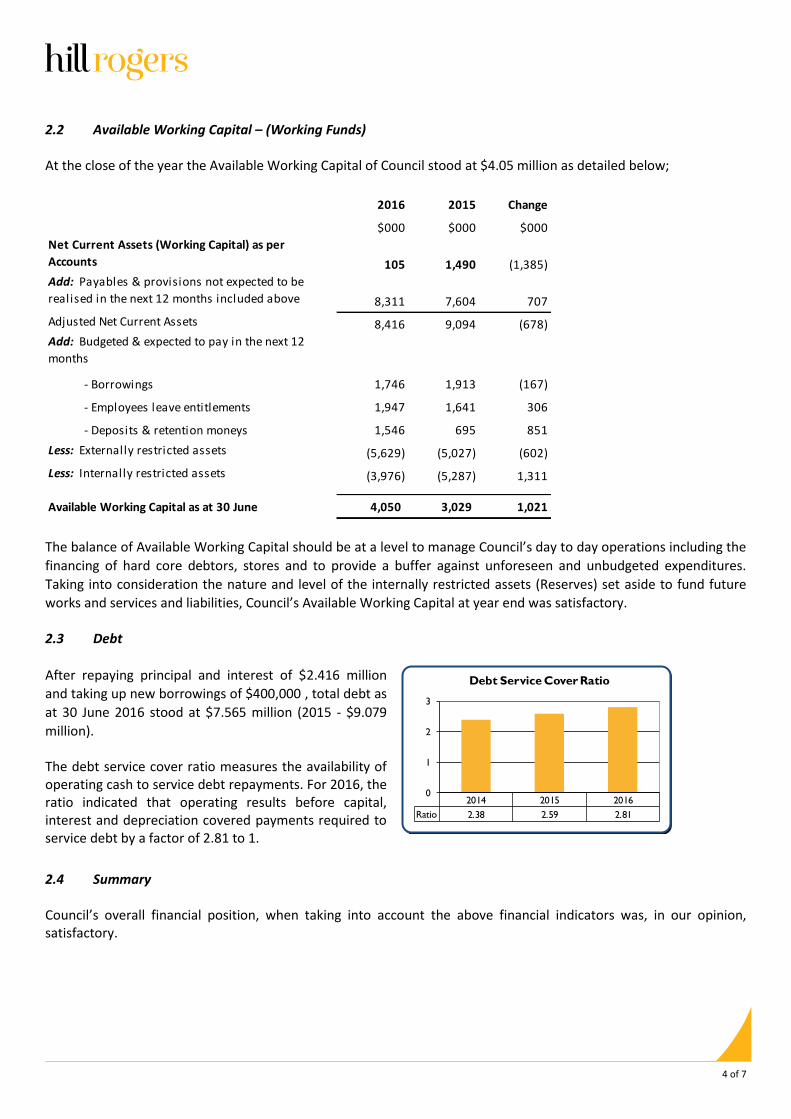
4 of 7
2.2 Available Working Capital – (Working Funds) At the close of the year the Available Working Capital of Council stood at $4.05 million as detailed below;
2016 2015 Change
$000 $000 $000
Net Current Assets (Working Capital) as per
Accounts 105 1,490 (1,385)
Add: Payables & provisions not expected to be
realised in the next 12 months included above 8,311 7,604 707
Adjusted Net Current Assets 8,416 9,094 (678)
Add: Budgeted & expected to pay in the next 12
months
- Borrowings 1,746 1,913 (167)
- Employees leave entitlements 1,947 1,641 306
- Deposits & retention moneys 1,546 695 851
Less: Externally restricted assets (5,629) (5,027) (602)
Less: Internally restricted assets (3,976) (5,287) 1,311
Available Working Capital as at 30 June 4,050 3,029 1,021
The balance of Available Working Capital should be at a level to manage Council’s day to day operations including the
financing of hard core debtors, stores and to provide a buffer against unforeseen and unbudgeted expenditures.
Taking into consideration the nature and level of the internally restricted assets (Reserves) set aside to fund future
works and services and liabilities, Council’s Available Working Capital at year end was satisfactory. 2.3 Debt
After repaying principal and interest of $2.416 million
and taking up new borrowings of $400,000 , total debt as
at 30 June 2016 stood at $7.565 million (2015 - $9.079
million). The debt service cover ratio measures the availability of operating cash to service debt repayments. For 2016, the ratio indicated that operating results before capital, interest and depreciation covered payments required to service debt by a factor of 2.81 to 1.
2014 2015 2016
Ratio 2.38 2.59 2.81
0
1
2
3
Debt Service Cover Ratio
2.4 Summary Council’s overall financial position, when taking into account the above financial indicators was, in our opinion, satisfactory.

5 of 7
3. CASH ASSETS 3.1 Cash Expense Cover Ratio This liquidity ratio indicates the number of months of expenditure requirements that can be meet with available cash and term deposit balances without the need for additional cash inflow. For 2016, this ratio stood at 4.25 months compared to the benchmark of 3.
2014 2015 2016
Ratio 3.25 4.24 4.25
0
1
2
3
4
5
Cash Expense Cover Ratio
3.2 Cash & Investment Securities
Cash and investments amounted $14.725 million at 30 June 2016 as compared with $13.16 million in 2015 and
$10.15 million in 2014. The chart alongside summarises the purposes for which cash and investments securities were held.
ExternalRestrictions
Internal Restrictions Uncommitted Funds
2014 4.475 4.362 1.313
2015 5.262 5.287 2.611
2016 5.877 3.976 4.872
0
1
2
3
4
5
6$m
Cash & Investments
Externally restricted cash and investments are restricted in their use by externally imposed requirements and
consisted of unexpended specific purpose grants ($81,000), developer contributions ($4.345 million) and domestic
waste management charges ($1.451 million). Internally restricted cash and investments have been restricted in their use by resolution or policy of Council to reflect forward plans, identified programs of works, and are, in fact, Council’s “Reserves”. These Reserves totalled $3.976 million and their purposes are more fully disclosed in Notes 6 of the financial statements. Unrestricted cash and investments amounted to $4.872 million, which is available to provide liquidity for day to day operations.
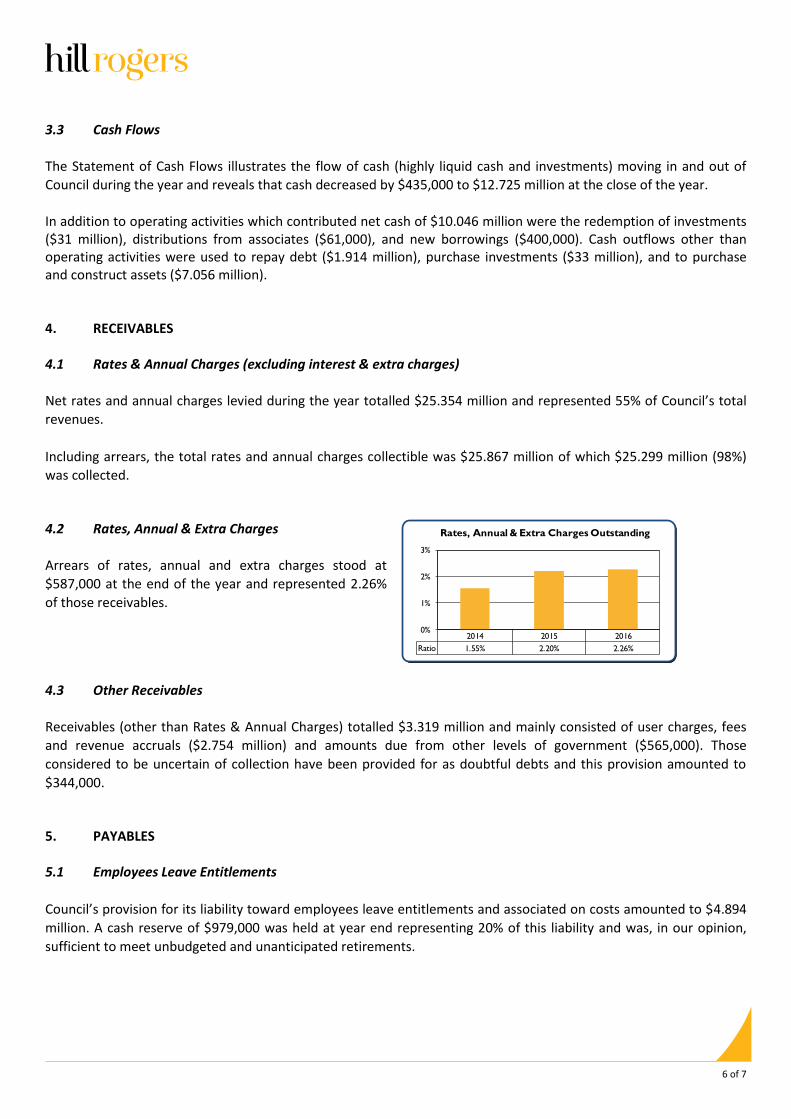
6 of 7
3.3 Cash Flows
The Statement of Cash Flows illustrates the flow of cash (highly liquid cash and investments) moving in and out of
Council during the year and reveals that cash decreased by $435,000 to $12.725 million at the close of the year.
In addition to operating activities which contributed net cash of $10.046 million were the redemption of investments ($31 million), distributions from associates ($61,000), and new borrowings ($400,000). Cash outflows other than operating activities were used to repay debt ($1.914 million), purchase investments ($33 million), and to purchase and construct assets ($7.056 million). 4. RECEIVABLES 4.1 Rates & Annual Charges (excluding interest & extra charges)
Net rates and annual charges levied during the year totalled $25.354 million and represented 55% of Council’s total
revenues.
Including arrears, the total rates and annual charges collectible was $25.867 million of which $25.299 million (98%)
was collected. 4.2 Rates, Annual & Extra Charges
Arrears of rates, annual and extra charges stood at
$587,000 at the end of the year and represented 2.26%
of those receivables.
2014 2015 2016
Ratio 1.55% 2.20% 2.26%
0%
1%
2%
3%
Rates, Annual & Extra Charges Outstanding
4.3 Other Receivables
Receivables (other than Rates & Annual Charges) totalled $3.319 million and mainly consisted of user charges, fees
and revenue accruals ($2.754 million) and amounts due from other levels of government ($565,000). Those
considered to be uncertain of collection have been provided for as doubtful debts and this provision amounted to
$344,000. 5. PAYABLES 5.1 Employees Leave Entitlements
Council’s provision for its liability toward employees leave entitlements and associated on costs amounted to $4.894
million. A cash reserve of $979,000 was held at year end representing 20% of this liability and was, in our opinion,
sufficient to meet unbudgeted and unanticipated retirements.

7 of 7
5.2 Deposits, Retentions & Bonds Deposits, retentions and bonds held at year end amounted to $7.069 million and a cash reserve was held amounting to $2 million representing 28% of this liability and was sufficient to meet anticipated repayments in the near future. 6. INFRASTRUCTURE RENEWALS The Infrastructure Renewals Ratio measures the rate at which these assets are renewed against the rate at which they are depreciating. Special Schedule No. 7 discloses that asset renewals for 2016 represented 129% of the depreciation charges for these assets. An industry benchmark is considered to be 100%, measured annually over the long term. 2014 2015 2016
Ratio 137.38% 95.72% 129.12%
50%
75%
100%
125%
150%
Infrastructure Renewals Ratio
7. REVALUATION OF ASSETS Council’s infrastructure, property, plant and equipment are required to be carried at fair value with revaluations of each asset class to be performed at least every five years. During the year, community land, open space assets, and the art collection were revalued. This resulted in a direct reduction to equity of $32.131 million. A further decrement of $1.223 million was recognised in the operating result in respect to the revaluation of community land. Notes 1(j), 9, and 20 of the financial statements provide further details. 8. MANAGEMENT LETTER
An audit management letter addressing the findings from our interim audit was issued on 5 April 2016 and included
our recommendations on possible ways to strengthen and/or improve procedures. A written response was received
on 12 April 2016 detailing management’s comments and proposed actions. 9. CONCLUSION We wish to record our appreciation to the Acting General Manager and his staff for their ready co-operation and the courtesies extended to us during the conduct of the audit. Yours faithfully, HILL ROGERS
BRETT HANGER Partner

Mosman Council SPECIAL PURPOSE FINANCIAL STATEMENTS for the year ended 30 June 2016
Proud to be MosmanProtecting our HeritagePlanning our FutureInvolving our Community

SPFS 2016
page 1
Mosman Council
Special Purpose Financial Statements for the year ended 30 June 2016
Contents
1. Statement by Councillors and Management
2. Special Purpose Financial Statements:
Income Statement – Water Supply Business ActivityIncome Statement – Sewerage Business ActivityIncome Statement – Other Business Activities
Statement of Financial Position – Water Supply Business ActivityStatement of Financial Position – Sewerage Business ActivityStatement of Financial Position – Other Business Activities
3. Notes to the Special Purpose Financial Statements
4. Auditor’s Report
Background
These Special Purpose Financial Statements have been prepared for the use by both Council and the Office ofLocal Government in fulfilling their requirements under National Competition Policy.
The principle of competitive neutrality is based on the concept of a ‘level playing field’ between persons/entitiescompeting in a market place, particularly between private and public sector competitors.
Essentially, the principle is that government businesses, whether Commonwealth, state or local, should operatewithout net competitive advantages over other businesses as a result of their public ownership.
For Council, the principle of competitive neutrality and public reporting applies only to declared business activities.
These include (a) those activities classified by the Australian Bureau of Statistics as business activities beingwater supply, sewerage services, abattoirs, gas production and reticulation, and (b) those activities with a turnoverof more than $2 million that Council has formally declared as a business activity (defined as Category 1 activities).
In preparing these financial statements for Council’s self-classified Category 1 businesses and ABS-definedactivities, councils must (a) adopt a corporatisation model and (b) apply full cost attribution including tax-equivalentregime payments and debt guarantee fees (where the business benefits from Council's borrowing position bycomparison with commercial rates).
(iv)
5
4n/a
(i)
(ii)
9
(iii)
n/a
Page
n/an/a3
2

page 2
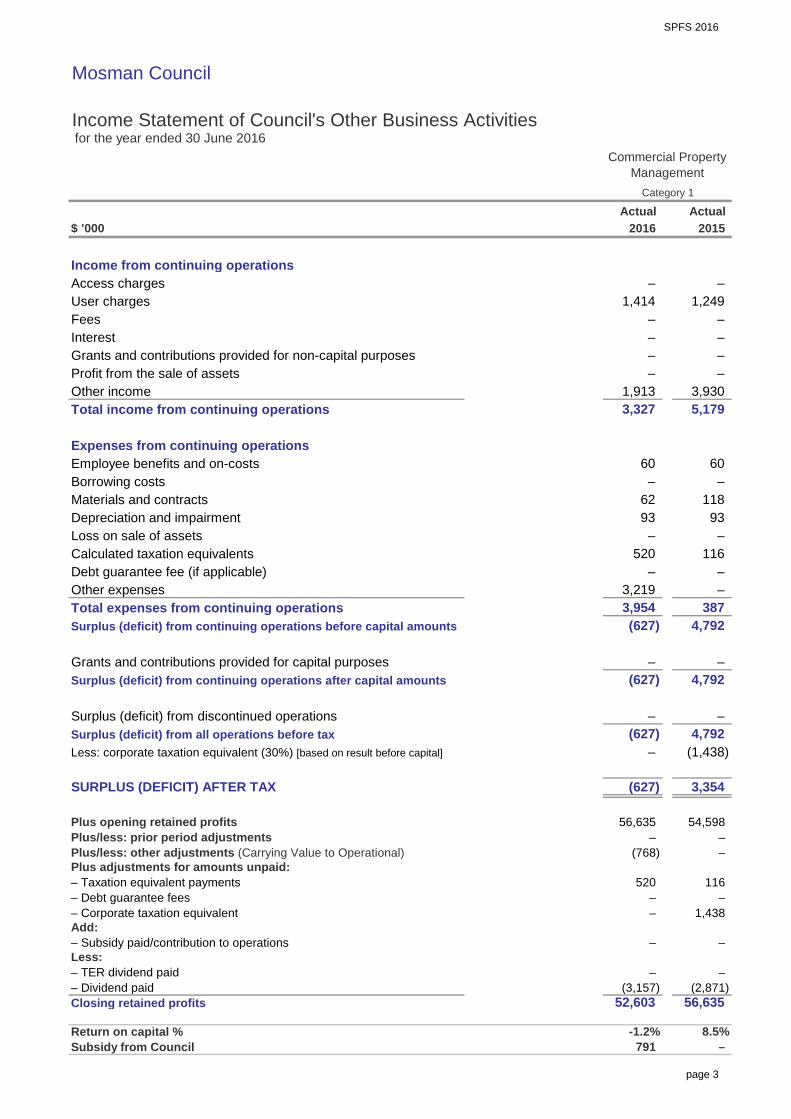
SPFS 2016
page 3
Mosman Council
Income Statement of Council's Other Business Activities for the year ended 30 June 2016
$ ’000
Income from continuing operationsAccess chargesUser chargesFeesInterestGrants and contributions provided for non-capital purposesProfit from the sale of assetsOther incomeTotal income from continuing operations
Expenses from continuing operationsEmployee benefits and on-costsBorrowing costsMaterials and contractsDepreciation and impairmentLoss on sale of assetsCalculated taxation equivalentsDebt guarantee fee (if applicable)Other expensesTotal expenses from continuing operationsSurplus (deficit) from continuing operations before capital amounts
Grants and contributions provided for capital purposesSurplus (deficit) from continuing operations after capital amounts
Surplus (deficit) from discontinued operationsSurplus (deficit) from all operations before taxLess: corporate taxation equivalent (30%) [based on result before capital]
SURPLUS (DEFICIT) AFTER TAX
Plus opening retained profitsPlus/less: prior period adjustmentsPlus/less: other adjustments (Carrying Value to Operational)Plus adjustments for amounts unpaid:– Taxation equivalent payments– Debt guarantee fees– Corporate taxation equivalentAdd:– Subsidy paid/contribution to operationsLess:– TER dividend paid– Dividend paidClosing retained profits
Return on capital %Subsidy from Council
0 Category 1
8.5%
52,603
-1.2%–
56,635
791
(627) (1,438) –
–
–
– –
520
(768)
3,354
–
(2,871) (3,157)
– 1,438
–
– –
116
54,598 56,635
(627)
118
4,792
60
–
–
93
–
–
62 93
Actual 20152016
–
–
–
– –
–
3,930 1,913 5,179
–
–
3,327
Commercial Property Management
– 1,414
(627) 4,792
520 116 – –
60
– –
Actual
1,249
–
387 – 3,219
4,792
3,954
–
(627) –
–

SPFS 2016
page 4
Mosman Council
Statement of Financial Position – Council's Other Business Activities as at 30 June 2016
$ ’000
ASSETSCurrent assetsCash and cash equivalentsInvestmentsReceivablesInventoriesOtherNon-current assets classified as held for saleTotal Current Assets
Non-current assetsInvestmentsReceivablesInventoriesInfrastructure, property, plant and equipmentInvestments accounted for using equity methodInvestment propertyOtherTotal non-current assetsTOTAL ASSETS
LIABILITIESCurrent liabilitiesBank overdraftPayablesBorrowingsProvisionsTotal current liabilities
Non-current liabilitiesPayablesBorrowingsProvisionsOther LiabilitiesTotal non-current liabilitiesTOTAL LIABILITIESNET ASSETS
EQUITYRetained earningsRevaluation reservesCouncil equity interestNon-controlling equity interestTOTAL EQUITY
–
56,635 52,603
–
329
–
338
– –
56,635
52,941
52,603 –
–
–
52,603
52,603
–
Commercial Property Management
Category 1
–
2016
–
2015
411
Actual
56,635
338
7,660
–
–
–
– –
–
295
52,530
– – –
48,950
7,567 – –
–
270 56,635
–
–
– – – –
270
56,905
–
Actual
9 –
–
270
–
56,610
295
–
–
44,963
– –
411
–
–

SPFS 2016
page 5
Mosman Council
Special Purpose Financial Statements for the year ended 30 June 2016
Contents of the notes accompanying the financial statements
Details
Summary of significant accounting policies
Water Supply Business Best-Practice Management disclosure requirements
Sewerage Business Best-Practice Management disclosure requirements n/a3
Note Page
1
2
6
n/a

SPFS 2016_
Mosman Council Notes to the Special Purpose Financial Statements for the year ended 30 June 2016 Note 1. Significant accounting policies
page 6
These financial statements are a Special Purpose Financial Statements (SPFS) prepared for use by Council and the Office of Local Government. For the purposes of these statements, the Council is not a reporting not-for-profit entity. The figures presented in the SPFS, unless otherwise stated, have been prepared in accordance with: the recognition and measurement criteria of
relevant Australian Accounting Standards,
other authoritative pronouncements of the Australian Accounting Standards Board (AASB), and
Australian Accounting Interpretations.
The disclosures in the SPFS have been prepared in accordance with: the Local Government Act (1993) NSW, the Local Government (General) Regulation, and the Local Government Code of Accounting
Practice and Financial Reporting. The statements are also prepared on an accruals basis, based on historic costs and do not take into account changing money values nor current values of non-current assets (except where specifically stated). Certain taxes and other costs (appropriately described) have been imputed for the purposes of the National Competition Policy. National Competition Policy Council has adopted the principle of ‘competitive neutrality’ to its business activities as part of the national competition policy which is being applied throughout Australia at all levels of government. The framework for its application is set out in the June 1996 government policy statement, Application of National Competition Policy to Local Government. The Pricing and Costing for Council Businesses, A Guide to Competitive Neutrality, issued by the Office of Local Government in July 1997, has also been adopted.
The pricing and costing guidelines outline the process for identifying and allocating costs to activities and provide standards for disclosure. These disclosures are reflected in Council’s pricing and/or financial reporting systems and include taxation equivalents, Council subsidies, return on investments (rate of return), and dividends paid. Declared business activities In accordance with Pricing and Costing for Council Businesses – A Guide to Competitive Neutrality, Council has declared that the following are to be considered as business activities: Category 1 (where gross operating turnover is over $2 million) a. Commercial Property Management
Takes into account Council's Commercial Property portfolio and includes properties such as Mosman Square & Library Walk shops, Boronia House, Library Walk flats and Balmoral Bathers. It being noted that an Independent Fair Valuation of Investment Properties in 2015 resulted in an increase to the portfolio of $2.129 M. Revaluations of operational land & buildings also impacted positively on the balance of Infrastructure, Property, Plant & Equipment within the Balance Sheet. Category 2 (where gross operating turnover is less than $2 million) Council has no Category 2 Declared Business Activities Monetary amounts Amounts shown in the financial statements are in Australian currency and rounded to the nearest thousand dollars. (i) Taxation-equivalent charges Council is liable to pay various taxes and financial duties in undertaking its business activities. Where this is the case, they are disclosed in these statements as a cost of operations just like all other costs.

SPFS 2016_
Mosman Council Notes to the Special Purpose Financial Statements for the year ended 30 June 2016 Note 1. Significant accounting policies (continued)
page 7
However, where Council is exempt from paying taxes which are generally paid by private sector businesses (such as income tax), equivalent tax payments have been applied to all Council-nominated business activities and are reflected in these financial statements. For the purposes of disclosing comparative information relevant to the private sector equivalent, the following taxation equivalents have been applied to all Council-nominated business activities (this does not include Council’s non-business activities): Notional rate applied (%) Corporate income tax rate – 30% Land tax – the first $482,000 of combined land values attracts 0%. For that valued from $482,001 to $2,947,000 the rate is 1.6% + $100. For the remaining combined land value that exceeds $2,947,000, a premium marginal rate of 2.0% applies. Payroll tax – 5.45% on the value of taxable salaries and wages in excess of $750,000. Income tax An income tax equivalent has been applied on the profits of each reported business activity. While income tax is not a specific cost for the purpose of pricing a good or service, it needs to be taken into account in terms of assessing the rate of return required on capital invested. Accordingly, the return on capital invested is set at a pre-tax level (gain or loss from ordinary activities before capital amounts) as would be applied by a private sector competitor – that is, it should include a provision equivalent to the corporate income tax rate, currently 30%. Income tax is only applied where a positive gain/ (loss) from ordinary activities before capital amounts has been achieved. Since this taxation equivalent is notional – that is, it is payable to Council as the ‘owner’ of business operations, it represents an internal payment and has no effect on the operations of the Council. Accordingly, there is no need for disclosure of
internal charges in Council’s General Purpose Financial Statements. The 30% rate applied is the equivalent company tax rate prevalent as at balance date. Local government rates and charges A calculation of the equivalent rates and charges payable on all category 1 businesses has been applied to all land assets owned or exclusively used by the business activity. Loan and debt guarantee fees The debt guarantee fee is designed to ensure that council business activities face ‘true’ commercial borrowing costs in line with private sector competitors. In order to calculate a debt guarantee fee, Council has determined what the differential borrowing rate would have been between the commercial rate and Council’s borrowing rate for its business activities. (ii) Subsidies Government policy requires that subsidies provided to customers, and the funding of those subsidies, must be explicitly disclosed. Subsidies occur when Council provides services on a less-than-cost-recovery basis. This option is exercised on a range of services in order for Council to meet its community service obligations. Accordingly, ‘subsidies disclosed’ (in relation to National Competition Policy) represents the difference between revenue generated from ‘rate of return’ pricing and revenue generated from prices set by Council in any given financial year. The overall effect of subsidies is contained within the Income Statement of each reported business activity. (iii) Return on investments (rate of return) The policy statement requires that councils with category 1 businesses ‘would be expected to generate a return on capital funds employed that is

SPFS 2016_
Mosman Council Notes to the Special Purpose Financial Statements for the year ended 30 June 2016 Note 1. Significant accounting policies (continued)
page 8
comparable to rates of return for private businesses operating in a similar field’. Such funds are subsequently available for meeting commitments or financing future investment strategies. The rate of return on capital is calculated as follows: Operating result before capital income + interest expense
Written down value of I,PP&E as at 30 June As a minimum, business activities should generate a return equal to the Commonwealth 10 year bond rate which is 2.17% at 30/6/16. The actual rate of return achieved by each business activity is disclosed at the foot of the Income Statement. (iv) Dividends Council is not required to pay dividends to either itself (as owner of a range of businesses) or to any external entities.

MOSMAN COUNCIL
SPECIAL PURPOSE FINANCIAL STATEMENTS
INDEPENDENT AUDITORS' REPORT
REPORT ON THE FINANCIAL STATEMENTS We have audited the accompanying special purpose financial statements of Mosman Council, which comprises the Statement of Financial Position as at 30 June 2016, Income Statement for the year ended on that date, a summary of significant accounting policies and other explanatory notes and the Statement by Councillors and Management. Responsibility of Council for the Financial Statements The Council is responsible for the preparation and fair presentation of the financial statements in accordance with the Local Government Act 1993 and have determined that the accounting policies described in Note 1 to the financial statements, which form part of the financial statements, are appropriate to meet the financial reporting requirements of the Division of Local Government. This responsibility includes the maintenance of adequate accounting records and internal controls designed to prevent and detect fraud and error; designing, implementing and maintaining internal controls relevant to the preparation and fair presentation of the financial statements that are free from material misstatement, whether due to fraud or error; selecting and applying appropriate accounting policies; and making accounting estimates that are reasonable in the circumstances. Auditors’ Responsibility Our responsibility is to express an opinion on the financial statements based on our audit. We conducted our audit in accordance with Australian Auditing Standards. These Auditing Standards require that we comply with relevant ethical requirements relating to audit engagements and plan and perform the audit to obtain reasonable assurance whether the financial statements are free from material misstatement. An audit involves performing procedures to obtain audit evidence about the amounts and disclosures in the financial statements. The procedures selected depend on the auditor's judgement, including the assessment of the risks of material misstatement of the financial statements, whether due to fraud or error. In making those risk assessments, the auditor considers internal control relevant to the entity's preparation and fair presentation of the financial statements in order to design audit procedures that are appropriate in the circumstances, but not for the purpose of expressing an opinion on the effectiveness of the Council's internal control. An audit also includes evaluating the appropriateness of accounting policies used and the reasonableness of accounting estimates made by the Council, as well as evaluating the overall presentation of the financial statements. Our audit did not involve an analysis of the prudence of business decisions made by Council or management. We believe that the audit evidence we have obtained is sufficient and appropriate to provide a basis for our audit opinion.
2 of 2
Independence In conducting our audit, we followed applicable independence requirements of Australian professional ethical pronouncements. Auditor’s Opinion In our opinion, the special purpose financial statements of the Council are presented fairly in accordance with the requirements of those applicable Accounting Standards detailed in Note 1 and the Local Government Code of Accounting Practice and Financial Reporting. Basis of Accounting Without modifying our opinion, we draw attention to Note 1 to the financial statements, which describes the basis of accounting. The financial statements have been prepared for the purpose of fulfilling the financial reporting requirements of the Office of Local Government. As a result, the financial statements may not be suitable for another purpose. HILL ROGERS
BRETT HANGER Partner Dated at Sydney this 9th day of September 2016

Mosman Council SPECIAL SCHEDULES for the year ended 30 June 2016
Proud to be MosmanProtecting our HeritagePlanning our FutureInvolving our Community

Special Schedules 2016
page 1
Mosman Council
Special Schedules for the year ended 30 June 2016
Contents
Special Schedules1
Net Cost of Services
Statement of Long Term Debt (all purposes)
Statement of Internal Loans (Sect. 410(3) LGA 1993)
Water Supply Operations – incl. Income StatementWater Supply – Statement of Financial Position
Sewerage Service Operations – incl. Income StatementSewerage Service – Statement of Financial Position
Notes to Special Schedules 3 and 5
Report on Infrastructure Assets
Permissible Income Calculation
1 Special Schedules are not audited (with the exception of Special Schedule 8).
Background
These Special Schedules have been designed to meet the requirements of special purpose users such as;
the NSW Grants Commissionthe Australian Bureau of Statistics (ABS),the NSW Office of Water (NOW), andthe Office of Local Government (OLG).
The financial data is collected for various uses including;
the allocation of Financial Assistance Grants,the incorporation of Local Government financial figures in national statistics,the monitoring of loan approvals,the allocation of borrowing rights, andthe monitoring of the financial activities of specific services.
5Special Schedule 7
n/a
n/a
(ii)
(i)
Special Schedule 8 9
Special Schedule 6Special Schedule 5 n/a
Page
2
4
n/a
Special Schedule 1
Special Schedule 2(a)n/a
Special Schedule 4
Special Schedule 2(b)
Special Schedule 3n/a

Special Schedules 2016
page 2
Mosman Council
Special Schedule 1 – Net Cost of Services for the year ended 30 June 2016
$’000
Governance
Administration
Public order and safety
Beach controlEnforcement of local government regulationsAnimal controlOtherTotal public order and safety
Health
EnvironmentNoxious plants and insect/vermin controlOther environmental protectionSolid waste managementStreet cleaningDrainageStormwater managementTotal environment
Community services and educationAdministration and educationSocial protection (welfare)Aged persons and disabledChildren’s servicesTotal community services and education
Housing and community amenitiesPublic cemeteriesPublic conveniencesStreet lightingTown planningOther community amenitiesTotal housing and community amenities
Water supplies
Sewerage services
–
– –
Expenses from. continuing. operations. Non-capital.
356
–
– –
Capital.
Income fromcontinuing operations
50
32
153 –
6,535
76
6,688
392
–
–
–
– –
–
987
1,852 1,087
–
99
– – –
–
–
– (80)
(1,599) (391)
(268) –
–
–
–
1,086
–
10,557
969
748
– – (1,295)
– (54)
–
86
46 –
1,371 –
–
–
Function or activity
–
Fire service levy, fire protection, emergency services
–
1,355
490 2,586
Net cost.of services.
(306) –
(969)
(204)
974 (371)
1,773 – – (1,773)
(20) – –
(9,809)
–
26
–
1,038
3,081
80
765 –
–
– –
3,156
–
327 204
4,420
5,714 371
–
– –
(273)
–
–
(2,070)
(1,229)
– 688
–
–
(688)
–
2,115 –
–
– (239)
(327)
–

Special Schedules 2016
page 3
Mosman Council
Special Schedule 1 – Net Cost of Services (continued) for the year ended 30 June 2016
$’000
Recreation and culturePublic librariesMuseumsArt galleriesCommunity centres and hallsPerforming arts venuesOther performing artsOther cultural servicesSporting grounds and venuesSwimming poolsParks and gardens (lakes)Other sport and recreationTotal recreation and culture
Fuel and energy
Agriculture
Mining, manufacturing and constructionBuilding controlOther mining, manufacturing and constructionTotal mining, manufacturing and const.
Transport and communicationUrban roads (UR) – localUrban roads – regionalSealed rural roads (SRR) – localSealed rural roads (SRR) – regionalUnsealed rural roads (URR) – localUnsealed rural roads (URR) – regionalBridges on UR – localBridges on SRR – localBridges on URR – localBridges on regional roadsParking areasFootpathsAerodromesOther transport and communicationTotal transport and communication
Economic affairsCamping areas and caravan parksOther economic affairsTotal economic affairs
Totals – functionsGeneral purpose revenues (1)
NET OPERATING RESULT (2)
(1) Includes: rates and annual charges (including ex gratia, excluding water and sewer), non-capital general purpose (2) As reported in the Income Statement
grants, interest on investments (excluding externally restricted assets) and interest on overdue rates and annual charges
Income fromcontinuing operations
238 – –
328
174
581
47,996
–
6,688 7,884
3,821 3,821
44,657
3,950
– –
20,008 47,996
3,950
167
24,482
1,429 –
1,916
–
6,312
–
38 –
–
– –
1,856
207 –
429 –
–
–
– –
246
Function or activity
600
–
–
246
–
– –
–
–
–
–
–
–
–
–
–
–
–
– –
–
241 11,038 – –
1,566
– –
–
711
711
– – – –
1,584
–
Non-capital.
–
Expenses from. continuing. operations.
5,447
414 194
290
–
69 –
– –
– –
4,196 1,534
–
600
277
–
(391)
134
– (221)
–
(9,231)
– 137
–
Capital.
3
–
–
–
– – –
1,916
– – – –
(1,423)
167
(21,598) 1,558
–
1,442 (207)
1,558
–
4,456
–
1,429
–
20,008
2,637 –
–
(2,460) –
472
–
(765)
(111)
(137)
(472)
–
Net cost.of services.
–
(111)
–
–
(2,416)
–
–
– (5,310)
Share of interests – joint ventures and associates using the equity method

Special Schedules 2016
page 4
Mosman Council
Special Schedule 2(a) – Statement of Long Term Debt (all purpose) for the year ended 30 June 2016
$’000
Spe
pag
Notes: excludes (i) internal loans and (ii) principal inflows/outflows relating to loan re-financing. This schedule is prepared using the face value of debt obligations, rather than fair value (which are reported in the GPFS).
–
– Deferred payments
– –
1,913
–
7,166
– – – – Total long term debt – –
Total debt
–
9,079
–
400 1,914
– – –
1,746
– – –
7,565
– – –
5,819
–
502 –
–
– – – Other long term debtRatepayers advances – – –
– Government advances – Finance leases –
– – – – –
– –
– – – –
Financial institutions 1,913 7,166 9,079 – 400
– –
400
–
– 1,914 – – –
1,914
1,913 7,166 Total loans–
9,079 Other
Other state government – – – – –
– – – – –
Treasury corporation–
Public subscription – –
– – – – –
–
Debt redemption during the year
From revenue
Sinking funds
–
1,746 – –
502 –
502
5,819
–
–
–
–
1,746 5,819 – –
– – – –
–
Current Non-current Total
–
– – –
– – –
–
–
– – – – –
7,565
–
7,565
– –
– –
Loans (by source)Commonwealth government
Current
– – – – – – –
Transfers to sinking
funds
Principal outstandingInterest
applicable for year TotalNon-
current
at the end of the year
– –
Principal outstanding New loans raised during
the year
at beginning of the year
Classification of debt

Special Schedules 2016
page 5
Mosman Council
Special Schedule 7 – Report on Infrastructure Assets as at 30 June 2016 as at 30 June 2016
$’000
0%3,043
227,782
41%
0.3%
0%58%0%
– 21% 54%
0%
3
51%
0%
0%
31
2,301
41
0%0%
8
1,662
138 196 277
13.5%
44 Physical Traffic Devices
Sub-total
289
Street Furniture 243 17
Other road assets
Lines and Signs
Retaining Walls
44
10
2,301
10
32
1,564 –
56
15.9%774
354 13 289
243
106
Footpaths
Kerb and Gutter1,564 13 49
12
0%0%8,442 0%
0%
13 0%128,288 1,188
0%
0%
0%
0% 0%
418
7 100%
100%0%
5
0%
Childcare centres
Buildings – specialised
LibraryCultural facilities
3
0%0%
59.9%
58%100%
18 82
3%
4
4 0%
0%0%
67%
12,447
0%
0%21,931 0%
– –
0%0%
0%
416
2,110
22%193
101 8%
0%
70%
–
Roads
Sub-totalMultistorey car park
9,267 – –
0%75%
–
100%
53
Asset category
Council works depot 3 18
Required Actual replacementcost (GRC)maintenancea
to satisfactory
Estimated cost
agreed level ofservice set by
Council
– – – 2,043
263
21
2%0%
18,820
Sealed roads 138
100%
Asset class
to bring assetsEstimated cost
2015/16to bring to the 2015/16 Gross
standard maintenance
–
BuildingsCouncil offices
Other buildings
1,210 3,899 6,110
–
555
125
1,323 42%
–
– 10,329 67,124
– – 985
6,795 42,349
43
602
57
25%
0.0%
72,063
196
20%10%11,877 8,381
26.5%
54%
0.0%
56%21%
19%22%
15,510 61%23%
1%10%
20.2% 0.7%
1,087
39
47%
25%
23,557 36,413 21% 26%
33% 9%
2%63.0%129,108
22
–
16%
– – –
0%19,298 1,639
340 –
Assets in condition as a percentage of gross replacement cost
Carryingvalue
14,821 7,562
22%
2%0%
0%16,574 0%

Special Schedules 2016
page 6
Mosman Council
Special Schedule 7 – Report on Infrastructure Assets as at 30 June 2016 (continued) as at 30 June 2016
$’000
recreationalassets
Notes:a Required maintenance is the amount identified in Council’s asset management plans.
Infrastructure asset condition assessment ‘key’
Excellent No work required (normal maintenance) Condition Description here…Good Only minor maintenance work required Condition Description here…Average Maintenance work required Condition Description here…Poor Renewal required Condition Description here…Very poor Urgent renewal/upgrading required Condition Description here…
0%
836 39%
2,606
0.2%
13% 0%
1%3%
8%
1,280
18%
0%
1%45%27 33 3%
maintenancea
651 38%
99%
3
11%
343 5,137 13%
1,280
Open space/ 106
Other
5
Marine structures 15
598
Stormwater drainage
60
Sporting fields 675 406
valuereplacement
60
Estimated costto bring to the
Council
50,269
5,957 3,126
7,275
965 266
Asset category
Sub-total
Stormwater quality improvement devices 10
agreed level ofservice set by cost (GRC)standard
Nodes (pits)
47
39
to bring assets GrossCarrying
906 40,834 4,724
49 59
maintenanceActualRequiredto satisfactory
51,183
10
40%39%2,401
5
2%
2%Closed conduits (pipes)
965 2,723
30,132 Sub-total
49%
5.5%
65,355 12.0%238
37%
0%
6%
88%
6,649 15,054
9,275
22.1% 56.8%
25%
0.9%1,581 1,623 46,348 14.8%
54%
0%
2015/16
21Asset class
3%
0%
Open conduits (drains)
3%6%266
95%
3,247
Estimated cost
2,606
0%
0%0%
Parks & reserves 989 612 19,658
39
17 12,278 12%
115
48%
33.3%
0%
2015/16
0%
106 675 989 836
54.2%
562
4
0.2%228
Assets in condition as a percentage of gross replacement cost
4321 6
10987
6,187 251,858 TOTAL – ALL ASSETS 6,187 3,185 4,508 406,609 16.9% 56.4% 25.4% 1.0% 0.3%
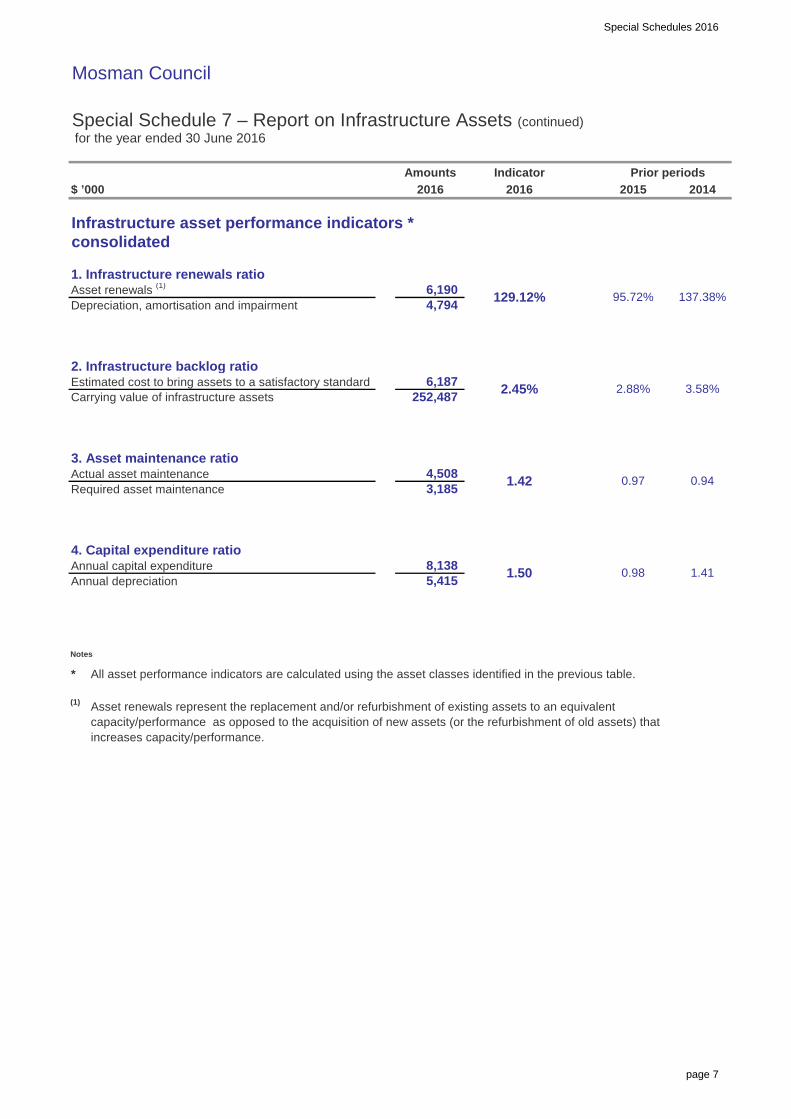
Special Schedules 2016
page 7
Mosman Council
Special Schedule 7 – Report on Infrastructure Assets (continued) for the year ended 30 June 2016
$ ’000
Infrastructure asset performance indicators * consolidated
1. Infrastructure renewals ratioAsset renewals (1)
Depreciation, amortisation and impairment
2. Infrastructure backlog ratioEstimated cost to bring assets to a satisfactory standardCarrying value of infrastructure assets
3. Asset maintenance ratioActual asset maintenanceRequired asset maintenance
4. Capital expenditure ratioAnnual capital expenditureAnnual depreciation
Notes
* All asset performance indicators are calculated using the asset classes identified in the previous table.
(1) Asset renewals represent the replacement and/or refurbishment of existing assets to an equivalent capacity/performance as opposed to the acquisition of new assets (or the refurbishment of old assets) that increases capacity/performance.
8,138 5,415
4,508
Indicator Prior periods
6,187 2.45% 2.88% 3.58%252,487
2016 2016 2015 2014
6,190 129.12% 95.72% 137.38%4,794
Amounts
1.42 0.97 0.943,185
1.50 0.98 1.41

Special Schedules 2016
page 8
Mosman Council
Special Schedule 7 – Report on Infrastructure Assets (continued) for the year ended 30 June 2016
Benchmark: ――― Minimum >=100.00% Ratio achieves benchmarkSource for benchmark: Code of Accounting Practice and Financial Reporting #24 Ratio is outside benchmark
Benchmark: ――― Maximum <2.00% Ratio achieves benchmarkSource for benchmark: Code of Accounting Practice and Financial Reporting #24 Ratio is outside benchmark
Benchmark: ――― Minimum >1.00 Ratio achieves benchmarkSource for benchmark: Code of Accounting Practice and Financial Reporting #24 Ratio is outside benchmark
Benchmark: ――― Minimum >1.10 Ratio achieves benchmarkSource for benchmark: Code of Accounting Practice and Financial Reporting #24 Ratio is outside benchmark
Council has exceeded the benchmark and started to address the infrastructure
backlog, as planned, with new Special Rate Variation monies
Commentary on 2015/16 result
2015/16 Ratio 2.45%
The ratio has improved with additional Special Rate Variation monies. Council forecasts that it will meet the ratio in FY
2017/18 and reduce the backlog to zero in FY 2024/25
Commentary on 2015/16 result
2015/16 Ratio 1.42 x
Compares actual vs. required annual asset maintenance. A ratio above 1.0 indicates Council is investing
enough funds to stop the infrastructure backlog growing.
Purpose of capital expenditure ratio
Purpose of asset renewals ratio
This ratio showswhat proportion the backlog is against
the total valueof a Council’s infrastructure.
To assess the extent to which a Council is expanding its asset
base thru capital expenditure on both new assets and the
replacement and renewal of existing
assets.
To assess the rate at which these assets are being renewed
relative to the rate at which they are depreciating.
Purpose of infrastructure backlog ratio
Purpose of asset maintenance ratio
Commentary on 2015/16 result
2015/16 Ratio 129.12%
Council has exceeded the ratio, as planned, with new Special Rate Variation
monies
Commentary on 2015/16 result
2015/16 Ratio 1.50 x
Council has exceeded the benchmark, as planned, with new Special Rate Variation
monies. In addition to renewals Council has added $1,132k of new assets including the
new assisted parking technologies, donated art works and sports ground
storage facilities
137.38% 129.12%
84% 96%
0%20%40%60%80%
100%120%140%160%
2013 2014 2015 2016
Rat
io %
1. Infrastructure renewals ratio
2.5%
3.6% 2.9%
2.5%
0.0%0.5%1.0%1.5%2.0%2.5%3.0%3.5%4.0%
2013 2014 2015 2016
Rat
io %
2. Infrastructure backlog ratio
1.12 1.42
0.94 0.97
0.000.200.400.600.801.001.201.401.60
2013 2014 2015 2016
Rat
io (
x)
3. Asset maintenance ratio
1.41 1.50
0.88 0.98
0.000.200.400.600.801.001.201.401.60
2013 2014 2015 2016
Rat
io (
x)
4. Capital expenditure ratio

Special Schedules 2016
page 9
Mosman Council
Special Schedule 8 – Permissible Income Calculation for the year ended 30 June 2017
$’000
Notional general income calculation (1)
Last year notional general income yieldPlus or minus adjustments (2)
Notional general income
Permissible income calculation
Special variation percentage (3)
Or rate peg percentageOr crown land adjustment (incl. rate peg percentage)
Less expiring special variation amountPlus special variation amount
Or plus rate peg amountOr plus Crown land adjustment and rate peg amount
Sub-total
Plus (or minus) last year’s carry forward totalLess valuation objections claimed in the previous yearSub-total
Total permissible income
Less notional general income yieldCatch-up or (excess) result
Plus income lost due to valuation objections claimed (4)
Less unused catch-up (5)
Carry forward to next year
Notes
(1) The notional general income will not reconcile with rate income in the financial statements in the correspondingyear. The statements are reported on an accrual accounting basis which include amounts that relate to prior years’rates income.
(2) Adjustments account for changes in the number of assessments and any increase or decrease in land value occurringduring the year. The adjustments are called ‘supplementary valuations’ as defined in the Valuation of Land Act 1916 .
(3) The ‘special variation percentage’ is inclusive of the rate peg percentage and where applicable Crown land adjustment.
(4) Valuation objections are unexpected changes in land values as a result of land owners successfully objecting to theland value issued by the Valuer-General. Councils can claim the value of the income lost due to valuation objections inany single year.
(5) Unused catch-up amounts will be deducted if they are not caught up within 2 years. Usually councils will have anominal carry forward figure. These amounts can be adjusted for in setting the rates in a future year.
(6) Carry forward amounts which are in excess (an amount that exceeds the permissible income) require ministerial approval by order published in the NSW Government Gazette in accordance with section 512 of the Local Government Act 1993 . The OLG will extract these amounts from Council’s Special Schedule 8 in the financial data return (FDR) to administer this process.
p
q = o – p
r
st = q + r – s
b
d
e
f
j = c x f
i = c x e
h = d x (c – g)
c = (a + b)
l
m
n = (l + m)
o = k + n
g
k = (c + g + h + i + j)
a
(7) 12
Calculation Calculation2015/16 2016/17
– –
(11) 12
4 –
18,868 19,237
18,879 19,225
(1) (4) (1) (11)
2,171 –
0 (7)
– 340 – –
18,869 19,248
0.00% 0.00%
(802) –
13.00% 0.00%0.00% 1.80%
17,498 18,879 2 29
17,500 18,908
MOSMAN COUNCIL
SPECIAL SCHEDULE NO. 8
INDEPENDENT AUDITORS' REPORT
REPORT ON SPECIAL SCHEDULE NO. 8 We have audited the accompanying special purpose financial statement comprising the reconciliation of total permissible general income (Special Schedule No. 8) of Mosman Council for the year ending 30 June 2017. Responsibility of Council for Special Schedule No. 8 The Council is responsible for the preparation and fair presentation of Special Schedule No. 8 in accordance with the Local Government Code of Accounting Practice and Financial Reporting (Guidelines) Update No. 24. This responsibility includes the maintenance of adequate accounting records and internal controls designed to prevent and detect fraud and error; designing, implementing and maintaining internal controls relevant to the preparation and fair presentation of Special Schedule No. 8 that is free from material misstatement, whether due to fraud or error; selecting and applying appropriate accounting policies; and making accounting estimates that are reasonable in the circumstances. Auditors’ Responsibility Our responsibility is to express an opinion on Special Schedule No. 8 based on our audit. We conducted our audit in accordance with Australian Auditing Standards. These Auditing Standards require that we comply with relevant ethical requirements relating to audit engagements and plan and perform the audit to obtain reasonable assurance whether Special Schedule No. 8 is free from material misstatement.
An audit involves performing procedures to obtain audit evidence about the amounts and disclosures in Special Schedule No. 8. The procedures selected depend on the auditor’s judgment, including the assessment of the risks of material misstatement of Special Schedule No. 8, whether due to fraud or error. An audit also includes evaluating the appropriateness of accounting policies used and the reasonableness of accounting estimates made by management, as well as evaluating the overall presentation of Special Schedule No. 8.
Because of the inherent limitations of an audit, together with the inherent limitations of internal control, there is an unavoidable risk that some material misstatements may not be detected, even though the audit is properly planned and performed in accordance with Australian Auditing Standards.
In making our risk assessments, we consider internal controls relevant to the entity’s preparation of Special Schedule No. 8 in order to design audit procedures that are appropriate in the circumstances, but not for the purpose of expressing an opinion on the effectiveness of the entity’s internal control.
2 of 2
We believe that the audit evidence we have obtained is sufficient and appropriate to provide a basis for our audit opinion. Independence In conducting our audit, we followed applicable independence requirements of Australian professional ethical pronouncements. Audit Opinion In our opinion, Special Schedule No. 8 of Mosman Council for 2016/17 is properly drawn up in accordance with the requirements of the Office of Local Government and in accordance with the books and records of the Council. Basis of Accounting Without modifying our opinion, we advise that this schedule has been prepared for distribution to the Office of Local Government for the purposes of confirming that Council’s reconciliation of Council’s total permissible general income is presented fairly. As a result, the schedule may not be suitable for another purpose. HILL ROGERS
BRETT HANGER Partner Dated at Sydney this 9th day of September 2016