Embed Size (px)
Citation preview

Yale School of Management
Retail, Location and Cities
Lecture for Real Estate Class
William N. Goetzmann
Yale School of Management
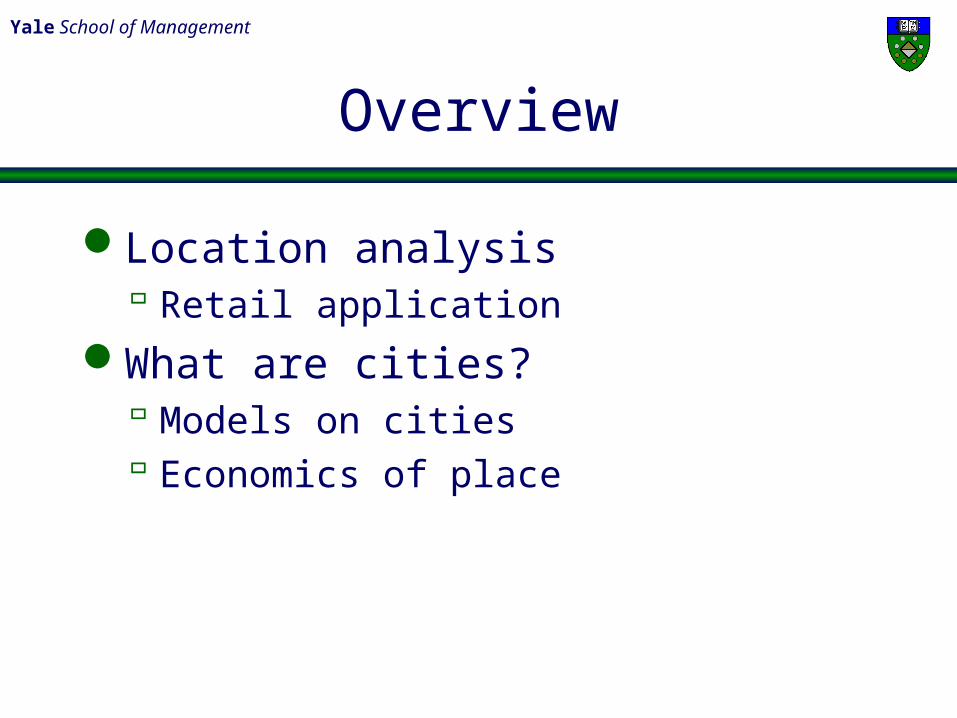
Overview
Location analysis Retail application
What are cities? Models on cities Economics of place

Yale School of Management
Location Analysis
Where to place a marketHow to estimate salesHow to factor in competition

Yale School of Management
Retail Real Estate
Variety Specialty Limited Line Department Mass Merchandise Discount Warehouse

Yale School of Management
Types of Shopping Centers
Name Radius Building Area GLA
Convenience/ Neighborhood
6 min. 30-100 KSF same
Community 15 min. 100-500 KSF same to 400 KSF
Regional 30+ min 500-1,000 KSF
300-800 KSF
Super-Regional 45 min. world
>1,000,000 SF
no limit

Yale School of Management
Mall Shape

Yale School of Management
Rationale
Anchors for Draw Shops for Impulse Finance:
Anchors own or lease cheaply Specialty shops pay percentage rents

Yale School of Management
Gravity Models
William Reilly (1929) "Retail Score Inversely Proportional to Distance"
Geographical Settlement Patterns Applications:
How many customers will come to the store? Where should we locate our store? What kind of store will work?

Yale School of Management
Example
Mall location analysis in ConnecticutTravel TimesPopulation CentersMall Size
Yale School of Management
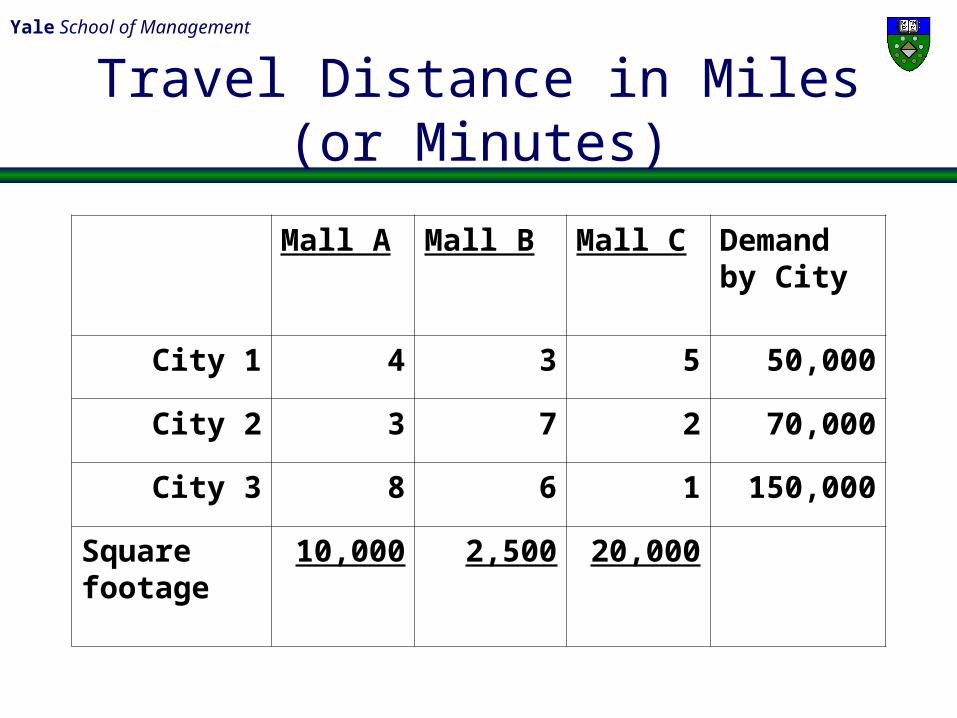
Travel Distance in Miles (or Minutes)
Mall A Mall B Mall C Demand by City
City 1 4 3 5 50,000
City 2 3 7 2 70,000
City 3 8 6 1 150,000
Square footage
10,000 2,500 20,000

Yale School of Management
A Gravity Score
Mall A Mall B Mall CScore: square
footage of space/distance 2,500.00 833.33 4,000.00
3,333.33 357.14 10,000.00
1,250.00 416.67 20,000.00
Sum of score by mall 7,083.33 1,607.14 34,000.00
e.g. 2,500=10,000/4

Yale School of Management
Market Share by Mall
Mall A Mall B Mall CMall market share of each city sales City 1 0.34 0.11 0.55Mall score/ sum of scores per city City 2 0.24 0.03 0.73
City 3 0.06 0.02 0.92
E.G. .34= 2,500/(2,500+833.33+4,000

Yale School of Management
Estimated Sales of Each Mall
Mall A Mall B Mall C Total
City 1 17,045.45 5,681.82 27,272.73 50,000
City 2 17,043.48 1,826.09 51,130.43 70,000
City 38,653.85 2,884.62 138,461.54 150,000
Market share times city demand
e.g. 17,045.45=.34x50,000

Yale School of Management
Issues
Linear modelMix of retailConsumer types Inter-position on locationsSayes’ law

Yale School of Management
Location
Cities from first principlesMonocentric city model
William Alonso (1964) Location and Land Use Richard Muth (1969) Cities and Housing
Transportation costsEmployment and shopping take place at one pointDemand for housing/budget constraintUtility for leisure time

Yale School of Management
Results
Housing prices (and rents) are a decreasing function of distance from CBD.
Shifts in transportation costs and travel times can be analyzed.
Calculus for understanding new structure of cities.
E.g. Rae (2004)

Yale School of Management
Another Approach
What are cities? Employment Shopping Social centers Private property Public amenities
What makes them grow?
Yale School of Management
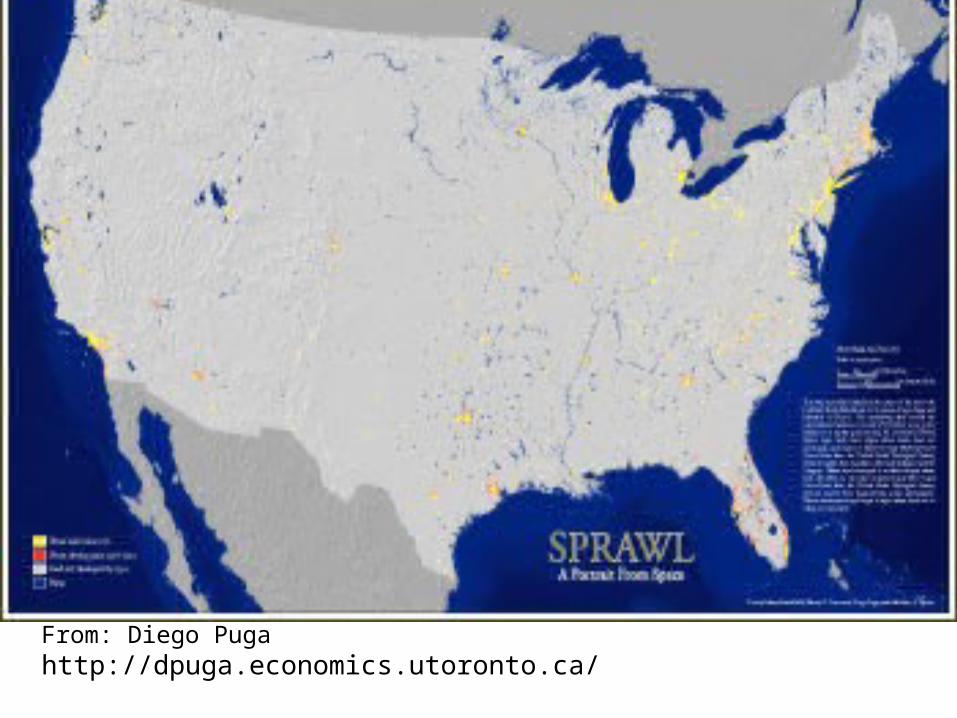
From: Diego Puga http://dpuga.economics.utoronto.ca/

Yale School of Management
Human Capital
Acquisition of labor is easier.Knowledge spillover leads to positive
externalities. Diversification (Jacobs/Glaeser)
Reduces labor riskCompetition
Leads to innovationSpecialization (Marshall/Arrow/Romer)
Develops particular technology

Yale School of Management
Goetzmann, Massa, Simonov
Specialization: the main industry in local employment / share of this same industry in national employment.
Competition: number of firms per employee in a district relative to the number of firms per employee in Sweden.
Diversity is the share of the next top (after the main one) five industries in municipal employment

Yale School of Management
Savings, Investment & Finance
Urban housing less risky Diversified industry base => smooth demand
Personal Portfolios Knowledge spillover & speculation Time and attention

Yale School of Management
Swedish Household Data
Variable Mean Median
Number of households 292,901 291,913
# of members in household 2.67 2.00
# of adults in household 1.77 2.00
Age of oldest household member 49.28 47
% with secondary education 43.5% 43.5%
% with higher education 31.4% 31.2%
% of immigrants 16.4% 16.3%

Yale School of Management
Wealth Variables
VariableRepresentation in
the sample Mean Median
Wealth-Tax Payers 7.9% 359,592 102,700
Real Estate Holders 54.6% 449,400 387,000
Labor Income Earners 100.0% 321,489 287,722
Entrepr. Income Earners 9.8% 88,114 43,268

Yale School of Management
Degree of Isolation and Equity Portfolio diversification
Population Density -50.00 (-3.04)
Index of Rural Areas 6.58 (19.03)
Distance from Airport 1.34 (4.09)

Yale School of Management
Local Professional Specialization and Equity Portfolio Diversification
Variable Coeff. t-stat
Competition -12.80 (-14.07)
Specialization -0.74 (-7.55)
Concentration -1088.10 (-22.70)

Yale School of Management
Under-Diversification
Linked to knowledge creation and spill-over in the urban environment.
Spillover that characterizes city agglomeration on the one hand reduces the availability of time to collect and analyze financial information
Increases the relative information that an investor has with respect to stocks professionally or geographically closer to him.

Yale School of Management
Cities
Provide investment opportunitiesRequire less risk hedgingResult in capital growth and more spillover

Yale School of Management
Creating Cities
Costa Mesa, CAWorld Financial CenterCanary Wharf, LondonDubai, UAE