Embed Size (px)
Citation preview
Y376 IPE:Y376 IPE:Oil PoliticsOil Politics
February 20, 2012February 20, 2012
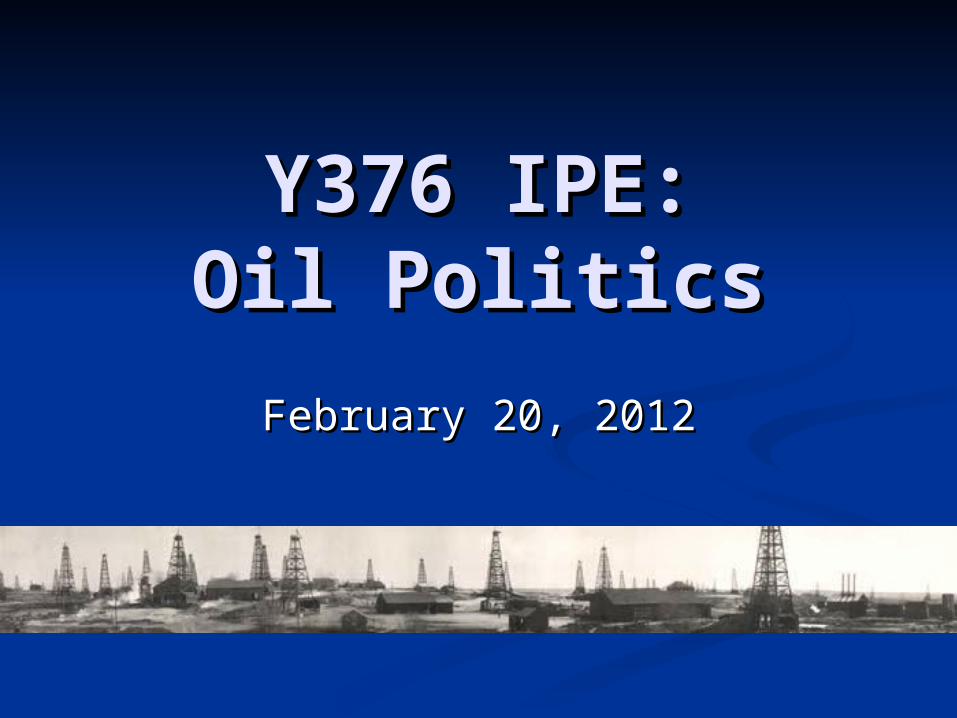
World Energy World Energy Consumption, 1965-Consumption, 1965-
2005, in Terawatts (TW)2005, in Terawatts (TW)
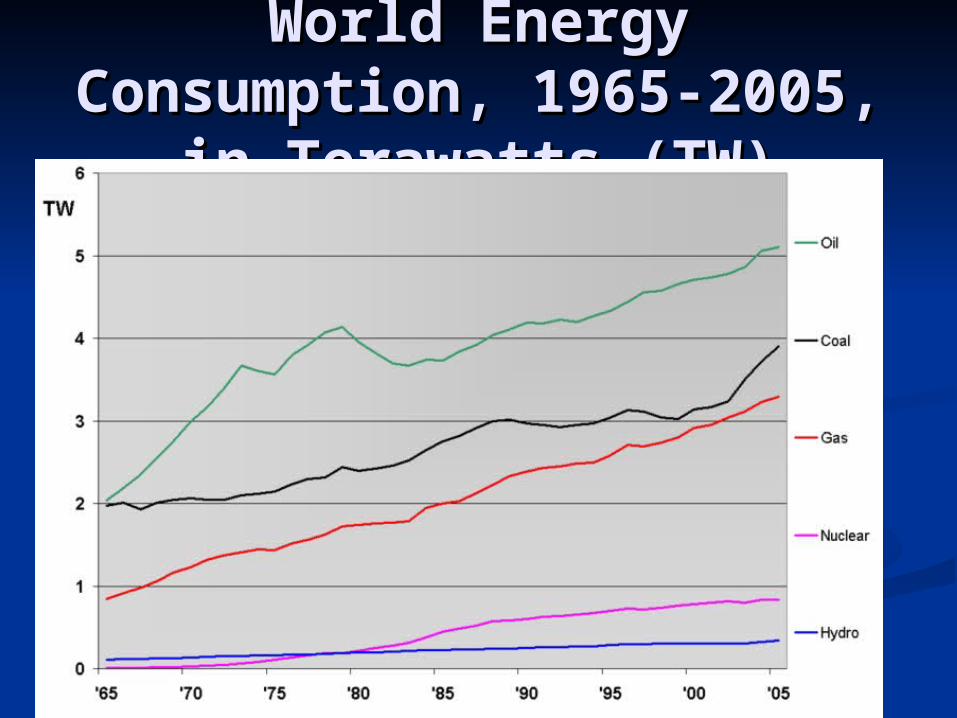
Projected Future Energy Projected Future Energy UseUse
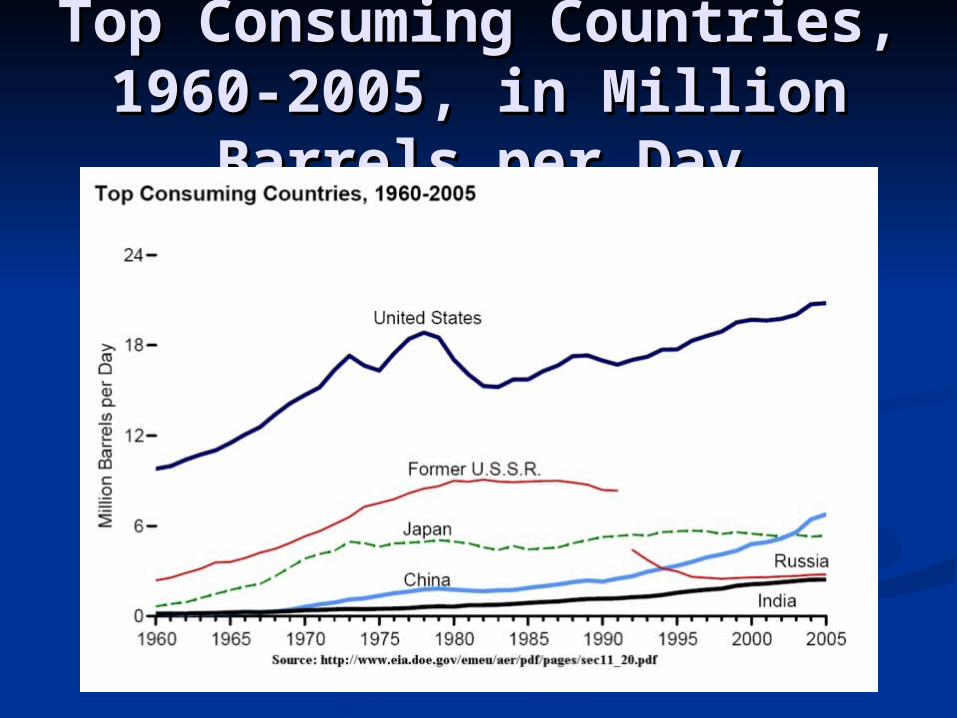
Top Consuming Top Consuming Countries, 1960-2005, in Countries, 1960-2005, in Million Barrels per DayMillion Barrels per Day
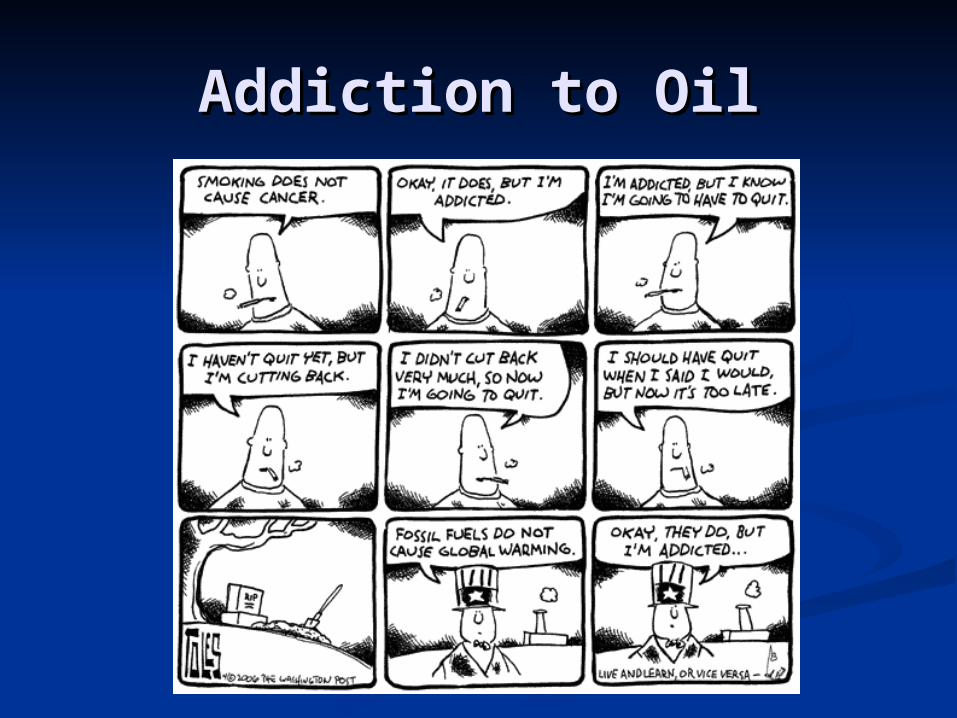
Addiction to OilAddiction to Oil
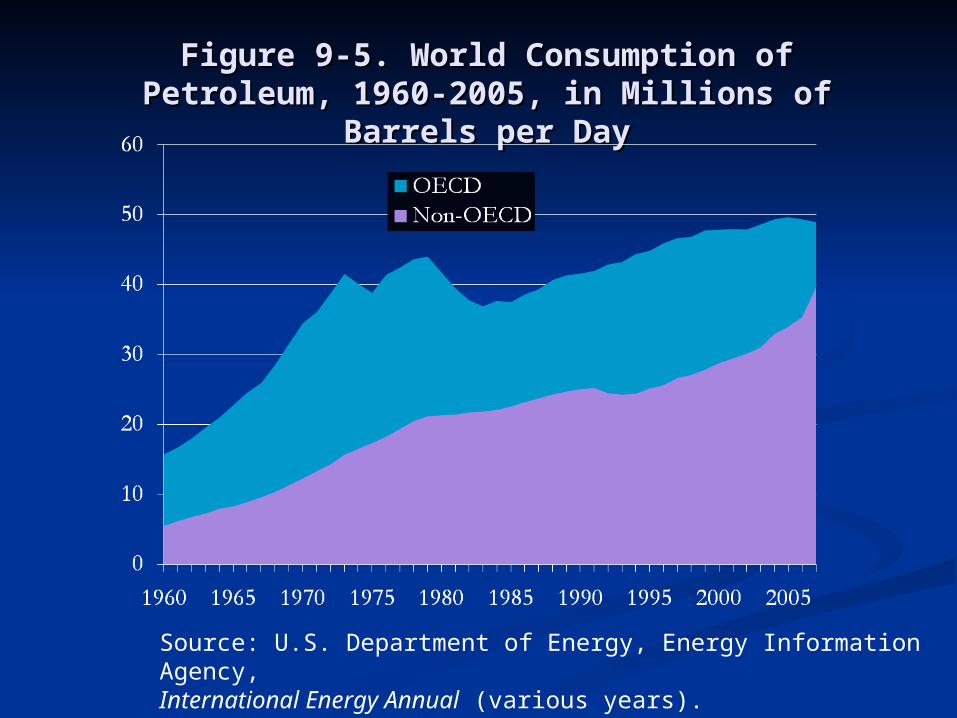
Figure 9-5. World Consumption of Figure 9-5. World Consumption of Petroleum, 1960-2005, in Millions of Petroleum, 1960-2005, in Millions of
Barrels per DayBarrels per Day
Source: U.S. Department of Energy, Energy Information Agency,International Energy Annual (various years).
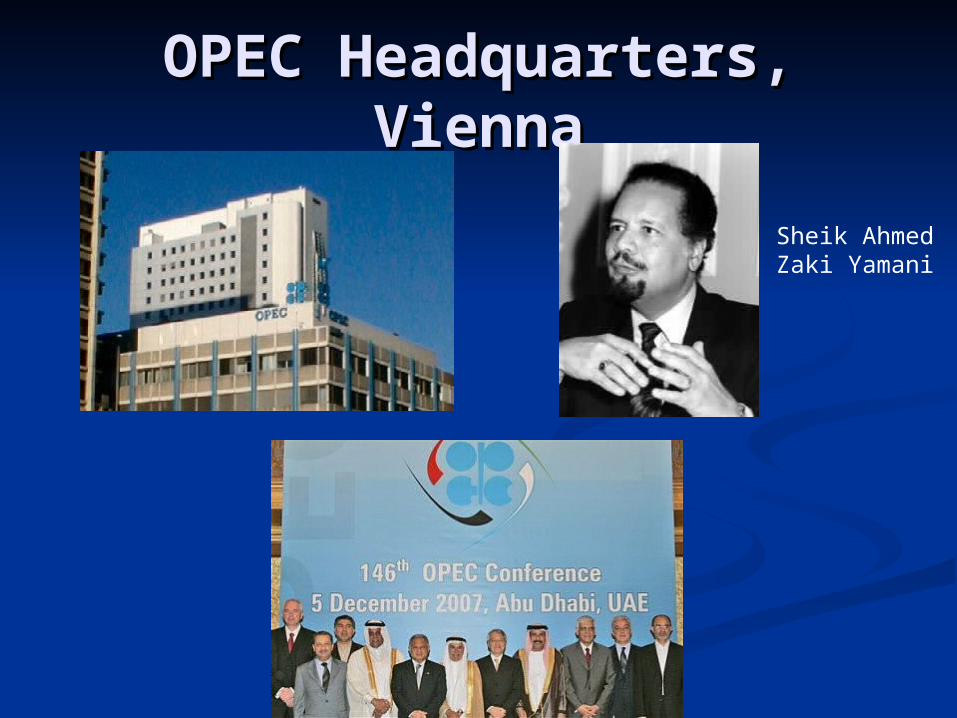
OPEC Headquarters, OPEC Headquarters, ViennaVienna
Sheik AhmedZaki Yamani
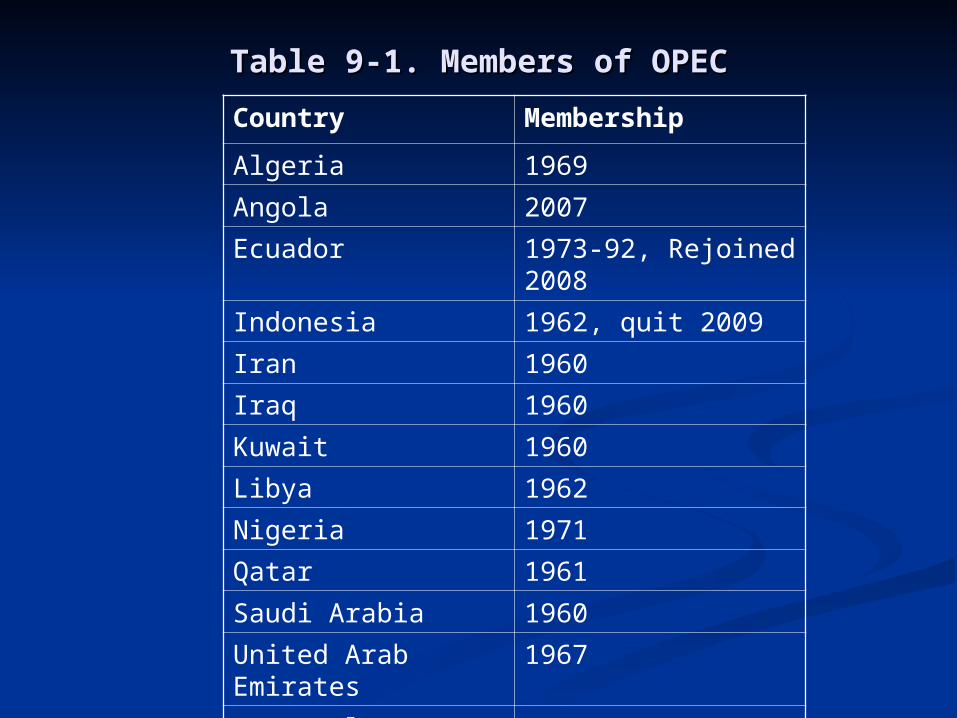
Table 9-1. Members of OPECTable 9-1. Members of OPEC
Country Membership
Algeria 1969
Angola 2007
Ecuador 1973-92, Rejoined 2008
Indonesia 1962, quit 2009
Iran 1960
Iraq 1960
Kuwait 1960
Libya 1962
Nigeria 1971
Qatar 1961
Saudi Arabia 1960
United Arab Emirates 1967
Venezuela 1960
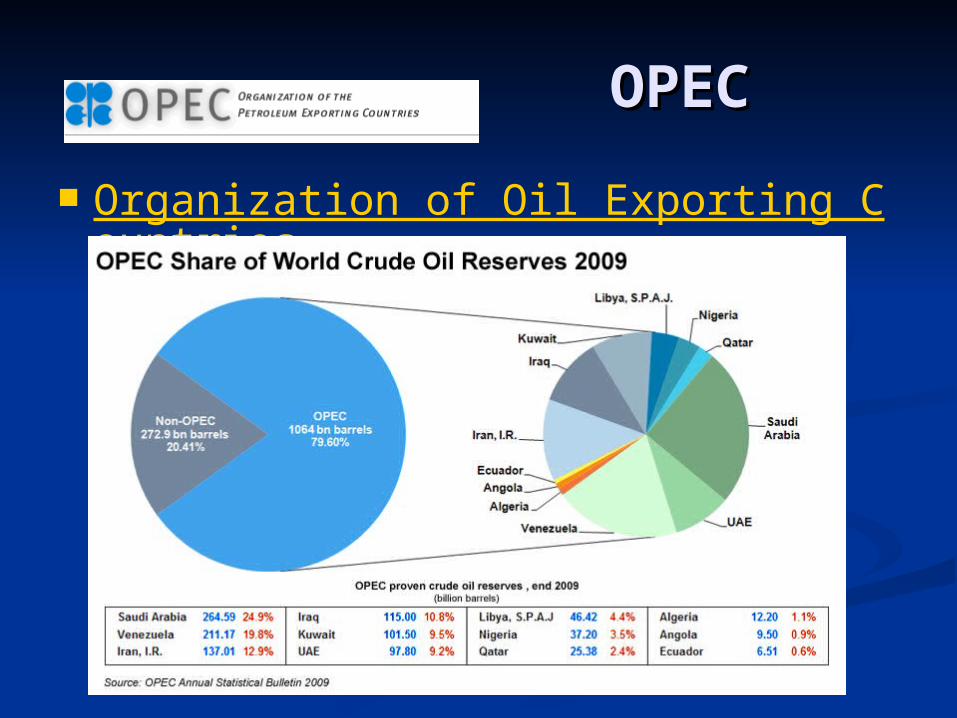
OPECOPEC
Organization of Oil Exporting Countries
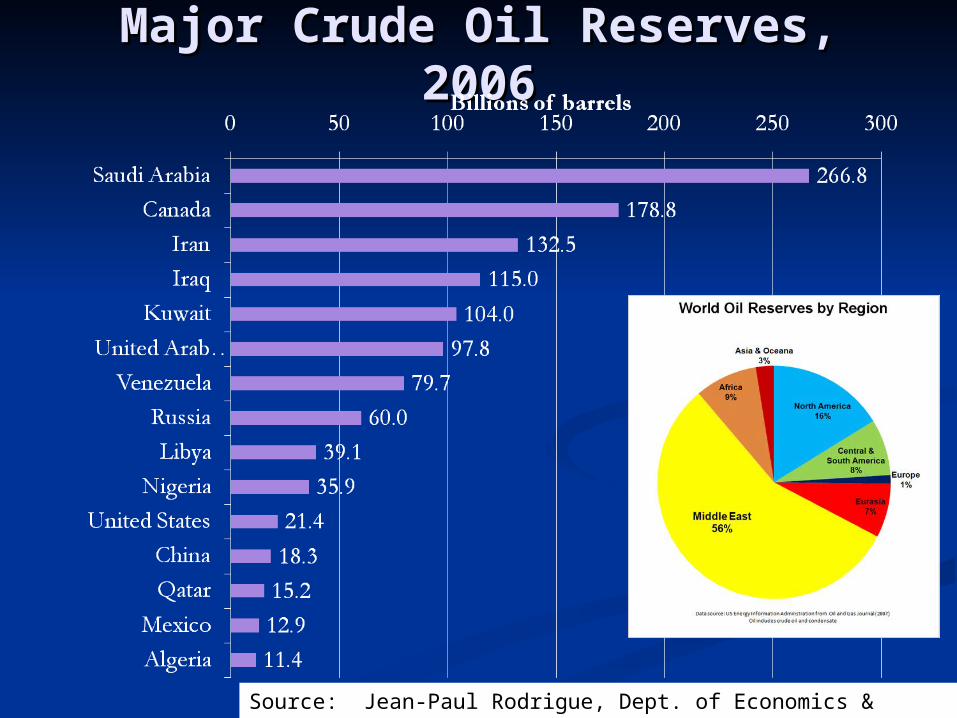
Major Crude Oil Reserves, Major Crude Oil Reserves, 20062006
Source: Jean-Paul Rodrigue, Dept. of Economics & Geography, Hofstra University
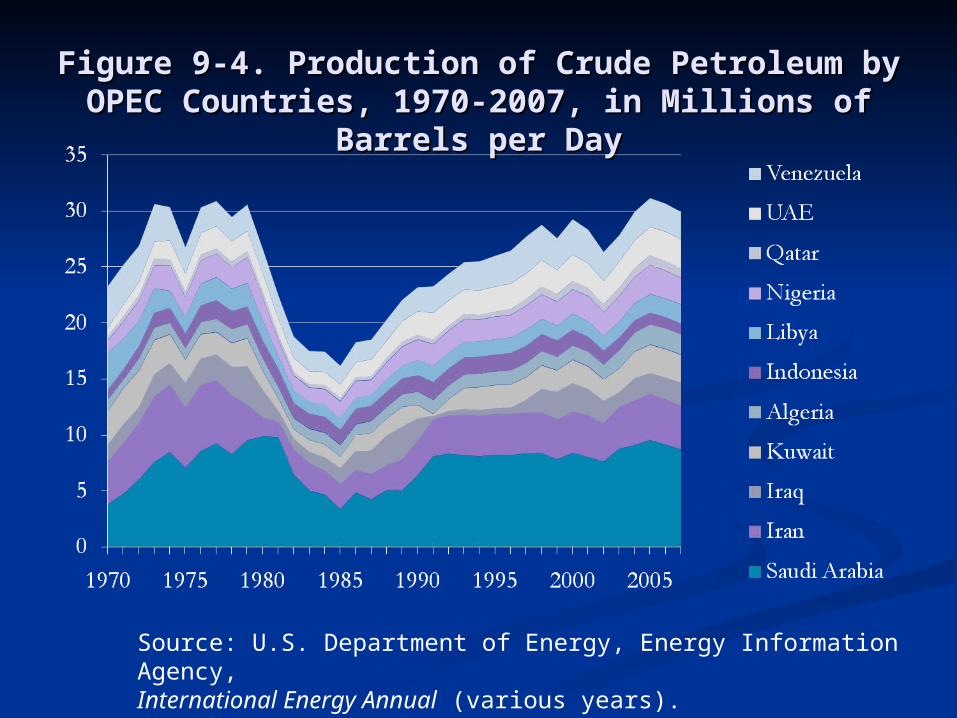
Figure 9-4. Production of Crude Petroleum by Figure 9-4. Production of Crude Petroleum by OPEC Countries, 1970-2007, in Millions of OPEC Countries, 1970-2007, in Millions of
Barrels per DayBarrels per Day
Source: U.S. Department of Energy, Energy Information Agency,International Energy Annual (various years).
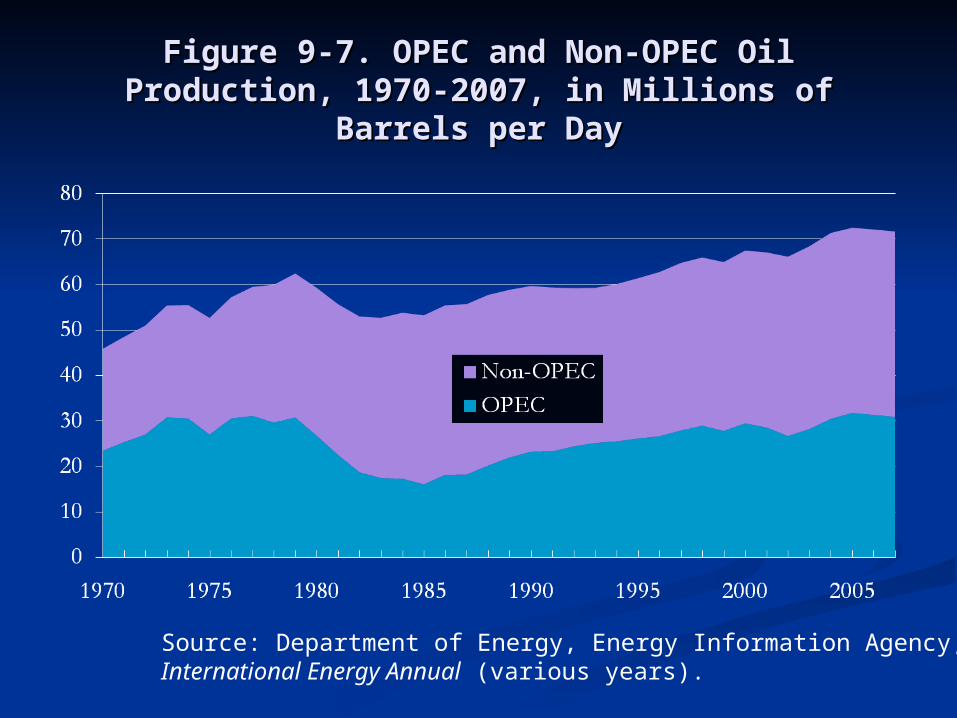
Figure 9-7. OPEC and Non-OPEC Oil Figure 9-7. OPEC and Non-OPEC Oil Production, 1970-2007, in Millions of Barrels Production, 1970-2007, in Millions of Barrels
per Dayper Day
Source: Department of Energy, Energy Information Agency,International Energy Annual (various years).
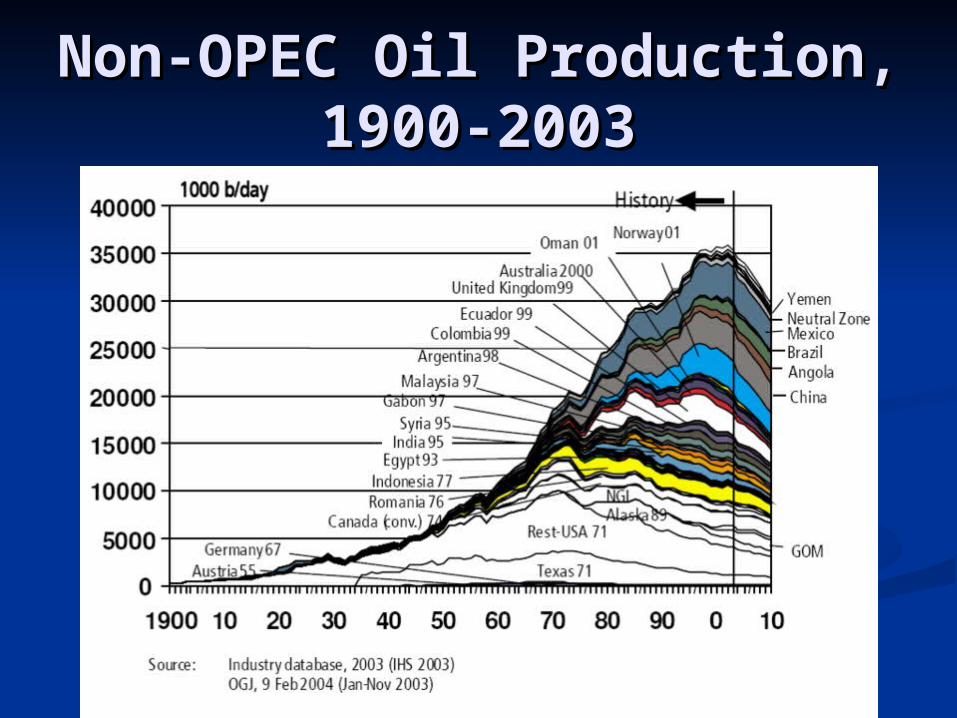
Non-OPEC Oil Non-OPEC Oil Production, 1900-2003Production, 1900-2003
Middle EastNorth AmericaLatin AmericaAfricaWestern EuropeFormer Soviet UnionPacific Asia
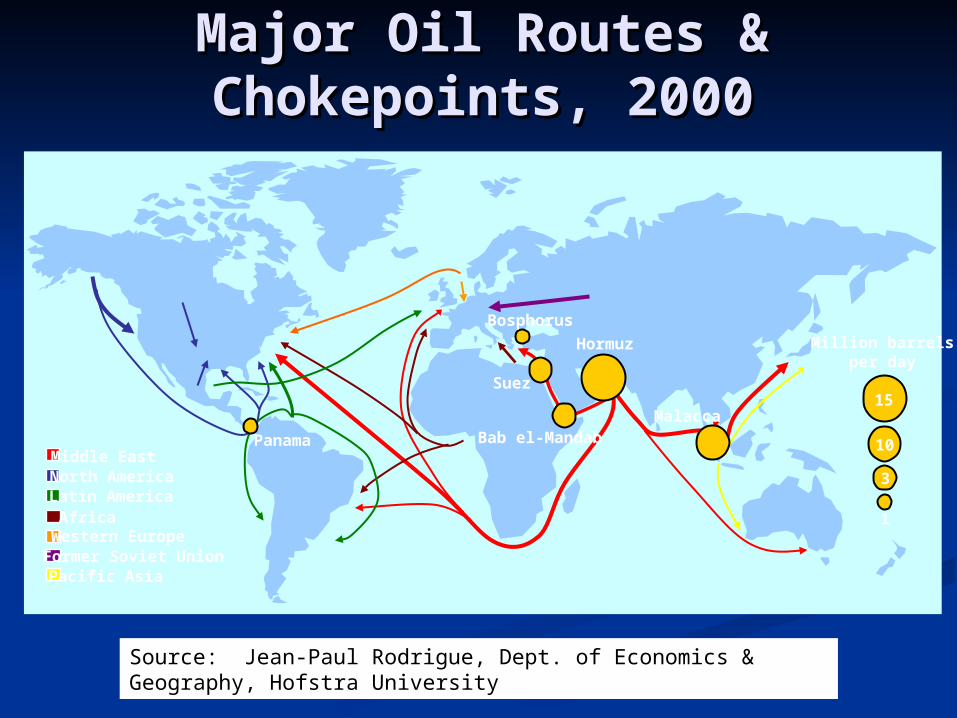
Major Oil Routes & Major Oil Routes & Chokepoints, 2000Chokepoints, 2000
15
10
3
1
Million barrelsper day
Hormuz
MalaccaBab el-Mandab
Suez
Bosphorus
Panama
Source: Jean-Paul Rodrigue, Dept. of Economics & Geography, Hofstra University
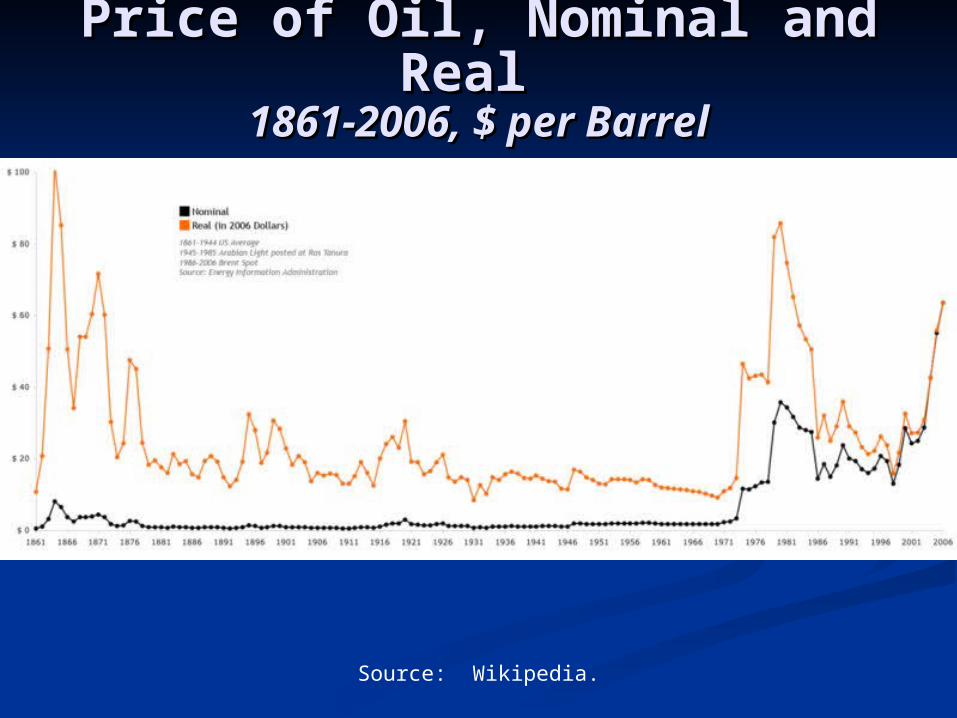
Price of Oil, Nominal and Price of Oil, Nominal and Real Real
1861-2006, $ per Barrel1861-2006, $ per Barrel
Source: Wikipedia.
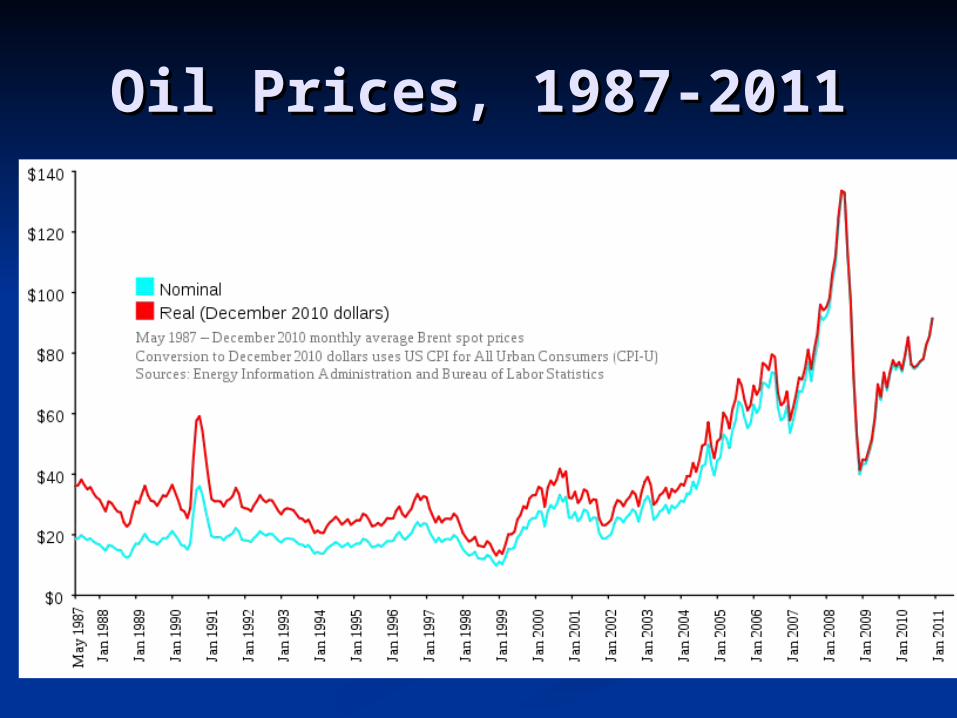
Oil Prices, 1987-2011Oil Prices, 1987-2011
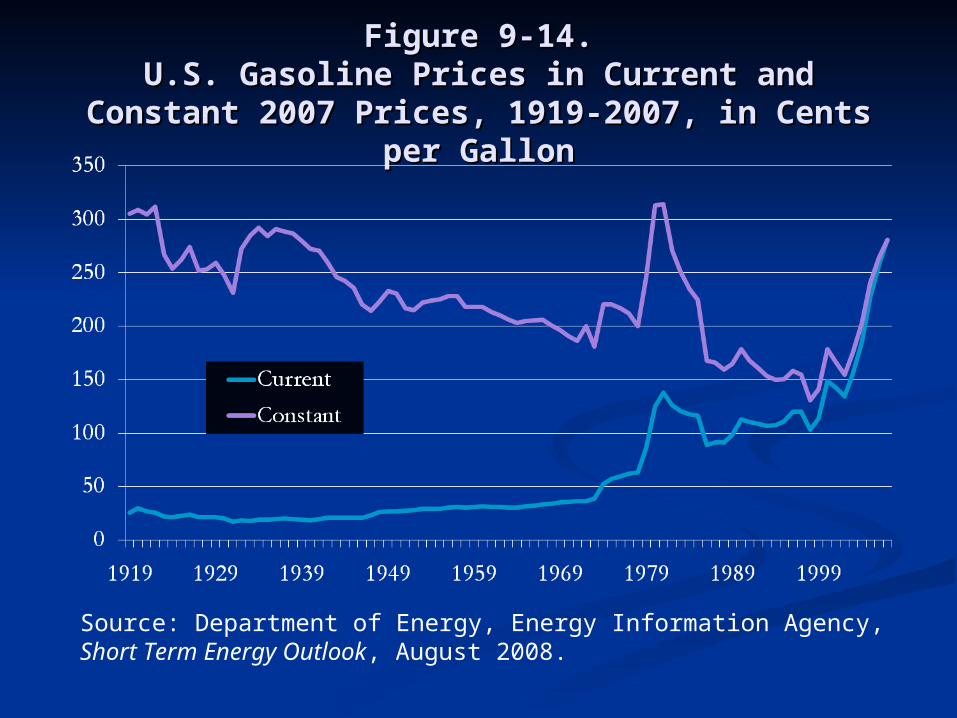
Figure 9-14.Figure 9-14.U.S. Gasoline Prices in Current and U.S. Gasoline Prices in Current and
Constant 2007 Prices, 1919-2007, in Cents Constant 2007 Prices, 1919-2007, in Cents per Gallonper Gallon
Source: Department of Energy, Energy Information Agency,Short Term Energy Outlook, August 2008.
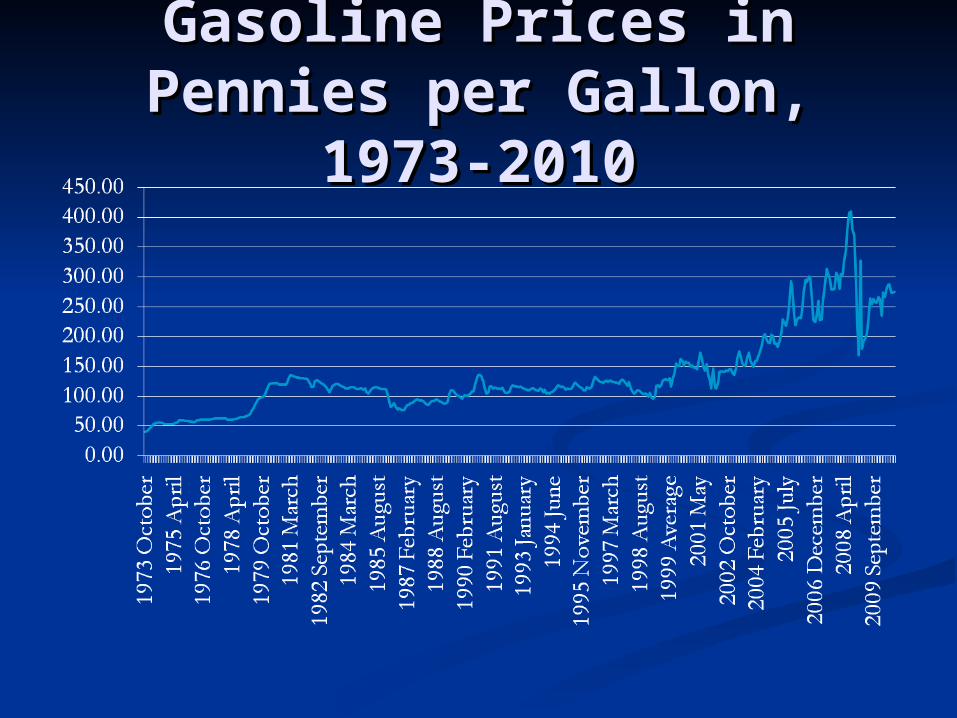
Gasoline Prices in Gasoline Prices in Pennies per Gallon, Pennies per Gallon,
1973-20101973-2010
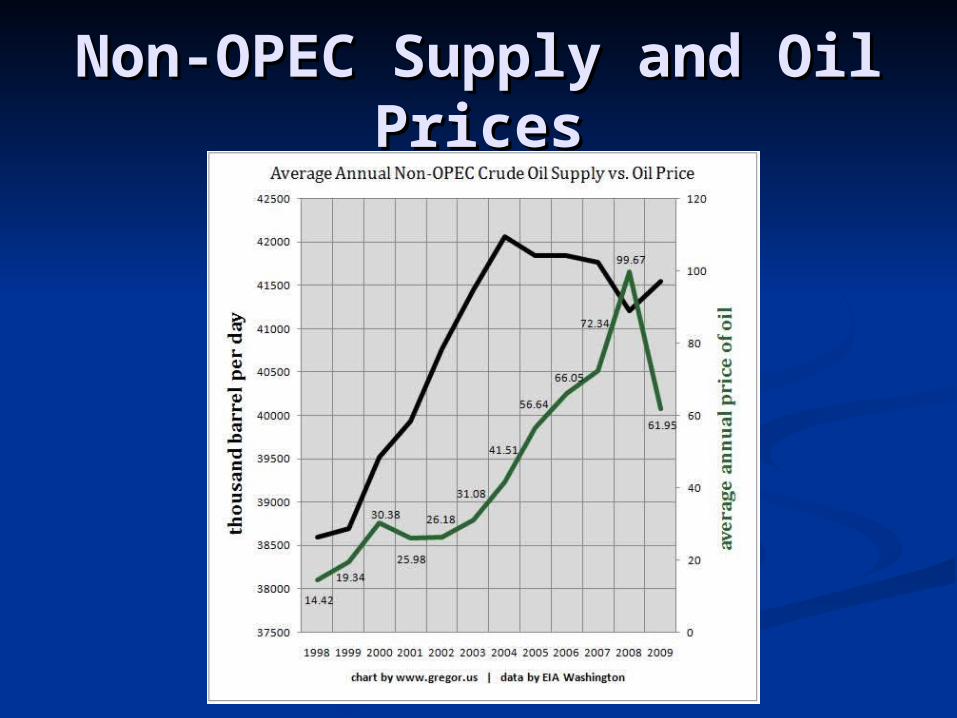
Non-OPEC Supply and Non-OPEC Supply and Oil PricesOil Prices
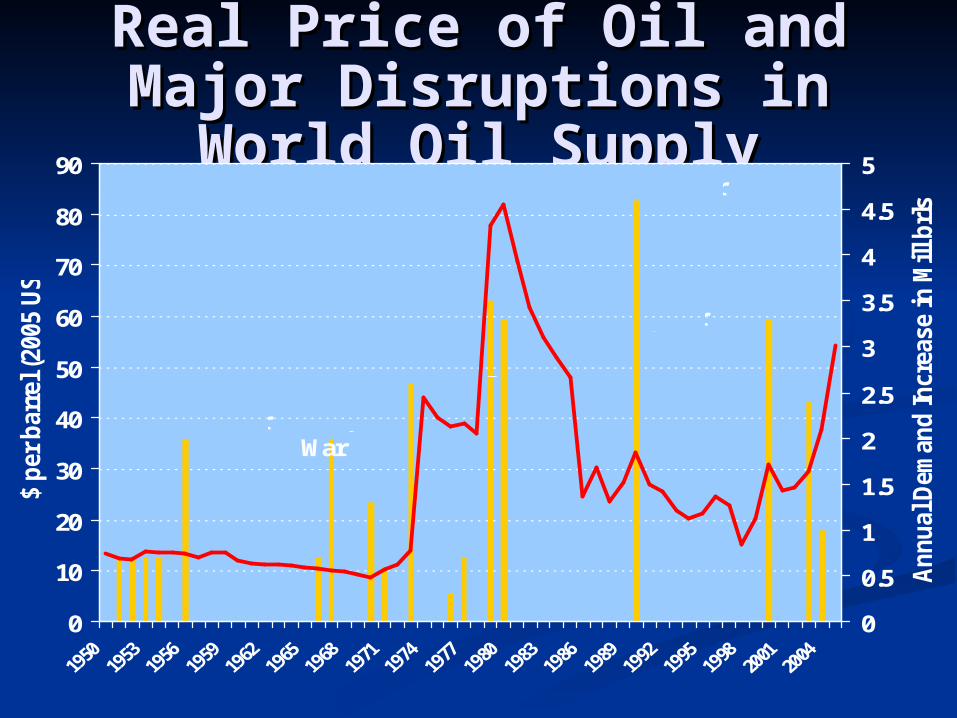
Real Price of Oil and Real Price of Oil and Major Disruptions in Major Disruptions in
World Oil SupplyWorld Oil Supply
0
10
20
30
40
50
60
70
80
90
$ p
er b
arre
l (20
05 U
S$)
0
0.5
1
1.5
2
2.5
3
3.5
4
4.5
5
An
nu
al D
eman
d In
crea
se in
Mill
brl
s/d
ay
Suez War
OPEC Embargo
6 Days War
Iranian Revolution
Iran / Iraq War
Gulf War
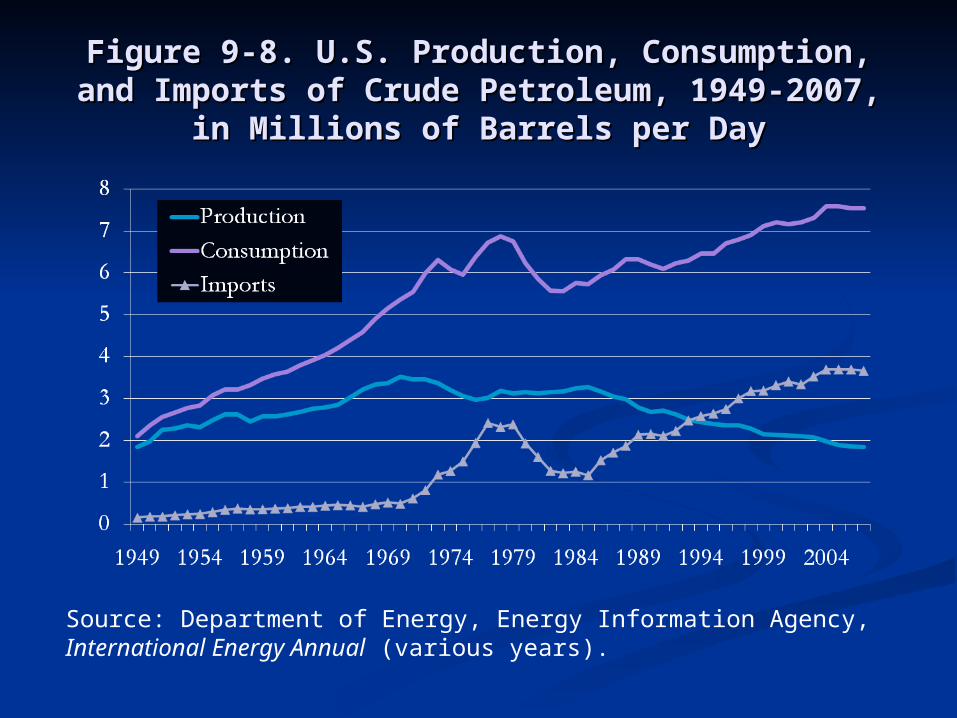
Figure 9-8. U.S. Production, Consumption, and Figure 9-8. U.S. Production, Consumption, and Imports of Crude Petroleum, 1949-2007, in Imports of Crude Petroleum, 1949-2007, in
Millions of Barrels per DayMillions of Barrels per Day
Source: Department of Energy, Energy Information Agency,International Energy Annual (various years).
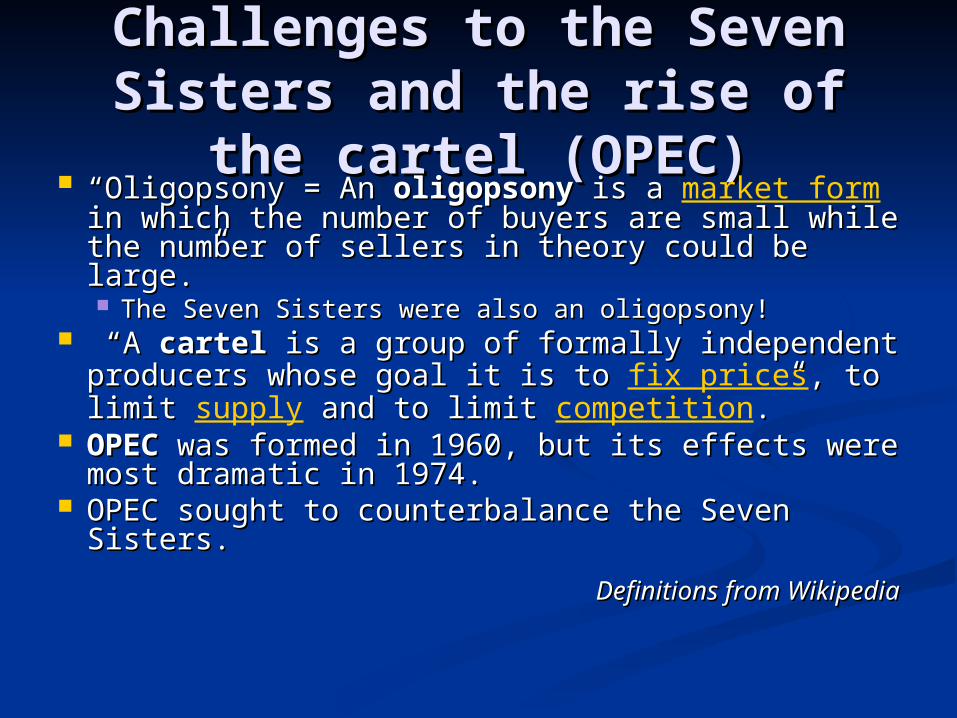
Challenges to the Seven Challenges to the Seven Sisters and the rise of the Sisters and the rise of the
cartel (OPEC)cartel (OPEC) ““Oligopsony = An Oligopsony = An oligopsonyoligopsony is a is a
market form in which the number of buyers in which the number of buyers are small while the number of sellers in theory are small while the number of sellers in theory could be large.”could be large.” The Seven Sisters were also an oligopsony!The Seven Sisters were also an oligopsony!
“ “A A cartelcartel is a group of formally independent is a group of formally independent producers whose goal it is to producers whose goal it is to fix prices, to , to limit limit supply and to limit and to limit competition.”.”
OPEC OPEC was formed in 1960, but its effects was formed in 1960, but its effects were most dramatic in 1974.were most dramatic in 1974.
OPEC sought to counterbalance the Seven OPEC sought to counterbalance the Seven Sisters.Sisters.
Definitions from WikipediaDefinitions from Wikipedia
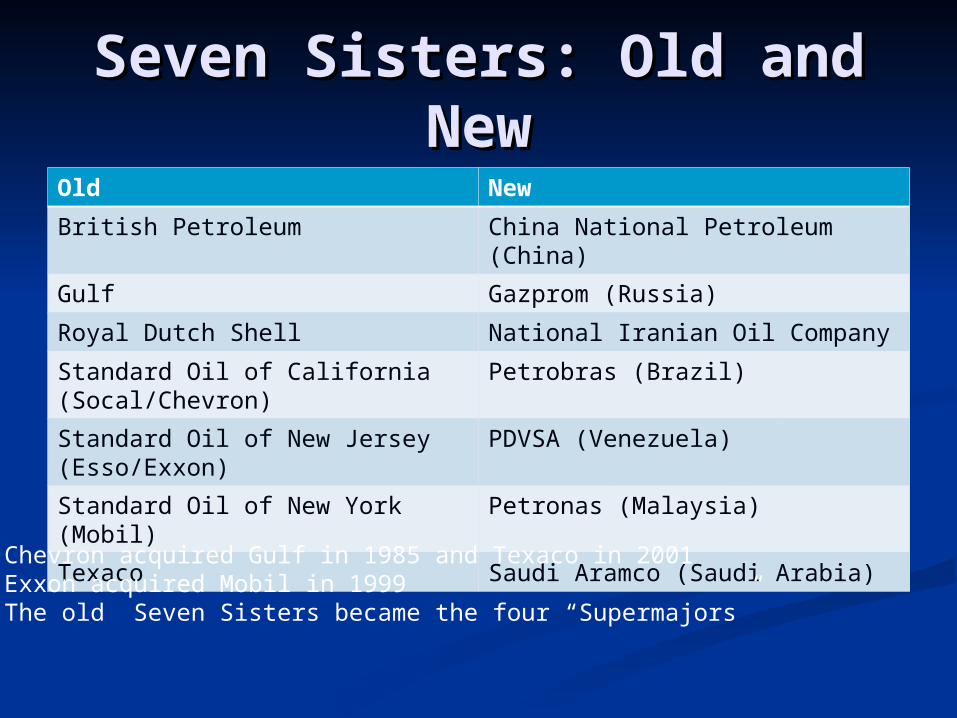
Seven Sisters: Old and Seven Sisters: Old and NewNew
Old New
British Petroleum China National Petroleum (China)
Gulf Gazprom (Russia)
Royal Dutch Shell National Iranian Oil Company
Standard Oil of California (Socal/Chevron)
Petrobras (Brazil)
Standard Oil of New Jersey (Esso/Exxon)
PDVSA (Venezuela)
Standard Oil of New York (Mobil) Petronas (Malaysia)
Texaco Saudi Aramco (Saudi Arabia)Chevron acquired Gulf in 1985 and Texaco in 2001Exxon acquired Mobil in 1999The old Seven Sisters became the four “Supermajors”
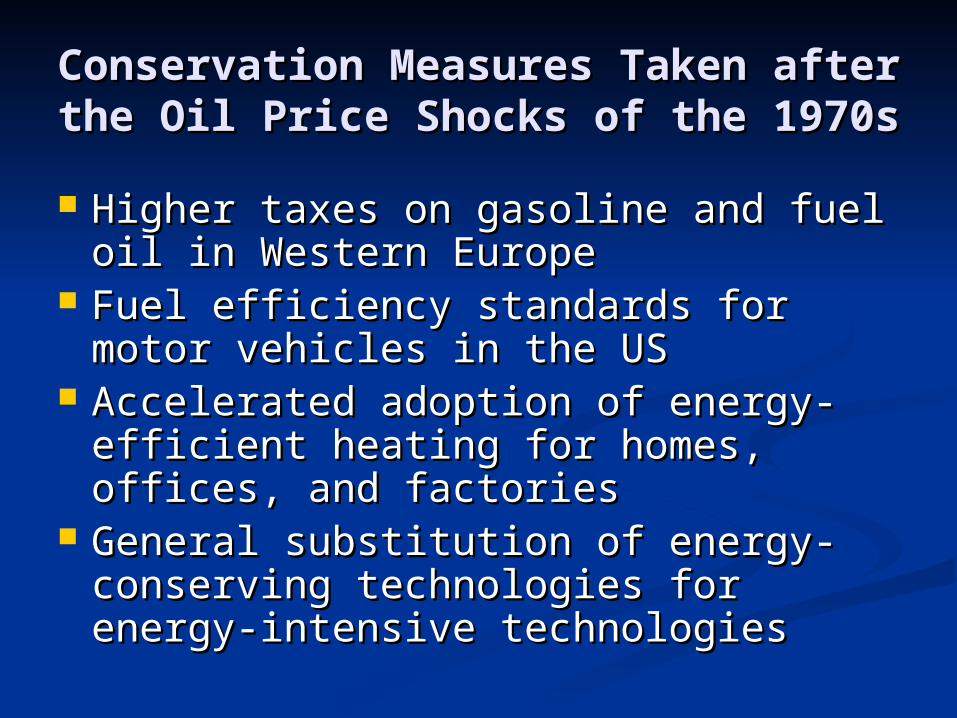
Conservation Measures Taken Conservation Measures Taken after the Oil Price Shocks of the after the Oil Price Shocks of the
1970s1970s Higher taxes on gasoline and fuel oil Higher taxes on gasoline and fuel oil
in Western Europein Western Europe Fuel efficiency standards for motor Fuel efficiency standards for motor
vehicles in the USvehicles in the US Accelerated adoption of energy-Accelerated adoption of energy-
efficient heating for homes, offices, efficient heating for homes, offices, and factoriesand factories
General substitution of energy-General substitution of energy-conserving technologies for energy-conserving technologies for energy-intensive technologiesintensive technologies
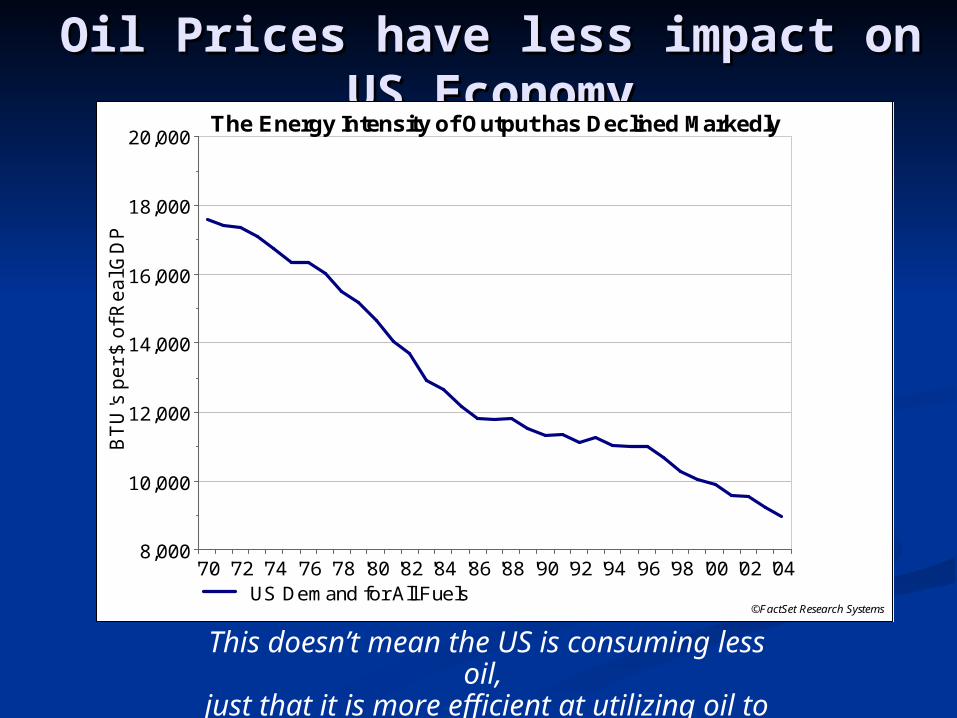
Oil Prices have less impact on US Oil Prices have less impact on US EconomyEconomy
'70 '72 '74 '76 '78 '80 '82 '84 '86 '88 '90 '92 '94 '96 '98 '00 '02 '048,000
10,000
12,000
14,000
16,000
18,000
20,000B
TU
's p
er
$ o
f Re
al G
DP
©FactSet Research Systems
The Energy Intensity of Output has Declined Markedly
US Demand for All Fuels
This doesn’t mean the US is consuming less oil,
just that it is more efficient at utilizing oil to produce

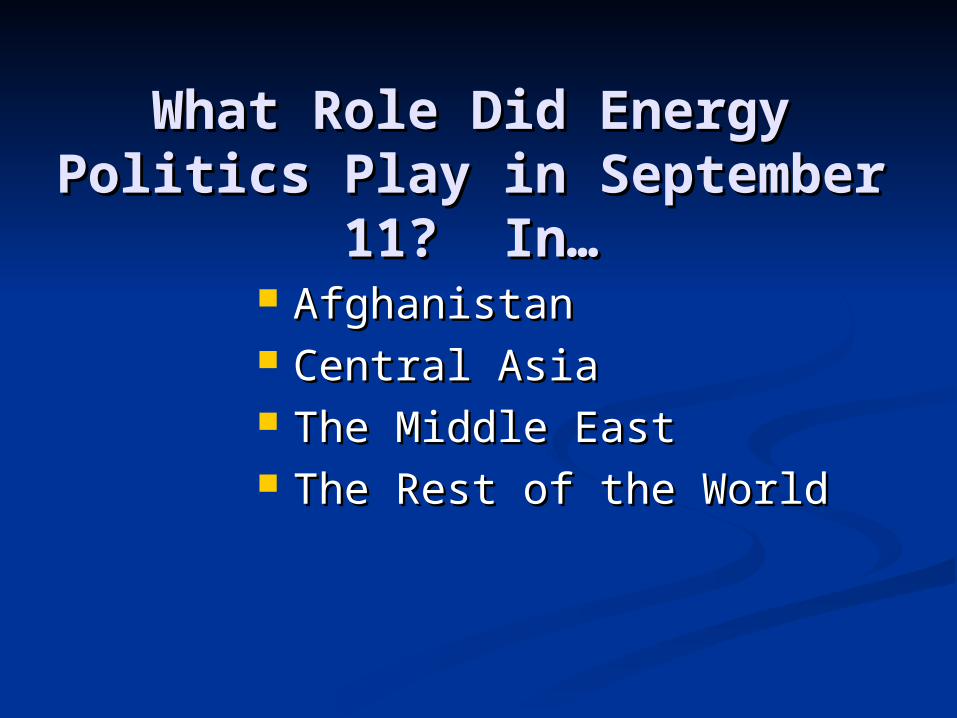
What Role Did Energy What Role Did Energy Politics Play in September Politics Play in September
11? In…11? In… AfghanistanAfghanistan Central AsiaCentral Asia The Middle EastThe Middle East The Rest of the WorldThe Rest of the World

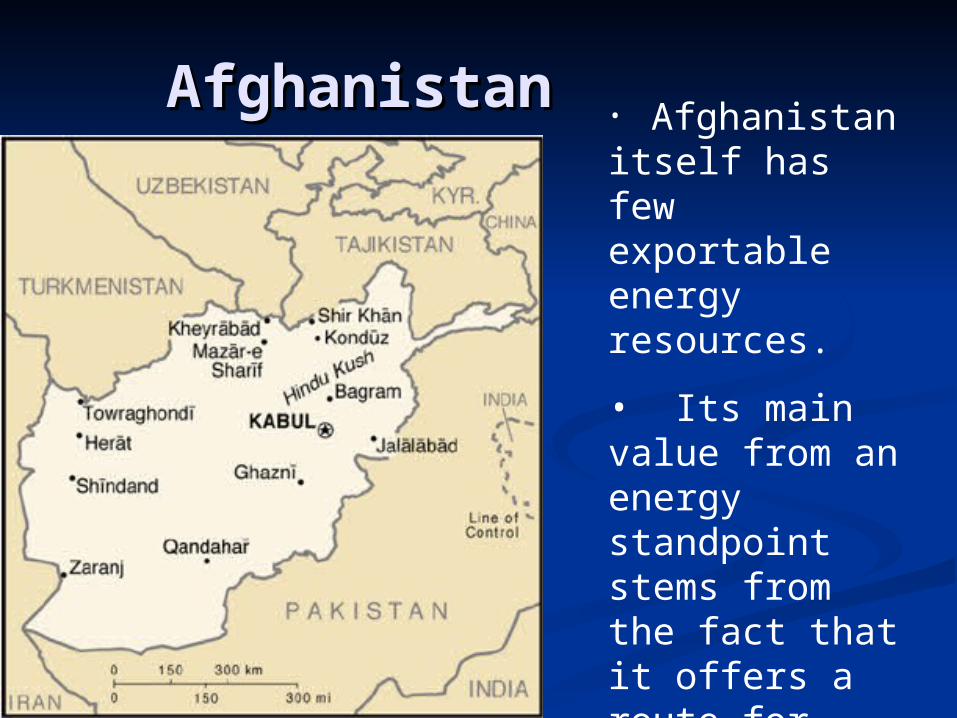
AfghanistanAfghanistan• Afghanistan itself has few exportable energy resources.
• Its main value from an energy standpoint stems from the fact that it offers a route for Caspian energy to the sea via Pakistan.

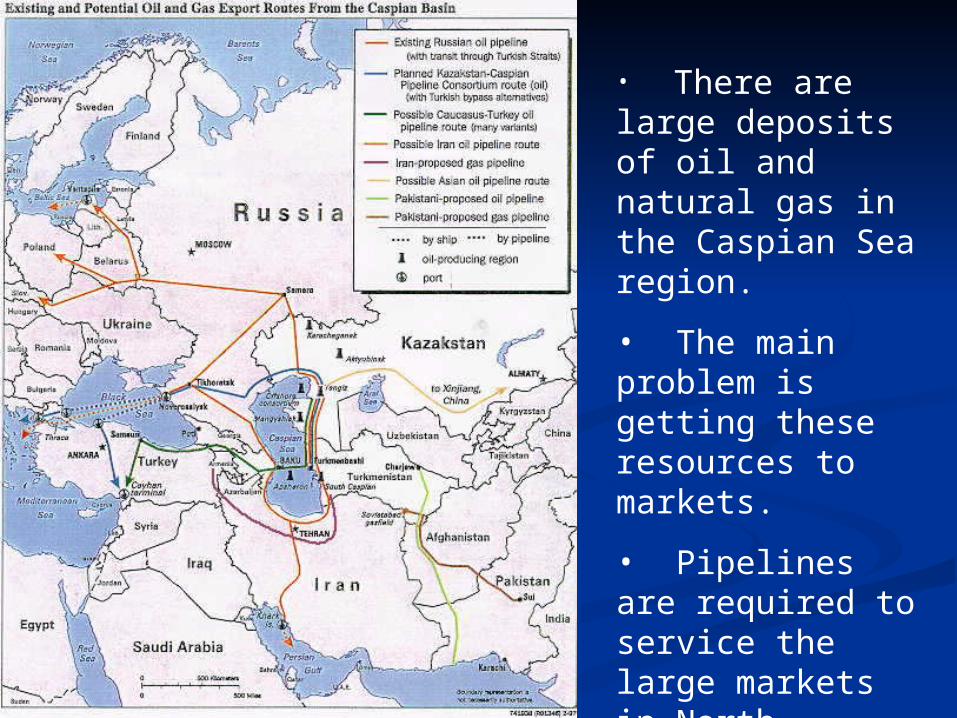
• There are large deposits of oil and natural gas in the Caspian Sea region.
• The main problem is getting these resources to markets.
• Pipelines are required to service the large markets in North America, Europe, and E. Asia.

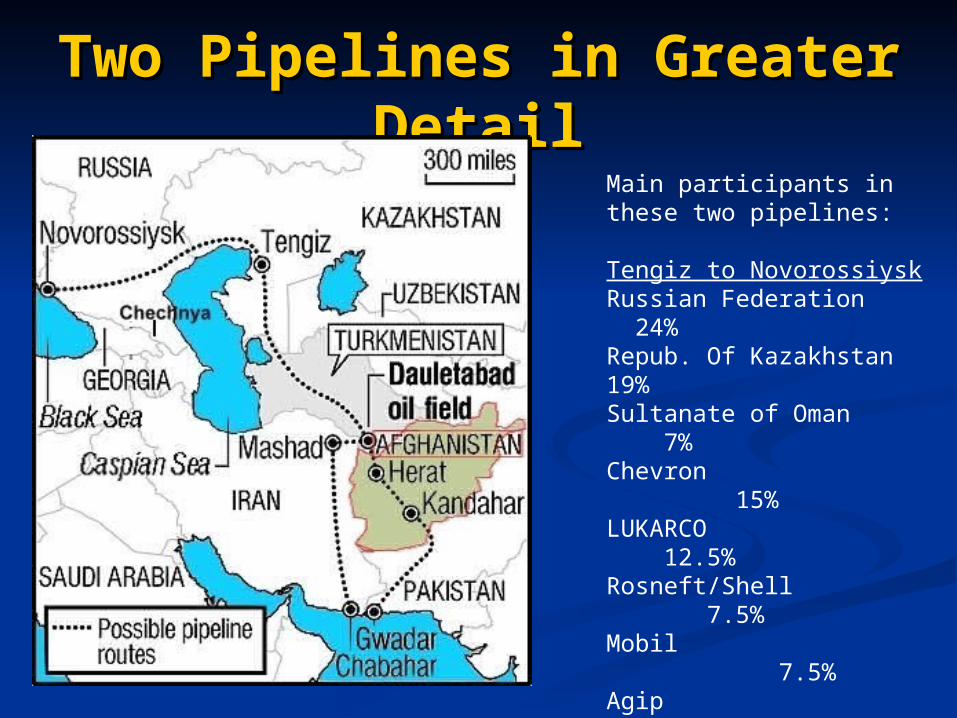
Two Pipelines in Greater DetailTwo Pipelines in Greater DetailMain participants in these two pipelines:
Tengiz to NovorossiyskRussian Federation 24%Repub. Of Kazakhstan 19%Sultanate of Oman 7%Chevron 15%LUKARCO 12.5%Rosneft/Shell 7.5%Mobil 7.5%Agip 2%
Turkmenistan to Pakistan:Unocal, Gazprom, Hyundai,Itochu, Delta Oil (Saudi Arabia)

What is the Role of Saudi Arabia What is the Role of Saudi Arabia within OPEC?within OPEC?
It is the largest single supplier of oil.It is the largest single supplier of oil. The small Saudi population permits The small Saudi population permits
them the luxury of varying the them the luxury of varying the amount of oil that they sell (thereby amount of oil that they sell (thereby controlling prices):controlling prices): When they want the price to increase When they want the price to increase
they sell lessthey sell less When they want the price to decrease When they want the price to decrease
they sell morethey sell more
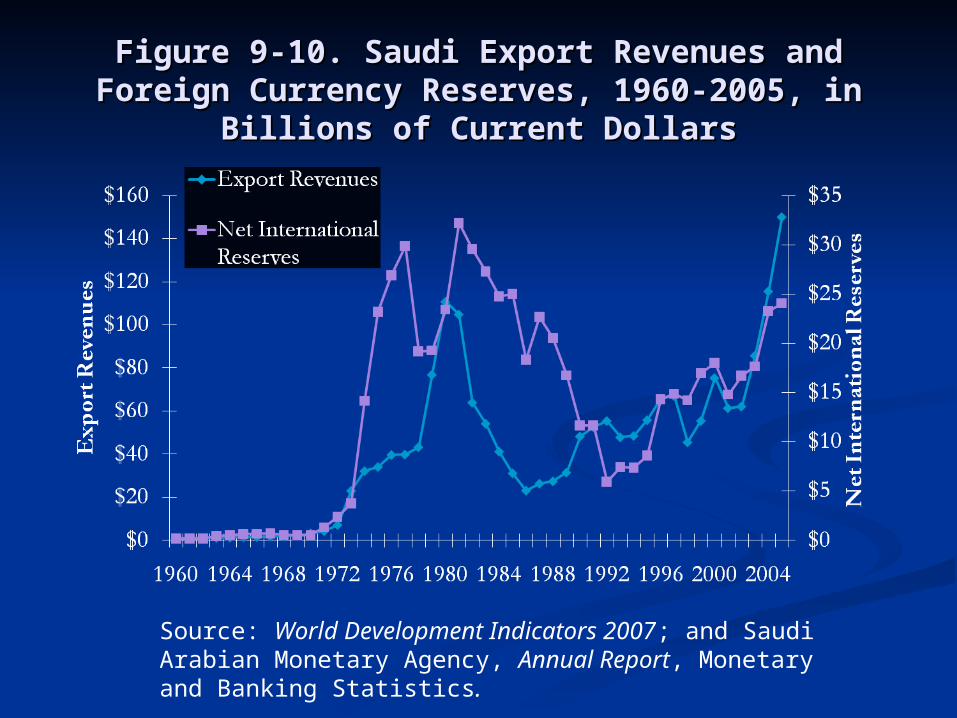
Figure 9-10. Saudi Export Revenues and Figure 9-10. Saudi Export Revenues and Foreign Currency Reserves, 1960-2005, in Foreign Currency Reserves, 1960-2005, in
Billions of Current DollarsBillions of Current Dollars
Source: World Development Indicators 2007; and Saudi Arabian Monetary Agency, Annual Report, Monetary and Banking Statistics.
What Role Did Energy What Role Did Energy Politics Play in September Politics Play in September
11? In…11? In… AfghanistanAfghanistan Central AsiaCentral Asia The Middle EastThe Middle East The Rest of the WorldThe Rest of the World
AfghanistanAfghanistan• Afghanistan itself has few exportable energy resources.
• Its main value from an energy standpoint stems from the fact that it offers a route for Caspian energy to the sea via Pakistan.
• There are large deposits of oil and natural gas in the Caspian Sea region.
• The main problem is getting these resources to markets.
• Pipelines are required to service the large markets in North America, Europe, and E. Asia.
Two Pipelines in Greater DetailTwo Pipelines in Greater DetailMain participants in these two pipelines:
Tengiz to NovorossiyskRussian Federation 24%Repub. Of Kazakhstan 19%Sultanate of Oman 7%Chevron 15%LUKARCO 12.5%Rosneft/Shell 7.5%Mobil 7.5%Agip 2%
Turkmenistan to Pakistan:Unocal, Gazprom, Hyundai,Itochu, Delta Oil (Saudi Arabia)
What is the Role of Saudi Arabia What is the Role of Saudi Arabia within OPEC?within OPEC?
It is the largest single supplier of oil.It is the largest single supplier of oil. The small Saudi population permits The small Saudi population permits
them the luxury of varying the them the luxury of varying the amount of oil that they sell (thereby amount of oil that they sell (thereby controlling prices):controlling prices): When they want the price to increase When they want the price to increase
they sell lessthey sell less When they want the price to decrease When they want the price to decrease
they sell morethey sell more

Figure 9-10. Saudi Export Revenues and Figure 9-10. Saudi Export Revenues and Foreign Currency Reserves, 1960-2005, in Foreign Currency Reserves, 1960-2005, in
Billions of Current DollarsBillions of Current Dollars
Source: World Development Indicators 2007; and Saudi Arabian Monetary Agency, Annual Report, Monetary and Banking Statistics.
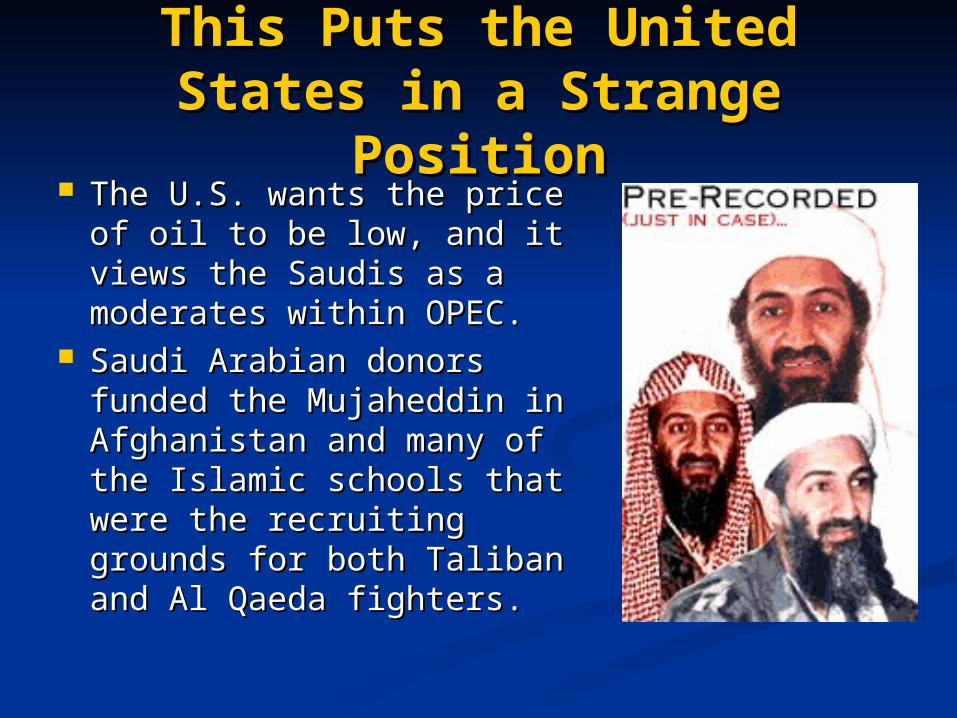
This Puts the United States in a This Puts the United States in a Strange PositionStrange Position
The U.S. wants the price The U.S. wants the price of oil to be low, and it of oil to be low, and it views the Saudis as a views the Saudis as a moderates within OPEC.moderates within OPEC.
Saudi Arabian donors Saudi Arabian donors funded the Mujaheddin funded the Mujaheddin in Afghanistan and many in Afghanistan and many of the Islamic schools of the Islamic schools that were the recruiting that were the recruiting grounds for both Taliban grounds for both Taliban and Al Qaeda fighters.and Al Qaeda fighters.
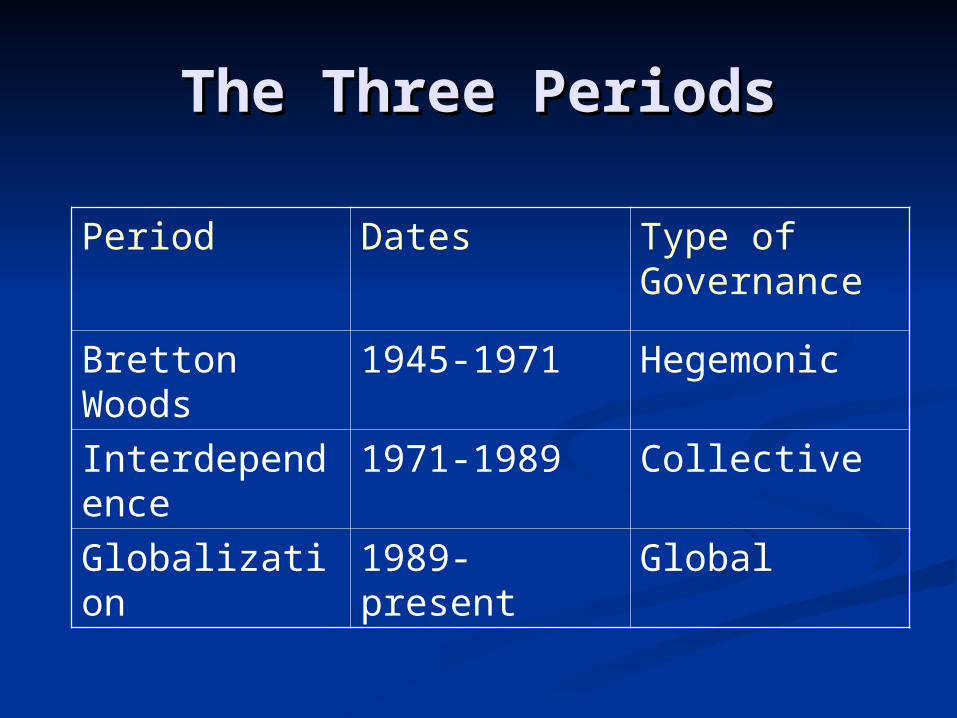
The Three PeriodsThe Three Periods
Period Dates Type of Governance
Bretton Woods 1945-1971 Hegemonic
Interdependence 1971-1989 Collective
Globalization 1989-present Global
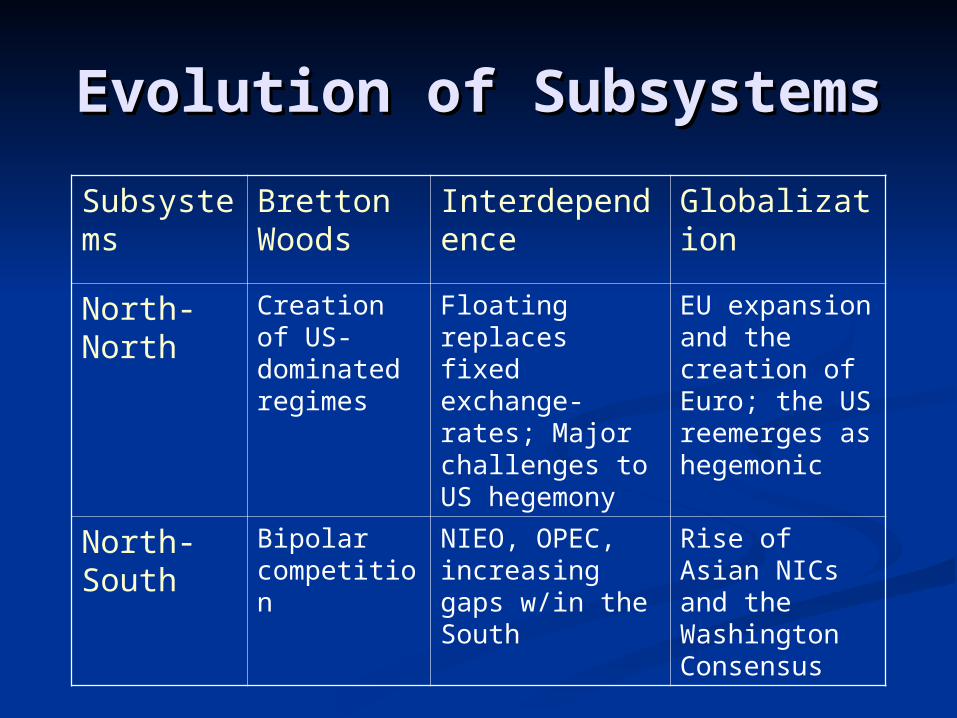
Evolution of SubsystemsEvolution of Subsystems
Subsystems Bretton Woods
Interdependence Globalization
North-North
Creation of US-dominated regimes
Floating replaces fixed exchange-rates; Major challenges to US hegemony
EU expansion and the creation of Euro; the US reemerges as hegemonic
North-South
Bipolar competition
NIEO, OPEC, increasing gaps w/in the South
Rise of Asian NICs and the Washington Consensus
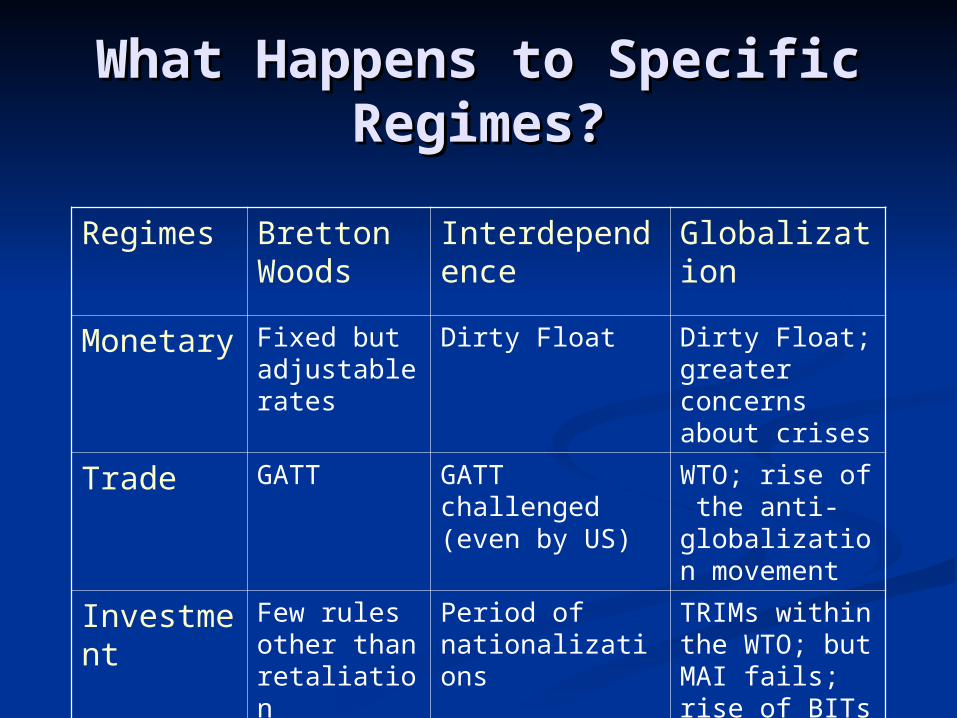
What Happens to Specific What Happens to Specific Regimes?Regimes?
Regimes Bretton Woods
Interdependence Globalization
Monetary Fixed but adjustable rates
Dirty Float Dirty Float; greater concerns about crises
Trade GATT GATT challenged (even by US)
WTO; rise of the anti-globalization movement
Investment Few rules other than retaliation
Period of nationalizations
TRIMs within the WTO; but MAI fails; rise of BITs