Embed Size (px)
Citation preview
Mass spectrometry core essentials handbook
Tools and reagents for proteomics core laboratories
Mass spectrometry (mass spec or MS) has become a valuable choice for protein analysis. The accuracy, sensitivity, and flexibility of MS instruments have enabled new applications in biological research, biopharmaceutical characterization, and diagnostic detection. MS can identify and quantify proteins ranging from 50 to 300,000 Da by revealing their structural and chemical properties in attomole through nanomole quantities. Mass spectrometry core laboratories strive to offer their users reliable, consistent data, so proper sample preparation and instrument calibration are critical. The use of metabolic or isobaric labeling have helped to enable these labs to provide higher throughput and more accurate protein quantitation.
Sample preparation
Sample preparation is one of the most variable and time-consuming steps in the analysis of proteins by MS, and the quality and reproducibility of sample extraction
Protein quantitation
Quantitative proteomics research is typically divided into two categories: discovery and targeted analysis. Discovery proteomics experiments are intended to identify as many proteins as possible across a broad dynamic range, while targeted protein analysis accurately measures a small number of proteins of interest. In discovery quantitation, stable isotope labeling using amino acids in cell culture (SILAC) identifies and quantifies relative differential changes in complex protein samples using in vivo metabolic incorporation of “heavy” 13C- or 15N-labeled amino acids into proteins, followed by MS analysis.
Introduction
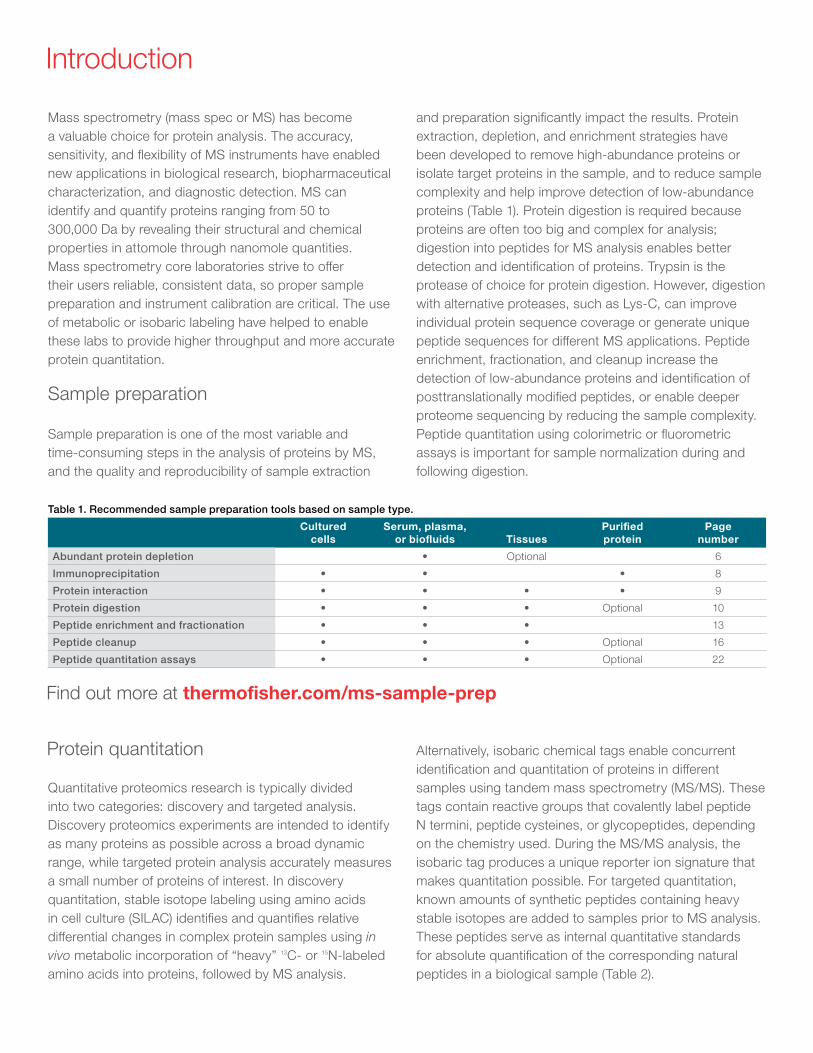
and preparation significantly impact the results. Protein extraction, depletion, and enrichment strategies have been developed to remove high-abundance proteins or isolate target proteins in the sample, and to reduce sample complexity and help improve detection of low-abundance proteins (Table 1). Protein digestion is required because proteins are often too big and complex for analysis; digestion into peptides for MS analysis enables better detection and identification of proteins. Trypsin is the protease of choice for protein digestion. However, digestion with alternative proteases, such as Lys-C, can improve individual protein sequence coverage or generate unique peptide sequences for different MS applications. Peptide enrichment, fractionation, and cleanup increase the detection of low-abundance proteins and identification of posttranslationally modified peptides, or enable deeper proteome sequencing by reducing the sample complexity. Peptide quantitation using colorimetric or fluorometric assays is important for sample normalization during and following digestion.
Table 1. Recommended sample preparation tools based on sample type.
Cultured cells
Serum, plasma, or biofluids Tissues
Purified protein
Page number
Abundant protein depletion • Optional 6
Immunoprecipitation • • • 8
Protein interaction • • • • 9
Protein digestion • • • Optional 10
Peptide enrichment and fractionation • • • 13
Peptide cleanup • • • Optional 16
Peptide quantitation assays • • • Optional 22
Alternatively, isobaric chemical tags enable concurrent identification and quantitation of proteins in different samples using tandem mass spectrometry (MS/MS). These tags contain reactive groups that covalently label peptide N termini, peptide cysteines, or glycopeptides, depending on the chemistry used. During the MS/MS analysis, the isobaric tag produces a unique reporter ion signature that makes quantitation possible. For targeted quantitation, known amounts of synthetic peptides containing heavy stable isotopes are added to samples prior to MS analysis. These peptides serve as internal quantitative standards for absolute quantification of the corresponding natural peptides in a biological sample (Table 2).
Find out more at thermofisher.com/ms-sample-prep
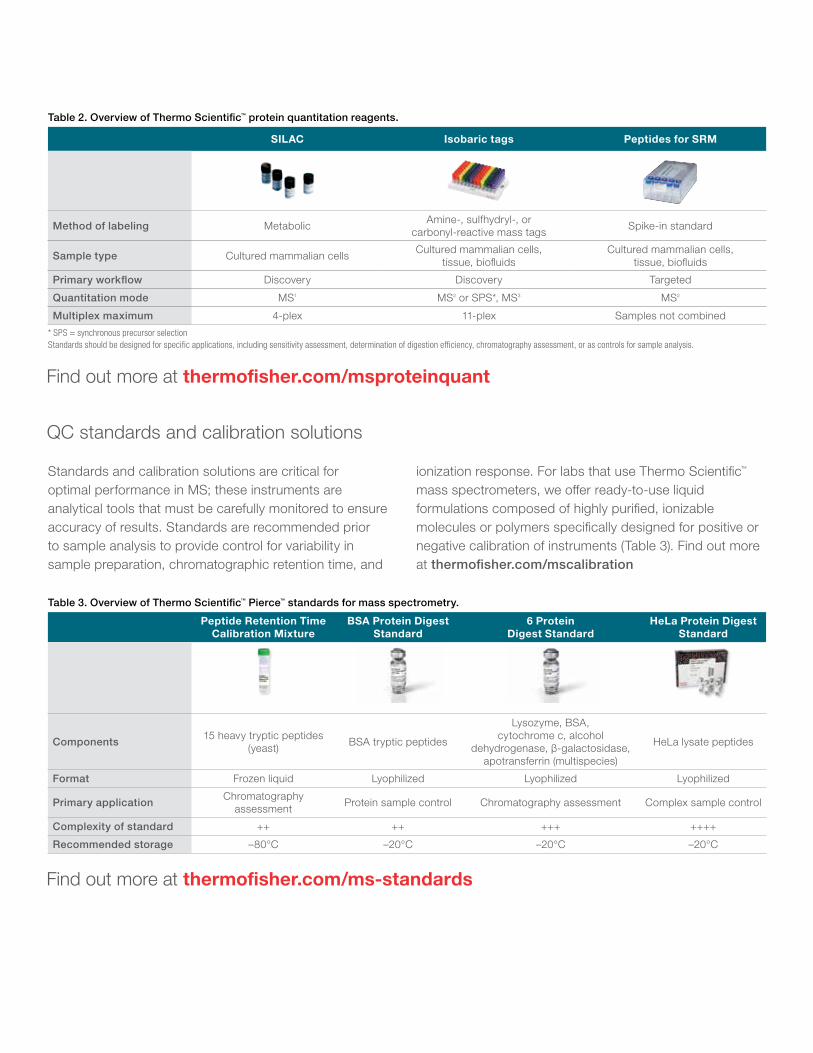
Table 2. Overview of Thermo Scientific™ protein quantitation reagents.
SILAC Isobaric tags Peptides for SRM
Method of labeling Metabolic Amine-, sulfhydryl-, or carbonyl-reactive mass tags Spike-in standard
Sample type Cultured mammalian cells Cultured mammalian cells, tissue, biofluids
Cultured mammalian cells, tissue, biofluids
Primary workflow Discovery Discovery Targeted
Quantitation mode MS1 MS2 or SPS*, MS3 MS2
Multiplex maximum 4-plex 11-plex Samples not combined
* SPS = synchronous precursor selectionStandards should be designed for specific applications, including sensitivity assessment, determination of digestion efficiency, chromatography assessment, or as controls for sample analysis.
Table 3. Overview of Thermo Scientific™ Pierce™ standards for mass spectrometry.
Peptide Retention Time Calibration Mixture
BSA Protein Digest Standard
6 Protein Digest Standard
HeLa Protein Digest Standard
Components 15 heavy tryptic peptides (yeast) BSA tryptic peptides
Lysozyme, BSA, cytochrome c, alcohol
dehydrogenase, β-galactosidase, apotransferrin (multispecies)
HeLa lysate peptides
Format Frozen liquid Lyophilized Lyophilized Lyophilized
Primary application Chromatography assessment Protein sample control Chromatography assessment Complex sample control
Complexity of standard ++ ++ +++ ++++
Recommended storage –80°C –20°C –20°C –20°C
Find out more at thermofisher.com/ms-standards
Find out more at thermofisher.com/msproteinquant
QC standards and calibration solutions
Standards and calibration solutions are critical for optimal performance in MS; these instruments are analytical tools that must be carefully monitored to ensure accuracy of results. Standards are recommended prior to sample analysis to provide control for variability in sample preparation, chromatographic retention time, and
ionization response. For labs that use Thermo Scientific™ mass spectrometers, we offer ready-to-use liquid formulations composed of highly purified, ionizable molecules or polymers specifically designed for positive or negative calibration of instruments (Table 3). Find out more at thermofisher.com/mscalibration
Workflows 5
Sample preparation 6High Select HSA/Immunoglobulin and Top14 Abundant Protein Depletion Spin Columns and Resins 6Pierce MS-Compatible Magnetic IP Kits 8MS-cleavable crosslinkers 9Pierce Trypsin Protease, MS Grade 10Lys-C Protease, MS Grade 12Phosphopeptide enrichment 13
High-Select Fe-NTA Phosphopeptide Enrichment Kit 14High-Selected TiO2 Phosphopeptide Enrichment Kit 15
Pierce High pH Reversed-Phase Fractionation Kit 16Pierce Peptide Desalting Spin Columns 18Pierce C18 Tips 19Detergent removal products 20Pierce Quantitative Peptide Assays 22
Protein quantitation 24SILAC metabolic labeling kits and NeuCode amino acids 24Isobaric amine-reactive tandem mass tag labeling reagents 26HeavyPeptide AQUA standards 28PEPotec SRM Peptide Libraries 29
QC standards 30Pierce Peptide Retention Time Calibration Mixture 30Pierce BSA Protein Digest Standard, LC-MS Grade 31Pierce 6 Protein Digest Standard, Equimolar, LC-MS Grade 32Pierce HeLa Protein Digest Standard 33
LC-MS solvents 34Pierce Trifluoroacetic Acid (TFA) 34Piece Formic Acid, LC-MS Grade 35Pierce Acetonitrile, LC-MS Grade 36Pierce Water, LC-MS Grade 36
Ordering information 37
Contents
5
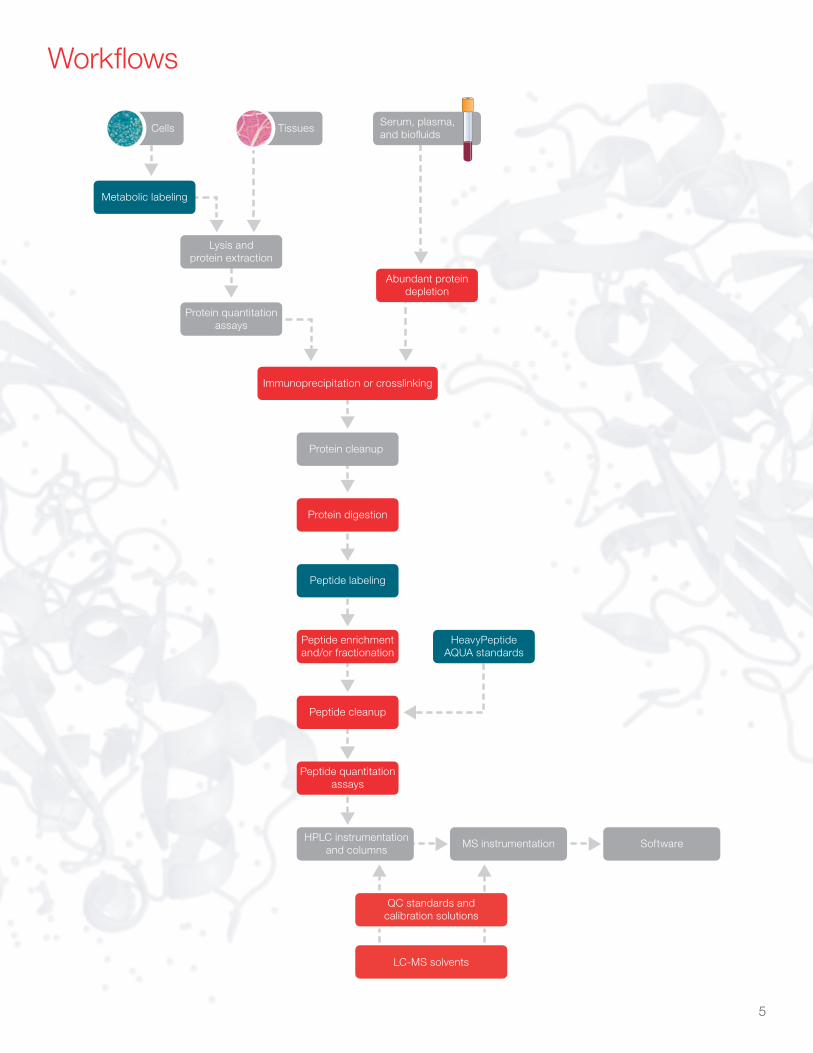
Workflows
Cells
Abundant proteindepletion
Lysis andprotein extraction
Metabolic labeling
Protein cleanup
Immunoprecipitation or crosslinking
Protein quantitationassays
Peptide labeling
Peptide enrichmentand/or fractionation
HeavyPeptideAQUA standards
Peptide cleanup
Peptide quantitationassays
QC standards andcalibration solutions
LC-MS solvents
HPLC instrumentationand columns MS instrumentation Software
Protein digestion
Tissues Serum, plasma, and biofluids
6
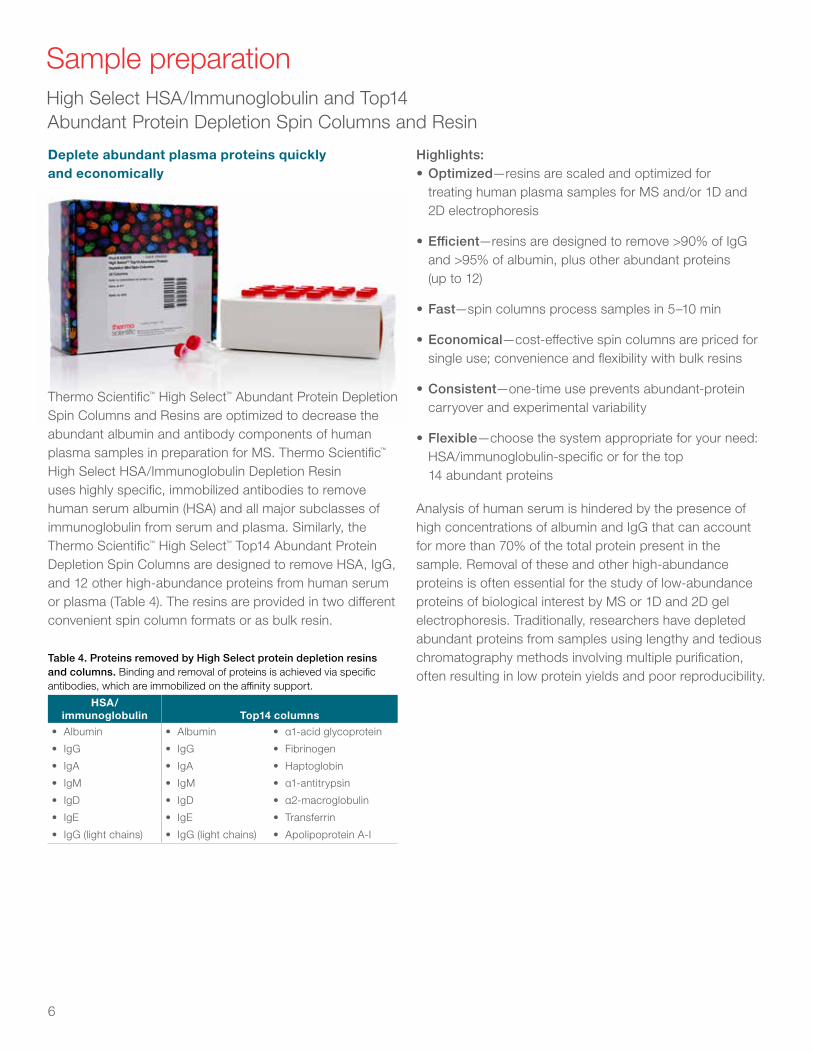
Deplete abundant plasma proteins quickly and economically
Thermo Scientific™ High Select™ Abundant Protein Depletion Spin Columns and Resins are optimized to decrease the abundant albumin and antibody components of human plasma samples in preparation for MS. Thermo Scientific™ High Select HSA/Immunoglobulin Depletion Resin uses highly specific, immobilized antibodies to remove human serum albumin (HSA) and all major subclasses of immunoglobulin from serum and plasma. Similarly, the Thermo Scientific™ High Select™ Top14 Abundant Protein Depletion Spin Columns are designed to remove HSA, IgG, and 12 other high-abundance proteins from human serum or plasma (Table 4). The resins are provided in two different convenient spin column formats or as bulk resin.
Sample preparation High Select HSA/Immunoglobulin and Top14 Abundant Protein Depletion Spin Columns and Resin
Highlights:• Optimized—resins are scaled and optimized for
treating human plasma samples for MS and/or 1D and 2D electrophoresis
• Efficient—resins are designed to remove >90% of IgG and >95% of albumin, plus other abundant proteins (up to 12)
• Fast—spin columns process samples in 5–10 min
• Economical—cost-effective spin columns are priced for single use; convenience and flexibility with bulk resins
• Consistent—one-time use prevents abundant-protein carryover and experimental variability
• Flexible—choose the system appropriate for your need: HSA/immunoglobulin-specific or for the top 14 abundant proteins
Analysis of human serum is hindered by the presence of high concentrations of albumin and IgG that can account for more than 70% of the total protein present in the sample. Removal of these and other high-abundance proteins is often essential for the study of low-abundance proteins of biological interest by MS or 1D and 2D gel electrophoresis. Traditionally, researchers have depleted abundant proteins from samples using lengthy and tedious chromatography methods involving multiple purification, often resulting in low protein yields and poor reproducibility.
Table 4. Proteins removed by High Select protein depletion resins and columns. Binding and removal of proteins is achieved via specific antibodies, which are immobilized on the affinity support.
HSA/ immunoglobulin Top14 columns
• Albumin • Albumin • α1-acid glycoprotein
• IgG • IgG • Fibrinogen
• IgA • IgA • Haptoglobin
• IgM • IgM • α1-antitrypsin
• IgD • IgD • α2-macroglobulin
• IgE • IgE • Transferrin
• IgG (light chains) • IgG (light chains) • Apolipoprotein A-I
7
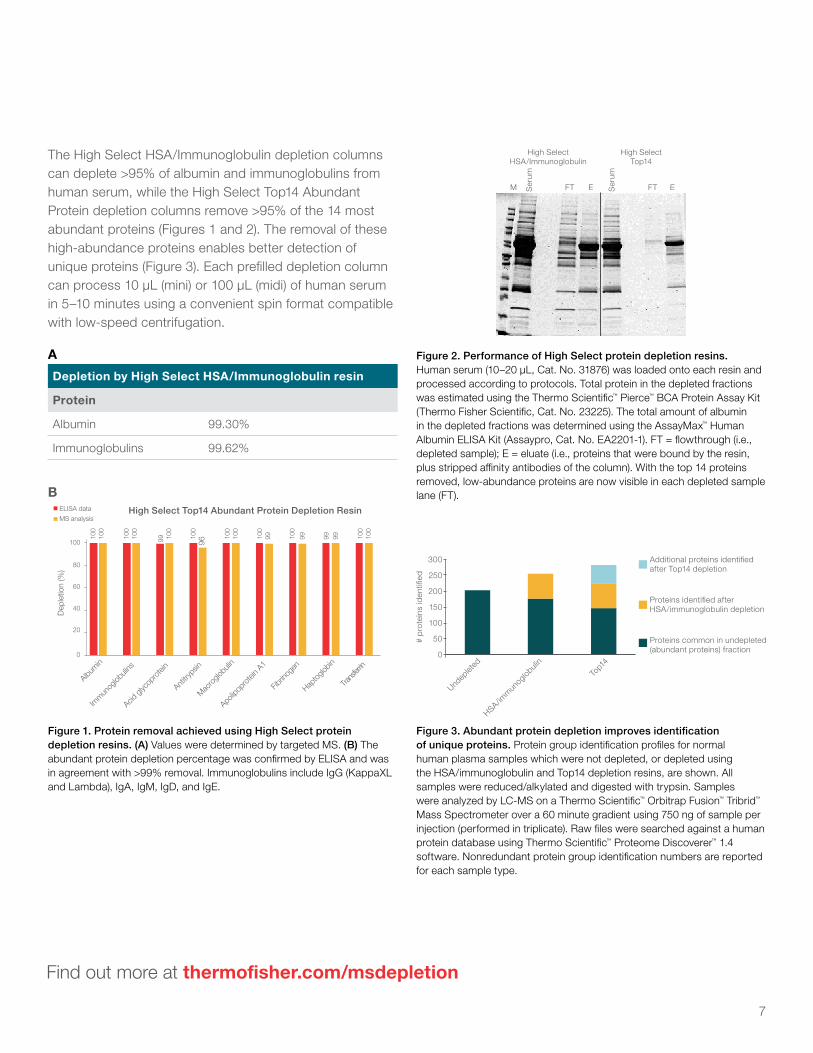
The High Select HSA/Immunoglobulin depletion columns can deplete >95% of albumin and immunoglobulins from human serum, while the High Select Top14 Abundant Protein depletion columns remove >95% of the 14 most abundant proteins (Figures 1 and 2). The removal of these high-abundance proteins enables better detection of unique proteins (Figure 3). Each prefilled depletion column can process 10 µL (mini) or 100 µL (midi) of human serum in 5–10 minutes using a convenient spin format compatible with low-speed centrifugation.
Figure 3. Abundant protein depletion improves identification of unique proteins. Protein group identification profiles for normal human plasma samples which were not depleted, or depleted using the HSA/immunoglobulin and Top14 depletion resins, are shown. All samples were reduced/alkylated and digested with trypsin. Samples were analyzed by LC-MS on a Thermo Scientific™ Orbitrap Fusion™ Tribrid™ Mass Spectrometer over a 60 minute gradient using 750 ng of sample per injection (performed in triplicate). Raw files were searched against a human protein database using Thermo Scientific™ Proteome Discoverer™ 1.4 software. Nonredundant protein group identification numbers are reported for each sample type.
Figure 2. Performance of High Select protein depletion resins. Human serum (10–20 μL, Cat. No. 31876) was loaded onto each resin and processed according to protocols. Total protein in the depleted fractions was estimated using the Thermo Scientific™ Pierce™ BCA Protein Assay Kit (Thermo Fisher Scientific, Cat. No. 23225). The total amount of albumin in the depleted fractions was determined using the AssayMax™ Human Albumin ELISA Kit (Assaypro, Cat. No. EA2201-1). FT = flowthrough (i.e., depleted sample); E = eluate (i.e., proteins that were bound by the resin, plus stripped affinity antibodies of the column). With the top 14 proteins removed, low-abundance proteins are now visible in each depleted sample lane (FT).
Find out more at thermofisher.com/msdepletion
Figure 1. Protein removal achieved using High Select protein depletion resins. (A) Values were determined by targeted MS. (B) The abundant protein depletion percentage was confirmed by ELISA and was in agreement with >99% removal. Immunoglobulins include IgG (KappaXL and Lambda), IgA, IgM, IgD, and IgE.
A
B
Depletion by High Select HSA/Immunoglobulin resin
Protein
Albumin 99.30%
Immunoglobulins 99.62%
80
60
40
20
0
100
100
100
100
100
99 100
100
96
100
100
100
99 99 99 99100
100
100
Albumin
Immun
oglob
ulins
Acid gl
ycop
rotei
n
Antitry
psin
Macro
globu
lin
Apolip
opro
tein A
1
Fibrin
ogen
Haptog
lobin
Trans
ferrin
Dep
letio
n (%
)
ELISA dataMS analysis
High Select Top14 Abundant Protein Depletion Resin
High SelectHSA/Immunoglobulin
M FT ESer
um
Ser
um
FT E
High SelectTop14
Additional proteins identified after Top14 depletion
Proteins identified after HSA/immunoglobulin depletion
Proteins common in undepleted (abundant proteins) fraction
0
50
100
150
200
250
300
Undep
leted
HSA/imm
unoglo
bulin
# pr
otei
ns id
entifi
ed
Top1
4
8
Validated kits for the efficient and reproducible enrichment of target antigens for LC-MS analysisThe Thermo Scientific™ Pierce™ MS-Compatible Magnetic Immunoprecipitation (IP) Kits provide MS-friendly reagents and optimized protocols to enable highly effective and efficient IP and co-IP of target antigens upstream of LC-MS analysis. In addition, low protein–binding microcentrifuge tubes are supplied separately to minimize loss during the sample processing.
Highlights:• MS-compatible—directly compatible with in-solution
peptide digestion
• Flexible—different IP strategies are available to utilize either native or biotinylated antibodies
• Sensitive—kits have been demonstrated to successfully enrich for low-abundance proteins
• Low background—buffers optimized to minimize enrichment of background proteins
• Robust—procedure and reagents have been robustly tested with numerous targets to enable consistent enrichment of low-abundance proteins
LoadMS
elutionBeadboil Load
MSelution
Beadboil
PP2A(72%)
PTEN(90%)
EGFR(80%)
Stat1(88%)
β-catenin(140%)
HDAC1(140%)
P13K(247%)
pan Akt(97%)
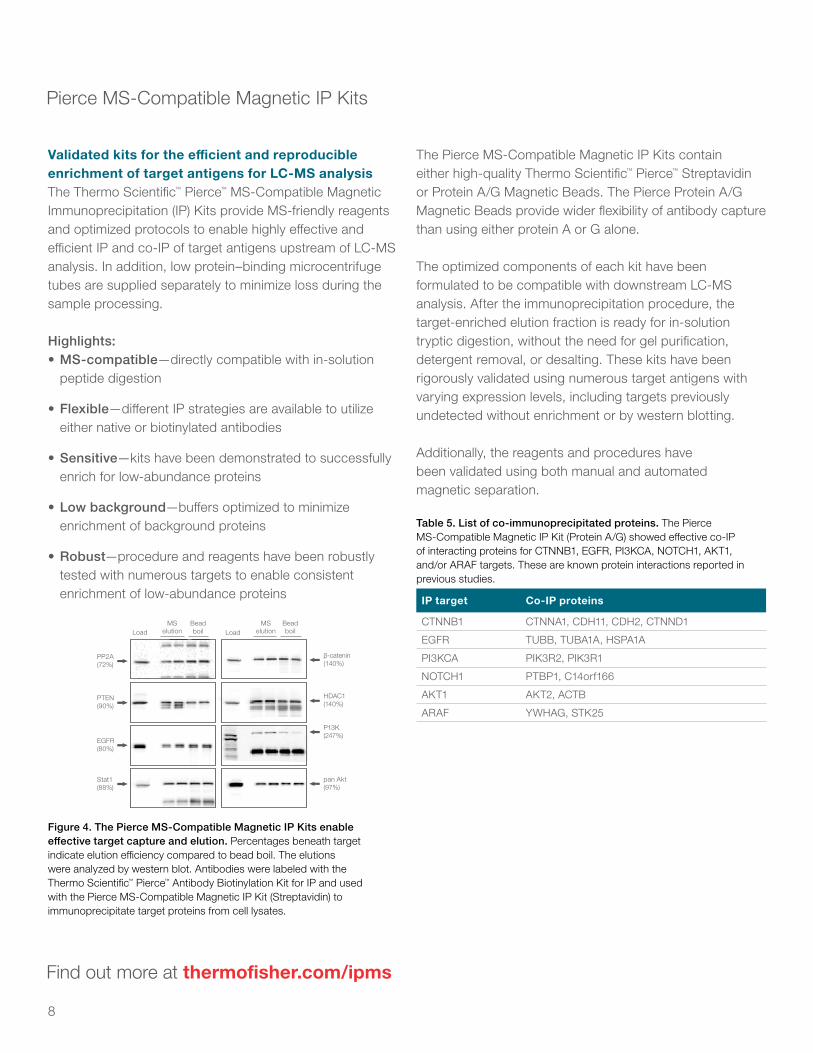
Figure 4. The Pierce MS-Compatible Magnetic IP Kits enable effective target capture and elution. Percentages beneath target indicate elution efficiency compared to bead boil. The elutions were analyzed by western blot. Antibodies were labeled with the Thermo Scientific™ Pierce™ Antibody Biotinylation Kit for IP and used with the Pierce MS-Compatible Magnetic IP Kit (Streptavidin) to immunoprecipitate target proteins from cell lysates.
Pierce MS-Compatible Magnetic IP Kits
The Pierce MS-Compatible Magnetic IP Kits contain either high-quality Thermo Scientific™ Pierce™ Streptavidin or Protein A/G Magnetic Beads. The Pierce Protein A/G Magnetic Beads provide wider flexibility of antibody capture than using either protein A or G alone.
The optimized components of each kit have been formulated to be compatible with downstream LC-MS analysis. After the immunoprecipitation procedure, the target-enriched elution fraction is ready for in-solution tryptic digestion, without the need for gel purification, detergent removal, or desalting. These kits have been rigorously validated using numerous target antigens with varying expression levels, including targets previously undetected without enrichment or by western blotting.
Additionally, the reagents and procedures have been validated using both manual and automated magnetic separation.
Find out more at thermofisher.com/ipms
Table 5. List of co-immunoprecipitated proteins. The Pierce MS-Compatible Magnetic IP Kit (Protein A/G) showed effective co-IP of interacting proteins for CTNNB1, EGFR, PI3KCA, NOTCH1, AKT1, and/or ARAF targets. These are known protein interactions reported in previous studies.
IP target Co-IP proteins
CTNNB1 CTNNA1, CDH11, CDH2, CTNND1
EGFR TUBB, TUBA1A, HSPA1A
PI3KCA PIK3R2, PIK3R1
NOTCH1 PTBP1, C14orf166
AKT1 AKT2, ACTB
ARAF YWHAG, STK25
9
Find out more at thermofisher.com/mscrosslinkers
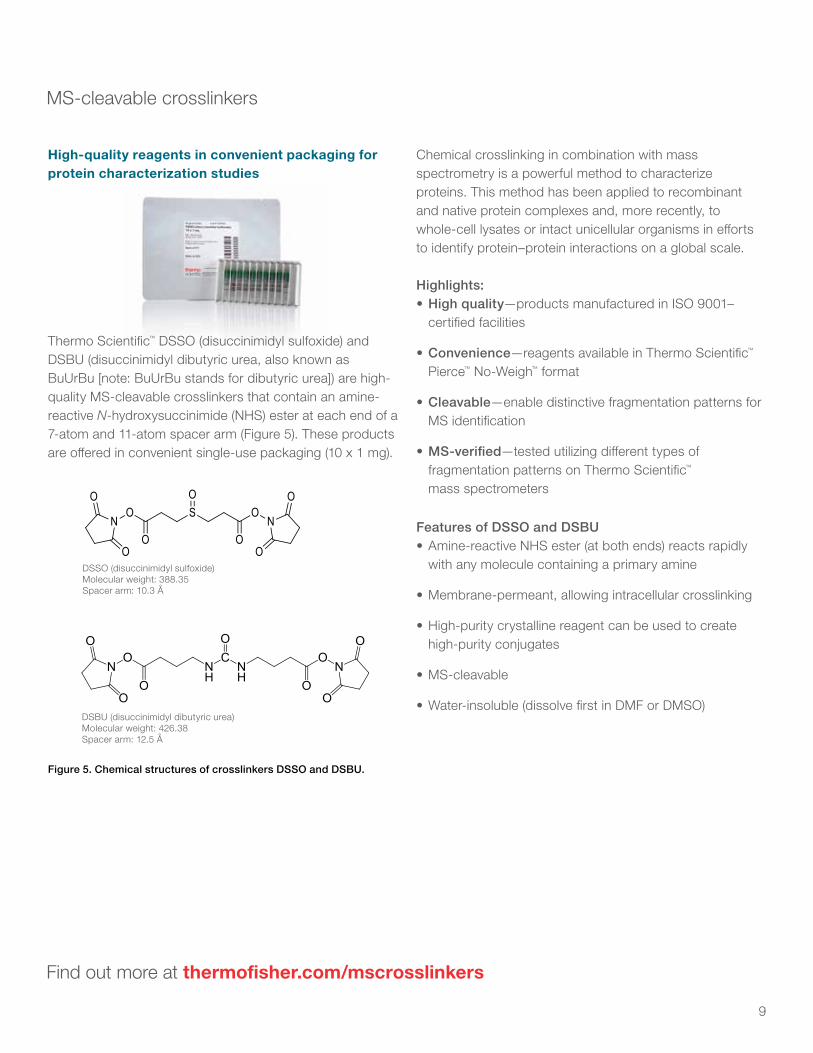
Thermo Scientific™ DSSO (disuccinimidyl sulfoxide) and DSBU (disuccinimidyl dibutyric urea, also known as BuUrBu [note: BuUrBu stands for dibutyric urea]) are high-quality MS-cleavable crosslinkers that contain an amine-reactive N-hydroxysuccinimide (NHS) ester at each end of a 7-atom and 11-atom spacer arm (Figure 5). These products are offered in convenient single-use packaging (10 x 1 mg).
DSSO (disuccinimidyl sulfoxide)Molecular weight: 388.35Spacer arm: 10.3 Å
DSBU (disuccinimidyl dibutyric urea)Molecular weight: 426.38Spacer arm: 12.5 Å
A B
DSSO (disuccinimidyl sulfoxide)Molecular weight: 388.35Spacer arm: 10.3 Å
DSBU (disuccinimidyl dibutyric urea)Molecular weight: 426.38Spacer arm: 12.5 Å
A B
Figure 5. Chemical structures of crosslinkers DSSO and DSBU.
MS-cleavable crosslinkers
High-quality reagents in convenient packaging for protein characterization studies
Chemical crosslinking in combination with mass spectrometry is a powerful method to characterize proteins. This method has been applied to recombinant and native protein complexes and, more recently, to whole-cell lysates or intact unicellular organisms in efforts to identify protein–protein interactions on a global scale.
Highlights:• High quality—products manufactured in ISO 9001–
certified facilities
• Convenience—reagents available in Thermo Scientific™ Pierce™ No-Weigh™ format
• Cleavable—enable distinctive fragmentation patterns for MS identification
• MS-verified—tested utilizing different types of fragmentation patterns on Thermo Scientific™ mass spectrometers
Features of DSSO and DSBU• Amine-reactive NHS ester (at both ends) reacts rapidly
with any molecule containing a primary amine
• Membrane-permeant, allowing intracellular crosslinking
• High-purity crystalline reagent can be used to create high-purity conjugates
• MS-cleavable
• Water-insoluble (dissolve first in DMF or DMSO)
10
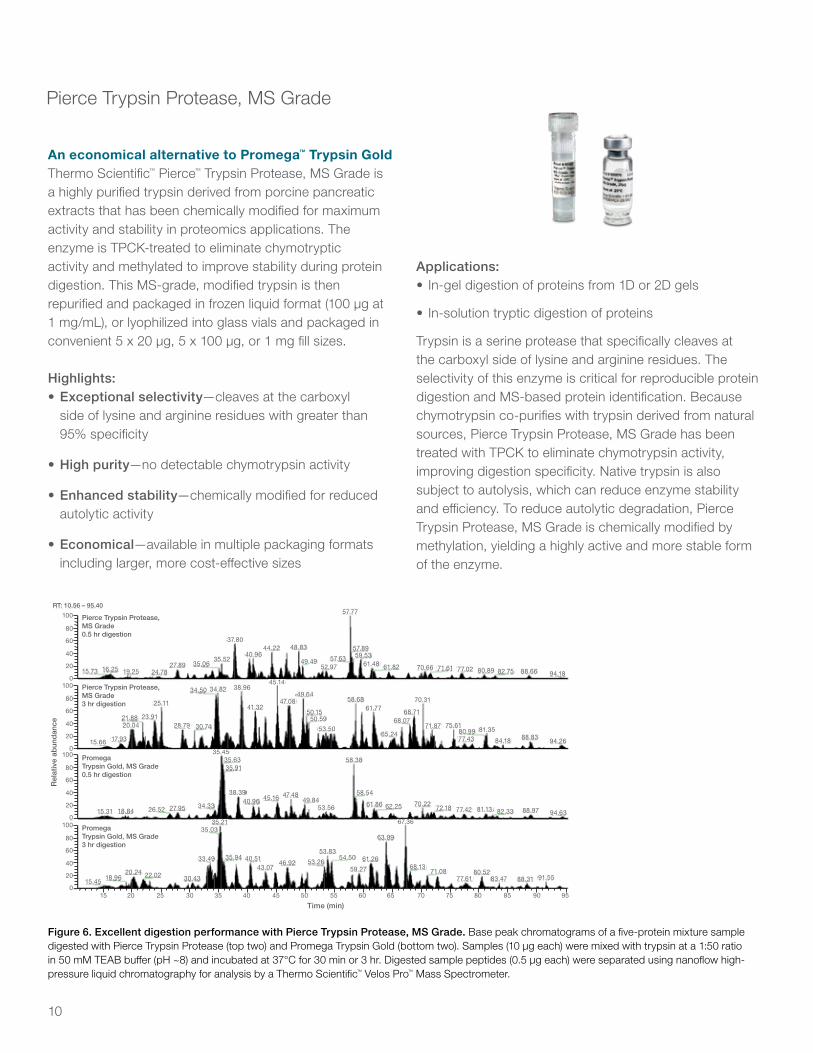
Figure 6. Excellent digestion performance with Pierce Trypsin Protease, MS Grade. Base peak chromatograms of a five-protein mixture sample digested with Pierce Trypsin Protease (top two) and Promega Trypsin Gold (bottom two). Samples (10 µg each) were mixed with trypsin at a 1:50 ratio in 50 mM TEAB buffer (pH ~8) and incubated at 37°C for 30 min or 3 hr. Digested sample peptides (0.5 µg each) were separated using nanoflow high-pressure liquid chromatography for analysis by a Thermo Scientific™ Velos Pro™ Mass Spectrometer.
Pierce Trypsin Protease, MS Grade0.5 hr digestion
RT: 10.56 – 95.40
Rel
ativ
e ab
und
ance
Pierce Trypsin Protease, MS Grade3 hr digestion
PromegaTrypsin Gold, MS Grade0.5 hr digestion
PromegaTrypsin Gold, MS Grade3 hr digestion
Time (min)
15.45
15.31
15.73 16.25 19.25 24.7827.89
37.80
57.77
57.89
94.1888.6682.7580.8977.0271.6170.6661.8261.4859.5357.63
48.83
49.4952.97
44.2240.96
35.5235.06
17.9315.66
20.0421.88 23.91
25.11
28.79 30.74
34.50 34.82 38.96
41.32
45.14
47.0849.64
50.1550.59
53.50
58.6861.77
65.24
68.0768.71
70.31
71.87 75.6181.35
84.18 88.8394.26
80.9977.43
18.84 26.52 27.95 34.33
35.4535.6335.91
38.3940.96 45.16 47.48
49.8453.56
58.38
58.54
61.86 62.25 70.2272.18 77.42 81.13 82.33 88.97 94.63
100
80
60
40
20
0
2015 25 30 35 40 45 50 55 60 65 70 75 80 85 90 95
18.9620.24 22.02 30.43
33.49
35.0335.21
35.94 40.5143.07
46.92
53.83
53.2654.50 61.26
63.99
67.36
68.1371.08
77.6180.52
83.47 88.31 91.5559.27
100
80
60
40
20
0100
80
60
40
20
0100
80
60
40
20
0
An economical alternative to Promega™ Trypsin Gold Thermo Scientific™ Pierce™ Trypsin Protease, MS Grade is a highly purified trypsin derived from porcine pancreatic extracts that has been chemically modified for maximum activity and stability in proteomics applications. The enzyme is TPCK-treated to eliminate chymotryptic activity and methylated to improve stability during protein digestion. This MS-grade, modified trypsin is then repurified and packaged in frozen liquid format (100 µg at 1 mg/mL), or lyophilized into glass vials and packaged in convenient 5 x 20 µg, 5 x 100 µg, or 1 mg fill sizes.
Highlights:• Exceptional selectivity—cleaves at the carboxyl
side of lysine and arginine residues with greater than 95% specificity
• High purity—no detectable chymotrypsin activity
• Enhanced stability—chemically modified for reduced autolytic activity
• Economical—available in multiple packaging formats including larger, more cost-effective sizes
Pierce Trypsin Protease, MS Grade
Applications:• In-gel digestion of proteins from 1D or 2D gels
• In-solution tryptic digestion of proteins
Trypsin is a serine protease that specifically cleaves at the carboxyl side of lysine and arginine residues. The selectivity of this enzyme is critical for reproducible protein digestion and MS-based protein identification. Because chymotrypsin co-purifies with trypsin derived from natural sources, Pierce Trypsin Protease, MS Grade has been treated with TPCK to eliminate chymotrypsin activity, improving digestion specificity. Native trypsin is also subject to autolysis, which can reduce enzyme stability and efficiency. To reduce autolytic degradation, Pierce Trypsin Protease, MS Grade is chemically modified by methylation, yielding a highly active and more stable form of the enzyme.
11
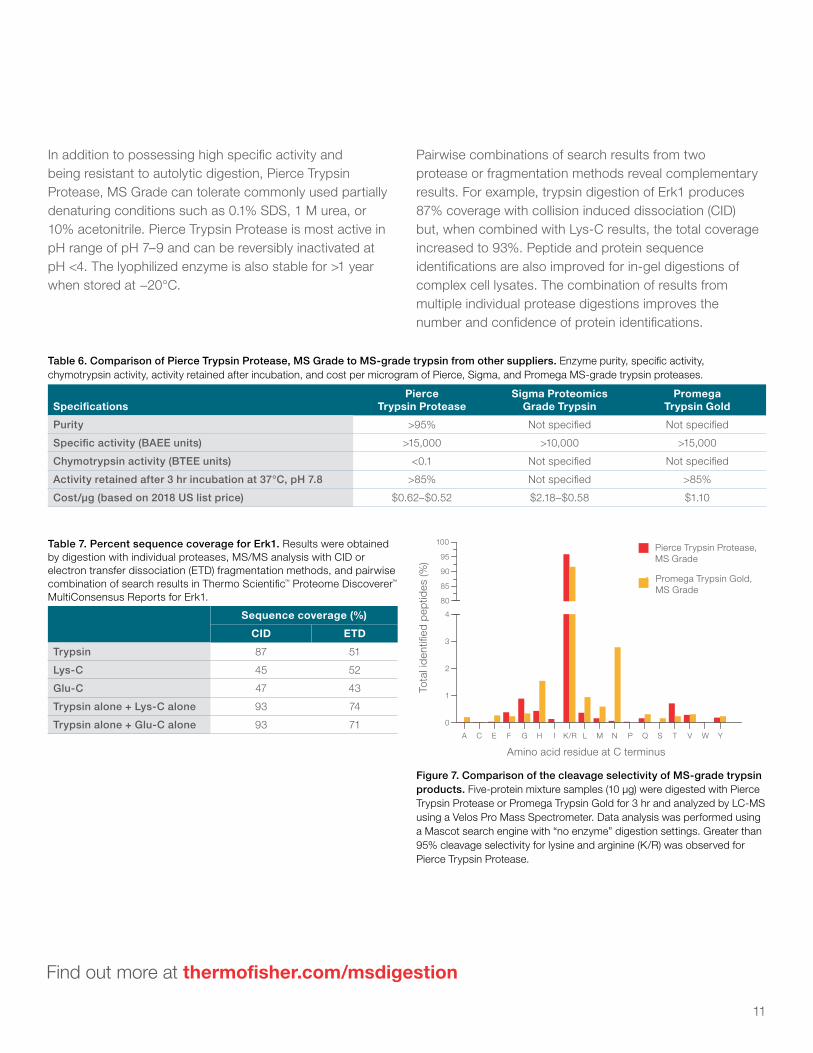
Figure 7. Comparison of the cleavage selectivity of MS-grade trypsin products. Five-protein mixture samples (10 µg) were digested with Pierce Trypsin Protease or Promega Trypsin Gold for 3 hr and analyzed by LC-MS using a Velos Pro Mass Spectrometer. Data analysis was performed using a Mascot search engine with “no enzyme” digestion settings. Greater than 95% cleavage selectivity for lysine and arginine (K/R) was observed for Pierce Trypsin Protease.
0
1
2
3
4
Pierce Trypsin Protease, MS Grade
Promega Trypsin Gold,MS Grade
80
85
90
95
100
Amino acid residue at C terminus
Tota
l ide
ntifi
ed p
eptid
es (%
)
A C E F G H I K/R L M N P Q S T V W Y
Table 7. Percent sequence coverage for Erk1. Results were obtained by digestion with individual proteases, MS/MS analysis with CID or electron transfer dissociation (ETD) fragmentation methods, and pairwise combination of search results in Thermo Scientific™ Proteome Discoverer™ MultiConsensus Reports for Erk1.
Sequence coverage (%)
CID ETD
Trypsin 87 51
Lys-C 45 52
Glu-C 47 43
Trypsin alone + Lys-C alone 93 74
Trypsin alone + Glu-C alone 93 71
Table 6. Comparison of Pierce Trypsin Protease, MS Grade to MS-grade trypsin from other suppliers. Enzyme purity, specific activity, chymotrypsin activity, activity retained after incubation, and cost per microgram of Pierce, Sigma, and Promega MS-grade trypsin proteases.
SpecificationsPierce
Trypsin ProteaseSigma Proteomics
Grade TrypsinPromega
Trypsin Gold
Purity >95% Not specified Not specified
Specific activity (BAEE units) >15,000 >10,000 >15,000
Chymotrypsin activity (BTEE units) <0.1 Not specified Not specified
Activity retained after 3 hr incubation at 37°C, pH 7.8 >85% Not specified >85%
Cost/µg (based on 2018 US list price) $0.62–$0.52 $2.18–$0.58 $1.10
In addition to possessing high specific activity and being resistant to autolytic digestion, Pierce Trypsin Protease, MS Grade can tolerate commonly used partially denaturing conditions such as 0.1% SDS, 1 M urea, or 10% acetonitrile. Pierce Trypsin Protease is most active in pH range of pH 7–9 and can be reversibly inactivated at pH <4. The lyophilized enzyme is also stable for >1 year when stored at −20°C.
Pairwise combinations of search results from two protease or fragmentation methods reveal complementary results. For example, trypsin digestion of Erk1 produces 87% coverage with collision induced dissociation (CID) but, when combined with Lys-C results, the total coverage increased to 93%. Peptide and protein sequence identifications are also improved for in-gel digestions of complex cell lysates. The combination of results from multiple individual protease digestions improves the number and confidence of protein identifications.
Find out more at thermofisher.com/msdigestion
12
Highly active alternative enzyme to trypsin that increases digestion efficiency Thermo Scientific™ Lys-C Protease, MS Grade is purified native Lys-C protease that has been validated for maximum activity and stability in proteomic applications.
Lys-C Protease, MS Grade is a 30 kDa serine protease isolated from Lysobacter enzymogenes that hydrolyzes proteins specifically at the carboxyl side of lysine. It can be used for in-solution or in-gel digestion workflows to produce peptides for LC-MS/MS protein identification. Lys-C has high activity and specificity for lysine residues, resulting in larger peptides and less sample complexity than trypsin (i.e., fewer peptides). Lys-C can also cleave lysines followed by prolines and remains active under highly denaturing conditions (i.e., 8 M urea). For this reason, Lys-C is often used for sequential digestion of proteins followed by trypsin to decrease tryptic missed cleavages. These unique properties of Lys-C help to ensure high digestion efficiency alone or followed by tryptic digestion.
Lys-C prototypic enzymes typically have higher charge states, making it a widely used enzyme for use with ETD fragmentation. Lys-C is also used commonly in phosphopeptide enrichment workflows and with isobaric-tagged peptide quantitation. Because Lys-C generates peptides with primary amines at both the N and C termini of a peptide, each peptide can be double-labeled with amine-reactive isobaric tags. This results in enhanced peptide ionization and improved limits of quantitation since more fragment ions can be reisolated during MS³ acquisition.
Highlights:• Enhanced digestion—when used in tandem with
trypsin, decreases tryptic missed cleavages
• Increased sequence coverage—better protein characterization results from overlapping peptides with complementary chromatographic, ionization, and fragmentation properties
• Carboxyl lysine cleavage specificity—at least 90% for a complex protein sample
• Efficient—protein digestion can be completed in 2 hr at 37°C
• Versatile—effective even under highly denaturing conditions (e.g., 8 M urea, 2 M guanidine HCl, 1% SDS, 2% CHAPS, and 40% acetonitrile)
• Stable—store lyophilized protease for up to 1 year at –20°C
Applications:• Improved sequence coverage of protein digests
• De novo sequencing
• Epigenetic studies
• In-gel digestion of proteins
Lys-C Protease, MS Grade
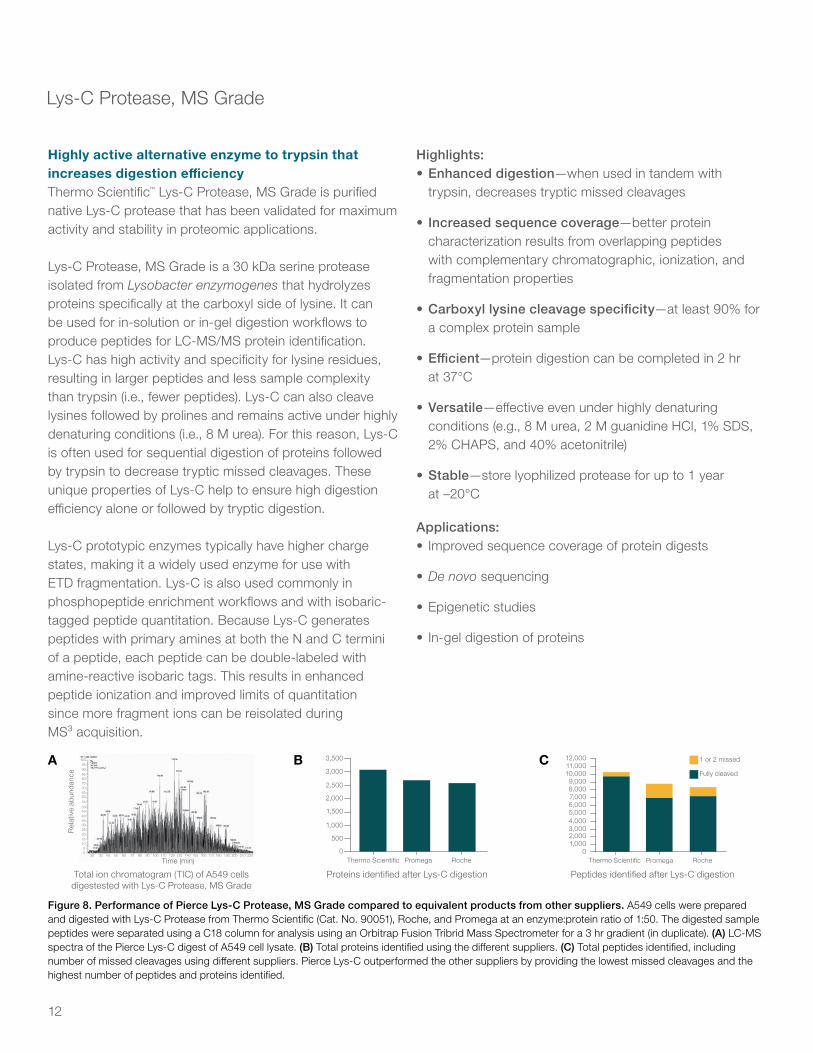
Figure 8. Performance of Pierce Lys-C Protease, MS Grade compared to equivalent products from other suppliers. A549 cells were prepared and digested with Lys-C Protease from Thermo Scientific (Cat. No. 90051), Roche, and Promega at an enzyme:protein ratio of 1:50. The digested sample peptides were separated using a C18 column for analysis using an Orbitrap Fusion Tribrid Mass Spectrometer for a 3 hr gradient (in duplicate). (A) LC-MS spectra of the Pierce Lys-C digest of A549 cell lysate. (B) Total proteins identified using the different suppliers. (C) Total peptides identified, including number of missed cleavages using different suppliers. Pierce Lys-C outperformed the other suppliers by providing the lowest missed cleavages and the highest number of peptides and proteins identified.
Total ion chromatogram (TIC) of A549 cells digestested with Lys-C Protease, MS Grade
20 30 40 50 60 70 80 90 100 110 120 130 140 150 160 170 180 190 200 210 220
Time (min)05
101520253035404550556065707580859095
100
Rel
ativ
e ab
unda
nce
A
Proteins identified after Lys-C digestion
3,500
3,000
2,500
2,000
1,500
1,000
500
0Thermo Scientific Promega Roche
B 12,00011,00010,0009,0008,0007,0006,0005,0004,0003,0002,0001,000
0Thermo Scientific Promega Roche
Fully cleaved
1 or 2 missed
Peptides identified after Lys-C digestion
C
13
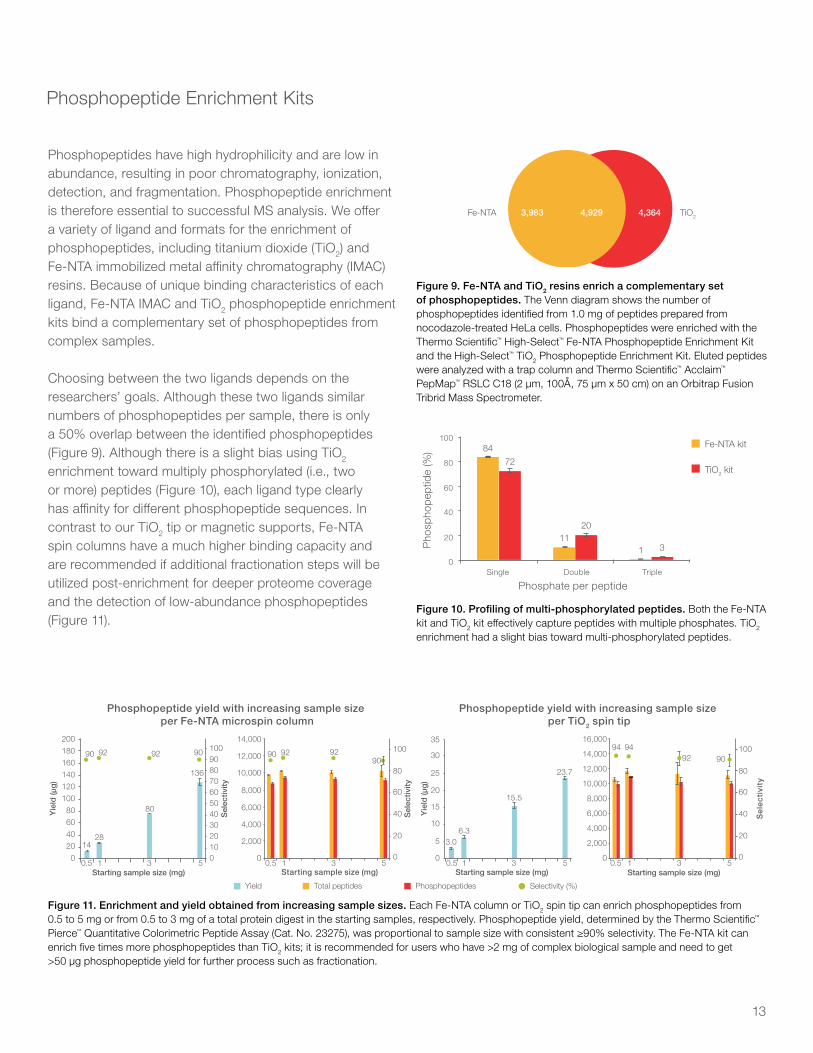
Phosphopeptides have high hydrophilicity and are low in abundance, resulting in poor chromatography, ionization, detection, and fragmentation. Phosphopeptide enrichment is therefore essential to successful MS analysis. We offer a variety of ligand and formats for the enrichment of phosphopeptides, including titanium dioxide (TiO2) and Fe-NTA immobilized metal affinity chromatography (IMAC) resins. Because of unique binding characteristics of each ligand, Fe-NTA IMAC and TiO2 phosphopeptide enrichment kits bind a complementary set of phosphopeptides from complex samples.
Choosing between the two ligands depends on the researchers’ goals. Although these two ligands similar numbers of phosphopeptides per sample, there is only a 50% overlap between the identified phosphopeptides (Figure 9). Although there is a slight bias using TiO2 enrichment toward multiply phosphorylated (i.e., two or more) peptides (Figure 10), each ligand type clearly has affinity for different phosphopeptide sequences. In contrast to our TiO2 tip or magnetic supports, Fe-NTA spin columns have a much higher binding capacity and are recommended if additional fractionation steps will be utilized post-enrichment for deeper proteome coverage and the detection of low-abundance phosphopeptides (Figure 11).
Phosphopeptide Enrichment Kits
Figure 9. Fe-NTA and TiO2 resins enrich a complementary set of phosphopeptides. The Venn diagram shows the number of phosphopeptides identified from 1.0 mg of peptides prepared from nocodazole-treated HeLa cells. Phosphopeptides were enriched with the Thermo Scientific™ High-Select™ Fe-NTA Phosphopeptide Enrichment Kit and the High-Select™ TiO2 Phosphopeptide Enrichment Kit. Eluted peptides were analyzed with a trap column and Thermo Scientific™ Acclaim™ PepMap™ RSLC C18 (2 μm, 100Å, 75 μm x 50 cm) on an Orbitrap Fusion Tribrid Mass Spectrometer.
Fe-NTA 3,983 4,3644,929 TiO2
Figure 10. Profiling of multi-phosphorylated peptides. Both the Fe-NTA kit and TiO2 kit effectively capture peptides with multiple phosphates. TiO2 enrichment had a slight bias toward multi-phosphorylated peptides.
Phosphate per peptide
Fe-NTA kit
TiO2 kit
Single0
20
8472
1120
1 3
40
60
80
100P
hosp
hope
ptid
e (%
)
Double Triple
Figure 11. Enrichment and yield obtained from increasing sample sizes. Each Fe-NTA column or TiO2 spin tip can enrich phosphopeptides from 0.5 to 5 mg or from 0.5 to 3 mg of a total protein digest in the starting samples, respectively. Phosphopeptide yield, determined by the Thermo Scientific™ Pierce™ Quantitative Colorimetric Peptide Assay (Cat. No. 23275), was proportional to sample size with consistent ≥90% selectivity. The Fe-NTA kit can enrich five times more phosphopeptides than TiO2 kits; it is recommended for users who have >2 mg of complex biological sample and need to get >50 μg phosphopeptide yield for further process such as fractionation.
Phosphopeptide yield with increasing sample size per Fe-NTA microspin column
Phosphopeptide yield with increasing sample size per TiO2 spin tip
0.50
5
10
15
20
25
30
35
0
20
40
60
80
100
0
2,000
4,000
6,000
8,000
10,000
12,000
16,000
14,00094 94
92 90
3.06.3
15.5
23.7
1 3Starting sample size (mg)
Yie
ld (µ
g)
Sel
ecti
vity
Starting sample size (mg)0.5 1 35 50.5
90 92
020406080
100120140160180200
0 0
20
40
60
80
100
0
2,000
4,000
6,000
8,000
10,000
12,000
14,000
102030405060708090100
92 90 9090
92 92
1428
80
136
1 3Starting sample size (mg)
Yie
ld (µ
g)
Sel
ectiv
ity
Sel
ectiv
ity
Starting sample size (mg)0.5 1 35 5
Selectivity (%)Total peptidesYield Phosphopeptides
14
High-Select Fe-NTA Phosphopeptide Enrichment Kit
Highlights:• Complete—kit includes all columns and buffers for
optimized phosphopeptide enrichment
• Convenient—prefilled spin-columns and ready-to-use buffers enable easy sample processing
• High binding capacity—each column enriches up to 150 μg of phosphopeptides from 5 mg of protein digest
• High specificity—recover phosphopeptides with >90% selectivity
• Excellent recovery—enriches more total and unique phosphopeptides than other commercially available resins
• Complementary—enriches a unique set of phosphopeptides that complements our TiO2 kit
Figure 12. High-Select Fe-NTA kit with significantly improved selectivity and yield. The average selectivity is 95 ± 2% per 1 mg of HeLa protein digest used for the enrichment. Phosphopeptide yield is improved 4-fold with the newer Fe-NTA kit.
Previous kit
Fe-NTA
(8 µg)Newly optimized
(33 µg)
Total unique peptidesPhosphopeptidesSelectivity (%)
3,000
70
3,932
6,045
99
0 0
20
60
80
100
40
6,000
9,000
# of
pep
tides
Sel
ectiv
ity (%
)
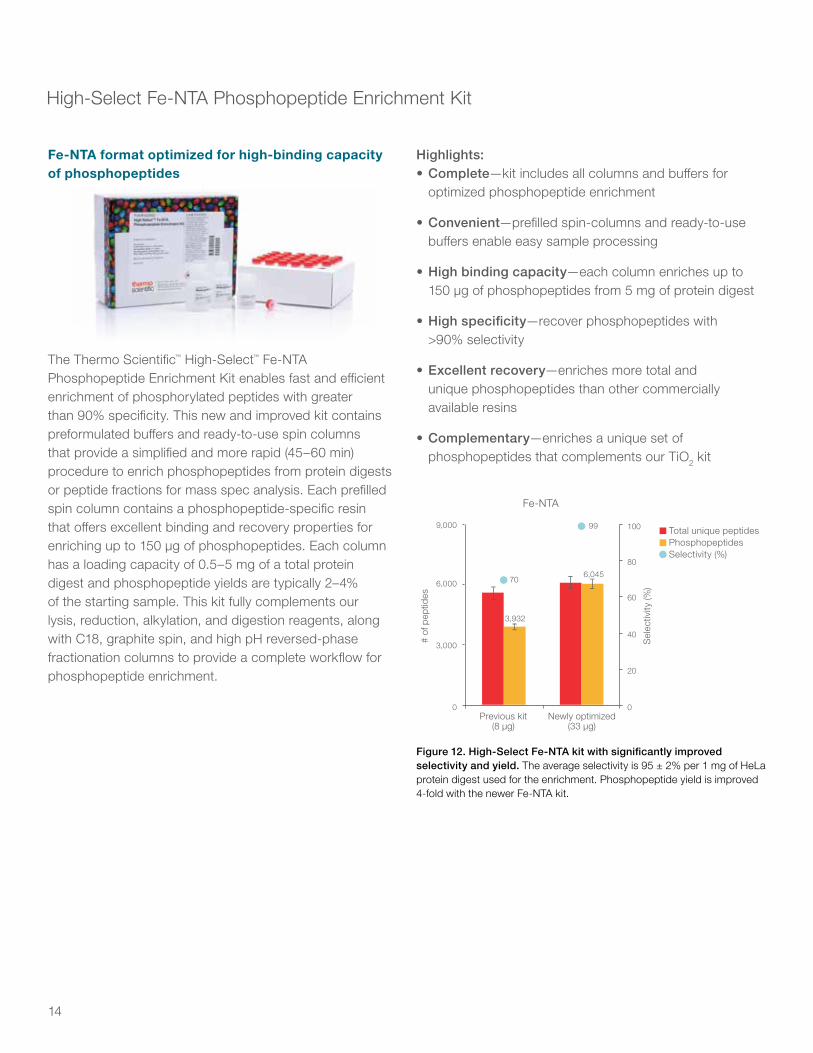
Fe-NTA format optimized for high-binding capacity of phosphopeptides
The Thermo Scientific™ High-Select™ Fe-NTA Phosphopeptide Enrichment Kit enables fast and efficient enrichment of phosphorylated peptides with greater than 90% specificity. This new and improved kit contains preformulated buffers and ready-to-use spin columns that provide a simplified and more rapid (45–60 min) procedure to enrich phosphopeptides from protein digests or peptide fractions for mass spec analysis. Each prefilled spin column contains a phosphopeptide-specific resin that offers excellent binding and recovery properties for enriching up to 150 μg of phosphopeptides. Each column has a loading capacity of 0.5–5 mg of a total protein digest and phosphopeptide yields are typically 2–4% of the starting sample. This kit fully complements our lysis, reduction, alkylation, and digestion reagents, along with C18, graphite spin, and high pH reversed-phase fractionation columns to provide a complete workflow for phosphopeptide enrichment.
15
High-Select TiO2 Phosphopeptide Enrichment Kit
Highlights:• Complete—kit includes all columns and buffers for
optimized phosphopeptide enrichment
• Convenient—spin tip format enables parallel processing of multiple samples
• Highly specific—recovers phosphopeptides with >85% selectivity
• Complementary—TiO2 enriches a unique set of phosphopeptides that complements our Fe-NTA IMAC kit
TiO2 spin tips selective for phosphopeptides
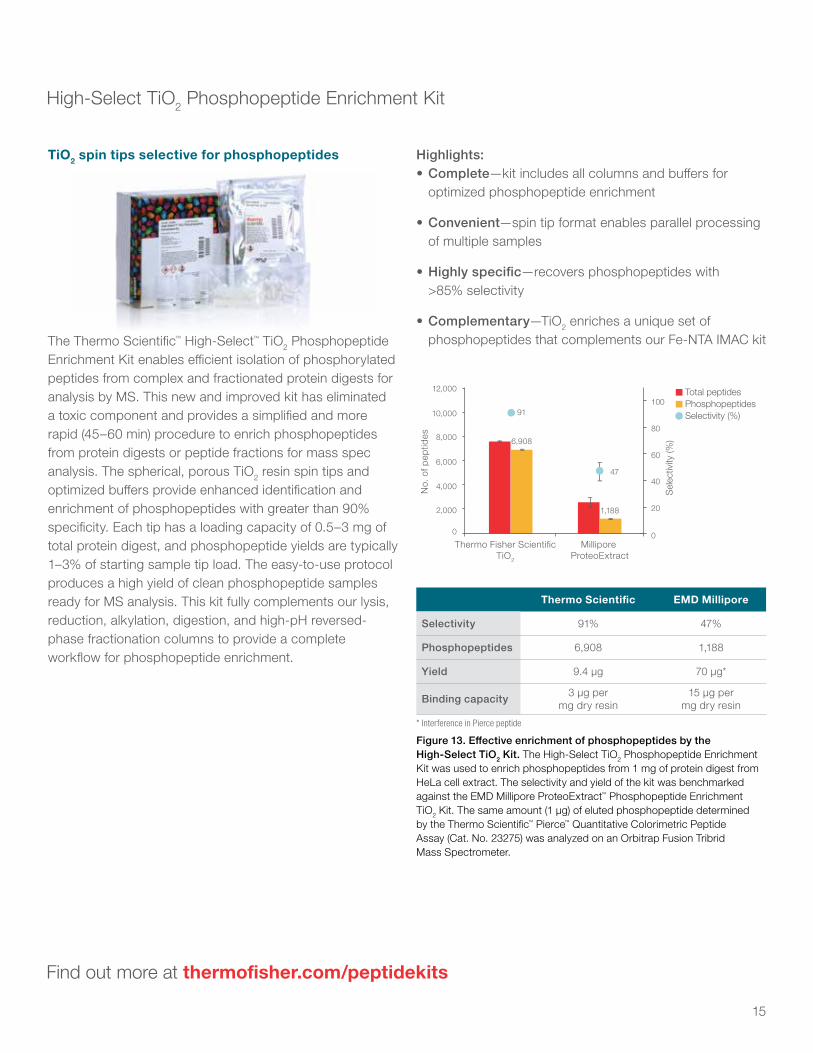
Figure 13. Effective enrichment of phosphopeptides by the High-Select TiO2 Kit. The High-Select TiO2 Phosphopeptide Enrichment Kit was used to enrich phosphopeptides from 1 mg of protein digest from HeLa cell extract. The selectivity and yield of the kit was benchmarked against the EMD Millipore ProteoExtract™ Phosphopeptide Enrichment TiO2 Kit. The same amount (1 μg) of eluted phosphopeptide determined by the Thermo Scientific™ Pierce™ Quantitative Colorimetric Peptide Assay (Cat. No. 23275) was analyzed on an Orbitrap Fusion Tribrid Mass Spectrometer.
Thermo Fisher ScientificTiO2
Millipore ProteoExtract
Total peptidesPhosphopeptidesSelectivity (%)91
47
6,908
1,188
0
2,000
4,000
6,000
8,000
10,000
12,000
0
20
40
60
80
100
No.
of p
eptid
es
Sel
ectiv
ity (%
)
Thermo Scientific EMD Millipore
Selectivity 91% 47%
Phosphopeptides 6,908 1,188
Yield 9.4 µg 70 µg*
Binding capacity 3 µg per mg dry resin
15 µg per mg dry resin
* Interference in Pierce peptide
Find out more at thermofisher.com/peptidekits
The Thermo Scientific™ High-Select™ TiO2 Phosphopeptide Enrichment Kit enables efficient isolation of phosphorylated peptides from complex and fractionated protein digests for analysis by MS. This new and improved kit has eliminated a toxic component and provides a simplified and more rapid (45–60 min) procedure to enrich phosphopeptides from protein digests or peptide fractions for mass spec analysis. The spherical, porous TiO2 resin spin tips and optimized buffers provide enhanced identification and enrichment of phosphopeptides with greater than 90% specificity. Each tip has a loading capacity of 0.5–3 mg of total protein digest, and phosphopeptide yields are typically 1–3% of starting sample tip load. The easy-to-use protocol produces a high yield of clean phosphopeptide samples ready for MS analysis. This kit fully complements our lysis, reduction, alkylation, digestion, and high-pH reversed-phase fractionation columns to provide a complete workflow for phosphopeptide enrichment.
16
Easy-to-use peptide fractionation kit that reduces sample complexity and increases protein identificationThe Thermo Scientific™ Pierce™ High pH Reversed-Phase Peptide Fractionation Kit increases protein identification from LC-MS analysis through orthogonal peptide fractionation of complex peptide samples.
Highlights:• Easy to use—resin provided in single-use spin
column format
• Improved protein identifications—protein identifications increased by ≥50% when compared to unfractionated samples
• Reproducible—elution profiles and fractional resolution vary by less than 20%
• Optimized—robust procedure for maximal protein identification and peptide recovery while minimizing fractional overlap
• Compatible—reagents have been validated with a variety of complex samples, including peptides labeled with Thermo Scientific™ Tandem Mass Tag™ (TMT™) reagents
To enable deep proteome sequencing, it is often necessary to reduce the sample complexity by fractionation in an orthogonal dimension prior to LC-MS analysis. The Pierce High pH Reversed-Phase Peptide Fractionation Kit uses high-pH reversed-phase chromatography to separate peptides by hydrophobicity and provides excellent orthogonality to low-pH reversed-phase LC-MS gradients. The kit is designed to improve protein identification through the use of a proprietary reversed-phase resin in an easy-to-use spin column format with a high-pH fractionation protocol. In contrast to strong cation exchange (SCX) fractionation, the high-pH reversed-phase fractions do not require an additional desalting step before LC-MS analysis.
The Pierce High pH Reversed-Phase Peptide Fractionation Kit includes a high-pH solution (0.1% triethylamine) and 12 spin columns containing pH-resistant reversed-phase resin. Each reversed-phase fractionation spin column enables fractionation of 10–100 µg of peptide sample using a microcentrifuge. Native phosphorylated samples labeled with TMT reagents and other complex peptide mixture samples can be fractionated using the kit. Combining the search results generated by the individual fractions improves protein sequence coverage and increases number of identified proteins relative to unfractionated samples
Pierce High pH Reversed-Phase Peptide Fractionation Kit
WashFractionation and elution
(1) Acetonitrile (x2)(2) 0.1% TFA (x2)
Conditionedspin column
Digestsample
Centrifuge at 5,000 x g(2 min)
Centrifuge at 3,000 x g(2 min)
Centrifuge at 3,000 x g(2 min)
Peptide elution with step gradient
Waste
Elution solution 1
Flowthroughfraction
Washfraction
Sample fractions1 2 3 4 5 6 7 8
Water
Column conditioning
Centrifuge at 3,000 x g(2 min)
Sample loading
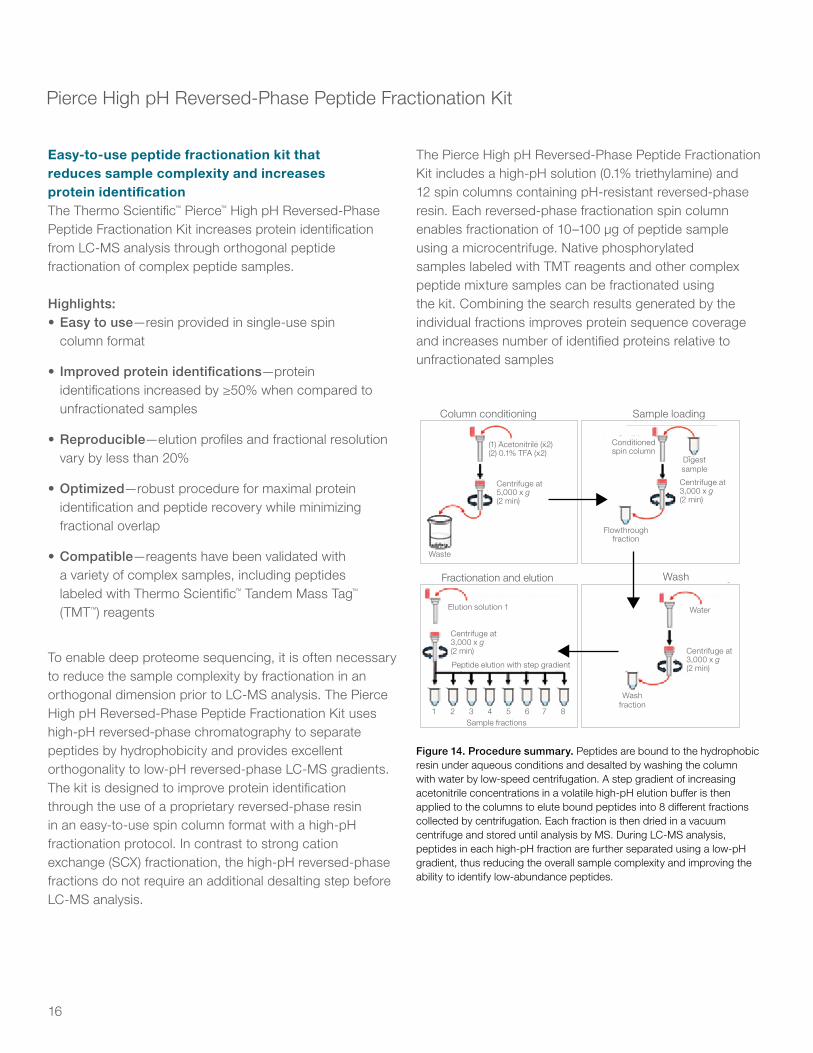
Figure 14. Procedure summary. Peptides are bound to the hydrophobic resin under aqueous conditions and desalted by washing the column with water by low-speed centrifugation. A step gradient of increasing acetonitrile concentrations in a volatile high-pH elution buffer is then applied to the columns to elute bound peptides into 8 different fractions collected by centrifugation. Each fraction is then dried in a vacuum centrifuge and stored until analysis by MS. During LC-MS analysis, peptides in each high-pH fraction are further separated using a low-pH gradient, thus reducing the overall sample complexity and improving the ability to identify low-abundance peptides.
17
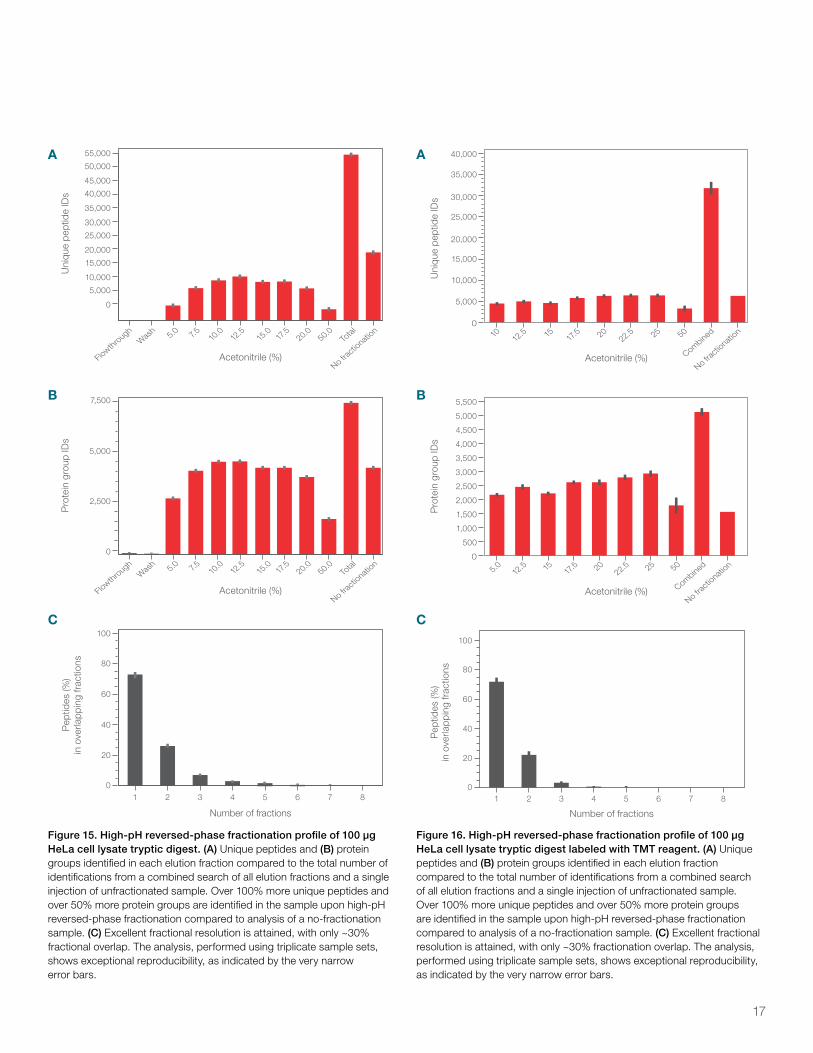
Figure 15. High-pH reversed-phase fractionation profile of 100 µg HeLa cell lysate tryptic digest. (A) Unique peptides and (B) protein groups identified in each elution fraction compared to the total number of identifications from a combined search of all elution fractions and a single injection of unfractionated sample. Over 100% more unique peptides and over 50% more protein groups are identified in the sample upon high-pH reversed-phase fractionation compared to analysis of a no-fractionation sample. (C) Excellent fractional resolution is attained, with only ~30% fractional overlap. The analysis, performed using triplicate sample sets, shows exceptional reproducibility, as indicated by the very narrow error bars.
Figure 16. High-pH reversed-phase fractionation profile of 100 µg HeLa cell lysate tryptic digest labeled with TMT reagent. (A) Unique peptides and (B) protein groups identified in each elution fraction compared to the total number of identifications from a combined search of all elution fractions and a single injection of unfractionated sample. Over 100% more unique peptides and over 50% more protein groups are identified in the sample upon high-pH reversed-phase fractionation compared to analysis of a no-fractionation sample. (C) Excellent fractional resolution is attained, with only ~30% fractionation overlap. The analysis, performed using triplicate sample sets, shows exceptional reproducibility, as indicated by the very narrow error bars.
Uni
que
pept
ide
IDs
Pro
tein
gro
up ID
sP
eptid
es (%
)in
ove
rlapp
ing
frac
tions
0
5,000
10,000
15,000
20,000
30,000
35,000
40,000
25,000
0
500
1,000
1,500
2,000
2,500
3,000
3,500
4,000
4,500
5,000
5,500
0
20
40
60
80
100
10 12.5 15 17
.5 2022.5 25 50
Combined
No frac
tionati
on
Acetonitrile (%)
5.012
.5 15 17.5 20
22.5 25 50
Combined
No frac
tionati
on
Acetonitrile (%)
Number of fractions
1 2 3 4 5 6 7 8
Uni
que
pept
ide
IDs
Pro
tein
gro
up ID
sP
eptid
es (%
)in
ove
rlapp
ing
frac
tions
0
0
0
20
40
60
80
100
2,500
5,000
7,500
FlowthroughWas
h 5.0 7.5 10.0
12.5
15.0
17.5
20.050.0
Total
No fracti
onation
5,000
Acetonitrile (%)
FlowthroughWas
h 5.0 7.5 10.0
12.5
15.0
17.5
20.050.0
Total
No fracti
onation
Acetonitrile (%)
Number of fractions
1 2 3 4 5 6 7 8
10,000
15,000
20,000
25,000
30,000
35,000
40,000
45,000
50,000
55,000A A
B B
C C
18
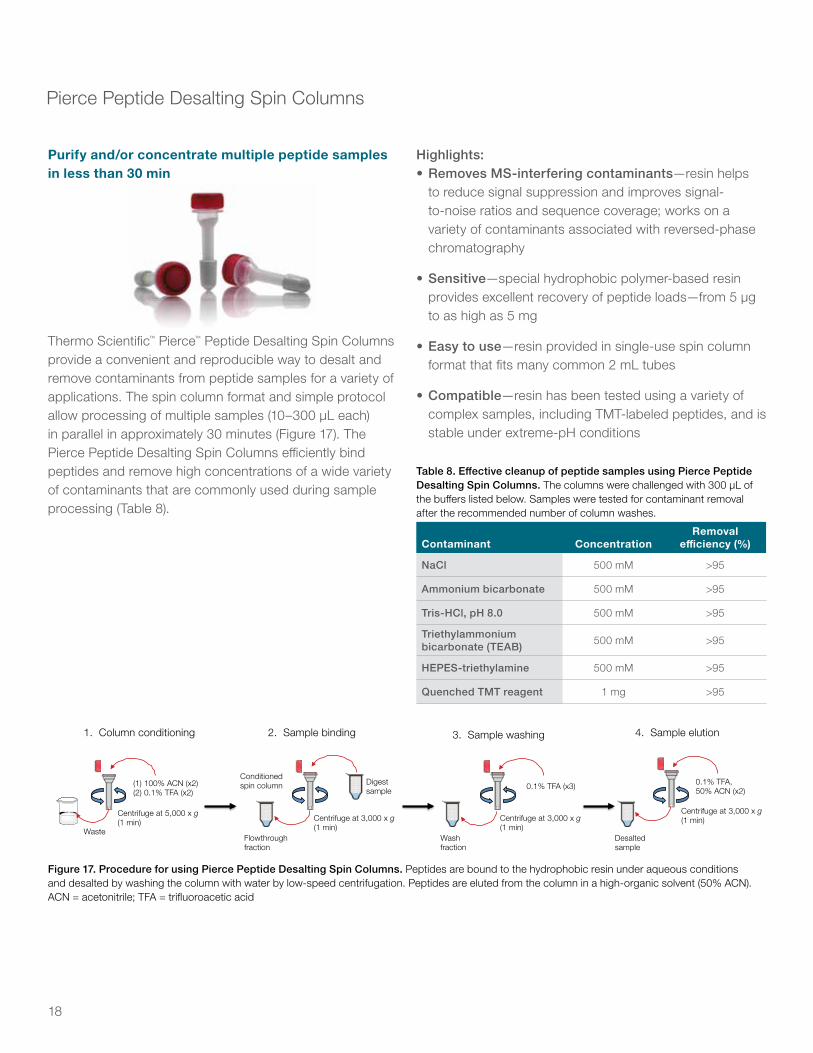
Pierce Peptide Desalting Spin Columns
Highlights:• Removes MS-interfering contaminants—resin helps
to reduce signal suppression and improves signal-to-noise ratios and sequence coverage; works on a variety of contaminants associated with reversed-phase chromatography
• Sensitive—special hydrophobic polymer-based resin provides excellent recovery of peptide loads—from 5 µg to as high as 5 mg
• Easy to use—resin provided in single-use spin column format that fits many common 2 mL tubes
• Compatible—resin has been tested using a variety of complex samples, including TMT-labeled peptides, and is stable under extreme-pH conditions
Purify and/or concentrate multiple peptide samples in less than 30 min
1. Column conditioning
(1) 100% ACN (x2)(2) 0.1% TFA (x2)
Conditioned spin column Digest
sample 0.1% TFA (x3) 0.1% TFA, 50% ACN (x2)
Centrifuge at 5,000 x g(1 min) Centrifuge at 3,000 x g
(1 min)Centrifuge at 3,000 x g(1 min)
Centrifuge at 3,000 x g(1 min)
Flowthrough fraction
Wash fraction
Desalted sample
Waste
2. Sample binding 3. Sample washing 4. Sample elution
Figure 17. Procedure for using Pierce Peptide Desalting Spin Columns. Peptides are bound to the hydrophobic resin under aqueous conditions and desalted by washing the column with water by low-speed centrifugation. Peptides are eluted from the column in a high-organic solvent (50% ACN). ACN = acetonitrile; TFA = trifluoroacetic acid
Table 8. Effective cleanup of peptide samples using Pierce Peptide Desalting Spin Columns. The columns were challenged with 300 µL of the buffers listed below. Samples were tested for contaminant removal after the recommended number of column washes.
Contaminant ConcentrationRemoval
efficiency (%)
NaCl 500 mM >95
Ammonium bicarbonate 500 mM >95
Tris-HCl, pH 8.0 500 mM >95
Triethylammonium bicarbonate (TEAB) 500 mM >95
HEPES-triethylamine 500 mM >95
Quenched TMT reagent 1 mg >95
Thermo Scientific™ Pierce™ Peptide Desalting Spin Columns provide a convenient and reproducible way to desalt and remove contaminants from peptide samples for a variety of applications. The spin column format and simple protocol allow processing of multiple samples (10–300 µL each) in parallel in approximately 30 minutes (Figure 17). The Pierce Peptide Desalting Spin Columns efficiently bind peptides and remove high concentrations of a wide variety of contaminants that are commonly used during sample processing (Table 8).
19
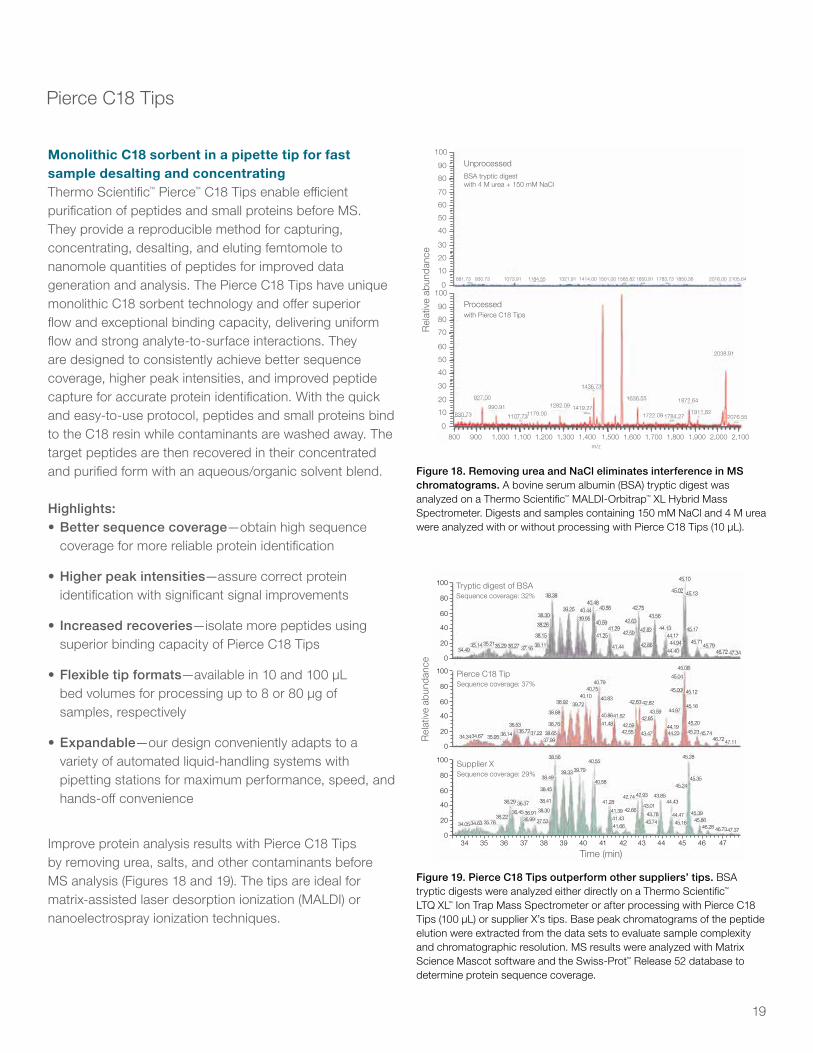
Monolithic C18 sorbent in a pipette tip for fast sample desalting and concentrating Thermo Scientific™ Pierce™ C18 Tips enable efficient purification of peptides and small proteins before MS. They provide a reproducible method for capturing, concentrating, desalting, and eluting femtomole to nanomole quantities of peptides for improved data generation and analysis. The Pierce C18 Tips have unique monolithic C18 sorbent technology and offer superior flow and exceptional binding capacity, delivering uniform flow and strong analyte-to-surface interactions. They are designed to consistently achieve better sequence coverage, higher peak intensities, and improved peptide capture for accurate protein identification. With the quick and easy-to-use protocol, peptides and small proteins bind to the C18 resin while contaminants are washed away. The target peptides are then recovered in their concentrated and purified form with an aqueous/organic solvent blend.
Highlights:• Better sequence coverage—obtain high sequence
coverage for more reliable protein identification
• Higher peak intensities—assure correct protein identification with significant signal improvements
• Increased recoveries—isolate more peptides using superior binding capacity of Pierce C18 Tips
• Flexible tip formats—available in 10 and 100 µL bed volumes for processing up to 8 or 80 µg of samples, respectively
• Expandable—our design conveniently adapts to a variety of automated liquid-handling systems with pipetting stations for maximum performance, speed, and hands-off convenience
Improve protein analysis results with Pierce C18 Tips by removing urea, salts, and other contaminants before MS analysis (Figures 18 and 19). The tips are ideal for matrix-assisted laser desorption ionization (MALDI) or nanoelectrospray ionization techniques.
Pierce C18 Tips
Figure 18. Removing urea and NaCl eliminates interference in MS chromatograms. A bovine serum albumin (BSA) tryptic digest was analyzed on a Thermo Scientific™ MALDI-Orbitrap™ XL Hybrid Mass Spectrometer. Digests and samples containing 150 mM NaCl and 4 M urea were analyzed with or without processing with Pierce C18 Tips (10 µL).
Figure 19. Pierce C18 Tips outperform other suppliers’ tips. BSA tryptic digests were analyzed either directly on a Thermo Scientific™ LTQ XL™ Ion Trap Mass Spectrometer or after processing with Pierce C18 Tips (100 µL) or supplier X’s tips. Base peak chromatograms of the peptide elution were extracted from the data sets to evaluate sample complexity and chromatographic resolution. MS results were analyzed with Matrix Science Mascot software and the Swiss-Prot™ Release 52 database to determine protein sequence coverage.
Rel
ativ
e A
bund
ance
800 900 1,000 1,100 1,200 1,300 1,400 1,500m/z
1,600 1,700 1,800 1,900 2,000 2,100
830.73
881.73 930.73 1073.91 1184.55 1321.91 1414.00 1501.00 1565.82 1650.91 1783.73 1850.36 2016.00 2105.64
990.91
927.00
1722.09 1784.27
1872.64
2076.55
1636.55
2038.91
1911.82
1436.73
1179.001107.731419.271282.09
0
10
20
30
40
50
60
70
80
90
1000
10
20
30
40
50
60
70
80
90
100
Rel
ativ
e ab
unda
nce
BSA tryptic digestwith 4 M urea + 150 mM NaCl
Unprocessed
with Pierce C18 TipsProcessed
100
80
60
40
20
034.49
34.34
34.0534.63 35.7636.22
36.29 36.37
36.45 36.9136.99 37.53
38.30
38.41
38.45
38.4939.33 39.79
40.55
40.58
41.2842.74
42.66
42.93 43.85
43.01
43.78
43.74
44.43
45.24
45.28
45.35
45.39
47.3746.7346.2845.86
44.4745.16
41.3941.4341.66
38.56
34.67 35.95 36.14
36.53
38.92 39.72
40.10 40.83
40.8641.5241.48 42.59
42.63 42.82
43.5942.85
43.4744.19
44.97
45.00
45.04
45.08
45.12
45.16
45.20
47.1146.7245.7445.2344.2342.55
40.7540.79
38.88
38.76
38.6537.99
36.7237.22
35.14 35.2135.29 36.27 37.16
38.30
38.38
39.2540.48
40.44
39.95
40.56
40.59
41.2541.29
41.44
42.59
42.63
42.75
43.56
44.13
45.02 45.13
45.10
45.17
45.7145.79
46.72 47.34
44.1744.94
44.40
42.82
42.86
38.26
38.15
38.11
100
80
60
40
20
0
100
80
60
40
20
34 35 36 37 38 39 40 41 42 43 44 45 46 470
Tryptic digest of BSASequence coverage: 32%
Pierce C18 TipSequence coverage: 37%
Supplier XSequence coverage: 29%
Time (min)
Rel
ativ
e ab
unda
nce
20
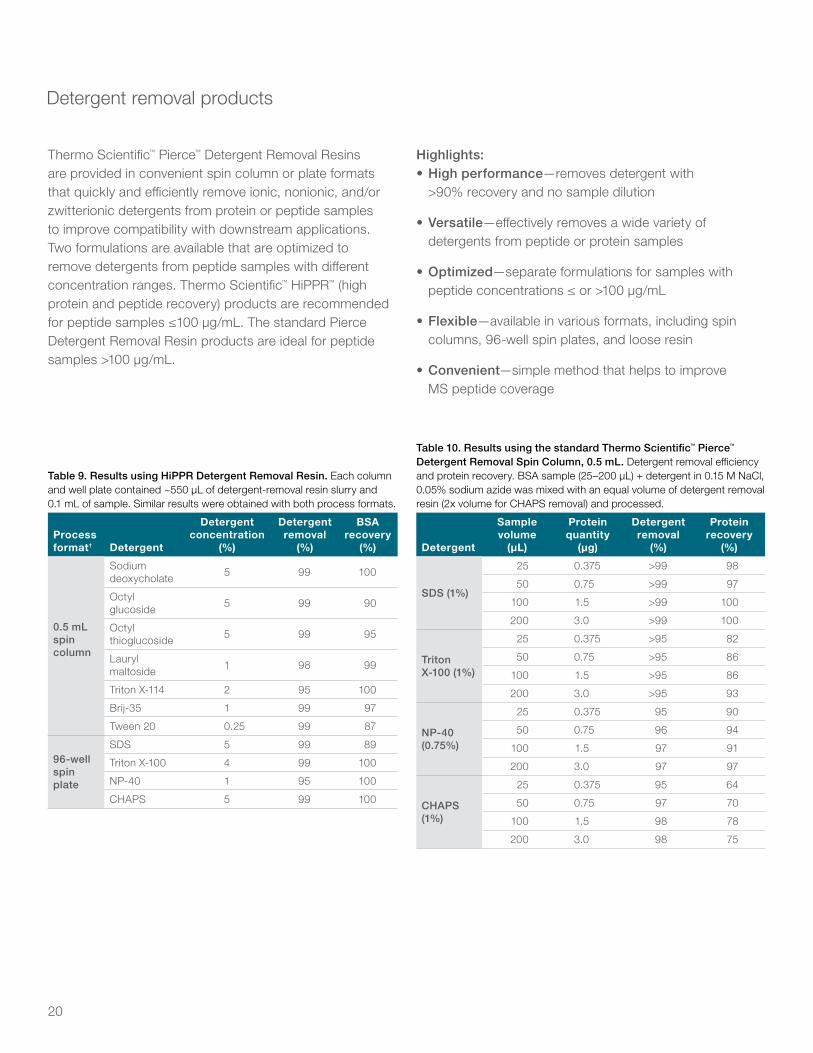
Thermo Scientific™ Pierce™ Detergent Removal Resins are provided in convenient spin column or plate formats that quickly and efficiently remove ionic, nonionic, and/or zwitterionic detergents from protein or peptide samples to improve compatibility with downstream applications. Two formulations are available that are optimized to remove detergents from peptide samples with different concentration ranges. Thermo Scientific™ HiPPR™ (high protein and peptide recovery) products are recommended for peptide samples ≤100 µg/mL. The standard Pierce Detergent Removal Resin products are ideal for peptide samples >100 µg/mL.
Highlights:• High performance—removes detergent with
>90% recovery and no sample dilution
• Versatile—effectively removes a wide variety of detergents from peptide or protein samples
• Optimized—separate formulations for samples with peptide concentrations ≤ or >100 µg/mL
• Flexible—available in various formats, including spin columns, 96-well spin plates, and loose resin
• Convenient—simple method that helps to improve MS peptide coverage
Detergent removal products
Table 10. Results using the standard Thermo Scientific™ Pierce™ Detergent Removal Spin Column, 0.5 mL. Detergent removal efficiency and protein recovery. BSA sample (25–200 µL) + detergent in 0.15 M NaCl, 0.05% sodium azide was mixed with an equal volume of detergent removal resin (2x volume for CHAPS removal) and processed.
Detergent
Sample volume
(µL)
Protein quantity
(µg)
Detergent removal
(%)
Protein recovery
(%)
SDS (1%)
25 0.375 >99 98
50 0.75 >99 97
100 1.5 >99 100
200 3.0 >99 100
Triton X-100 (1%)
25 0.375 >95 82
50 0.75 >95 86
100 1.5 >95 86
200 3.0 >95 93
NP-40 (0.75%)
25 0.375 95 90
50 0.75 96 94
100 1.5 97 91
200 3.0 97 97
CHAPS (1%)
25 0.375 95 64
50 0.75 97 70
100 1.5 98 78
200 3.0 98 75
Table 9. Results using HiPPR Detergent Removal Resin. Each column and well plate contained ~550 µL of detergent-removal resin slurry and 0.1 mL of sample. Similar results were obtained with both process formats.
Process format† Detergent
Detergent concentration
(%)
Detergent removal
(%)
BSA recovery
(%)
0.5 mL spin column
Sodium deoxycholate 5 99 100
Octyl glucoside 5 99 90
Octyl thioglucoside 5 99 95
Lauryl maltoside 1 98 99
Triton X-114 2 95 100
Brij-35 1 99 97
Tween 20 0.25 99 87
96-well spin plate
SDS 5 99 89
Triton X-100 4 99 100
NP-40 1 95 100
CHAPS 5 99 100
21
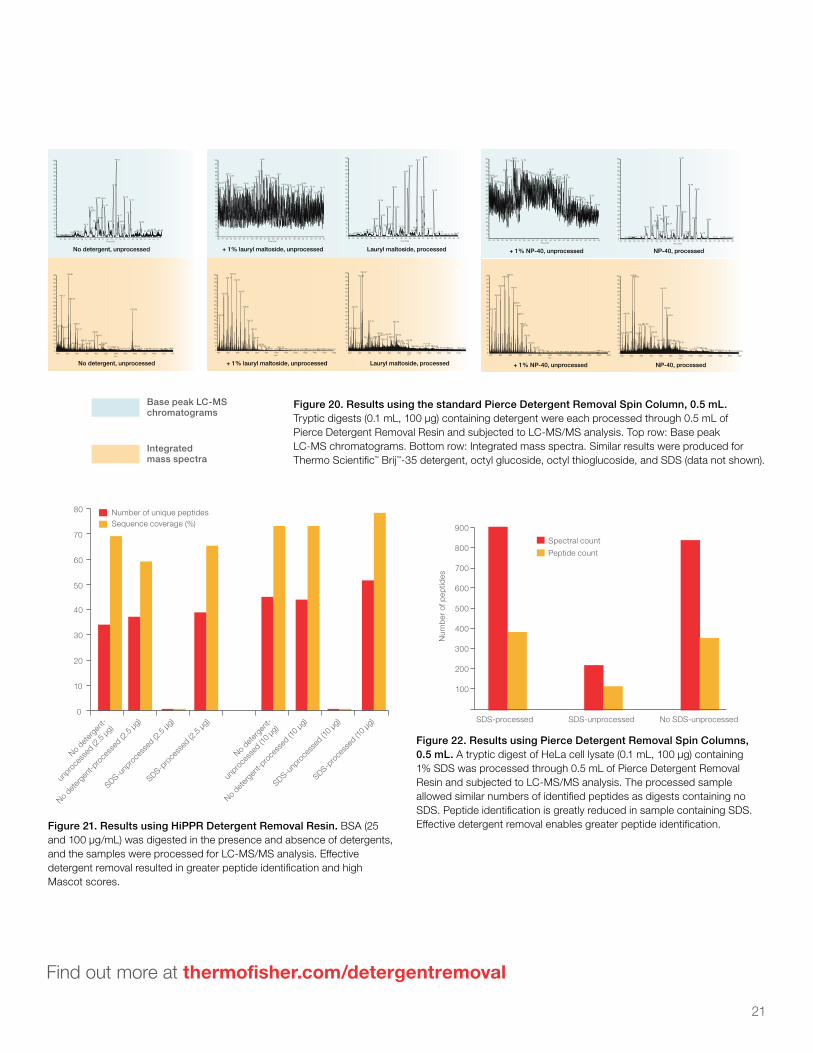
Figure 20. Results using the standard Pierce Detergent Removal Spin Column, 0.5 mL. Tryptic digests (0.1 mL, 100 µg) containing detergent were each processed through 0.5 mL of Pierce Detergent Removal Resin and subjected to LC-MS/MS analysis. Top row: Base peak LC-MS chromatograms. Bottom row: Integrated mass spectra. Similar results were produced for Thermo Scientific™ Brij™-35 detergent, octyl glucoside, octyl thioglucoside, and SDS (data not shown).
31 32 33 34 35 36 37 38 39 40 41 42 43 44 45 46 47 48 49 50 51 52 53 54Time (min)
No detergent, unprocessed
0
5
10
15
20
25
30
35
40
45
50
55
60
65
70
75
80
85
90
95
100 44.18
43.50
46.1639.59 40.8747.56
41.4737.92
38.0047.15
44.7740.02
39.37 42.43 44.82 50.0236.81 45.54
38.1852.8449.23 52.32 54.8954.0151.4834.52 48.7235.1034.39 53.92
35.6433.8831.5932.0930.47
400 500 600 700 800 900 1000 1100 1200 1300 1400 1500 1600m/z
0
5
10
15
20
25
30
35
40
45
50
55
60
65
70
75
80
85
90
95
100 518.98
445.07
536.08
1176.98
592.87410.28
462.01610.12
785.41
820.67
481.06666.82 740.83
875.20584.15 708.61653.83 863.181192.68941.03997.55
1585.091242.511111.50 1324.641030.58 1527.621481.781399.36
No detergent, unprocessed
30 31 32 33 34 35 36 37 38 39 40 41 42 43 44 45 46 47 48 49 50 51 52 53 54 55Time (min)
0
5
10
15
20
25
30
35
40
45
50
55
60
65
70
75
80
85
90
95
100 40.37
39.7032.13 44.27
41.4233.01 39.03 42.4841.08 43.56
31.84 42.5738.7030.03 50.0636.42 45.4033.62 48.9546.5852.1050.5347.3938.3833.9234.25 54.4730.60 36.65 46.5236.0931.81 51.7548.8334.55 37.38 54.3148.08 51.37 53.63
49.7746.23
+ 1% lauryl maltoside, unprocessed
400 500 600 700 800 900 1000 1100 1200 1300 1400 1500 1600m/z
0
5
10
15
20
25
30
35
40
45
50
55
60
65
70
75
80
85
90
95
100 546.43
502.41590.47
634.47458.39
678.50
419.45
722.52
763.04
782.97
815.69854.60
1037.79902.801055.17922.95 1020.93 1123.93 1456.741195.56 1325.281275.72 1500.791410.22 1575.75
+ 1% lauryl maltoside, unprocessed
30 31 32 33 34 35 36 37 38 39 40 41 42 43 44 45 46 47 48 49 50 51 52 53 54 55Time (min)
0
5
10
15
20
25
30
35
40
45
50
55
60
65
70
75
80
85
90
95
100 47.20
45.67
43.83
42.89
40.26
49.46
46.74
37.08
38.92 40.83
37.54
35.88
39.5138.6736.18 41.7845.4242.25 48.2334.33 44.66
50.7833.77 34.8532.3132.20 49.84 54.5754.2352.4430.45 51.18
Lauryl maltoside, processed
400 500 600 700 800 900 1000 1100 1200 1300 1400 1500 1600m/z
0
5
10
15
20
25
30
35
40
45
50
55
60
65
70
75
80
85
90
95
100 536.07
519.00
445.08
610.13 863.39
419.23462.01
700.88 784.78 875.02708.65666.77 820.81582.77 637.38
740.81 997.59887.45917.54508.04 1171.82954.76
1182.151250.061048.571112.571286.761356.781389.82 1513.351584.88
Lauryl maltoside, processed
30 31 32 33 34 35 36 37 38 39 40 41 42 43 44 45 46 47 48 49 50 51 52 53 54 55Time (min)
0
5
10
15
20
25
30
35
40
45
50
55
60
65
70
75
80
85
90
95
100 35.6137.6934.0135.5036.14
36.21 44.0633.86 37.9036.4943.8838.8237.15 39.67 43.3740.55 44.26 47.3242.9741.7330.4730.71 45.7834.30 42.27 47.7444.30 46.22
44.4331.4731.63 44.63 46.5733.6932.73
48.54
53.2849.3249.8550.9451.4350.27
51.9452.5354.59
+ 1% NP-40, unprocessed
400 500 600 700 800 900 1000 1100 1200 1300 1400 1500 1600m/z
0
5
10
15
20
25
30
35
40
45
50
55
60
65
70
75
80
85
90
95
100 590.54546.53
507.58634.51
463.59
639.60678.51
419.56
683.61
722.54727.61
766.53
810.55
859.70903.74 1499.92947.77 1573.86991.74 1425.951080.381118.591179.17 1351.971236.271277.93
+ 1% NP-40, unprocessed
30 31 32 33 34 35 36 37 38 39 40 41 42 43 44 45 46 47 48 49 50 51 52 53 54 55Time (min)
0
5
10
15
20
25
30
35
40
45
50
55
60
65
70
75
80
85
90
95
100 43.39
45.46
46.93
42.6939.6836.79
43.83
38.3540.22
46.5539.57 49.5538.15
40.3437.24
35.62
41.3545.2538.99
48.1544.2534.7233.0632.61 52.6851.0331.93 49.30 53.0654.86
NP-40, processed
400 500 600 700 800 900 1000 1100 1200 1300 1400 1500 1600m/z
0
5
10
15
20
25
30
35
40
45
50
55
60
65
70
75
80
85
90
95
100 518.99536.08
820.75
863.40
445.08874.63
637.30610.14701.11
474.44 708.69419.23 582.81
740.73
899.45785.19 956.43997.61941.34
1172.191030.95 1229.891112.66 1271.58 1399.591325.65 1466.781513.791590.89
NP-40, processed
Base peak LC-MS chromatograms
Integrated mass spectra
Figure 21. Results using HiPPR Detergent Removal Resin. BSA (25 and 100 µg/mL) was digested in the presence and absence of detergents, and the samples were processed for LC-MS/MS analysis. Effective detergent removal resulted in greater peptide identification and high Mascot scores.
Figure 22. Results using Pierce Detergent Removal Spin Columns, 0.5 mL. A tryptic digest of HeLa cell lysate (0.1 mL, 100 µg) containing 1% SDS was processed through 0.5 mL of Pierce Detergent Removal Resin and subjected to LC-MS/MS analysis. The processed sample allowed similar numbers of identified peptides as digests containing no SDS. Peptide identification is greatly reduced in sample containing SDS. Effective detergent removal enables greater peptide identification.
80
70
60
50
40
30
20
10
0
No dete
rgen
t-
unpro
cess
ed (2
.5 µg
)
Number of unique peptidesSequence coverage (%)
No dete
rgen
t-pro
cess
ed (2
.5 µg
)
SDS-unp
roce
ssed
(2.5
µg)
SDS-pro
cess
ed (2
.5 µg
)
No dete
rgen
t-
unpro
cess
ed (1
0 µg)
No dete
rgen
t-pro
cess
ed (1
0 µg)
SDS-unp
roce
ssed
(10 µ
g)
SDS-pro
cess
ed (1
0 µg)
Num
ber o
f pep
tides
900
Spectral count
Peptide count800
700
600
500
400
300
200
100
SDS-unprocessedSDS-processed No SDS-unprocessed
Find out more at thermofisher.com/detergentremoval
22
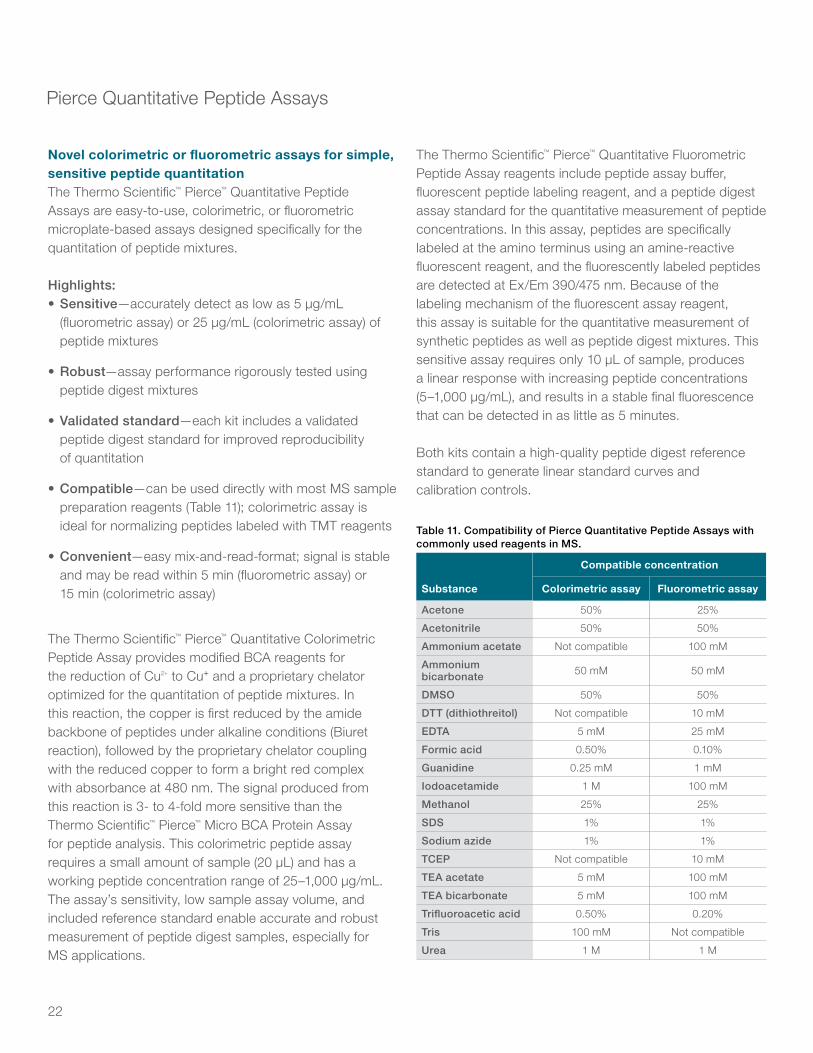
Novel colorimetric or fluorometric assays for simple, sensitive peptide quantitationThe Thermo Scientific™ Pierce™ Quantitative Peptide Assays are easy-to-use, colorimetric, or fluorometric microplate-based assays designed specifically for the quantitation of peptide mixtures.
Highlights:• Sensitive—accurately detect as low as 5 µg/mL
(fluorometric assay) or 25 μg/mL (colorimetric assay) of peptide mixtures
• Robust—assay performance rigorously tested using peptide digest mixtures
• Validated standard—each kit includes a validated peptide digest standard for improved reproducibility of quantitation
• Compatible—can be used directly with most MS sample preparation reagents (Table 11); colorimetric assay is ideal for normalizing peptides labeled with TMT reagents
• Convenient—easy mix-and-read-format; signal is stable and may be read within 5 min (fluorometric assay) or 15 min (colorimetric assay)
The Thermo Scientific™ Pierce™ Quantitative Colorimetric Peptide Assay provides modified BCA reagents for the reduction of Cu2+ to Cu⁺ and a proprietary chelator optimized for the quantitation of peptide mixtures. In this reaction, the copper is first reduced by the amide backbone of peptides under alkaline conditions (Biuret reaction), followed by the proprietary chelator coupling with the reduced copper to form a bright red complex with absorbance at 480 nm. The signal produced from this reaction is 3- to 4-fold more sensitive than the Thermo Scientific™ Pierce™ Micro BCA Protein Assay for peptide analysis. This colorimetric peptide assay requires a small amount of sample (20 μL) and has a working peptide concentration range of 25–1,000 μg/mL. The assay’s sensitivity, low sample assay volume, and included reference standard enable accurate and robust measurement of peptide digest samples, especially for MS applications.
The Thermo Scientific™ Pierce™ Quantitative Fluorometric Peptide Assay reagents include peptide assay buffer, fluorescent peptide labeling reagent, and a peptide digest assay standard for the quantitative measurement of peptide concentrations. In this assay, peptides are specifically labeled at the amino terminus using an amine-reactive fluorescent reagent, and the fluorescently labeled peptides are detected at Ex/Em 390/475 nm. Because of the labeling mechanism of the fluorescent assay reagent, this assay is suitable for the quantitative measurement of synthetic peptides as well as peptide digest mixtures. This sensitive assay requires only 10 μL of sample, produces a linear response with increasing peptide concentrations (5–1,000 μg/mL), and results in a stable final fluorescence that can be detected in as little as 5 minutes.
Both kits contain a high-quality peptide digest reference standard to generate linear standard curves and calibration controls.
Pierce Quantitative Peptide Assays
Table 11. Compatibility of Pierce Quantitative Peptide Assays with commonly used reagents in MS.
Compatible concentration
Substance Colorimetric assay Fluorometric assay
Acetone 50% 25%
Acetonitrile 50% 50%
Ammonium acetate Not compatible 100 mM
Ammonium bicarbonate 50 mM 50 mM
DMSO 50% 50%
DTT (dithiothreitol) Not compatible 10 mM
EDTA 5 mM 25 mM
Formic acid 0.50% 0.10%
Guanidine 0.25 mM 1 mM
Iodoacetamide 1 M 100 mM
Methanol 25% 25%
SDS 1% 1%
Sodium azide 1% 1%
TCEP Not compatible 10 mM
TEA acetate 5 mM 100 mM
TEA bicarbonate 5 mM 100 mM
Trifluoroacetic acid 0.50% 0.20%
Tris 100 mM Not compatible
Urea 1 M 1 M
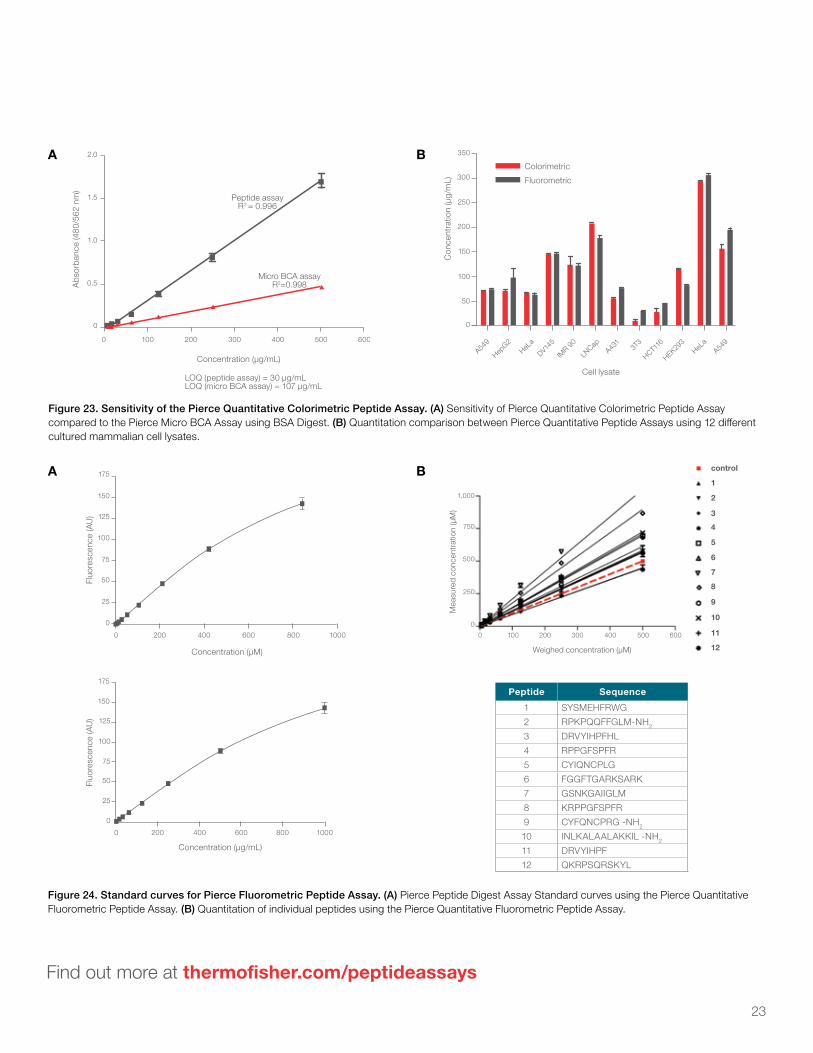
23
Figure 23. Sensitivity of the Pierce Quantitative Colorimetric Peptide Assay. (A) Sensitivity of Pierce Quantitative Colorimetric Peptide Assay compared to the Pierce Micro BCA Assay using BSA Digest. (B) Quantitation comparison between Pierce Quantitative Peptide Assays using 12 different cultured mammalian cell lysates.
Abs
orba
nce
(480
/562
nm
)C
once
ntra
tion
(μg/
mL)
Concentration (μg/mL)
LOQ (peptide assay) = 30 μg/mLLOQ (micro BCA assay) = 107 μg/mL
2.0
1.5
1.0
0.5
0
350
Colorimetric
Fluorometric
Cell lysate
300
250
200
150
100
50
0
A549
HepG2
HeLa
DV145
IMR 9
0
LNCap
A431
3T3
HCT116
HEK293
HeLa
A549
0 100 200 300 400 500 600
Peptide assayR2 = 0.996
Micro BCA assayR2=0.998
175
150
125
100
75
50
25
0
175
150
125
100
75
50
25
0
0 200 400 600 800 1000
0 200 400 600 800 1000
Concentration (μM)
Concentration (μg/mL)
Fluo
resc
ence
(AU
)Fl
uore
scen
ce (A
U)
Figure 24. Standard curves for Pierce Fluorometric Peptide Assay. (A) Pierce Peptide Digest Assay Standard curves using the Pierce Quantitative Fluorometric Peptide Assay. (B) Quantitation of individual peptides using the Pierce Quantitative Fluorometric Peptide Assay.
Mea
sure
d co
ncen
trat
ion
(μM
)
Weighed concentration (μM)
1,000
750
500
250
0
0 100 200 300 400 500 600
control
1
2
3
4
5
6
7
8
9
10
11
12
Peptide Sequence
1 SYSMEHFRWG
2 RPKPQQFFGLM-NH2
3 DRVYIHPFHL
4 RPPGFSPFR
5 CYIQNCPLG
6 FGGFTGARKSARK
7 GSNKGAIIGLM
8 KRPPGFSPFR
9 CYFQNCPRG -NH2
10 INLKALAALAKKIL -NH2
11 DRVYIHPF
12 QKRPSQRSKYL
Abs
orba
nce
(480
/562
nm
)C
once
ntra
tion
(μg/
mL)
Concentration (μg/mL)
LOQ (peptide assay) = 30 μg/mLLOQ (micro BCA assay) = 107 μg/mL
2.0
1.5
1.0
0.5
0
350
Colorimetric
Fluorometric
Cell lysate
300
250
200
150
100
50
0
A549
HepG2
HeLa
DV145
IMR 9
0
LNCap
A431
3T3
HCT116
HEK293
HeLa
A549
0 100 200 300 400 500 600
Peptide assayR2 = 0.996
Micro BCA assayR2=0.998
B
B
A
A
Find out more at thermofisher.com/peptideassays
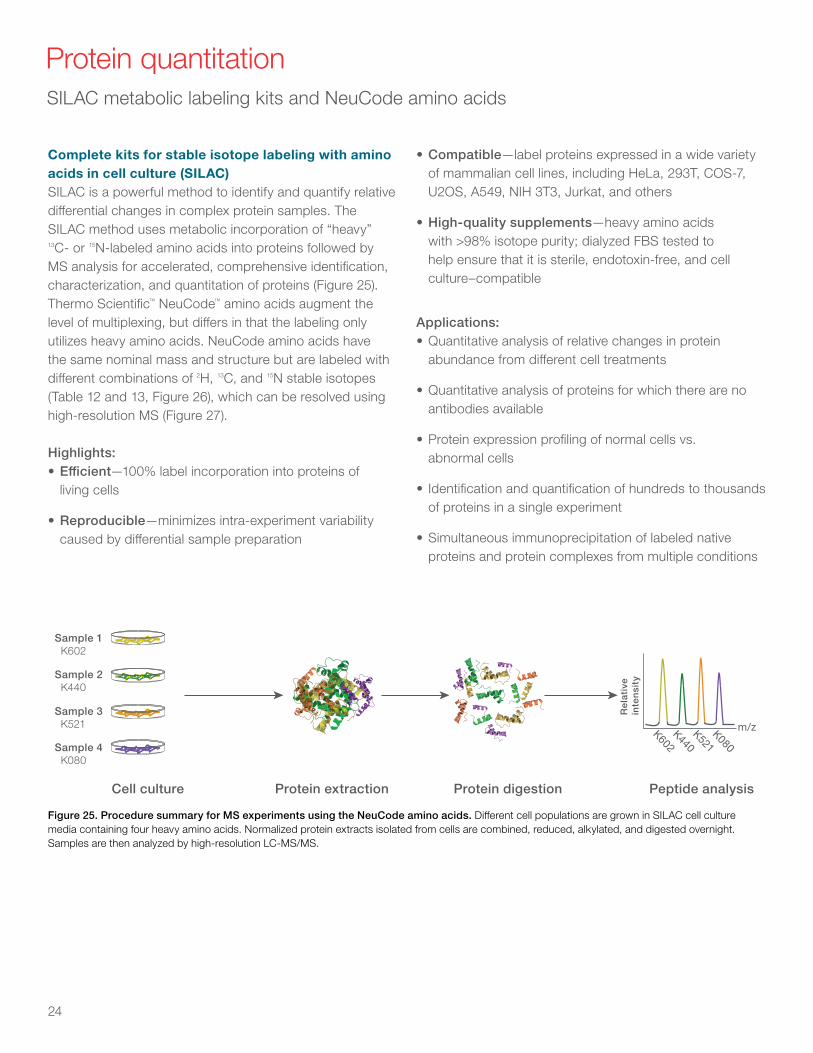
24
Complete kits for stable isotope labeling with amino acids in cell culture (SILAC)SILAC is a powerful method to identify and quantify relative differential changes in complex protein samples. The SILAC method uses metabolic incorporation of “heavy” 13C- or 15N-labeled amino acids into proteins followed by MS analysis for accelerated, comprehensive identification, characterization, and quantitation of proteins (Figure 25). Thermo Scientific™ NeuCode™ amino acids augment the level of multiplexing, but differs in that the labeling only utilizes heavy amino acids. NeuCode amino acids have the same nominal mass and structure but are labeled with different combinations of 2H, 13C, and 15N stable isotopes (Table 12 and 13, Figure 26), which can be resolved using high-resolution MS (Figure 27).
Highlights:• Efficient—100% label incorporation into proteins of
living cells
• Reproducible—minimizes intra-experiment variability caused by differential sample preparation
• Compatible—label proteins expressed in a wide variety of mammalian cell lines, including HeLa, 293T, COS-7, U2OS, A549, NIH 3T3, Jurkat, and others
• High-quality supplements—heavy amino acids with >98% isotope purity; dialyzed FBS tested to help ensure that it is sterile, endotoxin-free, and cell culture–compatible
Applications:• Quantitative analysis of relative changes in protein
abundance from different cell treatments
• Quantitative analysis of proteins for which there are no antibodies available
• Protein expression profiling of normal cells vs. abnormal cells
• Identification and quantification of hundreds to thousands of proteins in a single experiment
• Simultaneous immunoprecipitation of labeled native proteins and protein complexes from multiple conditions
Protein quantitation SILAC metabolic labeling kits and NeuCode amino acids
Sample 1 Light
Sample 2 Heavy
Cell culture Protein extraction Protein digestion Peptide analysis
K602K440K521K080
Sample 1 K602
Sample 2 K440
Sample 3 K521
Sample 4 K080
Cell culture Protein extraction Protein digestion Peptide analysis
Rel
ativ
ein
ten
sity
m/z
m/zLight Heavy
Rel
ativ
ein
ten
sity
Figure 25. Procedure summary for MS experiments using the NeuCode amino acids. Different cell populations are grown in SILAC cell culture media containing four heavy amino acids. Normalized protein extracts isolated from cells are combined, reduced, alkylated, and digested overnight. Samples are then analyzed by high-resolution LC-MS/MS.
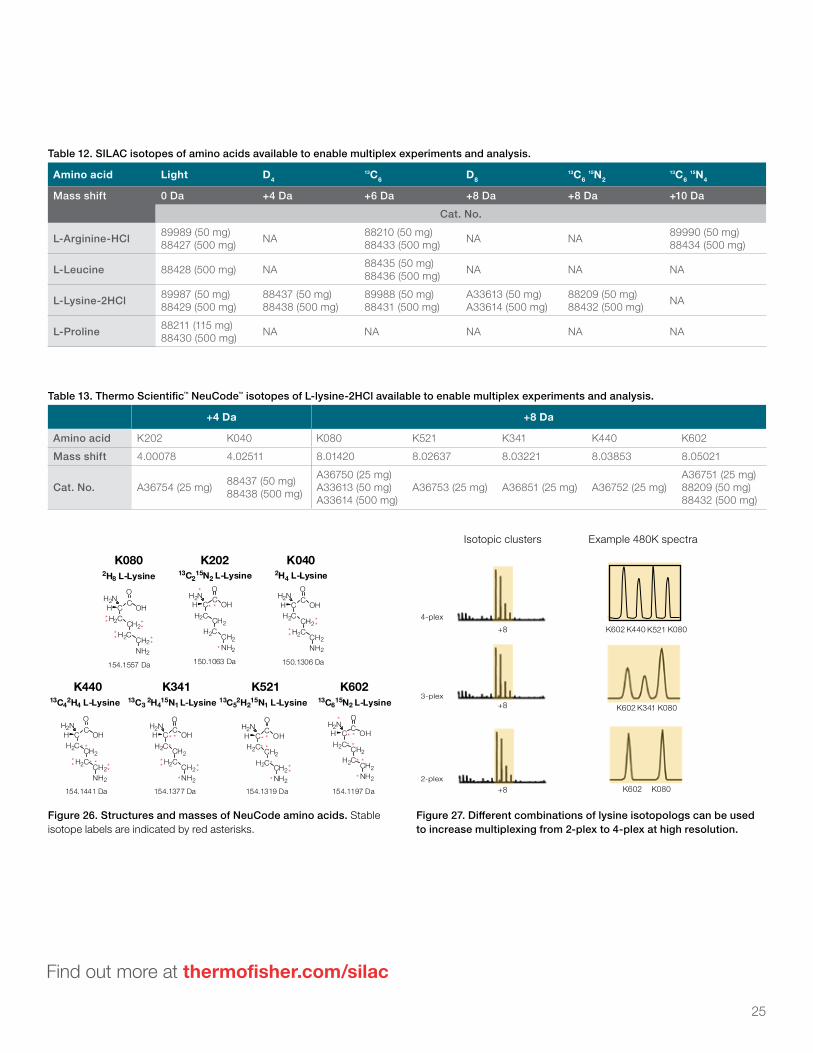
25
Isotopic clusters Example 480K spectra
K602 K080
K602 K440 K521
K602 K341 K080
K080+8
+8
+8
4-plex
3-plex
2-plex
Table 12. SILAC isotopes of amino acids available to enable multiplex experiments and analysis.
Amino acid Light D413C6 D8
13C6 15N2
13C6 15N4
Mass shift 0 Da +4 Da +6 Da +8 Da +8 Da +10 Da
Cat. No.
L-Arginine-HCl 89989 (50 mg) 88427 (500 mg) NA 88210 (50 mg)
88433 (500 mg) NA NA 89990 (50 mg) 88434 (500 mg)
L-Leucine 88428 (500 mg) NA 88435 (50 mg) 88436 (500 mg) NA NA NA
L-Lysine-2HCl 89987 (50 mg) 88429 (500 mg)
88437 (50 mg) 88438 (500 mg)
89988 (50 mg) 88431 (500 mg)
A33613 (50 mg) A33614 (500 mg)
88209 (50 mg) 88432 (500 mg) NA
L-Proline 88211 (115 mg) 88430 (500 mg) NA NA NA NA NA
Table 13. Thermo Scientific™ NeuCode™ isotopes of L-lysine-2HCl available to enable multiplex experiments and analysis.
+4 Da +8 Da
Amino acid K202 K040 K080 K521 K341 K440 K602
Mass shift 4.00078 4.02511 8.01420 8.02637 8.03221 8.03853 8.05021
Cat. No. A36754 (25 mg) 88437 (50 mg) 88438 (500 mg)
A36750 (25 mg) A33613 (50 mg) A33614 (500 mg)
A36753 (25 mg) A36851 (25 mg) A36752 (25 mg)A36751 (25 mg) 88209 (50 mg) 88432 (500 mg)
H 2 N C C
O H H 2 C
O
C H 2 H 2 C
H
C H 2 N H 2
K 2 0 2 1 3 C 2 1 5 N 2 L - L y s i n e
*
1 5 0 . 1 0 6 3 D a *
* *
2 H 4 L - L y s i n e K 0 4 0
H 2 N C C
O H H 2 C
O
C H 2 H 2 C
H
C H 2 N H 2
*
1 5 0 . 1 3 0 6 D a
* * *
K 0 8 0 2 H 8 L - L y s i n e
* *
H 2 N C C
O H H 2 C
O
C H 2 H 2 C
H
C H 2 N H 2
*
1 5 4 . 1 5 5 7 D a
* * *
* *
K 6 0 2 1 3 C 6 1 5 N 2 L - L y s i n e
H 2 N C C
O H H 2 C
O
C H 2 H 2 C
H
C H 2 N H 2
*
1 5 4 . 1 1 9 7 D a *
* * *
* *
*
K 3 4 1 1 3 C 3 2 H 4 1 5 N L - L y s i n e
H 2 N C C
O H H 2 C
O
C H 2 H 2 C
H
C H 2 N H 2
*
1 5 4 . 1 3 7 7 D a *
* *
* *
* *
1 3 C 5 2 H 2 1 5 N 1 L - L y s i n e K 5 2 1
H 2 N C C
O H H 2 C
O
C H 2 H 2 C
H
C H 2 N H 2
1 5 4 . 1 3 1 9 D a *
* * *
*
*
* *
K 4 4 0 1 3 C 4 2 H 4 L - L y s i n e
* *
H 2 N C C
O H H 2 C
O
C H 2 H 2 C
H
C H 2 N H 2
*
1 5 4 . 1 4 4 1 D a
* * *
* *
1
Figure 26. Structures and masses of NeuCode amino acids. Stable isotope labels are indicated by red asterisks.
Figure 27. Different combinations of lysine isotopologs can be used to increase multiplexing from 2-plex to 4-plex at high resolution.
Find out more at thermofisher.com/silac
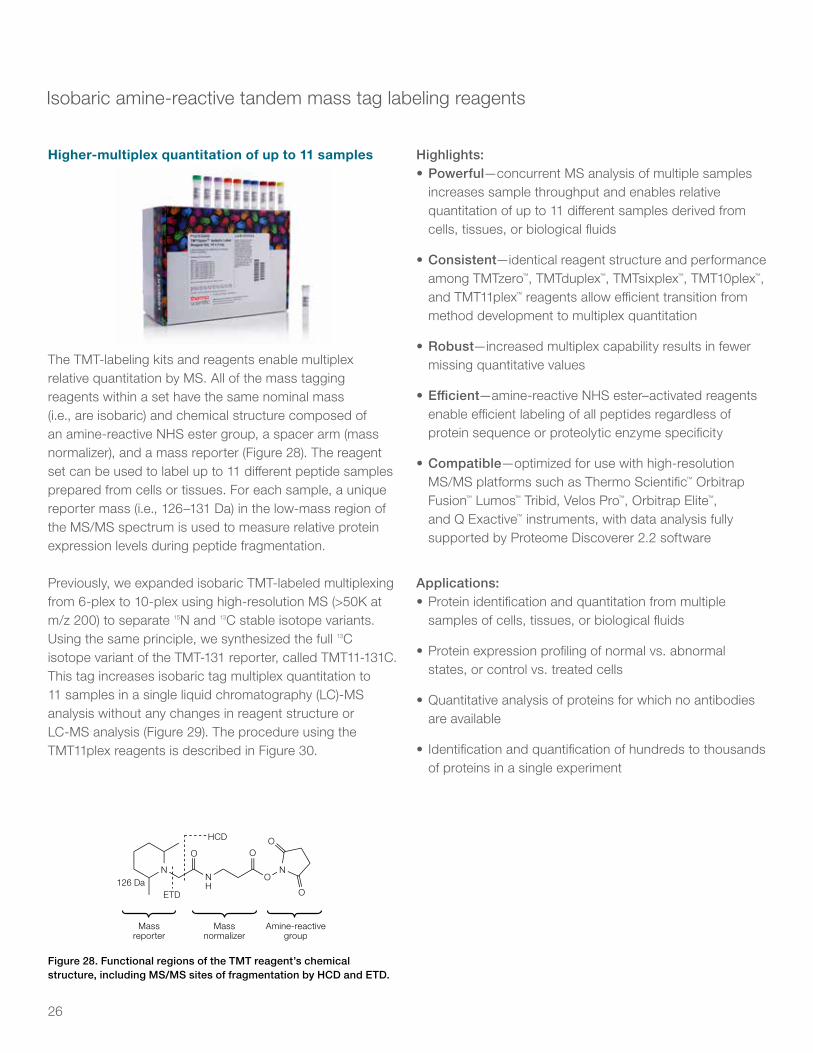
26
The TMT-labeling kits and reagents enable multiplex relative quantitation by MS. All of the mass tagging reagents within a set have the same nominal mass (i.e., are isobaric) and chemical structure composed of an amine-reactive NHS ester group, a spacer arm (mass normalizer), and a mass reporter (Figure 28). The reagent set can be used to label up to 11 different peptide samples prepared from cells or tissues. For each sample, a unique reporter mass (i.e., 126–131 Da) in the low-mass region of the MS/MS spectrum is used to measure relative protein expression levels during peptide fragmentation.
Previously, we expanded isobaric TMT-labeled multiplexing from 6-plex to 10-plex using high-resolution MS (>50K at m/z 200) to separate 15N and 13C stable isotope variants. Using the same principle, we synthesized the full 13C isotope variant of the TMT-131 reporter, called TMT11-131C. This tag increases isobaric tag multiplex quantitation to 11 samples in a single liquid chromatography (LC)-MS analysis without any changes in reagent structure or LC-MS analysis (Figure 29). The procedure using the TMT11plex reagents is described in Figure 30.
Highlights:• Powerful—concurrent MS analysis of multiple samples
increases sample throughput and enables relative quantitation of up to 11 different samples derived from cells, tissues, or biological fluids
• Consistent—identical reagent structure and performance among TMTzero™, TMTduplex™, TMTsixplex™, TMT10plex™, and TMT11plex™ reagents allow efficient transition from method development to multiplex quantitation
• Robust—increased multiplex capability results in fewer missing quantitative values
• Efficient—amine-reactive NHS ester–activated reagents enable efficient labeling of all peptides regardless of protein sequence or proteolytic enzyme specificity
• Compatible—optimized for use with high-resolution MS/MS platforms such as Thermo Scientific™ Orbitrap Fusion™ Lumos™ Tribid, Velos Pro™, Orbitrap Elite™, and Q Exactive™ instruments, with data analysis fully supported by Proteome Discoverer 2.2 software
Applications:• Protein identification and quantitation from multiple
samples of cells, tissues, or biological fluids
• Protein expression profiling of normal vs. abnormal states, or control vs. treated cells
• Quantitative analysis of proteins for which no antibodies are available
• Identification and quantification of hundreds to thousands of proteins in a single experiment
Isobaric amine-reactive tandem mass tag labeling reagents
Higher-multiplex quantitation of up to 11 samples
NNH
ON
O O
O
O
Massreporter
Massnormalizer
Amine-reactivegroup
HCD
ETD126 Da
Figure 28. Functional regions of the TMT reagent’s chemical structure, including MS/MS sites of fragmentation by HCD and ETD.
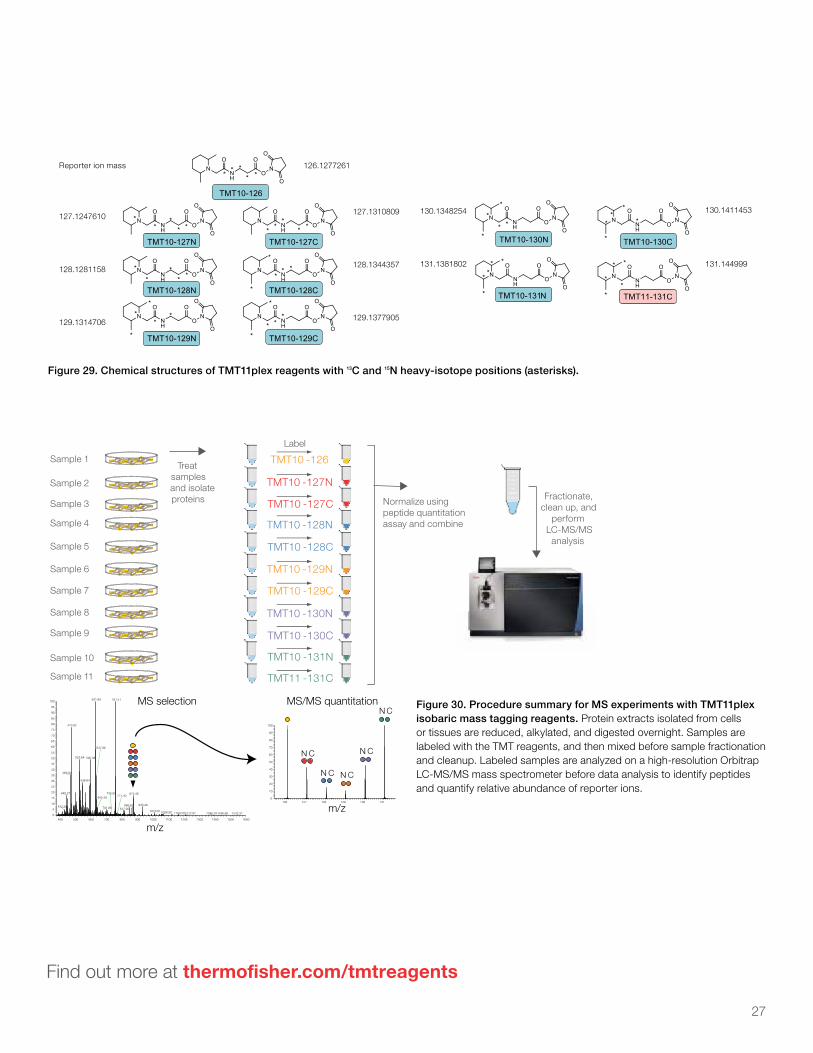
27
Find out more at thermofisher.com/tmtreagents
Figure 29. Chemical structures of TMT11plex reagents with 13C and 15N heavy-isotope positions (asterisks).
Reporter ion mass
127.1247610
128.1281158
129.1314706
130.1348254
131.1381802
127.1310809
126.1277261
128.1344357
129.1377905
130.1411453
131.144999
TMT10 -126
TMT10 -127N
TMT10 -128N
TMT10 -129N
TMT10 -130N
Label
TMT10 -127C
TMT10 -128C
TMT10 -129C
TMT10 -130C
TMT10 -131N
TMT11 -131C
Sample 1Treat
samplesand isolateproteins Fractionate,
clean up, andperform
LC-MS/MSanalysis
Normalize usingpeptide quantitationassay and combine
Sample 2
Sample 3
Sample 4
Sample 5
Sample 6
Sample 7
Sample 8
Sample 9
Sample 10
Sample 11
400 500 600 700 800 900 1000 1100 1200 1300 1400 1500 1600
m/z0
5
10
15
20
25
30
35
40
45
50
55
60
65
70
75
80
85
90
95
100 631.89 761.41
473.82
525.64 595.38
466.83
637.86
546.84
445.27 875.46
933.49866.69
645.39
701.86 817.95432.28
771.40
1010.81
735.93
1058.50 1168.501212.97 1446.861396.78 1542.31
126 127 128 129 130 1310
10
20
30
40
50
60
70
80
90
100
m/z
N C
N C N C
N C
N CMS selection MS/MS quantitation Figure 30. Procedure summary for MS experiments with TMT11plex
isobaric mass tagging reagents. Protein extracts isolated from cells or tissues are reduced, alkylated, and digested overnight. Samples are labeled with the TMT reagents, and then mixed before sample fractionation and cleanup. Labeled samples are analyzed on a high-resolution Orbitrap LC-MS/MS mass spectrometer before data analysis to identify peptides and quantify relative abundance of reporter ions.
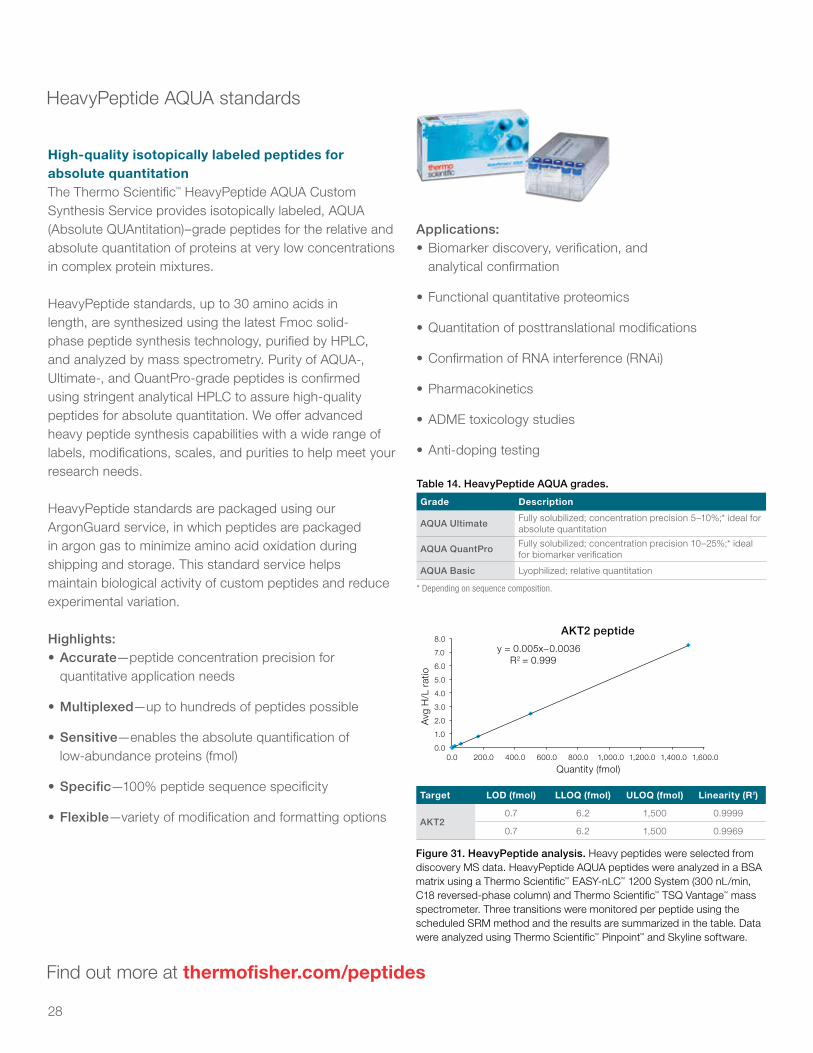
28
The Thermo Scientific™ HeavyPeptide AQUA Custom Synthesis Service provides isotopically labeled, AQUA (Absolute QUAntitation)–grade peptides for the relative and absolute quantitation of proteins at very low concentrations in complex protein mixtures.
HeavyPeptide standards, up to 30 amino acids in length, are synthesized using the latest Fmoc solid-phase peptide synthesis technology, purified by HPLC, and analyzed by mass spectrometry. Purity of AQUA-, Ultimate-, and QuantPro-grade peptides is confirmed using stringent analytical HPLC to assure high-quality peptides for absolute quantitation. We offer advanced heavy peptide synthesis capabilities with a wide range of labels, modifications, scales, and purities to help meet your research needs.
HeavyPeptide standards are packaged using our ArgonGuard service, in which peptides are packaged in argon gas to minimize amino acid oxidation during shipping and storage. This standard service helps maintain biological activity of custom peptides and reduce experimental variation.
Highlights:• Accurate—peptide concentration precision for
quantitative application needs
• Multiplexed—up to hundreds of peptides possible
• Sensitive—enables the absolute quantification of low-abundance proteins (fmol)
• Specific—100% peptide sequence specificity
• Flexible—variety of modification and formatting options
Applications:• Biomarker discovery, verification, and
analytical confirmation
• Functional quantitative proteomics
• Quantitation of posttranslational modifications
• Confirmation of RNA interference (RNAi)
• Pharmacokinetics
• ADME toxicology studies
• Anti-doping testing
HeavyPeptide AQUA standards
High-quality isotopically labeled peptides for absolute quantitation
Find out more at thermofisher.com/peptides
Target LOD (fmol) LLOQ (fmol) ULOQ (fmol) Linearity (R2)
AKT20.7 6.2 1,500 0.9999
0.7 6.2 1,500 0.9969
Table 14. HeavyPeptide AQUA grades.
Grade Description
AQUA Ultimate Fully solubilized; concentration precision 5–10%;* ideal for absolute quantitation
AQUA QuantPro Fully solubilized; concentration precision 10–25%;* ideal for biomarker verification
AQUA Basic Lyophilized; relative quantitation
* Depending on sequence composition.
Figure 31. HeavyPeptide analysis. Heavy peptides were selected from discovery MS data. HeavyPeptide AQUA peptides were analyzed in a BSA matrix using a Thermo Scientific™ EASY-nLC™ 1200 System (300 nL/min, C18 reversed-phase column) and Thermo Scientific™ TSQ Vantage™ mass spectrometer. Three transitions were monitored per peptide using the scheduled SRM method and the results are summarized in the table. Data were analyzed using Thermo Scientific™ Pinpoint™ and Skyline software.
y = 0.0559x−0.0099 R2 = 0.999
0.0
10.0
20.0
30.0
40.0
50.0
60.0
70.0
80.0
90.0
0.0 200.0 400.0 600.0 800.0 1,000.0 1,200.0 1,400.0 1,600.0
Avg
H/L
rat
io
Quantity (fmol)
EGFR peptide
AKT2 peptide
y = 0.005x−0.0036 R2 = 0.999
0.0
1.0
2.0
3.0
4.0
5.0
6.0
7.0
8.0
0.0 200.0 400.0 600.0 800.0 1,000.0 1,200.0 1,400.0 1,600.0
Avg
H/L
rat
io
Quantity (fmol)
29
The study of proteomes, subproteomes, and protein pathways often requires quantitative MS analysis that depends on the development and verification of SRM and MRM assays. The Thermo Scientific™ PEPotec™ SRM Peptide Libraries offer great convenience and flexibility for the development of quantitative MS with many customizable options.
The standard service supplies a suspension of at least 0.1 mg of each crude peptide housed in individual tubes in a 96-well plate format with either arginine (R) or lysine (K) as the C-terminal amino acid (other C-terminal amino acids are available as well; contact us for more information). Three quality-control grades are available, and optional services and peptide modifications are offered to give you the peptide libraries that fit your experimental needs.
Highlights:• Traceable—peptides are provided in individual,
2D-barcoded tubes in 96-tube plates
• Customized—libraries available in various grades with optional services available
• Convenient—standard libraries are delivered solubilized in 0.1% TFA in 50% (v/v) acetonitrile/water
• Flexible—extensive list of available modifications
Applications:• Mid- to high-throughput development of SRM and
MRM assays
• MS workflows with relative and absolute quantitation strategies
Includes:• Fully synthetic, crude (as synthesized) peptides
• Multiple grades of QC analysis and optional services and modifications
• Provided in individual Thermo Scientific™ Matrix™ 96-tube plates
PEPotec SRM Peptide Libraries
Fully synthetic, crude peptides customized for the development of mid- to high-throughput SRM and MRM assays
Table 15. PEPotec SRM Peptide Libraries—three grades to fit your experimental needs.
ParametersGrade 1
Fast and easyGrade 2
Greater analysisGrade 3
Maximum assurance
Quantity >0.1 mg
Length* 6 to 25 amino acids. Up to 35 amino acids are available for an additional fee
Purity Crude (as synthesized)
Formulation* Suspended in 0.1% TFA in 50% (v/v) acetonitrile/water
Delivery format Matrix 96-tube plates (Cat. No. 3712)
C-terminal residue* R or K
Counterion TFA
Quality control (QC) MS check of 5% of peptides MS check of 100% of peptides MS analysis of 100% of peptides
Peptide resynthesis** Not provided Not provided One resynthesis provided
Failed synthesis policy You pay for entire set of peptides ordered
You pay only for peptides successfully synthesized
You pay only for peptides successfully synthesized
Included documentation Peptide amount Peptide amount Peptide amount and MS spectra
Minimum order† 24 peptides 4 peptides 4 peptides* Changes to the standard length restrictions, formulation, and C-terminal residues are available as optional services.** Peptides not detected during MS analysis will be resynthesized (depending on the grade selected).† Orders for fewer than 48 peptides incur a plate fee.
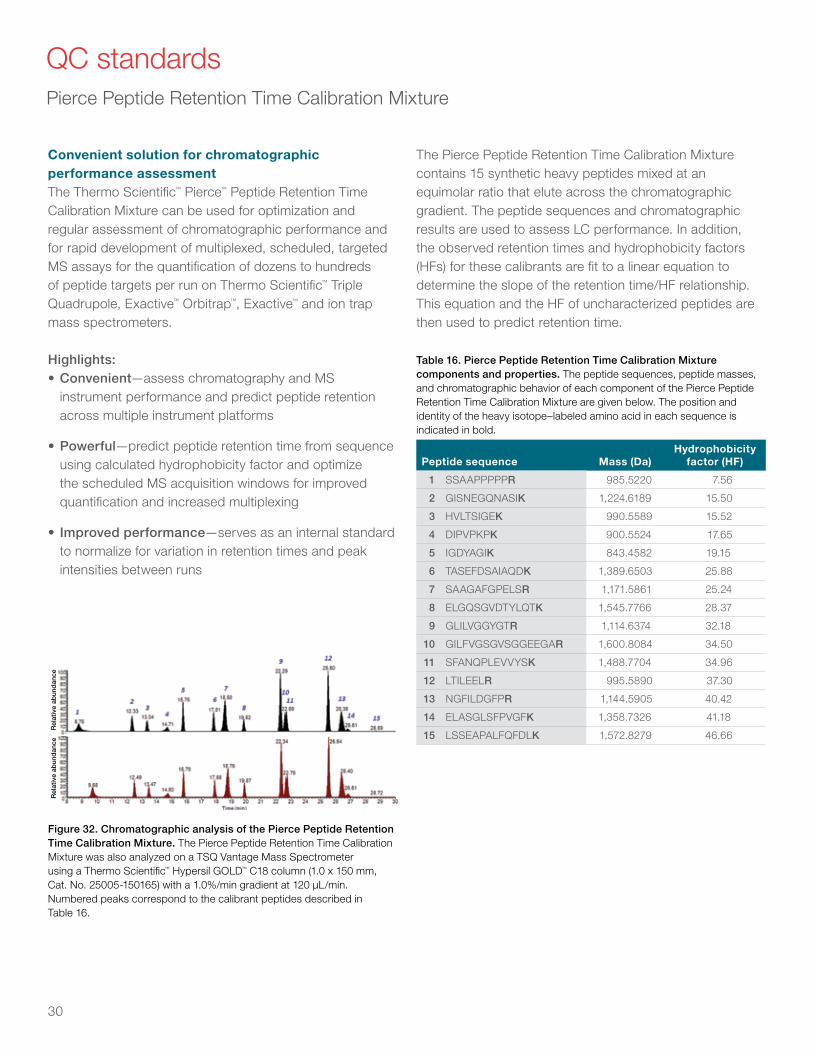
30
Convenient solution for chromatographic performance assessmentThe Thermo Scientific™ Pierce™ Peptide Retention Time Calibration Mixture can be used for optimization and regular assessment of chromatographic performance and for rapid development of multiplexed, scheduled, targeted MS assays for the quantification of dozens to hundreds of peptide targets per run on Thermo Scientific™ Triple Quadrupole, Exactive™ Orbitrap™, Exactive™ and ion trap mass spectrometers.
Highlights: • Convenient—assess chromatography and MS
instrument performance and predict peptide retention across multiple instrument platforms
• Powerful—predict peptide retention time from sequence using calculated hydrophobicity factor and optimize the scheduled MS acquisition windows for improved quantification and increased multiplexing
• Improved performance—serves as an internal standard to normalize for variation in retention times and peak intensities between runs
The Pierce Peptide Retention Time Calibration Mixture contains 15 synthetic heavy peptides mixed at an equimolar ratio that elute across the chromatographic gradient. The peptide sequences and chromatographic results are used to assess LC performance. In addition, the observed retention times and hydrophobicity factors (HFs) for these calibrants are fit to a linear equation to determine the slope of the retention time/HF relationship. This equation and the HF of uncharacterized peptides are then used to predict retention time.
QC standards Pierce Peptide Retention Time Calibration Mixture
Table 16. Pierce Peptide Retention Time Calibration Mixture components and properties. The peptide sequences, peptide masses, and chromatographic behavior of each component of the Pierce Peptide Retention Time Calibration Mixture are given below. The position and identity of the heavy isotope–labeled amino acid in each sequence is indicated in bold.
Peptide sequence Mass (Da)Hydrophobicity
factor (HF)
1 SSAAPPPPPR 985.5220 7.56
2 GISNEGQNASIK 1,224.6189 15.50
3 HVLTSIGEK 990.5589 15.52
4 DIPVPKPK 900.5524 17.65
5 IGDYAGIK 843.4582 19.15
6 TASEFDSAIAQDK 1,389.6503 25.88
7 SAAGAFGPELSR 1,171.5861 25.24
8 ELGQSGVDTYLQTK 1,545.7766 28.37
9 GLILVGGYGTR 1,114.6374 32.18
10 GILFVGSGVSGGEEGAR 1,600.8084 34.50
11 SFANQPLEVVYSK 1,488.7704 34.96
12 LTILEELR 995.5890 37.30
13 NGFILDGFPR 1,144.5905 40.42
14 ELASGLSFPVGFK 1,358.7326 41.18
15 LSSEAPALFQFDLK 1,572.8279 46.66
Figure 32. Chromatographic analysis of the Pierce Peptide Retention Time Calibration Mixture. The Pierce Peptide Retention Time Calibration Mixture was also analyzed on a TSQ Vantage Mass Spectrometer using a Thermo Scientific™ Hypersil GOLD™ C18 column (1.0 x 150 mm, Cat. No. 25005-150165) with a 1.0%/min gradient at 120 µL/min. Numbered peaks correspond to the calibrant peptides described in Table 16.
Rel
ativ
e ab
und
ance
Rel
ativ
e ab
und
ance
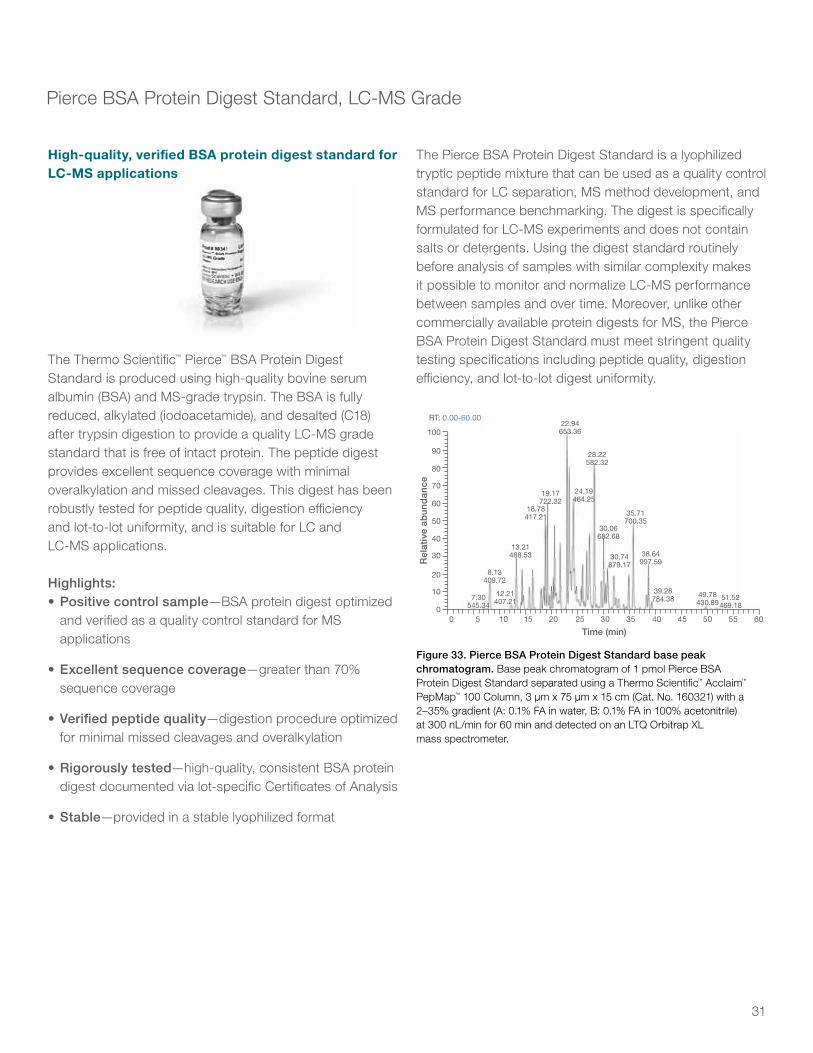
31
The Thermo Scientific™ Pierce™ BSA Protein Digest Standard is produced using high-quality bovine serum albumin (BSA) and MS-grade trypsin. The BSA is fully reduced, alkylated (iodoacetamide), and desalted (C18) after trypsin digestion to provide a quality LC-MS grade standard that is free of intact protein. The peptide digest provides excellent sequence coverage with minimal overalkylation and missed cleavages. This digest has been robustly tested for peptide quality, digestion efficiency and lot-to-lot uniformity, and is suitable for LC and LC-MS applications.
Highlights:• Positive control sample—BSA protein digest optimized
and verified as a quality control standard for MS applications
• Excellent sequence coverage—greater than 70% sequence coverage
• Verified peptide quality—digestion procedure optimized for minimal missed cleavages and overalkylation
• Rigorously tested—high-quality, consistent BSA protein digest documented via lot-specific Certificates of Analysis
• Stable—provided in a stable lyophilized format
The Pierce BSA Protein Digest Standard is a lyophilized tryptic peptide mixture that can be used as a quality control standard for LC separation, MS method development, and MS performance benchmarking. The digest is specifically formulated for LC-MS experiments and does not contain salts or detergents. Using the digest standard routinely before analysis of samples with similar complexity makes it possible to monitor and normalize LC-MS performance between samples and over time. Moreover, unlike other commercially available protein digests for MS, the Pierce BSA Protein Digest Standard must meet stringent quality testing specifications including peptide quality, digestion efficiency, and lot-to-lot digest uniformity.
Pierce BSA Protein Digest Standard, LC-MS Grade
High-quality, verified BSA protein digest standard for LC-MS applications
Figure 33. Pierce BSA Protein Digest Standard base peak chromatogram. Base peak chromatogram of 1 pmol Pierce BSA Protein Digest Standard separated using a Thermo Scientific™ Acclaim™ PepMap™ 100 Column, 3 µm x 75 µm x 15 cm (Cat. No. 160321) with a 2–35% gradient (A: 0.1% FA in water, B: 0.1% FA in 100% acetonitrile) at 300 nL/min for 60 min and detected on an LTQ Orbitrap XL mass spectrometer.
RT: 0.00-60.00
100
90
80
70
60
50
40
30
20
10
00 5 10
7.30545.34
8.13409.72
13.21488.53
19.17722.32
28.22582.32
30.06682.68
51.52469.18
49.78430.89
39.28784.38
38.64997.59
30.74879.17
35.71700.35
24.19464.25
22.94653.36
18.78417.21
12.21407.21
15 20 25
Time (min)
Rel
ativ
e ab
un
dan
ce
30 35 40 45 50 55 60
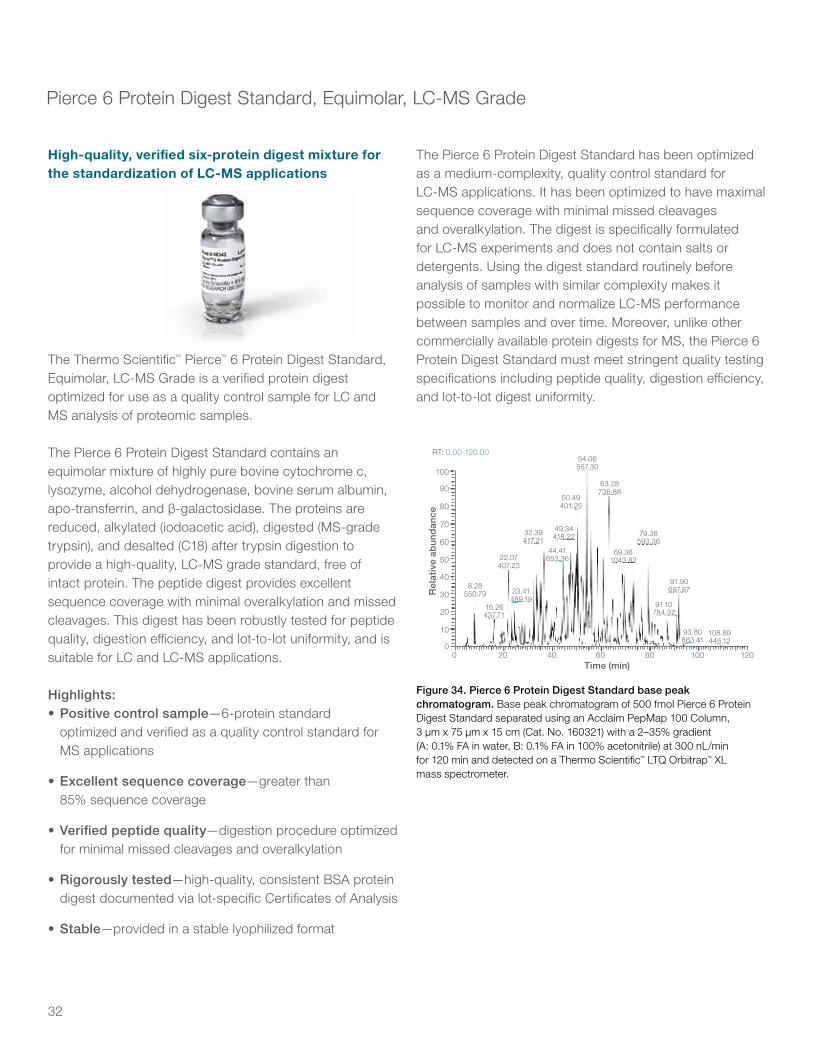
32
The Thermo Scientific™ Pierce™ 6 Protein Digest Standard, Equimolar, LC-MS Grade is a verified protein digest optimized for use as a quality control sample for LC and MS analysis of proteomic samples.
The Pierce 6 Protein Digest Standard contains an equimolar mixture of highly pure bovine cytochrome c, lysozyme, alcohol dehydrogenase, bovine serum albumin, apo-transferrin, and β-galactosidase. The proteins are reduced, alkylated (iodoacetic acid), digested (MS-grade trypsin), and desalted (C18) after trypsin digestion to provide a high-quality, LC-MS grade standard, free of intact protein. The peptide digest provides excellent sequence coverage with minimal overalkylation and missed cleavages. This digest has been robustly tested for peptide quality, digestion efficiency, and lot-to-lot uniformity, and is suitable for LC and LC-MS applications.
Highlights:• Positive control sample—6-protein standard
optimized and verified as a quality control standard for MS applications
• Excellent sequence coverage—greater than 85% sequence coverage
• Verified peptide quality—digestion procedure optimized for minimal missed cleavages and overalkylation
• Rigorously tested—high-quality, consistent BSA protein digest documented via lot-specific Certificates of Analysis
• Stable—provided in a stable lyophilized format
The Pierce 6 Protein Digest Standard has been optimized as a medium-complexity, quality control standard for LC-MS applications. It has been optimized to have maximal sequence coverage with minimal missed cleavages and overalkylation. The digest is specifically formulated for LC-MS experiments and does not contain salts or detergents. Using the digest standard routinely before analysis of samples with similar complexity makes it possible to monitor and normalize LC-MS performance between samples and over time. Moreover, unlike other commercially available protein digests for MS, the Pierce 6 Protein Digest Standard must meet stringent quality testing specifications including peptide quality, digestion efficiency, and lot-to-lot digest uniformity.
Pierce 6 Protein Digest Standard, Equimolar, LC-MS Grade
High-quality, verified six-protein digest mixture for the standardization of LC-MS applications
Figure 34. Pierce 6 Protein Digest Standard base peak chromatogram. Base peak chromatogram of 500 fmol Pierce 6 Protein Digest Standard separated using an Acclaim PepMap 100 Column, 3 µm x 75 µm x 15 cm (Cat. No. 160321) with a 2–35% gradient (A: 0.1% FA in water, B: 0.1% FA in 100% acetonitrile) at 300 nL/min for 120 min and detected on a Thermo Scientific™ LTQ Orbitrap™ XL mass spectrometer.
RT: 0.00-120.00
Rel
ativ
e ab
und
ance
Time (min)
100
90
80
70
60
50
40
30
20
10
00 20
108.89445.12
93.80863.41
91.90697.87
91.10784.37
79.38593.36
69.361043.82
63.28736.88
54.06567.30
50.49401.25
49.34418.22
44.41653.36
32.39417.21
23.41489.19
22.07407.23
16.26437.71
8.28550.79
40 60 80 100 120
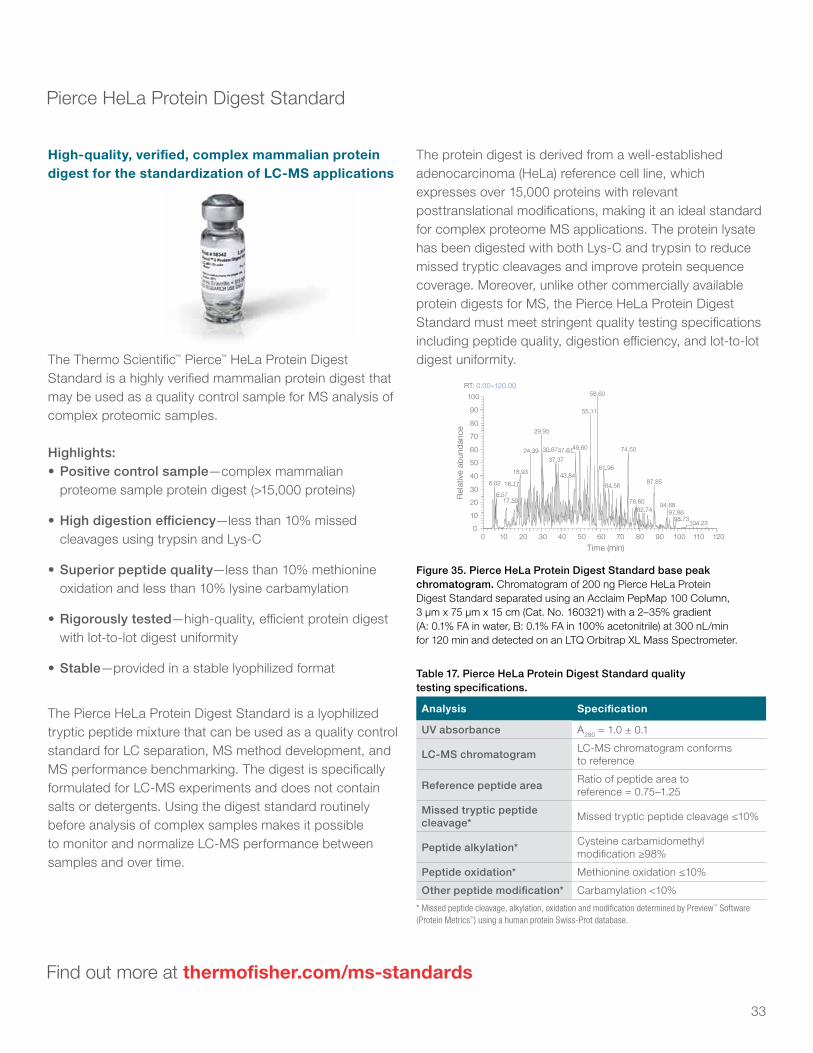
33
The Thermo Scientific™ Pierce™ HeLa Protein Digest Standard is a highly verified mammalian protein digest that may be used as a quality control sample for MS analysis of complex proteomic samples.
Highlights:• Positive control sample—complex mammalian
proteome sample protein digest (>15,000 proteins)
• High digestion efficiency—less than 10% missed cleavages using trypsin and Lys-C
• Superior peptide quality—less than 10% methionine oxidation and less than 10% lysine carbamylation
• Rigorously tested—high-quality, efficient protein digest with lot-to-lot digest uniformity
• Stable—provided in a stable lyophilized format
The Pierce HeLa Protein Digest Standard is a lyophilized tryptic peptide mixture that can be used as a quality control standard for LC separation, MS method development, and MS performance benchmarking. The digest is specifically formulated for LC-MS experiments and does not contain salts or detergents. Using the digest standard routinely before analysis of complex samples makes it possible to monitor and normalize LC-MS performance between samples and over time.
The protein digest is derived from a well-established adenocarcinoma (HeLa) reference cell line, which expresses over 15,000 proteins with relevant posttranslational modifications, making it an ideal standard for complex proteome MS applications. The protein lysate has been digested with both Lys-C and trypsin to reduce missed tryptic cleavages and improve protein sequence coverage. Moreover, unlike other commercially available protein digests for MS, the Pierce HeLa Protein Digest Standard must meet stringent quality testing specifications including peptide quality, digestion efficiency, and lot-to-lot digest uniformity.
Pierce HeLa Protein Digest Standard
High-quality, verified, complex mammalian protein digest for the standardization of LC-MS applications
Find out more at thermofisher.com/ms-standards
Table 17. Pierce HeLa Protein Digest Standard quality testing specifications.
Analysis Specification
UV absorbance A280 = 1.0 ± 0.1
LC-MS chromatogram LC-MS chromatogram conforms to reference
Reference peptide area Ratio of peptide area to reference = 0.75–1.25
Missed tryptic peptide cleavage* Missed tryptic peptide cleavage ≤10%
Peptide alkylation* Cysteine carbamidomethyl modification ≥98%
Peptide oxidation* Methionine oxidation ≤10%
Other peptide modification* Carbamylation <10%
* Missed peptide cleavage, alkylation, oxidation and modification determined by Preview™ Software (Protein Metrics™) using a human protein Swiss-Prot database.
Figure 35. Pierce HeLa Protein Digest Standard base peak chromatogram. Chromatogram of 200 ng Pierce HeLa Protein Digest Standard separated using an Acclaim PepMap 100 Column, 3 µm x 75 µm x 15 cm (Cat. No. 160321) with a 2–35% gradient (A: 0.1% FA in water, B: 0.1% FA in 100% acetonitrile) at 300 nL/min for 120 min and detected on an LTQ Orbitrap XL Mass Spectrometer.
RT: 0.00–120.00
0 10 20 30 40 50 60 70 80 90 100 110 120
Time (min)
0
10
20
30
40
50
60
70
80
90
100
Rel
ativ
e ab
unda
nce
58.60
55.11
29.95
49.60 74.5030.6747.6124.3937.37
61.9618.93 43.84
87.856.02 18.17 64.566.57
17.59 78.80 94.6882.74 97.86
98.73104.23
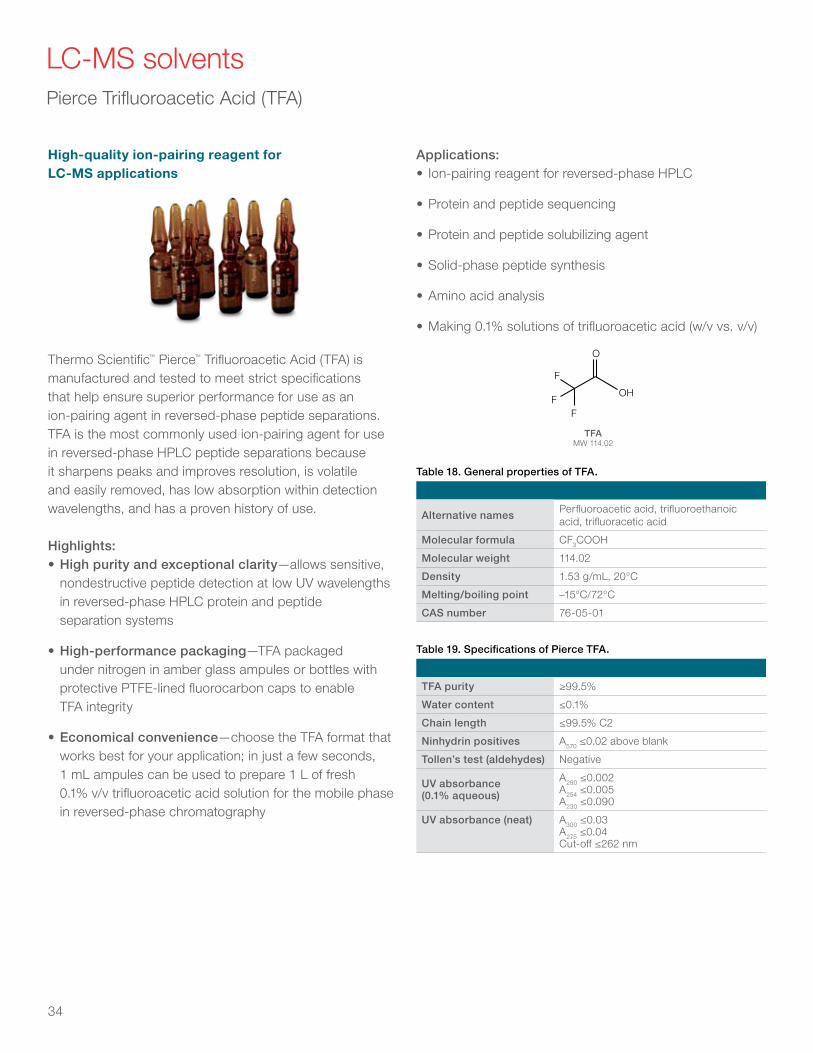
34
LC-MS solvents Pierce Trifluoroacetic Acid (TFA)
Thermo Scientific™ Pierce™ Trifluoroacetic Acid (TFA) is manufactured and tested to meet strict specifications that help ensure superior performance for use as an ion-pairing agent in reversed-phase peptide separations. TFA is the most commonly used ion-pairing agent for use in reversed-phase HPLC peptide separations because it sharpens peaks and improves resolution, is volatile and easily removed, has low absorption within detection wavelengths, and has a proven history of use.
Highlights:• High purity and exceptional clarity—allows sensitive,
nondestructive peptide detection at low UV wavelengths in reversed-phase HPLC protein and peptide separation systems
• High-performance packaging—TFA packaged under nitrogen in amber glass ampules or bottles with protective PTFE-lined fluorocarbon caps to enable TFA integrity
• Economical convenience—choose the TFA format that works best for your application; in just a few seconds, 1 mL ampules can be used to prepare 1 L of fresh 0.1% v/v trifluoroacetic acid solution for the mobile phase in reversed-phase chromatography
High-quality ion-pairing reagent for LC-MS applications
Applications:• Ion-pairing reagent for reversed-phase HPLC
• Protein and peptide sequencing
• Protein and peptide solubilizing agent
• Solid-phase peptide synthesis
• Amino acid analysis
• Making 0.1% solutions of trifluoroacetic acid (w/v vs. v/v)
O
F
FF
OH
TFAMW 114.02
Table 18. General properties of TFA.
Alternative names Perfluoroacetic acid, trifluoroethanoic acid, trifluoracetic acid
Molecular formula CF3COOH
Molecular weight 114.02
Density 1.53 g/mL, 20°C
Melting/boiling point –15°C/72°C
CAS number 76-05-01
Table 19. Specifications of Pierce TFA.
TFA purity ≥99.5%
Water content ≤0.1%
Chain length ≤99.5% C2
Ninhydrin positives A570 ≤0.02 above blank
Tollen’s test (aldehydes) Negative
UV absorbance (0.1% aqueous)
A280 ≤0.002 A254 ≤0.005 A230 ≤0.090
UV absorbance (neat) A300 ≤0.03 A275 ≤0.04 Cut-off ≤262 nm
35
Pierce Formic Acid, LC-MS Grade
Thermo Scientific™ Pierce™ Formic Acid is a high-purity solvent supplied in bottles or ampules as a convenient, contamination-free alternative for preparing elution solvents for HPLC separations of protein and peptides.
Pierce Formic Acid is sealed in amber glass ampules under a dry nitrogen atmosphere. A premeasured aliquot of acid greatly simplifies preparation of liter quantities of mobile phases at the standard 0.1% formic acid concentration. The quality of this formic acid, coupled with either glass-ampule or bottle packaging, provides reliability and convenience that adds value to both the chromatographic and MS results.
Highlights:• >99% pure formic acid—consistent LC baselines, with
less signal suppression of peptide in LC-MS applications
• High-performance packaging—choose bottles or amber glass, prescored, nitrogen-flushed ampules to protect formic acid from light, moisture, and contamination
• Convenient format—ampule packaging simplifies the preparation of gradient and isocratic mobile phases containing 0.1% (v/v) formic acid in water or acetonitrile; the contents of a single vial in a final volume of 1 L of solvent yields a mobile phase of the most common formic acid concentration
High-quality reagent for LC-MS applications Formic acid is a common component of reversed-phase mobile phases that provide protons for LC-MS analysis. The presence of a low concentration of formic acid in the mobile phase is also known to improve the peak shapes of the resulting separation. Unlike TFA, formic acid is not an ion-pairing reagent, and it does not suppress MS ionization of polypeptides when used as a mobile-phase component.
O
OHH
Formic acidMW 46.025
Table 20. General properties of formic acid.
Molecular formula HCOOH (CH2O2)
Molecular weight 46.025
Density 1.22 g/mL
CAS number 64-18-6
Refractive index 1.3701–1.3721 (20ºC)
Flash point 69ºC
Freezing point 8ºC
Table 21. Specifications of Pierce Formic Acid.
Visual Clear liquid, free of particulate matter
Identity (IR) Must show only peaks characteristic for the compound
Purity >99%
Refractive index 1.3701–1.3721 (20°C, 589 nm)
36
Pierce Acetonitrile, LC-MS Grade Pierce Water, LC-MS Grade
Thermo Scientific™ Pierce™ Water is an ultrapure, LC-MS grade preparation with low UV absorptivity that makes it suitable and trustworthy for use in HPLC and MS applications.
Pierce LC-MS Grade Water is specially purified by a proprietary method and tested to help ensure lot-to-lot consistency with low UV absorbance, to provide the most sensitive detection across all wavelengths. Pierce Water is 0.2 µm–filtered, packaged in solvent-rinsed amber glass bottles, and sealed under a nitrogen atmosphere with TFE-lined fluorocarbon caps for ultimate protection.
Highlights:• Verified—30 tests assure purity and quality for use in
LC-MS applications
• High-performance packaging—0.2 µm–filtered, packed in solvent-rinsed amber glass bottles, and sealed under nitrogen atmosphere to eliminate absorption of unknown atmospheric gases
• High purity—helps ensure high lot-to-lot consistency and reliability
High-quality formulation for LC-MS applications Ultrapure water for formulation of solvents for LC-MS
N C CH3
AcetonitrileMW 41.05
OHH
WaterMW 18.015
Find out more at thermofisher.com/ms-solvents
Thermo Scientific™ Pierce™ Acetonitrile (ACN) is an LC-MS grade solvent with high purity and low UV absorptivity that makes it suitable for HPLC and MS applications.
Pierce LC-MS Grade Acetonitrile is specially purified by a proprietary method and tested to help ensure lot-to-lot consistency with low UV absorbance, to provide the most sensitive detection across all wavelengths. Pierce Acetonitrile is 0.2 µm–filtered, packaged in solvent-rinsed amber glass bottles, and sealed under a nitrogen atmosphere with PTFE-lined fluorocarbon caps for ultimate protection.
Highlights:• Verified—37 quality tests enable low, stable baselines
and lot-to-lot consistency
• Sensitive—low UV absorbance yields low baselines and high detection sensitivity
• Purified—low impurity protects columns and simplifies analysis by eliminating extraneous peaks
Pierce LC-MS Grade Acetonitrile is specially purified and tested to the highest specifications to help ensure the integrity of your data, to maximize sensitivity in your assay, and to prolong the life of your equipment. These specifications also meet ACS standards.
37
Ordering information
We can supply a variety of mass spec reagents for large-scale and custom applications.
Find out more at thermofisher.com/bulkorder
Product Quantity Cat. No.
Calibration solutions and standards
Pierce Peptide Retention Time Calibration Mixture50 µL 88320
200 µL 88321
Pierce LTQ ESI Positive Ion Calibration Solution 10 mL 88322
Pierce LTQ Velos ESI Positive Ion Calibration Solution 10 mL 88323
Pierce ESI Negative Ion Calibration Solution 10 mL 88324
Pierce Triple Quadrupole Calibration Solution 10 mL 88325
Pierce Triple Quadrupole Calibration Solution, Extended Mass Range 10 mL 88340
Pierce Reserpine Standard for LC-MS 5 x 1 mL 88326
Pierce HeLa Protein Digest Standard20 µg 88328
5 x 20 µg 88329
Pierce BSA Protein Digest Standard, LC-MS Grade 1 nmol 88341
Pierce 6 Protein Digest Standard, Equimolar, LC-MS Grade 100 pmol 88342
Pierce Digestion Indicator for Mass Spectrometry 10 µg 84841
Pierce Intact Protein Standard Mix1 x 76 μg A33526
5 x 76 μg A33527
Protein quantitation reagents—SILAC
Pierce SILAC Protein Quantitation Kit (Lys-C)—RPMI 1640 1 kit A33971
Pierce SILAC Protein Quantitation Kit (Lys-C)—DMEM 1 kit A33969
Pierce SILAC Protein Quantitation Kit (Lys-C)—DMEM/F-12 1 kit A33970
L-Arginine-HCl 50 mg 89989
500 mg 88427
13C6 L-Arginine-HCl50 mg 88210
500 mg 88433
13C6 15N4 L-Arginine-HCl
50 mg 89990
500 mg 88434
L-Lysine-2HCl50 mg 89987
500 mg 88429
13C6 L-Lysine-2HCl50 mg 89988
500 mg 88431
13C6 15N2 L-Lysine-2HCl
50 mg 88209
500 mg 88432
L-Lysine-2HCl (4,4,5,5-D4)50 mg 88437
500 mg 88438
NeuCode Lysine-080 (3,3,4,4,5,5,6,6-D8 L-Lysine-2HCl)
25 mg A36750
50 mg A33613
500 mg A33614
NeuCode Lysine-440 (L-Lysine: 2HCl (3,4,5,6-13C4, 5,5,6,6-D4, 98%) 25 mg A36752
Product Quantity Cat. No.
Protein quantitation reagents—SILAC (continued)
NeuCode Lysine-521 (L-Lysine-2HCl) 25 mg A36753
NeuCode Lysine-341 (13C3
2H4 15N1 L-Lysine-2HCl) 25 mg A36851
NeuCode Lysine-202 (13C2 15N2 L-Lysine-2HCl) 25 mg A36754
NeuCode 4-Plex Lysine Bundle (NeuCode Lysine-080, NeuCode Lysine-602, NeuCode Lysine-440, NeuCode Lysine-521)
1 bundle A36755
L-Leucine 500 mg 88428
13C6 L-Leucine50 mg 88435
500 mg 88436
L-Proline115 mg 88211
500 mg 88430
RPMI Medium for SILAC500 mL 88365
6 x 500 mL A33823
Powdered RPMI Medium for SILAC, sufficient to prepare 10 L of medium 104 g 88426
DMEM Medium for SILAC500 mL 88364
6 x 500 mL A33822
Powdered DMEM Medium for SILAC 135 g 88425
DMEM/F-12 (1:1) Medium for SILAC 500 mL 88370
MEM for SILAC 500 mL 88368
IMDM for SILAC 500 mL 88367
Protein quantitation reagents— amine-reactive tandem mass tag reagents
TMT10plex Isobaric Label Reagent Set plus TMT11-131C Label Reagent 1 x 5 mg/tag A34808
TMT11-131C Label Reagent 1 x 5 mg A34807
TMT10plex Isobaric Label Reagent Set10 reactions 90110
30 reactions 90111
TMT10plex Isobaric Mass Tag Labeling Kit 30 reactions 90113
TMT10plex Isobaric Label Reagent Set60 reactions 90406
80 reactions 90309
TMTsixplex Isobaric Label Reagent Set6 reactions 90061
12 reactions 90062
TMTsixplex Isobaric Mass Tagging Kit 35 reactions 90064
TMTsixplex Isobaric Label Reagent Set
30 reactions 90066
72 reactions 90068
96 reactions 90308
TMTduplex Isobaric Mass Tagging Kit 15 reactions 90063
TMTduplex Isobaric Label Reagent Set10 reactions 90065
10 reactions 90060
TMTzero Label Reagent 5 x 0.8 mg 90067
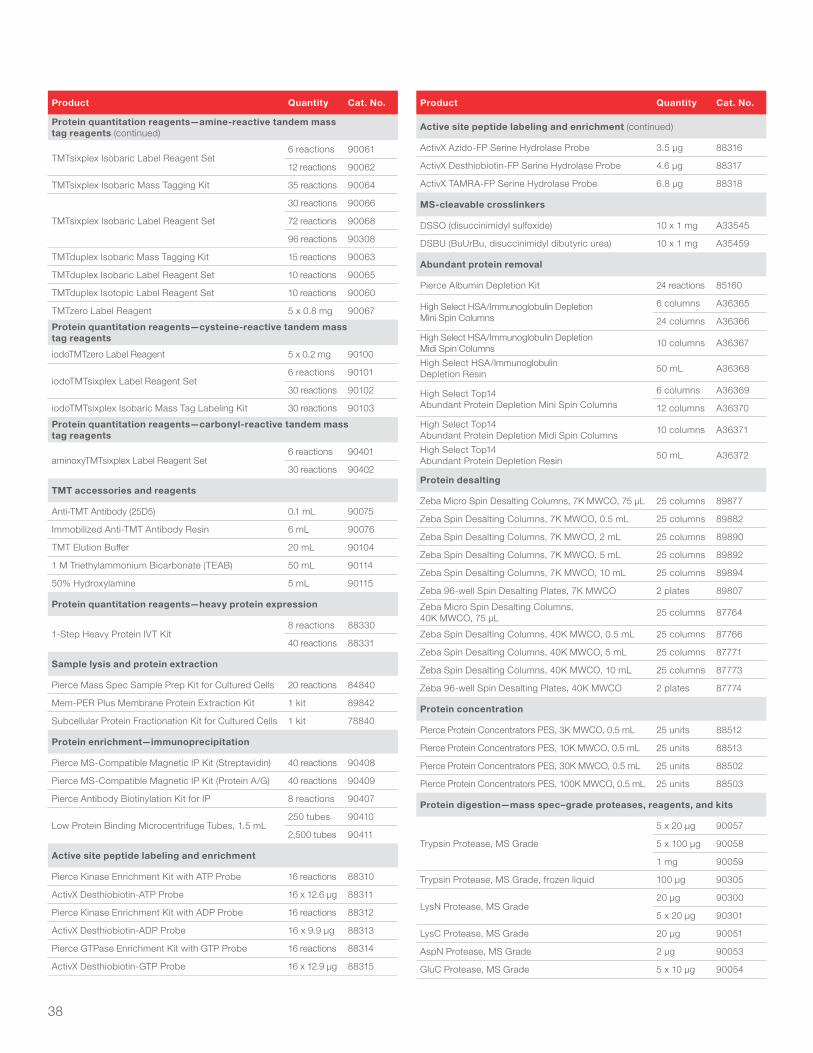
38
Product Quantity Cat. No.
Protein quantitation reagents—amine-reactive tandem mass tag reagents (continued)
TMTsixplex Isobaric Label Reagent Set6 reactions 90061
12 reactions 90062
TMTsixplex Isobaric Mass Tagging Kit 35 reactions 90064
TMTsixplex Isobaric Label Reagent Set
30 reactions 90066
72 reactions 90068
96 reactions 90308
TMTduplex Isobaric Mass Tagging Kit 15 reactions 90063
TMTduplex Isobaric Label Reagent Set 10 reactions 90065
TMTduplex Isotopic Label Reagent Set 10 reactions 90060
TMTzero Label Reagent 5 x 0.8 mg 90067
Protein quantitation reagents—cysteine-reactive tandem mass tag reagents
iodoTMTzero Label Reagent 5 x 0.2 mg 90100
iodoTMTsixplex Label Reagent Set6 reactions 90101
30 reactions 90102
iodoTMTsixplex Isobaric Mass Tag Labeling Kit 30 reactions 90103
Protein quantitation reagents—carbonyl-reactive tandem mass tag reagents
aminoxyTMTsixplex Label Reagent Set6 reactions 90401
30 reactions 90402
TMT accessories and reagents
Anti-TMT Antibody (25D5) 0.1 mL 90075
Immobilized Anti-TMT Antibody Resin 6 mL 90076
TMT Elution Buffer 20 mL 90104
1 M Triethylammonium Bicarbonate (TEAB) 50 mL 90114
50% Hydroxylamine 5 mL 90115
Protein quantitation reagents—heavy protein expression
1-Step Heavy Protein IVT Kit8 reactions 88330
40 reactions 88331
Sample lysis and protein extraction
Pierce Mass Spec Sample Prep Kit for Cultured Cells 20 reactions 84840
Mem-PER Plus Membrane Protein Extraction Kit 1 kit 89842
Subcellular Protein Fractionation Kit for Cultured Cells 1 kit 78840
Protein enrichment—immunoprecipitation
Pierce MS-Compatible Magnetic IP Kit (Streptavidin) 40 reactions 90408
Pierce MS-Compatible Magnetic IP Kit (Protein A/G) 40 reactions 90409
Pierce Antibody Biotinylation Kit for IP 8 reactions 90407
Low Protein Binding Microcentrifuge Tubes, 1.5 mL250 tubes 90410
2,500 tubes 90411
Active site peptide labeling and enrichment
Pierce Kinase Enrichment Kit with ATP Probe 16 reactions 88310
ActivX Desthiobiotin-ATP Probe 16 x 12.6 µg 88311
Pierce Kinase Enrichment Kit with ADP Probe 16 reactions 88312
ActivX Desthiobiotin-ADP Probe 16 x 9.9 µg 88313
Pierce GTPase Enrichment Kit with GTP Probe 16 reactions 88314
ActivX Desthiobiotin-GTP Probe 16 x 12.9 µg 88315
Product Quantity Cat. No.
Active site peptide labeling and enrichment (continued)
ActivX Azido-FP Serine Hydrolase Probe 3.5 µg 88316
ActivX Desthiobiotin-FP Serine Hydrolase Probe 4.6 µg 88317
ActivX TAMRA-FP Serine Hydrolase Probe 6.8 µg 88318
MS-cleavable crosslinkers
DSSO (disuccinimidyl sulfoxide) 10 x 1 mg A33545
DSBU (BuUrBu, disuccinimidyl dibutyric urea) 10 x 1 mg A35459
Abundant protein removal
Pierce Albumin Depletion Kit 24 reactions 85160
High Select HSA/Immunoglobulin Depletion Mini Spin Columns
6 columns A36365
24 columns A36366
High Select HSA/Immunoglobulin Depletion Midi Spin Columns 10 columns A36367
High Select HSA/Immunoglobulin Depletion Resin 50 mL A36368
High Select Top14 Abundant Protein Depletion Mini Spin Columns
6 columns A36369
12 columns A36370
High Select Top14 Abundant Protein Depletion Midi Spin Columns 10 columns A36371
High Select Top14 Abundant Protein Depletion Resin 50 mL A36372
Protein desalting
Zeba Micro Spin Desalting Columns, 7K MWCO, 75 µL 25 columns 89877
Zeba Spin Desalting Columns, 7K MWCO, 0.5 mL 25 columns 89882
Zeba Spin Desalting Columns, 7K MWCO, 2 mL 25 columns 89890
Zeba Spin Desalting Columns, 7K MWCO, 5 mL 25 columns 89892
Zeba Spin Desalting Columns, 7K MWCO, 10 mL 25 columns 89894
Zeba 96-well Spin Desalting Plates, 7K MWCO 2 plates 89807
Zeba Micro Spin Desalting Columns, 40K MWCO, 75 µL 25 columns 87764
Zeba Spin Desalting Columns, 40K MWCO, 0.5 mL 25 columns 87766
Zeba Spin Desalting Columns, 40K MWCO, 5 mL 25 columns 87771
Zeba Spin Desalting Columns, 40K MWCO, 10 mL 25 columns 87773
Zeba 96-well Spin Desalting Plates, 40K MWCO 2 plates 87774
Protein concentration
Pierce Protein Concentrators PES, 3K MWCO, 0.5 mL 25 units 88512
Pierce Protein Concentrators PES, 10K MWCO, 0.5 mL 25 units 88513
Pierce Protein Concentrators PES, 30K MWCO, 0.5 mL 25 units 88502
Pierce Protein Concentrators PES, 100K MWCO, 0.5 mL 25 units 88503
Protein digestion—mass spec–grade proteases, reagents, and kits
Trypsin Protease, MS Grade
5 x 20 µg 90057
5 x 100 µg 90058
1 mg 90059
Trypsin Protease, MS Grade, frozen liquid 100 µg 90305
LysN Protease, MS Grade20 µg 90300
5 x 20 µg 90301
LysC Protease, MS Grade 20 µg 90051
AspN Protease, MS Grade 2 µg 90053
GluC Protease, MS Grade 5 x 10 µg 90054
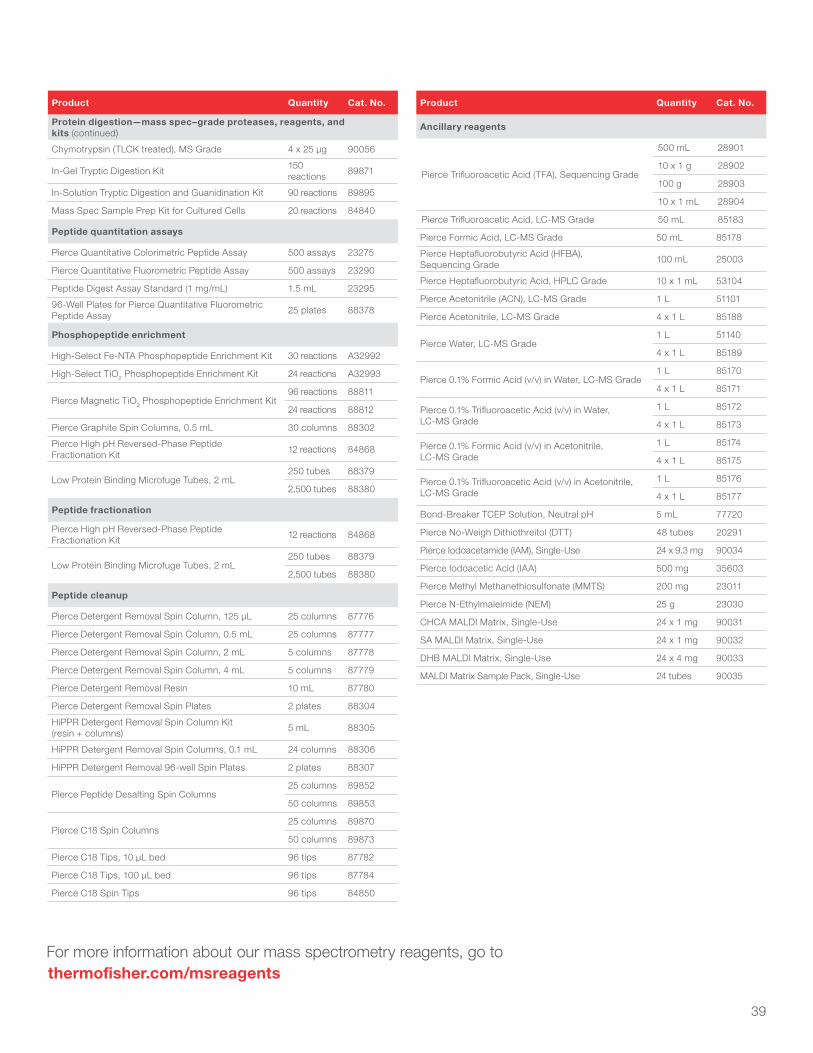
39
Product Quantity Cat. No.
Protein digestion—mass spec–grade proteases, reagents, and kits (continued)
Chymotrypsin (TLCK treated), MS Grade 4 x 25 µg 90056
In-Gel Tryptic Digestion Kit 150 reactions 89871
In-Solution Tryptic Digestion and Guanidination Kit 90 reactions 89895
Mass Spec Sample Prep Kit for Cultured Cells 20 reactions 84840
Peptide quantitation assays
Pierce Quantitative Colorimetric Peptide Assay 500 assays 23275
Pierce Quantitative Fluorometric Peptide Assay 500 assays 23290
Peptide Digest Assay Standard (1 mg/mL) 1.5 mL 23295
96-Well Plates for Pierce Quantitative Fluorometric Peptide Assay 25 plates 88378
Phosphopeptide enrichment
High-Select Fe-NTA Phosphopeptide Enrichment Kit 30 reactions A32992
High-Select TiO2 Phosphopeptide Enrichment Kit 24 reactions A32993
Pierce Magnetic TiO2 Phosphopeptide Enrichment Kit96 reactions 88811
24 reactions 88812
Pierce Graphite Spin Columns, 0.5 mL 30 columns 88302
Pierce High pH Reversed-Phase Peptide Fractionation Kit 12 reactions 84868
Low Protein Binding Microfuge Tubes, 2 mL 250 tubes 88379
2,500 tubes 88380
Peptide fractionation
Pierce High pH Reversed-Phase Peptide Fractionation Kit 12 reactions 84868
Low Protein Binding Microfuge Tubes, 2 mL 250 tubes 88379
2,500 tubes 88380
Peptide cleanup
Pierce Detergent Removal Spin Column, 125 µL 25 columns 87776
Pierce Detergent Removal Spin Column, 0.5 mL 25 columns 87777
Pierce Detergent Removal Spin Column, 2 mL 5 columns 87778
Pierce Detergent Removal Spin Column, 4 mL 5 columns 87779
Pierce Detergent Removal Resin 10 mL 87780
Pierce Detergent Removal Spin Plates 2 plates 88304
HiPPR Detergent Removal Spin Column Kit (resin + columns) 5 mL 88305
HiPPR Detergent Removal Spin Columns, 0.1 mL 24 columns 88306
HiPPR Detergent Removal 96-well Spin Plates 2 plates 88307
Pierce Peptide Desalting Spin Columns25 columns 89852
50 columns 89853
Pierce C18 Spin Columns25 columns 89870
50 columns 89873
Pierce C18 Tips, 10 µL bed 96 tips 87782
Pierce C18 Tips, 100 µL bed 96 tips 87784
Pierce C18 Spin Tips 96 tips 84850
Product Quantity Cat. No.
Ancillary reagents
Pierce Trifluoroacetic Acid (TFA), Sequencing Grade
500 mL 28901
10 x 1 g 28902
100 g 28903
10 x 1 mL 28904
Pierce Trifluoroacetic Acid, LC-MS Grade 50 mL 85183
Pierce Formic Acid, LC-MS Grade 50 mL 85178
Pierce Heptafluorobutyric Acid (HFBA), Sequencing Grade 100 mL 25003
Pierce Heptafluorobutyric Acid, HPLC Grade 10 x 1 mL 53104
Pierce Acetonitrile (ACN), LC-MS Grade 1 L 51101
Pierce Acetonitrile, LC-MS Grade 4 x 1 L 85188
Pierce Water, LC-MS Grade1 L 51140
4 x 1 L 85189
Pierce 0.1% Formic Acid (v/v) in Water, LC-MS Grade1 L 85170
4 x 1 L 85171
Pierce 0.1% Trifluoroacetic Acid (v/v) in Water, LC-MS Grade
1 L 85172
4 x 1 L 85173
Pierce 0.1% Formic Acid (v/v) in Acetonitrile, LC-MS Grade
1 L 85174
4 x 1 L 85175
Pierce 0.1% Trifluoroacetic Acid (v/v) in Acetonitrile, LC-MS Grade
1 L 85176
4 x 1 L 85177
Bond-Breaker TCEP Solution, Neutral pH 5 mL 77720
Pierce No-Weigh Dithiothreitol (DTT) 48 tubes 20291
Pierce Iodoacetamide (IAM), Single-Use 24 x 9.3 mg 90034
Pierce Iodoacetic Acid (IAA) 500 mg 35603
Pierce Methyl Methanethiosulfonate (MMTS) 200 mg 23011
Pierce N-Ethylmaleimide (NEM) 25 g 23030
CHCA MALDI Matrix, Single-Use 24 x 1 mg 90031
SA MALDI Matrix, Single-Use 24 x 1 mg 90032
DHB MALDI Matrix, Single-Use 24 x 4 mg 90033
MALDI Matrix Sample Pack, Single-Use 24 tubes 90035
For more information about our mass spectrometry reagents, go to thermofisher.com/msreagents

Find out more at thermofisher.com/msreagentsFor Research Use Only. Not for use in diagnostic procedures. © 2018 Thermo Fisher Scientific Inc. All rights reserved. All trademarks are the property of Thermo Fisher Scientific and its subsidiaries unless otherwise specified. AssayMax is a trademark of Assaypro LLC. Brij is a trademark of Uniqema Americas. TMTzero, TMTduplex, TMTsixplex, TMT10plex, and TMT11plex are trademarks of Proteome Sciences. Tandem Mass Tag is a trademark of Electrophoretics Limited. NeuCode is a trademark of WARF. UniProt is a trademark of the European Molecular Biology Laboratory. Mascot is a trademark of Matrix Science. ProteoExtract is a trademark of Merck KGAA. Swiss-Prot is a trademark of the Swiss Institute of Bioinformatics. Preview is a trademark of Protein Metrics. Promega is a trademark of Promega Corporation. COL32447 0718
Protein sample preparation and quantitation for mass spectrometryReagents, consumables, instrumentation, and software for proteomics research
Mass spectrometry digital resources
Mass spec rewards program
Save up to 40% on a single order through the Thermo Scientific™ Mass Spec Rewards Program.* Save even more if you purchase one or more Thermo Scientific™ mass spectrometers in 2018. Learn more on how to make a purchase through this program, obtain a list of eligible products, or register to be contacted by your sales representative.
Find out more at thermofisher.com/msrewards
Download the free Thermo Scientific™ Protein Sample Preparation and Quantitation for Mass Spectrometry Handbook and other relevant literature to learn more about tools and techniques for more robust and reproducible outcomes. Access helpful white papers and late-breaking posters for specific applications like subcellular fractionation, peptide fractionation, isobaric labeling, and more. Increase your knowledge of sample preparation and protein quantitation through our free, on-demand webinars.
Register now at thermofisher.com/msresources
* Discount will apply to qualifying orders received by Life Technologies no later than December 31, 2018. Customer can use the discount only once. Discount only applies to a maximum of 1 order per customer. Discount applies to the list price in effect at the time the order is received by Life Technologies. Cannot be combined with other discounts or promotions. Offer void where prohibited, licensed, or restricted by federal, state, provincial, or local laws or regulation or agency/institutional policy. Other restrictions may apply.


![Motor unit MTR-DCI€¦ · Description MTR-DCI-...IO Description 539616 en 1209d [763197] Motor unit MTR-DCI](https://img.pdfslide.us/doc/110x75/5f50cafd0ff31e4afa1c4f9b/motor-unit-mtr-dci-description-mtr-dci-io-description-539616-en-1209d-763197.jpg)