Embed Size (px)
Citation preview
Eur J Appl Physiol (1994) 69:550-556
"°"" A p p l i e d Joumal of
P h y s i o l o g y
Y-intercept of the maximal work-duration relationship and anaerobic capacity in cyclists
and Occupational Physiology © Springer-Verlag 1994
S. Green 1, B. T. Dawson 2, C. Goodman 2, M. F. Carey 3
i School of Human Movement Studies, Queensland University of Technology, Kelvin Grove Campus, Brisbane, Queensland 4059, Australia
2 Exercise Physiology Laboratory, Department of Human Movement, University of Western Australia, Perth, Western Australia, 6009
3 Department of Chemistry and Biology, Exercise Metabolism Unit, Victoria University of Technology, Melbourne, Victoria, 3011, Australia
Accepted: 12 July 1994
Abstract. The degree to which the y-intercept (Y-int) of the linear regression of maximal work output on ex- ercise duration represented anaerobic capacity was de- termined in ten well-trained male cyclists [peak oxygen uptake (VO2peak)=69.8 (SD 4.2) ml.kg-~.min-~] . Each cyclist performed three exhausting cycle sessions on separate occasions; the mean exercise durations were 312, 243 and 141 s for the low (approximately 104% VO2peak), medium (approximately 108% ITO2peak) and high (approximately 113% I?O2peak) in- tensities respectively, and Y-int (kilojoules; joules per kilogram) was derived from the regression of work output on exercise duration. The muscle anaerobic ad- enosine 5'-triphosphate (ATP) yield (NATP) and anaerobic capacity (AC) were estimated from changes in metabolites in the vastus lateralis muscle and blood lactate concentration during the high intensity cycling session. The activities of glycogen phosphorylase, phosphofructokinase and citrate synthase, as well as muscle buffer value (in vitro/3) were also determined. The Y-int (kilojoules) was positively correlated (P_0.05) with AC (r=0.73), ]~ATP (r=0.70) and in vitro /3 (r=0.71); similar correlations (P_<0.05) were observed for Y-int (joules per kilogram). The Y-int was not correlated (P>0.05) with any enzyme activity. When the Y-Jut was transformed into oxygen equival- ents [litres of oxygen equivalent (1 02 Eq)] it was, on average, 0.92 1 02 Eq lower than AC (P_< 0.05); howev- er, an alternative method of establishing the work-du- ration regression yielded a mean Y-int which was only 0.19 1 O2 Eq less than AC (P~0.05). These findings support the validity of Y-Jut as a work estimate of anaerobic capacity in well-trained cyclists.
Key words: Muscle - Metabolism - Enzymes - Buffer value
Correspondence to." S. Green
Introduction
It has been suggested that the validity of various tests purported to measure anaerobic capacity (AC) is un- clear (Green and Dawson 1993; Saltin 1990) and, as yet, there does not exist a universal test of AC. In con- trast to tests which attempt to quantify AC (e.g. accu- mulated oxygen deficit), the measurement of maximal work output which is used to reflect AC, or measure anaerobic work capacity (Green and Dawson 1993), is relatively simple and inexpensive. The slope and y-in- tercept of the maximal work-duration regression, origi- nally described by Scherrer et al. (1954), have been purported to represent an aerobic and anaerobic pa- rameter, respectively (Monod and Scherrer 1965; Whipp et al. 1982). This regression is written W ~ = a + b- T~m, where Wnm is maximal work output is T~im is duration, the slope b has the dimension of pow- er (termed critical power, CP) which, as orginally sug- gested (Monod and Scherrer 1965), is aerobic in nature and represents an endurance capacity, whereas para- meter a (the y-intercept) has the dimension of energy and has been thought to represent an anaerobic energy store (Monod and Scherrer 1965) or AC (Whippet al. 1982).
That CP is a measure of endurance capacity in ath- letes has been supported by more recent findings which have demonstrated that it was both positively correlated with the individual anaerobic threshold in a sample (in part) composed of cyclists (McLellan and Cheung 1992) and increased by endurance training (Gaesser and Wilson 1988; Poole et al. 1990). Howev- er, there is less evidence supporting the validity of the y-intercept (Y-int) to 'represent' AC in athletes. Al- though Jenkins and Quigley (1991, 1993) have demon- strated that Y-int of previously untrained subjects was both increased by sprint training and highly correlated with repeated sprinting ability, the concurrent validity of this measure in populations of athletes is not known.
An experimental design used to examine the con- current validity of a laboratory measure, that is Y-int,
551
involves relat ing it to a cr i ter ion est imate (T homas and Nelson 1985). A l t h o u g h demons t ra t ing that a test measure of A C is quant i ta t ively similar to a cri terion est imate is an impor t an t step in establishing its validity (Withers et al. 1991), a valid test of A C must also be able to discr iminate be tween individuals (e.g. athletes) possessing different A C ; this m a y be tes ted by examin- ing the associat ion be tween the test scores and criteri- on est imates within the sample. De te rmin ing a level of associat ion be tween Y-int and the cr i ter ion est imate cons idered acceptable mus t account for potent ia l sources of e r ror in bo th variables which m a y reduce it. In humans , measur ing a cr i ter ion est imate of A C is dif- ficult: A C can only, at best, be de t e rmined by est imat- ing the total accumula t ion or degrada t ion of metabo l - ites associated with anaerob ic adenos ine 5 ' - t r i phos - pha te ( A T P ) resynthesis by sampling f r o m representa- tive muscular and vascular sites. This m e t h o d m a y be associated with cons iderable (but u n k n o w n ) e r ro r (see M e t h o d and Discuss ion for m o r e detail); it is, however , the only direct m e t h o d of es t imat ing A C in humans. The m e a s u r e m e n t of Y-int in well- t rained athletes (used to satisfy concerns of external validity) who are regular ly engaged in t raining m a y also be associated with error. There fo re , the results o f a s tudy employ ing the a f o r e m e n t i o n e d design and using well- t rained ath- letes should be in te rpre ted within the context out l ined above.
In this study, the hypothes is tha t Y-int is a valid w o r k es t imate of A C in well- t rained cyclists was tested by establishing the relat ionship be tween Y-int and bo th A C , as es t imated f r o m exercise- induced changes in muscle and b lood metabol i tes , and anaerob ic po ten- tial as r ep resen ted by key anaerob ic enzyme activities and muscle buffer values.
M e t h o d s
Subjects. Ten well-trained male cyclists [mean age, 26 (SD 9) range 15M7 years; mean height, 1.83 (SD 0.01) range 1.76-1.89 m; mean mass 74.5 (SD 7.5) range 59.6-85.9 kg] volunteered as subjects and signed informed consent. The experimental proce- dures were approved by the Human Rights Committee of the University of Western Australia.
Experimental procedures. All cycle tests were performed on a modified Monark (model 814) cycle ergometer which was cleaned and calibrated prior to each test day. Oxygen consump- tion (1702) and respiratory exchange ratio (R: CO2 production/ 1202) were determined using an on-line system which consisted of a Morgan ventilometer and Applied Electrochemistry O2 (model S-3A/1) and CO2 (model CD-3A) gas analysers. The gas analysis equipment was calibrated immediately before and fol- lowing each test session using standard gases of known concen- trations. Each cycle test was performed 1 week apart and, in the case of the three supra-peak VO2 (VO2pe,k) sessions, ordered randomly. The cyclists were familiarised with the equipment on two previous occasions and were asked to refrain from vigorous physical activity and the consumption of food 24 and 3 h prior to the tests, respectively.
Aerobic variables. The lactate threshold (LT) was determined as follows: each subject initially cycled at approximately 44 W at 90 rpm for 4 min; thereafter, maintaining a cadence of 90 rpm, the
power output was increased approximately 44 W each 4 rain over 6 to 9 power outputs (i.e. mean=23%-91% ~ O 2 p e a k ) , Capillary blood samples were taken from an hyperaemised earlobe during the 4th min at each power output. The LT was defined as the power output corresponding to a blood lactate concentration 1 retool.1-1 greater than an individual baseline value which, in turn, was derived from blood lactate concentrations elicited over the initial 4-6 power outputs (Coyle et al. 1991). In addition, 1202 measured during rain 3M of each power output (excluding meas- urements at 44 W) was averaged and used to determine the sub- maximal 1202-power regression for each cyclist. At 10 min fol- lowing the end of the LT test each cyclist performed an incre- mental test (approximately 22 W.min-~), beginning at a power output approximately 132 W less than the final power output completed during the LT test, to exhaustion for the determina- tion of VO2p~k; exhaustion was defined as a fall in cadence of equal to or greater than 3 rpm' during the final work period. Us- ing the VO2-power regression, the power output corresponding to peak VOz, which was always measured during the final 30-s period, was defined a s I ~ O 2 p e a k ( W ) ,
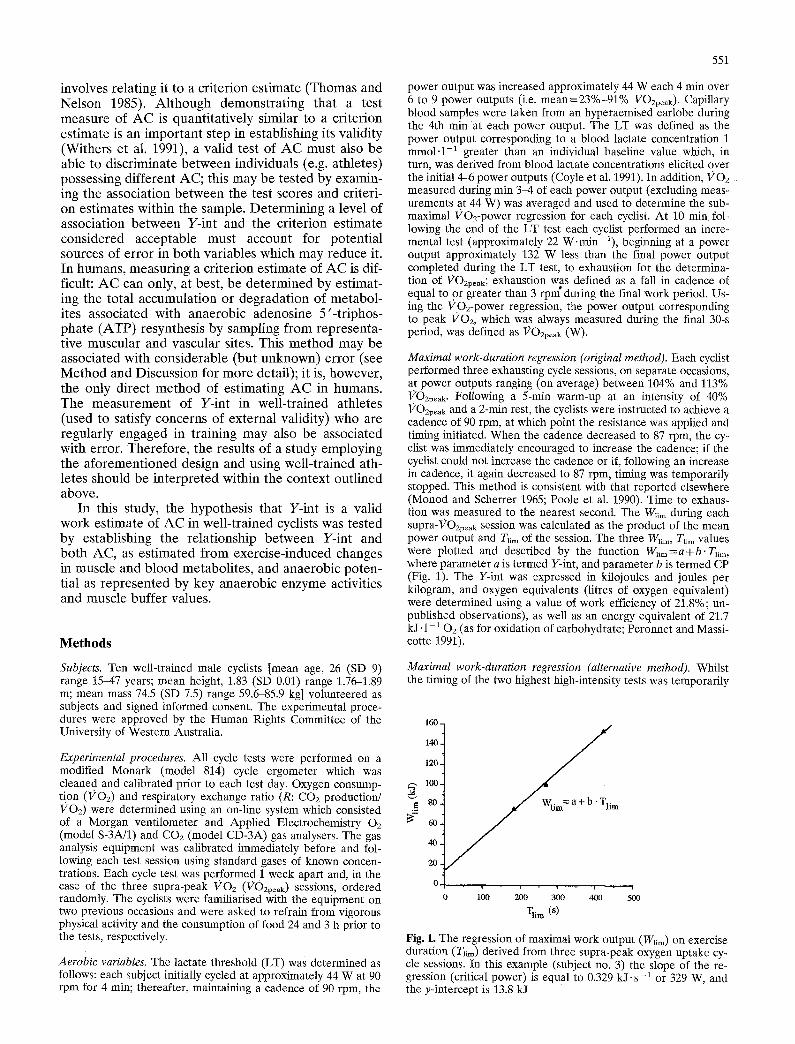
Maximal work-duration regression (original method). Each cyclist performed three exhausting cycle sessions, on separate occasions, at power outputs ranging (on average) between 104% and 113% VOzpe~k. Following a 5-rain warm-up at an intensity of 40% VOzpeak and a 2-min rest, the cyclists were instructed to achieve a cadence of 90 rpm, at which point the resistance was applied and timing initiated. When the cadence decreased to 87 rpm, the cy- clist was immediately encouraged to increase the cadence; if the cyclist could not increase the cadence or if, following an increase in cadence, it again decreased to 87 rpm, timing was temporarily stopped. This method is consistent with that reported elsewhere (Monod and Scherrer 1965; Poole et al. 1990). Time to exhaus- tion was measured to the nearest second. The W~m during each supra-VOzpeak session was calculated as the product of the mean power output and T~im of the session. The three W~m, T~im values were plotted and descrfbed by the function W~m=a+b" T~im, where parameter a is termed Y-int, and parameter b is termed CP (Fig. 1). The YAnt was expressed in kilojoules and joules per kilogram, and oxygen equivalents (litres of oxygen equivalent) were determined using a value of work efficiency of 21.8%; un- published observations), as well as an energy equivalent of 21.7 kJ. 1-1 02 (as for oxidation of carbohydrate; Peronnet and Massi- cotte 1991).
Maximal work-duration regression (alternative method). Whilst the timing of the two highest high-intensity tests was temporarily
1 6 0 .
1 4 0 .
1 2 0 .
1 0 0 .
8 0 -
~- 60.
4 0 .
2 0 .
0 .
0
i • i • i , i -
100 2 0 0 3 0 0 4 0 0
~rl~ (s)
i
5 0 0
Fig. 1. The regression of maximal work output (Wum) on exercise duration (Tiara) derived from three supra-peak oxygen uptake cy- cle sessions. In this example (subject no. 3) the slope of the re- gression (critical power) is equal to 0.329 kJ.s-1 or 329 W, and the y-intercept is 13.8 kJ
552
stopped when the cadence declined to 87 rpm (as described above), each cyclist was encouraged to continue cycling until the power output declined to ~)~O2pea k (W). The time which accumu- lated during this latter period of work was recorded (in addition to that recorded when determining the original work-duration re- gression) and the total work outputs during the three tests were determined as previously described to determine an alternative work-duration regression. Thus, the same work sessions were used to determine both the original and alternative work-dura- tion regressions, except that the additional work completed as each cyclist's cadence declined from 87 rpm to the cadence corre- sponding to ~,702pea k (W) was considered in the measurement of Wire during the cycling sessions at the two highest intensities (i.e. 108% and 113% VO2pe,k; see Results) for the alternative method. This alternative method was considered to maximise the anae- robic ATP yield during all three supra-I202p~ak sessions, whereas the original method failed to do so because two of the three tests were concluded when the power output was still greater than ~ffO2pea k (W). See Discussion for further rationale and results.
Muscle biochemistry. Muscle samples (mean wet mass = 47.6 rag) were taken from vastus lateralis muscle using a percutaneous biopsy needle adapted for suction. One muscle sample was taken at rest, immediately frozen in liquid nitrogen and stored at - 8 0 ° C. This sample was later analysed for the activities (micro- moles per minute per gram protein at 25 ° C) of glycogen phos- phorylase (PHOS), phosphofructokinase (PFK) and citrate syn- thase (CS) (Green et al. 1991). Muscle homogenate protein con- centration was determined using the method of Lowry et al. (1951).
Prior to, and immediately following the 113% gO2peak cycle session, a muscle sample was taken and immediately frozen in liquid nitrogen. The frozen muscle was weighed and split into two pieces. One piece was freeze-dried at - 40 ° C and 2 mmHg for 36 h, and then extracted according to methods described by Harris et al. (1974). The neutralised extracts were then frozen and stored at -70°C until analysed for ATP, adenosine 5'-diphos- phate (ADP), phosphocreatine (PCr), creatine (Cr) and lactate (la-) (Lowry and Passoneau 1972). The pre- or post-exercise muscle [ATP], [ADP] and [PCr] were corrected according to the highest total Cr content. Metabolite concentrations were ex- pressed as millimoles per kilogram dry mass. The other muscle piece (10-20 mg) was homogenised in a cocktail of 145 mmol.1-1 KC1, 10 retool.1-1 NaC1 and 5 mmo1.1 -~ iodo acetic acid, using a dilution ratio of 25 pA.mg wet mass-~, and analysed for pH and muscle (non-bicarbonate) buffer value (in vitro /3). Muscle pH was measured at 37°C using a 3 mm Titron pH electrode, and was taken as the average of pH measurements made at 45 s, 60 s, 75 s and 90 s following the insertion of the electrode into the ho- mogenate (Spriet at al. 1986). The muscle homogenate was stored for 24 h at 0M ° C and then analysed for in vitro/3: a 110-1,1 aliquot was adjusted to pH = 7.10 with 0.01 mol. 1 -1 sodium hydr- oxide and titrated to pH=6.10 with 0.01 tool-1-1 hydrochloric acid (HC1). The samples were sealed and vortexed at each step of the titration and stirred continuously during pH measurement. In vitro/3 was determined from titrations on two aliquots, and was defined as the amount of HC1 required to change the pH of the homogenate of 1 g of wet muscle by one pH unit (p~mol HC1. ApH- 1= 1 Slyke). Due to technical difficulties data on only nine subjects are presented for in vitro/3 and enzyme activities.
Blood analysis. In addition to blood samples collected during the LT test, blood samples were taken from an hyperaemised earlobe 5 min prior to and immediately after the 113% ~O2pea k test. All samples were analysed in duplicate for L-la- using an Analox (LM3) lactate analyser; the validity of this lactate analyser had been established by comparing plasma la- concentrations (0.5- 17 mmol.1-1) with those determined using a manual enzymatic method (r=0.97). Exercise blood lactate concentration ([la--]b) was calculated as the difference between the resting and postex- ercise la- concentration and expressed in millimoles per litre.
Calculations. The anaerobic ATP yield was calculated from the change in (A) muscle metabolites as follows:
Anaerobic A T P yield = = 1.5A[la-] + A[PCr] + (2A[ATP] - A[ADP]) (1)
To estimate the whole-body anaerobic ATP yield the follow- ing assumptions were made: 1. The total muscle mass engaged during exercise was 25% of body mass (Astrand et al. 1986; Withers et al. 1991); and 2. The metabolic changes which occurred in the biopsied sample were representative of those which occurred throughout the vas- tus lateralis muscle which, in turn, was representative of the me- tabolic changes which had occurred in other prime-moving mus- cles recruited during the 113% l?O2peak session.
To estimate metabolite changes in wet tissue the metabolite concentrations (dry mass) were normalized to the water content of resting muscle. In addition, the total amount of la- (milli- moles ATP) which had accumulated in the blood during the course of the 113% gO2peak test was estimated from [la-]b as- suming that the volume of whole blood approximates 75 ml. k g - 1 (Astrand and Rodahl 1977). The extent to which la- accumu- lated in inactive tissue compartments was not assessed, although this value, relative to total body la- accumulation, is likely to have been small. The sum of the muscle and whole blood ATP yields (millimoles ATP) was used to estimate AC.
Statistics. Linear regression or correlation analyses were used to determine the relationships between all variables. Paired stu- dent's t-tests were used to test for differences between selected variables. The level of significance was set at P-<0.05.
Results
Individual da ta and simple statistics on physical, physi- ological and metabol ic variables are given in Table 1. The m e a n for L T was 51.9 (SD 6.1) m l . k g - t . m i n -1, 259 (SD 47) W and 74 (SD 6) % 1202pe~k. D a t a on CP and Y-int are given in Table 1; in addit ion, CP was 4.65 (SD 0.56) W ' k g -1 and Y-int was 168 (SD 78) J - k g -1. W h e n expressed in oxygen equivalents Y-int was 2.69 (SD 1.41) 1 0 2 Eq. The m e a n r z value for the maximal work -du ra t i on re la t ionship was 0.9961; the S E E for CP and Y-int were 17.9 W and 4.16 kJ, respectively. M e a n dura t ions of the three exhaust ing cycle sessions were 141 (SD 22) s at 113% VO2peak, 243 (S.D 50) s at 108% Vo2peak and 312 (SD 67) s at 104% VO2peak.
The muscle metabol ic response to the high-intensi ty session is shown in Fig. 2. Res t ing [ATP] , [ADP] , [PCr] and [ l a - ] were 23.1 (SD 2.1), 1.58 (SD 0.21), 72.9 (SD 5.5) and 6.8 (SD 3.0) m m o l . k g -1 dry mass, respect ive- ly; the co r re spond ing postexercise values were 16.1 (SD 1.9), 1.83 (SD 0.25), 15.1 (SD 9.9) and 87.3 (SO 24.3) m m o l ' k g -~ dry mass. The muscle anae rob ic A T P yield, calculated accord ing to Eq. 1, was 203 (SD 47) m m o l . k g - 1 dry mass. The exercise- induced change in [ l a - ]b was 14.3 (SD 1.3) m m o l ' 1 - 1 . In accordance with the p rocedures descr ibed (see M e t h o d ) A C was calculated to be 1046 (SD 241) m m o l A T P ; individual da ta are r epo r t ed in Tab le 1. The A C (litres of 02 equivalent) was significantly h igher than Y-int (litres o f 02 equivalent) .
Corre la t ions be tween Y-int and muscle metabol ic variables are p resen ted in Table 2. The Y-int (kilo- joules; joules per k i logram) were also posi t ively corre- la ted ( P _ 0 . 0 5 ) with A A T P ( r=0 .67 ; r = 0 . 7 1 ) .
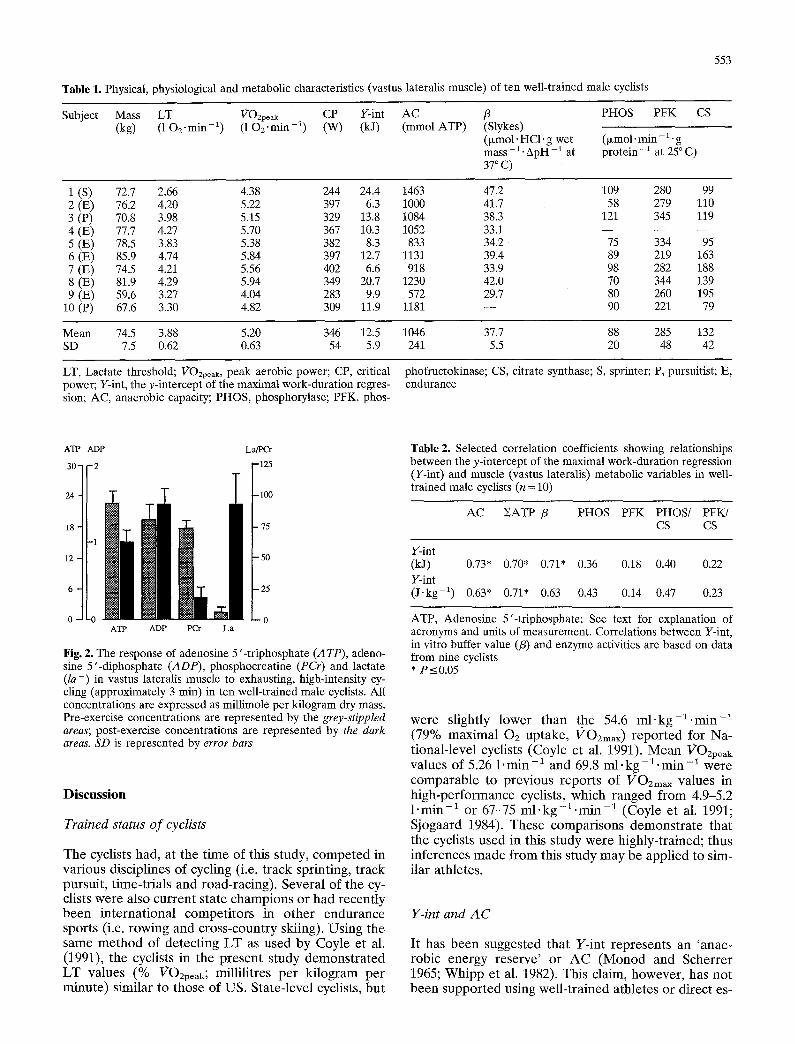
Table 1. Physical, physiological and metabolic characteristics (vastus lateralis muscle) of ten well-trained male cyclists
553
Subject Mass LT l)'O2peak CP Y-int AC /3 PHOS PFK CS (kg) (1 O2.min -1) (1 O2"min -1) (W) (kJ) (retool ATP) (Slykes)
(ixmol.HCl.g wet (ixmol.min-l-g mass-l.ApH -a at protein -~ at 25°C) 37 ° C)
1 (S) 72.7 2.66 4.38 244 24.4 1463 47.2 109 280 99 2 (E) 76.2 4.20 5.22 397 6.3 1000 41.7 58 279 110 3 (P) 70.8 3.98 5.15 329 13.8 1084 38.3 121 345 119 4 (E) 77.7 4.27 5.70 367 10.3 1052 33.1 - - - - - - 5 (E) 78.5 3.83 5.38 382 8.3 833 34.2' 75 334 95 6 (E) 85.9 4.74 5.84 397 12.7 1131 39.4 89 219 163 7 (E) 74.5 4.21 5.56 402 6.6 918 33.9 98 282 188 8 (E) 81.9 4.29 5.94 349 20.7 1230 42.0 70 344 139 9 (E) 59.6 3.27 4.04 283 9.9 572 29.7 80 260 195
10 (P) 67.6 3.30 4.82 309 11.9 1181 - - 90 221 79
Mean 74.5 3.88 5.20 346 12.5 1046 37.7 88 285 132 SD 7.5 0.62 0.63 54 5.9 241 5.5 20 48 42
LT, Lactate threshold; VOzpeak, peak aerobic power; CP, critical phofructokinase; CS, citrate synthase; S, sprinter; P, pursuitist; E, power; Y-int, the y-intercept of the maximal work-duration regres- endurance sion; AC, anaerobic capacity; PHOS, phosphorylase; PFK, phos-
ATP ADP La/PCr
30- -2 -125
24 -100
12 ' 50
6 - 25
O. .0 ~ - - 0 ATP ADP PCr La
Fig. 2. The response of adenosine 5'-triphosphate (14 TP), adeno- sine 5'-diphosphate (ADP), phosphocreatine (PCr) and lactate (la-) in vastus lateralis muscle to exhausting, high-intensity cy- cling (approximately 3 rain) in ten well-trained male cyclists. All concentrations are expressed as millimole per kilogram dry mass. Pre-exercise concentrations are represented by the grey-stippled areas; post-exercise concentrations are represented by the dark areas. SD is represented by error bars
Discussion
Trained status o f cyclists
The cyclists had, at the t ime of this study, competed in various disciplines of cycling (i.e. track sprinting, t rack pursuit, t ime-trials and road-racing). Several of the cy- clists were also current state champions or had recently been international compet i tors in other endurance sports (i.e. rowing and cross-country skiing). Using the same method of detecting LT as used by Coyle et al. (1991), the cyclists in the present study demonst ra ted LT values (% x ~ O 2 p e a k ; m i l l i l i t r e s per ki logram per minute) similar to those of US. State-level cyclists, but
TaMe 2. Selected correlation coefficients showing relationships between the y-intercept of the maximal work-duration regression (Y-int) and muscle (vastus lateralis) metabolic variables in well- trained male cyclists (n = 10)
AC EATP /3 PHOS PFK PHOS/ PFK/ CS CS
Y-int (kJ) 0.73* 0.70* 0.71" 0.36 0.18 0.40 0.22 Y-int (J.kg -1) 0.63* 0.71" 0 .63 0.43 0.14 0.47 0.23
ATP, Adenosine 5'-triphosphate; See text for explanation of acronyms and units of measurement. Correlations between Y-int, in vitro buffer value (/3) and enzyme activities are based on data from nine cyclists * P< 0.05
were slightly lower than the 54.6 m l . k g - l . m i n -1 (79% maximal Oz uptake, l ¢ ~ O 2 m a x ) repor ted for Na- tional-level cyclists (Coyle et al. 1991). Mean VOzpeak values of 5.26 1.min -1 and 69.8 m l . k g - l - m i n -1 were comparable to previous reports of VOzmax values in high-performance cyclists, which ranged f rom 4.9-5.2 1-min -~ or 67-75 m l . k g - l . m i n -1 (Coyle et al. 1991; Sjogaard 1984). These comparisons demonst ra te that the cyclists used in this study were highly-trained; thus inferences made f rom this study may be applied to sim- ilar athletes.
Y-in t and A C
I t has been suggested that Y-int represents an 'anae- robic energy reserve ' or A C (Monod and Scherrer 1965; Whipp et al. 1982). This claim, however, has not been suppor ted using well-trained athletes or direct es-
554
timations of AC and/or anaerobic potential (i.e. en- zyme activities, buffer values) of musculature primarily involved in the exercise task.
The Y-int values of the cyclists in this study (Table 1 and Results) lie within the lower range of mean Y-int values (10.1-20.8 kJ) reported in the literature (Gues- ser and Wilson 1988; Jenkins and Quigley 1993; Van- derwalle et al. 1989). This could be attributed to inter- study differences in subjects, equipment and test proto- cols. When expressed in oxygen equivalents the mean value for Y-int (12.5 kJ) is equal to 2.69 1 02 Eq; this value is lower (P_0.05) than the oxygen equivalent calculated for AC (3.61 1 Eq. Oa)1. Therefore, Y-int, as measured in this study, appeared to underestimate AC.
There are several factors which could account for this. Firstly, it has been implied that the work-duration regression parameters are influenced by the duration over which work output is generated (McLellan and Cheung 1992), and failure to include work outputs gen- erated during longer work periods (i.e. > 10 min) in the determination of the Wlim-Tlim function might re- sult in a lower Y-int. This could be due, in part, to the increasing effect of "aerobic inertia" on work output as the duration of exercise is decreased, which deflects the work-duration regression downwards (Vandewalle et al. 1989), and might explain why Y-int was underes- timated in the present study. However, it does not ex- plain why Y-int scores in the present study are lower than those (i.e. mean = 205 J. kg-1) reported by Van- derwalle et al. (1989) since 1. The exercise durations over which work output was measured in that study (i.e. approximately 80-193 s) were less than those used in the present study, and 2. The effects of 'aerobic inertia' would (presumably) be less for endurance-trained compared to untrained subjects (which were used in the study by Vandewalle et al. 1989).
Secondly, the underestimation of Y-int might relate to the degree to which AC was maximised during the three cycle sessions which was alluded to by Vande- walle et al. (1989). All three cycle sessions were per- formed at an intensity above •O2pea k and the differ- ence between the power output at the moment timing was stopped and VO2p~ak would have been larger for the shorter work sessions. Therefore, the anaerobic ATP yield would have been lower for the shorter cycle sessions in comparison to the corresponding yield dur- ing the longer sessions; this would deflect the work- duration downwards resulting in a lower Y-int and higher CP. To test this the work-duration regression was determined using an alternative method which was based upon work outputs generated during the same cycle sessions, but which were continued until the pow- er output had declined to ~'702peak (W). Using this method Y-int [15.9 (SD 6.5) kJ] was approximately
1 This calculation assumes that glycogen is the oxidised sub- strate, and that 39 tool A T P are resynthesized for each mole of 02 consumed.
27% higher (P_0.05) than Y-int derived from the ori- ginal method (i.e. 12.49 k J), and CP was also lower [335 (SD 57) W vs 346 (SD 54) W; P_< 0.05) in compar- ison. The durations of the low-, medium- and high- intensity supra-1202p~ak sessions were 166 (SD 21) s, 250 (SD 51) s and 312 (SD 67) s. When expressed in oxygen equivalents the mean Y-int was equal to 3.42 (SD 1.57) 1 02 Eq which is similar (P>0.05) to the es- timate of AC (i.e. 3.61 1 02 Eq). Thus, approximately 80% of the original difference between Y-int and AC (i.e. 0.19 vs 0.91 1 02 Eq) has been accounted for by a modification of the original protocol which had rela- tively minimal effect on the work durations.
A third possibility is that AC overestimated true anaerobic capacity. To obtain an accurate whole-body estimate of anaerobic ATP production, the distribution volumes within which changes in l a - , PCr and ATP occur must be known. To date there is no method of determining these distribution volumes accurately, so any extrapolation of metabolite concentrations to whole-body estimates using the method in the present study must be interpreted with some caution. In this study these distribution volumes were estimated by as- suming that the active muscle mass used during exer- cise was 25% of body mass (Medb¢ et al. 1988; Withers et al. 1991), and the extracellular space within which la - accumulated was 75 ml-kg -1 of body mass. Within the constraints of these assumptions and limitations, AC is primarily determined by the metabolites which contribute to the muscle anaerobic ATP yield and, to a lesser extent, [la-]b. The changes in [la-], [PCr] and [ATP] in the present study were consistent with those reported in other studies involving endurance cyclists (Sharp et al. 1986; Withers et al. 1991) or untrained men (Sahlin et al. 1978), and the change in [la-]b was also similar to other corresponding responses to short- term maximal exercise (see Green and Dawson, 1993 for references). The estimates of AC made in the pres- ent study are consistent with those estimates (approxi- mately 3.5 1 02 Eq), based on similar methods, for en- durance cyclists (Withers et al. 1991). Therefore, on the basis of these comparisons, the estimates of AC seem reasonable and are not likely to significantly overestimate the true value. Moreover, despite the lim- itations of estimating AC in the present study, the dis- crepancy between AC and Y-int (original method) is not likely to be fully explained by error in estimating AC.
This study has demonstrated that significant rela- tionship exist between Y-int (kilojoules and joules per kilogram), the anaerobic ATP yield (millimoles per kilogram), AC and in vitro fi (Table 2); the significance of these correlations was, in general, no different for Y-int derived from the alternative method (e.g. AC vs Y-int: r =0.64; P_< 0.05). This supports the hypothesis that, in well-trained cyclists, Y-int is a valid work esti- mate of AC. The Y-intercept was also positively corre- lated with the decrease in muscle [ATP] which oc- curred during the 113% T~O2pea k cycle session; similar results were shown when Y-int was determined using the alternative method (e.g. Y-int (joules per kilogram)
555
vs A[ATP]: r=0.83; P_<0.05). That is, the greater the Y-int the larger the decrease in muscle [ATP] during fatiguing exercise. The magnitude of the fall in muscle [ATP] during fatiguing exercise has been shown to be greater in type II (glycolytic) compared to type I mus- cle fibres (Meyer and Terjung 1979). Type II muscle has also been shown to be better adapted for intense anaerobic work than type I muscle (Castellini and Somero 1981). It can be inferred from these findings that those cyclists who exhibited greater decreases in muscle [ATP] also recruited a higher percentage of type II (glycolytic) fibres, which further supports the validity of Y-int as a work estimate of AC since an in- crease in the recruitment of type II fibres is, theoreti- cally, fundamental to generating a greater AC.
It has been suggested that both intramuscular buf- fering processes and the activities of rate-limiting (e.g. PFK) or fiux-generating enzymes (e.g. PHOS) in- volved in glycogenolysis/glycolysis may, in part, deter- mine AC (Saltin 1990); this being the case, these theo- retical determinants of AC should be related to AC and/or Y-int. Both the enzyme activities and in vitro fi (Table 1) were similar to human values reported else- where (Green et al. 1991; Harris et al. 1990). Despite the relatively small between-subject variation in in vi- tro/3, it was significantly correlated with Y-int (Table 2), anaerobic ATP yield (r=0.81) and AC (r=0.89); this is consistent with reports of higher buffer values in type II muscle (e.g. Castellini and Somero 1981) and is further evidence that Y-int is a valid work estimate of anaerobic capacity in cyclists.
In contrast, neither of the activities of PHOS and PFK correlated with Y-int, AC or in vitro/3. The de- rived ratios, PFK:CS and PHOS:CS, which may have provided a more sensitive muscle estimate of anaerob- ic potential, also did not correlate with these same var- iables. This would seem to suggest that, in (primarily) endurance cyclists, in vitro fi is a more important de- terminant of AC than anaerobic enzyme activities. However, there has been found to be considerable het- erogeneity of fibre type (and presumably metabolic characteristics) in human vastus lateralis muscle (Elder et al. 1982). Since the enzyme activities were deter- mined on a muscle sample different from that used for determination of in vitro fi and AC, the relatively low- er correlations between the enzyme activities and AC may, in part, be explained by this metabolic hetero- geneity.
The reliability of Y-int has been found to vary from r=0.67 to r=0.97 in untrained subjects (Gaesser and Wilson 1988; Jenkins and Quigley 1993). Due to the training and competitive commitments of the cyclists, the reliability of Y-int was not determined in the pres- ent study. Despite the high mean r 2 value (0.9961) of the original work-duration regression, the mean SEE of Y-int was 4.16 kJ; it was similar for the alternative method (SEE=4.25 k J), although when it was ex- pressed relative to the mean Y-int it was slightly lower in comparison (27% vs 33%). These SEE values are approximately fourfold greater than those reported elsewhere for untrained subjects (e.g. Jenkins and Qui-
gley 1993). Reasons for this difference are not clear, although it is plausible that a greater variability in me- chanical work output generated during repeated high- intensity tests (and the parameters derived from them) would be observed in athletes engaged in regular train- ing, who are likely to experience more variable states of fatigue, compared to untrained subjects. Inclusion of work outputs generated over approximately 60s (Gaesser and Wilson 1988; Poole et al. 1990; Vande- walle et al. 1989) in the maximal work-duration regres- sion might have also reduced the variability of Y-int by increasing both the range and number of values across which the regression was determined. Conversely, since AC, as quantified by the accumulated oxygen de- ficit, is not maximised within 60 s of maximal constant- load exercise (Medb¢ et al. 1988; Medb¢ and Tabata 1989), including work outputs generated over approxi- mately 60 s might deflects the work-duration regres- sion downwards and, thus, yield a lower Y-int.
In conclusion, results of this study support the valid- ity of Y-int as a work estimate of AC in well-trained cyclists. It has also been demonstrated that Y-int quan- tifies AC more accurately when the power output at which each supra-I202peak cycle session is stopped ap- proximates VO2peak, rather than at an intensity above this power output. To improve the accuracy of estimat- ing Y-int in cyclists, it is suggested that future studies, using well-trained cyclists, examine the effect of using work outputs generated over longer durations (ap- proximately 10-20 min) on the work duration regres- sion parameters and their associated errors.
Acknowledgements. The authors thank the Australian Sports Commission for funding this research.
References
Astrand P-O, Rodahl K (1977) Textbook of work physiology. Physiological bases of exercise. McGraw-Hill, New York, p 134
Astrand P-O, Hultman E, Juhlin-Dannfelt A, Reynolds G (1986) Disposal of lactate during and after strenuous exercise in hu- mans. J Appl Physioi 61:338-343
Castellini MA, Somero GN (1981) Buffering capacity of verte- brate muscle: correlations with potentials for anaerobic func- tion. J Comp Physiol 143:191-198
Coyle EF, Feltner ME, Kautz SA, Hamilton MT, Montain S J, Baylor AM, Abraham LD, Petrek GW (1991) Physiological and biomechanical factors associated with elite endurance cy- cling performance. Med Sci Sports Exerc 23:93-107
Elder GCB, Bradbury K, Roberts R (1982) Variability of fiber type distributions within human muscles. J Appl Physiol 53:1473-1480
Gaesser GA, Wilson LA (1988) Effects of continuous and inter- val training on the parameters of the power-endurance time relationship for high-intensity exercise. Int J Sports Med 9: 417-421
Green HJ, Jones S, Ball-Burnett ME, Smith D, Liversey J, Far- rance BW (1991) Early muscular and metabolic adaptations to prolonged exercise training in humans. J Appl Physiol 70: 2032-2038
Green S, Dawson BT (1993) Measurement of anaerobic capaci- ties in humans: definitions, limitations and unsolved prob- lems. Sports Med 15:312-327
556
Harris RC, Hultman E, Nordesjo L-O (1974) Glycogen, glycolyt- ic intermediates and high energy phosphates determined in biopsy samples of m. quadriceps femoris of man at rest. Meth- ods and variance of values. Scand J Clin Lab Invest 33:109- 120
Harris RC, Marlin DJ, Dunnett M, Snow DH, Hultman E (1990) Muscle buffering capacity and dipeptide content in the thor- oughbred horse, greyhound dog and man. Comp Bioehem Physiol 97A: 249-251
Jenkins DG, Quigley BM (1991) The y-intercept of the critical power function as a measure of anaerobic work capacity. Er- gonomics 34:13-22
Jenkins DG, Quigley BM (1993) The influence of high-intensity exercise training on the W ~ - T ~ relationship. Med Sci Sports Exerc 25: 275-282
Lowry OH, Passoneau JV (1972) A flexible system of enzymatic analysis. Academic Press, New York
Lowry OH, Rosebrough NJ, Farr AL, Randall RJ (1951) Protein measurement with the Folin phenol reagent. J Biol Chem 193: 265-275
McLellan T, Cheung KS (1992) A comparative evaluation of the individual anaerobic threshold and the critical power. Med Sci Sports Exerc 24: 543-550
Medb¢ JI, Tabata I (1989) Relative importance of aerobic and anaerobic energy release during short-lasting exhausting bicy- cle exercise. J Appl Physiol 67:1881-1886
Medb¢ JI, Mohn AC, Tabata I, Bahr R, Vaage O, Sejersted OH (1988) Anaerobic capacity determined by maximal accumu- lated 02 deficit. J Appl Physiol 64:50-60
Meyer RA, Terjung RL (1979) Differences in ammonia and ade- nylate metabolism in contracting fast and slow muscle. Am J Physiol 55: 218-224
Monod H, Scherrer J (1965) The work capacity of a synergic muscular group. Ergonomics 8:329-338
Peronnet F, Massicotte D (1991) Table of nonprotein respiratory quotient: an update. Can J Sports Sci 16:23-29
Poole DC, Ward SA, Whipp BJ (1990) The effects of training on the metabolic and respiratory profile of high-intensity cycle ergometer exercise. Eur J Appl Physiol 59:421-429
Sahlin K, Palmskog G, Hultman E (1978) Adenine nucleotide and IMP contents of the quadriceps muscle in man after exer- cise. PflOgers Arch 374:193-198
Saltin B (1990) Anaerobic capacity: past, present, and prospec- tive. In: Taylor AW, Gollnick PD, Green HJ, Ianuzzo CD, Noble EG, Metivier G, Sutton JR (eds) Biochemistry of exer- cise VII, International Series on Sport Sciences, 21. Human Kinetics. Champaign, Ill., pp 387-412
Scherrer J, Samson M, Paleologue A (1954) Etud6 du travail musculaire et de la fatigue. Donn6es ergomdtriques obtenues chez l'homme. J Physiol (Paris) 46:887-916
Sharp RL, Costill DL, Fink WJ, King DS (1986) Effects of eight weeks of bicycle ergometer sprint training on human muscle buffer capacity. Int J Sports Med 7:13-17
Sjogaard G (1984) Muscle morphology and metabolic potential in elite road cyclists during a season. Int J Sports Med 5 : 250- 254
Spriet LL, Soderlund K, Thomson JA, Hultman E (1986) pH measurement in human skeletal muscle samples: effect of phosphagen hydrolysis. J Appl Physiol 61:1949-1954
Thomas JR, Nelson JK (1985) Introduction to research in health, physical education, recreation, and dance. Human Kinetics, Champaign, Ill., pp 254-257
Vandewalle H, Kapitaniak B, Gr~in S, Raveneau S, Monod H (1989) Comparison between a 30-s all-out test and a time- work test on a cycle ergometer. Eur J Appl Physiol 58:375- 381
Whipp B J, Huntsman D J, Storer TW, Lamara N, Wasserman K (1982) A constant which determines the duration of tolerance to high-intensity work. Fed Proc 41 : 1591
Withers RT, Sherman WM, Clark DG, Esselbach PC, Nolan SR, Mackay MH, Brinkman M (1991) Muscle metabolism during 30, 60 and 90 s of maximal cycling on an air-braked egometer. Eur J Appl Physiol 63:354-362