Embed Size (px)
Citation preview
-
y Cropstage from Conventional and Conservation Tilled Corn
L. A. Kramer ASSOC. MEMBER
ASAE
ABSTRACT
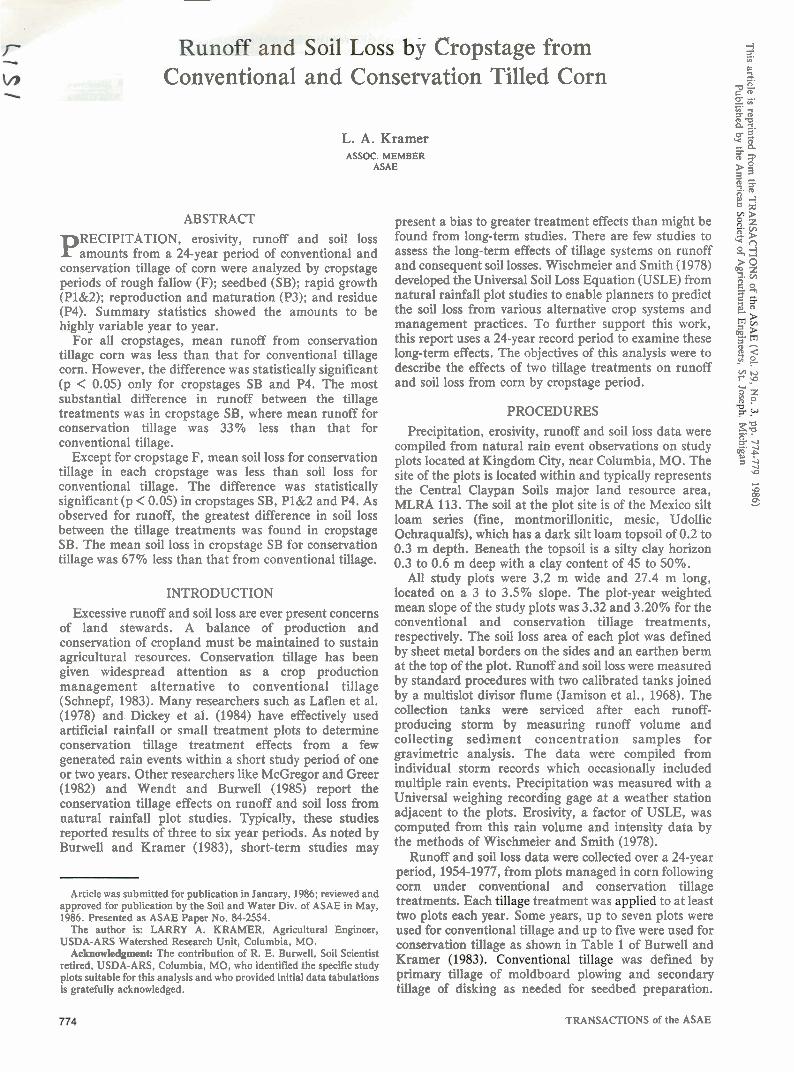
P RECIPITATION, erosivity, runoff and soil loss amounts from a 24-year period of conventional and
conservation tillage of corn were analyzed by cropstage periods of rough fallow (F); seedbed (SB); rapid growth (P1&2); reproduction and maturation (P3); and residue (P4). Summary statistics showed the amounts to be highly variable year to year.
For all cropstages, mean runoff from conservation tillage corn was less than that for conventional tillage corn. However, the difference was statistically significant (p < 0.05) only for cropstages SB and P4. The most substantial difference in runoff between the tillage treatments was in cropstage SB, where mean runoff for conservation tillage was 33% less than that for conventional tillage.
Except for cropstage F, mean soil loss for conservation tillage in each cropstage was less than soil loss for conventional tillage. The difference was statistically significant (p < 0.05) in cropstages SB, P1&2 and P4. As observed for runoff, the greatest difference in soil loss between the tillage treatments was found in cropstage SB. The mean soil loss in cropstage SB for conservation tillage was 67% less than that from conventional tillage.
INTRODUCTION Excessive runoff and soil loss are ever present concerns
of land stewards. A balance of production and conservation of cropland must be maintained to sustain agricultural resources. Conservation tillage has been given widespread attention as a crop production management alternative to conventional tillage (Schnepf, 1983). Many researchers such as Laflen et al. (1978) and Dickey et al. (1984) have effectively used artificial rainfall or small treatment plots to determine conservation tillage treatment effects from a few generated rain events within a short study period of one or two years. Other researchers like McGregor and Greer (1982) and Wendt and Burwell (1985) report the conservation tillage effects on runoff and soil loss from natural rainfall plot studies. Typically, these studies reported results of three to six year periods. As noted by Burwell and Kramer (1983), short-term studies may
2 t' 0 2.
2~ Z K t' -, ZG a I. zg rr a 5 p * s B s 0"" % 3
present a bias to greater treatment effects than might be $ found from long-term studies. There are few studies to 8 * assess the long-term effects of tillage systems on runoff % 2 and consequent soil losses. Wischmeier and Smith (1978) * O
%. 5 developed the Universal Soil Loss Equation (USLE) from & % natural rainfall plot studies to enable planners to predict g the soil loss from various alternative crop systems and a " management practices. To further support this work, this report uses a 24-year record period to examine these 5. long-term effects. The objectives of this analysis were to 8 2 describe the effects of two tillage treatments on runoff - . and soil loss from corn by cropstage period. ? "%
I 0 Z W 0
PROCEDURES Precipitation, erosivity, runoff and soil loss data were g?
compiled from natural rain event observations on study 2 =f 3 + plots located at Kingdom City, near Columbia, MO. The 3 =f
site of the plots is located within and typically represents \O
C
the Central Claypan Soils major land resource area, 8 MLRA 113. The soil at the plot site is of the Mexico silt OI - loam series (fine, montmorillonitic, mesic, Udollic Ochraqualfs), which has a dark silt loam topsoil of 0.2 to 0.3 m depth. Beneath the topsoil is a silty clay horizon 0.3 to 0.6 m deep with a clay content of 45 to 50%.
All study plots were 3.2 m wide and 27.4 m long, located on a 3 to 3.5% slope. The plot-year weighted mean slope of the study plots was 3.32 and 3.20% for the conventional and conservation tillage treatments, respectively. The soil loss area of each plot was defined by sheet metal borders on the sides and an earthen berm at the top of the plot. Runoff and soil loss were measured by standard procedures with two calibrated tanks joined by a multislot divisor flume (Jamison et al., 1968). The collection tanks were serviced after each runoff- producing storm by measuring runoff volume and collecting sediment concentration samples for gravimetric analysis. The data were compiled from individual storm records which occasionally included multiple rain events. Precipitation was measured with a Universal weighing recording gage at a weather station adjacent to the plots. Erosivity, a factor of USLE, was computed from this rain volume and intensity data by the methods of Wischmeier and Smith (1978).
Runoff and soil loss data were collected over a 24-vear period, 1954-1977, from plots managed in corn folloGing
Article was submitted for publication in January, 1986; reviewed and corn under conventional and conservation tillage
approved for publication by the Soil and Water Div. of ASAE in May, treatments. Each treatment was to at least 1986. Presented as ASAE Paper No. 84-2554. two plots each year. Some years, up to seven plots were
The author is: LARRY A. KRAMER, Agricultural Engineer, used for conventional tillage and up to five were used for USDA-ARS Watershed Research Unit, Columbia, MO. Acknowledgment: The contribution of R. E. Buyell, Soil Scientist
conservation tillage as shown in Table 1 of Burwell and retired, USDA-ARS, Columbia, MO, who identified .the specific study Kramer was defined by olots suitable for this analysis and who orovided initial data tabulations primary tillage of moldboard plowing and secondary is gratefully acknowledge;. tillage of disking as needed for seedbed preparation.
TRANSACTIONS of the ASAE
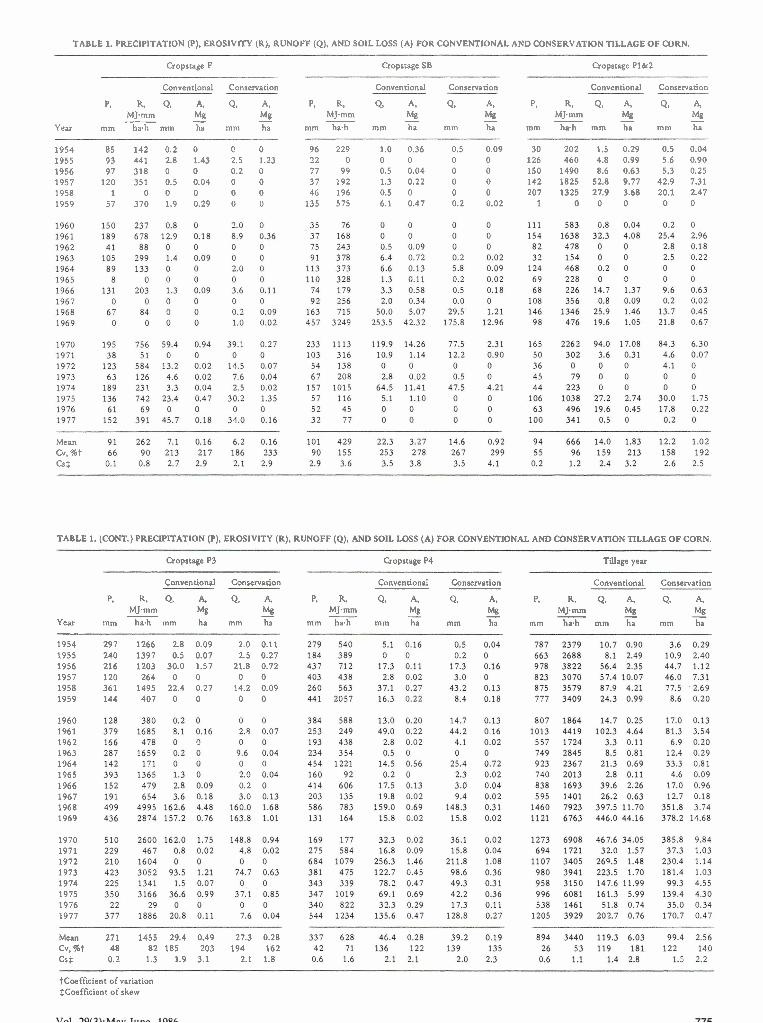
TABLE 1. PRECIPITATION (P), EROSIVITY (R), RUNOFF (Q), AND SOlL LOSS (A) FOR CONVENTIONAL AND CONSERVATION TILLAGE OF CORN.
Cropstage F Cropstage SB Cropstage P1&2
Conventional Conservation Conventional Conservation Conventional Conservation
P, R, Q, A. Q. A, P, R, Q, A. Q, A, P. R. Q. A, Q. 4 MJmm Mg - - Mg - MJ.mm Mt? - - Mg - MJ.mrn Mg - - M g -
Y e u mm h a h mm ha mm ha mm h a h mm ha mm ha mm h a h mm ha mm ha
1954 85 142 0.2 0 0 0 96 229 1.0 0.36 0.5 0.09 30 202 1.5 0.29 0.5 0.04 1955 93 441 2.8 1.43 2.5 1.23 2 2 0 0 0 0 0 126 460 4.8 0.99 5.6 0.90 1956 97 318 0 0 0.2 0 77 99 0.5 0.04 0 0 150 1490 8.6 0.63 5.3 0.25 1957 120 351 0.5 0.04 0 0 37 192 1.3 0.22 0 0 142 1825 52.8 9.77 42.9 7.31 1958 1 0 0 0 0 0 46 196 0.5 0 0 0 207 1325 27.9 3.68 20.1 2.47 1959 57 370 1.9 0.29 0 0 135 575 6.1 0.47 0.2 0.02 1 0 0 0 0 0
Mean Cv. kt Cs S
TABLE 1. (CONT.) PRECIPITATION (P), EROSIVITY (R). RUNOFF (Q). AND SOlL LOSS (A) FOR CONVENTIONAL AND CONSERVATION TILLAGE OF CORN.
Cropstage P3
Conventional Conservation
P, R, Q. A. Q, A, MJmm Mg - Mg -
mm ha.h mm ha mm ha
297 1266 2.8 0.09 2.0 0.11 240 1397 0.5 0.07 2.5 0.27 216 1203 30.0 1.57 21.8 0.72 120 264 0 0 0 0 361 1495 22.4 0.27 14.2 0.09 144 407 0 0 0 0
Gopscage P4
Conventional Conservation
P. R. Q. A, Q. A, MJ mm Mg - - Mg -
mm h a h mm ha mm ha
Tillage year
Conventional Conservation
P, R, Q, A, Q, A, MJmm Mg - - Mg -
mm h a h mm ha mm ha Year - 1954 1955 1956 1957 1958 1959
1960 1961 1962 1963 1964 1965 1966 1967 1968 1969
1970 1971 1972 1973 1974 1975 1976 1977
Mean 271 1455 29.4 0.49 27.3 0.28 Cv,%t 48 82 185 203 194 162 CJ $ 0.2 1.3 1.9 3.1 2.1 1.8
tcoefficient o f variation $Coefficient o f skew
Conservation tillage was defined by two operations with a field cultivator. The field cultivator operations for conservation tillage were performed on the same dates as plowing and disking for conventional tillage. The field cultivator operation is similar to that of a chisel plow. The field cultivator had seven knives on 0.2 m spacing. Primary tillage depth for plowing and the first field cultivation was about 0.15 m and secondary tillage depth for disking and the second field cultivation was about 0.08 m. All tillage and planting operations were in an upslope direction. This is not recommended field practice but is customary for plot studies. Potentially more soil loss could be measured from the study plots where tillage patterns are normal to the slope contour than from field areas tilled on the contour because of rilling in the tillage tracks. However, for the slopes and soil of these study plots, extensive rilling associated with tillage tracks was not observed. Weeds were controlled on both treatments with one or two crop cultivations each year and applications of pre-emergence and post- emergence herbicides. Herbicide applications were begun in 1970 and were normally followed by only one crop cultivation operation for weed control during the growing season. Fertilizer was applied according to annual soil test recommendations for optimum production.
The cultural operations for corn production consisted of primary tillage in the spring (average date, April 17), secondary tillage and planting (average date, May IS), cultivation and spray for weed control as needed (average first cultivation date, June lo), harvest (average date, October 16), and stalk chopping or shredding (generally in early November). When a cultural operation was performed on the conventional tillage plots, a corresponding operation was performed on the conservation tillage plots the same day. Corn residues remained on the plots for both tillage treatments. Standard farm equipment was used for cultural operations. Corn plant populations generally increased during the 24-yr period as fertility levels were increased and row spacing was decreased. The mean plant population was 36,000 plants/ha the first half of the study period when rows were spaced 1.07 m and 46,000 plants/ha the second half of the period when rows were spaced 0.76 m. Corn grain was sampled from all plots and grain yield was corrected to 15.5% moisture by weight. The mean yield of 7.22 Mg/ha from conservation tilled corn was not significantly different (p < 0.05) from the mean yield of 7.12 Mg/ha from conventional tillage corn.
The precipitation, erosivity, runoff and soil loss event data were summarized by cropstage periods defined by the cultural operation dates each year. Five periods were identified to represent uniform ground cover conditions and management effects as described by Wischmeier and Smith (1978). These periods are defined as: rough fallow period from primary spring tillage to secondary tillage and planting (F); seedbed period from planting to first cultivation (SB); rapid growth period from first cultivation to 30 days after first cultivation (P1&2); reproduction and maturation period from 30 days after first cultivation to harvest (P3); and residue period from harvest to primary spring tillage (P4).
The cropstage periods, PI, P2 and P3, in Agricultural Handbook 537 (AH 537) (Wischmeier and Smith, 1978) were defmed according to the percentage of canopy cover
rather than the number of days for the cropstage. Canopy cover was not documented during the period of record analyzed in this report. However, recent observations by Alberts et al. (1985) of canopy growth during cropstages on these study plots indicated that AH 537 cropstages P1 and P2 combined are represented by the period Pl&2 summarized in this report. The other cropstages defined for this analysis are similar to those in AH 537. The data are also summarized for the tillage year periods defined as beginning on the date of primary tillage and ending on the day before primary tillage the next spring.
Cumulative frequency distributions of the runoff and soil loss data by cropstage and tillage year were constructed to examine long-term data variability. The data were transformed to logarithmic values and fitted to a log-Pearson I11 distribution. The three parameter log- Pearson I11 distribution was chosen so the data with high skew coefficients could be adequately fitted. Some cropstage data sets had zero value observations. The log- Pearson I11 distribution was fitted to nonzero data; then the frequency values were adjusted for the number of zero values as discussed by Haan (1977). Results were graphed using the Wiebull plotting position formula.
Mean tillage treatment effects on runoff and soil loss were evaluated using a "t" test of paired observations (Snedecor and Cochran, 1980). The variance of the cropstage data tended to be proportional to the mean so a logarithmic transformation was used to stabilize it. Unit value was added to all data before the transformation to accommodate the zero value data (Snedecor and Cochran, 1980).
Supplemental water was applied to the study plots as part of a separate study during the years 1966 through 1977 in an attempt to stimulate runoff events during dry periods. The supplemental water amount which averaged 125 mm per year was applied in cropstages P1&2 and P3. Most of the supplemental water (72%) was applied in cropstage P3, the last stage of the corn plant development. There was little evidence of enhanced runoff and soil loss due to the water additions. No severe storms occurred following supplemental water applications. But, higher corn yields were likely sustained during dry years within this period.
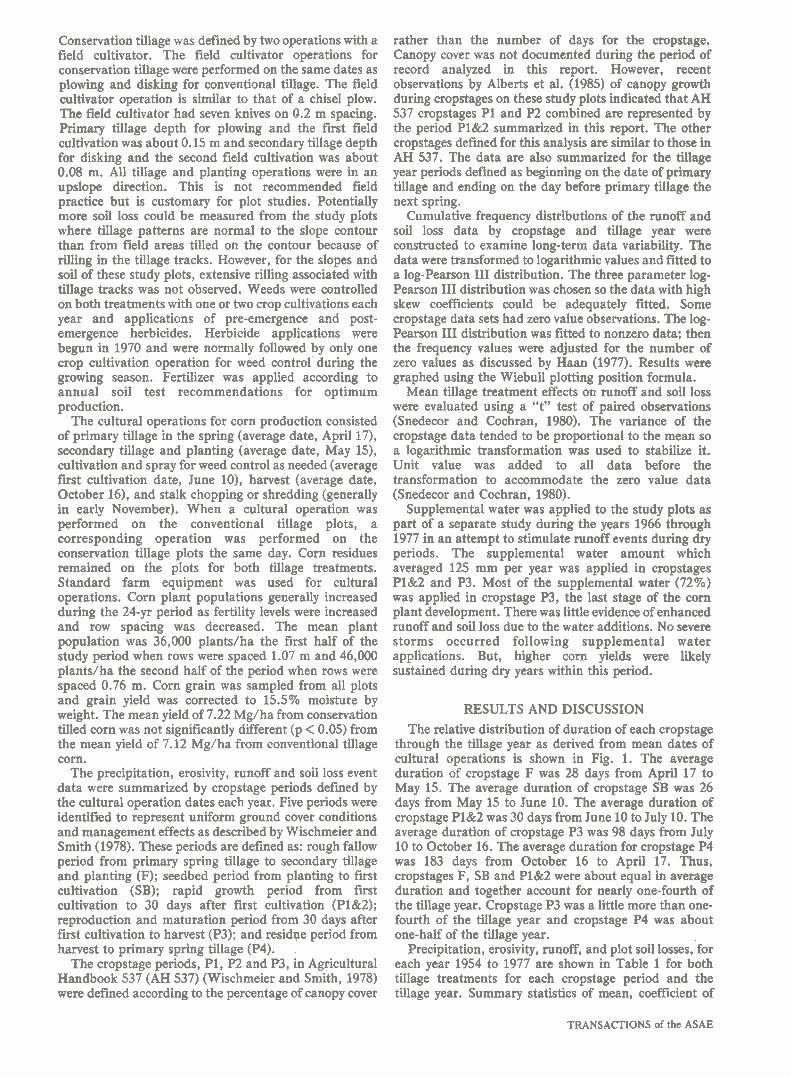
RESULTS AND DISCUSSION The relative distribution of duration of each cropstage
through the tillage year as derived from mean dates of cultural operations is shown in Fig. 1. The average duration of cropstage F was 28 days from April 17 to May 15. The average duration of cropstage SB was 26 days from May 15 to June 10. The average duration of cropstage P1&2 was 30 days from June 10 to July 10. The average duration of cropstage P3 was 98 days from July 10 to October 16. The average duration for cropstage P4 was 183 days from October 16 to April 17. Thus, cropstages F, SB and P1&2 were about equal in average duration and together account for nearly one-fourth of the tillage year. Cropstage P3 was a little more than one- fourth of the tillage year and cropstage P4 was about one-half of the tillage year.
Precipitation, erosivity, runoff, and plot soil losses, for each year 1954 to 1977 are shown in Table 1 for both tillage treatments for each cropstage period and the tillage year. Summary statistics of mean, coefficient of
TRANSACTIONS of the ASAE
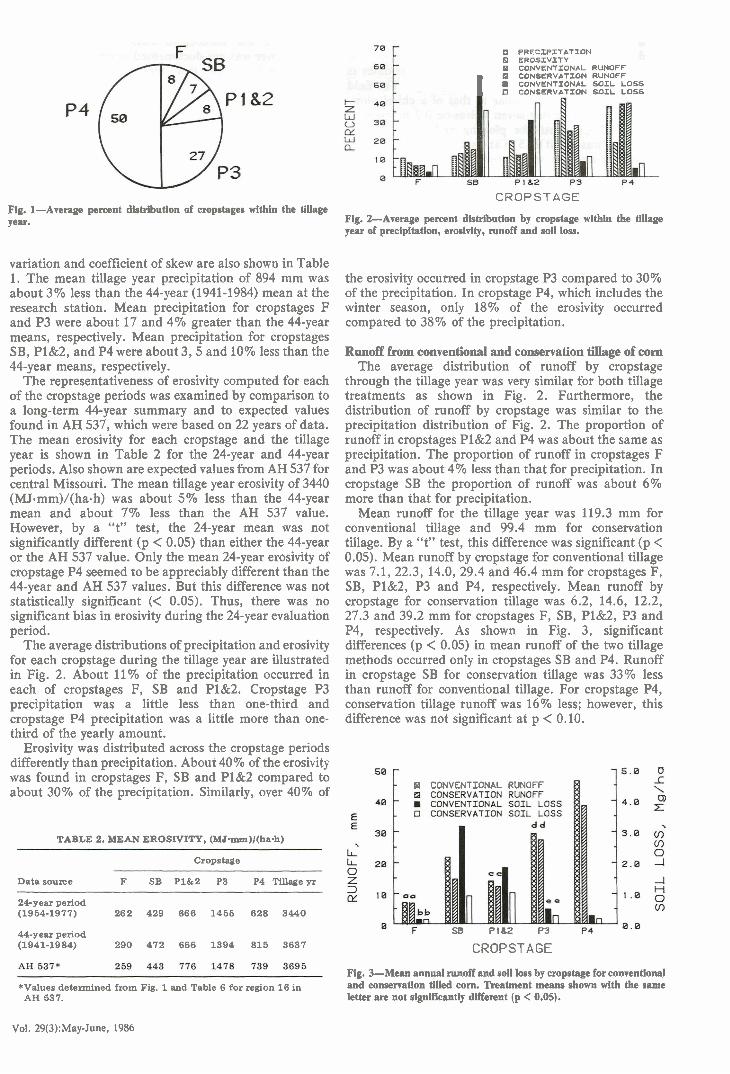
Fig. 1-Average percent distribution of cropstages within the tillage Year.
variation and coefficient of skew are also shown in Table 1. The mean tillage year precipitation of 894 mm was about 3% less than the 44-year (1941-1984) mean at the research station. Mean precipitation for cropstages F and P3 were about 17 and 4% greater than the 44-year means, respectively. Mean precipitation for cropstages SB, P1&2, and P4 were about 3 , s and 10% less than the 44-year means, respectively.
The representativeness of erosivity computed for each of the cropstage periods was examined by comparison to a long-term 44-year summary and to expected values found in AH 537, which were based on 22 years of data. The mean erosivity for each cropstage and the tillage year is shown in Table 2 for the 24-year and 44-year periods. Also shown are expected values from AH 537 for central Missouri. The mean tillage year erosivity of 3440 (MJ.mm)/(ha.h) was about 5% less than the 44-year mean and about 7% less than the AH 537 value. However, by a "t" test, the 24-year mean was not significantly different (p < 0.05) than either the 44-year or the AH 537 value. Only the mean 24-year erosivity of cropstage P4 seemed to be appreciably different than the 44-year and AH 537 values. But this difference was not statistically significant (< 0.05). Thus, there was no significant bias in erosivity during the 24-year evaluation period.
The average distributions of precipitation and erosivity for each cropstage during the tillage year are illustrated in Fig. 2. About 11 % of the precipitation occurred in each of cropstages F, SB and P1&2. Cropstage P3 precipitation was a little less than one-third and cropstage P4 precipitation was a little more than one- third of the yearly amount.
Erosivity was distributed across the cropstage periods differently than precipitation. About 40% of the erosivity was found in cropstages F, SB and P1&2 compared to about 30% of the precipitation. Similarly, over 40% of
TABLE 2. MEAN EROSIVITY, (MI-mm)/(ha.h)
Cropstage
Data source F SB P1&2 P3 P4 Tillweyr
24-year period (1954-1977) 262 429 666 1455 628 3440
44-year period (1941-19 84) 290 472 666 1394 815 3637
*Values determined from Fig. 1 and Table 6 for region 16 in AH 537.
P R E C I P I T A T I O N Q E R O S I V I T Y e CONVENTIONAL RUNOFF
CONSERVATION RUNOFF CONVENTIONAL S O I L LOSS 1 D CONSERVATION S O I L LOSS
CROPSTAGE
Fig. 2-Average percent distribution by cropstage within the tillage year of precipitation, erasivity, runoff and soil loss.
the erosivity occurred in cropstage P3 compared to 30% of the precipitation. In cropstage P4, which includes the winter season, only 18% of the erosivity occurred compared to 38% of the precipitation.
Runoff &om conventional and conservation tillage of corn The average distribution of runoff by cropstage
through the tillage year was very similar for both tillage treatments as shown in Fig. 2. Furthermore, the distribution of runoff by cropstage was similar to the precipitation distribution of Fig. 2. The proportion of runoff in cropstages P1&2 and P4 was about the same as precipitation. The proportion of runoff in cropstages F and P3 was about 4% less than that for precipitation. In cropstage SB the proportion of runoff was about 6% more than that for precipitation.
Mean runoff for the tillage year was 119.3 mm for conventional tillage and 99.4 mm for conservation tillage. By a "t" test, this difference was significant (p < 0.05). Mean runoff by cropstage for conventional tillage was 7.1, 22.3, 14.0, 29.4 and 46.4 mm for cropstages F, SB, P1&2, P3 and P4, respectively. Mean runoff by cropstage for conservation tillage was 6.2, 14.6, 12.2, 27.3 and 39.2 mm for cropstages F, SB, P1&2, P3 and P4, respectively. As shown in Fig. 3, significant differences (p < 0.05) in mean runoff of the two tillage methods occurred only in cropstages SB and P4. Runoff in cropstage SB for conservation tillage was 33% less than runoff for conventional tillage. For cropstage P4, conservation tillage runoff was 16% less; however, this difference was not significant at p < 0.10.
6d CONVENTIONAL RUNOFF
SB Pi62 P3
CROPSTAGE
Fig. 3-Mean annual runoff and soil loss by cropstage for conventional and conservation tilled corn. Treatment means shown with the same letter are not significantly different (p < 0.05).
Vol. 29(3):May-June, 1986
In cropstage SB, the greater runoff from conventional tillage was associated with a difference in soil aggregation due to disking versus field cultivation for conservation tillage prior to planting. Porosity was not measured in this study, but Bunvell and Larson (1969) report the secondary tillage of field cultivation in their study left the soil with greater porosity than the disking. Thus, in cropstage SB, the conservation tilled soil allowed more infiltration of rain than the conventional tilled soil. Consequently, runoff was less. Runoff was less for the conservation tilled treatment during this cropstage period compared to conventional tillage, particularly for the more numerous small rain events. In cropstage SB, there is little protection of the soil by growing corn plants. No surface residue data are available, but some residue typically remained at the soil surface after field cultivation to impede surface runoff and facilitate infiltration on the conservation tillage treatment in contrast to the conventional tillage treatment where all residues are covered.
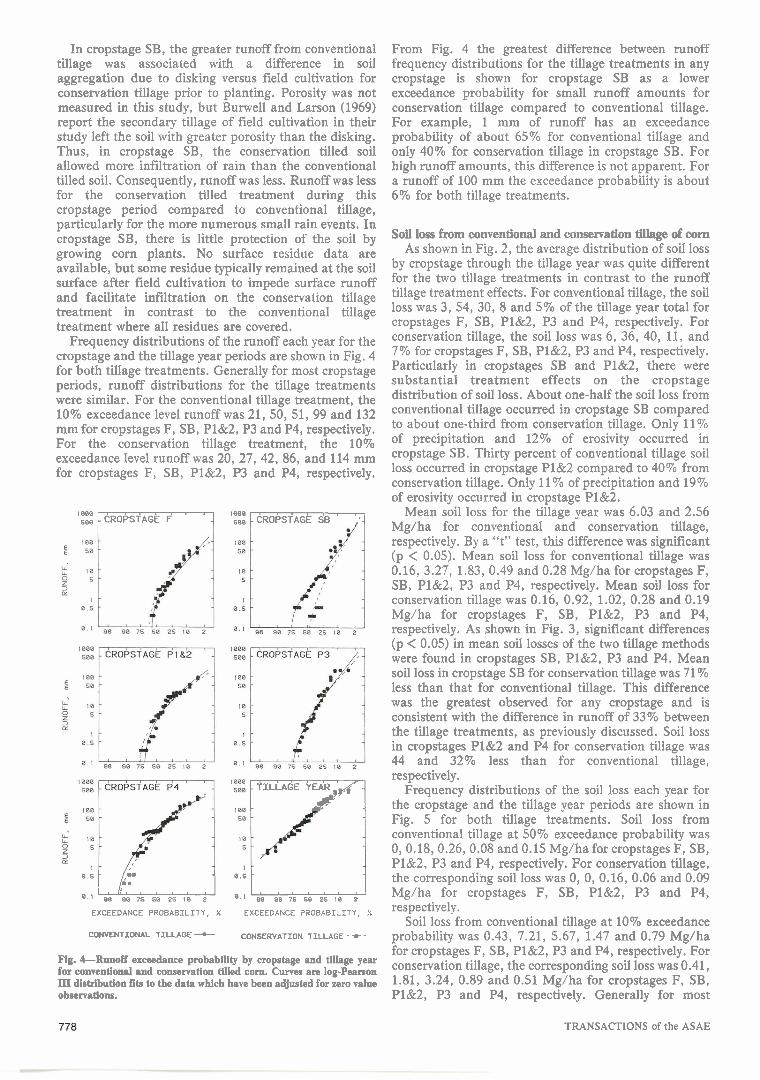
Frequency distributions of the runoff each year for the cropstage and the tillage year periods are shown in Fig. 4 for both tillage treatments. Generally for most cropstage periods, runoff distributions for the tillage treatments were similar. For the conventional tillage treatment, the 10% exceedance level runoff was 21,50,51,99 and 132 mm for cropstages F, SB, P1&2, P3 and P4, respectively. For the conservation tillage treatment, the 10% exceedance level runoff was 20, 27, 42, 86, and 114 mm for cropstages F, SB, P1&2, P3 and P4, respectively.
1 0 0 0 * ~ S I I - I 1000 500 1 CROPSTAGE F 5, 1 CROPS~AGE SB ' 24
TILLAGE YEAR m . , , , , , I " 1 , , , , , 1 "I 98 9 0 7 5 5 0 2 5 I 0 2 88 8 0 7 5 5 0 2 5 1 0 2
EXCEEDANCE PROBABILITY, % EXCEEDANCE PROBABILITY, X
CONVENTION*L TILLAGE --c CONSERVATION TILLAGE - I- -
Ng. 4--Runoff exceedance pmbabllity by cropstage and tillage year for conventional and conservation tilled corn. Curves a n log-Pemn IIf distribution Bts to the data which have been adjusted for zero value obsemations.
From Fig. 4 the greatest difference between runoff frequency distributions for the tillage treatments in any cropstage is shown for cropstage SB as a lower exceedance probability for small runoff amounts for conservation tillage compared to conventional tillage. For example, 1 mm of runoff has an exceedance probability of about 65% for conventional tillage and only 40% for conservation tillage in cropstage SB. For high runoff amounts, this difference is not apparent. For a runoff of 100 mm the exceedance probability is about 6% for both tillage treatments.
Soil loss from conventional and conservation tillage of corn As shown in Fig. 2, the average distribution of soil loss
by cropstage through the tillage year was quite different for the two tillage treatments in contrast to the runoff tillage treatment effects. For conventional tillage, the soil loss was 3, 54, 30, 8 and 5% of the tillage year total for cropstages F, SB, P1&2, P3 and P4, respectively. For conservation tillage, the soil loss was 6, 36, 40, 11, and 7% for cropstages F, SB, P1&2, P3 and P4, respectively. Particularly in cropstages SB and P1&2, there were substantial treatment effects on the cropstage distribution of soil loss. About one-half the soil loss from conventional tillage occurred in cropstage SB compared to about one-third from conservation tillage. Only 11% of precipitation and 12% of erosivity occurred in cropstage SB. Thirty percent of conventional tillage soil loss occurred in cropstage P1&2 compared to 40% from conservation tillage. Only 11 % of precipitation and 19% of erosivity occurred in cropstage P1&2.
Mean soil loss for the tillage year was 6.03 and 2.56 Mg/ha for conventional and conservation tillage, respectively. By a "t" test, this difference was significant (p < 0.05). Mean soil loss for conventional tillage was 0.16, 3.27, 1.83, 0.49 and 0.28 Mg/ha for cropstages F, SB, P1&2, P3 and P4, respectively. Mean soil loss for conservation tillage was 0.16, 0.92, 1.02, 0.28 and 0.19 Mg/ha for cropstages F, SB, P1&2, P3 and P4, respectively. As shown in Fig. 3, significant differences (p < 0.05) in mean soil losses of the two tillage methods were found in cropstages SB, P1&2, P3 and P4. Mean soil loss in cropstage SB for conservation tillage was 71 % less than that for conventional tillage. This difference was the greatest observed for any cropstage and is consistent with the difference in runoff of 33% between the tillage treatments, as previously discussed. Soil loss in cropstages P1&2 and P4 for conservation tillage was 44 and 32% less than for conventional tillage, respectively.
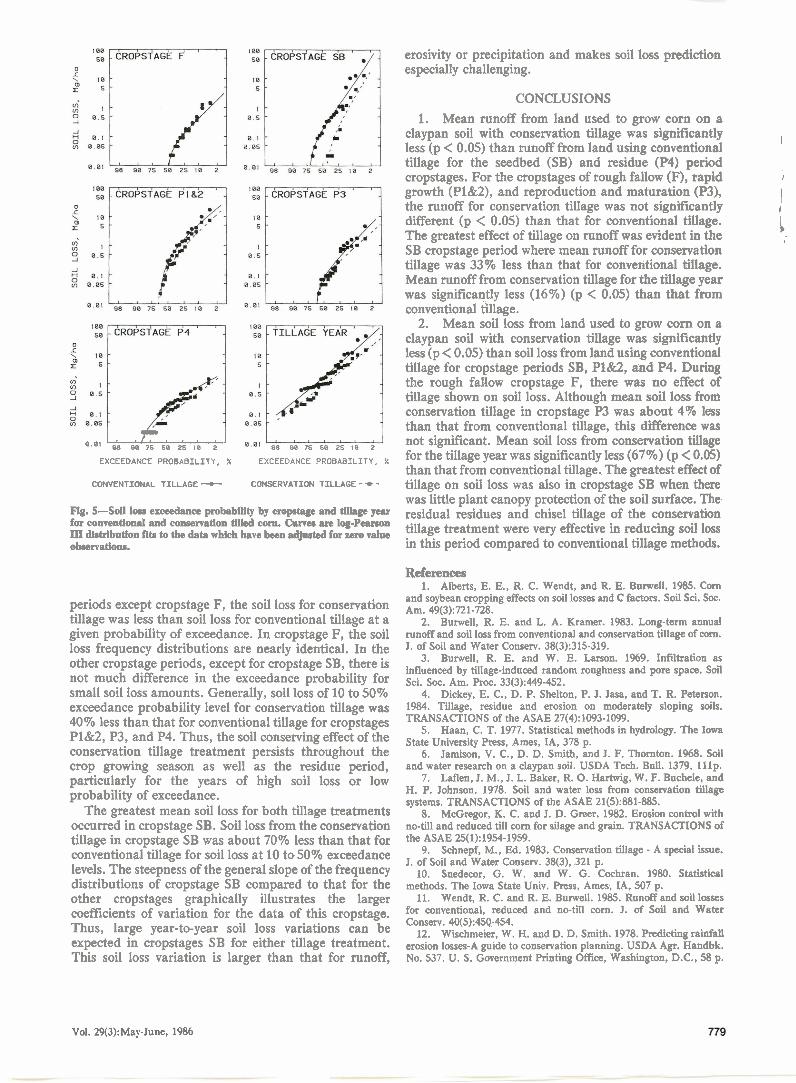
Frequency distributions of the soil loss each year for the cropstage and the tillage year periods are shown in Fig. 5 for both tillage treatments. Soil loss from conventional tillage at 50% exceedance probability was 0,0.18,0.26,0.08 and 0.15 Mg/hafor cropstages F, SB, P1&2, P3 and P4, respectively. For conservation tillage, the corresponding soil loss was 0, 0, 0.16, 0.06 and 0.09 Mg/ha for cropstages F, SB, P1&2, P3 and P4, respectively.
Soil loss from conventional tillage at 10% exceedance probability was 0.43, 7.21, 5.67, 1.47 and 0.79 Mg/ha for cropstages F, SB, P1&2, P3 and P4, respectively. For conservation tillage, the corresponding soil loss was 0.41, 1.81, 3.24, 0.89 and 0.51 Mg/ha for cropstages F, SB, P1&2, P3 and P4, respectively. Generally for most
TRANSACTIONS of the ASAE
O'O"& ;0?& i5 lb iJ 08 08 75 50 2s I0 2
EXCEEDANCE PROBABILITY, X EXCEEDANCE PROBABILITY, %
CONVENTIONAL TILLAGE- CONSERVATION TILLAGE -+-
Fig. ~-SOU low exceedance probability by cropstage and tillage year for conventional and co~~~rva t i on tilled corn. Cllrvm us log-Pconoa Ill disMbution fits to the data which have been *ted for zcro value observations.
periods except cropstage F, the soil loss for conservation tillage was less than soil loss for conventional tillage at a given probability of exceedance. In cropstage F, the soil loss frequency distributions are nearly identical. In the other cropstage periods, except for cropstage SB, there is not much difference in the exceedance probability for small soil loss amounts. Generally, soil loss of 10 to 50% exceedance probability level for conservation tillage was 40% less than that for conventional tillage for cropstages P1&2, P3, and P4. Thus, the soil conserving effect of the conservation tillage treatment persists throughout the crop growing season as well as the residue period, particularly for the years of high soil loss or low probability of exceedance.
The greatest mean soil loss for both tillage treatments occurred in cropstage SB. Soil loss from the conservation tillage in cropstage SB was about 70% less than that for conventional tillage for soil loss at 10 to 50% exceedance levels. The steepness of the general slope of the frequency distributions of cropstage SB compared to that for the other cropstages graphically illustrates the larger coefficients of variation for the data of this cropstage. Thus, large year-to-year soil loss variations can be expected in cropstages SB for either tillage treatment. This soil loss variation is larger than that for runoff,
erosivity or precipitation and makes soil loss prediction especially challenging.
CONCLUSIONS 1. Mean runoff from land used to grow corn on a
claypan soil with conservation tillage was significantly less (p < 0.05) than runoff from land using conventional I
tillage for the seedbed (SB) and residue (P4) period cropstages. For the cropstages of rough fallow (F), rapid 1 growth (P1&2), and reproduction and maturation (P3), the runoff for conservation tillage was not significantly I
I different (p < 0.05) than that for conventional tillage. The greatest effect of tillage on runoff was evident in the L-
I
SB cropstage period where mean runoff for conservation tillage was 33% less than that for conventional tillage. Mean runoff from conservation tillage for the tillage year was significantly less (16%) (p < 0.05) than that from conventional tillage.
2. Mean soil loss from land used to grow corn on a claypan soil with conservation tillage was significantly less (p < 0.05) than soil loss from land using conventional tillage for cropstage periods SB, P1&2, and P4. During the rough fallow cropstage F, there was no effect of tillage shown on soil loss. Although mean soil loss from conservation tillage in cropstage P3 was about 4% less
I
than that from conventional tillage, this difference was not significant. Mean soil loss from conservation tillage for the tillage year was significantly less (67%) (p < 0.05) than that from conventional tillage. The greatest effect of tillage on soil loss was also in cropstage SB when there was little plant canopy protection of the soil surface. The residual residues and chisel tillage of the conservation tillage treatment were very effective in reducing soil loss in this period compared to conventional tillage methods.
References 1. Alberts, E. E., R. C. Wendt, and R. E. Burwell. 1985. Corn
and soybean cropping effects on soil losses and C factors. Soil Sci. Soc. Am. 49(3):721-728.
2. Burwell, R. E. and L. A. Kramer. 1983. Long-term annual runoff and soil loss from conventional and conservation tillage of corn. J. of Soil and Water Conserv. 38(3):315-319.
3. Burwell, R. E. and W. E. Larson. 1%9. Infiltration as influenced by tillage-induced random roughness and pore space. Soil Sci. Soc. Am. Proc. 33(3):449-452.
4. Dickey, E. C., D. P. Shelton, P. J. Jasa, and T. R. Peterson. 1984. Tillage, residue and erosion on moderately sloping soils. TRANSACTIONS of the ASAE 27(4):1093-1099.
5. Haan, C. T. 1977. Statistical methods in hydrology. The Iowa State University Press, Ames, IA, 378 p.
6. Jamison, V. C., D. D. Smith, and J. F. Thornton. 1%8. Soil and water research on a claypan soil. USDA Tech. Bull. 1379, l l lp .
7. Laflen, J. M., J. L. Baker, R. 0. Hartwig, W. F. Buchele, and H. P. Johnson. 1978. Soil and water loss from conservation tillage systems. TRANSACTIONS of the ASAE 21(5):881-885.
8. McGregor, K. C. and J. D. Greer. 1982. Erosion control with no-till and reduced till corn for silage and grain. TRANSACTIONS of the ASAE 25(1):1954-1959.
9. Schnepf, M., Ed. 1983. Conservation tillage - A special issue. 1. of Soil and Water Conserv. 38(3), 321 p.
10. Snedecor, G. W. and W. G. Cochran. 1980. Statistical methods. The Iowa State Univ. Press, Ames, IA. 507 p.
11. Wendt, R. C. and R. E. Burwell. 1985. Runoff and soil losses for conventional, reduced and no-till corn. J. of Soil and Water C O ~ S ~ N . 40(5):45qr454.
12. Wischmeier, W. H. and D. D. Smith. 1978. Predicting rainfall erosion losses-A guide to conservation planning. USDA Agr. Handbk. No. 537. U. S. Government Printing W ~ c e , Washington, D.C., 58 p.
Vol. 29(3):May-June, 1986