Embed Size (px)
Citation preview
xx
A Survey on Ear Biometrics
AYMAN ABAZA, WVHTC FoundationARUN ROSS, West Virginia UniversityCHRISTINA HEBERT, WVHTC FoundationMARY ANN F. HARRISON, WVHTC FoundationMARK S. NIXON, University of Southampton
Recognizing people by their ear has recently received significant attention in the literature. Several reasons account forthis trend: first, ear recognition does not suffer from some problems associated with other non contact biometrics, such asface recognition; second, it is the most promising candidate for combination with the face in the context of multi-pose facerecognition; and third, the ear can be used for human recognition in surveillance videos where the face may be occludedcompletely or in part. Further, the ear appears to degrade little with age. Even though, current ear detection and recognitionsystems have reached a certain level of maturity, their success is limited to controlled indoor conditions. In addition to varia-tion in illumination, other open research problems include hair occlusion; earprint forensics; ear symmetry; ear classification;and ear individuality.
This paper provides a detailed survey of research conducted in ear detection and recognition. It provides an up-to-datereview of the existing literature revealing the current state-of-art for not only those who are working in this area but also forthose who might exploit this new approach. Furthermore, it offers insights into some unsolved ear recognition problems aswell as ear databases available for researchers.
Categories and Subject Descriptors: I.5.4 [Pattern Recognition]: Applications
General Terms: Design, Algorithms, Performance
Additional Key Words and Phrases: Biometrics, Ear recognition/detection, Earprints, Person verification/identification
ACM Reference Format:Abaza, A., Ross, A., Herbert, C., Harrison, M.F., and Nixon, M.S. 2011. A Survey on Ear Biometrics ACM Trans. Embedd.Comput. Syst. 39, 3, Article xx (September 2013), 33 pages.DOI = 10.1145/0000000.0000000 http://doi.acm.org/10.1145/0000000.0000000
1. INTRODUCTIONThe science of establishing human identity based on the physical (e.g., fingerprints and iris) or be-havioral (e.g., gait) attributes of an individual is referred to as biometrics [Jain et al. 2004]. Humanshave used body characteristics such as face and voice for thousands of years to recognize each other.In contemporary society, there is a pronounced interest in developing machine recognition systemsthat can be used for automated human recognition. With applications ranging from forensics to na-tional security, biometrics is slowly becoming an integral part of modern society. The most commonbiometric systems are those based on characteristics that have been commonly used by humans foridentification, such as fingerprint and face images, which have the largest market share. More re-cently, the iris biometric has been used in large-scale identity management systems such as border
Author’s address: A. Abaza, C. Hebert, and M. Harrison, Advanced Technologies Group, WVHTC Foundation, Fairmont,WV 26554.A. Ross, Lane Department of Computer Science and Electrical Engineering, West Virginia University, Morgantown, WV26506.M. S. Nixon, Department of Electronics and Computer Science and Engineering, University of Southampton, SouthamptonSO17 1BJ, UK.Permission to make digital or hard copies of part or all of this work for personal or classroom use is granted without feeprovided that copies are not made or distributed for profit or commercial advantage and that copies show this notice on thefirst page or initial screen of a display along with the full citation. Copyrights for components of this work owned by othersthan ACM must be honored. Abstracting with credit is permitted. To copy otherwise, to republish, to post on servers, toredistribute to lists, or to use any component of this work in other works requires prior specific permission and/or a fee.Permissions may be requested from Publications Dept., ACM, Inc., 2 Penn Plaza, Suite 701, New York, NY 10121-0701USA, fax +1 (212) 869-0481, or [email protected]© 2013 ACM 1539-9087/2013/09-ARTxx $10.00
DOI 10.1145/0000000.0000000 http://doi.acm.org/10.1145/0000000.0000000
ACM Transactions on Embedded Computing Systems, Vol. 39, No. 3, Article xx, Publication date: September 2013.
xx:2 Abaza et al.
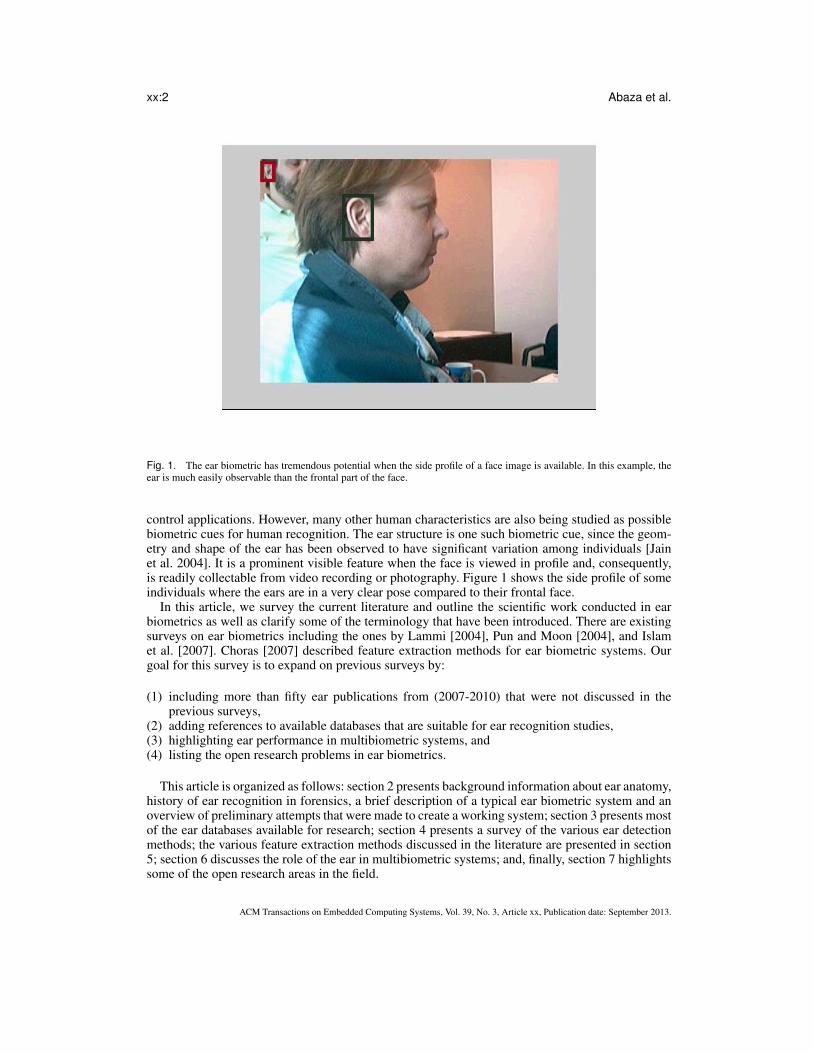
Fig. 1. The ear biometric has tremendous potential when the side profile of a face image is available. In this example, theear is much easily observable than the frontal part of the face.
control applications. However, many other human characteristics are also being studied as possiblebiometric cues for human recognition. The ear structure is one such biometric cue, since the geom-etry and shape of the ear has been observed to have significant variation among individuals [Jainet al. 2004]. It is a prominent visible feature when the face is viewed in profile and, consequently,is readily collectable from video recording or photography. Figure 1 shows the side profile of someindividuals where the ears are in a very clear pose compared to their frontal face.
In this article, we survey the current literature and outline the scientific work conducted in earbiometrics as well as clarify some of the terminology that have been introduced. There are existingsurveys on ear biometrics including the ones by Lammi [2004], Pun and Moon [2004], and Islamet al. [2007]. Choras [2007] described feature extraction methods for ear biometric systems. Ourgoal for this survey is to expand on previous surveys by:
(1) including more than fifty ear publications from (2007-2010) that were not discussed in theprevious surveys,
(2) adding references to available databases that are suitable for ear recognition studies,(3) highlighting ear performance in multibiometric systems, and(4) listing the open research problems in ear biometrics.
This article is organized as follows: section 2 presents background information about ear anatomy,history of ear recognition in forensics, a brief description of a typical ear biometric system and anoverview of preliminary attempts that were made to create a working system; section 3 presents mostof the ear databases available for research; section 4 presents a survey of the various ear detectionmethods; the various feature extraction methods discussed in the literature are presented in section5; section 6 discusses the role of the ear in multibiometric systems; and, finally, section 7 highlightssome of the open research areas in the field.
ACM Transactions on Embedded Computing Systems, Vol. 39, No. 3, Article xx, Publication date: September 2013.
A Survey on Ear Biometrics xx:3
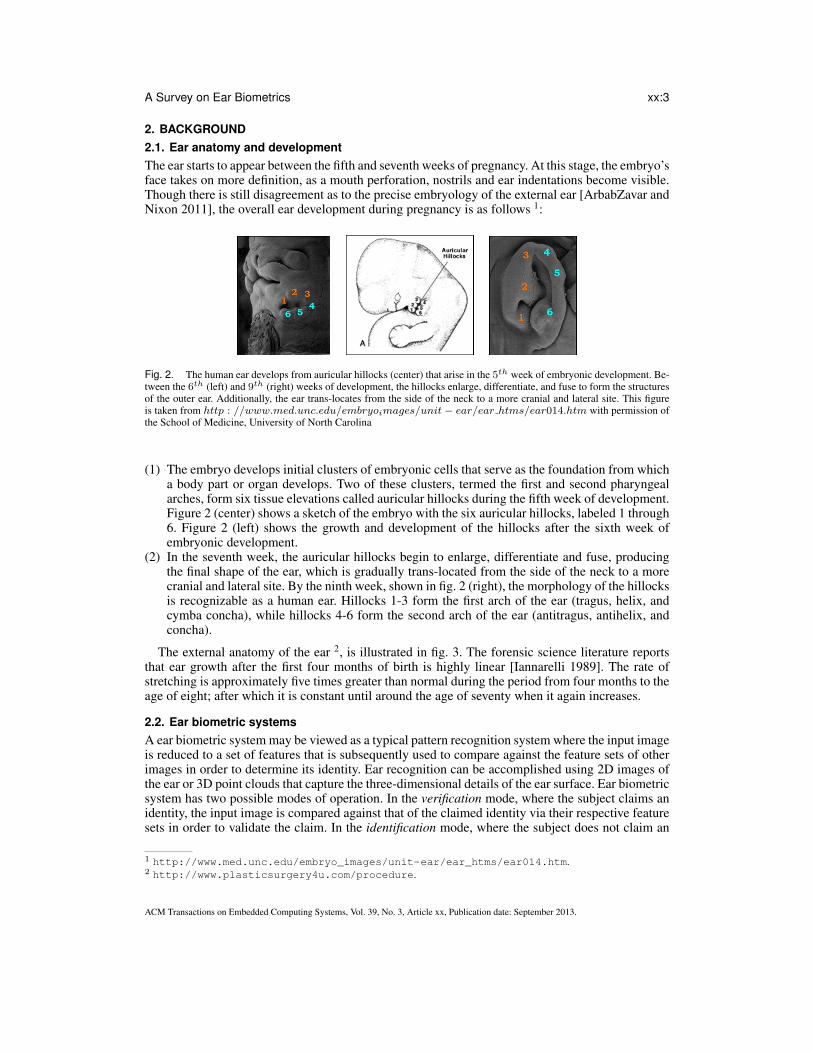
2. BACKGROUND2.1. Ear anatomy and developmentThe ear starts to appear between the fifth and seventh weeks of pregnancy. At this stage, the embryo’sface takes on more definition, as a mouth perforation, nostrils and ear indentations become visible.Though there is still disagreement as to the precise embryology of the external ear [ArbabZavar andNixon 2011], the overall ear development during pregnancy is as follows 1:
Fig. 2. The human ear develops from auricular hillocks (center) that arise in the 5th week of embryonic development. Be-tween the 6th (left) and 9th (right) weeks of development, the hillocks enlarge, differentiate, and fuse to form the structuresof the outer ear. Additionally, the ear trans-locates from the side of the neck to a more cranial and lateral site. This figureis taken from http : //www.med.unc.edu/embryoimages/unit− ear/ear htms/ear014.htm with permission ofthe School of Medicine, University of North Carolina
(1) The embryo develops initial clusters of embryonic cells that serve as the foundation from whicha body part or organ develops. Two of these clusters, termed the first and second pharyngealarches, form six tissue elevations called auricular hillocks during the fifth week of development.Figure 2 (center) shows a sketch of the embryo with the six auricular hillocks, labeled 1 through6. Figure 2 (left) shows the growth and development of the hillocks after the sixth week ofembryonic development.
(2) In the seventh week, the auricular hillocks begin to enlarge, differentiate and fuse, producingthe final shape of the ear, which is gradually trans-located from the side of the neck to a morecranial and lateral site. By the ninth week, shown in fig. 2 (right), the morphology of the hillocksis recognizable as a human ear. Hillocks 1-3 form the first arch of the ear (tragus, helix, andcymba concha), while hillocks 4-6 form the second arch of the ear (antitragus, antihelix, andconcha).
The external anatomy of the ear 2, is illustrated in fig. 3. The forensic science literature reportsthat ear growth after the first four months of birth is highly linear [Iannarelli 1989]. The rate ofstretching is approximately five times greater than normal during the period from four months to theage of eight; after which it is constant until around the age of seventy when it again increases.
2.2. Ear biometric systemsA ear biometric system may be viewed as a typical pattern recognition system where the input imageis reduced to a set of features that is subsequently used to compare against the feature sets of otherimages in order to determine its identity. Ear recognition can be accomplished using 2D images ofthe ear or 3D point clouds that capture the three-dimensional details of the ear surface. Ear biometricsystem has two possible modes of operation. In the verification mode, where the subject claims anidentity, the input image is compared against that of the claimed identity via their respective featuresets in order to validate the claim. In the identification mode, where the subject does not claim an
1 http://www.med.unc.edu/embryo_images/unit-ear/ear_htms/ear014.htm.2 http://www.plasticsurgery4u.com/procedure.
ACM Transactions on Embedded Computing Systems, Vol. 39, No. 3, Article xx, Publication date: September 2013.

xx:4 Abaza et al.
(1) Helix Rim(2) Lobule(3) Antihelix(4) Concha(5) Tragus(6) Antitragus(7) Crus of Helix(8) Triangular Fossa(9) Incisure Intertragica
Fig. 3. External anatomy of the ear. The visible flap is often referred to as the pinna. The intricate structure of the pinnacoupled with its morphology is believed to be unique to an individual although large-scale evaluation of automated earrecognition has not been conducted
Fig. 4. The block diagram of a typical ear recognition system
identity, the input ear image is compared against a set of labeled3 ear images in a database in order todetermine the best match and, therefore, its identity. The salient stages of a classical ear recognitionsystem are illustrated in fig. 4.
(1) Ear detection (segmentation): The first and foremost stage involves localizing the position ofthe ear in an image. Here, a rectangular boundary is typically used to indicate the spatial extentof the ear in the given image. Ear detection is a critical component since the errors in this stagecan undermine the utility of the biometric system.
(2) Ear normalization and enhancement: In this stage, the detected (segmented) ear is subjected toan enhancement routine that improves the fidelity of the image. Further, the ear image may besubjected to certain geometric or photometric corrections in order to facilitate feature extractionand matching. In some cases, a curve that tightly fits the external contour of the ear may beextracted.
(3) Feature extraction: While the segmented ear can be directly used during the matching stage,most systems extract a salient set of features to represent the ear. Feature extraction refers to theprocess in which the segmented ear is reduced to a mathematical model (e.g., a feature vector)that summarizes the discriminatory information.
(4) Matching: The features extracted in the previous stage have to be compared against those storedin the database in order to establish the identity of the input ear. In its simplest form, matchinginvolves the generation of a match score by comparing the feature sets pertaining to two earimages. The match score indicates the similarity between two ear images.
(5) Decision: In the decision stage, the match score(s) generated in the matching module are used torender a final decision. In the verification mode of operation, the output is a “yes” or a ”no”, withthe former indicating a genuine match and the latter indicating an impostor. In the identificationmode of operation, the output is a list of potential matching identities sorted in terms of theirmatch score.
3The term labeled is used to indicate that the identity of the images in the database is known
ACM Transactions on Embedded Computing Systems, Vol. 39, No. 3, Article xx, Publication date: September 2013.
A Survey on Ear Biometrics xx:5
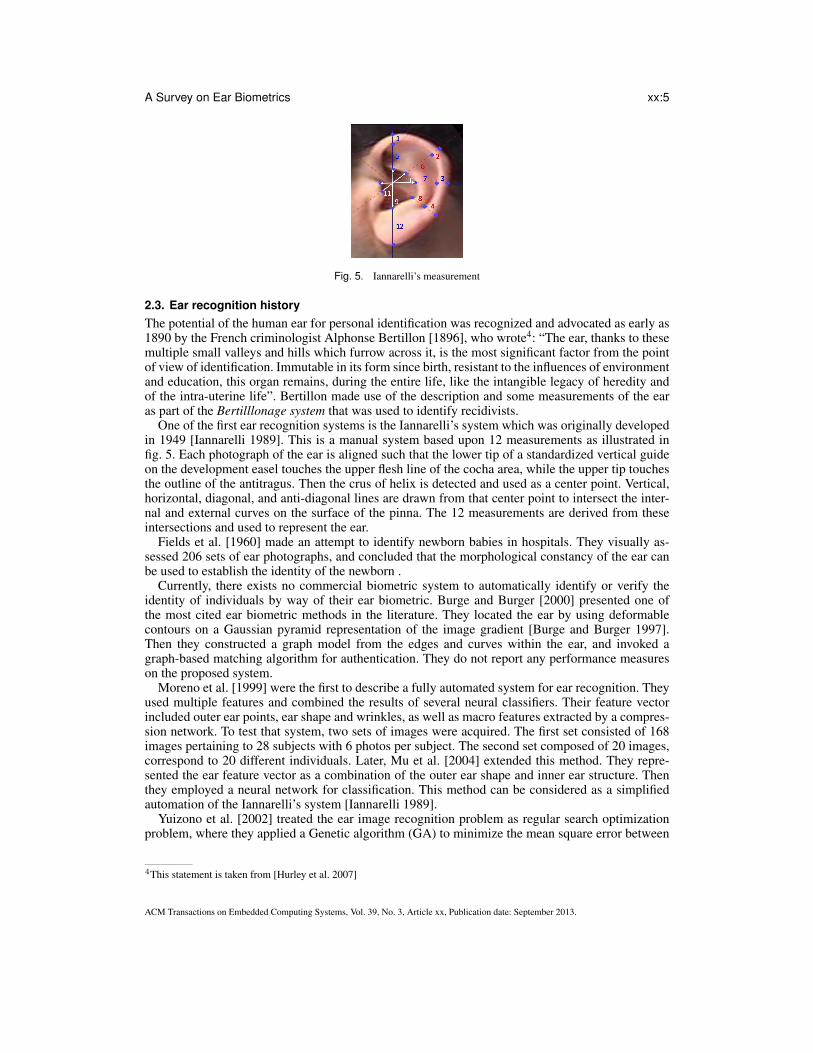
Fig. 5. Iannarelli’s measurement
2.3. Ear recognition historyThe potential of the human ear for personal identification was recognized and advocated as early as1890 by the French criminologist Alphonse Bertillon [1896], who wrote4: “The ear, thanks to thesemultiple small valleys and hills which furrow across it, is the most significant factor from the pointof view of identification. Immutable in its form since birth, resistant to the influences of environmentand education, this organ remains, during the entire life, like the intangible legacy of heredity andof the intra-uterine life”. Bertillon made use of the description and some measurements of the earas part of the Bertilllonage system that was used to identify recidivists.
One of the first ear recognition systems is the Iannarelli’s system which was originally developedin 1949 [Iannarelli 1989]. This is a manual system based upon 12 measurements as illustrated infig. 5. Each photograph of the ear is aligned such that the lower tip of a standardized vertical guideon the development easel touches the upper flesh line of the cocha area, while the upper tip touchesthe outline of the antitragus. Then the crus of helix is detected and used as a center point. Vertical,horizontal, diagonal, and anti-diagonal lines are drawn from that center point to intersect the inter-nal and external curves on the surface of the pinna. The 12 measurements are derived from theseintersections and used to represent the ear.
Fields et al. [1960] made an attempt to identify newborn babies in hospitals. They visually as-sessed 206 sets of ear photographs, and concluded that the morphological constancy of the ear canbe used to establish the identity of the newborn .
Currently, there exists no commercial biometric system to automatically identify or verify theidentity of individuals by way of their ear biometric. Burge and Burger [2000] presented one ofthe most cited ear biometric methods in the literature. They located the ear by using deformablecontours on a Gaussian pyramid representation of the image gradient [Burge and Burger 1997].Then they constructed a graph model from the edges and curves within the ear, and invoked agraph-based matching algorithm for authentication. They do not report any performance measureson the proposed system.
Moreno et al. [1999] were the first to describe a fully automated system for ear recognition. Theyused multiple features and combined the results of several neural classifiers. Their feature vectorincluded outer ear points, ear shape and wrinkles, as well as macro features extracted by a compres-sion network. To test that system, two sets of images were acquired. The first set consisted of 168images pertaining to 28 subjects with 6 photos per subject. The second set composed of 20 images,correspond to 20 different individuals. Later, Mu et al. [2004] extended this method. They repre-sented the ear feature vector as a combination of the outer ear shape and inner ear structure. Thenthey employed a neural network for classification. This method can be considered as a simplifiedautomation of the Iannarelli’s system [Iannarelli 1989].
Yuizono et al. [2002] treated the ear image recognition problem as regular search optimizationproblem, where they applied a Genetic algorithm (GA) to minimize the mean square error between
4This statement is taken from [Hurley et al. 2007]
ACM Transactions on Embedded Computing Systems, Vol. 39, No. 3, Article xx, Publication date: September 2013.

xx:6 Abaza et al.
Fig. 6. The data acquisition system designed at West Virginia University for collecting ear images at multiple angles.
the probe and gallery images. They assembled a database of 660 images corresponding to 110persons. They demonstrated an accuracy of 99− 100%.
Like other biometric traits, research in ear recognition is directed by the databases that are avail-able for algorithm evaluation and performance analysis. Therefore, we first discuss the variousdatabases that have been assembled by multiple research groups for assessing the potential of earbiometrics.
3. DATABASESTest and development of robust ear recognition algorithms require databases of sufficient size (manysubjects, multiple samples per subject, etc.) that include carefully controlled variations of factorssuch as lighting and pose. In the literature, the [Carreira-Perpinan 1995] database has been widelyused ; however it is a very small database of 19 subjects. In this section, we review several databasesthat have been used in the literature of ear recognition (and detection). Most of these databases areeither available for the public or can be transferred under license.
3.1. WVU databaseThe West Virginia University (WVU) ear database was collected using the system [Fahmy et al.2006] shown in fig. 6. This system had undergone various design, assembly, and implementationchanges. The main hardware components for this system include:
— PC: Provides complete control of the moving parts and acquiring video from camera.— Camera: Captures video. It is attached to the camera arm, and the latter is controlled by a stepper
motor.— Linear Actuator: This is a unique custom made device (by Netmotion, Inc.) has a 4-ft span and
allows smooth, vertical (up or downward) translation. This device is used to adjust the height ofthe camera according to the subject height.
— Light: For this database, the light was fixed to the camera arm.— Structural Framework: Consisted of tinted wall, rotating arms, and other structural supports. A
black board was added behind the chair, to serve as a uniform background during video capture.
There are various software packages that were used: (i) Posteus IPE (stepper system control): toadjust the camera height, and to rotate the camera; (ii) EVI Series Demonstration Software (camera
ACM Transactions on Embedded Computing Systems, Vol. 39, No. 3, Article xx, Publication date: September 2013.

A Survey on Ear Biometrics xx:7
Fig. 7. Image samples from USTB databases III [with permission of USTB]
control): to adjust zoom, tilt, and focus of the used camera; and (iii) IC Video Capture: to record thesubject’s images during the camera rotation.
The WVU ear database consists of 460 video sequences for 402 different subjects, and multi-sequence for 54 subjects [Abaza 2008]. Each video begins at the left profile of a subject (0 degrees)and terminates at the right profile (180 degrees) in about 2 minutes. This database has 55 subjectswith eyeglasses, 42 subjects with earrings, 38 subjects with partially occluded ears, and 2 fullyoccluded ears. The WVU database is currently not available for public use.
3.2. USTB databasesThe University of Science and Technology Beijing (USTB) databases 5 are available for academicresearch [USTB 2005].
— IMAGE DATABASE I: 180 images of 60 volunteers. For each subject the following three imageswere acquired: (a) normal ear image; (b) image with small angle rotation; and (c) image under adifferent lighting condition.
— IMAGE DATABASE II: 308 images of 77 volunteers. By defining the angle when the CCDcamera is perpendicular to the ear as being the profile view (0◦), for each subject the followingfour images were acquired: (a) profile image; (b) two images with 30◦ and −30◦ angle variations;and (c) one with illumination variation.
— IMAGE DATABASE III: 79 volunteers. For each subject the he following ear images wereacquired:— Regular ear images: The subject rotates his head from 0 degrees to 60 degrees toward the right
side. Images of the head were acquired at the following angles: 0◦, 5◦, 10◦, 15◦, 20◦, 25◦, 30◦,40◦, 45◦, 50◦, 60◦. Two images were recorded at each angle resulting in a total of 22 imagesper subject. Similarly, as the subject rotates his head from 0 degrees to 45 degrees toward theleft side, images of the head were acquired at the following angles: 0◦, 5◦, 10◦, 15◦, 20◦, 25◦,30◦, 40◦, 45◦. Two images were recorded at each angle resulting in a total of 18 images persubject.
— Ear images with partial occlusion: The total number of ear images with partial occlusion is144 pertaining to 24 subjects with 6 images per subject. Occlusion is due to three conditions:partial occlusion (disturbance from some hair), trivial occlusion (little hair) and regular occlu-sion (natural occlusion due to hair).
— IMAGE DATABASE IV: A camera system consisting of 17 CCD cameras, distributed aroundthe subject at an interval of 15◦ between them, was used to acquire ear and face images of 500volunteers at multiple poses/angles. Samples from USTB databases are shown in fig. 7.
3.3. UCR databaseThe University of California Riverside (UCR) database was assembled from images captured by theMinolta Vivid 300 camera [Chen and Bhanu 2007]. This camera uses the light-stripe method to emita horizontal stripe light to the object and the reflected light is then converted by triangulation intodistance information. The camera outputs a range image and its registered color image in less than
5http://www.ustb.edu.cn/resb/en/subject/subject.htm
ACM Transactions on Embedded Computing Systems, Vol. 39, No. 3, Article xx, Publication date: September 2013.
xx:8 Abaza et al.
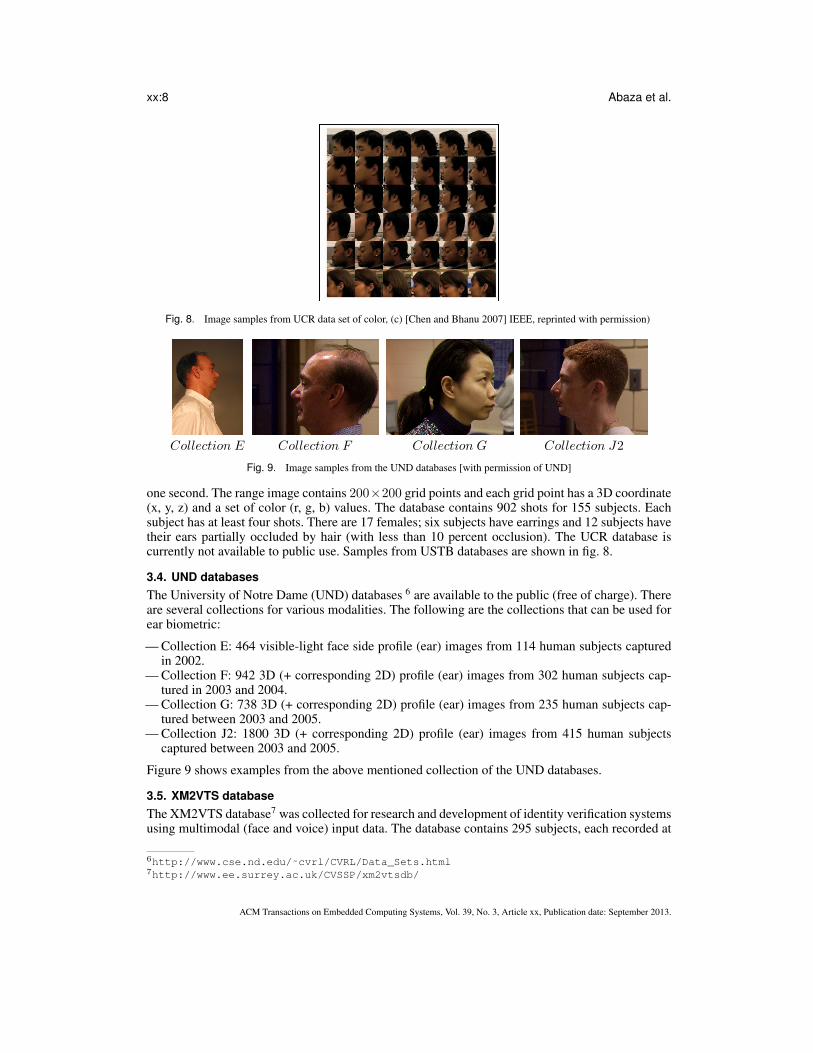
Fig. 8. Image samples from UCR data set of color, (c) [Chen and Bhanu 2007] IEEE, reprinted with permission)
Collection E Collection F Collection G Collection J2
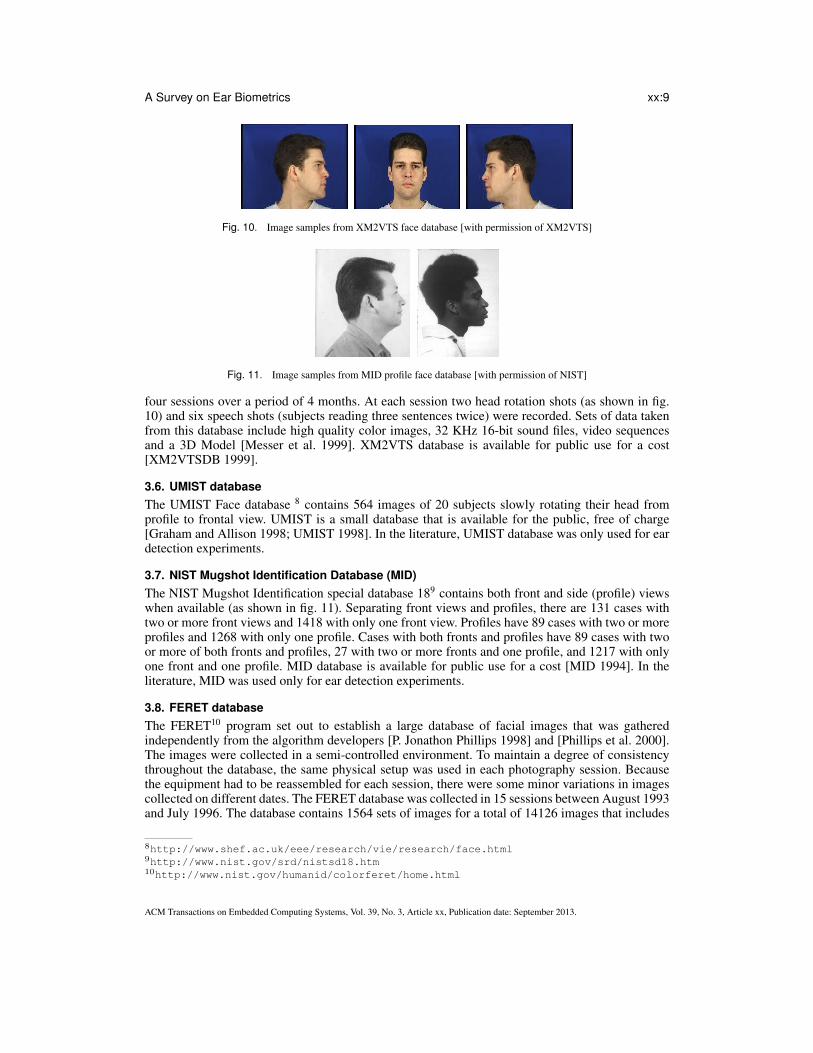
Fig. 9. Image samples from the UND databases [with permission of UND]
one second. The range image contains 200×200 grid points and each grid point has a 3D coordinate(x, y, z) and a set of color (r, g, b) values. The database contains 902 shots for 155 subjects. Eachsubject has at least four shots. There are 17 females; six subjects have earrings and 12 subjects havetheir ears partially occluded by hair (with less than 10 percent occlusion). The UCR database iscurrently not available to public use. Samples from USTB databases are shown in fig. 8.
3.4. UND databasesThe University of Notre Dame (UND) databases 6 are available to the public (free of charge). Thereare several collections for various modalities. The following are the collections that can be used forear biometric:
— Collection E: 464 visible-light face side profile (ear) images from 114 human subjects capturedin 2002.
— Collection F: 942 3D (+ corresponding 2D) profile (ear) images from 302 human subjects cap-tured in 2003 and 2004.
— Collection G: 738 3D (+ corresponding 2D) profile (ear) images from 235 human subjects cap-tured between 2003 and 2005.
— Collection J2: 1800 3D (+ corresponding 2D) profile (ear) images from 415 human subjectscaptured between 2003 and 2005.
Figure 9 shows examples from the above mentioned collection of the UND databases.
3.5. XM2VTS databaseThe XM2VTS database7 was collected for research and development of identity verification systemsusing multimodal (face and voice) input data. The database contains 295 subjects, each recorded at
6http://www.cse.nd.edu/˜cvrl/CVRL/Data_Sets.html7http://www.ee.surrey.ac.uk/CVSSP/xm2vtsdb/
ACM Transactions on Embedded Computing Systems, Vol. 39, No. 3, Article xx, Publication date: September 2013.
A Survey on Ear Biometrics xx:9
Fig. 10. Image samples from XM2VTS face database [with permission of XM2VTS]
Fig. 11. Image samples from MID profile face database [with permission of NIST]
four sessions over a period of 4 months. At each session two head rotation shots (as shown in fig.10) and six speech shots (subjects reading three sentences twice) were recorded. Sets of data takenfrom this database include high quality color images, 32 KHz 16-bit sound files, video sequencesand a 3D Model [Messer et al. 1999]. XM2VTS database is available for public use for a cost[XM2VTSDB 1999].
3.6. UMIST databaseThe UMIST Face database 8 contains 564 images of 20 subjects slowly rotating their head fromprofile to frontal view. UMIST is a small database that is available for the public, free of charge[Graham and Allison 1998; UMIST 1998]. In the literature, UMIST database was only used for eardetection experiments.
3.7. NIST Mugshot Identification Database (MID)The NIST Mugshot Identification special database 189 contains both front and side (profile) viewswhen available (as shown in fig. 11). Separating front views and profiles, there are 131 cases withtwo or more front views and 1418 with only one front view. Profiles have 89 cases with two or moreprofiles and 1268 with only one profile. Cases with both fronts and profiles have 89 cases with twoor more of both fronts and profiles, 27 with two or more fronts and one profile, and 1217 with onlyone front and one profile. MID database is available for public use for a cost [MID 1994]. In theliterature, MID was used only for ear detection experiments.
3.8. FERET databaseThe FERET10 program set out to establish a large database of facial images that was gatheredindependently from the algorithm developers [P. Jonathon Phillips 1998] and [Phillips et al. 2000].The images were collected in a semi-controlled environment. To maintain a degree of consistencythroughout the database, the same physical setup was used in each photography session. Becausethe equipment had to be reassembled for each session, there were some minor variations in imagescollected on different dates. The FERET database was collected in 15 sessions between August 1993and July 1996. The database contains 1564 sets of images for a total of 14126 images that includes
8http://www.shef.ac.uk/eee/research/vie/research/face.html9http://www.nist.gov/srd/nistsd18.htm10http://www.nist.gov/humanid/colorferet/home.html
ACM Transactions on Embedded Computing Systems, Vol. 39, No. 3, Article xx, Publication date: September 2013.

xx:10 Abaza et al.
Fig. 12. Image samples from FERET profile database [with permission of FERET]
Fig. 13. Image samples from CAS-PEAL database [with permission of CASPEAL]
1199 individuals and 365 duplicate sets of images. For some individuals, images were collected atright and left profile (labeled pr and pl), as shown in fig. 12, and are suitable for 2D ear recognition.FERET database is available for the public use [FERET 2003].
3.9. CAS-PEAL databaseThe CAS-PEAL11 face database [Gao et al. 2004] is constructed by Joint Research & DevelopmentLaboratory for Advanced Computer and Communication Technologies (JDL) of Chinese Academyof Sciences (CAS), under the support of the Chinese National Hi-Tech (863) Program and the ISVI-SION Tech. Co. Ltd. The CAS-PEAL database includes face images with various Poses, Expres-sions, Accessories, and Lighting (PEAL).
The CAS-PEAL face database contains 99,594 images of 1040 individuals (595 males and 445females). For each subject, 9 cameras spaced equally in a horizontal semicircular shelf are setup tosimultaneously capture images across different poses in one shot (as shown in fig. 13). Each subjectis also asked to look up and down to capture 18 images in another two shots. CAS-PEAL databasealso includes 5 kinds of expressions, 6 kinds accessories (3 glasses, and 3 caps), and 15 lightingdirections, as well as varying backgrounds, distance from cameras, and aging variation. CAS-PEALdatabase is available for the public use [Gao et al. 2008]. In the literature, CAS-PEAL database wasonly used for ear detection experiments.
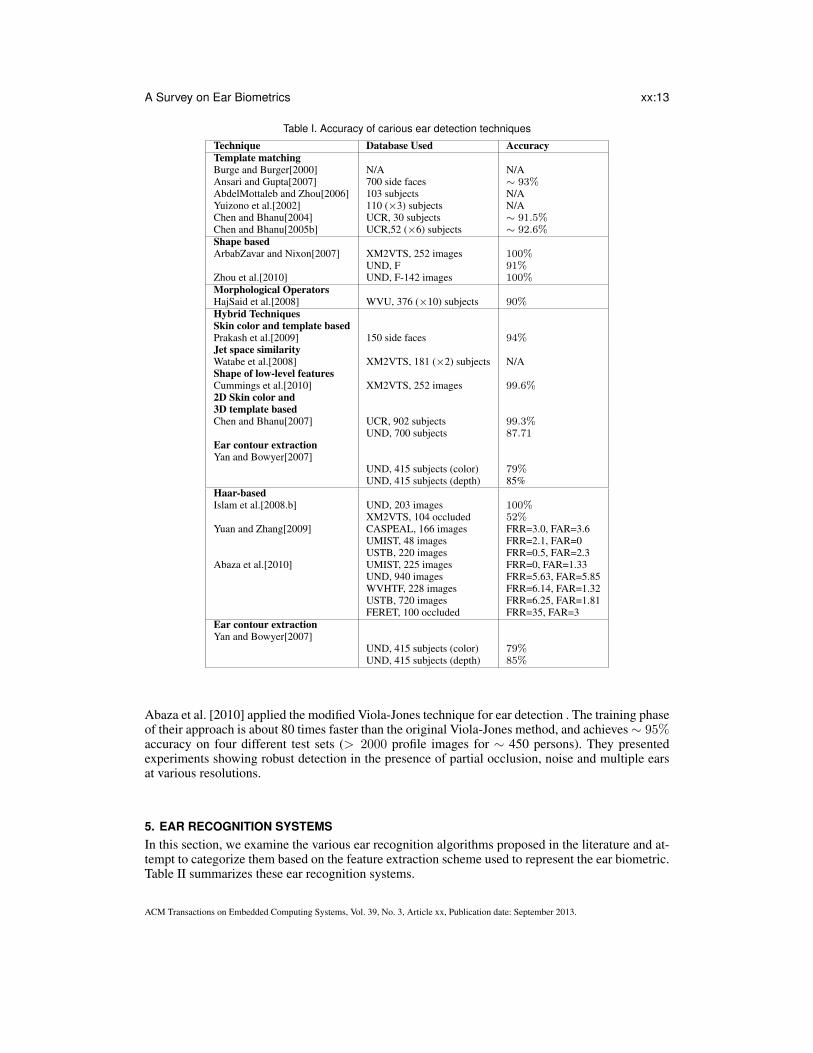
4. EAR DETECTIONEar detection (segmentation) is an essential step for automated ear recognition systems, thoughmany of the published recognition approaches achieve this manually. However, there have beenseveral approaches aimed at providing fully automated ear detection. This section describes someof the semi-automated (computer-assisted) and automated techniques proposed in the literature.Table I summarizes these ear detection techniques.
4.1. Computer-assisted ear segmentationThese semi-automated methods require user-defined landmarks specified on an image, and thenear segmentation is automated from that point onward. Yan and Bowyer [2005a] used a two-linelandmark, with one line along the border between the ear and the face, and the other from the topof the ear to the bottom, in order to detect the ear region. Alvarez et al. [2005] proposed a modified
11http://www.jdl.ac.cn/peal/home.htm
ACM Transactions on Embedded Computing Systems, Vol. 39, No. 3, Article xx, Publication date: September 2013.

A Survey on Ear Biometrics xx:11
snake algorithm and ovoid model technique. This technique requires the user to manually drawan approximated ear contour which is then used for estimating the ovoid model parameters formatching.
4.2. Template matching techniquesBurge and Burger [2000] located the ear using deformable contours on a Gaussian pyramid rep-resentation of the image gradient. Then edges are computed using the Canny operator, and edgerelaxation is used to form larger curve segments, after which the remaining small curve segmentsare removed.
Ansari and Gupta [2007] used outer helix curves of ears moving parallel to each other as featurefor localizing ear in an image. Using the Canny edge detector, edges are extracted from the wholeimage. These edges are segmented into convex and concave edges. From these segmented edges,expected outer helix edges are determined 12. They assembled a database of 700 side faces, andreported an accuracy of ∼ 93%.
AbdelMottaleb and Zhou [2006] segmented the ear from a face profile based on template match-ing, where they modeled the ear by its external curve. Yuizono et al. [2002] also used a templatematching technique for detection . They used both a hierarchical pyramid and sequential similaritycomputation to speed up the detection of the ear from 2D images.
In the context of 3D ear detection: Chen and Bhanu [2004] used a model-based (template match-ing) technique for ear detection . The model template is represented by an averaged histogram ofshape index 13. The detection is a four-step process: step edge detection and thresholding, imagedilation, connected component labeling, and template matching. Based on a test set of 30 subjectsfrom the UCR database, they achieved a 91.5% detection rate with 2.52% false alarm rate. Later,Chen and Bhanu [2005b] developed another shape model-based technique for locating human earsin side face range images where the ear shape model is represented by a set of discrete 3D ver-tices corresponding to the helix and anti-helix parts. They started by locating the edge segmentsand grouping them into different clusters that are potential ear candidates. For each cluster, theyregister the ear shape model with the edges. The region with the minimum mean registration erroris declared to be the detected ear region. Based on 52 subjects from UCR database, with 6 imagesper subjects, they achieved a 92.6% detection rate.
4.3. Shape basedArbabZavar and Nixon [2007] enrolled the ear based on finding the elliptical shape of the ear usinga Hough Transform (HT) . They achieved a 100% detection rate using the XM2VTS face-profiledatabase consisting of 252 images from 63 subjects, and 91% using the UND, collection F, database.
In the context of 3D ear detection: Zhou et al. [2010] introduced a novel shape-based featureset, termed the Histograms of Categorized Shapes (HCS), for robust 3D ear detection. They useda sliding window approach and a linear Support Vector Machine (SVM) classifier. They reported aperfect detection rate, i.e., a 100% detection rate with a 0% false positive rate, on a validation setconsisting of 142 range profile images from the UND, collection F, database.
4.4. Morphological operators techniquesHajSaid et al. [2008] addressed the problem of a fully automated ear segmentation scheme by em-ploying morphological operators . They used low computational-cost appearance-based features forsegmentation, and a learning-based Bayesian classifier for determining whether the output of thesegmentation is incorrect or not. They achieved a 90% accuracy on 3750 facial images correspond-ing to 376 subjects in the WVU database.
12They observed that ear resembles ellipse in shape; hence they assumed that the shape of helix curve is convex.13Shape index is a quantitative measure of the shape of a surface at each point, and is represented as a function of themaximum and minimum principal curvatures
ACM Transactions on Embedded Computing Systems, Vol. 39, No. 3, Article xx, Publication date: September 2013.
xx:12 Abaza et al.
4.5. Hybrid techniquesPrakash et al. used skin-color and template based technique for automatic ear detection in a sideprofile face image [Prakash et al. 2009; Prakash et al. 2008]. The technique first separates skinregions from non-skin regions and then searches for the ear within the skin regions using a templatematching approach. Finally, the ear region is validated using a moment based shape descriptor.Experimentation was done on an assembled database of 150 side profile face images, and yielded a94% accuracy.
Watabe et al. [2008] introduced the notion of “jet space similarity” for ear detection, which de-notes the similarity between Gabor jets and reconstructed jets obtained via Principal ComponentAnalysis (PCA) . They used the XM2VTS database for evaluation; however they did not reporttheir algorithm’s accuracy.
Cummings et al. [2010] used the image ray transform, based upon an analogy to light rays, todetect ears in an image . This transformation is capable of highlighting tubular structures such asthe helix of the ear and spectacle frames. By exploiting the elliptical shape of the helix, this methodwas used to segment the ear region. This technique achieved a detection rate of 99.6% using theXM2VTS database.
Chen and Bhanu [2007] fused skin-color from color images and edges from range images toperform ear detection . In the range images, they observed that the edge magnitude is larger aroundthe helix and the antihelix parts. They clustered the resulting edge segments and deleted the shortirrelevant edges. Using the UCR database, they reported a correct detection rate of 99.3% (896 outof 902). Using the UND databases (collections F and a subset of G), they reported a correct detectionrate of 87.71% (614 out of 700).
Yan and Bowyer developed a fully automatic ear contour extraction algorithm [Yan and Bowyer2007; Yan and Bowyer 2006]. First, they detected the ear pit based on the nose position and bysearching within a sector. Then, they segmented the ear contour using active contour initializedaround the ear tip. In [Yan and Bowyer 2007], using only color information, 88 out of 415 (21%)images were incorrectly segmented; while using only depth information, 60 out of 415 (15%) im-ages were incorrectly segmented. They speculated that all of the incorrectly segmented images inthese two situations could be correctly segmented by using a combination of color and depth infor-mation; however experimental results corroborating this were not reported.
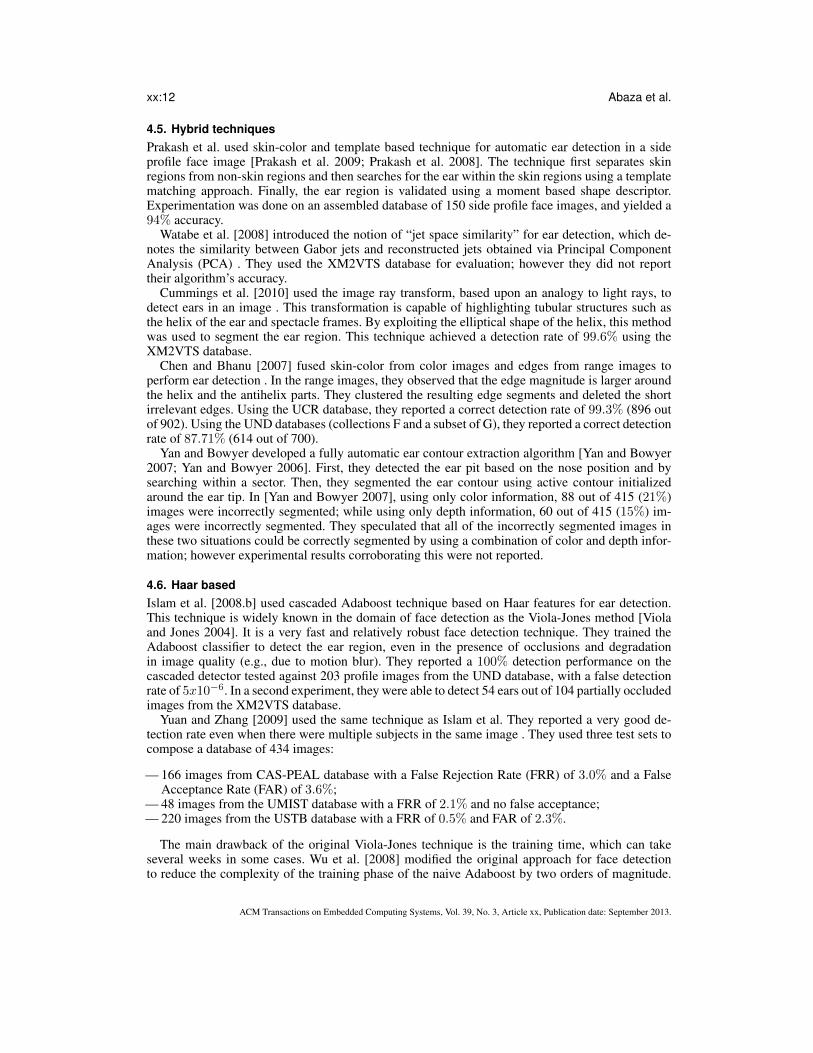
4.6. Haar basedIslam et al. [2008.b] used cascaded Adaboost technique based on Haar features for ear detection.This technique is widely known in the domain of face detection as the Viola-Jones method [Violaand Jones 2004]. It is a very fast and relatively robust face detection technique. They trained theAdaboost classifier to detect the ear region, even in the presence of occlusions and degradationin image quality (e.g., due to motion blur). They reported a 100% detection performance on thecascaded detector tested against 203 profile images from the UND database, with a false detectionrate of 5x10⁻⁶. In a second experiment, they were able to detect 54 ears out of 104 partially occludedimages from the XM2VTS database.
Yuan and Zhang [2009] used the same technique as Islam et al. They reported a very good de-tection rate even when there were multiple subjects in the same image . They used three test sets tocompose a database of 434 images:
— 166 images from CAS-PEAL database with a False Rejection Rate (FRR) of 3.0% and a FalseAcceptance Rate (FAR) of 3.6%;
— 48 images from the UMIST database with a FRR of 2.1% and no false acceptance;— 220 images from the USTB database with a FRR of 0.5% and FAR of 2.3%.
The main drawback of the original Viola-Jones technique is the training time, which can takeseveral weeks in some cases. Wu et al. [2008] modified the original approach for face detectionto reduce the complexity of the training phase of the naive Adaboost by two orders of magnitude.
ACM Transactions on Embedded Computing Systems, Vol. 39, No. 3, Article xx, Publication date: September 2013.
A Survey on Ear Biometrics xx:13
Table I. Accuracy of carious ear detection techniques
Technique Database Used AccuracyTemplate matchingBurge and Burger[2000] N/A N/AAnsari and Gupta[2007] 700 side faces ∼ 93%AbdelMottaleb and Zhou[2006] 103 subjects N/AYuizono et al.[2002] 110 (×3) subjects N/AChen and Bhanu[2004] UCR, 30 subjects ∼ 91.5%Chen and Bhanu[2005b] UCR,52 (×6) subjects ∼ 92.6%Shape basedArbabZavar and Nixon[2007] XM2VTS, 252 images 100%
UND, F 91%Zhou et al.[2010] UND, F-142 images 100%Morphological OperatorsHajSaid et al.[2008] WVU, 376 (×10) subjects 90%Hybrid TechniquesSkin color and template basedPrakash et al.[2009] 150 side faces 94%Jet space similarityWatabe et al.[2008] XM2VTS, 181 (×2) subjects N/AShape of low-level featuresCummings et al.[2010] XM2VTS, 252 images 99.6%2D Skin color and3D template basedChen and Bhanu[2007] UCR, 902 subjects 99.3%
UND, 700 subjects 87.71Ear contour extractionYan and Bowyer[2007]
UND, 415 subjects (color) 79%UND, 415 subjects (depth) 85%
Haar-basedIslam et al.[2008.b] UND, 203 images 100%
XM2VTS, 104 occluded 52%Yuan and Zhang[2009] CASPEAL, 166 images FRR=3.0, FAR=3.6
UMIST, 48 images FRR=2.1, FAR=0USTB, 220 images FRR=0.5, FAR=2.3
Abaza et al.[2010] UMIST, 225 images FRR=0, FAR=1.33UND, 940 images FRR=5.63, FAR=5.85WVHTF, 228 images FRR=6.14, FAR=1.32USTB, 720 images FRR=6.25, FAR=1.81FERET, 100 occluded FRR=35, FAR=3
Ear contour extractionYan and Bowyer[2007]
UND, 415 subjects (color) 79%UND, 415 subjects (depth) 85%
Abaza et al. [2010] applied the modified Viola-Jones technique for ear detection . The training phaseof their approach is about 80 times faster than the original Viola-Jones method, and achieves ∼ 95%accuracy on four different test sets (> 2000 profile images for ∼ 450 persons). They presentedexperiments showing robust detection in the presence of partial occlusion, noise and multiple earsat various resolutions.
5. EAR RECOGNITION SYSTEMSIn this section, we examine the various ear recognition algorithms proposed in the literature and at-tempt to categorize them based on the feature extraction scheme used to represent the ear biometric.Table II summarizes these ear recognition systems.
ACM Transactions on Embedded Computing Systems, Vol. 39, No. 3, Article xx, Publication date: September 2013.
xx:14 Abaza et al.
5.1. Intensity-basedVictor et al. [2002] and Chang et al. [2003] built a multimodal recognition system based on faceand ear. For the ear images the manually identified coordinates of the Triangular Fossa and theAntitragus are used for ear detection. Their ear recognition system was based on the concept ofeigen-ears, using principal component analysis (PCA). They reported a performance of 72.7% forthe ear in one experiment, compared to 90.9% for the multimodal system, using 114 subjects fromthe UND, collection E, database.
Zhang et al. [2005] built a hybrid system for ear recognition . This system combines IndependentComponent Analysis (ICA) and a Radial Basis Function (RBF) network. The original ear imagedatabase was decomposed into linear combinations of several basic images. Then the correspondingcoefficients of these combinations were fed into a RBF network. They achieved a 94.11% using twodatabases of segmented ear images. The first database was the Carreira-Perpinan database [Carreira-Perpinan 1995] consisting of 102 grey-scale images (6 ear images for each of 17 subjects). Thesecond database was the USTB database I, consisting of 180 images (3 ear images for each of 60subjects).
Yuan and Mu [2007] used an automatic ear extraction and normalization method based on animproved Active Shape Model (ASM) . Ear normalization adjusts for any scaling and rotationalvariation of the ear image. Then Full-space Linear Discriminant Analysis (FSLDA) was applied toperform ear recognition. They used the USTB database III, consisting of 79 subjects and achieveda recognition rate of 90%, using a head rotation range varying between 20-degrees left-rotation to10-degrees right-rotation.
Xie and Mu [2007] used an improved version of the locally linear embedding algorithm. Locallinear embedding (LLE) is based on projecting data in high-dimensional space into a single globalcoordinate system of lower dimension, by preserving neighboring relationships, in order to discoverthe underlying structure of the data [Feng and Mu 2009]. LLE can better solve the problems ofnon-linear dimensionality reduction; however it suffers from lack of labeled information in the dataset. The improved version of LLE (IDLLE) first obtained the lower dimensional representation ofthe data points using the standard LLE algorithm, and then adopted Linear discriminant analysis(LDA) to resolve the problem of human ear classification. They used 79 subjects from the USTBdatabase IV, and they did not mention how they performed the detection and normalization steps.They reported the recognition rate of multi-pose ear as 60.75% compared to 43.03% using regularLLE was used. Later they used the same database, with ear poses in the range [-45◦,45◦] [Xie andMu 2008]. Experimentally they showed that the recognition rate of multi-pose ear had improvedusing LLE, compared to PCA and Kernel PCA. They further showed that the improved version ofthe LLE algorithm is better, compared to the regular one at these poses. The recognition rate wasabove 80% for ear poses in the range [-10◦, 20◦], and above 90% for those in the range [0◦, 10◦].
Zhang and Liu [2008] examined the problem of multi-view ear recognition . They used a B-Splinepose manifold construction in a discriminative projection space. This space is formed by the nullkernel discriminant analysis (NKDA) feature extraction scheme. They conducted many experimentsand performed comparisons to demonstrate the effectiveness of their multi-view ear recognitionapproach. Ears are segmented by manual supervising from original images and the segmented earimages are saved as multi-view ear data set. They reported a 97.7% rank-1 recognition rate in thepresence of large pose variations using 60 subjects from the USTB database IV.
Naseem et al. [2008] proposed a general classification algorithm for (image-based) object recog-nition, based on a sparse representation computed by l1−minimization. This framework providesnew insights into two crucial issues in ear recognition: feature extraction and robustness to occlusion[Wright et al. 2009]. From each image the ear portion is manually cropped, and no normalizationof the ear region is needed. They conducted several experiments using the UND and the USTBdatabases with session variability, various head rotations, and different lighting conditions. Theseexperiments yielded a high recognition rate in the order of 98%.
ACM Transactions on Embedded Computing Systems, Vol. 39, No. 3, Article xx, Publication date: September 2013.

A Survey on Ear Biometrics xx:15
Fig. 14. Force field line formed by iterations [Hurley et al. 2000]
5.2. Force fieldHurley et al. used force field transformations for ear recognition [Hurley et al. 2000; Hurley et al.2005b]. The image is treated as an array of Gaussian attractors that act as the source of the forcefield (as shown in fig. 14). The directional properties of that force field are exploited to locate a smallnumber of potential energy wells and channels that are used during the matching stage [Hurley et al.2005a]. Fixed size frame was manually adjusted by eye to surround and crop the ear images. Theyreported a very high recognition rate of 99.2%, using 4 images each of 63 subjects selected fromthe XM2VTS database.
AbdelMottaleb and Zhou [2006] used force field transformation followed by recognition basedon contours constructed from these features . They assembled a database of profile face images from103 subjects. For each person, one image was used for training, where the ear region was detectedusing external contour matching. The proposed ear recognition method was applied to 58 queryimages corresponding to 29 subjects. They achieved a 87.93% rank-1 recognition rate.
Dong and Mu used force field transformation and developed a two-stage approach for multi-pose ear feature extraction and recognition, i.e., force field transformation plus null space basedkernel fisher discriminant analysis (NKFDA) [Dong and Mu 2008]. Kernel technique can not onlyefficiently represent the nonlinear relation of data but also simplify the Null Linear DiscriminantAnalysis (NLDA). They cropped out the ear manually from the original images and make somepreprocess such as filtering and normalization. They used the USTB database IV and reported arecognition rate of 75.3% for pose 25◦, 72.2% for pose 30◦, 48.1% for pose 45◦.
5.3. 2D ear curves geometryChoras proposed an automated geometrical method [Choras 2004; Choras 2005]. He extracted theear contours and centroid from ear image, and then constructed concentric circles using that cen-troid. He defined two feature vectors for the ear based on the interest points between the variouscontours of the ear and the concentric circles. Testing with an assembled database of 240 ear images(20 different views) for 12 subjects, and selecting images with very high quality and under idealconditions of recognition, he reported a 100% recognition rate.
Later Choras and Choras [2006] added two more geometric feature vectors extracted using theAngle-Based Contour Representation and the Geometrical Parameters Method. Then they con-ducted a comparison study using an assembled database of 102 ear images, where the variousgeometrical methods yielded false reject rate between (0− 9.6%).
5.4. Fourier descriptorAbate et al. [2006] used rotation invariant descriptors, namely GFD (Generic Fourier Descriptor),to extract meaningful features from ear images. This descriptor is quite robust to both ear rotationsand illumination changes. They assembled their own databases to evaluate the proposed scheme.The first data set A, contains 210 ear images from 70 subjects, with 3 samples for each subject: a)looking ahead (0◦ rotation), b) looking up (15◦ rotation) and c) looking up (30◦ rotation). Imageswere acquired over two sessions. The second data set B, also obtained over two sessions, contains
ACM Transactions on Embedded Computing Systems, Vol. 39, No. 3, Article xx, Publication date: September 2013.
xx:16 Abaza et al.
72 ear images from 36 subjects with 2 photos per subject looking up with a free rotation angle.Experimentally, they showed a marginally better rank-1 recognition rate (96%) compared to theEigenears algorithm (95%). Further, they showed that their technique had a rank-1 recognition rateof 88% for images obtained at 15◦ and 30◦ compared to a rate of 50% and 20% for the Eigenearsalgorithm.
5.5. Wavelet transformationSana and Gupta [2007] used a discrete Haar wavelet transform to extract the textural features of theear. The ear was first detected from a raw image using a template matching technique. Haar wavelettransform was then used to decompose the detected image and to compute coefficient matrices of thewavelet transforms which are clustered in its feature template. The matching score was calculatedusing the Hamming distance. They reported a recognition accuracy of 96% based on two database:600 subjects (3 images per subject) from the IITK database and 350 subjects from the Saugordatabase.
HaiLong and Mu [2009] used the low frequency sub-images, obtained by utilizing two-dimensional wavelet transform, and then extracted features by applying an orthogonal centroid al-gorithm. They used the USTB databases, and they did not mention the detection step. They reportedan average performance rate of 85.7% on the USTB database II (77 subjects) divided into fourgroups, and 97.2% on the USTB database IV (79 subjects), divided into 11 groups.
Nosrati et al. [2007] applied a 2D wavelet to the geometrically normalized (aligned) ear image.They used template matching for ear extraction, then they found three independent features in threedirections (Horizontal, Vertical and Diagonal). They combined these decomposed images to gen-erate a single feature matrix using the weighted sum. This technique allows one to consider thechanges in the ear images simultaneously along three basic directions. Finally they applied PCAto the feature matrix for dimensionality reduction and classification. They achieved a recognitionaccuracy of 90.5% and 95.05% on the USTB database and Carreira-Perpinan database, respectively.
Wang et al. [2008] used Haar wavelet transforms and uniform local binary patterns (ULBPs)to recognize ear images. First, ear images were manually segmented and decomposed by a Haarwavelet transform. Then ULBPs were combined simultaneously with block-based and multi-resolution methods to describe the texture features of ear sub-images transformed by the Haarwavelet. Finally, the texture features were classified into identities using the nearest neighbormethod. Using the USTB database IV (no mention of ear detection), they conducted several ex-periments combining ULBPs with the multi-resolution and block-based methods. They achieved arecognition rate of 100%, 92.41%, 62.66% and 42.41% for pose angles of 5◦, 20◦, 35◦, and 45◦,respectively.
Feng and Mu [2009] also combined local binary pattern (LBP) and wavelet transform. They usednon-uniform LBP8,1 operator, and evaluated the performance of various similarity measures andtwo matchers (K Nearest Neighbor and two-class Support Vector Machine). They used images fromUSTB database III (no mention of ear detection): 79 subjects - 10 images per subject at variousposes (0◦,5◦, 10◦, 15◦, 20◦).
5.6. Gabor filtersYaqubi et al. [2008] used a feature extraction method based on a set of Gabor filters followedby a maximization operation over multiple scales and positions. This method is motivated by aquantitative model of the visual cortex. Then they used Support Vector Machine (SVM) for earclassification. They obtained a recognition rate of 75% on a subset of the USTB ear database where180 ear images were manually extracted from 60 subjects.
Nanni and Lumini used a multi-matcher system, where each matcher was trained using featuresextracted from a single sub-window of the entire 2D image [Nanni and Lumini 2007; Nanni andLumini 2009a]. The ear was segmented using two landmarks. The features were extracted by theconvolution of each sub-window with a bank of Gabor Filters. Then their dimensionality was re-duced using Laplacian Eigen Maps. The best matchers, corresponding to the most discriminative
ACM Transactions on Embedded Computing Systems, Vol. 39, No. 3, Article xx, Publication date: September 2013.
A Survey on Ear Biometrics xx:17
Fig. 15. The SIFT key points matching
sub-windows, were selected by running Sequential Forward Floating Selection (SFFS). Experi-ments were carried out using 114 subjects from the UND database (collection E) and the sumrule was employed for fusing the selected sub-windows at the score level. They achieved a rank-1recognition rate of ∼ 84% and a rank-5 recognition rate of ∼ 93%; for verification experiments,the area under the ROC curve was ∼ 98.5% suggesting very good performance. Later Nanni andLumini [2009b] improved the performance of their ear matcher using score normalization. In or-der to discriminate between genuine and impostors, they trained a quadratic discriminant classifier.Their proposed normalization method overcomes the main drawback of the unconstrained cohortnormalization (UCN), as it does not need a large number of background models. Experimentally,they showed that for the ear modality, their proposed normalization and UCN reduces the EER from∼ 11.6% to ∼ 7.6%.
Watabe et al. [2008] extended the ideas from elastic graph matching and principal componentanalysis (PCA) . For ear representation, they used an “ear graph” whose vertices were labeled bythe Gabor jets of body of the antihelix, superior anti-helix crus, and inferior anti-helix crus. Theydeveloped a new ear detection algorithm, based on the notion of “jet space similarity,” which denotesthe similarity between Gabor jets and reconstructs jets obtained using PCA. They used 362 images,2 per person, from the XM2VTS database for performance evaluation. In a verification experiment,they reported a FRR of 4% and a FAR of 0.1%, which was approximately 5 times better than thePCA technique. Further, in an identification experiment, the rank-1 recognition rate for their methodwas 98% compared to 81% for the PCA technique.
Kumar and Zhang [2007] used Log-Gabor wavelets to extract the phase information, i.e. ear-codes, from the 1D gray-level signals. Thus each ear is represented by a unique ear code or(phase template). Then they compared the Hamming distance between the query ear images andthe database as a classifier. They reported about 90% recognition using 113 subjects from the UND,collection E, database (no mention of the detection step).
5.7. Scale Invariant Feature Transform (SIFT)Dewi and Yahagi [2006] used SIFT to generates approximately 16 key-points for each ear image.Using the Carreira-Perpinan database (segmented ear images) [Carreira-Perpinan 1995], they re-ported a recognition rate of 78.8%.
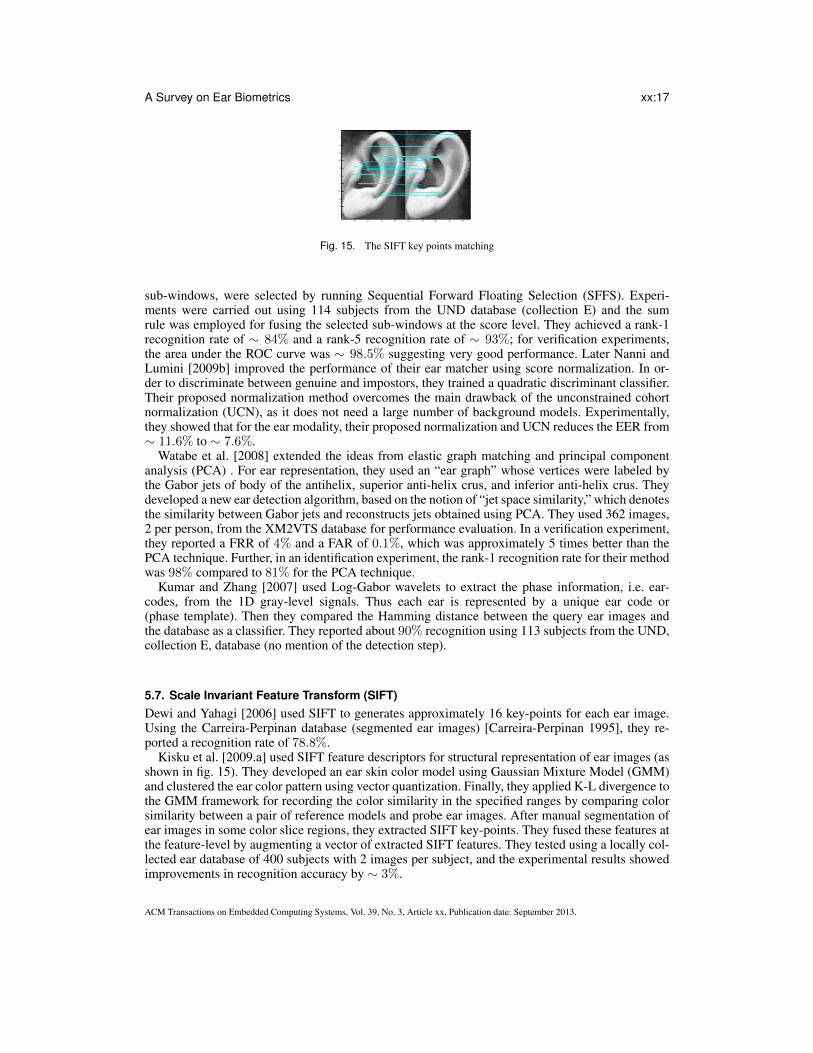
Kisku et al. [2009.a] used SIFT feature descriptors for structural representation of ear images (asshown in fig. 15). They developed an ear skin color model using Gaussian Mixture Model (GMM)and clustered the ear color pattern using vector quantization. Finally, they applied K-L divergence tothe GMM framework for recording the color similarity in the specified ranges by comparing colorsimilarity between a pair of reference models and probe ear images. After manual segmentation ofear images in some color slice regions, they extracted SIFT key-points. They fused these features atthe feature-level by augmenting a vector of extracted SIFT features. They tested using a locally col-lected ear database of 400 subjects with 2 images per subject, and the experimental results showedimprovements in recognition accuracy by ∼ 3%.
ACM Transactions on Embedded Computing Systems, Vol. 39, No. 3, Article xx, Publication date: September 2013.
xx:18 Abaza et al.
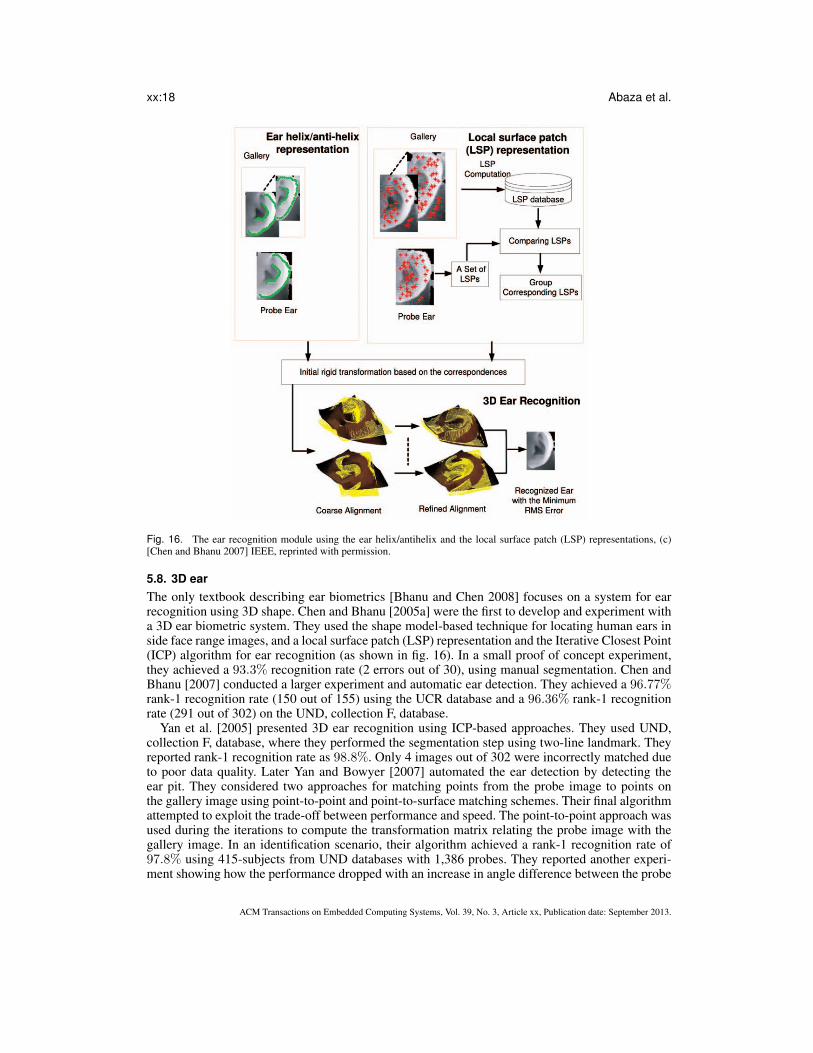
Fig. 16. The ear recognition module using the ear helix/antihelix and the local surface patch (LSP) representations, (c)[Chen and Bhanu 2007] IEEE, reprinted with permission.
5.8. 3D earThe only textbook describing ear biometrics [Bhanu and Chen 2008] focuses on a system for earrecognition using 3D shape. Chen and Bhanu [2005a] were the first to develop and experiment witha 3D ear biometric system. They used the shape model-based technique for locating human ears inside face range images, and a local surface patch (LSP) representation and the Iterative Closest Point(ICP) algorithm for ear recognition (as shown in fig. 16). In a small proof of concept experiment,they achieved a 93.3% recognition rate (2 errors out of 30), using manual segmentation. Chen andBhanu [2007] conducted a larger experiment and automatic ear detection. They achieved a 96.77%rank-1 recognition rate (150 out of 155) using the UCR database and a 96.36% rank-1 recognitionrate (291 out of 302) on the UND, collection F, database.
Yan et al. [2005] presented 3D ear recognition using ICP-based approaches. They used UND,collection F, database, where they performed the segmentation step using two-line landmark. Theyreported rank-1 recognition rate as 98.8%. Only 4 images out of 302 were incorrectly matched dueto poor data quality. Later Yan and Bowyer [2007] automated the ear detection by detecting theear pit. They considered two approaches for matching points from the probe image to points onthe gallery image using point-to-point and point-to-surface matching schemes. Their final algorithmattempted to exploit the trade-off between performance and speed. The point-to-point approach wasused during the iterations to compute the transformation matrix relating the probe image with thegallery image. In an identification scenario, their algorithm achieved a rank-1 recognition rate of97.8% using 415-subjects from UND databases with 1,386 probes. They reported another experi-ment showing how the performance dropped with an increase in angle difference between the probe
ACM Transactions on Embedded Computing Systems, Vol. 39, No. 3, Article xx, Publication date: September 2013.
A Survey on Ear Biometrics xx:19
and gallery. In [Yan and Bowyer 2006], they reported an experiment on a subset of users wearingear rings where the performance dropped to 94.2%.
Islam et al. [2008.a] used ICP to implement a fully automated 3D ear recognition system. Forthe detection, first they used 2D Haar-based ear detector, then they cropped the corresponding 3Dsegment. They used two subsets from the UND, collection F, database. The first subset consisted ofarbitrarily selected 200 profile images of 100 different subjects; while the second database consistedof 300 subjects. They achieved a rank-1 recognition rate of 93% using single-step ICP.
Passalis et al. [2007] used a generic annotated ear model (AEM) to register and fit each ear dataset. Only the 3D geometry that resides within a sphere of a certain radius that is centered roughlyon the ear pit, was automatically segmented. Then a compact biometric signature was extractedthat retains 3D information. The meta-data containing this information were stored using a regulargrid of lower dimension, allowing direct comparison. They used a database containing 1031 dataset representing 525 subjects: 830 data set representing 415 subjects from the UND database; and201 3D polygonal data set from 110 subjects. They achieved a recognition rate of 94.4% on thisheterogeneous database. According to the literature, computing the similarity score for the 830 datasets from the UND database, takes 276 hours on an average; while using their proposed method, ittook approximately 7 hours for enrollment and a few minutes for authentication.
Cadavid and Abdel-Mottaleb described a novel approach for 3D ear biometrics from surveillancevideos [Cadavid and AbdelMottaleb 2007; Cadavid and AbdelMottaleb 2008a]. First they automat-ically segment the ear region using template matching and they reconstructed 2.5D images usingthe Shape from Shading (SFS) scheme. The resulting 2.5D models are then registered using theIterative Closest Point (ICP) algorithm to calculate the similarity between the reference model andevery model in the reference database. Later Cadavid and AbdelMottaleb [2008b] used the mathe-matical morphology ear detection technique [HajSaid et al. 2008], and they reported a 95.0% rank-1recognition rate and 3.3% Equal Error Rate (EER) on the WVU database.
6. MULTIBIOMETRICS USING THE EAR MODALITYIn a multibiometric system, fusion can be accomplished at various levels [Ross et al. 2006]: fusionbefore matching (sensor and feature levels) and fusion after matching (match score, rank, and deci-sion levels). Combining the ear biometric with the face modality has tremendous practical potentialdue to the following reasons: (a) the ear is part of the face; (b) the ear can be acquired using thesame sensor as the face; and (c) the same type of feature extraction and matching algorithms can beused for both. Table III summarizes these multibiometric systems.
6.1. Frontal Face and EarVictor et al. [2002] and Chang et al. [2003] discussed multimodal recognition systems using the earand the face. They used the UND databases and reported a performance of 69.3% for face (PCA)and 72.7% for ear (PCA), in one experiment, compared to 90.9% for the multimodal system (PCAbased on fused face and ear images). There have been other experiments based on Eigenfaces andEigenears using different databases and other fusion rules:
(1) Darwish et al. [2009] fused the face and ear scores. They tested using 10 individuals (2 imageseach) from MIT, ORL (AT&T) and Yale databases, and reported an overall accuracy of 92.24%.
(2) Boodoo and Subramanian [2009] reported the same experiment using a database of 30 individ-uals (7 face and 7 ear images). They used 3 face and 3 ear images for testing. They consideredtwo levels of fusion. The first method combined 3 images of the same modality using majorityvoting, while the second method fused the output of the two modalities using the AND rule.They reported a recognition rate of 96%.
(3) Luciano and Krzyzak [2009] presented a relatively wide experiment, where they used 100 sub-jects from the FERET database and 114 from the UND database. They reported good perfor-mance using face as a single modality, but not for the ear. Using normalized weighted scores,
ACM Transactions on Embedded Computing Systems, Vol. 39, No. 3, Article xx, Publication date: September 2013.
xx:20 Abaza et al.
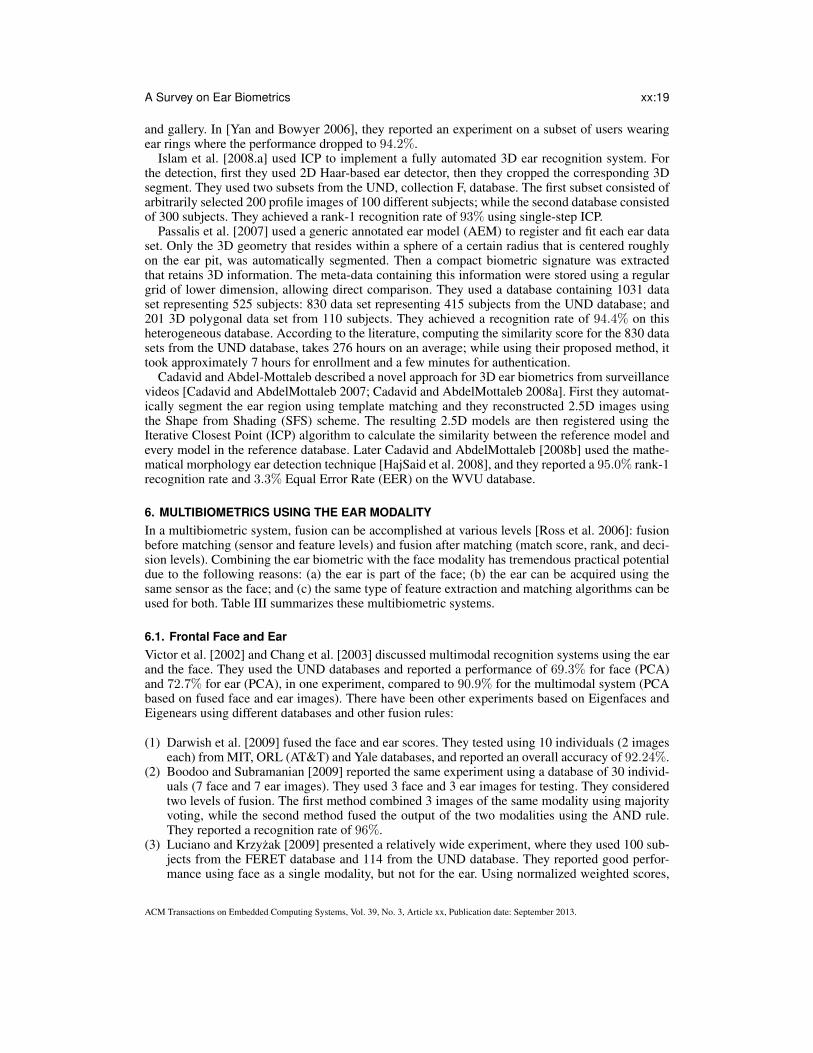
Table II. Various Ear Recognition Techniques, sub: number of subjects, EER: Equal ErrorRate, FRR: False Reject Rate and R1: Rank one identification rate; otherwise the accuracyis the recognition rate
Technique Database AccuracyIntensity-BasedPCA, Chang et al.[2003] UND, 114 sub 72.7%ICA, Zhang et al.[2005] Carreira Perpinan, 17 (×6)
and 60 (×3) sub 94.11%FSLDA, Yuan and Mu[2007] USTB, 79 (×7) sub 90%IDLLE, Xie and Mu[2008] USTB, 79 sub [−10◦ to 20◦] > 80%
and [0◦ to 10◦] > 90%NKDA, Zhang and Liu[2008] USTB, 60 sub R1 = 97.7%Sparse Representation, UND, 32 (×6) sub 96.88%Naseem et al.[2008] USTB, 56 (×5) sub 98.21%Force Field (FF)Hurley et al.[2005a] XM2VTS, 63 (×4) sub 99.2%FF then Contour extraction 29 (×2) subAbdelMottaleb and Zhou[2006] against 103 sub R1 = 87.93%FF then NKDFA USTB, pose 25◦ 75.3%Dong and Mu[2008] pose 30◦, 72.2%
and pose 45◦ 48.1%2D Curves GeometryChoras and Choras[2006] 102 images FRR=0-9.6%Fourier DescriptorAbate et al.[2006] 70 sub [0◦, 15◦, 30◦] R1=[96%, 88%, 88%]Wavelet TransformationSana and Gupta[2007] 600 and 350 (×3) sub ¿ 96%HaiLong and Mu[2009] USTB II, 77 sub 85.7%
USTB III, 79 sub 97.2%Nosrati et al.[2007] USTB 90.5%
Carreira Perpinan, 17 (×6) sub 95.05%Wang et al.[2008] USTB, [5◦, 20◦], [100%, 92.41%]
and [35◦, 45◦] [62.66%, 42.41%]Gabor FiltersYaqubi et al.[2008] USTB, 60 (×3) sub 75%Nanni and Lumini[2009a] UND, 114 sub R1=84%Gabor jets (EBGM)Watabe et al.[2008] XM2VTS, 181 (×2) sub R1=98%Log-Gabor WaveletsKumar and Zhang[2007] UND, 113 sub 90%SIFTKisku et al. [2009.a] 400 (×2) sub 96.93%Dewi and Yahagi[2006] Carreira Perpinan, 17(×6) sub 78.8%3D FeaturesYan et al.[2005] UND, 302 sub 98.8%Yan and Bowyer[2007] UND, 415 sub 97.8%Yan and Bowyer[2006] UND, sub wearing ear rings 94.2%3D local surface patch and ICPChen and Bhanu[2005a] UCR, 30 sub 93.3%Chen and Bhanu[2007] UCR, 155 and UND, 302 sub 96.8% and 96.4%Single step ICP,Islam et al.[2008.a] UND, 300 sub R1=93.98%AEM, Passalis et al.[2007] UND, 415 (×2) sub, 201 94.4%
3D polygonals from 110 sub plus Time Cut2.5D, SFS WVU, 402 galleries R1=95.0%Cadavid and AbdelMottaleb[2008b] and 60 probes EER=3.3%
ACM Transactions on Embedded Computing Systems, Vol. 39, No. 3, Article xx, Publication date: September 2013.

A Survey on Ear Biometrics xx:21
the best recognition rate of ∼ 99% was achieved using a weight in the range of (0.9 to 0.8)/(0.1to 0.2) for face/ear respectively.
Middendorff and Bowyer [2007] and Middendorff et al. [2007] presented an overview of combin-ing the frontal face and ear modalities, where they suggested several fusion methods for combining2D and 3D data.
Theoharis et al. [2008] used a unified approach that fused 3D facial and ear data. An annotateddeformable model was fitted to the data using ICP and Simulated Annealing (SA). Wavelet coef-ficients were computed from the geometry image and used as a biometric signature. The methodwas evaluated using the largest publicly available databases (FRGC v2 3D face database and thecorresponding ears from the UND database, collections F and G). They reported a 99.7% rank-1recognition rate but did not describe the fusion method.
Mahoor et al. [2009] used a multimodal 2.5D ear and 2D face biometric fused at the score level.For 2.5D ear recognition, a series of frames was extracted from a video clip. The ear segment ineach frame was independently reconstructed using the shape from shading method. Then variousear contours are extracted and registered using the iterative closest point algorithm. For 2D facerecognition, a set of facial landmarks were extracted from frontal facial images using active shapemodel. Then, the responses of facial images to a series of Gabor filters at the locations of faciallandmarks were calculated, and used for recognition. They used the WVU database and reported arank-1 identification rate of 81.67%, 95%, and 100% for face, ear and fusion, respectively.
Islam et al. [2009] fused 3D local features for ear and face at the score level, using the weightedsum rules. They used the FRGC v2 3D face database and the corresponding ears from the UNDdatabases, collections F and G, and achieved a rank-1 identification rate of 98.71% and a verificationrate of 99.68% (at 0.001 FAR) for neutral face expression. For other types of facial expressions, theyachieved 98.1% and 96.83% identification and verification rates, respectively.
Kisku et al. [2009.b] used Gabor filters to extract features of land marked images of face and ear.They used a locally collected database of 1600 images from 400 subjects. Also they used a syn-thesized database where the face frontal image were taken from BANCA database [BaillyBailliereet al. 2003], and the ear images from the Carreira-Perpinan database [Carreira-Perpinan 1995]. Theyfused the scores using Dempster-Shafer (DS) decision theory, and reported an overall accuracy of95.53%.
6.2. Face Profile and EarYuan et al. [2006.a] used face profile images that includes the ear (assuming fusion at the sensor/ data level) and applied a full space linear discriminant analysis (i.e., using eigenvectors corre-sponding to positive eigenvalues). They used the USTB database and achieved a recognition rate of96.2%.
Xu and Mu [2007b] used the same technique (full space linear discriminant analysis) for com-bining the face profile with the ear. They carried out decision fusion using the Product, Sum andMedian rules according to the Bayesian theory and a modified Vote rule for two classifiers. Theyused the USTB database [USTB 2005] and achieved a recognition rate of 97.62% using the sumand median rules compared to 94.05% for the ear alone and 88.10% for the face profile alone.
References [Pan et al. 2008; Xu et al. 2007] presented modified FDA technique by applyingkernels of the feature vectors. They fused the face profile and ear at the feature level (using average,product, and weighted-sum rules). They used the USTB database [USTB 2005] and achieved arecognition rate of 96.84% using the weighted-sum rule.
Xu and Mu [2007a] used kernel canonical correlation analysis (KCCA) for combining the faceprofile and the ear. They carried out decision fusion using the Weighted Sum rule, where the weightsare obtained by solving the corresponding Lagrangian. They used the 38 subjects from USTBdatabase and achieved a recognition rate of 98.68%.
ACM Transactions on Embedded Computing Systems, Vol. 39, No. 3, Article xx, Publication date: September 2013.

xx:22 Abaza et al.
Rahman and Ishikawa [2005] used the PCA technique to combine the face profile with the ear.They used a subset of 18 subjects (5 images each) from the UND database. They reported an iden-tification rate of 94.44%.
6.3. Face, Ear, and Third ModalityWoodard et al. [2006] proposed combining 3D face images with ear and finger surfaces using score-level fusion. They reported a 97% rank-1 recognition rate based on a sub-set of 85 subjects from theUND 3D databases.
Monwar and Gavrilova [2008] developed a multimodal biometric system that used face, ear andsignature features extracted by PCA or Fisher’s linear discriminant methods. The fusion is con-ducted at the rank level. The ranks of individual matchers were combined using the Borda countmethod, the Logistic regression method, or a modified Borda count method. To test this system,Monwar and Gavrilova used a chimeric database consisting of faces, ears and signatures. For theface database, they used the Olivetti Research Lab (ORL) Database [Samaria and Harter 1994],which contains 400 images, 10 each of 40 different subjects. For ear, they used Carreira-Perpinandatabase [Carreira-Perpinan 1995]. For signatures, they used 160 signatures with 8 signatures of20 individuals from the University of Rajshahi database [RUSign 2005]. Then those signatureswere scanned. The results indicated that fusing individual modalities, using weighted Borda countimproved the overall Equal Error Rate (ERR) to 9.76% compared to an average of 16.78% for in-dividual modalities. Later, Monwar and Gavrilova [2009] extended their experiment by includingmore data from the USTB database. For the signatures, also they used 500 signatures with 10 sig-natures of 50 individuals from Rajshahi database. They achieved an EER of 1.12 using the logisticregression rank fusion scheme.
6.4. Multi-algorithmic Ear RecognitionYan and Bowyer [2005b] used 2D PCA along with 3 different 3D ear recognition algorithms tocombine the evidence due to 2D and 3D ear images. They used the UND databases, collectionE, consisting of 1,884 (2D and 3D images) from 302 subjects. With the same database, using animproved ICP algorithm, they obtained a 98.7% rank-1 recognition rate by adopting a multi-instanceapproach on the 3D images.
Zhang and Mu [2008] extracted global features using the Kernel Principal Component Analysis(KPCA) technique and extracted local features using the Independent Component Analysis (ICA)technique. Then they established a correlation criterion function between two groups of featurevectors and extracted their canonical correlation features according to this criterion which could beviewed as fusion at the feature level. They tested using the USTB database and achieved a rank onerecognition rate of 55%, compared to 45% for the KPCA and 30% for the ICA alone.
Srinivas and Gupta [2009] used SIFT to extract the features from ear images at different posesand merged them according to a fusion rule in order to produce a single feature vector called thefused template. The similarity of SIFT features of the probe image and the enrolled user templatewas measured by their Euclidean distance. They collected 1060 images from 106 subjects. Theycaptured 2 images at each of the following poses for the right ear: [−40◦,−20◦,+0◦,+20◦,+40◦].The images obtained were normalized to a size of 648×486. For training, they used three images perperson for enrollment: images at poses [−40◦,+0◦and + 40◦]. They tested using the remaining 7images, and reported an accuracy of 95.32% for the fused template versus 88.33% for the non-fusedtemplate.
ArbabZavar and Nixon [2011] used a part-wise description model of the ear derived by a stochas-tic clustering on a set of scale invariant features of a training set . They further enhanced the per-formance of this guided model description by incorporating a wavelet-based ear recognition tech-nique [ArbabZavar and Nixon 2008]. This wavelet-based analysis aims to capture information inthe ear’s boundary structures, which can augment discriminant variability. They presented severalexperiments using a weighted sum of the normalized distances based on the guided model and thewavelet-based technique. They tested these methods using 458 images of 150 subjects from the
ACM Transactions on Embedded Computing Systems, Vol. 39, No. 3, Article xx, Publication date: September 2013.

A Survey on Ear Biometrics xx:23
Table III. Ear in Multibiometric systems, sub: different subjects, EER: Equal Error rate, R1:Rank one identification rate; otherwise the accuracy is the recognition rate
Multibiometrics Fusion Level/ Method Database AccuracyFace - earVictor et al.[2002]Chang et al.[2003] Image/ Data UND, 114 subj 90.9%Theoharis et al.[2008] N/A UND, F and G R1=99.7%Mahoor et al.[2009] Score/ weighted SUM WVU, 402 galleries
and 60 probes 100%Islam et al.[2009] Score/ weighted SUM UND, F and G R1=98.71%Kisku et al. [2009.b] Score/ Dempster Shafer IITK, 400 (×4) sub 95.53%Face profile - earYuan et al.[2006.a] Image/ Data USTB 96.2%Xu and Mu[2007b] Score/ SUM and MED USTB 97.62%Pan et al.[2008],and Xu et al.[2007] Feature/ weighted SUM USTB 96.84%Rahman and Ishikawa[2005] Decision/ “manual” UND, 18 sub 94.44%Xu et al.[2007] Feature/ weighted SUM USTB, 38 sub 98.68%Face - ear - 3 fingersWoodard et al.[2006] Score/ MIN UND, 85 sub R1=97%Face - ear - signatureMonwar and Gavrilova[2009] Rank/ Borda count USTB, and
and Logistic regression synthesized data EER=1.12%Ear - multiple algorithmsYan and Bowyer[2005b] Score/ weighted SUM UND, 302 sub R1=98.7%Zhang and Mu[2008] Feature/ Concatenation USTB, 79 sub R1=55%Srinivas and Gupta[2009] Feature/ Merge 106(×10) sub 95.32%ArbabZavar and Nixon[2011] Score weighted SUM XM2VTS, 150 sub 97.4%Left and right earsLu et al.[2006] N/A 56 (5 left, 5 right) sub R1=95.1%
XM2VTS database. They achieved a recognition rate of ∼ 97.4% compared to ∼ 89.1% for theguided model and ∼ 91.9% for the wavelet-based model.
6.5. Right Ear + Left EarLu et al. [2006] extracted ear shape features using Active Shape Models (ASMs). They modeledthe shape and local appearance of the ear in a statistical manner. In addition, steerable featureswere extracted from the ear image. Steerable features encode rich discriminant information of thelocal structural texture and provide guidance for shape location. The Eigenear shape technique wasused for final classification. Lu et al. [Lu et al. 2006] conducted a small experiment to demonstratehow fusion of the results of the two ears can enhance the results14. They collected 10 images eachfrom 56 individuals: 5 images for the left ear and 5 for the right ear, corresponding to 5 differentposes. The difference in angle between two adjacent poses was 5 degrees. They achieved a rank-1recognition rate of 95.1% via fusion versus 93.3% for the left ear or right ear alone.
7. OPEN RESEARCH AREASResearch in ear biometrics is beginning to move out of its infant stage [Hurley et al. 2007]. Whileearly research focused on ear recognition in constrained environments, the benefits of the ear bio-metric cannot be realized until the accompanying systems can work on large data sets in uncon-strained surveillance-like environments. This means a number of research areas are relatively lessexplored with respect to this biometric.
7.1. Hair occlusionWhen the ear is partially occluded by hair or other artifacts, then methods for ear recognition canbe severely impacted. Based on visual assessment of 200 occluded ear images from the FERET
14Lu et al. [Lu et al. 2006] did not provide details about the fusion level or method used.
ACM Transactions on Embedded Computing Systems, Vol. 39, No. 3, Article xx, Publication date: September 2013.
xx:24 Abaza et al.
Fig. 17. Ear Thermogram, (c) [Burge and Burger 2000] IEEE, reprinted with permission.
Fig. 18. (a) Example of occluded ears. (b) Splitting the ear image into three sub-regions. (c) [Yuan et al. 2006.b] IEEE,reprinted with permission
Fig. 19. Ear image is divided into sub-windows
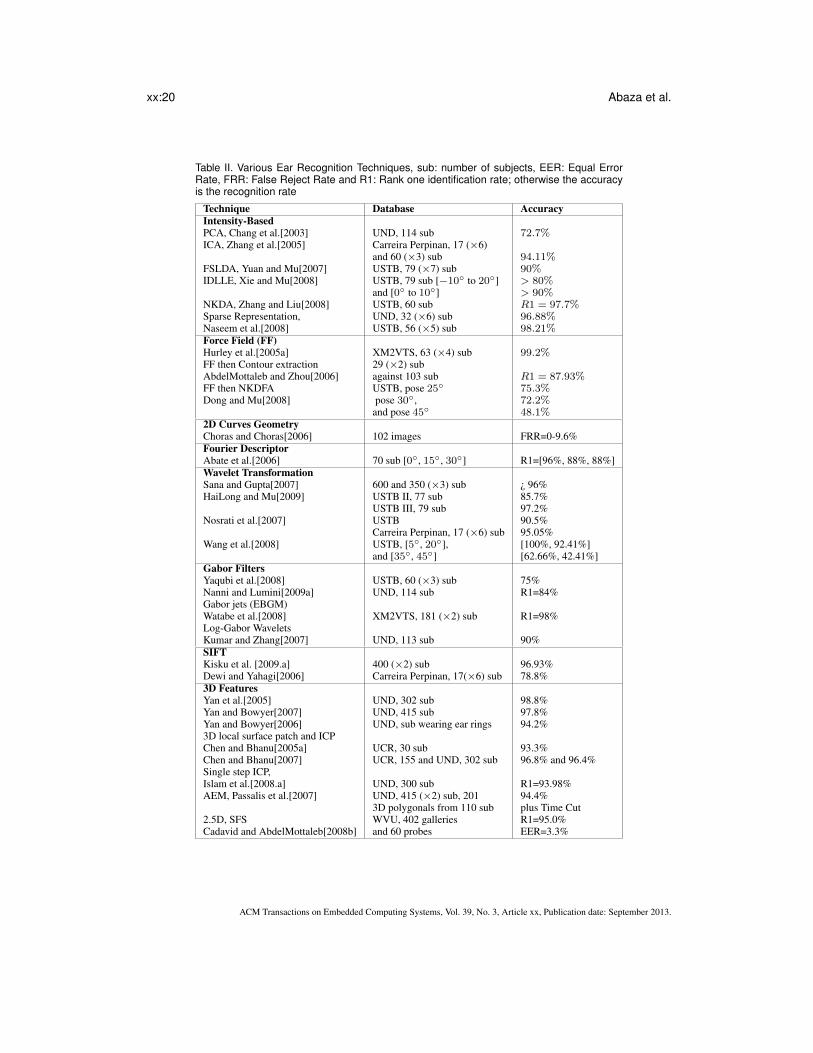
database, we determined that 81% of the hair occlusion is at the top of the ear, 17% from the side,and 2% at the bottom and other portions of the ear.
Burge and Burger [2000] suggested the use of thermogram images to detect occlusion due to hairand mask it out of the image. A thermogram image is one in which the surface heat of the subjectis used to form an image. Figure 17 is a thermogram of the external ear. The subject’s hair in thiscase has an ambient temperature between 27.2◦C and 29.7◦C, while the external anatomy of theear ranges from 30.0◦C to 37.2◦C. Removing the hair is accomplished by segmenting out the lowtemperature areas.
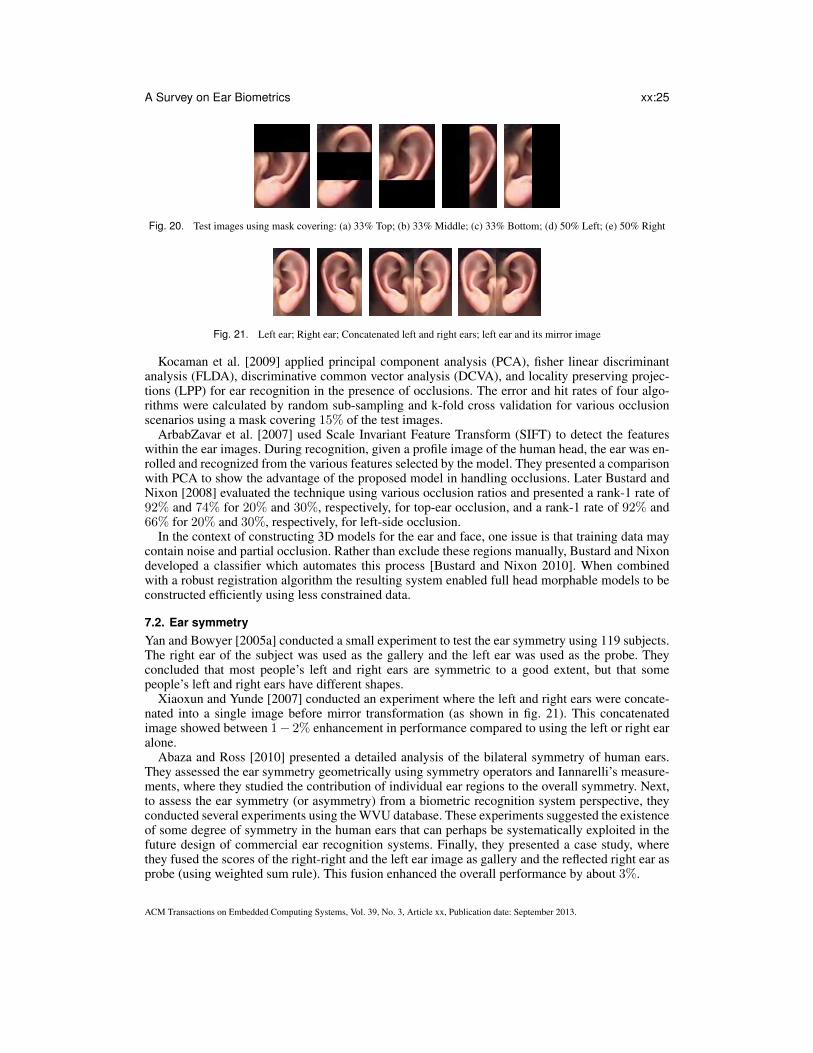
Yuan et al. [2006.b] proposed an Improved Non-Negative Matrix Factorization with sparsenessconstraints (INMFSC) by imposing an additional constraint on the objective function of NMFSC.This improvement can control the sparseness of both the basis vectors and the coefficient matrixsimultaneously. This proposed INMFSC was applied on normal images as well as partially occludedimages. Experiments showed that their enhanced technique yielded better performance even withpartially occluded images (as shown in fig. 18). Later Yuan et al. [2010] separated the normalizedear image into 28 sub-windows as shown in fig. 19. Then, they used Neighborhood PreservingEmbedding for feature extraction on each sub-window, and selected the most discriminative sub-windows according to the recognition rate. Finally, they applied weighted majority voting for fusionat the decision level. They evaluated images of the ear that were partially occluded at the top, middle,bottom, left, and right of the ear, respectively as shown in fig. 20.
ACM Transactions on Embedded Computing Systems, Vol. 39, No. 3, Article xx, Publication date: September 2013.
A Survey on Ear Biometrics xx:25
Fig. 20. Test images using mask covering: (a) 33% Top; (b) 33% Middle; (c) 33% Bottom; (d) 50% Left; (e) 50% Right
Fig. 21. Left ear; Right ear; Concatenated left and right ears; left ear and its mirror image
Kocaman et al. [2009] applied principal component analysis (PCA), fisher linear discriminantanalysis (FLDA), discriminative common vector analysis (DCVA), and locality preserving projec-tions (LPP) for ear recognition in the presence of occlusions. The error and hit rates of four algo-rithms were calculated by random sub-sampling and k-fold cross validation for various occlusionscenarios using a mask covering 15% of the test images.
ArbabZavar et al. [2007] used Scale Invariant Feature Transform (SIFT) to detect the featureswithin the ear images. During recognition, given a profile image of the human head, the ear was en-rolled and recognized from the various features selected by the model. They presented a comparisonwith PCA to show the advantage of the proposed model in handling occlusions. Later Bustard andNixon [2008] evaluated the technique using various occlusion ratios and presented a rank-1 rate of92% and 74% for 20% and 30%, respectively, for top-ear occlusion, and a rank-1 rate of 92% and66% for 20% and 30%, respectively, for left-side occlusion.
In the context of constructing 3D models for the ear and face, one issue is that training data maycontain noise and partial occlusion. Rather than exclude these regions manually, Bustard and Nixondeveloped a classifier which automates this process [Bustard and Nixon 2010]. When combinedwith a robust registration algorithm the resulting system enabled full head morphable models to beconstructed efficiently using less constrained data.
7.2. Ear symmetryYan and Bowyer [2005a] conducted a small experiment to test the ear symmetry using 119 subjects.The right ear of the subject was used as the gallery and the left ear was used as the probe. Theyconcluded that most people’s left and right ears are symmetric to a good extent, but that somepeople’s left and right ears have different shapes.
Xiaoxun and Yunde [2007] conducted an experiment where the left and right ears were concate-nated into a single image before mirror transformation (as shown in fig. 21). This concatenatedimage showed between 1− 2% enhancement in performance compared to using the left or right earalone.
Abaza and Ross [2010] presented a detailed analysis of the bilateral symmetry of human ears.They assessed the ear symmetry geometrically using symmetry operators and Iannarelli’s measure-ments, where they studied the contribution of individual ear regions to the overall symmetry. Next,to assess the ear symmetry (or asymmetry) from a biometric recognition system perspective, theyconducted several experiments using the WVU database. These experiments suggested the existenceof some degree of symmetry in the human ears that can perhaps be systematically exploited in thefuture design of commercial ear recognition systems. Finally, they presented a case study, wherethey fused the scores of the right-right and the left ear image as gallery and the reflected right ear asprobe (using weighted sum rule). This fusion enhanced the overall performance by about 3%.
ACM Transactions on Embedded Computing Systems, Vol. 39, No. 3, Article xx, Publication date: September 2013.
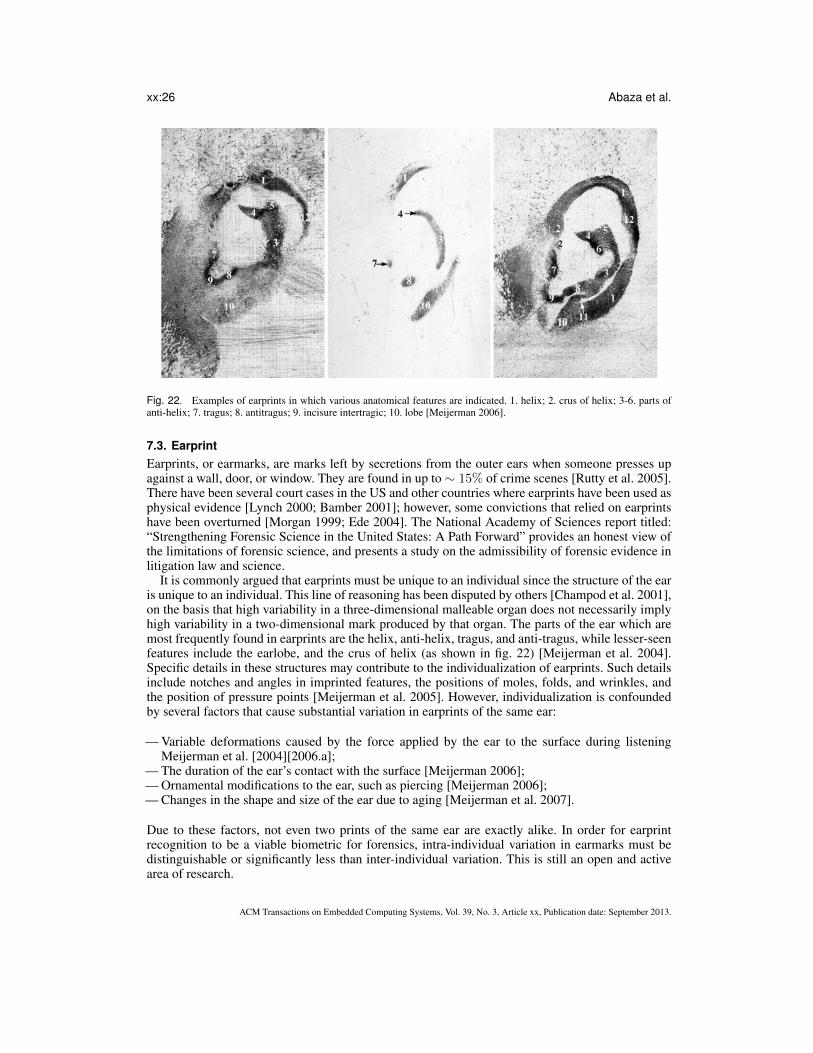
xx:26 Abaza et al.
Fig. 22. Examples of earprints in which various anatomical features are indicated. 1. helix; 2. crus of helix; 3-6. parts ofanti-helix; 7. tragus; 8. antitragus; 9. incisure intertragic; 10. lobe [Meijerman 2006].
7.3. EarprintEarprints, or earmarks, are marks left by secretions from the outer ears when someone presses upagainst a wall, door, or window. They are found in up to ∼ 15% of crime scenes [Rutty et al. 2005].There have been several court cases in the US and other countries where earprints have been used asphysical evidence [Lynch 2000; Bamber 2001]; however, some convictions that relied on earprintshave been overturned [Morgan 1999; Ede 2004]. The National Academy of Sciences report titled:“Strengthening Forensic Science in the United States: A Path Forward” provides an honest view ofthe limitations of forensic science, and presents a study on the admissibility of forensic evidence inlitigation law and science.
It is commonly argued that earprints must be unique to an individual since the structure of the earis unique to an individual. This line of reasoning has been disputed by others [Champod et al. 2001],on the basis that high variability in a three-dimensional malleable organ does not necessarily implyhigh variability in a two-dimensional mark produced by that organ. The parts of the ear which aremost frequently found in earprints are the helix, anti-helix, tragus, and anti-tragus, while lesser-seenfeatures include the earlobe, and the crus of helix (as shown in fig. 22) [Meijerman et al. 2004].Specific details in these structures may contribute to the individualization of earprints. Such detailsinclude notches and angles in imprinted features, the positions of moles, folds, and wrinkles, andthe position of pressure points [Meijerman et al. 2005]. However, individualization is confoundedby several factors that cause substantial variation in earprints of the same ear:
— Variable deformations caused by the force applied by the ear to the surface during listeningMeijerman et al. [2004][2006.a];
— The duration of the ear’s contact with the surface [Meijerman 2006];— Ornamental modifications to the ear, such as piercing [Meijerman 2006];— Changes in the shape and size of the ear due to aging [Meijerman et al. 2007].
Due to these factors, not even two prints of the same ear are exactly alike. In order for earprintrecognition to be a viable biometric for forensics, intra-individual variation in earmarks must bedistinguishable or significantly less than inter-individual variation. This is still an open and activearea of research.
ACM Transactions on Embedded Computing Systems, Vol. 39, No. 3, Article xx, Publication date: September 2013.
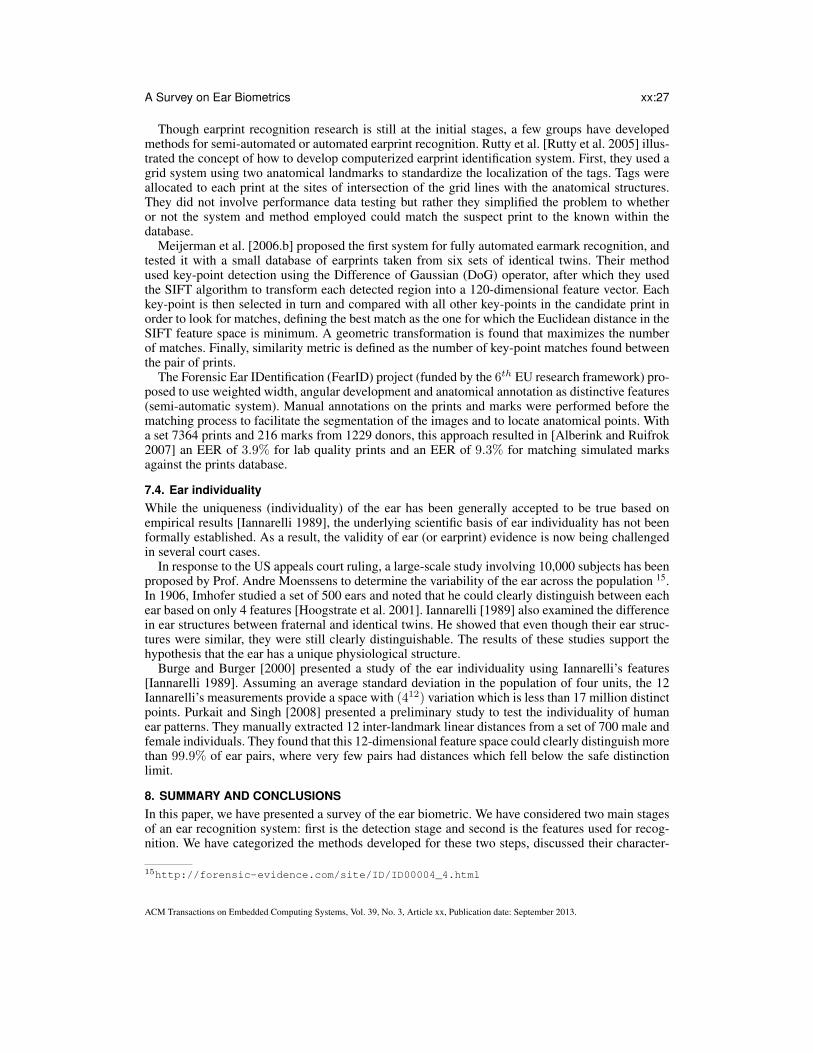
A Survey on Ear Biometrics xx:27
Though earprint recognition research is still at the initial stages, a few groups have developedmethods for semi-automated or automated earprint recognition. Rutty et al. [Rutty et al. 2005] illus-trated the concept of how to develop computerized earprint identification system. First, they used agrid system using two anatomical landmarks to standardize the localization of the tags. Tags wereallocated to each print at the sites of intersection of the grid lines with the anatomical structures.They did not involve performance data testing but rather they simplified the problem to whetheror not the system and method employed could match the suspect print to the known within thedatabase.
Meijerman et al. [2006.b] proposed the first system for fully automated earmark recognition, andtested it with a small database of earprints taken from six sets of identical twins. Their methodused key-point detection using the Difference of Gaussian (DoG) operator, after which they usedthe SIFT algorithm to transform each detected region into a 120-dimensional feature vector. Eachkey-point is then selected in turn and compared with all other key-points in the candidate print inorder to look for matches, defining the best match as the one for which the Euclidean distance in theSIFT feature space is minimum. A geometric transformation is found that maximizes the numberof matches. Finally, similarity metric is defined as the number of key-point matches found betweenthe pair of prints.
The Forensic Ear IDentification (FearID) project (funded by the 6th EU research framework) pro-posed to use weighted width, angular development and anatomical annotation as distinctive features(semi-automatic system). Manual annotations on the prints and marks were performed before thematching process to facilitate the segmentation of the images and to locate anatomical points. Witha set 7364 prints and 216 marks from 1229 donors, this approach resulted in [Alberink and Ruifrok2007] an EER of 3.9% for lab quality prints and an EER of 9.3% for matching simulated marksagainst the prints database.
7.4. Ear individualityWhile the uniqueness (individuality) of the ear has been generally accepted to be true based onempirical results [Iannarelli 1989], the underlying scientific basis of ear individuality has not beenformally established. As a result, the validity of ear (or earprint) evidence is now being challengedin several court cases.
In response to the US appeals court ruling, a large-scale study involving 10,000 subjects has beenproposed by Prof. Andre Moenssens to determine the variability of the ear across the population 15.In 1906, Imhofer studied a set of 500 ears and noted that he could clearly distinguish between eachear based on only 4 features [Hoogstrate et al. 2001]. Iannarelli [1989] also examined the differencein ear structures between fraternal and identical twins. He showed that even though their ear struc-tures were similar, they were still clearly distinguishable. The results of these studies support thehypothesis that the ear has a unique physiological structure.
Burge and Burger [2000] presented a study of the ear individuality using Iannarelli’s features[Iannarelli 1989]. Assuming an average standard deviation in the population of four units, the 12Iannarelli’s measurements provide a space with (412) variation which is less than 17 million distinctpoints. Purkait and Singh [2008] presented a preliminary study to test the individuality of humanear patterns. They manually extracted 12 inter-landmark linear distances from a set of 700 male andfemale individuals. They found that this 12-dimensional feature space could clearly distinguish morethan 99.9% of ear pairs, where very few pairs had distances which fell below the safe distinctionlimit.
8. SUMMARY AND CONCLUSIONSIn this paper, we have presented a survey of the ear biometric. We have considered two main stagesof an ear recognition system: first is the detection stage and second is the features used for recog-nition. We have categorized the methods developed for these two steps, discussed their character-
15http://forensic-evidence.com/site/ID/ID00004_4.html
ACM Transactions on Embedded Computing Systems, Vol. 39, No. 3, Article xx, Publication date: September 2013.

xx:28 Abaza et al.
istics, and reported their performance. Even though current ear detection and recognition systemshave reached a certain level of maturity, their success is limited to controlled indoor conditions. Forexample, to the best of our knowledge, ear biometrics have yet to be tested outdoors. In addition tovariation in illumination, other open research problems include occlusion due to hair; ear symmetry;earprint forensics; ear classification; and ear individuality.
For any researcher who wants to start working on ear biometrics, we have presented a systematicdiscussion that includes available databases, detection and feature extraction techniques, as well as asurvey of some unsolved ear recognition problems. The benefits of ear recognition is yet to be fullyrealized and we anticipate an extensive use of this biometric in next generation face recognitionsystems.
ACKNOWLEDGMENTS
Abaza, Herbert and Harrison were supported by ONR under Contract to WVHTF No. N00014-09-C-0388. Ross was sup-ported by NSF CAREER Grant No. IIS 0642554.
REFERENCESABATE, A., NAPPI, M., RICCIO, D., AND RICCIARDI, S. 2006. Ear recognition by means of a rotation invariant descriptor.
In Proc. of the 18th IEEE International Conference on Pattern Recognition ICPR. Hong Kong, China, 437–440.ABAZA, A. 2008. High performance image processing techniques in automated identification systems. Ph.D. thesis, West
Virginia University, Morgantown-WV, USA.ABAZA, A., HEBERT, C., AND HARRISON, M. F. 2010. Fast learning ear detection for real-time surveillance. In Proc. of
the IEEE conference on Biometrics: Theory, Applications, and Systems BTAS. Washington-DC, USA.ABAZA, A. AND ROSS, A. 2010. Towards understanding the symmetry of human ears: A biometric perspective. In Proc. of
the IEEE conference on Biometrics: Theory, Applications, and Systems BTAS. Washington-DC, USA.ABDELMOTTALEB, M. AND ZHOU, J. 2006. Human ear recognition from face profile images. In Proc. of the 2nd Interna-
tional Conference on Biometrics ICB. Hong Kong, China, 786–792.ALBERINK, I. AND RUIFROK, A. 2007. Performance of the FearID earprint identification system. Forensic science interna-
tional 166, 145–154.ALVAREZ, L., GONZALEZ, E., AND MAZORRA, L. 2005. Fitting ear contour using an ovoid model. In Proc. of the IEEE
International Carnahan Conference on Security Technology. Las Palmas, Spain, 145–148.ANSARI, S. AND GUPTA, P. 2007. Localization of ear using outer helix curve of the ear. In Proc. of the IEEE International
Conference on Computing: Theory and Applications. Barcelona, Spain, 688–692.ARBABZAVAR, B. AND NIXON, M. 2007. On shape-mediated enrolment in ear biometrics. In Proc. of the International
Symposium on Visual Computing ISVC. Washington-DC, USA, II: 549–558.ARBABZAVAR, B. AND NIXON, M. 2008. Robust log-gabor filter for ear biometrics. In Proc. of the 18th IEEE International
Conference on Pattern Recognition ICPR. Tampa-FL, USA.ARBABZAVAR, B. AND NIXON, M. 2011. On guided model-based analysis for ear biometrics. Computer Vision and Image
Understanding 115, 74, 487–502.ARBABZAVAR, B., NIXON, M., AND HURLEY, D. 2007. On model-based analysis of ear biometrics. In Proc. of the IEEE
conference on Biometrics: Theory, Applications, and Systems BTAS. Washington, DC, USA.BAILLYBAILLIERE, E., BENGIO, S., BIMBOT, F., HAMOUZ, M., KITTLER, J., MARIETHOZ, J., MATAS, J., MESSER,
K., POPOVICI, V., POREE, F., RUIZ, B., AND THIRAN, J.-P. 2003. The BANCA database and evaluation protocol.In Proc. of the 4th International Conference on Audio- and Video-Based Biometric Person Authentication. Vol. 2688.Guildford, UK, 625–638.
BAMBER, D. 2001. Prisoners to appeal as unique ’earprint’ evidence is discredited. Telegraph Newspaper(UK), online at: http://www.telegraph.co.uk/news/uknews/1364060/Prisoners-to-appeal-as-unique-earprint-evidence-is-discredited.html.
BERTILLON, A. 1896. Signaletic Instructions Including: The Theory and Practice of Anthropometrical Identification. R.W.McClaughry translation, The Werner Company.
BHANU, B. AND CHEN, H. 2008. Human Ear Recognition by Computer 1st Edition Ed. Springer.BOODOO, N. B. AND SUBRAMANIAN, R. K. 2009. Robust multibiometric recognition using face and ear images. Interna-
tional Journal of Computer Science and Information Security (IJCSIS) 6, 2.BURGE, M. AND BURGER, W. 1997. Ear biometrics for machine vision. In Proc. of the 21th Workshop of the Austrian
Association for Pattern Recognition. Hallstatt, Upper Austria.
ACM Transactions on Embedded Computing Systems, Vol. 39, No. 3, Article xx, Publication date: September 2013.

A Survey on Ear Biometrics xx:29
BURGE, M. AND BURGER, W. 2000. Ear biometrics in computer vision. In Proc. of the 15th IEEE International Conferenceon Pattern Recognition ICPR. Barcelona, Spain, 826–830.
BUSTARD, J. AND NIXON, M. 2008. Robust 2D ear registration and recognition based on SIFT point matching. In Proc. ofthe IEEE conference on Biometrics: Theory, Applications, and Systems BTAS. Washington, DC, USA.
BUSTARD, J. AND NIXON, M. 2010. 3D morphable model construction for robust ear and face recognition. In Proc. of theIEEE Conference on Computer Vision and Patern Recognition (CVPR). San Francisco-CA, USA.
CADAVID, S. AND ABDELMOTTALEB, M. 2007. Human identification based on 3D ear models. In Proc. of the 1st IEEEInternational Conference on Biometrics: Theory, Applications, and Systems BTAS. Washington-DC, USA, 1–6.
CADAVID, S. AND ABDELMOTTALEB, M. 2008a. 3D ear modeling and recognition from video sequences using shape fromshading. In Proc. of the 19th IEEE International Conference on Pattern Recognition ICPR. Tampa-FL, USA, 1–4.
CADAVID, S. AND ABDELMOTTALEB, M. 2008b. 3D ear modeling and recognition from video sequences using shape fromshading. IEEE Transactions on Information Forensics and Security 3, 4, 709–718.
CARREIRA-PERPINAN. 1995. Compression neural networks for feature extraction: Application to human recognition fromear images. M.S. thesis, Faculty of Informatics, Technical University of Madrid, Spain.
CHAMPOD, C., EVETT, I., AND KUCHLER, B. 2001. Earmarks as evidence: A critical review. Forensic Science 46, 6,1275–1284.
CHANG, K., BOWYER, K., SARKAR, S., AND VICTOR, B. 2003. Comparison and combination of ear and face images inappearance-based biometrics. IEEE Transactions on Pattern Analysis and Machine Intelligence 25, 1160–1165.
CHEN, H. AND BHANU, B. 2004. Human ear detection from side face range images. In Proc. of the IEEE InternationalConference on Pattern Recognition ICPR. Cambridge, UK, 574–577.
CHEN, H. AND BHANU, B. 2005a. Contour matching for 3D ear recognition. In Proc. of the IEEE Workshops on Applicationof Computer Vision WACV. Breckenridge-CO, USA, 123–128.
CHEN, H. AND BHANU, B. 2005b. Shape model-based 3D ear detection from side face range images. In Proc. of the IEEEConference on Computer Vision and Pattern Recognition CVPR. Washington-DC, USA, 122–127.
CHEN, H. AND BHANU, B. 2007. Human ear recognition in 3D. IEEE Transaction on Pattern Analysis and MachineIntelligence 29, 4, 718–737.
CHORAS, M. 2004. Human ear identification based on image analysis. In Proc. of the 7th IEEE International Conferenceon Artificial Intelligence and Soft Computing ICAISC. Zakopane, Poland.
CHORAS, M. 2005. Ear biometrics based on geometrical feature extraction. Electronic Letters on Computer Vision andImage Analysis ELCVIA 5, 3, 84–95.
CHORAS, M. 2007. Image feature extraction methods for ear biometrics – a survey. In Proc. of the 6th IEEE InternationalConference on Computer Information Systems and Industrial Management Applications. Minneapolis-MN, USA, 261–265.
CHORAS, M. AND CHORAS, R. 2006. Geometrical algorithms of ear contour shape representation and feature extraction.In Proc. of the 6th IEEE International Conference on Intelligent Systems Design and Applications ISDA. Jinan, China.
CUMMINGS, A., NIXON, M., AND CARTER, J. 2010. A novel ray analogy for enrollment of ear biometrics. In Proc. of theIEEE conference on Biometrics: Theory, Applications, and Systems BTAS. Washington-DC, USA.
DARWISH, A. A., ABDELGHAFAR, R., AND ALI, A. F. 2009. Multimodal face and ear images. Journal of ComputerScience 5, 5, 374–379.
DEWI, K. AND YAHAGI, T. 2006. Ear photo recognition using scale invariant keypoints. In Proc. of the InternationalComputational Intelligence Conference. San Francisco-CA, USA, 253–258.
DONG, J. AND MU, Z. 2008. Multi-pose ear recognition based on force field transformation. In Proc. of the 2nd IEEEInternational Symposium on Intelligent Information Technology Application. 771–775.
EDE, R. 2004. Wrongful convictions put forensic science in the dock. The Times (London) February 3.FAHMY, G., ELSHERBEENY, A., MANDALA, S., ABDELMOTTALEB, M., AND AMMAR, H. 2006. The effect of lighting
direction/condition on the performance of face recognition algorithms. In Proc. of the SPIE Conference on HumanIdentification. Orlando-FL, USA.
FENG, J. AND MU, Z. 2009. Texture analysis for ear recognition using local feature descriptor and transform filter. M. Ding,B. Bhanu, F. Wahl, and J. Roberts, Eds. MIPPR 2009: Pattern Recognition and Computer Vision 7496, 1, 74962P.
FERET. 2003. Color FERET database. available at:http : //face.nist.gov/colorferet/.
FIELDS, C., FALLS, H. C., WARREN, C. P., AND ZIMBEROFF, M. 1960. The ear of newborn as an identification constant.Obstetrics and Gynecology 16, 98–102.
GAO, W., CAO, B., SHAN, S., CHEN, X., ZHOU, D., ZHANG, X., AND ZHAO, D. 2008. CAS-PEAL the cas-peal large-scale chinese face database and baseline evaluations. IEEE Transactions on Systems, Man, and Cybernetics-Part A:Systems and Humans 38, 1, 149 – 161.
ACM Transactions on Embedded Computing Systems, Vol. 39, No. 3, Article xx, Publication date: September 2013.

xx:30 Abaza et al.
GAO, W., CAO, B., SHAN, S., ZHOU, D., ZHANG, X., AND ZHAO, D. 2004. CAS-PEAL. online at:http : //www.jdl.ac.cn/peal/home.htm.
GRAHAM, D. AND ALLISON, N. 1998. Face Recognition: from Theory to Applications. Springer, Chapter Characterizingvirtual eigen-signatures for general purpose face recognition, 446–456.
HAILONG, Z. AND MU, Z. 2009. Combining wavelet transform and orthogonal centroid algorithm for ear recognition. InProc. of the 2nd IEEE International Conference on Computer Science and Information Technology. Beijing, China.
HAJSAID, E., ABAZA, A., AND AMMAR, H. 2008. Ear segmentation in color facial images using mathematical morphology.In Proc. of the 6th IEEE Biometric Consortium Conference BCC. Tampa-FL, USA.
HOOGSTRATE, A., VANDEN HEUVEL, H., AND HUYBEN, E. 2001. Ear identification based on surveillance camera images.Science and Justice 41, 3, 167–172.
HURLEY, D., ARBABZAVAR, B., AND NIXON, M. 2007. Handbook of Biometrics. Springer, Chapter 7 The Ear as a Bio-metric, 131–150.
HURLEY, D., NIXON, M., AND CARTER, J. 2000. Automatic ear recognition by force field transformations. In Proc. of theIEE Colloquium on Visual Biometrics. 7/1–7/5.
HURLEY, D., NIXON, M., AND CARTER, J. 2005a. Ear biometrics by force field convergence. In Proc. of the 5th In-ternational Conference on Audio- and Video-Based Biometric Person Authentication AVBPA. Rye Brook-NY, USA,386–394.
HURLEY, D., NIXON, M., AND CARTER, J. 2005b. Force field feature extraction for ear biometrics. Computer Vision andImage Understanding 98, 3, 491–512.
IANNARELLI, A. 1989. Ear Identification, Forensic Identification Series. Paramount Publishing Company, Fremont, Cali-fornia.
ISLAM, S., BENNAMOUN, M., AND DAVIES, R. 2008. a. Fast and fully automatic ear detection using cascaded adaboost.In Proc. of the IEEE Workshop on Applications of Computer Vision. Copper Mountain-CO, USA, 1–6.
ISLAM, S., BENNAMOUN, M., MIAN, A., AND DAVIES, R. 2008. b. A fully automatic approach for human recognition fromprofile images using 2D and 3D ear data. In Proc. of 4th International Symposium on 3D Data Processing Visualizationand Transmission. Atlanta-GA, USA.
ISLAM, S., BENNAMOUN, M., MIAN, A., AND DAVIES, R. 2009. Score level fusion of ear and face local 3D features forfast and expression-invariant human recognition. In Proc. of the 6th International Conference on Image Analysis andRecognition. Berlin, Heidelberg, 387–396.
ISLAM, S., BENNAMOUN, M., OWENS, R., AND DAVIES, R. 2007. Biometric approaches of 2D-3D ear and face: A survey.In Advances in Computer and Information Sciences and Engineering, T. Sobhed., Springer Netherlands. 509–514.
JAIN, A., ROSS, A., AND PRABHAKAR, S. 2004. An introduction to biometric recognition. IEEE Transactions on Circuitsand Systems for Video Technology 14, 1, 4–20.
KISKU, D. R., GUPTA, P., MEHROTRA, H., AND SING, J. K. 2009. b. Multimodal belief fusion for face and ear biometrics.Intelligence Information Management (on-line) 1, 3.
KISKU, D. R., MEHROTRA, H., GUPTA, P., AND SING, J. K. 2009. a. SIFT-based ear recognition by fusion of detected key-points from color similarity slice regions. In Proc. of the IEEE International Conference on Advances in ComputationalTools for Engineering Applications ACTEA. Zouk Mosbeh, Lebanon, 380–385.
KOCAMAN, B., KIRCI, M., GUNES, E. O., CAKIR, Y., AND OZBUDAK, O. 2009. On ear biometrics. In Proc. of the IEEERegion 8 Conference EUROCON. Saint-Petersburg, Russia.
KUMAR, A. AND ZHANG, D. 2007. Ear authentication using log-gabor wavelets. In SPIE Defence and Security Symposium.Vol. 6539. Orlando-FL, USA.
LAMMI, H. 2004. Ear biometrics. Tech. rep., Lappeenranta University of Technology.LU, L., ZHANG, X., ZHAO, Y., AND JIA, Y. 2006. Ear recognition based on statistical shape model. In Proc. of the 1st
IEEE International Conference on Innovative Computing, Information and Control. Washington-DC, USA, 353–356.LUCIANO, L. AND KRZYZAK, A. 2009. Automated multimodal biometrics using face and ear. In Proc. of the 6th Interna-
tional Conference on Image Analysis and Recognition (ICIAR). Halifax, Canada, 451–460.LYNCH, C. 2000. Ear-prints provide evidence in court. Glasgow University News.MAHOOR, M., CADAVID, S., AND ABDELMOTTALEB, M. 2009. Multimodal ear and face modeling and recognition. In
Proc. of the IEEE International Conference on Image Processing ICIP. Cairo, Egypt.MEIJERMAN, L. 2006. Inter- and intra individual variation in earprints. Ph.D. thesis, University Leiden.MEIJERMAN, L., NAGELKERKE, N., VAN BASTEN, R., VANDER LUGT, C., DECONTI, F., DRUSINI, A., GIACON, M.,
SHOLL, S., VANEZIS, P., AND MAAT, G. 2006. a. Inter- and Intra-individual variation in applied force when listeningat a surface, and resulting variation in earprints. Medicine, Science, and the Law 46, 141–151.
MEIJERMAN, L., SHOLL, S., DECONTI, F., GIACON, M., VANDER LUGT, C., DRUSINI, A., VANEZIS, P., AND MAAT, G.2004. Exploratory study on classification and individualization of earprints. Forensic Science International 140, 91–99.
ACM Transactions on Embedded Computing Systems, Vol. 39, No. 3, Article xx, Publication date: September 2013.

A Survey on Ear Biometrics xx:31
MEIJERMAN, L., THEAN, A., AND MAAT, G. 2005. Earprints in forensic investigations. Forensic Science, Medicine, andPathology 1, 4, 247–256.
MEIJERMAN, L., THEAN, A., VANDER LUGT, C., VAN MUNSTER, R., VAN ANTWERPEN, G., AND MAAT, G. 2006. b.Individualization of earprints: Variation in prints of monozygotic twins. Forensic Science, Medicine, and Pathology 2, 1,39–49.
MEIJERMAN, L., VANDER LUGT, C., AND MAAT, G. 2007. Cross-sectional anthropometric study of the external ear. Foren-sic Science 52, 286–293.
MESSER, K., MATAS, J., KITTLER, J., LUETTIN, J., AND MAITRE, G. 1999. XM2VTSDB: The extended M2VTSdatabase. In Proc. of the 2nd International Conference on Audio and Video-based Biometric Person Authentication.Washington-DC, USA.
MID. 1994. NIST mugshot identification database. available at:http : //www.nist.gov/srd/nistsd18.cfm.
MIDDENDORFF, C. AND BOWYER, K. 2007. Handbook of Biometrics. Springer, Chapter 16 Multibiometrics Using Faceand Ear, 315–334.
MIDDENDORFF, C., BOWYER, K. W., AND YAN, P. 2007. Multimodal Surveillance: Sensors, Algorithms and Systems.Artech House, Boston, Chapter 8 Multimodal biometrics involving the human ear, 177–190.
MONWAR, M. M. AND GAVRILOVA, M. 2008. FES: a system for combining face, ear and signature biometrics using ranklevel fusion. In Proc. of the 3rd IEEE International Conference on Information Technology: New Generations. LasVegas-NV, USA, 922–927.
MONWAR, M. M. AND GAVRILOVA, M. 2009. Multimodal biometric system using rank-level fusion approach. IEEE Trans-actions on Systems, Man, and Cybernetics-Part B: Cybernetics 39, 4.
MORENO, B., SANCHEZ, A., AND VELEZ, J. 1999. On the use of outer ear images for personal identification in securityapplications. In Proc. of the 33rd IEEE International Conference on Security Technology. Madrid, Spain, 469–476.
MORGAN, J. 1999. State v. Kunze, court of appeals of washington, division 2. 97 Wash.App. 832, 988 p.2d 977. http ://www.forensic− evidence.com/site/ID/ID Kunze.html.
MU, Z., YUAN, L., XU, Z., XI, D., AND QI, S. 2004. Shape and structural feature based ear recognition. In Proc. of the5th Chinese Conference on Biometric Recognition. Guangzhou, China, 663–670.
NANNI, L. AND LUMINI, A. 2007. A multi-matcher for ear authentication. Pattern Recognition Letter 28, 16, 2219–2226.NANNI, L. AND LUMINI, A. 2009a. Fusion of color spaces for ear authentication. Pattern Recognition 42, 9, 1906–1913.NANNI, L. AND LUMINI, A. 2009b. A supervised method to discriminate between impostors and genuine in biometry.
Expert Systems with Applications 36, 7, 10401–10407.NASEEM, I., TOGNERI, R., AND BENNAMOUN, M. 2008. Sparse representation for ear biometrics. In Proc. of the 4th
International Symposium on Advances in Visual Computing (ISVC), Part II. Las Vegas-NV, USA, 336–345.NOSRATI, M., FAEZ, K., AND FARADJI, F. 2007. Using 2D wavelet and principal component analysis for personal identi-
fication based on 2D ear structure. In Proc. of the IEEE International Conference on Intelligent and Advanced Systems.Kuala Lumpur, Malaysia.
P. JONATHON PHILLIPS, HARRY WECHSLER, J. H. P. J. R. 1998. The feret database and evaluation procedure for facerecognition algorithms. Image and Vision Computing 16, 5, 295–306.
PAN, X., CAO, Y., XU, X., LU, Y., AND ZHAO, Y. 2008. Ear and face based multimodal recognition based on KFDA.In Proc. of the IEEE International Conference on Audio, Language and Image Processing ICALIP. Shanghai, China,965–969.
PASSALIS, G., KAKADIARIS, I., THEOHARIS, T., TODERICI, G., AND PAPAIOANNOU, T. 2007. Towards fast 3D earrecognition for real-life biometric applications. In Proc. of the IEEE Conference on Advanced Video and Signal BasedSurveillance. London, UK, 39–44.
PHILLIPS, P., MOON, H., RIZVI, S. A., AND RAUSS, P. J. 2000. The feret evaluation methodology for face recognitionalgorithms. IEEE Transactions on Pattern Analysis and Machine Intelligence 22, 10, 1090–1104.
PRAKASH, S., JAYARAMAN, U., AND GUPTA, P. 2008. Ear localization from side face images using distance transformand template matching. In Proc. of the 1st IEEE Workshops on Image Processing Theory, Tools and Applications IPTA.Sousse, Tunisia.
PRAKASH, S., JAYARAMAN, U., AND GUPTA, P. 2009. A skin-color and template based technique for automatic ear detec-tion. In Proc. of the 7th IEEE International Conference on Advances in Pattern Recognition ICAPR. Kolkata, India.
PUN, K. AND MOON, Y. 2004. Recent advances in ear biometrics. Proc. of the IEEE International Conference on AutomaticFace and Gesture Recognition AFGR, 164–169.
PURKAIT, R. AND SINGH, P. 2008. A test of individuality of human external ear pattern: Its application in the field ofpersonal identification. Forensic Science International 178, 112–118.
RAHMAN, M. M. AND ISHIKAWA, S. 2005. Proposing a passive biometric system for robotic vision. In Proc. of the 10th
International Symposium on Artificial Life and Robotics (AROB). Oita, Japan.
ACM Transactions on Embedded Computing Systems, Vol. 39, No. 3, Article xx, Publication date: September 2013.

xx:32 Abaza et al.
ROSS, A., NANDAKUMAR, K., AND JAIN, A. 2006. Handbook of Multibiometrics. Springer.RUSIGN. 2005. Signature database. University of Rajshahi, Bangladesh.RUTTY, G., ABBAS, A., AND CROSSLING, D. 2005. Could earprint identification be computerised? an illustrated proof of
concept paper. International Journal of Legal Medicine 119, 333–343.SAMARIA, F. AND HARTER, A. 1994. Parameterization of a stochastic model for human face identification. In Proc. of the
2nd IEEE Workshop on application of computer vision. Sarasota-FL , USA.SANA, A. AND GUPTA, P. 2007. Ear biometrics: A new approach. In Proc. of the 6th International Conference on Advances
in Pattern Recognition. Kolkata, India.SRINIVAS, B. G. AND GUPTA, P. 2009. Feature level fused ear biometric system. In Proc. of the 17th IEEE International
Conference on Advances in Pattern Recognition. Kolkata, India.THEOHARIS, T., PASSALIS, G., TODERICI, G., AND KAKADIARIS, I. 2008. Unified 3D face and ear recognition using
wavelets on geometry images. Pattern Recognition 41, 3, 796–804.UMIST. 1998. UMIST database. available at:
http : //www.shef.ac.uk/eee/research/iel/research/face.html.USTB. 2005. University of science and technology beijing USTB database. available at:
http : //www1.ustb.edu.cn/resb/en/index.htm.VICTOR, B., BOWYER, K., AND SARKAR, S. 2002. An evaluation of face and ear biometrics. In Proc. of the 16th IEEE
International Conference on Pattern Recognition ICPR. Quebec City, Canada, 429–432.VIOLA, P. AND JONES, M. 2004. Robust real-time face detection. International Journal of Computer Vision 57, 2, 137–154.WANG, Y., MU, Z., AND ZENG, H. 2008. Block-based and multi-resolution methods for ear recognition using wavelet
transform and uniform local binary patterns. In Proc. of the 19th IEEE International Conference on Pattern RecognitionICPR. Tampa-FL, USA, 1–4.
WATABE, D., SAI, H., SAKAI, K., AND NAKAMURA, O. 2008. Ear biometrics using jet space similarity. In Proc. of theIEEE Canadian Conference on Electrical and Computer Engineering CCECE. Niagara Falls, Canada.
WOODARD, D., FALTEMIER, T., YAN, P., FLYNN, P., AND BOWYER, K. 2006. A comparison of 3D biometric modalities.In Proc. of the IEEE International Conference on Computer Vision and Pattern Recognition CVPR. New York-NY,USA, 57–61.
WRIGHT, J., YANG, A. Y., GANESH, A., SASTRY, S. S., AND MA, Y. 2009. Robust face recognition via sparse represen-tation. IEEE Transaction on Pattern Analysis and Machine Intelligence 31, 2, 210–227.
WU, J., BRUBAKER, S. C., MULLIN, M. D., AND REHG, J. M. 2008. Fast asymmetric learning for cascade face detection.IEEE Transactions on Pattern Analysis and Machine Intelligence 30, 3, 369–382.
XIAOXUN, Z. AND YUNDE, J. 2007. Symmetrical null space LDA for face and ear recognition. Neuro-computing 70, 4-6,842–848.
XIE, Z. AND MU, Z. 2007. Improved locally linear embedding and its application on multi-pose ear recognition. In Proc. ofthe IEEE International Conference on Wavelet Analysis and Pattern Recognition. Beijing, China.
XIE, Z. AND MU, Z. 2008. Ear recognition using LLE and IDLLE algorithm. In Proc. of the 19th IEEE InternationalConference on Pattern Recognition ICPR. Tampa-FL, USA, 1–4.
XM2VTSDB. 1999. XM2VTSDB database. available at:http : //www.ee.surrey.ac.uk/CV SSP/xm2vtsdb/.
XU, X. AND MU, Z. 2007a. Feature fusion method based on KCCA for ear and profile face based multimodal recognition.In Proc. of the IEEE International Conference on Automation and Logistics. Jinan, China, 620–623.
XU, X. AND MU, Z. 2007b. Multimodal recognition based on fusion of ear and profile face. In Proc. of the 4th IEEEInternational Conference on Image and Graphics ICIG. Washington-DC, USA, 598–603.
XU, X., MU, Z., AND YUAN, L. 2007. Feature-level fusion method based on KFDA for multimodal recognition fusing earand profile face. In Proc. of the IEEE International Conference on Wavelet Analysis and Pattern Recognition ICWAPR.Vol. 3. Beijing, China, 1306–1310.
YAN, P. AND BOWYER, K. 2005a. Empirical evaluation of advanced ear biometrics. In Proc. of the IEEE Conference onComputer Vision and Pattern Recognition CVPR. San Diego-CA, USA.
YAN, P. AND BOWYER, K. 2005b. Multibiometrics 2D and 3D ear recognition. In Proc. of Audio- and Video-Based PersonAuthentication Conference AVBPA. Washington-DC, USA, 503–512.
YAN, P. AND BOWYER, K. 2006. An automatic 3D ear recognition system. In Proc. of the 3rd IEEE International Sympo-sium on 3D Data Processing Visualization and Transmission. Chapel Hill-NC, USA, 326–333.
YAN, P. AND BOWYER, K. 2007. Biometric recognition using 3D ear shape. IEEE Transaction on Pattern Analysis andMachine Intelligence PAMI 29, 8, 1297–1308.
YAN, P., BOWYER, K., AND CHANG, K. 2005. ICP-Based approaches for 3D ear recognition. In Proc. of the SPIE, Bio-metric Technology for Human Identification II. Orlando-FL, USA, 282–291.
ACM Transactions on Embedded Computing Systems, Vol. 39, No. 3, Article xx, Publication date: September 2013.

A Survey on Ear Biometrics xx:33
YAQUBI, M., FAEZ, K., AND MOTAMED, S. 2008. Ear recognition using features inspired by visual cortex and support vec-tor machine technique. In Proc. of the IEEE International Conference on Computer and Communication Engineering.Kuala Lumpur, Malaysia.
YUAN, L. AND MU, Z. 2007. Ear recognition based on 2D images. In Proc. of the 1st IEEE International Conference onBiometrics: Theory, Applications, and Systems BTAS. Washington-DC, USA.
YUAN, L., MU, Z., AND LIU, Y. 2006. a. Multimodal recognition using face profile and ear. In Proc. of the IEEE Interna-tional Symposium on Systems and Control in Aerospace and Astronautics ISSCAA. Harbin, China, 887–891.
YUAN, L., MU, Z., ZHANG, Y., AND LIU, K. 2006. b. Ear recognition using improved non-negative matrix factorization.In Proc. of the 18th IEEE International Conference on Pattern Recognition ICPR. Hong Kong, China, 501–504.
YUAN, L., WANG, Z., AND MU, Z. 2010. Ear recognition under partial occlusion based on neighborhood preserving embed-ding. In Proc. of the SPIE, Biometric Technology for Human Identification VII. Vol. 7667. Orlando-FL, USA, 76670Y.
YUAN, L. AND ZHANG, F. 2009. Ear detection based on improved adaboost algorithm. In Proc. of the 8th IEEE Interna-tional Conference on Machine Learning and Cybernetics ICMLC. Baoding, China.
YUIZONO, T., WANG, Y., SATOH, K., AND NAKAYAMA, S. 2002. Study on individual recognition for ear images byusing genetic local search. In Proc. of the IEEE Congress on Evolutionary Computation CEC. Washington-DC, USA,237–242.
ZHANG, H. AND MU, Z. 2008. Ear recognition method based on fusion features of global and local features. In Proc. of theIEEE International Conference on Wavelet Analysis and Pattern Recognition. Hong Kong, China.
ZHANG, H., MU, Z., QU, W., LIU, L., AND ZHANG, C. 2005. A novel approach for ear recognition based on ICA andRBF network. In Proc. of the 4th IEEE International Conference on Machine Learning and Cybernetics. Guangzhou,China, 4511–4515.
ZHANG, Z. AND LIU, H. 2008. Multi-view ear recognition based on b-spline pose manifold construction. In Proc. of the7th IEEE World Congress on Intelligent Control and Automation. Chongqing, China.
ZHOU, J., CADAVID, S., AND ABDELMOTTALEB, M. 2010. Histograms of categorized shapes for 3D ear detection. InProc. of the IEEE conference on Biometrics: Theory, Applications, and Systems BTAS. Washington-DC, USA.
Received March 2011; revised Aug 2011; accepted Oct 2011
ACM Transactions on Embedded Computing Systems, Vol. 39, No. 3, Article xx, Publication date: September 2013.


![ROBUST EAR DETECTION FOR BIOMETRIC VERIFICATIONROBUST EAR DETECTION FOR BIOMETRIC VERIFICATION 33 Typical stages of an automatic ear-based recognition system [Abaza et al., 2011] are](https://img.pdfslide.us/doc/110x75/5e727f5f484ee11be50fead2/robust-ear-detection-for-biometric-robust-ear-detection-for-biometric-verification.jpg)