Embed Size (px)
Citation preview
Mapping Irrigated Areas in the Limpopo Province, South Africa
IWMI Working Paper
172Xueliang Cai, James Magidi, Luxon Nhamo and Barbara van Koppen
Working Papers
The publications in this series record the work and thinking of IWMI researchers, and knowledge that the Institute’s scientific management feels is worthy of documenting. This series will ensure that scientific data and other information gathered or prepared as a part of the research work of the Institute are recorded and referenced. Working Papers could include project reports, case studies, conference or workshop proceedings, discussion papers or reports on progress of research, country-specific research reports, monographs, etc. Working Papers may be copublished, by IWMI and partner organizations.
Although most of the reports are published by IWMI staff and their collaborators, we welcome contributions from others. Each report is reviewed internally by IWMI staff. The reports are published and distributed both in hard copy and electronically (www.iwmi.org) and where possible all data and analyses will be available as separate downloadable files. Reports may be copied freely and cited with due acknowledgment.
About IWMI
IWMI’s mission is to provide evidence-based solutions to sustainably manage water and land resources for food security, people’s livelihoods and the environment. IWMI works in partnership with governments, civil society and the private sector to develop scalable agricultural water management solutions that have a tangible impact on poverty reduction, food security and ecosystem health.
IWMI Working Paper 172
Mapping Irrigated Areas in the Limpopo Province, South Africa
Xueliang Cai, James Magidi, Luxon Nhamo and Barbara van Koppen
International Water Management Institute
A free copy of this publication can be downloaded atwww.iwmi.org/Publications/Working_Papers/index.aspx
The authors: Xueliang Cai is Remote Sensing Crop Water Productivity Analyst/Senior Lecturer at UNESCO-IHE Institute for Water Education, Delft, The Netherlands; He was Researcher - Water Resources and Remote Sensing at the International Water Management Institute (IWMI), Pretoria, South Africa, at the time this research study was conducted; James Magidi is Geomatics Lecturer, Department of Geomatics, Faculty of Engineering and The Built Environment, Tshwane University of Technology, Pretoria, South Africa; Luxon Nhamo is Researcher (Agriculture Water Management and GIS Specialist) at IWMI, Pretoria, South Africa; and Barbara van Koppen is Principal Researcher - Poverty, Gender and Water at IWMI, Pretoria, South Africa.
Cai, X.; Magidi, J.; Nhamo, L.; van Koppen, B. 2017. Mapping irrigated areas in the Limpopo Province, South Africa. Colombo, Sri Lanka: International Water Management Institute (IWMI). 37p. (IWMI Working Paper 172). doi: 10.5337/2017.205
/ irrigated land / agricultural land / cultivated land / agricultural development / rainfed farming / land cover / remote sensing / satellite imagery / mapping / sustainable development / water resources / water security / surface water / groundwater irrigation / seasonal cropping / winter crops / food production / developing countries / irrigation operation / smallholders / surveys / capacity building / South Africa /
ISSN 2012-5763e-ISSN 2478-1134 ISBN 978-92-9090-851-7
Copyright 2017, by IWMI. All rights reserved. IWMI encourages the use of its material provided that the organization is acknowledged and kept informed in all such instances.
Please direct inquiries and comments to: [email protected]
Acknowledgements
The authors gratefully acknowledge the Department of Agriculture, Forestry and Fisheries (DAFF), Directorate of Water Use and Irrigation Development and the Limpopo Department of Agriculture and Rural Development (LDARD), in particular the vital contributions made by Mary Jean Gabriel (Director) and Sydney Shikwambana and Mosibudi Sekgala (staff of DAFF’s Directorate of Water Use and Irrigation Development), and Dr. Tshikolomo Khathu, Makopoi Nkopane, Shalom Nevhutanda, Boshomane Matlala and Daniel Ngwako Manyama (all from LDARD). The authors greatly appreciate their support, feedback, the long days spent in the field for data collection, and assistance with data analysis. The authors also thank Karthikeyan Matheswaran (Postdoctoral Fellow: Surface Water Modelling and Hydraulics, IWMI) for his excellent feedback and comments on the draft version of this Working Paper.
Project
This study, Irrigated Area Mapping in the Limpopo Province, is part of the DAFF-supported project Revitalization of Smallholder Irrigation in South Africa. It is a component of the Global Irrigated Area Mapping (GIAM) initiative of the International Water Management Institute (IWMI), and is a part of the CGIAR Research Program on Water, Land and Ecosystems (WLE).
CollaboratorsThis research study is a collaboration of the following organizations:
International Water Management Institute (IWMI)
Department of Agriculture, Forestry and Fisheries (DAFF)
Limpopo Department of Agriculture and Rural Development (LDARD)
DonorsThis research study was funded by the following:
This research was carried out as part of the CGIAR Research Program on Water, Land and Ecosystems (WLE) and supported by CGIAR Fund Donors (http://www.cgiar.org/who-weare/cgiar-fund/fund-donors-2).
Department of Agriculture, Forestry and Fisheries (DAFF)
v
Contents
Figures ............................................................................................................................. vi
Tables ........................................................................................................................... vi
Acronyms ............................................................................................................................ vii
Summary ............................................................................................................................. ix
Introduction .............................................................................................................................. 1
1. Description of the Study Area ................................................................................................. 2
2. Methodology ............................................................................................................................ 5
2.1. Delineation of Croplands Using Remote Sensing ..................................................... 5
2.2. Satellite Data Download and Analysis ...................................................................... 5
2.3. Ground Truth (GT) Data Collection .......................................................................... 6
2.4. Other Secondary Data Sets Used ............................................................................... 8
2.5. Mapping Agricultural Areas ....................................................................................... 8
2.6. Mapping 2015 Winter Irrigated Areas ..................................................................... 10
3. Results ............................................................................................................................ 10
3.1. Irrigation Status from the Field Survey ................................................................... 10
3.2. Delineated Agricultural Areas in Limpopo Province .............................................. 13
3.3. The Winter Irrigated Areas in Limpopo Province ................................................... 14
3.4. Center-Pivot Irrigation Areas in Limpopo Province................................................ 15
3.5. Difference between Mapped Cropped Areas and Other Existing Data Sets........... 15
3.6. Accuracy Assessment of the Mapped Agricultural Areas ....................................... 16
4. Discussion and Conclusions .................................................................................................. 16
References ............................................................................................................................ 17
Annex 1. Technical Guide on ODK Field Survey .................................................................... 19
Annex 2. Statistics from IWMI 2015 Irrigated Area Mapping ................................................ 25
vi
Figures
Figure 1. Map of the Limpopo Province in South Africa showing its districts and major towns ................................................................................................................ 3
Figure 2. Cropping calendar of some of the irrigated crops grown in the Limpopo Province ...................................................................................................... 4
Figure 3. Flow-chart of the data inputs, key procedures and outputs of the irrigation mapping ...................................................................................................................... 5
Figure 4. Landsat scenes that cover the Limpopo Province. The numbers are the paths/ rows of respective image tiles.................................................................................... 6
Figure 5. GT points visited in 2014, 2015 and 2016 ................................................................ 7
Figure 6. Developing training samples for supervised classification ....................................... 9
Figure 7. Distribution of agriculture types by scale ................................................................ 11
Figure 8. Distribution of agricultural systems by water sources ............................................ 11
Figure 9. The distribution of 2014, 2015 and 2016 GT points of different irrigation and rain-fed farming systems along with surface water bodies ..................................... 12
Figure 10. Agricultural areas by system (rain-fed and equipped for irrigation) showing proportion of agricultural systems in each district in the Limpopo Province ........ 13
Figure 11. 2015 winter irrigated areas in the Limpopo Province (July to August), showing proportion of winter irrigated areas and those not irrigated but equipped for irrigation. ............................................................................................ 14
Figure 12. The mapped center pivots of the Limpopo Province in 2015. The pie-charts represent the proportion of operational and non-operational center-pivot irrigated areas. .......................................................................................................... 15
Tables
Table 1. Landsat scenes used in the classification and extraction of winter irrigation. ......... 6
Table 2. Land cover classes derived from the Landsat 8 image classification ....................... 9
Table 3. GT points among small- to large-scale farming with different water sources. ...... 12
Table 4. Total cropland area and irrigated areas of the Limpopo Province .......................... 16
vii
Acronyms
CAADP Comprehensive Africa Agriculture Development Programme
CGIAR A global research partnership for a food-secure future
DAFF Department of Agriculture, Forestry and Fisheries
GDP Gross Domestic Product
GIAM Global Irrigated Area Mapping
GIS Geographic Information System
GPS Global Positioning System
GT Ground Truth
ICT Information and Communication Technology
IWMI International Water Management Institute
LDARD Limpopo Department of Agriculture and Rural Development
LULC Land use/Land cover
MODIS Moderate Resolution Imaging Spectroradiometer
MVC Maximum Value Composite
NASA National Aeronautics and Space Administration
NDP National Development Plan
NDVI Normalized Difference Vegetation Index
NLC National Land Cover
ODK Open Data Kit
SDG Sustainable Development Goal
USGS United States Geological Survey

ix
Summary
Recent studies reveal that there are many differences in reported numbers of irrigated areas, especially in developing countries, and that significant knowledge gaps and uncertainties remain to inform investment decisions and policy making. This is particularly relevant in South Africa, where the National Development Plan (NDP) envisages to increase irrigated areas; yet there are uncertainties in reported information on irrigated areas, especially on informal irrigation. This report summarizes the findings of a collaborative effort by the International Water Management Institute (IWMI), Department of Agriculture, Forestry and Fisheries (DAFF) and the Limpopo Department of Agriculture and Rural Development (LDARD) to map and assess irrigated areas in the Limpopo Province, South Africa. An assessment based on remote sensing was carried out to map agricultural areas in 2015 using a combination of Landsat and Moderate Resolution Imaging Spectroradiometer (MODIS) satellite data. The mapping process was supported with data from previous irrigated area mapping exercises by DAFF and three field ground truthing (GT) surveys jointly conducted with the partners. A literature review and analysis of irrigated area statistics showed gaps and inconsistencies in different government reporting lines to comprehensively include irrigated areas. The mapping based on remote sensing estimated in total 1.6 million hectares (Mha) of cropland in the province, with only 262,000 ha actually irrigated in the 2015 winter season. The center-pivot irrigation systems, usually with high capital inputs, were underutilized with only 47,000 ha (29%) actually irrigated out of 164,000 ha equipped with center pivots.

1
INTRODUCTION
Agriculture is a relatively small but important sector in South Africa as it accounts for about 3% of national gross domestic product (GDP) and 7% of formal employment. The South African National Development Plan (NDP) (NPC 2012) sets to stimulate the country’s economic growth in multiple sectors including agriculture with special emphasis on irrigation. The typology of agriculture in South Africa is however interesting with successful commercial farming on one side, a large number of small subsistence farming on the other, and a range of out-growers in between (Pienaar 2013). This mosaic in South Africa’s agriculture entails a pathway for the growth of emerging farmers as the government has set to improve the smallholder farmers’ lot and reduce their vulnerability. However, it also poses challenges for targeted agricultural policies and investment in a dynamic environment where changes are constantly occurring and water resources management for the agriculture sector for all-inclusive and pro-poor interventions is hotly debated.
Irrigation is a key player in the terrestrial ecosystem concerning water, food, and eventually, the well-being of people and the environment. Irrigation is also the single largest abstractive water user in many countries (Johansson 2005). National and regional food security targets are often built on irrigation development. For example, the Comprehensive Africa Agriculture Development Programme (CAADP) sets a target to expand area under irrigation on the continent by at least 5 million ha (Mha) by 2025 (NEPAD 2014). There are renewed efforts to ensure food and water security as set out by many countries, development agencies and, globally, the United Nations’ Sustainable Development Goals (SDGs), specifically Goals 1, 2 and 6 on poverty alleviation, zero hunger and provision of clean water and sanitation, respectively.
While policies and investment often focus on irrigation in many African countries, there is a general lack of data and information on the status of existing irrigation on the continent. Ali (2016) analyzed the reported irrigated areas for ten Asian countries and found that there are large variations in the reported numbers depending on their sources. The coefficient of variations of the ten countries ranges from 27 to 90%, rendering associated policies and investment plans which base their analyses on uncertain numbers, much less effective. The reason for the misapprehension is that there is a general lack of an accurate, up to date and comprehensive information set for a baseline, timely reporting of changes in irrigated areas and the corresponding production. Existing country reporting systems on which global data sets on irrigated areas, such as the Food and Agriculture Organization of the United Nations (FAO) AQUASTAT database, are based, are often estimates and aggregates coming through layers of national administrative systems. These results are often subject to errors and biases.
Remote sensing is a useful tool for mapping irrigated areas to better support water resources and agricultural development in developing countries where reliable reporting and monitoring systems are yet to be established. Valid for application at multiple scales such as global scale (Thenkabail et al. 2007), regional scale (Xiao et al. 2006), and basin scale (Cai and Sharma 2010), the remote sensing approach can map large areas within a short period of time and at low cost. More importantly, remote sensing can map the areas actually irrigated instead of areas equipped for irrigation. There can be profound differences between the two: sometimes the actual irrigated area is larger than the areas equipped, especially in regions where agriculture is more fragmented with informal irrigation, as in Africa and Asia. Sometimes, the actual irrigated area is much smaller, mainly in the case of large public irrigation systems where the actual command areas often shrink due to lack of maintenance. Remote sensing can overcome these problems and provide a “picture” of the real situation to the mapping period. It will further help understand the ecological footprint of food production, assess the potential of agricultural development within the planet’s boundaries with limited land and water resources, and achieve a balance between the agricultural and natural ecosystems.
2
This report describes research outcomes to map irrigated areas using medium-resolution images of Landsat 8 in the Limpopo Province, South Africa. The activity was carried out in collaboration with DAFF and LDARD. The results based on remote sensing were compared with existing information from national and provincial sources. The gaps in current reporting lines were identified and alternative approaches through remote sensing to improve decision making for future investment were analyzed. Capacity-building and partnership were also part of the study.
In 2012, the International Water Management Institute (IWMI) embarked on an initiative to use satellite imagery to map irrigated and rain-fed areas to assess how agricultural water management practices are expanding in traditionally rain-fed areas across Asia and Africa. The resultant product is obtainable from IWMI’s Water Data Portal (available at www.waterdata.iwmi.org/applications/irri_area). This initiative builds on IWMI’s previous attempt at Global Irrigated Area Mapping (GIAM) (Thenkabail et al. 2007) which was the first of such maps, globally. In 2014, 2015 and 2016 these activities were coordinated from IWMI’s regional office in South Africa, based in Pretoria, in close collaboration with DAFF and LDARD.
As IWMI’s mapping activities attracted interests from DAFF and LDARD, they agreed to provide support to further refine IWMI’s continental mapping methodology at local scale in the Limpopo Province, South Africa. The activity was further supported by the CGIAR Research Program on Water, Land and Ecosystems (WLE). DAFF and LDARD received on-the-job training during the course of the project and a training workshop was also conducted at the end of the project. The staff also participated in various project activities, including the identification, collection and analysis of existing reporting lines on irrigation and rain-fed agriculture; field surveys using Information and Communication Technology (ICT) Android global positioning system (GPS) and tablets; and geographic information system (GIS) analysis.
1. DESCRIPTION OF THE STUDY AREA
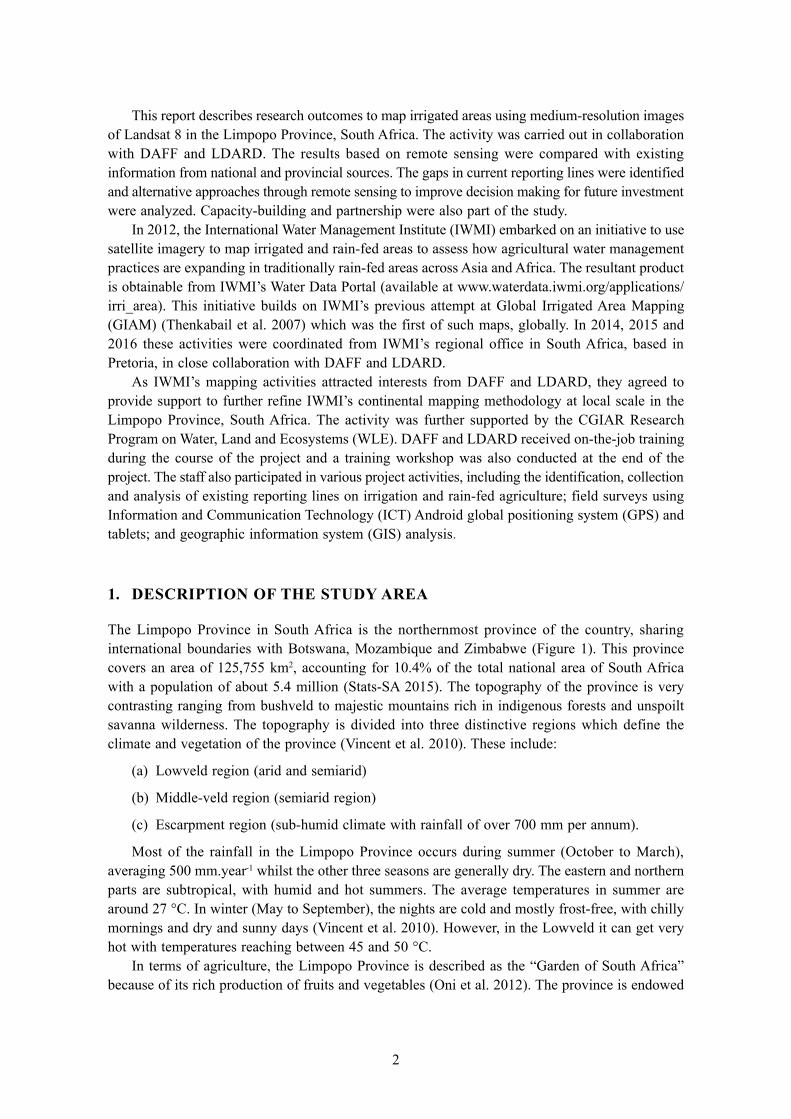
The Limpopo Province in South Africa is the northernmost province of the country, sharing international boundaries with Botswana, Mozambique and Zimbabwe (Figure 1). This province covers an area of 125,755 km2, accounting for 10.4% of the total national area of South Africa with a population of about 5.4 million (Stats-SA 2015). The topography of the province is very contrasting ranging from bushveld to majestic mountains rich in indigenous forests and unspoilt savanna wilderness. The topography is divided into three distinctive regions which define the climate and vegetation of the province (Vincent et al. 2010). These include:
(a) Lowveld region (arid and semiarid)
(b) Middle-veld region (semiarid region)
(c) Escarpment region (sub-humid climate with rainfall of over 700 mm per annum).
Most of the rainfall in the Limpopo Province occurs during summer (October to March), averaging 500 mm.year-1 whilst the other three seasons are generally dry. The eastern and northern parts are subtropical, with humid and hot summers. The average temperatures in summer are around 27 °C. In winter (May to September), the nights are cold and mostly frost-free, with chilly mornings and dry and sunny days (Vincent et al. 2010). However, in the Lowveld it can get very hot with temperatures reaching between 45 and 50 °C.
In terms of agriculture, the Limpopo Province is described as the “Garden of South Africa” because of its rich production of fruits and vegetables (Oni et al. 2012). The province is endowed
3
Figure 1. Map of the Limpopo Province in South Africa showing its districts and major towns.
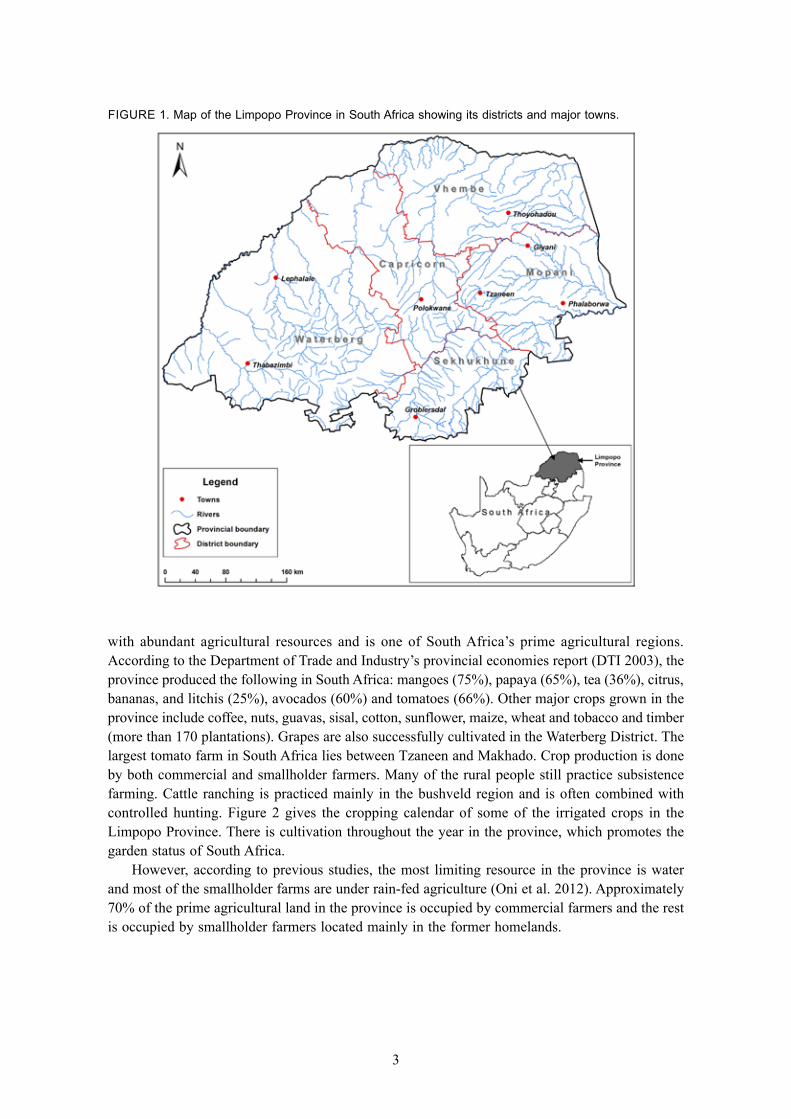
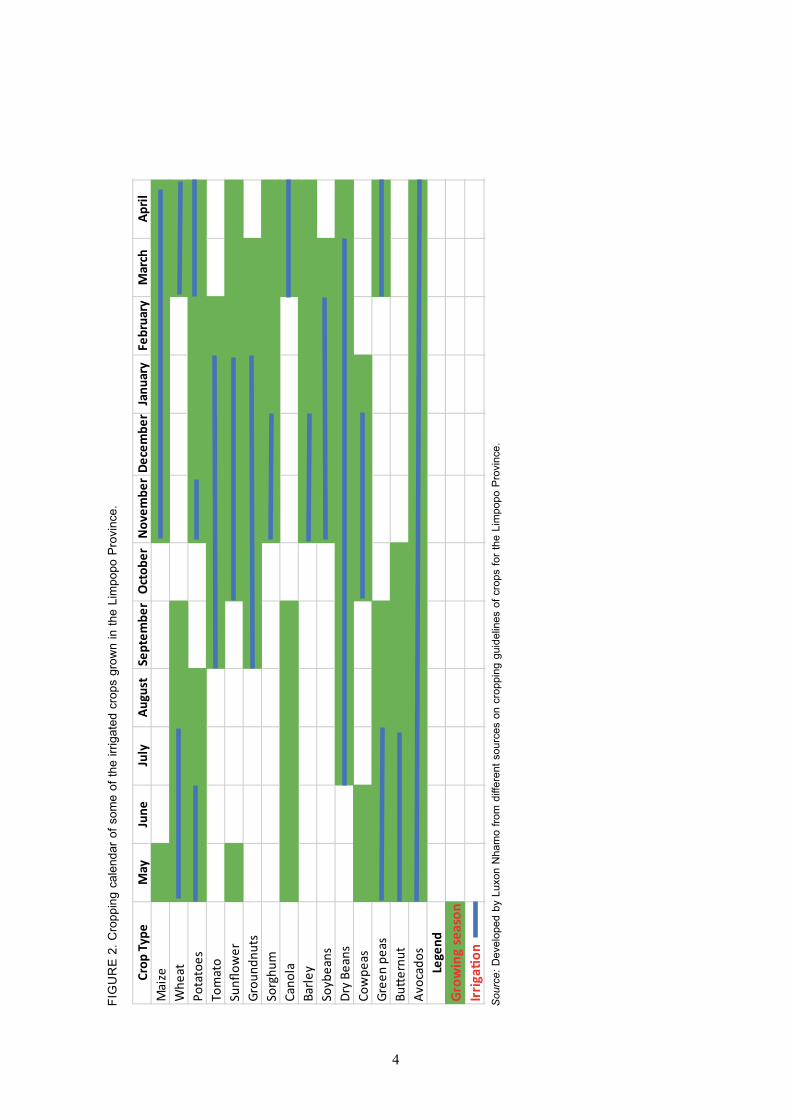
with abundant agricultural resources and is one of South Africa’s prime agricultural regions. According to the Department of Trade and Industry’s provincial economies report (DTI 2003), the province produced the following in South Africa: mangoes (75%), papaya (65%), tea (36%), citrus, bananas, and litchis (25%), avocados (60%) and tomatoes (66%). Other major crops grown in the province include coffee, nuts, guavas, sisal, cotton, sunflower, maize, wheat and tobacco and timber (more than 170 plantations). Grapes are also successfully cultivated in the Waterberg District. The largest tomato farm in South Africa lies between Tzaneen and Makhado. Crop production is done by both commercial and smallholder farmers. Many of the rural people still practice subsistence farming. Cattle ranching is practiced mainly in the bushveld region and is often combined with controlled hunting. Figure 2 gives the cropping calendar of some of the irrigated crops in the Limpopo Province. There is cultivation throughout the year in the province, which promotes the garden status of South Africa.
However, according to previous studies, the most limiting resource in the province is water and most of the smallholder farms are under rain-fed agriculture (Oni et al. 2012). Approximately 70% of the prime agricultural land in the province is occupied by commercial farmers and the rest is occupied by smallholder farmers located mainly in the former homelands.
4
Fig
ur
e 2
. Cro
ppin
g ca
lend
ar o
f som
e of
the
irrig
ated
cro
ps g
row
n in
the
Lim
popo
Pro
vinc
e.
Crop
Typ
eM
ayJu
neJu
lyAu
gust
Sept
embe
rO
ctob
erN
ovem
ber
Dece
mbe
rJa
nuar
yFe
brua
ryM
arch
April
Mai
zeW
heat
Pota
toes
Tom
ato
Sunfl
ower
Grou
ndnu
tsSo
rghu
mCa
nola
Barle
ySo
ybea
nsDr
y Be
ans
Cow
peas
Gree
n pe
asBu
ttern
utAv
ocad
osLe
gend
Grow
ing
seas
onIrr
igati
onS
ourc
e: D
evel
oped
by
Luxo
n N
ham
o fro
m d
iffer
ent s
ourc
es o
n cr
oppi
ng g
uide
lines
of c
rops
for t
he L
impo
po P
rovi
nce.

5
2. METHODOLOGY
2.1. Delineation of Croplands Using Remote Sensing
A series of data sets were collected and used to come up with the final map of croplands of the Limpopo Province. These include Landsat 8 and the Moderate Resolution Imaging Spectroradiometer (MODIS) Normalized Difference Vegetation Index (NDVI) time series images, ground truth (GT) points, existing national Land use/Land cover (LULC) maps, statistics and government surveys of the agricultural areas.
The mapping procedure included data collection, data processing and map generation (results) as indicated in the methodological flow-chart shown in Figure 3. It needs to be noted that the delineation of the agricultural area is based on one time Landsat 8 image for 2015. The identification of plots/fields that are cultivated throughout the year (so including winter irrigation) was achieved through the NDVI analysis. Area equipped with center pivots highlighted in this study refers to all areas equipped with pivots whether irrigated or not. Center pivots are highly mechanized irrigated areas and are easily identified by their circular shape.
2.2. Satellite Data Download and Analysis
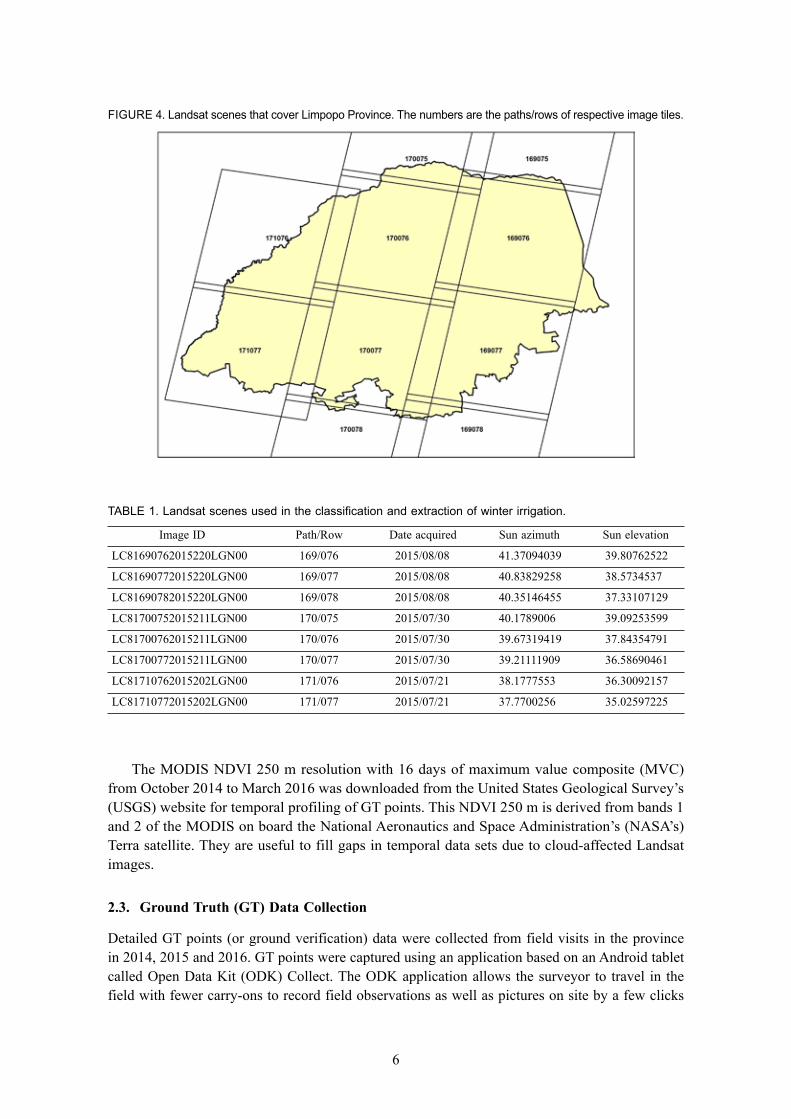
The primary data used to map agricultural areas in the Limpopo Province is the cloud-free Landsat 8 imagery of 2015, with a spatial resolution of 30 m and temporal resolution of 16 days. The province requires eight (8) Landsat 8 scenes (Figure 4) to cover the entire area. About 247 Landsat scenes from 2014 to 2015 were downloaded from the United States Geological Survey’s (USGS) Earth-explorer website, 137 scenes had a cloud cover less than 10% and 110 scenes had cloud cover above 10%. The visibility of most summer Landsat scenes was hampered by clouds, making it impossible to make up a cloud-free mosaic for the summer season. The most suitable images for classification were found between May and September, and for this study July and August images were used (Table 1).
Figure 3. Flow-chart of the data inputs, key procedures and outputs of the irrigation mapping.
6
TABLe 1. Landsat scenes used in the classification and extraction of winter irrigation.
Image ID Path/Row Date acquired Sun azimuth Sun elevation
LC81690762015220LGN00 169/076 2015/08/08 41.37094039 39.80762522
LC81690772015220LGN00 169/077 2015/08/08 40.83829258 38.5734537
LC81690782015220LGN00 169/078 2015/08/08 40.35146455 37.33107129
LC81700752015211LGN00 170/075 2015/07/30 40.1789006 39.09253599
LC81700762015211LGN00 170/076 2015/07/30 39.67319419 37.84354791
LC81700772015211LGN00 170/077 2015/07/30 39.21111909 36.58690461
LC81710762015202LGN00 171/076 2015/07/21 38.1777553 36.30092157
LC81710772015202LGN00 171/077 2015/07/21 37.7700256 35.02597225
The MODIS NDVI 250 m resolution with 16 days of maximum value composite (MVC) from October 2014 to March 2016 was downloaded from the United States Geological Survey’s (USGS) website for temporal profiling of GT points. This NDVI 250 m is derived from bands 1 and 2 of the MODIS on board the National Aeronautics and Space Administration’s (NASA’s) Terra satellite. They are useful to fill gaps in temporal data sets due to cloud-affected Landsat images.
2.3. Ground Truth (GT) Data Collection
Detailed GT points (or ground verification) data were collected from field visits in the province in 2014, 2015 and 2016. GT points were captured using an application based on an Android tablet called Open Data Kit (ODK) Collect. The ODK application allows the surveyor to travel in the field with fewer carry-ons to record field observations as well as pictures on site by a few clicks
Figure 4. Landsat scenes that cover Limpopo Province. The numbers are the paths/rows of respective image tiles.
7
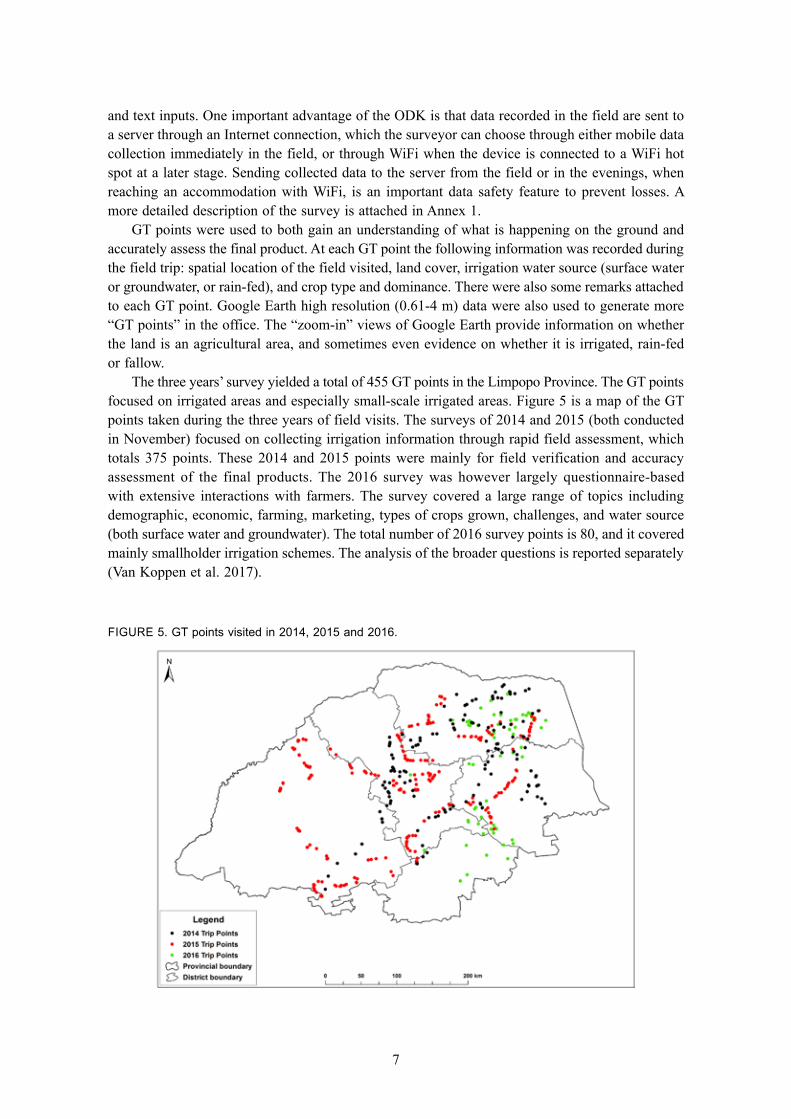
Figure 5. gT points visited in 2014, 2015 and 2016.
and text inputs. One important advantage of the ODK is that data recorded in the field are sent to a server through an Internet connection, which the surveyor can choose through either mobile data collection immediately in the field, or through WiFi when the device is connected to a WiFi hot spot at a later stage. Sending collected data to the server from the field or in the evenings, when reaching an accommodation with WiFi, is an important data safety feature to prevent losses. A more detailed description of the survey is attached in Annex 1.
GT points were used to both gain an understanding of what is happening on the ground and accurately assess the final product. At each GT point the following information was recorded during the field trip: spatial location of the field visited, land cover, irrigation water source (surface water or groundwater, or rain-fed), and crop type and dominance. There were also some remarks attached to each GT point. Google Earth high resolution (0.61-4 m) data were also used to generate more “GT points” in the office. The “zoom-in” views of Google Earth provide information on whether the land is an agricultural area, and sometimes even evidence on whether it is irrigated, rain-fed or fallow.
The three years’ survey yielded a total of 455 GT points in the Limpopo Province. The GT points focused on irrigated areas and especially small-scale irrigated areas. Figure 5 is a map of the GT points taken during the three years of field visits. The surveys of 2014 and 2015 (both conducted in November) focused on collecting irrigation information through rapid field assessment, which totals 375 points. These 2014 and 2015 points were mainly for field verification and accuracy assessment of the final products. The 2016 survey was however largely questionnaire-based with extensive interactions with farmers. The survey covered a large range of topics including demographic, economic, farming, marketing, types of crops grown, challenges, and water source (both surface water and groundwater). The total number of 2016 survey points is 80, and it covered mainly smallholder irrigation schemes. The analysis of the broader questions is reported separately (Van Koppen et al. 2017).
8
2.4. Other Secondary Data Sets Used
Existing similar mapping products which include the South Africa National Land Cover (NLC) map developed in 2013-14, DAFF’s 1999 and 2015 maps of field boundaries, map of the crop estimate committees and IWMI’s global irrigated area mapping (GIAM) were also used to compare and complete the final product of this study.
The NLC map was generated using multi-season Landsat 8 imagery of 2013 and 2014 by GEOTERRAIMAGE (geOTerrAiMAge 2015). The map contains 11 agricultural classes which are listed below. It is evident that the classification does not separate irrigated versus rain-fed area, except for center pivots.
1. Cultivated Commercial Fields
2. Cultivated Commercial Pivots
3. Cultivated Orchards
4. Cultivated Vines
5. Cultivated Permanent Pineapple
6. Cultivated Subsistence
7. Cultivated Cane Pivots
8. Cultivated Cane Commercial - Crop
9. Cultivated Cane Commercial - Fallow
10. Cultivated Cane Emerging - Crop
11. Cultivated Cane Emerging - Fallow
In 1999 and 2015, DAFF developed the maps of field boundaries. These maps were digitized from SPOT 5 imagery (2.5 m resolution) at a scale of 1:10 000 for the whole country. These data sets included annual crops, horticulture and viticulture, old fields, center pivots, shade nets, subsistence farming and plantations. As in the previous case, the data sets do not specifically identify irrigation and rain-fed areas, except for center pivots.
2.5. Mapping Agricultural Areas
Maps of South African National Land Cover (SANLC) and DAFF field boundaries have shown a good level of accuracy and they are reasonably up to date. The current irrigated area mapping initiative used the two data sets for comparisons, verification and completion of the gaps that might have been left out by the remote sensing exercise. The irrigated area mapping exercise mainly used Landsat 8 images of 2015 to plot out croplands.
The delineation process started with processing of cloud-free Landsat 8 data which were layer-stacked and mosaicked into three segments for the entire Limpopo Province. The maximum likelihood supervised classification method was used to separate different LULC types in the province. In supervised classification, the user recognizes classes in the available images as shown in Figure 6, based on the prior knowledge (personal experience, GT visits, and Google Earth zoom-in views). Prior knowledge of the area allows the user to select and set up discrete samples for each LULC class and assign names to them. These samples are called training sites and spectral signatures (mean values and variance of digital number--DN) of each training site will be computed. Using statistical processing, every pixel on the images will be compared with the signatures on the
9
training sites and will be assigned to the classes it resembles. In this study, the maximum likelihood supervised classification was run for the whole province and training sites were created.
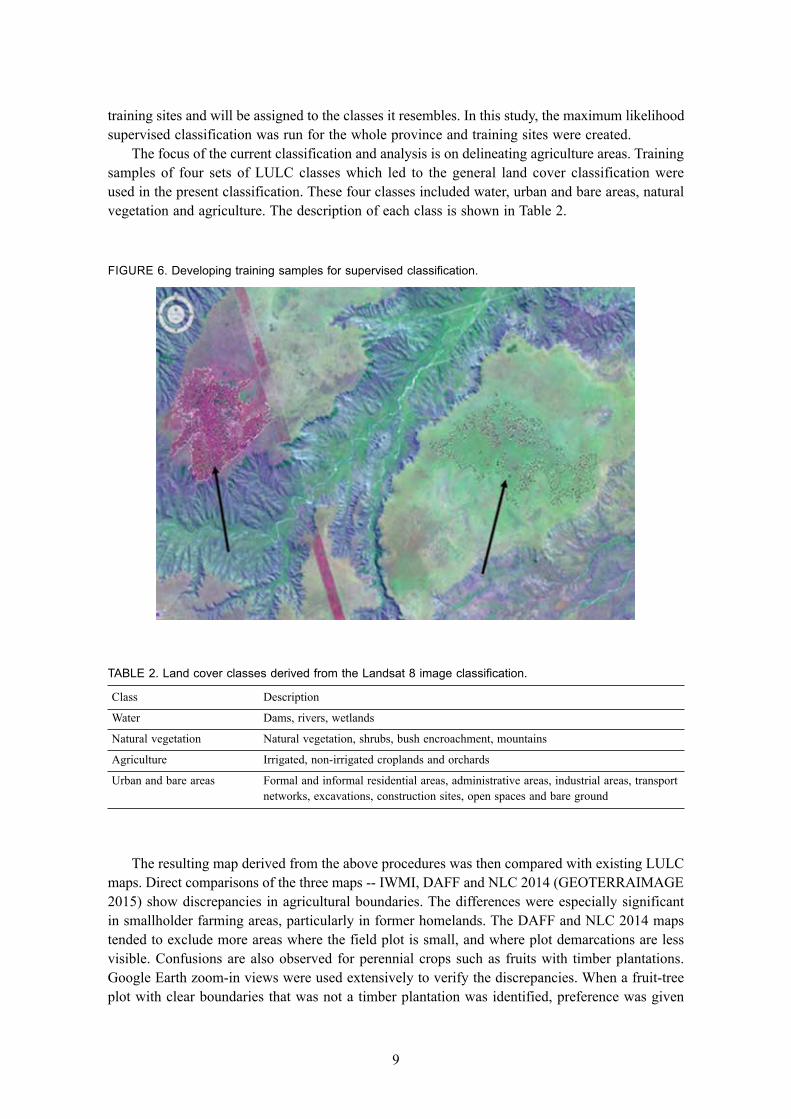
The focus of the current classification and analysis is on delineating agriculture areas. Training samples of four sets of LULC classes which led to the general land cover classification were used in the present classification. These four classes included water, urban and bare areas, natural vegetation and agriculture. The description of each class is shown in Table 2.
Figure 6. Developing training samples for supervised classification.
TABLe 2. Land cover classes derived from the Landsat 8 image classification.
Class Description
Water Dams, rivers, wetlands
Natural vegetation Natural vegetation, shrubs, bush encroachment, mountains
Agriculture Irrigated, non-irrigated croplands and orchards
Urban and bare areas Formal and informal residential areas, administrative areas, industrial areas, transport networks, excavations, construction sites, open spaces and bare ground
The resulting map derived from the above procedures was then compared with existing LULC maps. Direct comparisons of the three maps -- IWMI, DAFF and NLC 2014 (GEOTERRAIMAGE 2015) show discrepancies in agricultural boundaries. The differences were especially significant in smallholder farming areas, particularly in former homelands. The DAFF and NLC 2014 maps tended to exclude more areas where the field plot is small, and where plot demarcations are less visible. Confusions are also observed for perennial crops such as fruits with timber plantations. Google Earth zoom-in views were used extensively to verify the discrepancies. When a fruit-tree plot with clear boundaries that was not a timber plantation was identified, preference was given
10
for it to be classified as an agricultural land, even though it may have not been cultivated in the past few years. Tree plantations such as eucalyptus and pine trees were classified as forests; so, they were not included as agricultural land.
2.6. Mapping 2015 Winter Irrigated Areas
The Normalized Difference Vegetation Index (NDVI) was used to map irrigated areas. NDVI is a slope-based vegetation index derived from the reflectance values of near-infrared and red portions of the electromagnetic spectrum, and is used to quantify photosynthetic capacity, moisture stress, and vegetation productivity. NDVI is calculated as follows:
NIR-R (1) NIR+R where, NIR represents the spectral reflectance in near-infrared band and R represents the red
band. Chlorophyll, which is the primary photosynthetic pigment in the plant absorbs visible light (0.4-0.7 µm) bands but reflects infrared light (0.7-1.1 µm) wavelengths. Healthy vegetation reflects more infrared and absorbs more red and blue portions of the electromagnetic spectrum. The blue portion is affected by atmospheric scattering; hence the use of red and near-infrared bands to calculate NDVI and other vegetation indices. In arid areas and dry seasons there is less absorption of the visible light and low reflection of the infrared light, resulting in a low NDVI value; and the opposite applies in humid areas and wet seasons. NDVI values range from -1 to +1 where 0 to1 represents high plant productivity, and -1 to 0 represents no vegetation cover, presence of clouds, water or glaciers. NDVI was calculated from the Landsat 8 cloud-free 2015 winter images.
The NDVI threshold was used to separate the irrigated and non-irrigated lands between July and August 2015 during the dry season, which falls during the winter season in South Africa. Pixel values above the threshold value of 0.14 were selected and classified as winter irrigated areas and those below were classified as non-irrigated areas. This is based on the assumption that in the Limpopo Province, no crops could have healthy conditions (represented by NDVI) during the dry winter season without irrigation. So any crops within agricultural areas with NDVI above certain thresholds should be irrigated.
3. RESULTS
3.1. Irrigation Status from the Field Survey
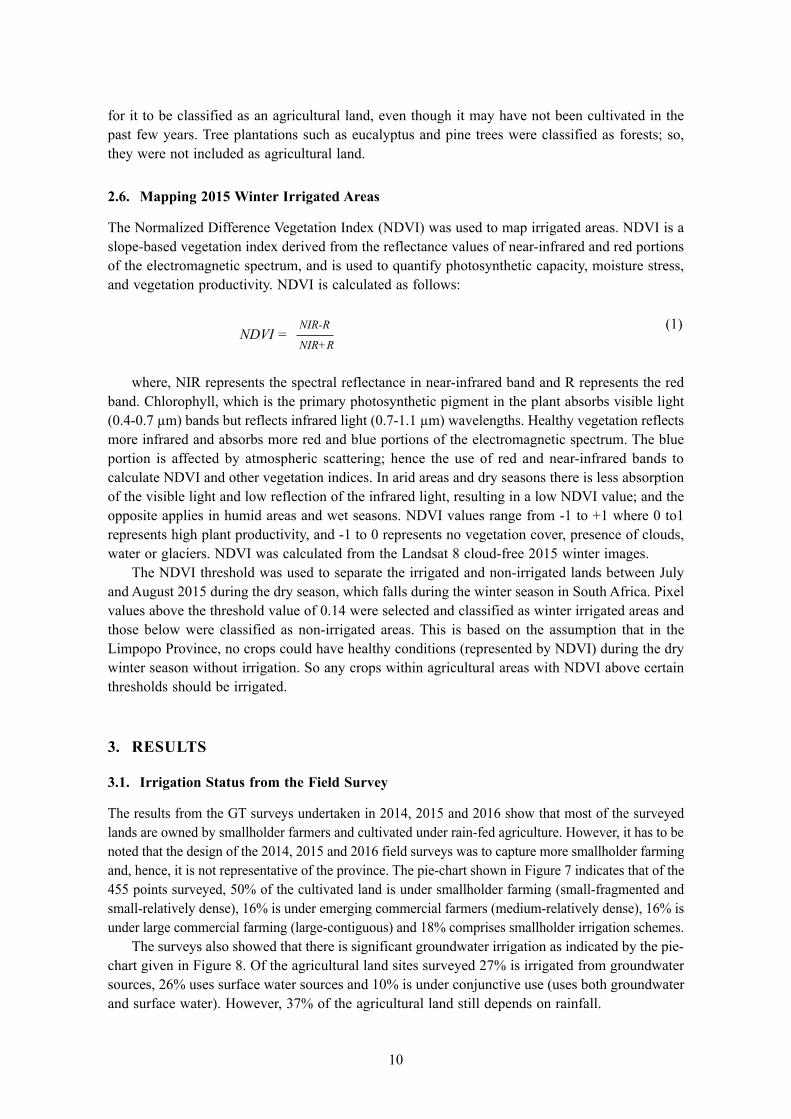
The results from the GT surveys undertaken in 2014, 2015 and 2016 show that most of the surveyed lands are owned by smallholder farmers and cultivated under rain-fed agriculture. However, it has to be noted that the design of the 2014, 2015 and 2016 field surveys was to capture more smallholder farming and, hence, it is not representative of the province. The pie-chart shown in Figure 7 indicates that of the 455 points surveyed, 50% of the cultivated land is under smallholder farming (small-fragmented and small-relatively dense), 16% is under emerging commercial farmers (medium-relatively dense), 16% is under large commercial farming (large-contiguous) and 18% comprises smallholder irrigation schemes.
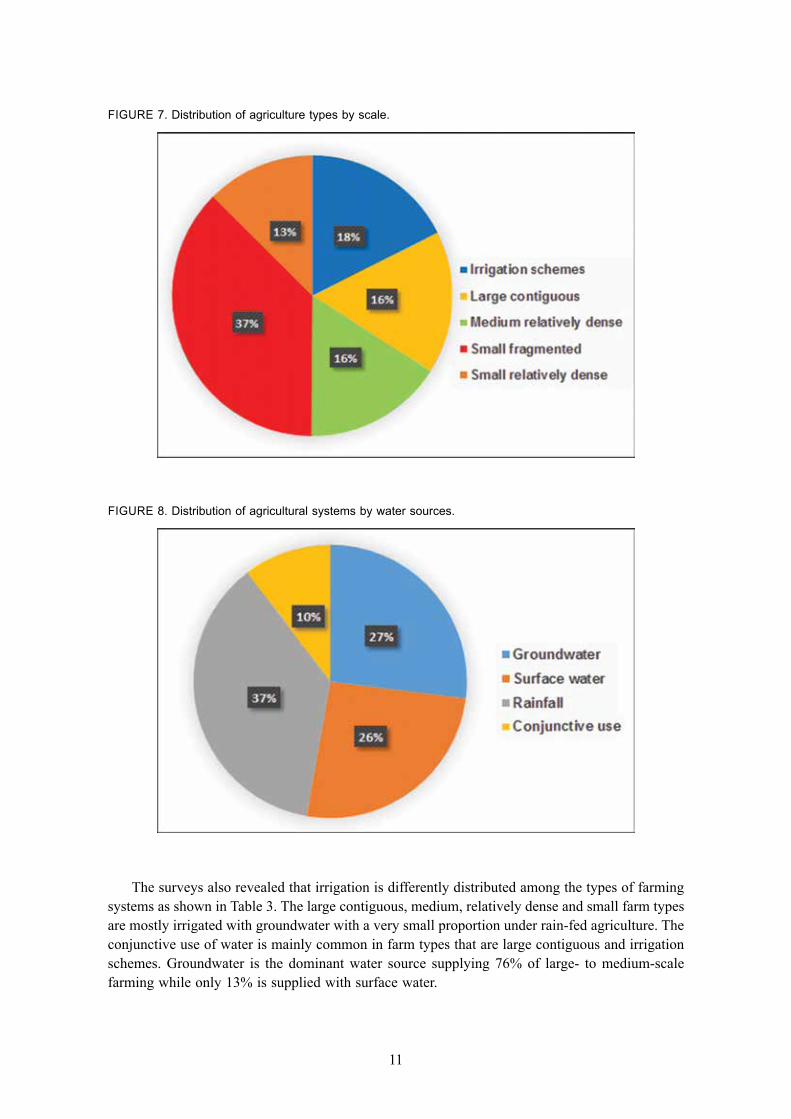
The surveys also showed that there is significant groundwater irrigation as indicated by the pie-chart given in Figure 8. Of the agricultural land sites surveyed 27% is irrigated from groundwater sources, 26% uses surface water sources and 10% is under conjunctive use (uses both groundwater and surface water). However, 37% of the agricultural land still depends on rainfall.
NDVI =
11
The surveys also revealed that irrigation is differently distributed among the types of farming systems as shown in Table 3. The large contiguous, medium, relatively dense and small farm types are mostly irrigated with groundwater with a very small proportion under rain-fed agriculture. The conjunctive use of water is mainly common in farm types that are large contiguous and irrigation schemes. Groundwater is the dominant water source supplying 76% of large- to medium-scale farming while only 13% is supplied with surface water.
Figure 7. Distribution of agriculture types by scale.
Figure 8. Distribution of agricultural systems by water sources.
12
TABLe 3. gT points among small- to large-scale farming with different water sources.
Farm type Groundwater Surface water Conjunctive use Rainfall Sum
Large, contiguous 0 29 42 4 75
Medium, relatively dense 61 1 0 11 73
Small, relatively dense 39 18 0 0 57
Small, fragmented 20 0 0 152 172
Irrigation schemes 3 69 6 0 78
Sum 123 117 48 167 455
On the other hand, the smallholder farming sector surveyed relies heavily on rain-fed agriculture. About 88% of the small fragmented farming is rain-fed (Table 3). Only 12% of this farming is irrigated and mostly from groundwater. Irrigation schemes generally use surface water for irrigation. Overall, the farm types under irrigation generally use more surface water than groundwater.
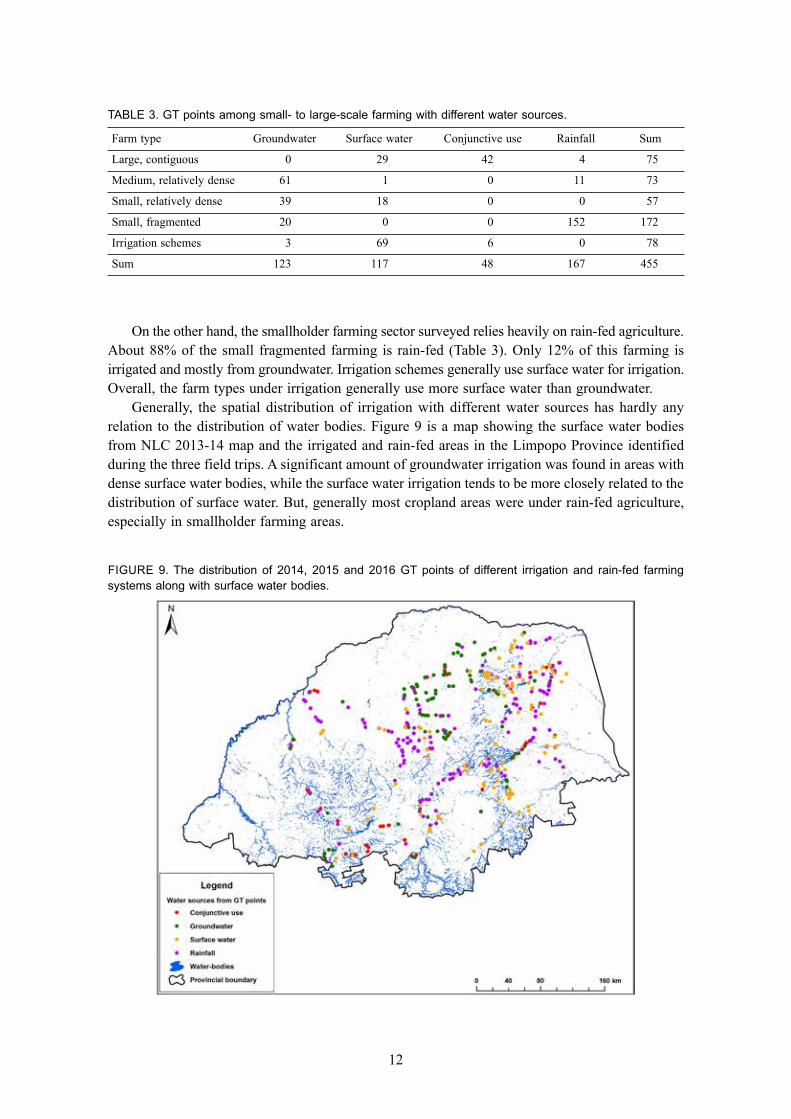
Generally, the spatial distribution of irrigation with different water sources has hardly any relation to the distribution of water bodies. Figure 9 is a map showing the surface water bodies from NLC 2013-14 map and the irrigated and rain-fed areas in the Limpopo Province identified during the three field trips. A significant amount of groundwater irrigation was found in areas with dense surface water bodies, while the surface water irrigation tends to be more closely related to the distribution of surface water. But, generally most cropland areas were under rain-fed agriculture, especially in smallholder farming areas.
Figure 9. The distribution of 2014, 2015 and 2016 gT points of different irrigation and rain-fed farming systems along with surface water bodies.
13
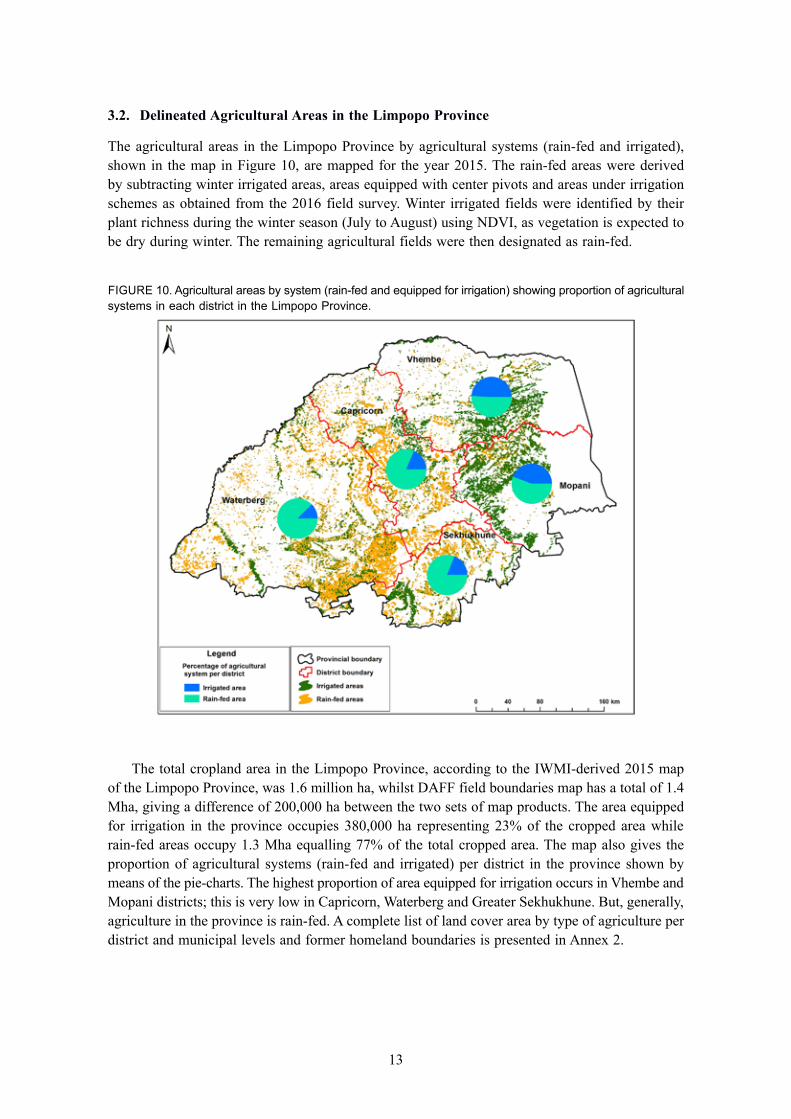
3.2. Delineated Agricultural Areas in the Limpopo Province
The agricultural areas in the Limpopo Province by agricultural systems (rain-fed and irrigated), shown in the map in Figure 10, are mapped for the year 2015. The rain-fed areas were derived by subtracting winter irrigated areas, areas equipped with center pivots and areas under irrigation schemes as obtained from the 2016 field survey. Winter irrigated fields were identified by their plant richness during the winter season (July to August) using NDVI, as vegetation is expected to be dry during winter. The remaining agricultural fields were then designated as rain-fed.
Figure 10. Agricultural areas by system (rain-fed and equipped for irrigation) showing proportion of agricultural systems in each district in the Limpopo Province.
The total cropland area in the Limpopo Province, according to the IWMI-derived 2015 map of the Limpopo Province, was 1.6 million ha, whilst DAFF field boundaries map has a total of 1.4 Mha, giving a difference of 200,000 ha between the two sets of map products. The area equipped for irrigation in the province occupies 380,000 ha representing 23% of the cropped area while rain-fed areas occupy 1.3 Mha equalling 77% of the total cropped area. The map also gives the proportion of agricultural systems (rain-fed and irrigated) per district in the province shown by means of the pie-charts. The highest proportion of area equipped for irrigation occurs in Vhembe and Mopani districts; this is very low in Capricorn, Waterberg and Greater Sekhukhune. But, generally, agriculture in the province is rain-fed. A complete list of land cover area by type of agriculture per district and municipal levels and former homeland boundaries is presented in Annex 2.
14
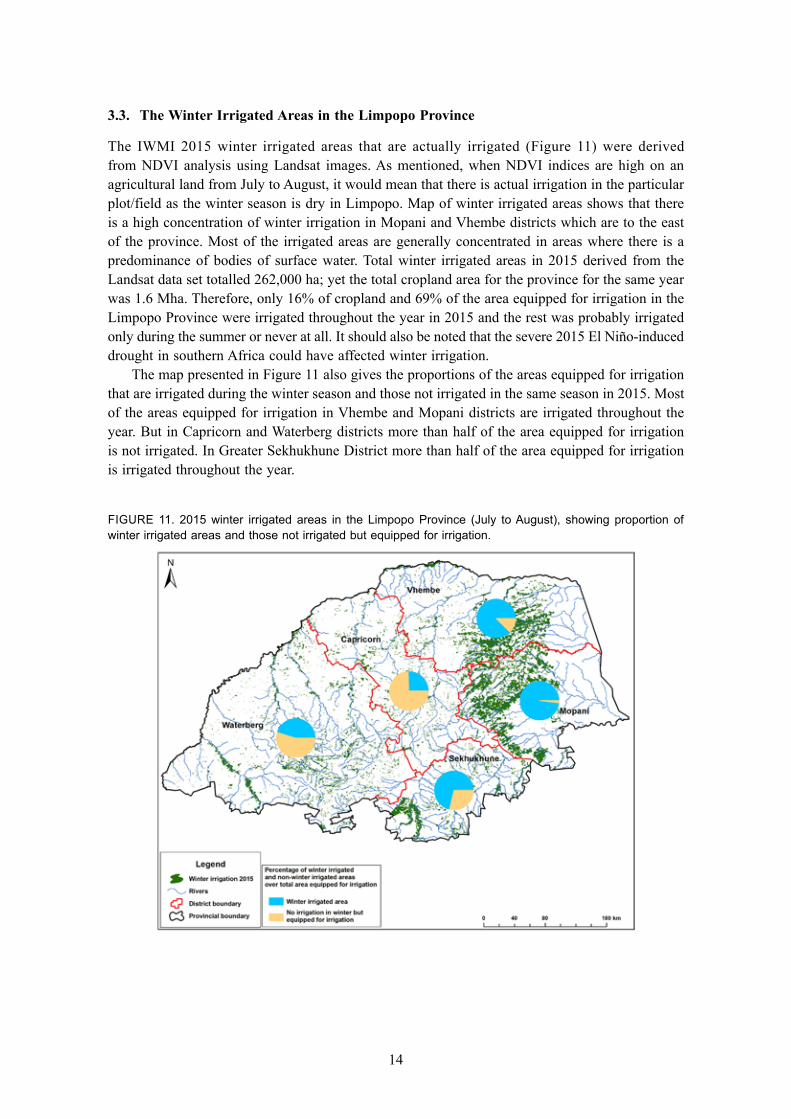
3.3. The Winter Irrigated Areas in the Limpopo Province
The IWMI 2015 winter irrigated areas that are actually irrigated (Figure 11) were derived from NDVI analysis using Landsat images. As mentioned, when NDVI indices are high on an agricultural land from July to August, it would mean that there is actual irrigation in the particular plot/field as the winter season is dry in Limpopo. Map of winter irrigated areas shows that there is a high concentration of winter irrigation in Mopani and Vhembe districts which are to the east of the province. Most of the irrigated areas are generally concentrated in areas where there is a predominance of bodies of surface water. Total winter irrigated areas in 2015 derived from the Landsat data set totalled 262,000 ha; yet the total cropland area for the province for the same year was 1.6 Mha. Therefore, only 16% of cropland and 69% of the area equipped for irrigation in the Limpopo Province were irrigated throughout the year in 2015 and the rest was probably irrigated only during the summer or never at all. It should also be noted that the severe 2015 El Niño-induced drought in southern Africa could have affected winter irrigation.
The map presented in Figure 11 also gives the proportions of the areas equipped for irrigation that are irrigated during the winter season and those not irrigated in the same season in 2015. Most of the areas equipped for irrigation in Vhembe and Mopani districts are irrigated throughout the year. But in Capricorn and Waterberg districts more than half of the area equipped for irrigation is not irrigated. In Greater Sekhukhune District more than half of the area equipped for irrigation is irrigated throughout the year.
Figure 11. 2015 winter irrigated areas in the Limpopo Province (July to August), showing proportion of winter irrigated areas and those not irrigated but equipped for irrigation.
15
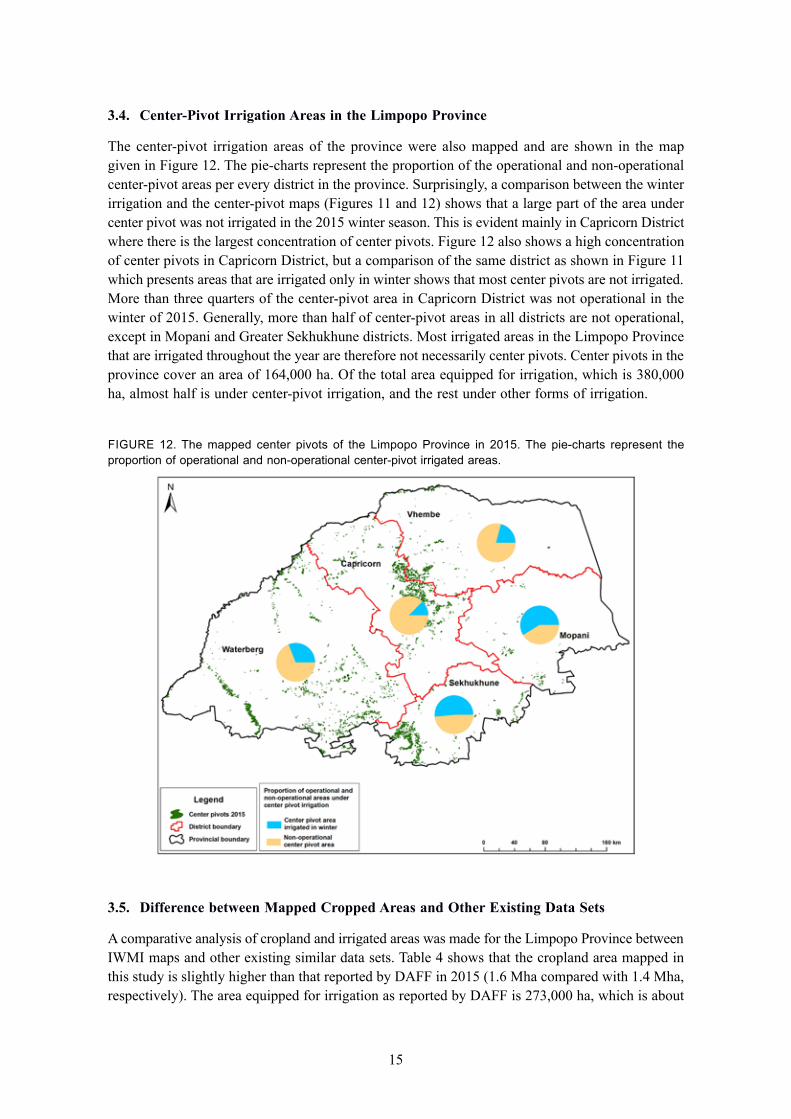
3.4. Center-Pivot Irrigation Areas in the Limpopo Province
The center-pivot irrigation areas of the province were also mapped and are shown in the map given in Figure 12. The pie-charts represent the proportion of the operational and non-operational center-pivot areas per every district in the province. Surprisingly, a comparison between the winter irrigation and the center-pivot maps (Figures 11 and 12) shows that a large part of the area under center pivot was not irrigated in the 2015 winter season. This is evident mainly in Capricorn District where there is the largest concentration of center pivots. Figure 12 also shows a high concentration of center pivots in Capricorn District, but a comparison of the same district as shown in Figure 11 which presents areas that are irrigated only in winter shows that most center pivots are not irrigated. More than three quarters of the center-pivot area in Capricorn District was not operational in the winter of 2015. Generally, more than half of center-pivot areas in all districts are not operational, except in Mopani and Greater Sekhukhune districts. Most irrigated areas in the Limpopo Province that are irrigated throughout the year are therefore not necessarily center pivots. Center pivots in the province cover an area of 164,000 ha. Of the total area equipped for irrigation, which is 380,000 ha, almost half is under center-pivot irrigation, and the rest under other forms of irrigation.
Figure 12. The mapped center pivots of the Limpopo Province in 2015. The pie-charts represent the proportion of operational and non-operational center-pivot irrigated areas.
3.5. Difference between Mapped Cropped Areas and Other Existing Data Sets
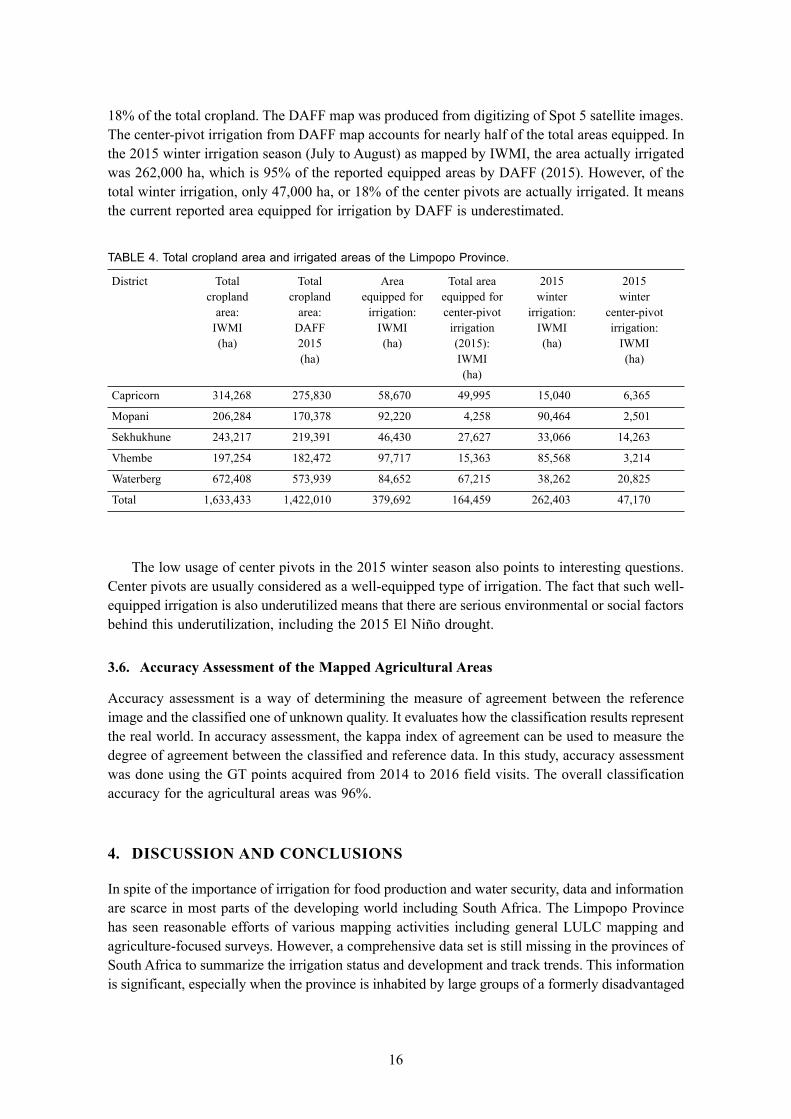
A comparative analysis of cropland and irrigated areas was made for the Limpopo Province between IWMI maps and other existing similar data sets. Table 4 shows that the cropland area mapped in this study is slightly higher than that reported by DAFF in 2015 (1.6 Mha compared with 1.4 Mha, respectively). The area equipped for irrigation as reported by DAFF is 273,000 ha, which is about
16
18% of the total cropland. The DAFF map was produced from digitizing of Spot 5 satellite images. The center-pivot irrigation from DAFF map accounts for nearly half of the total areas equipped. In the 2015 winter irrigation season (July to August) as mapped by IWMI, the area actually irrigated was 262,000 ha, which is 95% of the reported equipped areas by DAFF (2015). However, of the total winter irrigation, only 47,000 ha, or 18% of the center pivots are actually irrigated. It means the current reported area equipped for irrigation by DAFF is underestimated.
TABLe 4. Total cropland area and irrigated areas of the Limpopo Province.
District Total Total Area Total area 2015 2015 cropland cropland equipped for equipped for winter winter area: area: irrigation: center-pivot irrigation: center-pivot IWMI DAFF IWMI irrigation IWMI irrigation: (ha) 2015 (ha) (2015): (ha) IWMI (ha) IWMI (ha) (ha)
Capricorn 314,268 275,830 58,670 49,995 15,040 6,365
Mopani 206,284 170,378 92,220 4,258 90,464 2,501
Sekhukhune 243,217 219,391 46,430 27,627 33,066 14,263
Vhembe 197,254 182,472 97,717 15,363 85,568 3,214
Waterberg 672,408 573,939 84,652 67,215 38,262 20,825
Total 1,633,433 1,422,010 379,692 164,459 262,403 47,170
The low usage of center pivots in the 2015 winter season also points to interesting questions. Center pivots are usually considered as a well-equipped type of irrigation. The fact that such well-equipped irrigation is also underutilized means that there are serious environmental or social factors behind this underutilization, including the 2015 El Niño drought.
3.6. Accuracy Assessment of the Mapped Agricultural Areas
Accuracy assessment is a way of determining the measure of agreement between the reference image and the classified one of unknown quality. It evaluates how the classification results represent the real world. In accuracy assessment, the kappa index of agreement can be used to measure the degree of agreement between the classified and reference data. In this study, accuracy assessment was done using the GT points acquired from 2014 to 2016 field visits. The overall classification accuracy for the agricultural areas was 96%.
4. DISCUSSION AND CONCLUSIONS
In spite of the importance of irrigation for food production and water security, data and information are scarce in most parts of the developing world including South Africa. The Limpopo Province has seen reasonable efforts of various mapping activities including general LULC mapping and agriculture-focused surveys. However, a comprehensive data set is still missing in the provinces of South Africa to summarize the irrigation status and development and track trends. This information is significant, especially when the province is inhabited by large groups of a formerly disadvantaged
17
population that still rely on agriculture, and when the country has clearly set out targets in agriculture and irrigation development.
The province has a total of 1.6 Mha of cropland, with only 262,000 ha irrigated in the 2015 winter season. Large amounts of investments have been made in center-pivot irrigation systems. The center-pivot usage is however low with only 47,000 ha, out of a total of 164,000 ha being equipped and irrigated in the winter of 2015. Further studies are needed to understand the reason for such low utilization of irrigation systems.
There is also a general lack of technical capacity and institutional arrangement within DAFF and LDARD to produce periodic, consistent reports on the status and development of irrigation. Open source, dense, temporal remote sensing data sets provide a new opportunity to achieve this goal at lower costs and to assess agricultural development and production in near real-time. The challenges are however within the departments to build up capacity, and monitor agricultural production and productivity at regular intervals and update on irrigation development. The task becomes easier now that a basis on which to build on is available, especially with necessary capacity-building of relevant DAFF and LDARD staff. One advantage of the remote sensing methodology used in this study is that it can be replicated at other provinces to assess the national irrigation scenario and can also be applied at regular intervals.
REFERENCES
Ali, A. 2016. Analysing growth-track and uncertainties in Asia’s irrigated areas: A fact finding study to track the growth & scale of discrepancies in Asia’s irrigated areas and their potential implications. MSc thesis. WSE-HELWD 16.19. Delft, the Netherlands: UNESCO-IHE Institute for Water Education.
Cai, X.; Sharma, B.R. 2010. Integrating remote sensing, census and weather data for an assessment of rice yield, water consumption and water productivity in the Indo-Gangetic river basin. Agricultural Water Management 97: 309-316.
DAFF (Department of Agriculture, Forestry and Fisheries). 2015. South Africa field boundaries map. Pretoria, South Africa: Department of Agriculture, Forestry and Fisheries, Government of South Africa.
DTI (Department of Trade and Industry). 2003. Provincial economies. Pretoria, South Africa: Department of Trade and Industry (DTI). Available at www.westerncape.gov.za/text/2003/provincial_economies_2003.pdf (accessed on March 18, 2017).
GEOTERRAIMAGE. 2015. 2013-2014 South African national land-cover dataset: Data user report and metadata. GEOTERRAIMAGE (South Africa). Available at www.environment.gov.za/mapsgraphics#national_landcoverwww.geoterraimage.com (accessed on March 06, 2016).
Johansson, R.J. 2005. Micro and macro-level approaches for assessing the value of irrigation water. Policy Research Working Paper 3778. Washington, DC: World Bank.
NEPAD (New Partnership for Africa’s Development). 2014. The programme of work: Operationalising the Malabo Declaration on African Agriculture and CAADP Implementation Strategy and Roadmap. Midrand, South Africa: NEPAD.
NPC (National Planning Commission). 2012. National Development Plan 2030. Our future - make it work. Pretoria: NPC. The Presidency of South Africa http://www.poa.gov.za/news/Documents/NPC%20National%20Development%20Plan%20Vision%202030%20-lo-res.pdf (accessed on March 18, 2017).
Oni, S.; Nesamvuni, A.; Odhiambo, J.; Dagada, M. 2012. The study of agricultural industry in the Limpopo Province (Executive Summary). Limpopo Province: Department of Agricultural Economics and Extension, Centre for Rural Development.
Pienaar, P.L. 2013. Typology of smallholder farming in South Africa’s former homelands: Towards an appropriate classification system. Stellenbosch, South Africa: Stellenbosch University.
Stats-SA (Statistics-SA). 2015. Mid-year population estimates. 2015. Statistics South Africa (Stats SA), Statistical release P0302. Pretoria, South Africa: Stats-SA.

18
Thenkabail, P.; Gangadhara Rao, P.; Biggs, T.; Krishna, M.; Turral, H. 2007. Spectral matching techniques to determine historical land-use/land-cover (LULC) and irrigated areas using time-series 0.1-degree AVHRR Pathfinder datasets. Photogrammetric Engineering & Remote Sensing 73: 1029-1040.
Van Koppen, B.; Nhamo, L.; Cai, X.; Gabriel, M.J.; Sekgala, M.; Shikwambana, S.; Nevhutanda, S.; Matlala, B.; Manyama, D.; Tshikolomo, K. 2017. Smallholder irrigation schemes in Limpopo Province, South Africa. Colombo, Sri Lanka: International Water Management Institute (IWMI). (IWMI Working Paper 174).
Vincent, K.; Cull, T.; Archer, E.R. 2010. Gendered vulnerability to climate change in Limpopo province, South Africa. In: Gender and climate change: An introduction, ed., Dankelman, I. London: Earthscan. Pp. 130-137.
Xiao, X.; Boles, S.; Frolking, S.; Li, C.; Babu, J.Y.; Salas, W.; Moore, B. 2006. Mapping paddy rice agriculture in South and Southeast Asia using multi-temporal MODIS images. Remote Sensing of Environment 100: 95-113.
19
ANNEx 1. TECHNICAL GUIDE ON ODK FIELD SURvEY
This note lays out the detailed methods and requirements for a field survey to determine LULC and information on crops and irrigation. Two options were included for the survey: 1) paper- and GPS-based survey and 2) Android smart phone-/tablet-based survey.
It is important to note that before commencement of the survey, careful planning is required for logistics as well as communications with concerned parties to ensure smooth and successful field trips. Familiarization with the areas to be surveyed will help learn better about the crops, the irrigation systems, and the people.
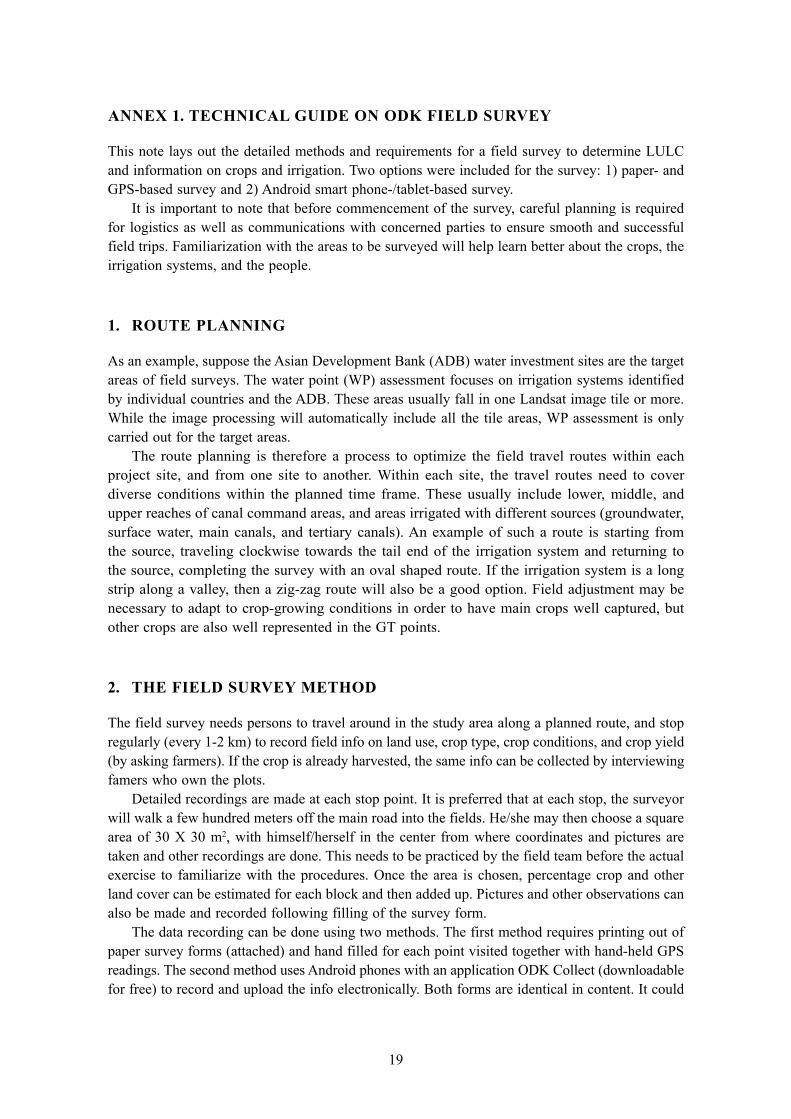
1. ROUTE PLANNING
As an example, suppose the Asian Development Bank (ADB) water investment sites are the target areas of field surveys. The water point (WP) assessment focuses on irrigation systems identified by individual countries and the ADB. These areas usually fall in one Landsat image tile or more. While the image processing will automatically include all the tile areas, WP assessment is only carried out for the target areas.
The route planning is therefore a process to optimize the field travel routes within each project site, and from one site to another. Within each site, the travel routes need to cover diverse conditions within the planned time frame. These usually include lower, middle, and upper reaches of canal command areas, and areas irrigated with different sources (groundwater, surface water, main canals, and tertiary canals). An example of such a route is starting from the source, traveling clockwise towards the tail end of the irrigation system and returning to the source, completing the survey with an oval shaped route. If the irrigation system is a long strip along a valley, then a zig-zag route will also be a good option. Field adjustment may be necessary to adapt to crop-growing conditions in order to have main crops well captured, but other crops are also well represented in the GT points.
2. THE FIELD SURvEY METHOD
The field survey needs persons to travel around in the study area along a planned route, and stop regularly (every 1-2 km) to record field info on land use, crop type, crop conditions, and crop yield (by asking farmers). If the crop is already harvested, the same info can be collected by interviewing famers who own the plots.
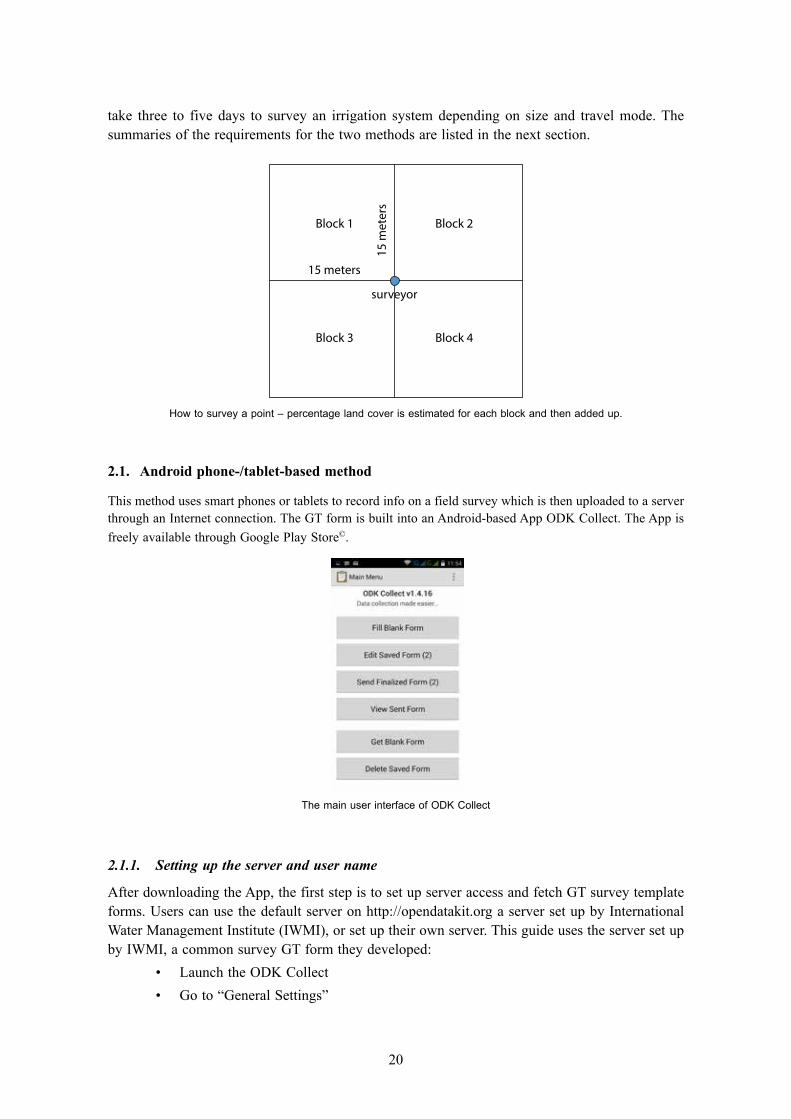
Detailed recordings are made at each stop point. It is preferred that at each stop, the surveyor will walk a few hundred meters off the main road into the fields. He/she may then choose a square area of 30 X 30 m2, with himself/herself in the center from where coordinates and pictures are taken and other recordings are done. This needs to be practiced by the field team before the actual exercise to familiarize with the procedures. Once the area is chosen, percentage crop and other land cover can be estimated for each block and then added up. Pictures and other observations can also be made and recorded following filling of the survey form.
The data recording can be done using two methods. The first method requires printing out of paper survey forms (attached) and hand filled for each point visited together with hand-held GPS readings. The second method uses Android phones with an application ODK Collect (downloadable for free) to record and upload the info electronically. Both forms are identical in content. It could
20
take three to five days to survey an irrigation system depending on size and travel mode. The summaries of the requirements for the two methods are listed in the next section.
Block 1
surveyor
Block 2
Block 3 Block 4
15 meters
15 m
eter
s
How to survey a point – percentage land cover is estimated for each block and then added up.
2.1. Android phone-/tablet-based method
This method uses smart phones or tablets to record info on a field survey which is then uploaded to a server through an Internet connection. The GT form is built into an Android-based App ODK Collect. The App is freely available through Google Play Store©.
The main user interface of ODK Collect
2.1.1. Setting up the server and user name
After downloading the App, the first step is to set up server access and fetch GT survey template forms. Users can use the default server on http://opendatakit.org a server set up by International Water Management Institute (IWMI), or set up their own server. This guide uses the server set up by IWMI, a common survey GT form they developed:
• Launch the ODK Collect• Go to “General Settings”
21
• Select “Configure Platform Settings”• Enter following ODK aggregate settings• URL: http://mdn.iwmi.org• User Name: AS PROVIDED• Password: AS PROVIDED
2.1.2. Fetching blank form/template
On the main menu press “Get blank form” to download the GT template. There are several options available. Users can download the form “Ground Truth Survey China Modified”. The App is ready to be used for field survey.
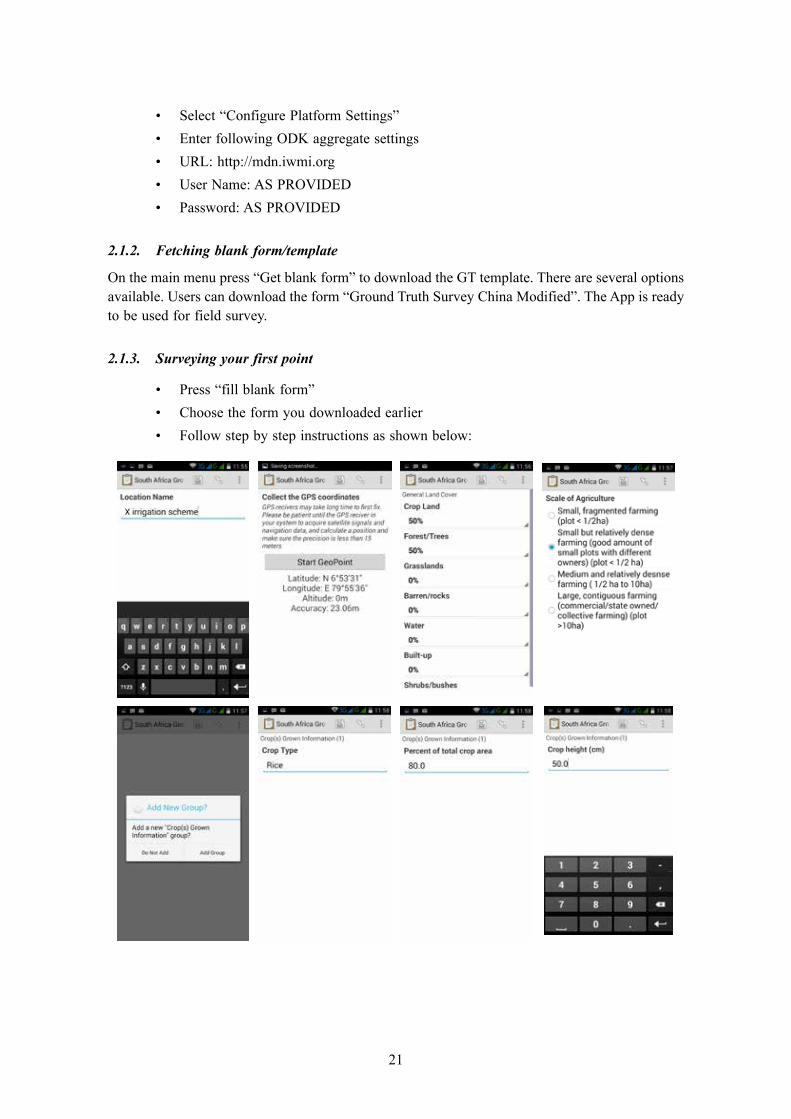
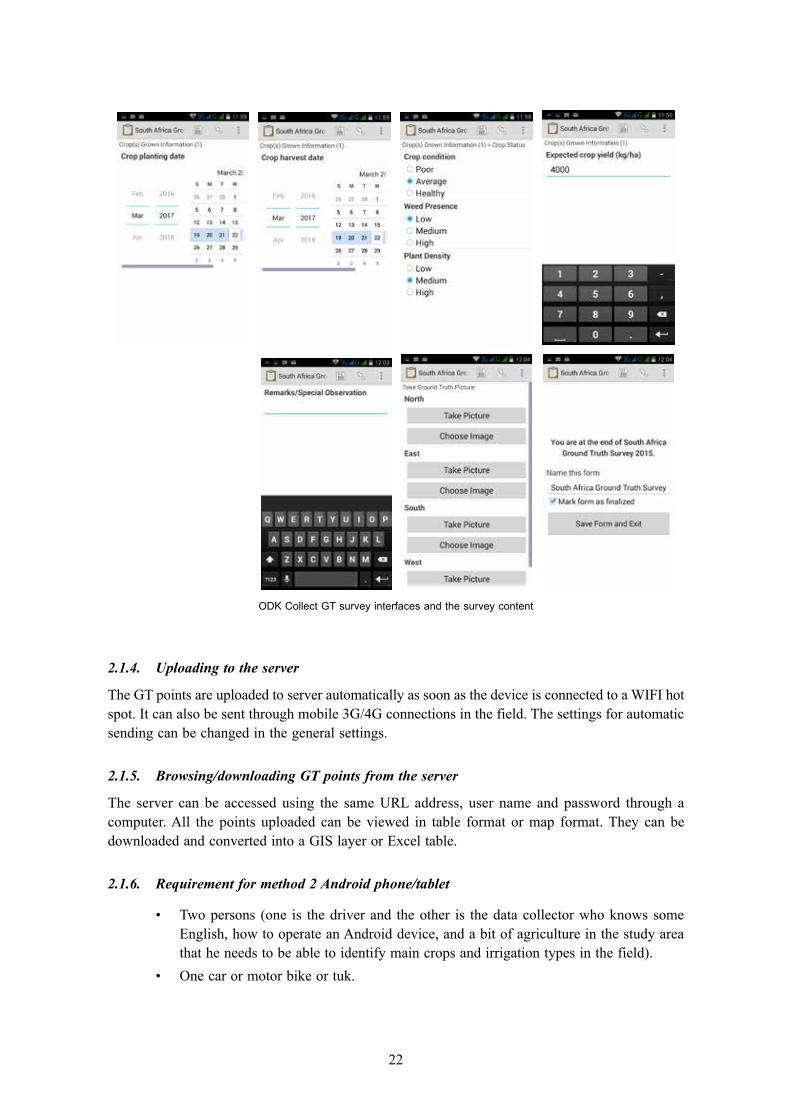
2.1.3. Surveying your first point
• Press “fill blank form” • Choose the form you downloaded earlier• Follow step by step instructions as shown below:
22
2.1.4. Uploading to the server
The GT points are uploaded to server automatically as soon as the device is connected to a WIFI hot spot. It can also be sent through mobile 3G/4G connections in the field. The settings for automatic sending can be changed in the general settings.
2.1.5. Browsing/downloading GT points from the server
The server can be accessed using the same URL address, user name and password through a computer. All the points uploaded can be viewed in table format or map format. They can be downloaded and converted into a GIS layer or Excel table.
2.1.6. Requirement for method 2 Android phone/tablet
• Two persons (one is the driver and the other is the data collector who knows some English, how to operate an Android device, and a bit of agriculture in the study area that he needs to be able to identify main crops and irrigation types in the field).
• One car or motor bike or tuk.
ODK Collect gT survey interfaces and the survey content
23
• An Android phone/tablet which has an Internet connection in the field, a camera, and a minimum of 8 GB storage space, and backup battery/power bank.
• Cash for fuel, meals, and overnight accommodation in small towns (that the team will travel roughly a circle/oval to cover one irrigation system).
• Other personal care items.
2.2. Method based on paper printouts
The contents of the forms are the same as those of the Android-based method. Instead of filling up in a smart phone/tablet, the surveyor has to fill up the one page form on paper, and take GPS coordinates and photos using separate devices. When taking photos, Photo ID needs to be noted down on the GT form to keep track of their location.
2.2.1. Requirement for the survey, based on paper printouts
• Two persons (one is the driver, and the other is the data collector who knows some English and a bit of agriculture in the study area that he needs to be able to identify main crops and irrigation types in the field)
• One car or motor bike or tuk. • A hand-held GPS with spare batteries.• A digital camera with spare batteries. • Paper GT forms.• Cash for fuel, meals, and overnight accommodation in small towns (that the team will
travel roughly a circle/oval to cover one irrigation system).• Other personal care items.
This method requires the data form to be input into the computer after the survey.
24
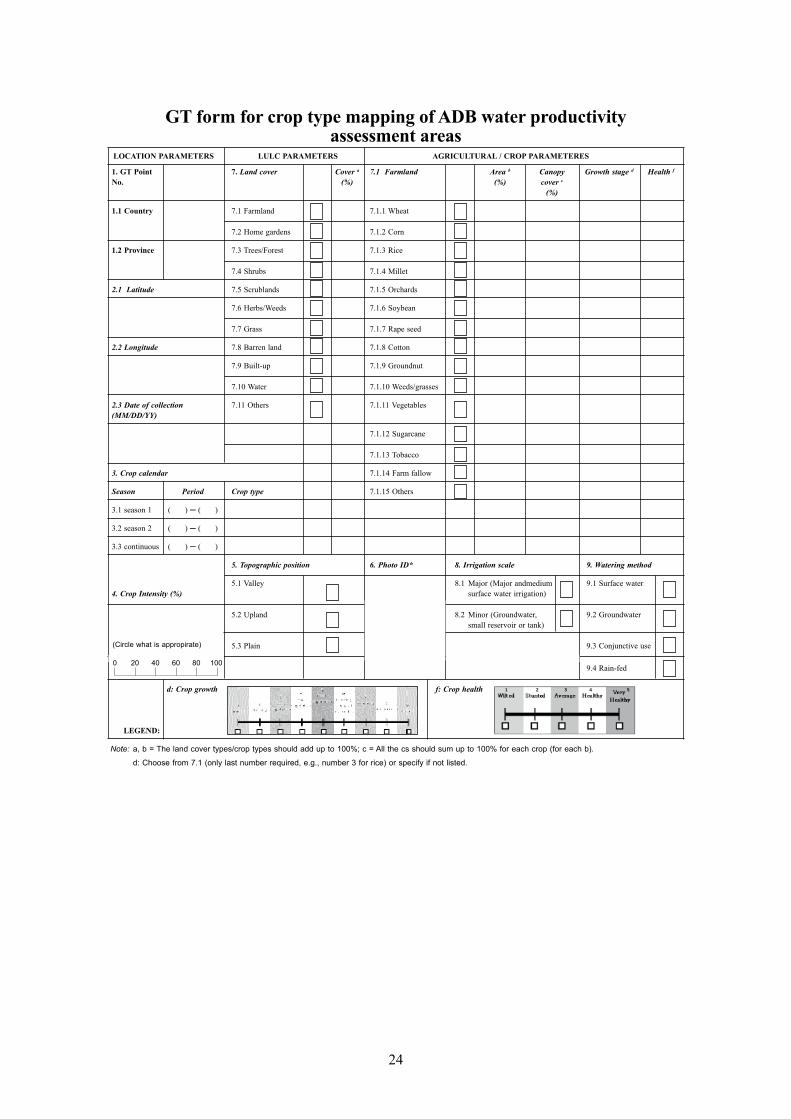
GT form for crop type mapping of ADB water productivity assessment areas
LOCATION PARAMETERS LULC PARAMETERS AGRICULTURAL / CROP PARAMETERES
1. GT Point 7. Land cover Cover a 7.1 Farmland Area b Canopy Growth stage d Health f No. (%) (%) cover c (%)
1.1 Country 7.1 Farmland 7.1.1 Wheat
7.2 Home gardens 7.1.2 Corn
1.2 Province 7.3 Trees/Forest 7.1.3 Rice
7.4 Shrubs 7.1.4 Millet
2.1 Latitude 7.5 Scrublands 7.1.5 Orchards
7.6 Herbs/Weeds 7.1.6 Soybean
7.7 Grass 7.1.7 Rape seed
2.2 Longitude 7.8 Barren land 7.1.8 Cotton
7.9 Built-up 7.1.9 Groundnut
7.10 Water 7.1.10 Weeds/grasses
2.3 Date of collection 7.11 Others 7.1.11 Vegetables (MM/DD/YY)
7.1.12 Sugarcane
7.1.13 Tobacco
3. Crop calendar 7.1.14 Farm fallow
Season Period Crop type 7.1.15 Others
3.1season1 ()─()
3.2season2 ()─()
3.3continuous ()─()
5. Topographic position 6. Photo ID* 8. Irrigation scale 9. Watering method
5.1 Valley 8.1 Major (Major andmedium 9.1 Surface water 4. Crop Intensity (%) surface water irrigation)
5.2 Upland 8.2 Minor (Groundwater, 9.2 Groundwater small reservoir or tank) 5.3 Plain 9.3 Conjunctive use
9.4 Rain-fed
d: Crop growth f: Crop health LEGEND:
Note: a, b = The land cover types/crop types should add up to 100%; c = All the cs should sum up to 100% for each crop (for each b).
d: Choose from 7.1 (only last number required, e.g., number 3 for rice) or specify if not listed.
1 2 3 4 5
(Circle what is appropirate)
0 20 40 60 80 100
25
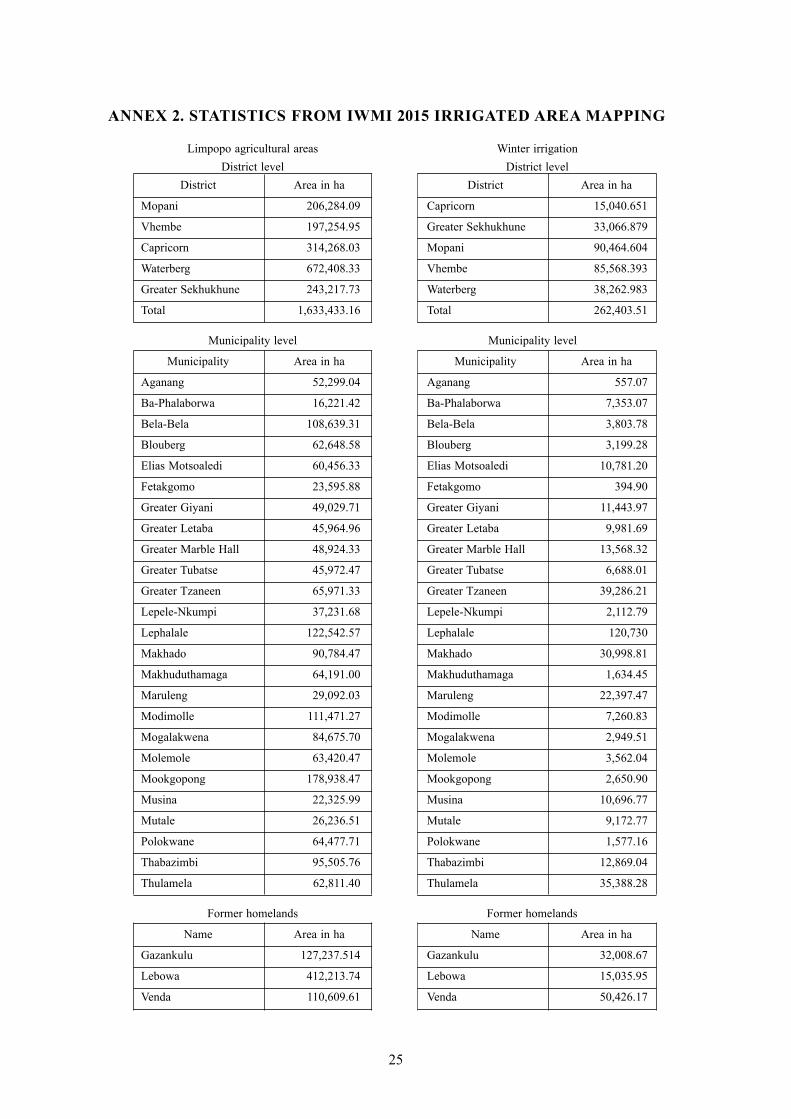
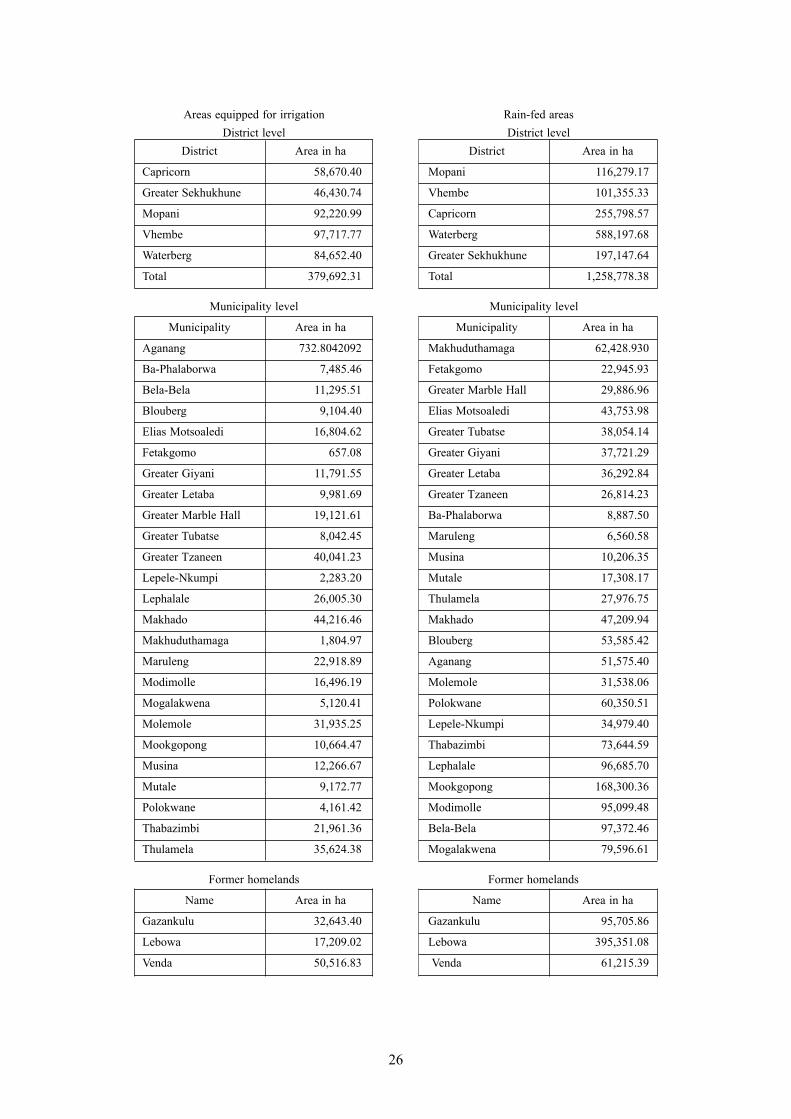
ANNEx 2. STATISTICS FROM IWMI 2015 IRRIGATED AREA MAPPING
Limpopo agricultural areas Winter irrigation District level District level District Area in ha District Area in ha
Mopani 206,284.09 Capricorn 15,040.651
Vhembe 197,254.95 Greater Sekhukhune 33,066.879
Capricorn 314,268.03 Mopani 90,464.604
Waterberg 672,408.33 Vhembe 85,568.393
Greater Sekhukhune 243,217.73 Waterberg 38,262.983
Total 1,633,433.16 Total 262,403.51
Municipality level Municipality level
Municipality Area in ha Municipality Area in ha
Aganang 52,299.04 Aganang 557.07
Ba-Phalaborwa 16,221.42 Ba-Phalaborwa 7,353.07
Bela-Bela 108,639.31 Bela-Bela 3,803.78
Blouberg 62,648.58 Blouberg 3,199.28
Elias Motsoaledi 60,456.33 Elias Motsoaledi 10,781.20
Fetakgomo 23,595.88 Fetakgomo 394.90
Greater Giyani 49,029.71 Greater Giyani 11,443.97
Greater Letaba 45,964.96 Greater Letaba 9,981.69
Greater Marble Hall 48,924.33 Greater Marble Hall 13,568.32
Greater Tubatse 45,972.47 Greater Tubatse 6,688.01
Greater Tzaneen 65,971.33 Greater Tzaneen 39,286.21
Lepele-Nkumpi 37,231.68 Lepele-Nkumpi 2,112.79
Lephalale 122,542.57 Lephalale 120,730
Makhado 90,784.47 Makhado 30,998.81
Makhuduthamaga 64,191.00 Makhuduthamaga 1,634.45
Maruleng 29,092.03 Maruleng 22,397.47
Modimolle 111,471.27 Modimolle 7,260.83
Mogalakwena 84,675.70 Mogalakwena 2,949.51
Molemole 63,420.47 Molemole 3,562.04
Mookgopong 178,938.47 Mookgopong 2,650.90
Musina 22,325.99 Musina 10,696.77
Mutale 26,236.51 Mutale 9,172.77
Polokwane 64,477.71 Polokwane 1,577.16
Thabazimbi 95,505.76 Thabazimbi 12,869.04
Thulamela 62,811.40 Thulamela 35,388.28
Former homelands Former homelands
Name Area in ha Name Area in ha
Gazankulu 127,237.514 Gazankulu 32,008.67
Lebowa 412,213.74 Lebowa 15,035.95
Venda 110,609.61 Venda 50,426.17
26
Areas equipped for irrigation Rain-fed areas District level District level District Area in ha District Area in ha
Capricorn 58,670.40 Mopani 116,279.17
Greater Sekhukhune 46,430.74 Vhembe 101,355.33
Mopani 92,220.99 Capricorn 255,798.57
Vhembe 97,717.77 Waterberg 588,197.68
Waterberg 84,652.40 Greater Sekhukhune 197,147.64
Total 379,692.31 Total 1,258,778.38
Municipality level Municipality level
Municipality Area in ha Municipality Area in ha
Aganang 732.8042092 Makhuduthamaga 62,428.930
Ba-Phalaborwa 7,485.46 Fetakgomo 22,945.93
Bela-Bela 11,295.51 Greater Marble Hall 29,886.96
Blouberg 9,104.40 Elias Motsoaledi 43,753.98
Elias Motsoaledi 16,804.62 Greater Tubatse 38,054.14
Fetakgomo 657.08 Greater Giyani 37,721.29
Greater Giyani 11,791.55 Greater Letaba 36,292.84
Greater Letaba 9,981.69 Greater Tzaneen 26,814.23
Greater Marble Hall 19,121.61 Ba-Phalaborwa 8,887.50
Greater Tubatse 8,042.45 Maruleng 6,560.58
Greater Tzaneen 40,041.23 Musina 10,206.35
Lepele-Nkumpi 2,283.20 Mutale 17,308.17
Lephalale 26,005.30 Thulamela 27,976.75
Makhado 44,216.46 Makhado 47,209.94
Makhuduthamaga 1,804.97 Blouberg 53,585.42
Maruleng 22,918.89 Aganang 51,575.40
Modimolle 16,496.19 Molemole 31,538.06
Mogalakwena 5,120.41 Polokwane 60,350.51
Molemole 31,935.25 Lepele-Nkumpi 34,979.40
Mookgopong 10,664.47 Thabazimbi 73,644.59
Musina 12,266.67 Lephalale 96,685.70
Mutale 9,172.77 Mookgopong 168,300.36
Polokwane 4,161.42 Modimolle 95,099.48
Thabazimbi 21,961.36 Bela-Bela 97,372.46
Thulamela 35,624.38 Mogalakwena 79,596.61
Former homelands Former homelands
Name Area in ha Name Area in ha
Gazankulu 32,643.40 Gazankulu 95,705.86
Lebowa 17,209.02 Lebowa 395,351.08
Venda 50,516.83 Venda 61,215.39
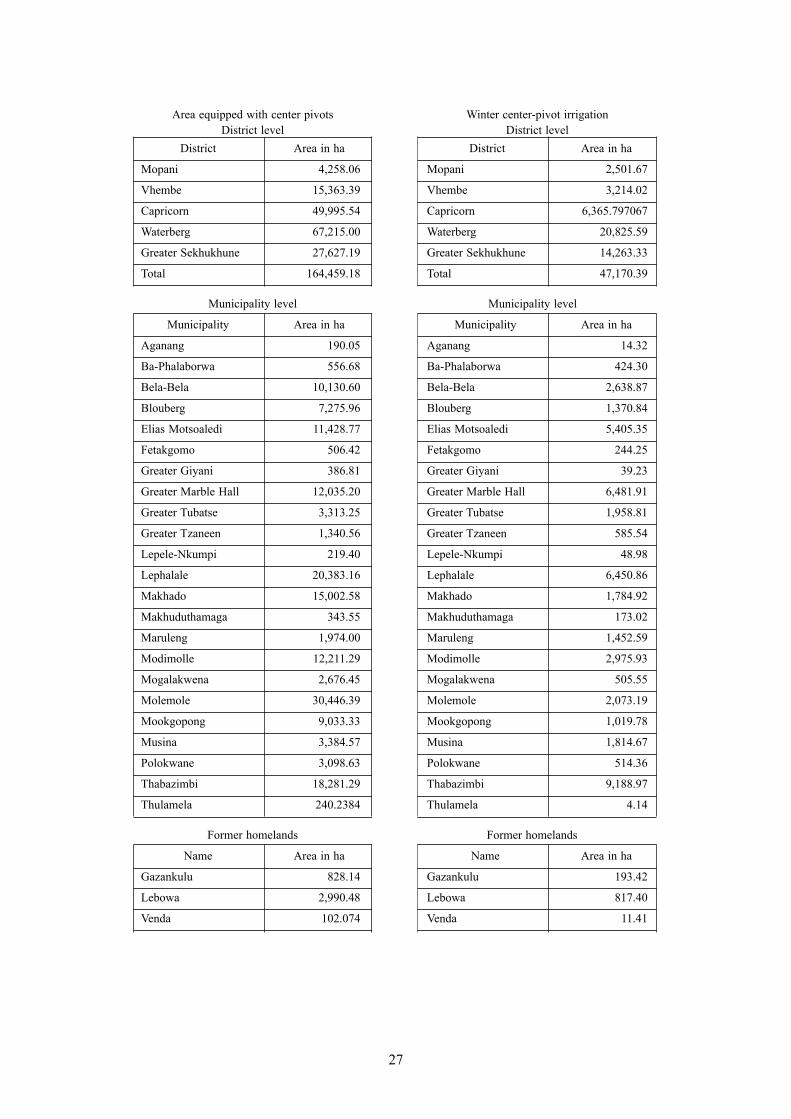
27
Area equipped with center pivots Winter center-pivot irrigation District level District level District Area in ha District Area in ha
Mopani 4,258.06 Mopani 2,501.67
Vhembe 15,363.39 Vhembe 3,214.02
Capricorn 49,995.54 Capricorn 6,365.797067
Waterberg 67,215.00 Waterberg 20,825.59
Greater Sekhukhune 27,627.19 Greater Sekhukhune 14,263.33
Total 164,459.18 Total 47,170.39
Municipality level Municipality level
Municipality Area in ha Municipality Area in ha
Aganang 190.05 Aganang 14.32
Ba-Phalaborwa 556.68 Ba-Phalaborwa 424.30
Bela-Bela 10,130.60 Bela-Bela 2,638.87
Blouberg 7,275.96 Blouberg 1,370.84
Elias Motsoaledi 11,428.77 Elias Motsoaledi 5,405.35
Fetakgomo 506.42 Fetakgomo 244.25
Greater Giyani 386.81 Greater Giyani 39.23
Greater Marble Hall 12,035.20 Greater Marble Hall 6,481.91
Greater Tubatse 3,313.25 Greater Tubatse 1,958.81
Greater Tzaneen 1,340.56 Greater Tzaneen 585.54
Lepele-Nkumpi 219.40 Lepele-Nkumpi 48.98
Lephalale 20,383.16 Lephalale 6,450.86
Makhado 15,002.58 Makhado 1,784.92
Makhuduthamaga 343.55 Makhuduthamaga 173.02
Maruleng 1,974.00 Maruleng 1,452.59
Modimolle 12,211.29 Modimolle 2,975.93
Mogalakwena 2,676.45 Mogalakwena 505.55
Molemole 30,446.39 Molemole 2,073.19
Mookgopong 9,033.33 Mookgopong 1,019.78
Musina 3,384.57 Musina 1,814.67
Polokwane 3,098.63 Polokwane 514.36
Thabazimbi 18,281.29 Thabazimbi 9,188.97
Thulamela 240.2384 Thulamela 4.14
Former homelands Former homelands
Name Area in ha Name Area in ha
Gazankulu 828.14 Gazankulu 193.42
Lebowa 2,990.48 Lebowa 817.40
Venda 102.074 Venda 11.41

IWMI Working Papers
172 Mapping Irrigated Areas in the Limpopo Province, South Africa. Xueliang Cai, James Magidi, Luxon Nhamo and Barbara van Koppen. 2017.
171 Multiple Uses of Small Reservoirs in Crop-livestock Agro-ecosystems of the Volta River Basin with an Emphasis on Livestock Management. Augustine. A. Ayantunde, Mawa Karambiri, Viviane Yameogo and Olufunke O. Cofie. 2016.
170 An Assessment of Integrated Watershed Management in Ethiopia. Gebrehaweria Gebregziabher, Dereje Assefa Abera, Girmay Gebresamuel, Meredith Giordano and Simon Langan. 2016.
169 Methods to Investigate the Hydrology of the Himalayan Springs: A Review. Pennan Chinnasamy and Sanmugam A. Prathapar. 2016.
168 Measuring Transboundary Water Cooperation: Learning from the Past to Inform the Sustainable Development Goals. Davison Saruchera and Jonathan Lautze. 2015.
167 Review of Hydro-economic Models to Address River Basin Management Problems: Structure, Applications and Research Gaps. Maksud Bekchanov, Aditya Sood and Marc Jeuland. 2015.
166 Water Resources Assessment of the Volta River Basin. Marloes Mul, Emmanuel Obuobie, Richard Appoh, Kwabena Kankam-Yeboah, Emmanuel Bekoe-Obeng, Barnabas Amisigo, Frederick Yaw Logah, Benjamin Ghansah and Matthew McCartney. 2015. (Also available in French)
165 Baseline Review and Ecosystem Services Assessment of the Tana River Basin, Kenya. Tracy Baker, Jeremiah Kiptala, Lydia Olaka, Naomi Oates, Asghar Hussain and Matthew McCartney. 2015.
164 Consumer Perceptions of Fruit and Vegetable Quality: Certification and Other Options for Safeguarding Public Health in West Africa. Bernard Keraita and Pay Drechsel. 2015.
163 Characteristics of Urban and Peri-urban Agriculture in West Africa: Results of an Exploratory Survey Conducted in Tamale (Ghana) and Ouagadougou (Burkina Faso). Imogen Bellwood-Howard, Volker Häring, Hanna Karg, Regina Roessler, Johannes Schlesinger and Martina Shakya. 2015.
162 Review Paper on ‘Garden Kits’ in Africa: Lessons Learned and the Potential of Improved Water Management. Douglas J. Merrey and Simon Langan. 2014.
IWMI provides free access to all its publications.Visit
www.iwmi.org/publications/index.aspx
ISSN: 2012-5763e-ISSN: 2478-1134ISBN: 978-92-9090-851-7
Postal AddressP O Box 2075ColomboSri Lanka
Location127 Sunil MawathaPelawattaBattaramullaSri Lanka
Telephone+94-11-2880000
Fax+94-11-2786854
Websitewww.iwmi.org