Embed Size (px)
DESCRIPTION
This is a basic lecture on X-ray Diffraction (XRD) techniques used in materials characterization. Some applications has been also dealt with.
Citation preview

Dr. T. K. Chaudhuri, Professor and HeadDr. K. C. Patel Research and Development CentreDr. K. C. Patel Research and Development Centre
X-ray Diffraction: Basics and Applications

INTRODUCTION: HISTORY
Soft X-rays: 0.12 to 12 keV (10 to 0.10 nm)
Hard X-rays: 12 to 120 keV (0.10 to 0.01 nm) -------- penetrates solid objects; used for diagnostic radiography and crystallography.
What are X-rays?
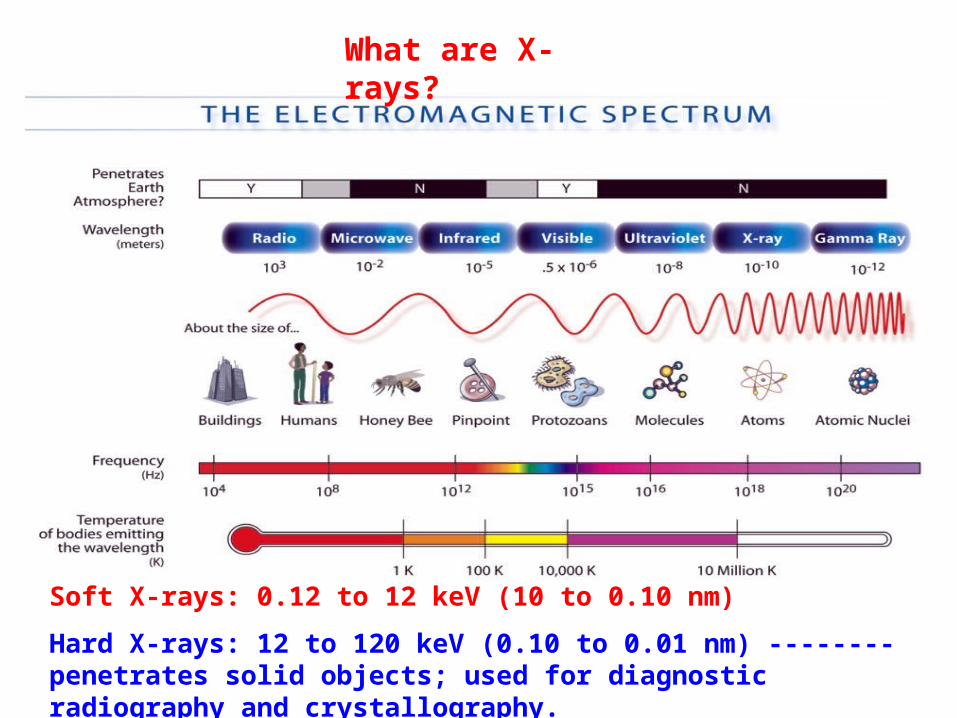
1895 X-rays discovered by Roentgen
1914 First diffraction pattern of a crystal made by Knipping and von Laue
1915 Theory to determine crystal structure from diffraction pattern developed by Bragg
1916 First to study polycrystalline powder : Debye and Scherrer
1953 DNA structure solved by Watson and Crick
Now Diffraction improved by computer technology; methods used to determine atomic structures and in medical applications
History of X-ray : Timeline
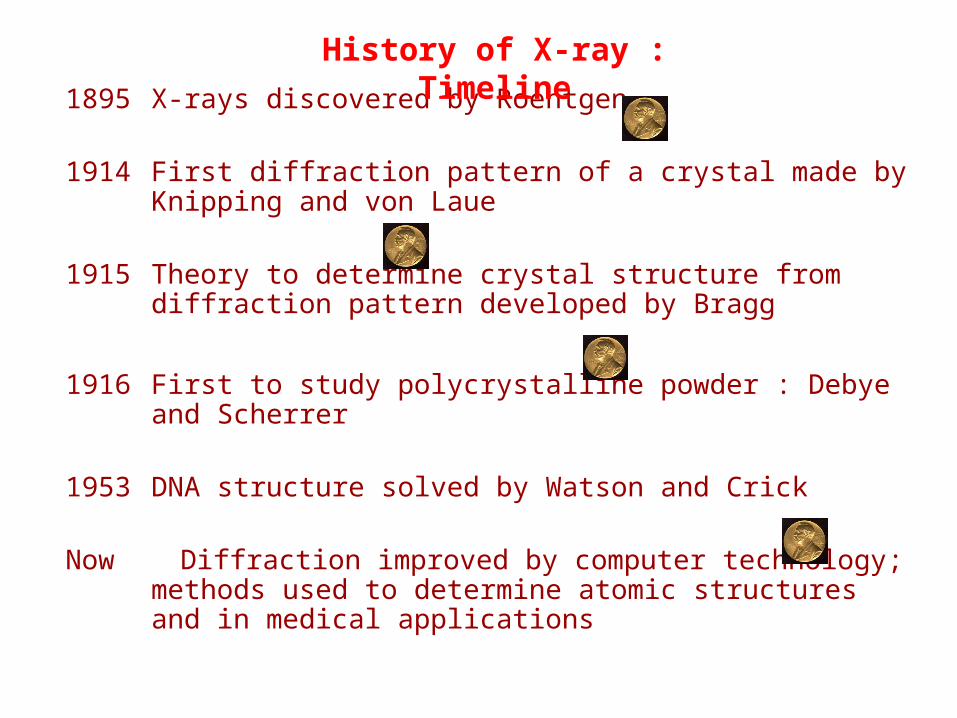
• Wilhelm Conrad Röntgen discovered X-Rays in 1895
• X-ray : unknown ray• Won 1901 Nobel prize in
PhysicsWilhelm Conrad Röntgen (1845-1923)
A modern radiograph of a hand Bertha Röntgen’s Hand 8 Nov, 1895
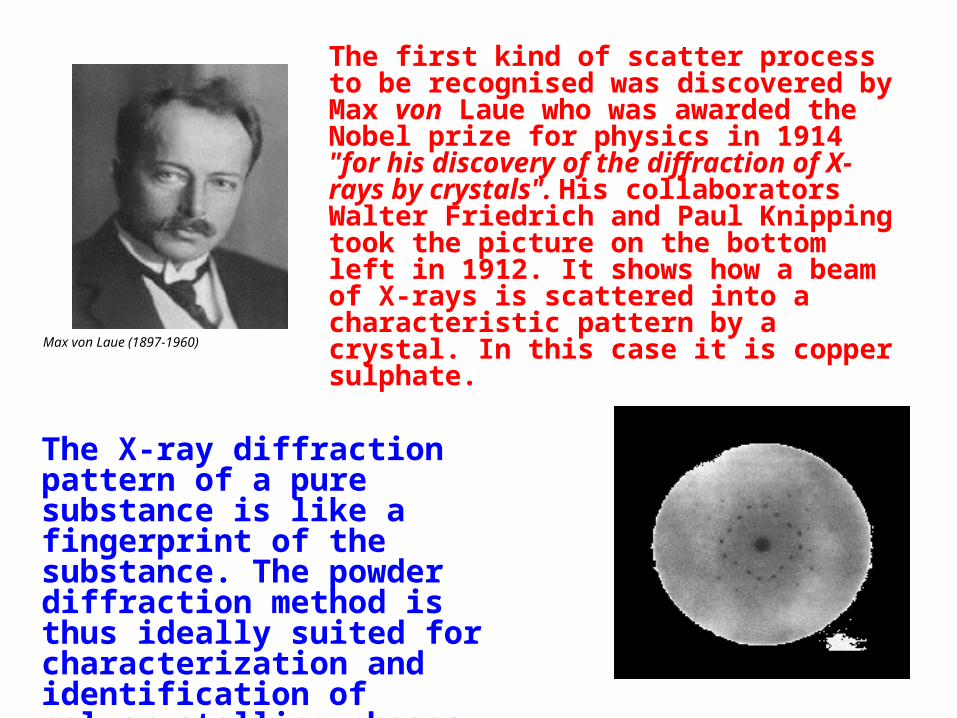
The first kind of scatter process to be recognised was discovered by Max von Laue who was awarded the Nobel prize for physics in 1914 "for his discovery of the diffraction of X-rays by crystals". His collaborators Walter Friedrich and Paul Knipping took the picture on the bottom left in 1912. It shows how a beam of X-rays is scattered into a characteristic pattern by a crystal. In this case it is copper sulphate.
Max von Laue (1897-1960)
The X-ray diffraction pattern of a pure substance is like a fingerprint of the substance. The powder diffraction method is thus ideally suited for characterization and identification of polycrystalline phases.
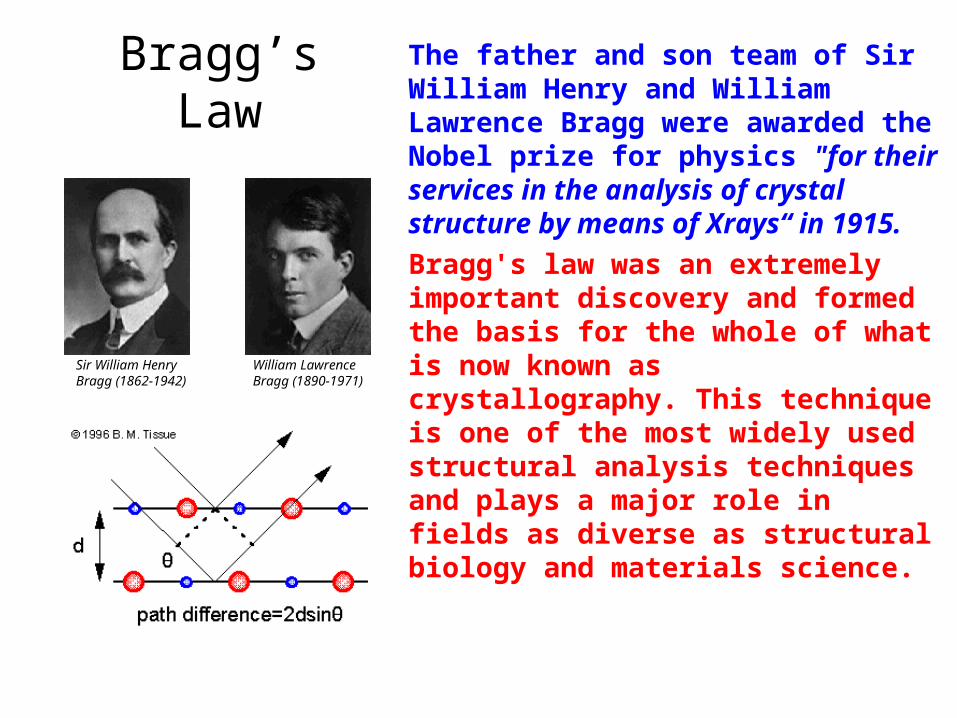
Bragg’s LawThe father and son team of Sir William Henry and William Lawrence Bragg were awarded the Nobel prize for physics "for their services in the analysis of crystal structure by means of Xrays“ in 1915.
Bragg's law was an extremely important discovery and formed the basis for the whole of what is now known as crystallography. This technique is one of the most widely used structural analysis techniques and plays a major role in fields as diverse as structural biology and materials science.
William LawrenceBragg (1890-1971)
Sir William HenryBragg (1862-1942)

BASICS
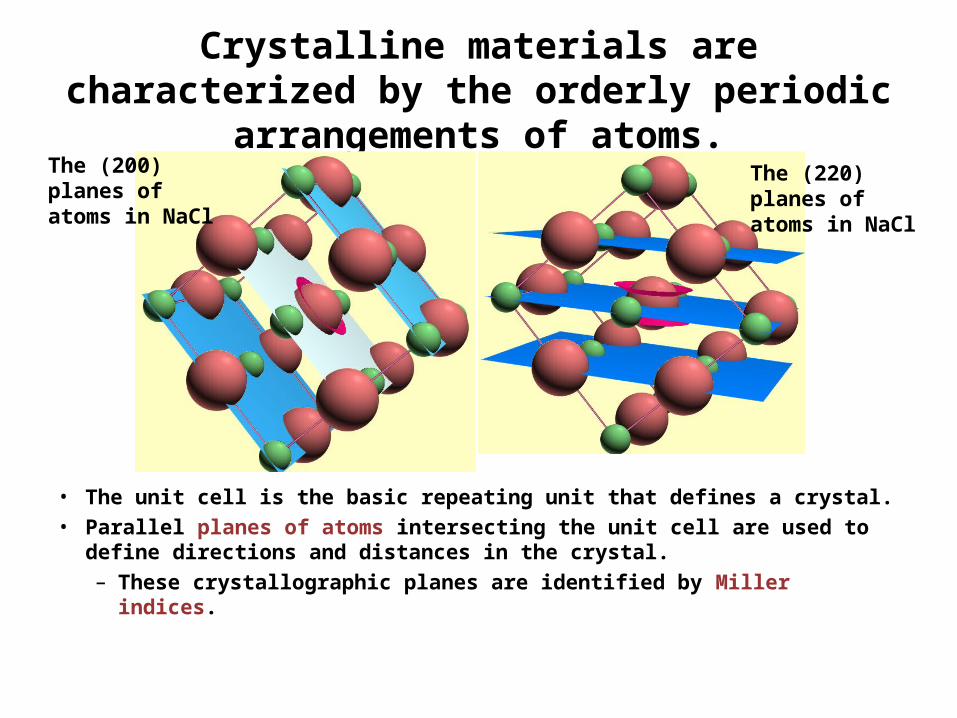
Crystalline materials are characterized by the orderly periodic arrangements of atoms.
• The unit cell is the basic repeating unit that defines a crystal.
• Parallel planes of atoms intersecting the unit cell are used to define directions and distances in the crystal.
– These crystallographic planes are identified by Miller indices.
The (200) planes of atoms in NaCl
The (220) planes of atoms in NaCl
The atoms in a crystal are a periodic array of coherent scatterers and thus can diffract X-rays
• Diffraction occurs when each object in a periodic array scatters radiation coherently, producing concerted constructive interference at specific angles.
• The electrons in an atom coherently scatter light.
– The electrons interact with the oscillating electric field of the light wave.
• Atoms in a crystal form a periodic array of coherent scatterers.
– The wavelength of X rays are similar to the distance between atoms.
– Diffraction from different planes of atoms produces a diffraction pattern, which contains information about the atomic arrangement within the crystal
• X Rays are also reflected, scattered incoherently, absorbed, refracted, and transmitted when they interact with matter.
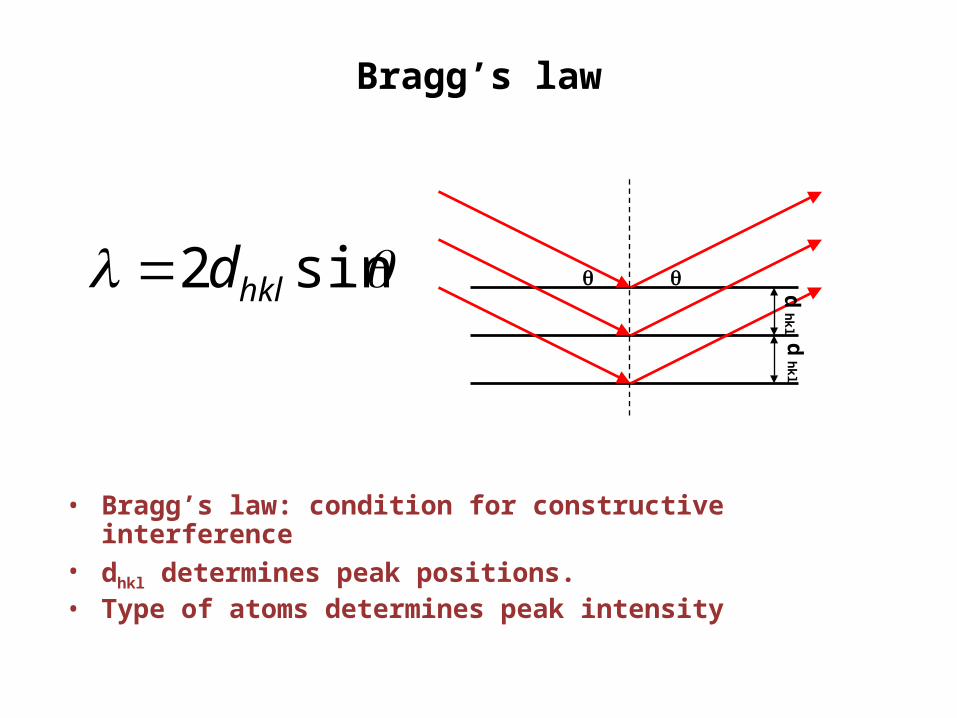
Bragg’s law
• Bragg’s law: condition for constructive interference• dhkl determines peak positions. • Type of atoms determines peak intensity
sin2 hkld
dh
kld
hkl
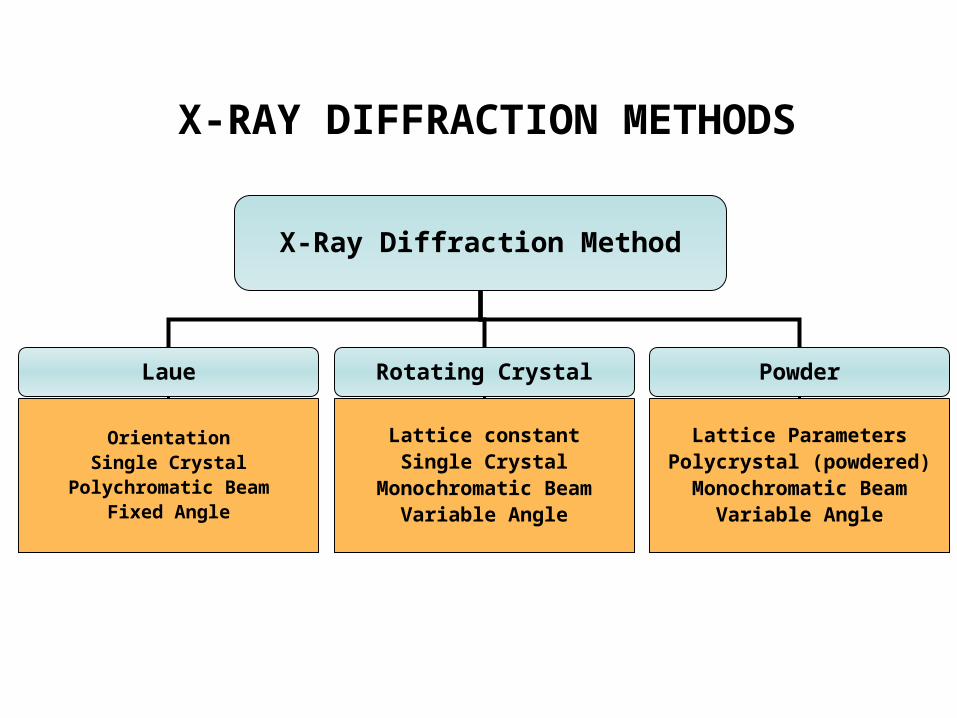
X-RAY DIFFRACTION METHODS
X-Ray Diffraction Method
Laue Rotating Crystal Powder
OrientationSingle Crystal
Polychromatic BeamFixed Angle
Lattice constantSingle Crystal
Monochromatic BeamVariable Angle
Lattice ParametersPolycrystal (powdered)Monochromatic Beam
Variable Angle
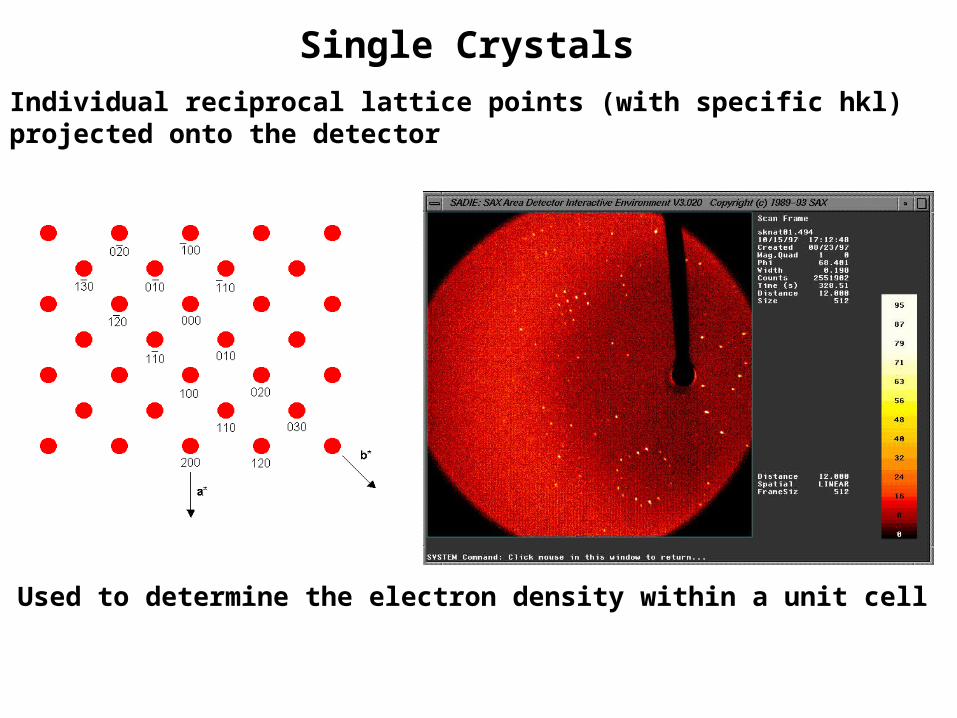
Single Crystals
Individual reciprocal lattice points (with specific hkl) projected onto the detector
Used to determine the electron density within a unit cell
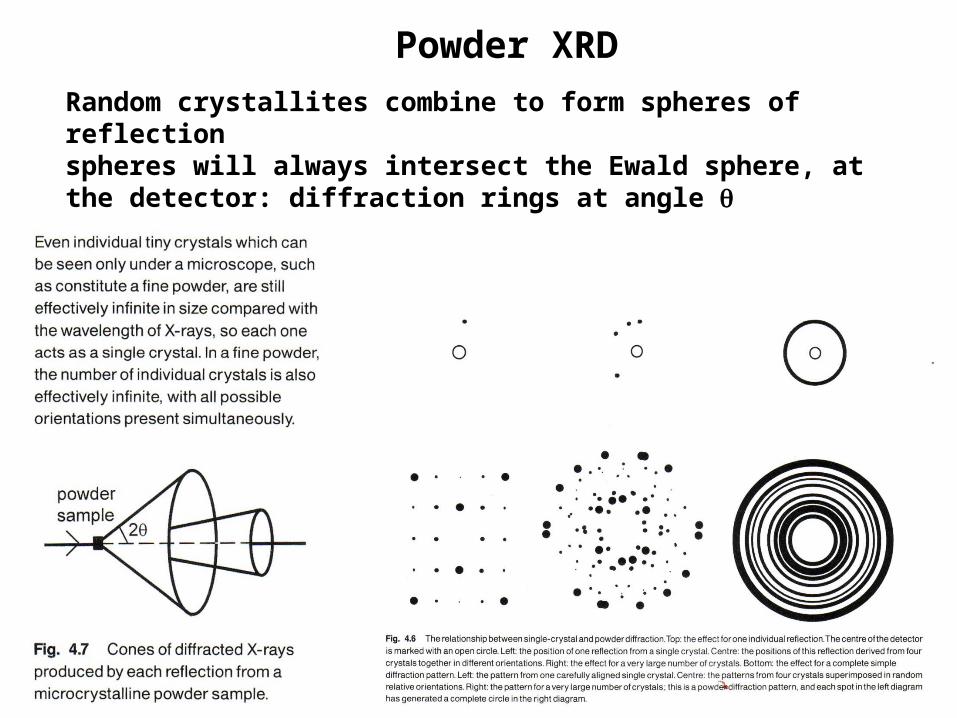
Powder XRD
Random crystallites combine to form spheres of reflectionspheres will always intersect the Ewald sphere, at the detector: diffraction rings at angle

Debye Scherrer Camera A very small amount of powdered material is sealed into a fine capillary tube made from glass that does not diffract x-rays.
The specimen is placed in the Debye Scherrer camera and is accurately aligned to be in the centre of the camera. X-rays enter the camera through a collimator.
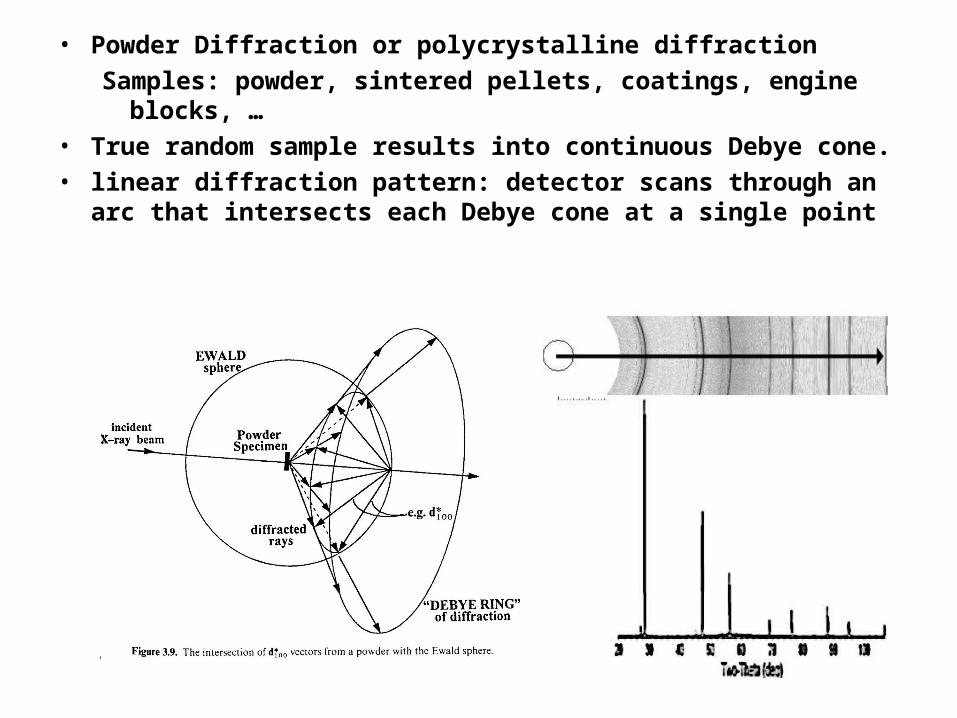
• Powder Diffraction or polycrystalline diffraction
Samples: powder, sintered pellets, coatings, engine blocks, … • True random sample results into continuous Debye cone.• linear diffraction pattern: detector scans through an arc that
intersects each Debye cone at a single point
MEASUREMENT OF XRD:
DIFFRACTOMETERS
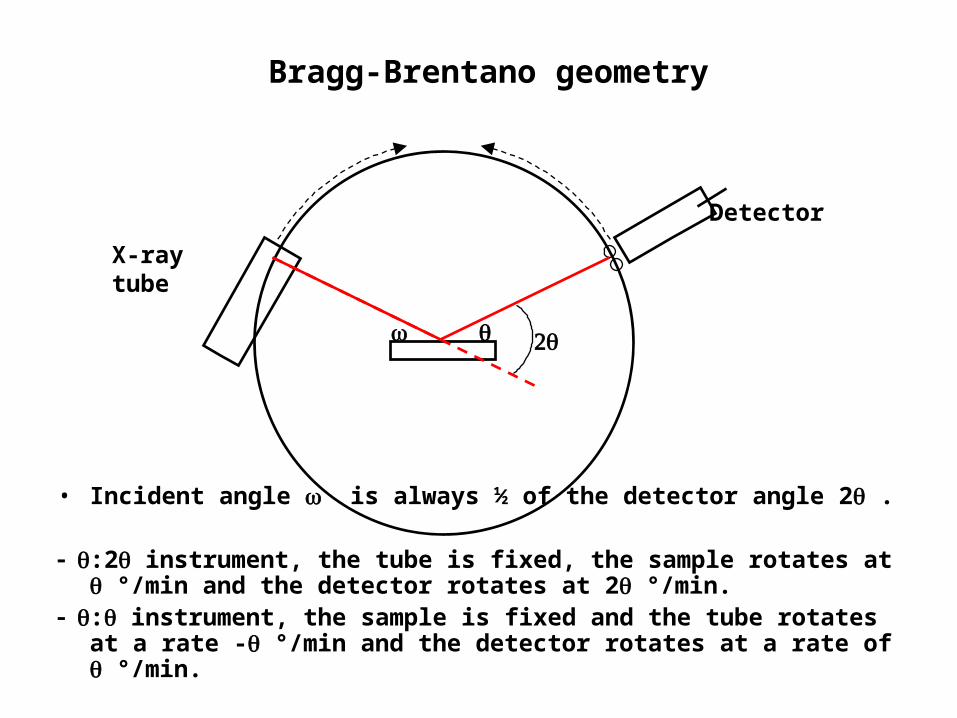
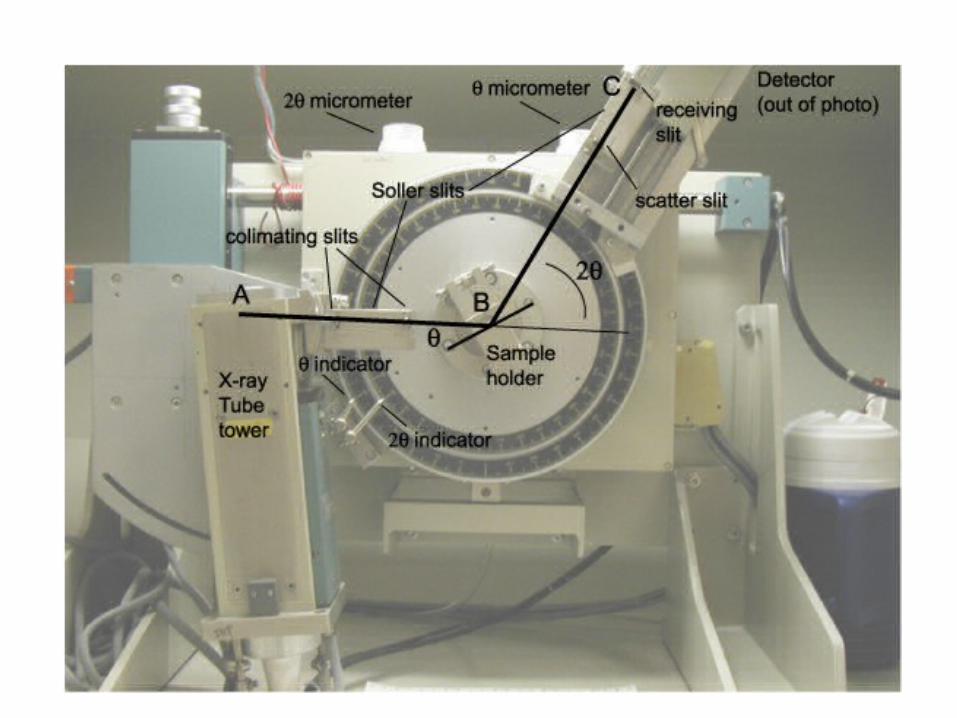
Bragg-Brentano geometry
• Incident angle is always ½ of the detector angle 2 .
:2 instrument, the tube is fixed, the sample rotates at °/min and the detector rotates at 2 °/min.
: instrument, the sample is fixed and the tube rotates at a rate - °/min and the detector rotates at a rate of °/min.
X-ray tube
Detector
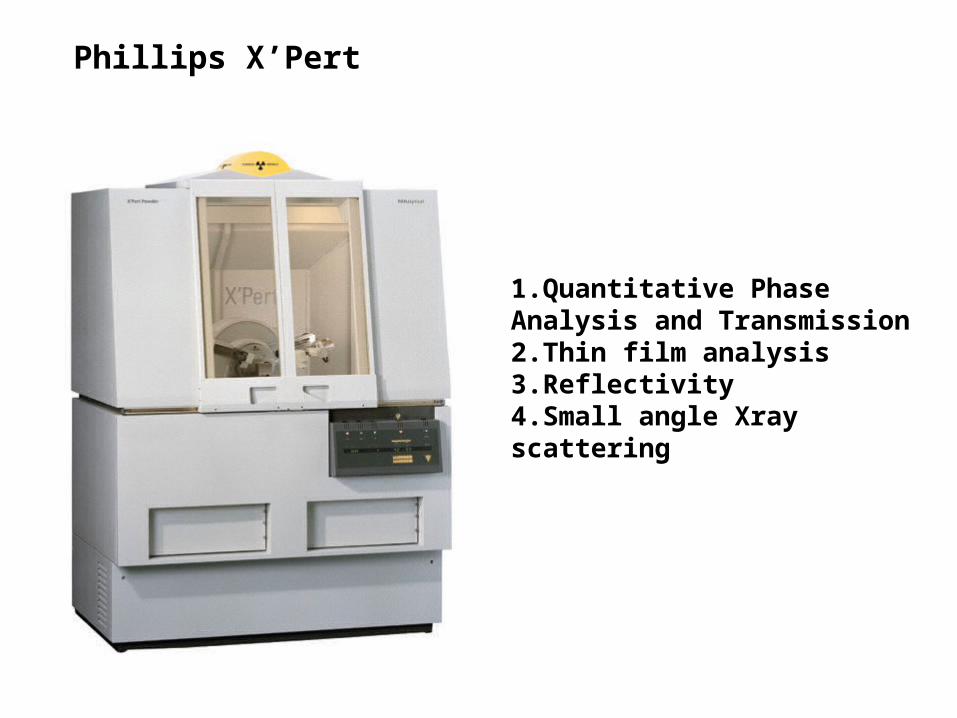
1.Quantitative Phase Analysis and Transmission2.Thin film analysis3.Reflectivity4.Small angle Xray scattering
Phillips X’Pert
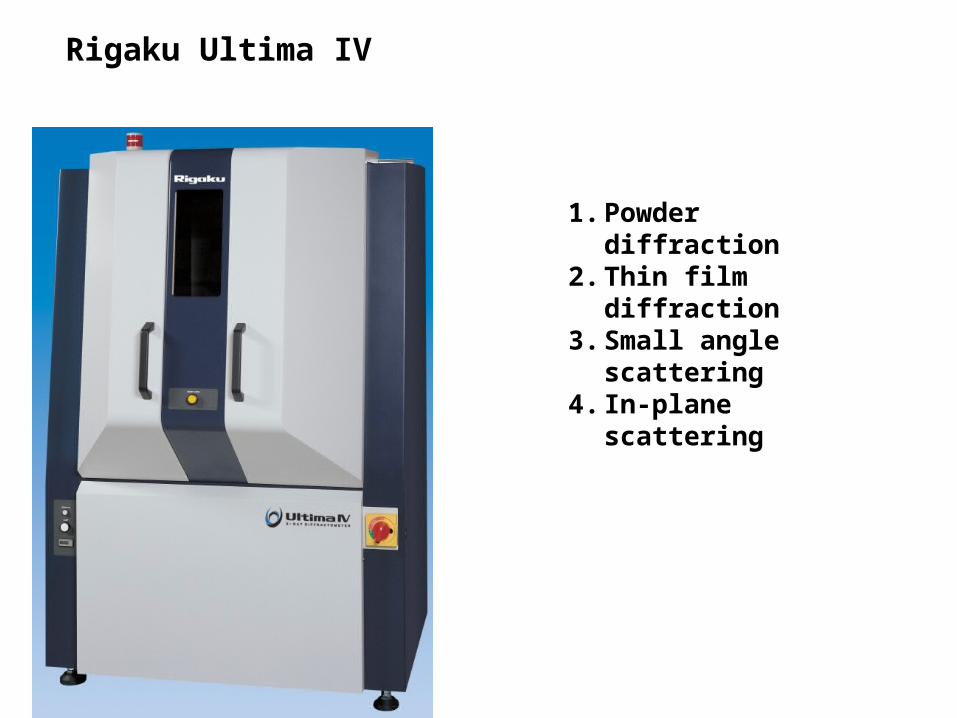
1. Powder diffraction2. Thin film diffraction3. Small angle
scattering4. In-plane scattering
Rigaku Ultima IV
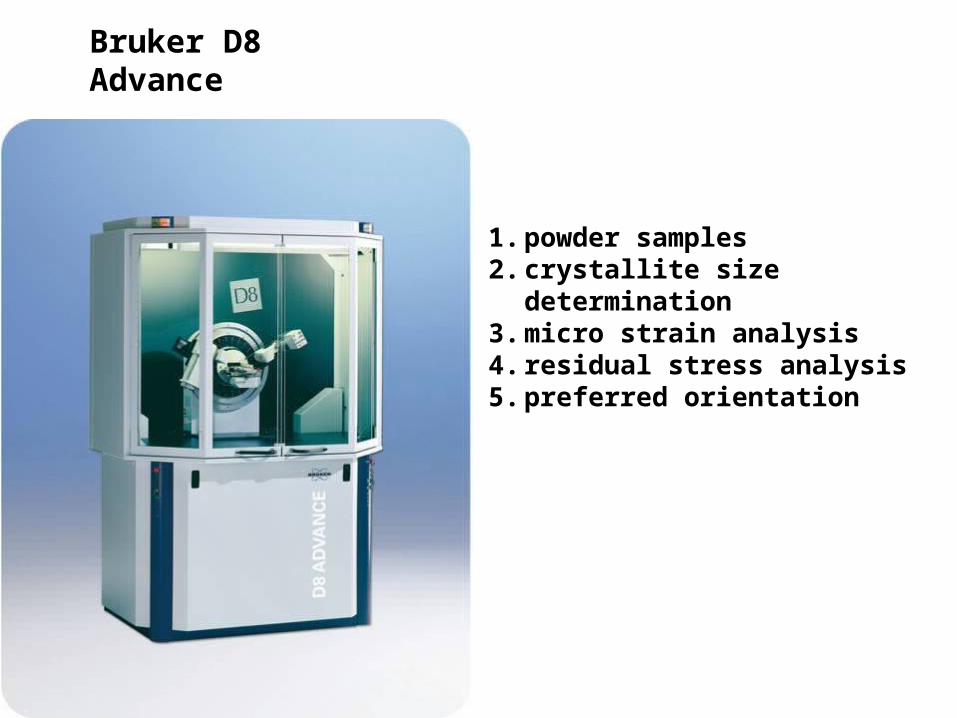
Bruker D8 Advance
1. powder samples 2. crystallite size determination3. micro strain analysis4. residual stress analysis5. preferred orientation
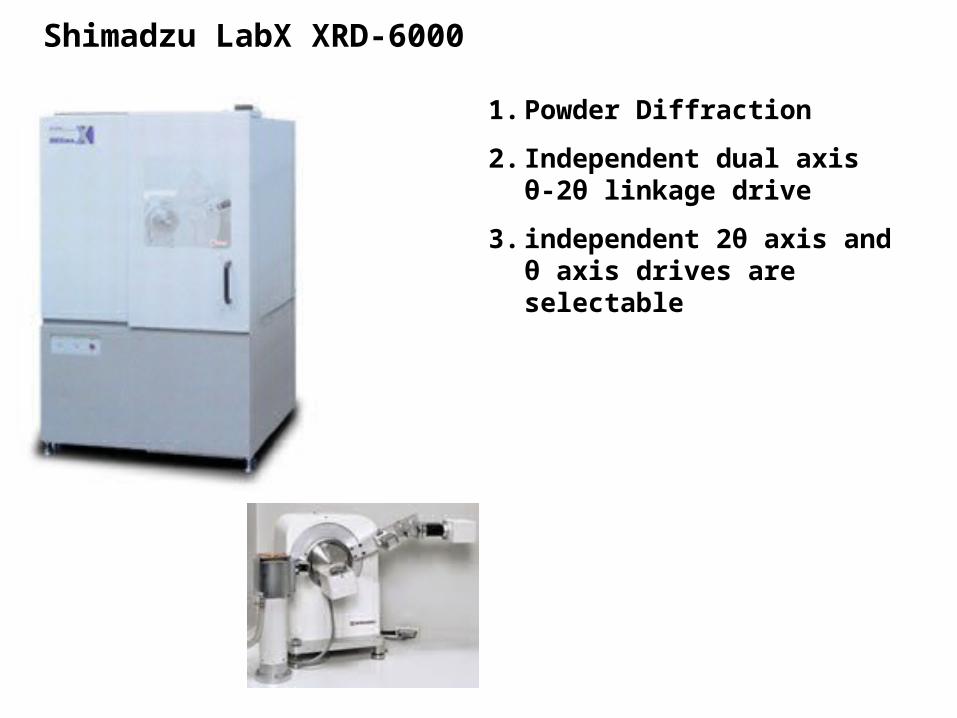
Shimadzu LabX XRD-6000
1. Powder Diffraction
2. Independent dual axis θ-2θ linkage drive
3. independent 2θ axis and θ axis drives are selectable
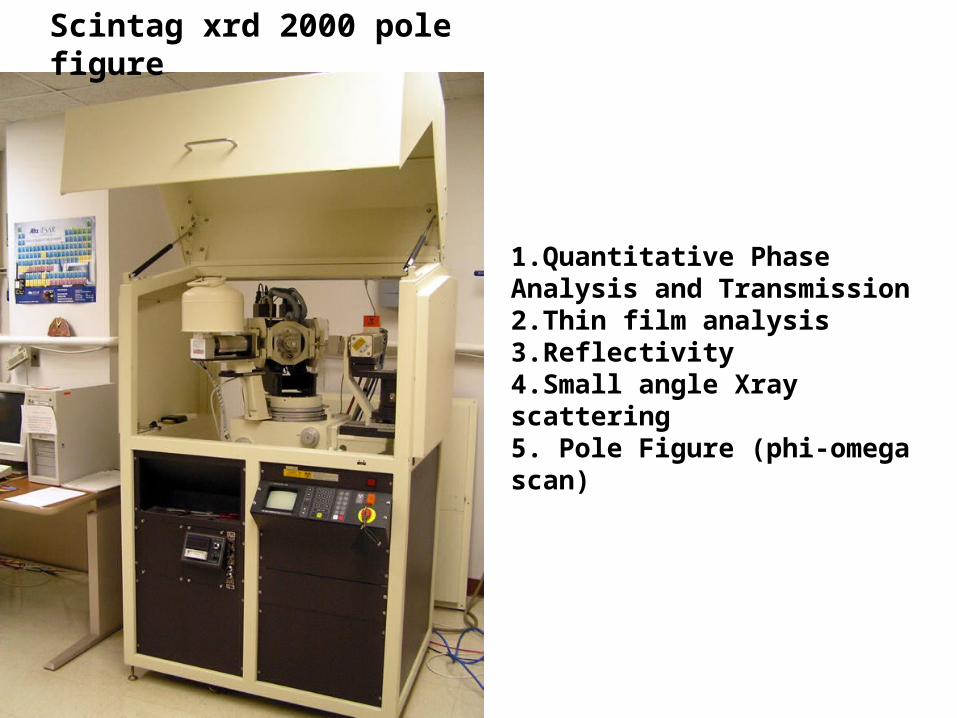
Scintag xrd 2000 pole figure
1.Quantitative Phase Analysis and Transmission2.Thin film analysis3.Reflectivity4.Small angle Xray scattering5. Pole Figure (phi-omega scan)
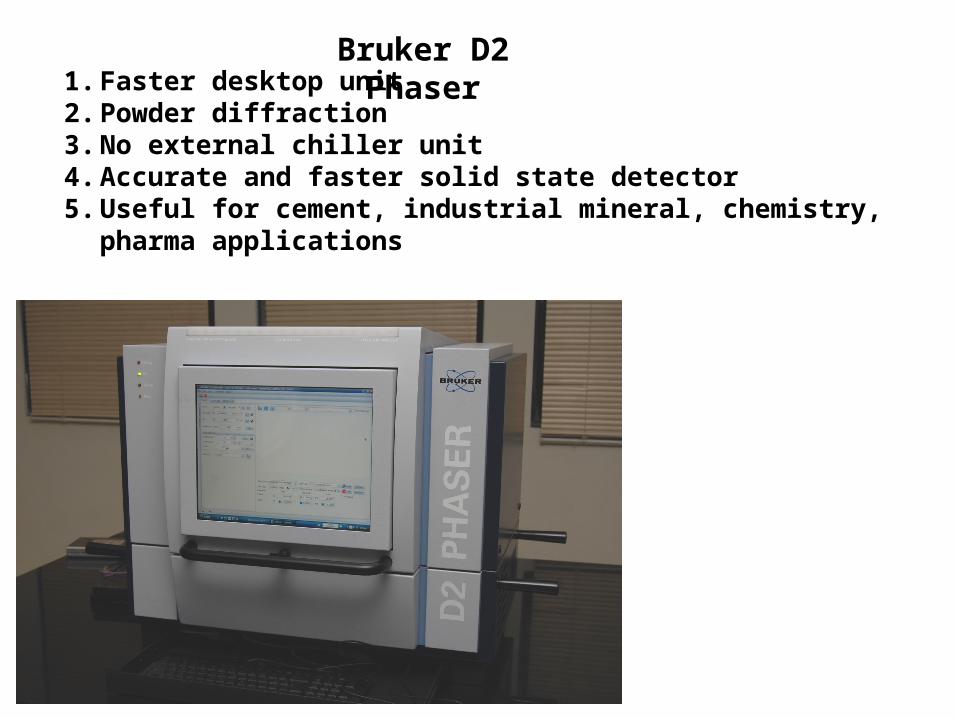
1. Faster desktop unit 2. Powder diffraction3. No external chiller unit4. Accurate and faster solid state detector5. Useful for cement, industrial mineral, chemistry, pharma
applications
Bruker D2 Phaser
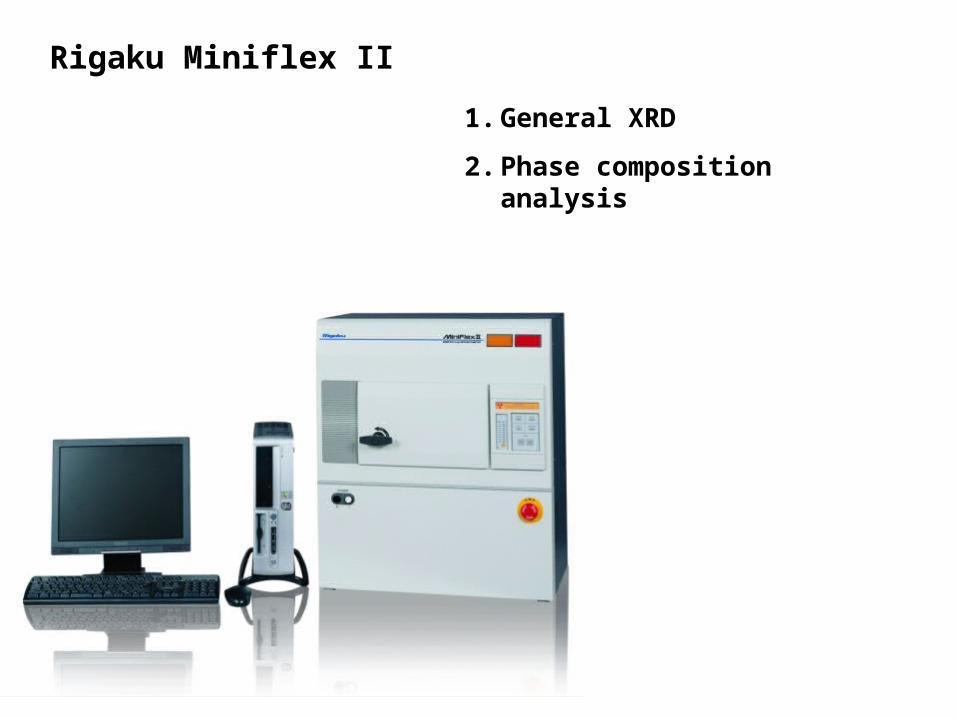
Rigaku Miniflex II
1. General XRD
2. Phase composition analysis
X-ray diffractographs: Analysis
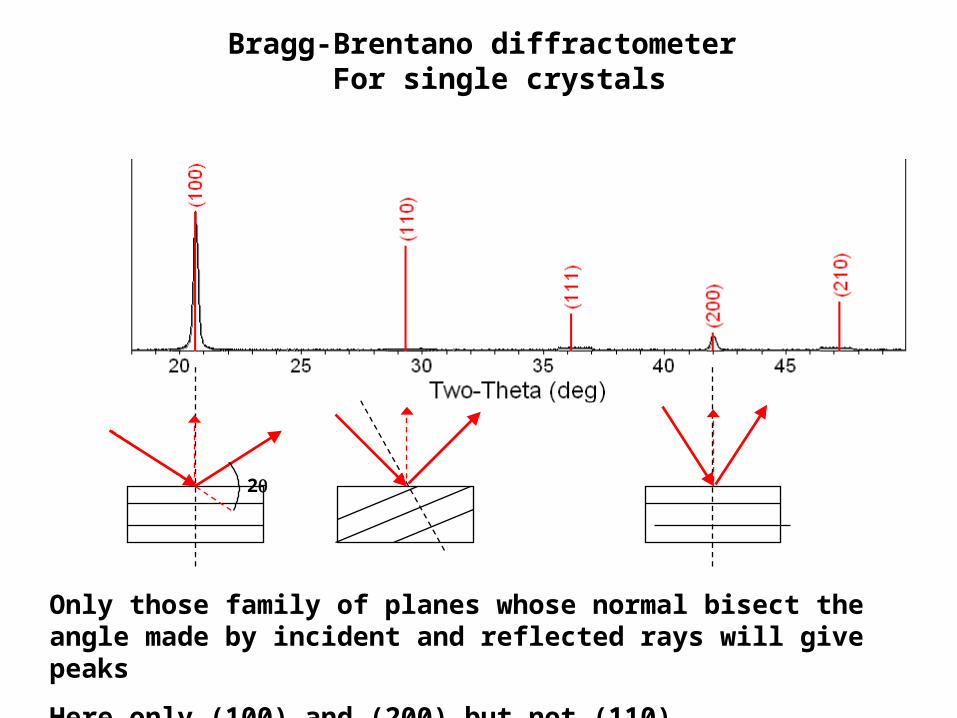
Bragg-Brentano diffractometer For single crystals
2
Only those family of planes whose normal bisect the angle made by incident and reflected rays will give peaks
Here only (100) and (200) but not (110)
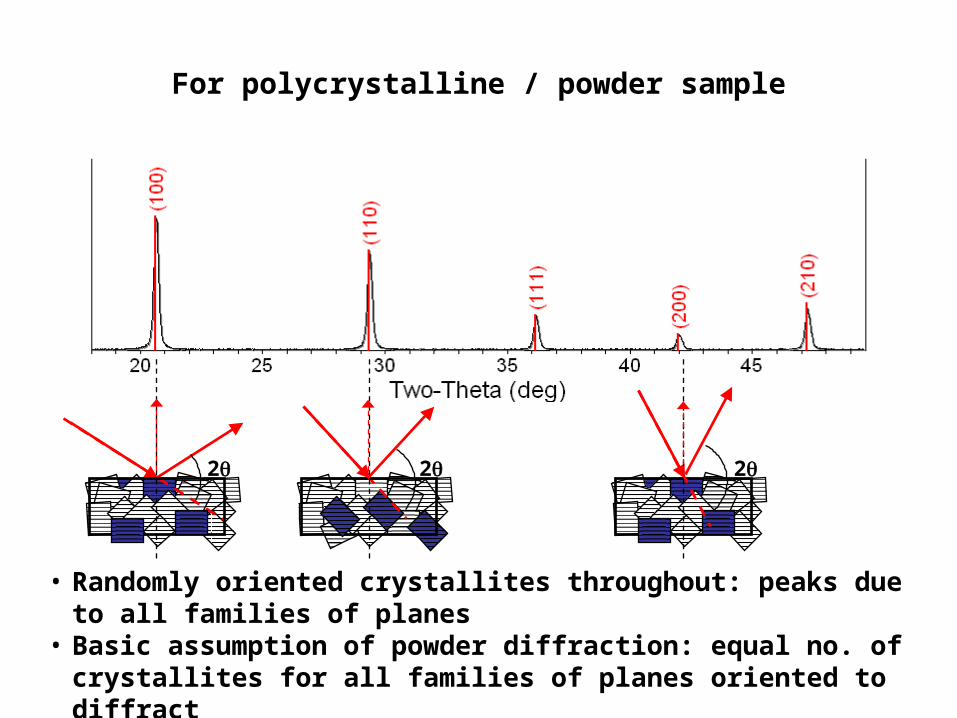
For polycrystalline / powder sample
2 2 2
• Randomly oriented crystallites throughout: peaks due to all families of planes
• Basic assumption of powder diffraction: equal no. of crystallites for all families of planes oriented to diffract
10 20 30 40
2
PowderCell 2 .0
Atomic distribution in the unit cell
Peak relative intensities
Unit cell Symmetry and size
Peak positions
a
cb
Peak shapes
Particle size and defects
Background
Diffuse scattering, sample holder, matrix, amorphous phases, etc...
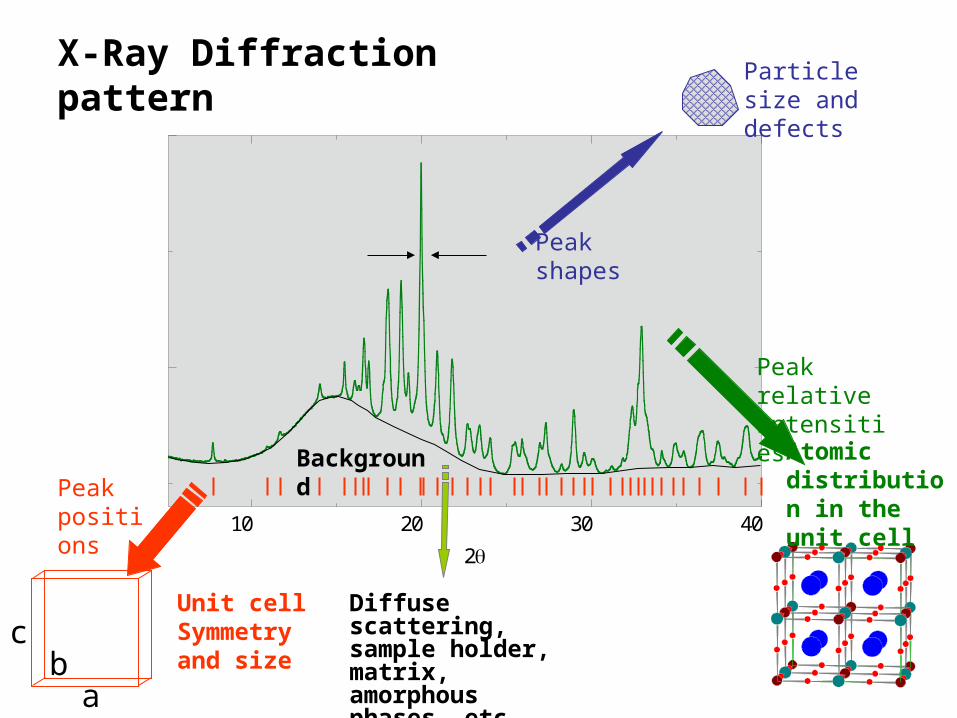
X-Ray Diffraction pattern
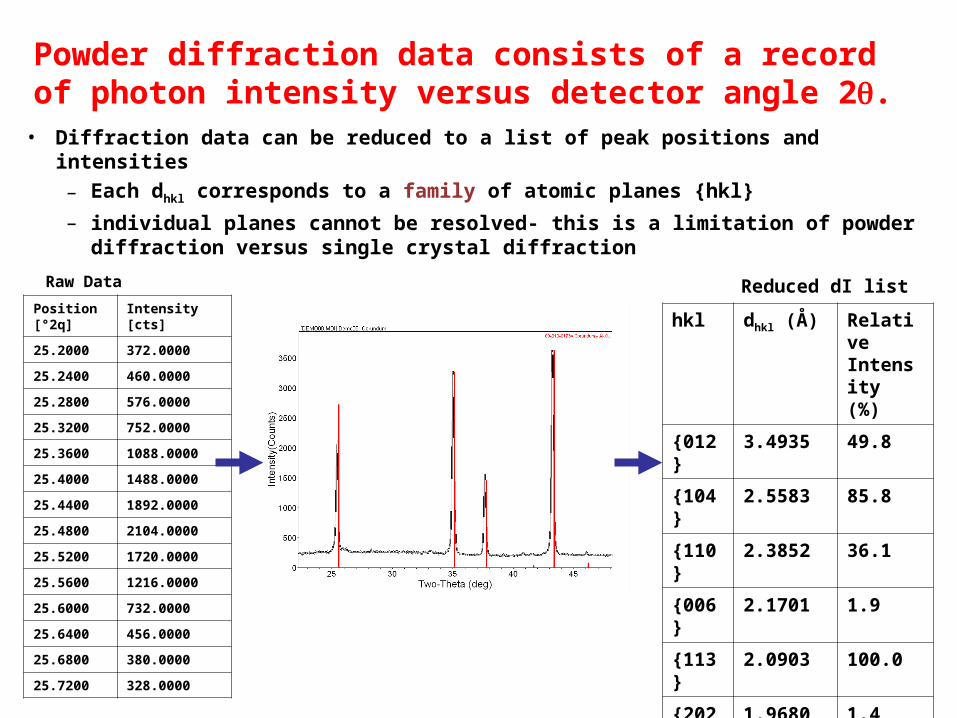
Powder diffraction data consists of a record of photon intensity versus detector angle 2.
• Diffraction data can be reduced to a list of peak positions and intensities
– Each dhkl corresponds to a family of atomic planes {hkl}
– individual planes cannot be resolved- this is a limitation of powder diffraction versus single crystal diffraction
hkl dhkl (Å) Relative Intensity (%)
{012} 3.4935 49.8
{104} 2.5583 85.8
{110} 2.3852 36.1
{006} 2.1701 1.9
{113} 2.0903 100.0
{202} 1.9680 1.4
Position[°2q]
Intensity [cts]
25.2000 372.0000
25.2400 460.0000
25.2800 576.0000
25.3200 752.0000
25.3600 1088.0000
25.4000 1488.0000
25.4400 1892.0000
25.4800 2104.0000
25.5200 1720.0000
25.5600 1216.0000
25.6000 732.0000
25.6400 456.0000
25.6800 380.0000
25.7200 328.0000
Raw Data Reduced dI list
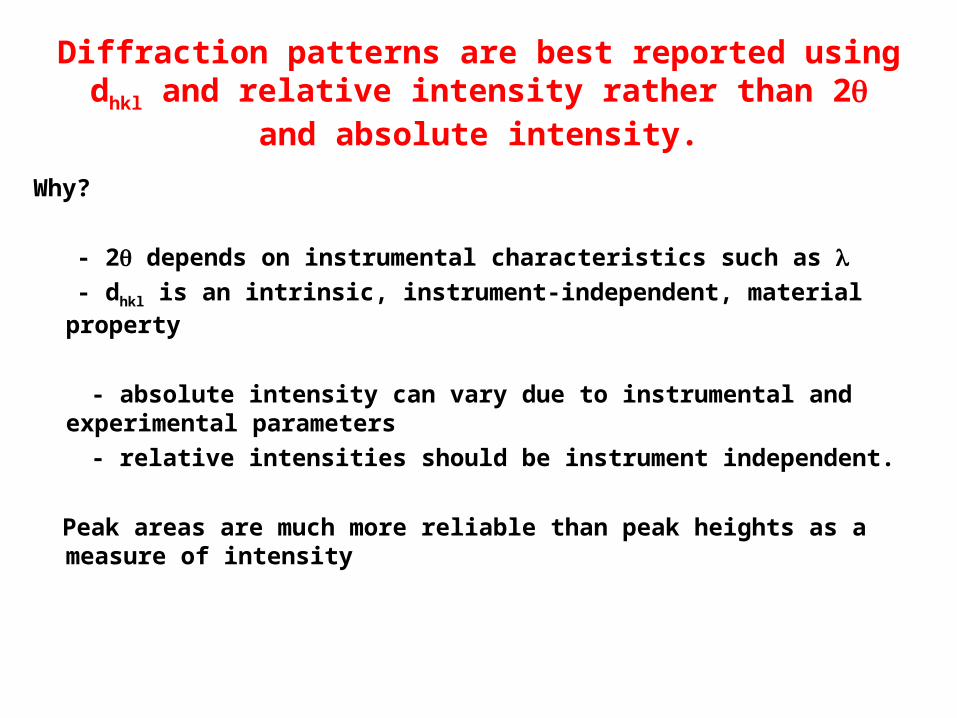
Diffraction patterns are best reported using dhkl and relative intensity rather than 2 and absolute intensity.
Why?
- 2 depends on instrumental characteristics such as - dhkl is an intrinsic, instrument-independent, material property
- absolute intensity can vary due to instrumental and experimental parameters
- relative intensities should be instrument independent.
Peak areas are much more reliable than peak heights as a measure of intensity
APPLICATIONS OF X-ray Diffraction
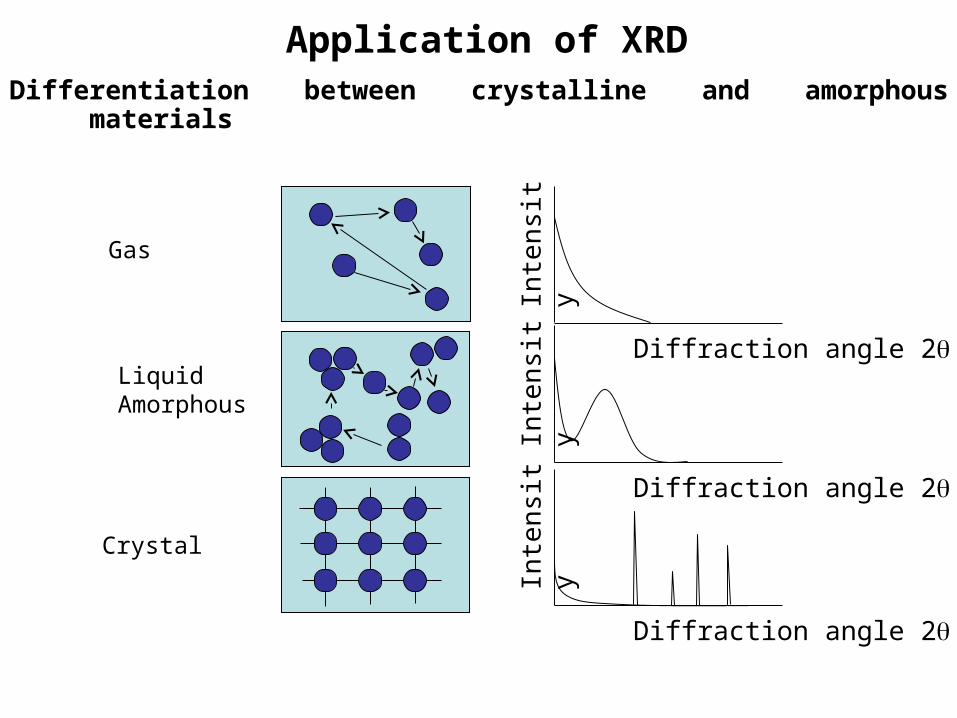
Application of XRDDifferentiation between crystalline and amorphous materials
Diffraction angle 2
Inte
nsit
y
Gas
LiquidAmorphous
Crystal
Diffraction angle 2
Inte
nsit
y
Diffraction angle 2
Inte
nsit
y
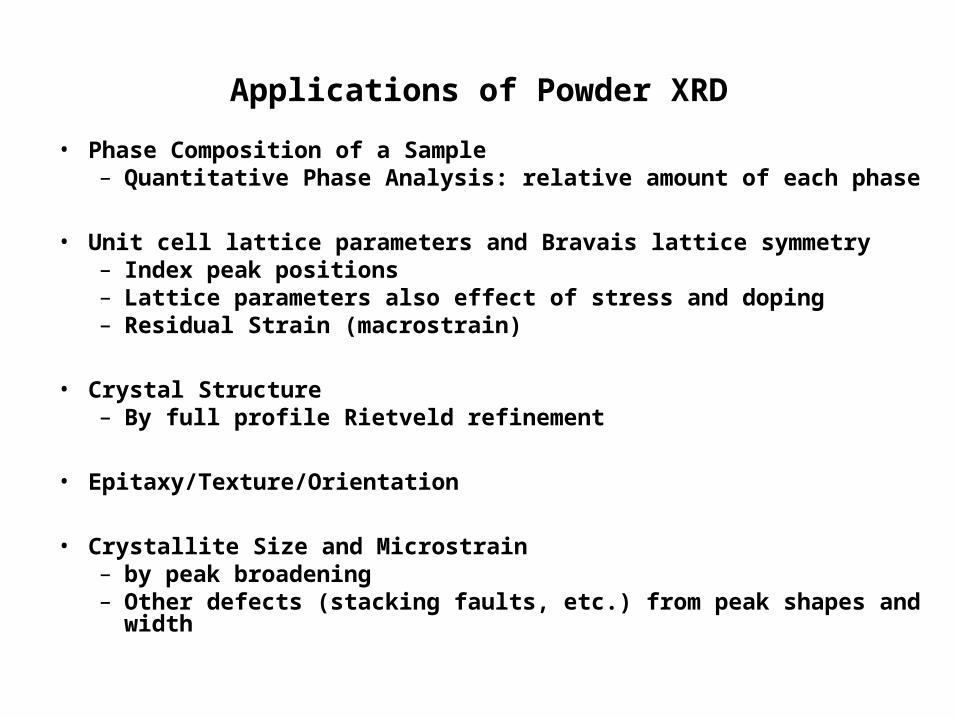
Applications of Powder XRD
• Phase Composition of a Sample– Quantitative Phase Analysis: relative amount of each phase
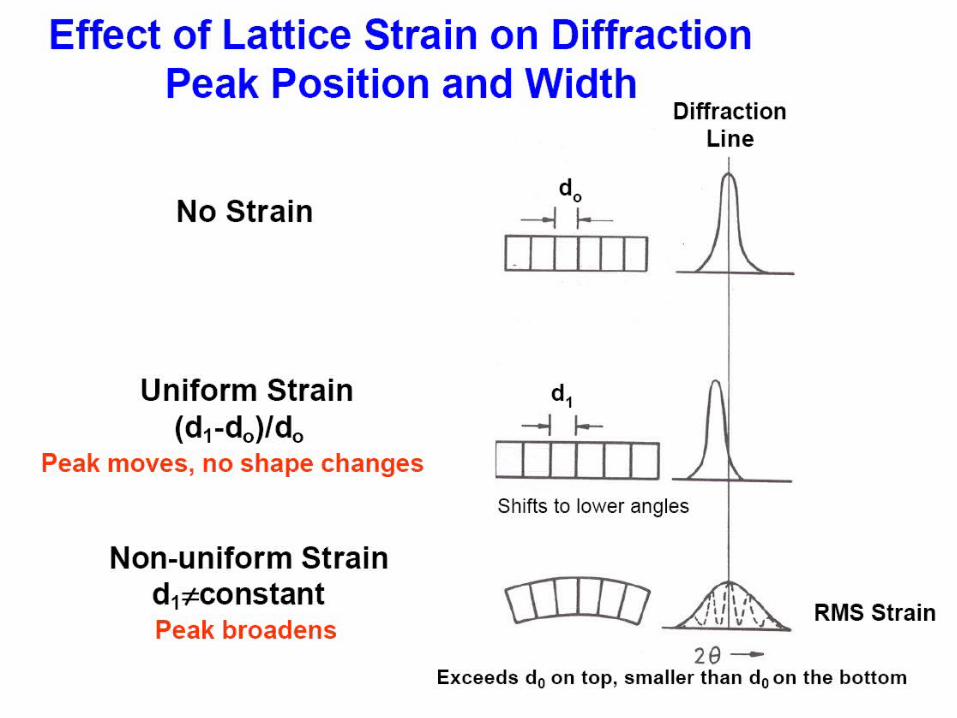
• Unit cell lattice parameters and Bravais lattice symmetry– Index peak positions– Lattice parameters also effect of stress and doping– Residual Strain (macrostrain)
• Crystal Structure– By full profile Rietveld refinement
• Epitaxy/Texture/Orientation
• Crystallite Size and Microstrain– by peak broadening– Other defects (stacking faults, etc.) from peak shapes and width
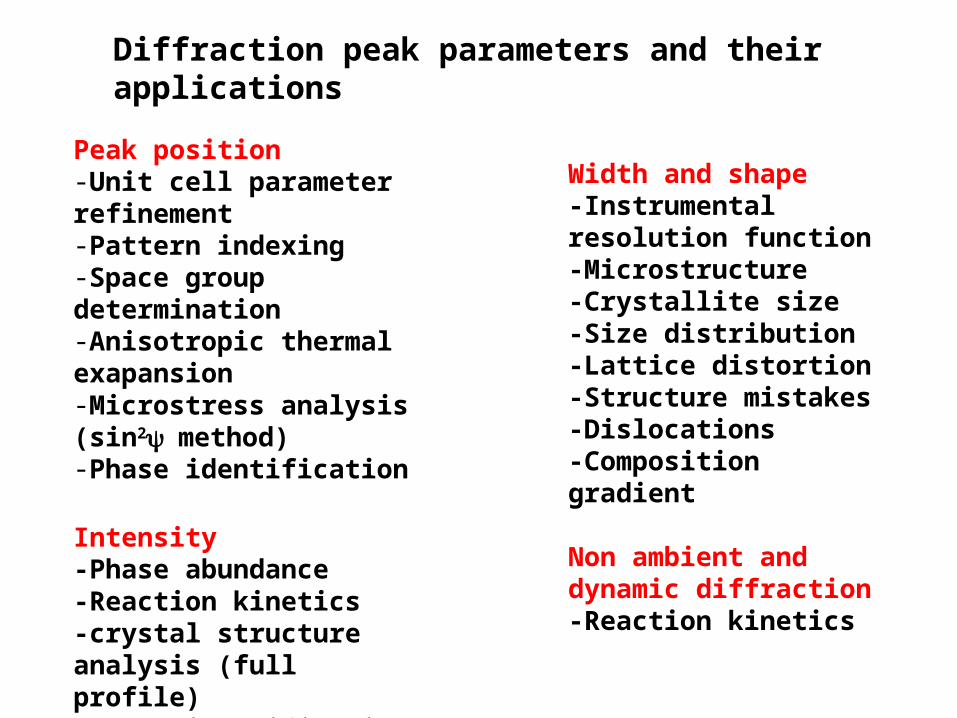
Peak position-Unit cell parameter refinement -Pattern indexing-Space group determination-Anisotropic thermal exapansion-Microstress analysis (sin2method)-Phase identification
Intensity -Phase abundance-Reaction kinetics-crystal structure analysis (full profile)-phase identification-texture analysis
Width and shape-Instrumental resolution function-Microstructure-Crystallite size-Size distribution-Lattice distortion-Structure mistakes-Dislocations-Composition gradient
Non ambient and dynamic diffraction-Reaction kinetics
Diffraction peak parameters and their applications
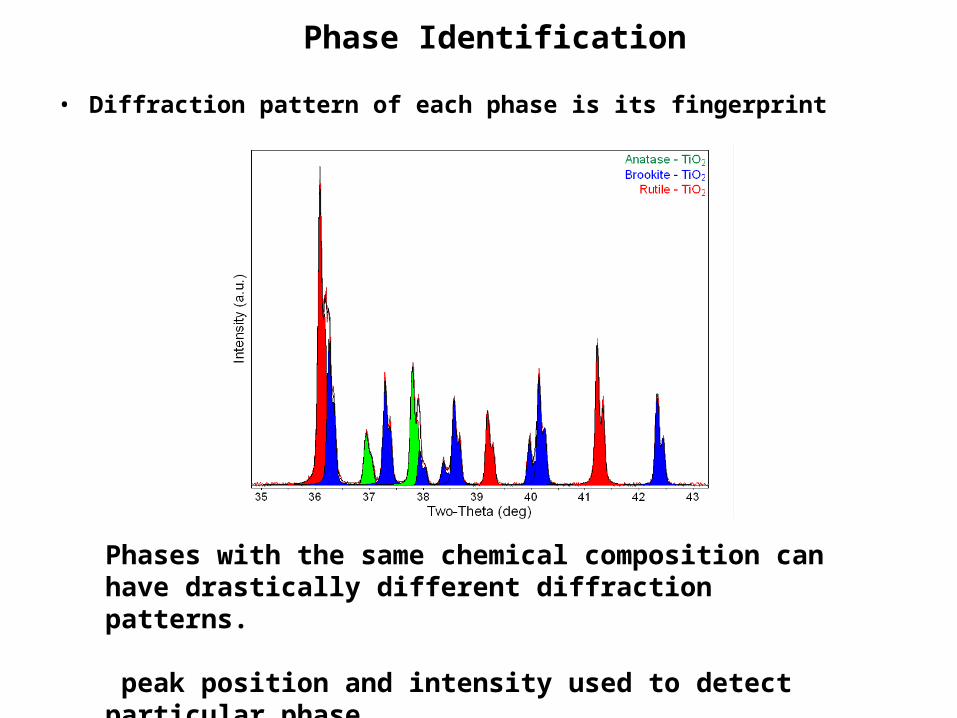
Phase Identification
• Diffraction pattern of each phase is its fingerprint
Phases with the same chemical composition can have drastically different diffraction patterns.
peak position and intensity used to detect particular phase
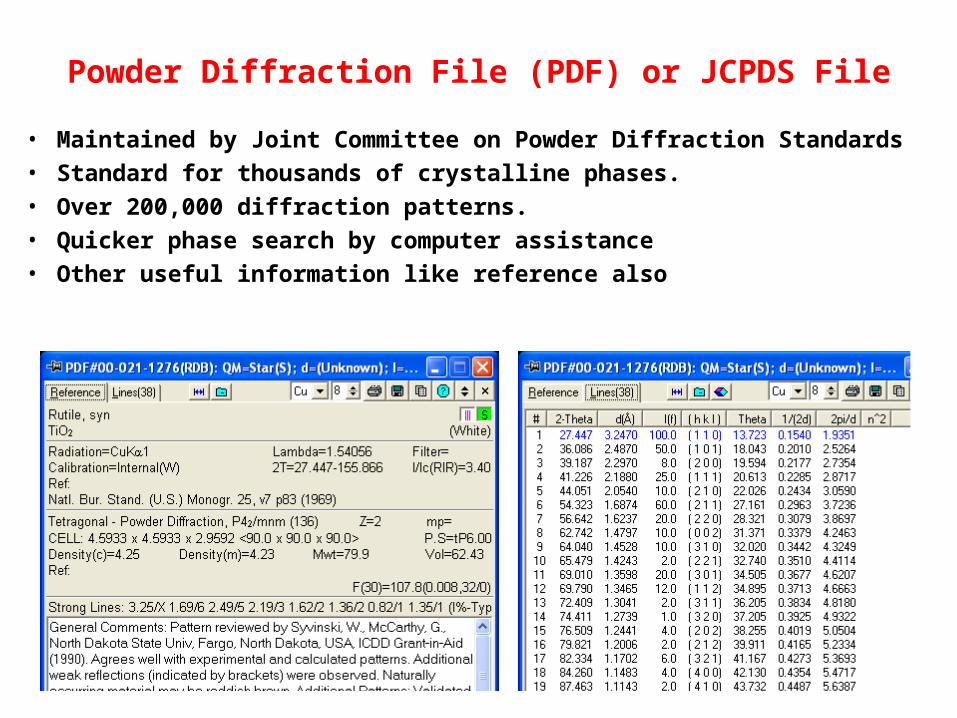
Powder Diffraction File (PDF) or JCPDS File
• Maintained by Joint Committee on Powder Diffraction Standards • Standard for thousands of crystalline phases.• Over 200,000 diffraction patterns.• Quicker phase search by computer assistance• Other useful information like reference also
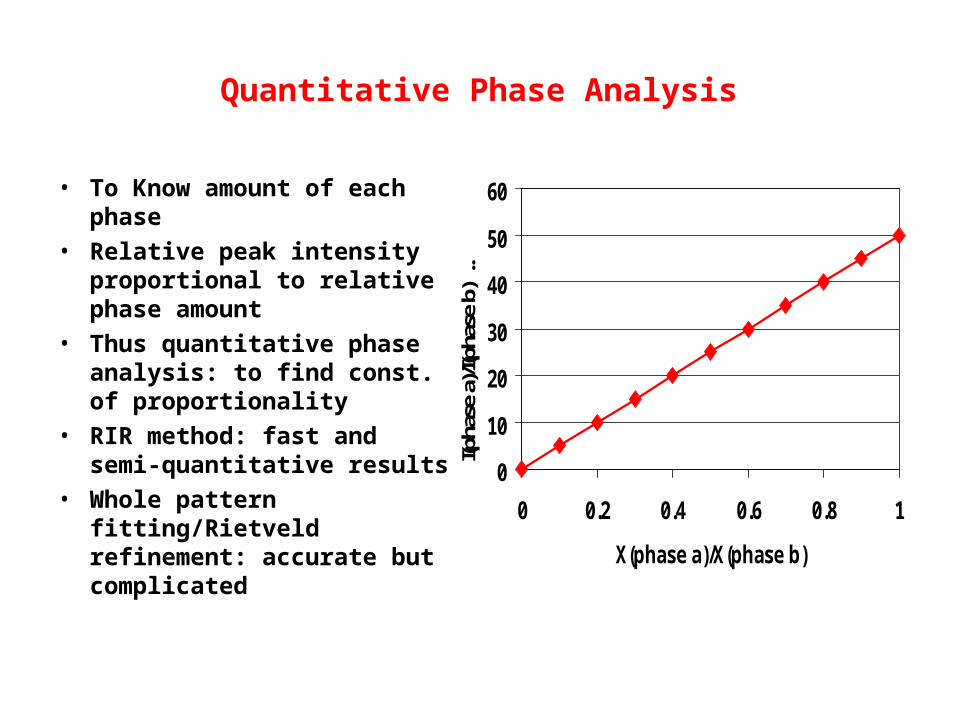
Quantitative Phase Analysis
• To Know amount of each phase
• Relative peak intensity proportional to relative phase amount
• Thus quantitative phase analysis: to find const. of proportionality
• RIR method: fast and semi-quantitative results
• Whole pattern fitting/Rietveld refinement: accurate but complicated
0
10
20
30
40
50
60
0 0.2 0.4 0.6 0.8 1
X(phase a)/X(phase b)
I(pha
se a
)/I(p
hase
b)
..
Unit Cell Lattice Parameter Refinement
• By accurate measurement of peak positions over long range• measure peak positions with a peak search algorithm or profile
fitting• profile fitting is more accurate but more time consuming• Can be use to quantify the effect due to alloying, substitutional
doping, temperature and pressure, etc • identify and correct for systematic errors such as specimen
displacement and zero shift
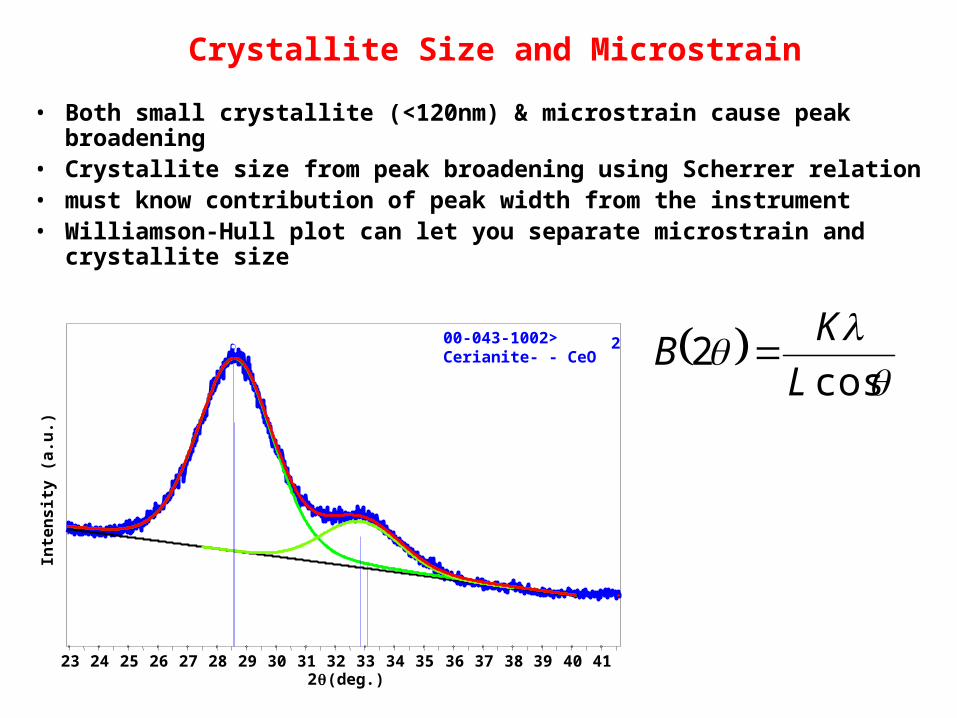
23 24 25 26 27 28 29 30 31 32 33 34 35 36 37 38 39 40 41
2 (deg.)
Inte
ns
ity
(a
.u.)
00-043-1002> Cerianite- - CeO
2
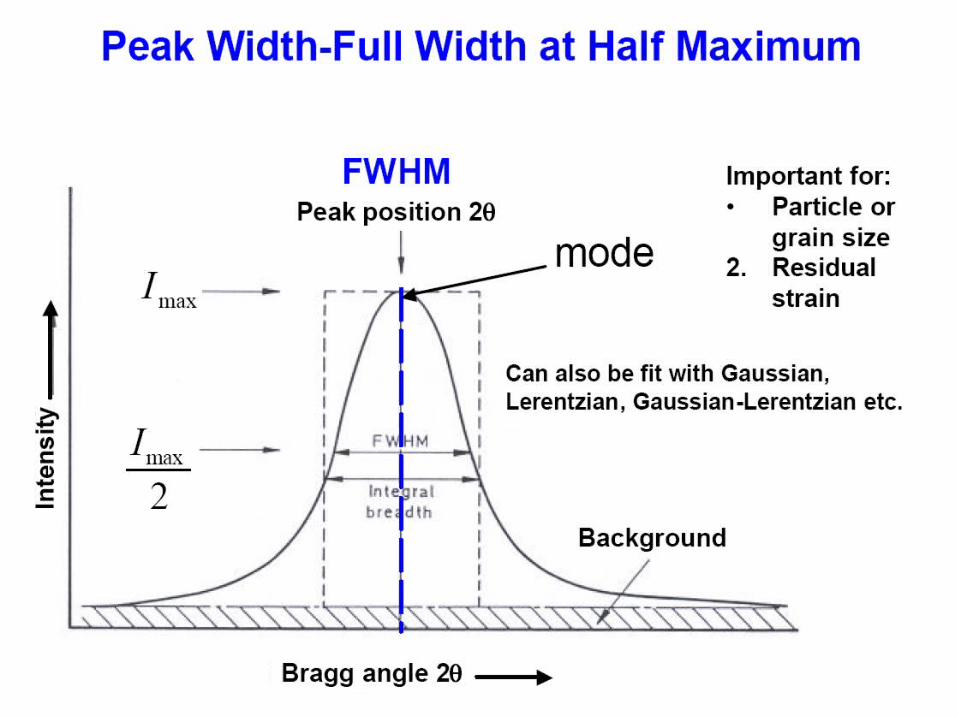
Crystallite Size and Microstrain
• Both small crystallite (<120nm) & microstrain cause peak broadening
• Crystallite size from peak broadening using Scherrer relation • must know contribution of peak width from the instrument • Williamson-Hull plot can let you separate microstrain and
crystallite size
cos
2L
KB
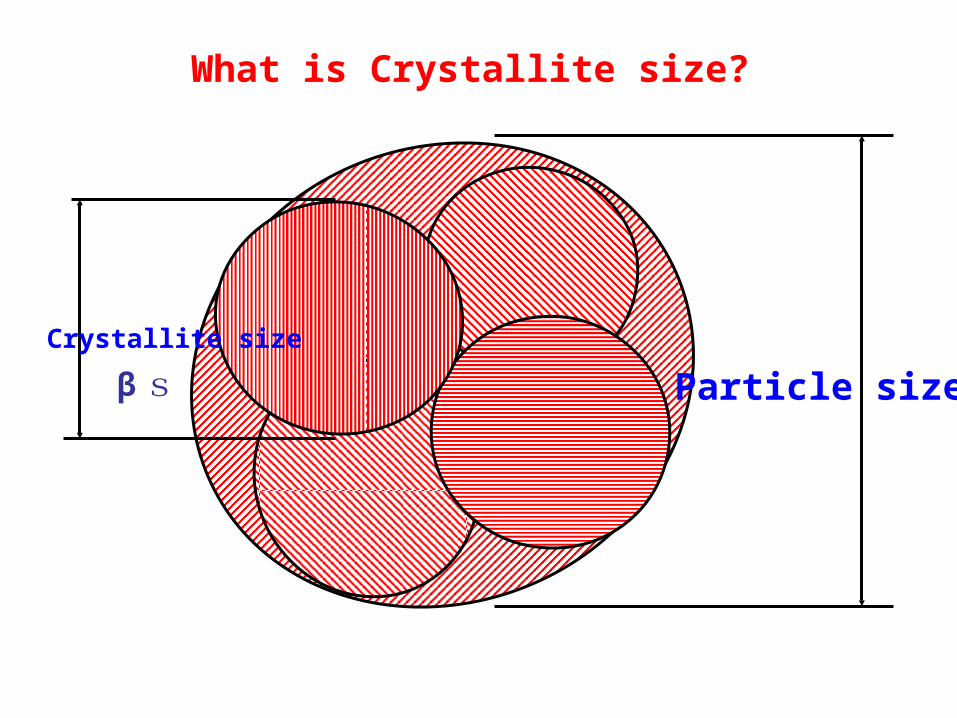
Crystallite size
β s Particle size
What is Crystallite size?
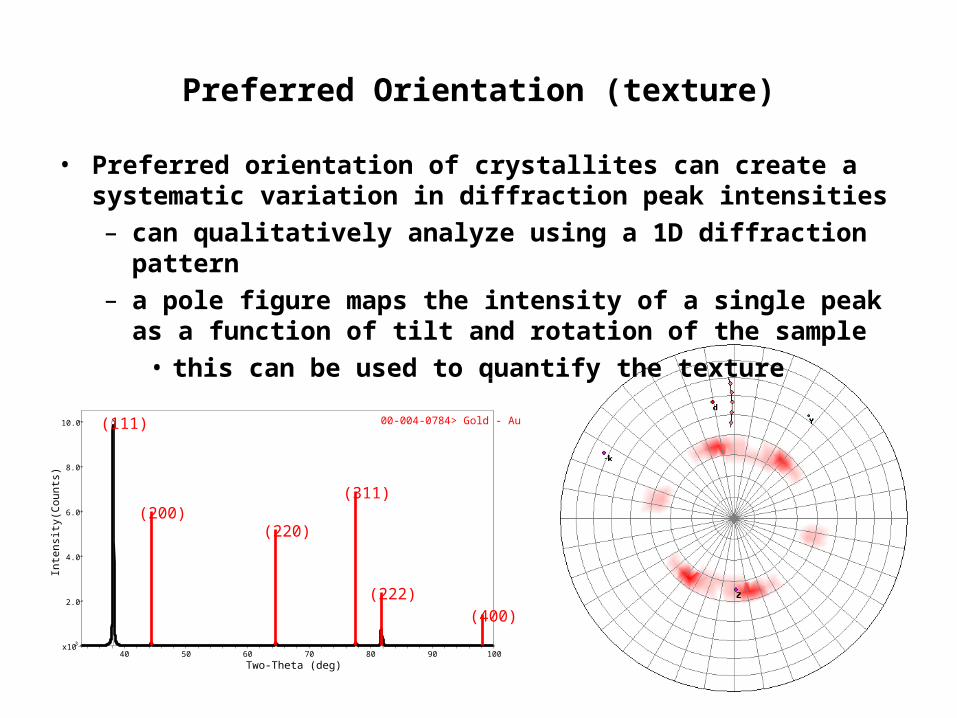
Preferred Orientation (texture)
• Preferred orientation of crystallites can create a systematic variation in diffraction peak intensities– can qualitatively analyze using a 1D diffraction pattern– a pole figure maps the intensity of a single peak as a
function of tilt and rotation of the sample• this can be used to quantify the texture
(111)
(311)(200)
(220)
(222)(400)
40 50 60 70 80 90 100
Two-Theta (deg)
x103
2.0
4.0
6.0
8.0
10.0
Inte
nsity
(Cou
nts)
00-004-0784> Gold - Au
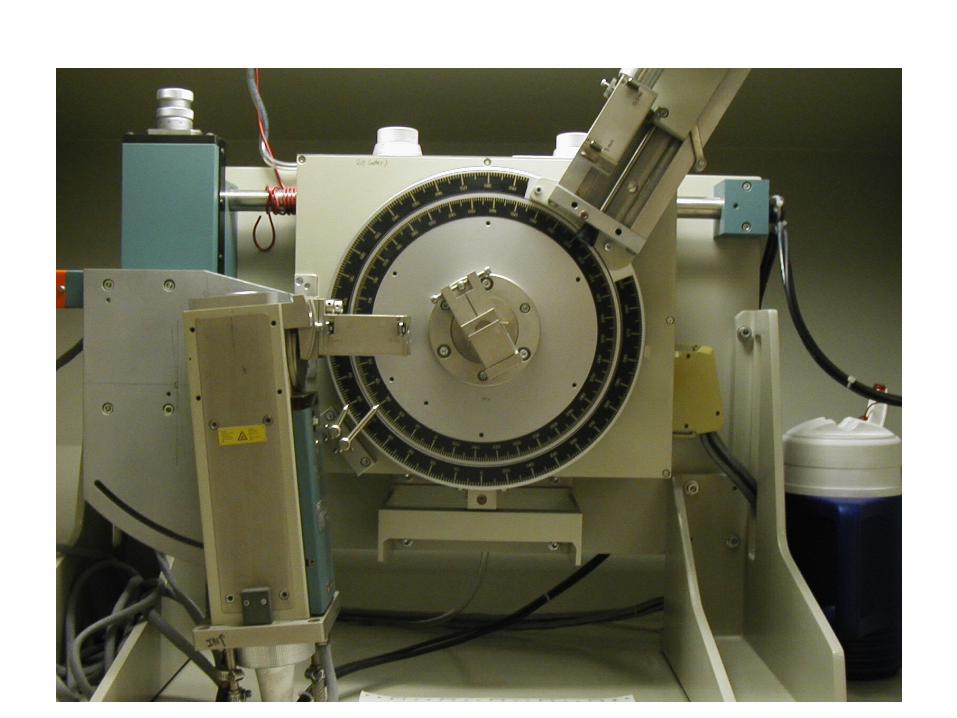
COMPONENTS OF X-RAY DIFFRACTOMETER
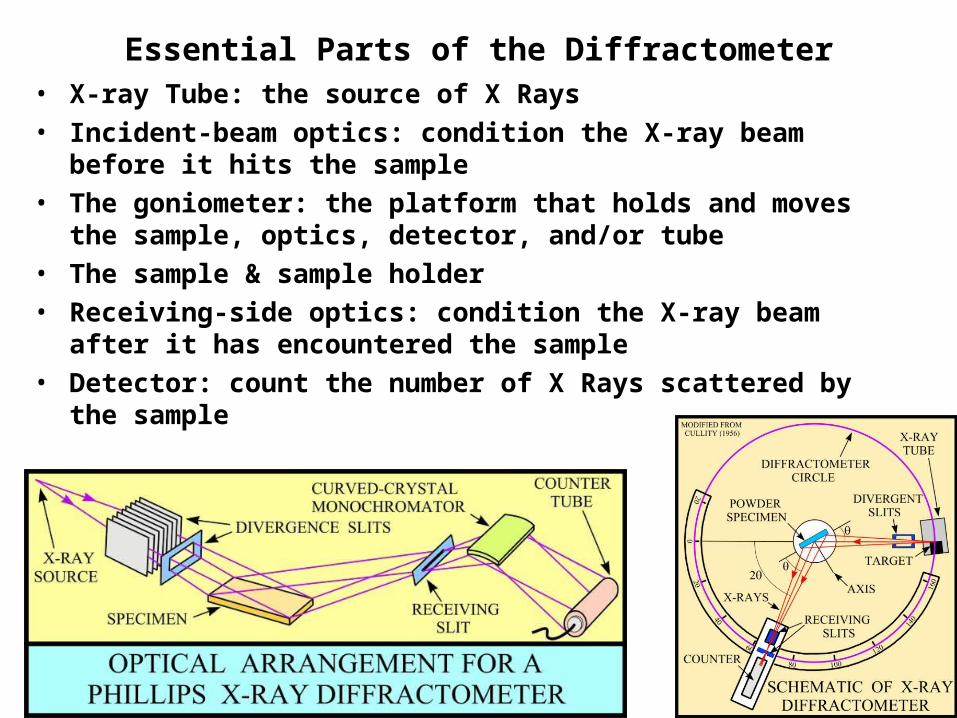
Essential Parts of the Diffractometer• X-ray Tube: the source of X Rays• Incident-beam optics: condition the X-ray beam before it hits
the sample• The goniometer: the platform that holds and moves the sample,
optics, detector, and/or tube• The sample & sample holder• Receiving-side optics: condition the X-ray beam after it has
encountered the sample• Detector: count the number of X Rays scattered by the sample
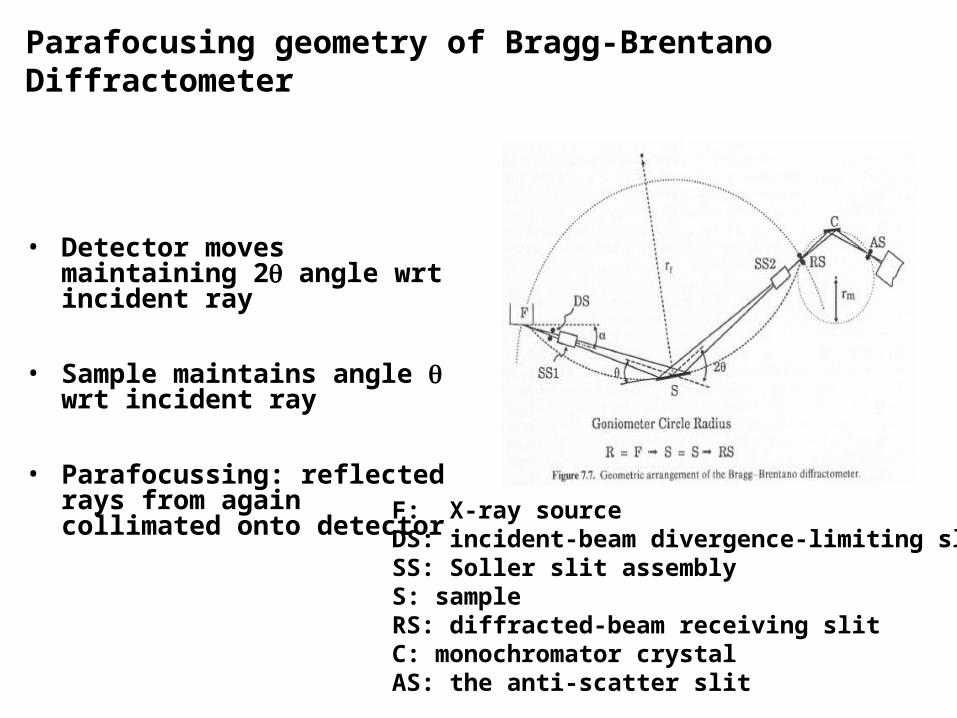
Parafocusing geometry of Bragg-Brentano Diffractometer
• Detector moves maintaining 2 angle wrt incident ray
• Sample maintains angle wrt incident ray
• Parafocussing: reflected rays from again collimated onto detector
F: X-ray sourceDS: incident-beam divergence-limiting slitSS: Soller slit assemblyS: sampleRS: diffracted-beam receiving slitC: monochromator crystalAS: the anti-scatter slit
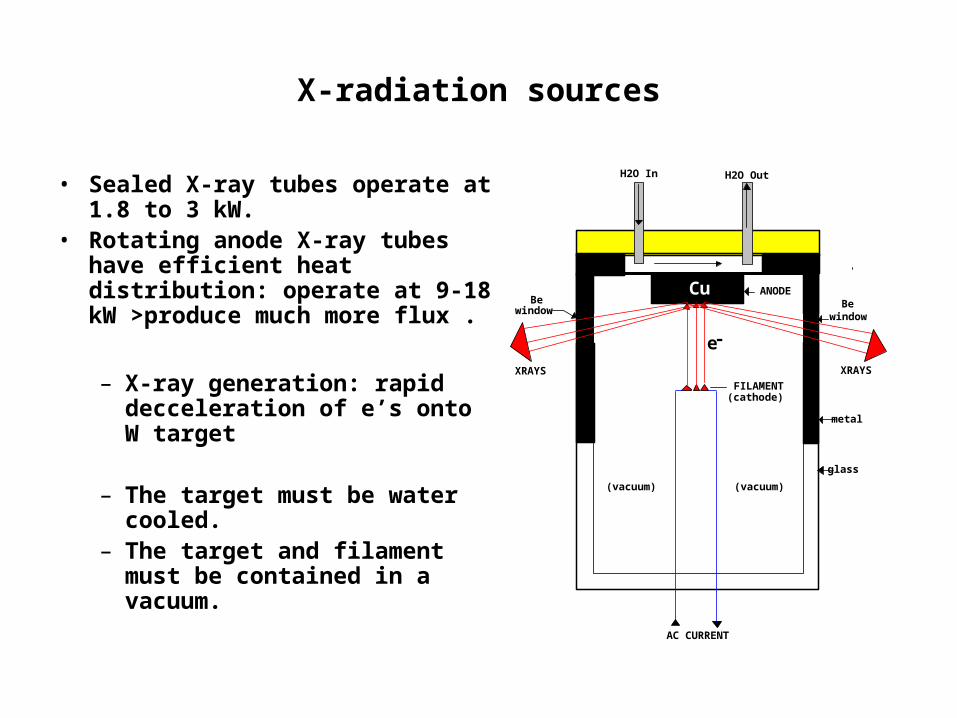
X-radiation sources
• Sealed X-ray tubes operate at 1.8 to 3 kW.
• Rotating anode X-ray tubes have efficient heat distribution: operate at 9-18 kW >produce much more flux .
– X-ray generation: rapid decceleration of e’s onto W target
– The target must be water cooled.
– The target and filament must be contained in a vacuum.
Cu
H2O In H2O Out
e-
Be
XRAYS
windowBe
XRAYS
FILAMENT
ANODE
(cathode)
AC CURRENT
window
metal
glass
(vacuum) (vacuum)
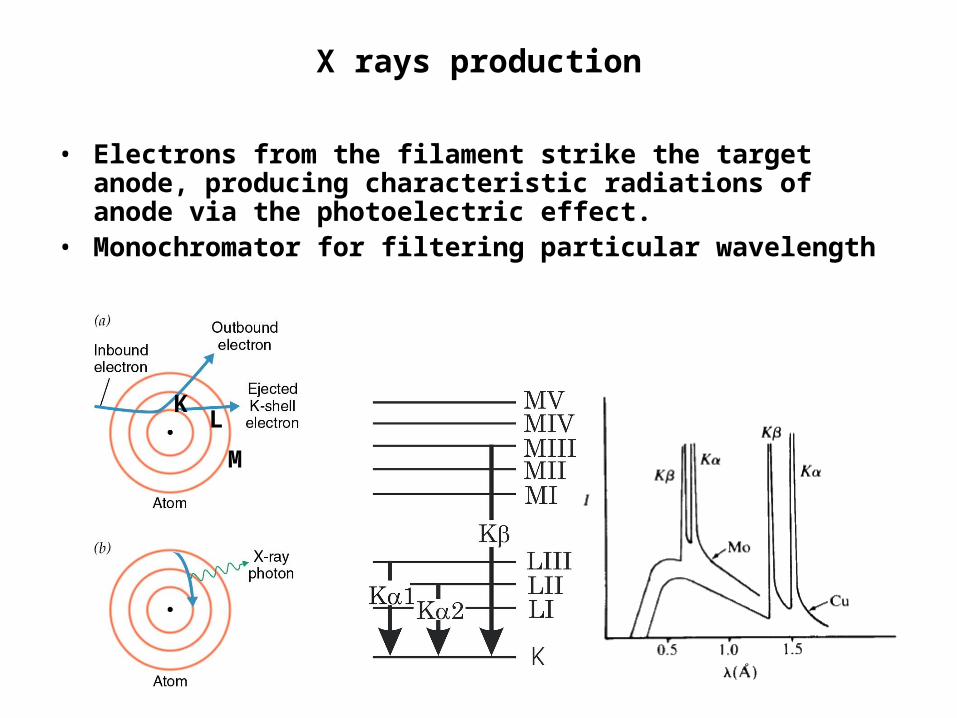
X rays production
• Electrons from the filament strike the target anode, producing characteristic radiations of anode via the photoelectric effect.
• Monochromator for filtering particular wavelength
KL
M
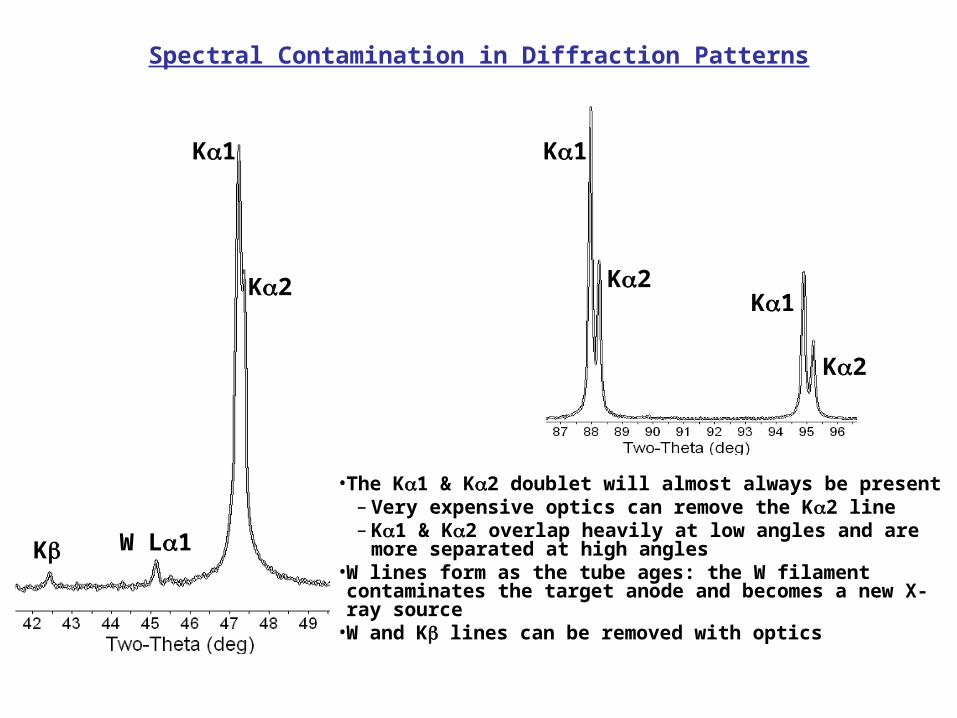
Spectral Contamination in Diffraction Patterns
K1
K2
K W L1
K1
K2K1
K2
• The K1 & K2 doublet will almost always be present– Very expensive optics can remove the K2 line– K1 & K2 overlap heavily at low angles and are more
separated at high angles• W lines form as the tube ages: the W filament contaminates the target anode and becomes a new X-ray source
• W and K lines can be removed with optics
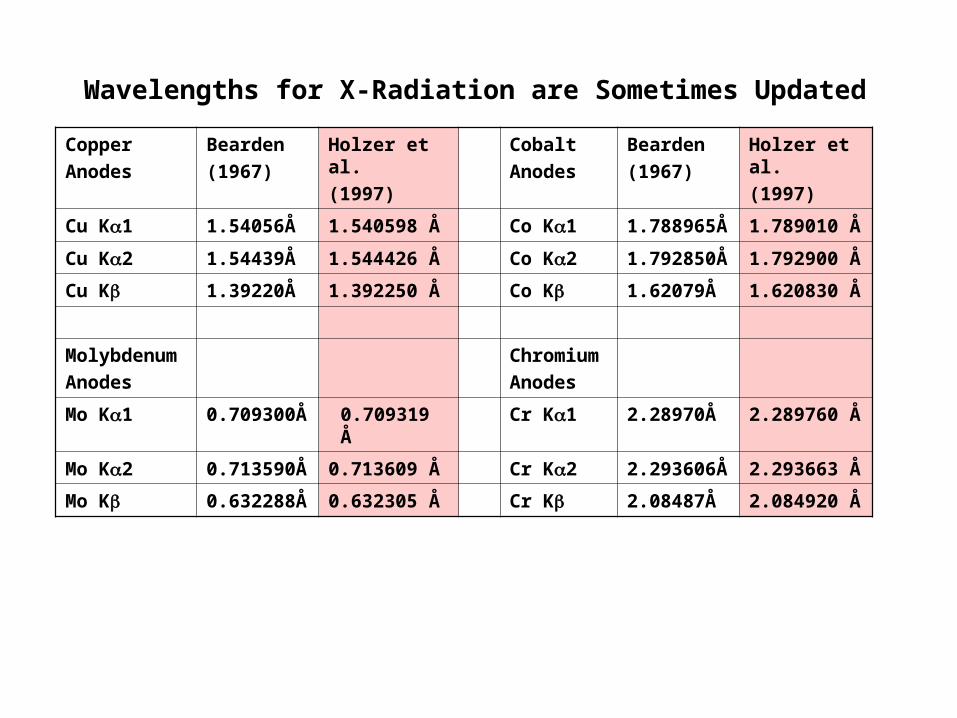
Wavelengths for X-Radiation are Sometimes Updated
Copper
Anodes
Bearden
(1967)
Holzer et al.
(1997)
Cobalt
Anodes
Bearden
(1967)
Holzer et al.
(1997)
Cu K1 1.54056Å 1.540598 Å Co K1 1.788965Å 1.789010 Å
Cu K2 1.54439Å 1.544426 Å Co K2 1.792850Å 1.792900 Å
Cu K 1.39220Å 1.392250 Å Co K 1.62079Å 1.620830 Å
Molybdenum
Anodes
Chromium
Anodes
Mo K1 0.709300Å 0.709319 Å Cr K1 2.28970Å 2.289760 Å
Mo K2 0.713590Å 0.713609 Å Cr K2 2.293606Å 2.293663 Å
Mo K 0.632288Å 0.632305 Å Cr K 2.08487Å 2.084920 Å
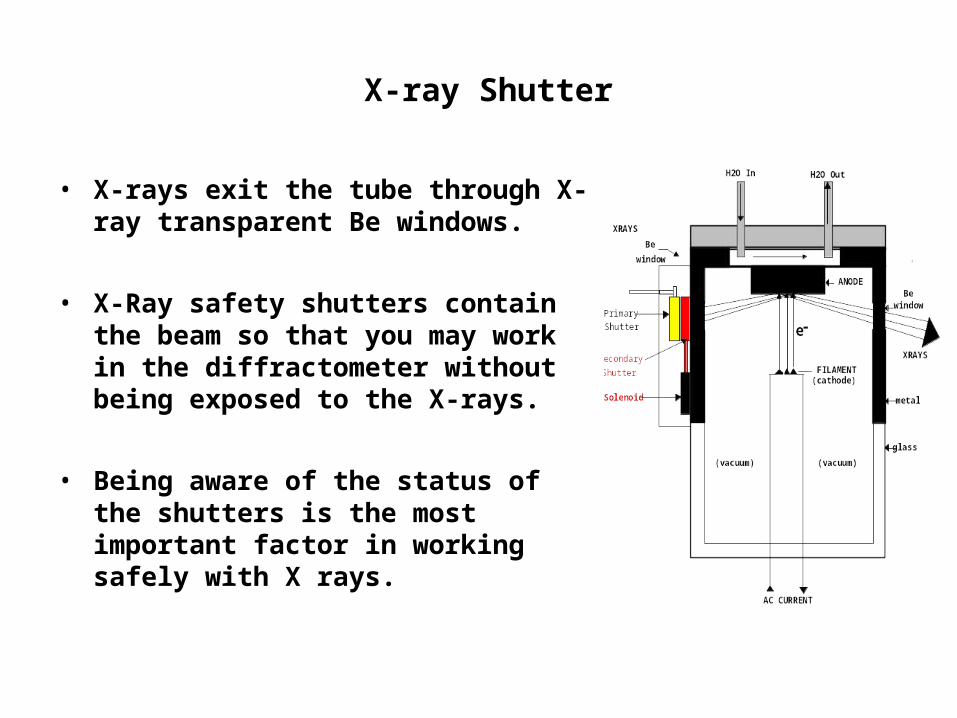
X-ray Shutter
• X-rays exit the tube through X-ray transparent Be windows.
• X-Ray safety shutters contain the beam so that you may work in the diffractometer without being exposed to the X-rays.
• Being aware of the status of the shutters is the most important factor in working safely with X rays.
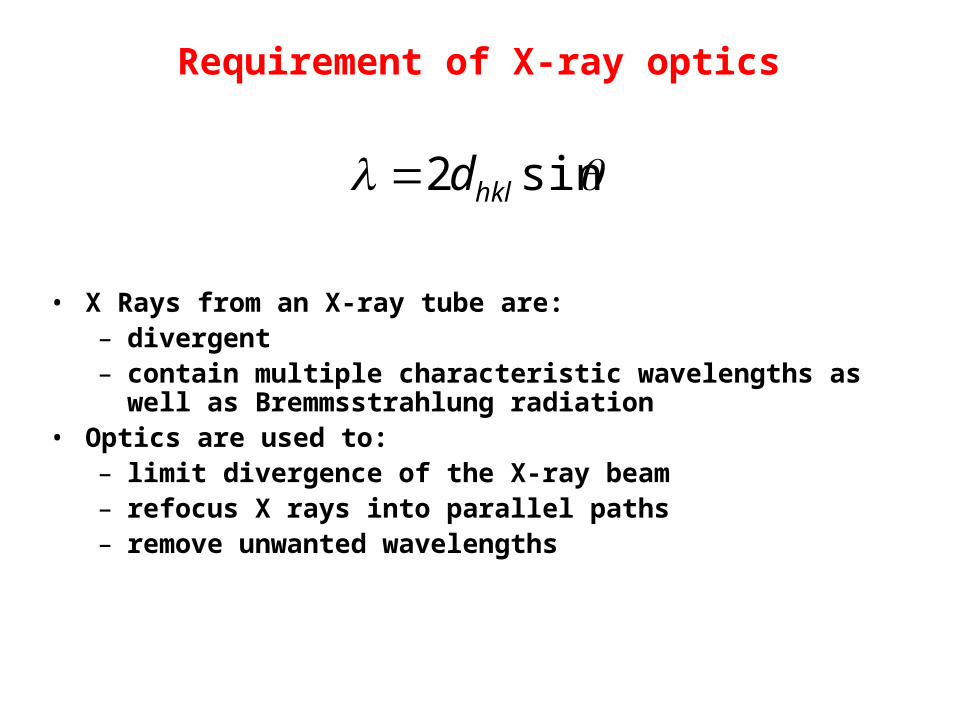
Requirement of X-ray optics
• X Rays from an X-ray tube are: – divergent– contain multiple characteristic wavelengths as well as
Bremmsstrahlung radiation• Optics are used to:
– limit divergence of the X-ray beam– refocus X rays into parallel paths– remove unwanted wavelengths
sin2 hkld
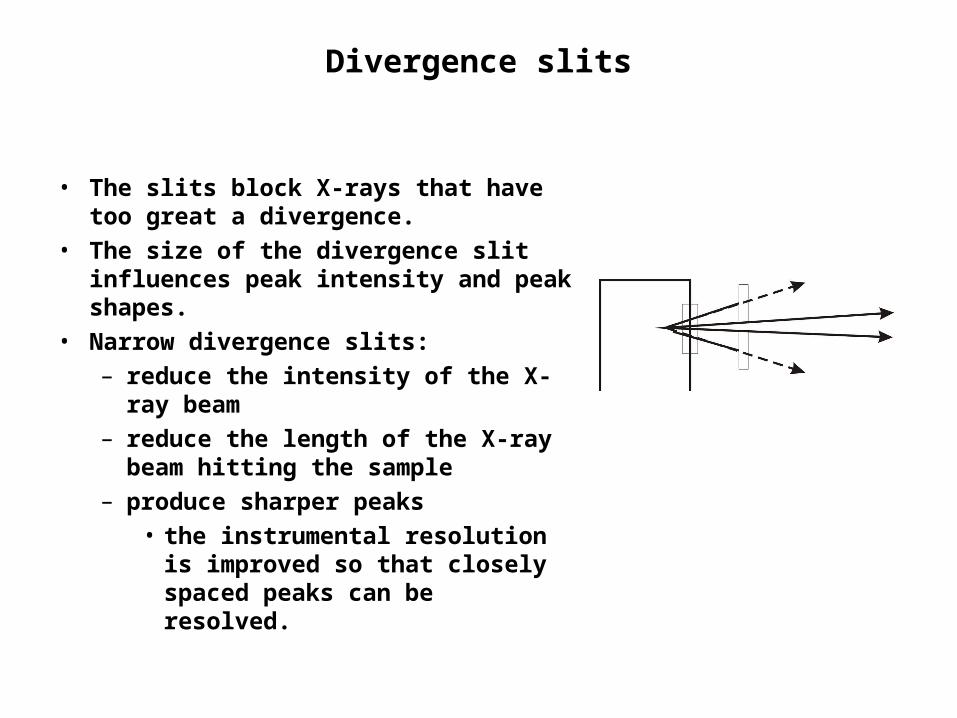
Divergence slits
• The slits block X-rays that have too great a divergence.
• The size of the divergence slit influences peak intensity and peak shapes.
• Narrow divergence slits:
– reduce the intensity of the X-ray beam
– reduce the length of the X-ray beam hitting the sample
– produce sharper peaks
• the instrumental resolution is improved so that closely spaced peaks can be resolved.
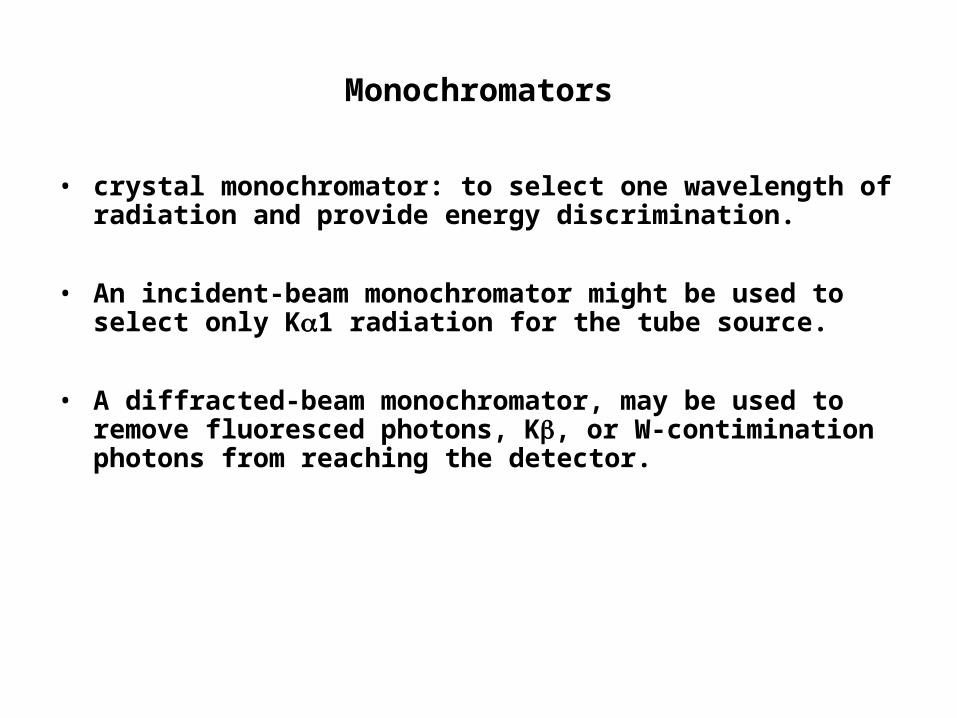
Monochromators
• crystal monochromator: to select one wavelength of radiation and provide energy discrimination.
• An incident-beam monochromator might be used to select only K1 radiation for the tube source.
• A diffracted-beam monochromator, may be used to remove fluoresced photons, K, or W-contimination photons from reaching the detector.
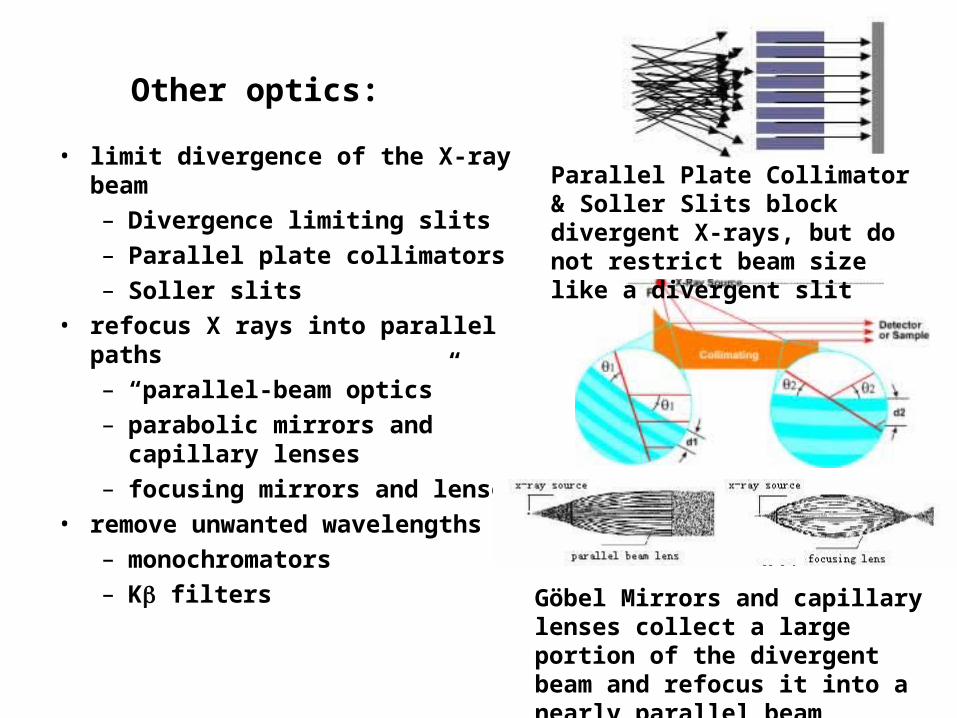
Other optics:
• limit divergence of the X-ray beam– Divergence limiting slits– Parallel plate collimators– Soller slits
• refocus X rays into parallel paths– “parallel-beam optics”– parabolic mirrors and capillary
lenses– focusing mirrors and lenses
• remove unwanted wavelengths– monochromators– K filters
Parallel Plate Collimator & Soller Slits block divergent X-rays, but do not restrict beam size like a divergent slit
Göbel Mirrors and capillary lenses collect a large portion of the divergent beam and refocus it into a nearly parallel beam
Detectors
• point detectors– observe one point of space at a time
• slow, but compatible with most/all optics– scintillation and gas proportional detectors count all photons,
within an energy window, that hit them– Si(Li) detectors can electronically analyze or filter wavelengths
• position sensitive detectors– linear PSDs observe all photons scattered along a line from 2 to
10° long– 2D area detectors observe all photons scattered along a conic
section– gas proportional (gas on wire; microgap anodes)
• limited resolution, issues with deadtime and saturation– CCD
• limited in size, expensive – solid state real-time multiple semiconductor strips
• high speed with high resolution, robust

SAMPLE / SPECIMEN PREPARATION
Preparing a powder specimen
• An ideal powder sample should have many crystallites in random orientations
– the distribution of orientations should be smooth and equally distributed amongst all orientations
• If the crystallites in a sample are very large, there will not be a smooth distribution of crystal orientations. You will not get a powder average diffraction pattern.
– crystallites should be <10m in size to get good powder statistics
• Large crystallite sizes and non-random crystallite orientations both lead to peak intensity variation
– the measured diffraction pattern will not agree with that expected from an ideal powder
– the measured diffraction pattern will not agree with reference patterns in the Powder Diffraction File (PDF) database
Important characteristics of samples for XRPD
• a flat plate sample for XRPD should have a smooth flat surface– if the surface is not smooth and flat, X-ray absorption may
reduce the intensity of low angle peaks– parallel-beam optics can be used to analyze samples with
odd shapes or rought surfaces• Densely packed• Randomly oriented grains/crystallites• Grain size less than 10 microns• ‘Infinitely’ thick
XRD EXAMPLES
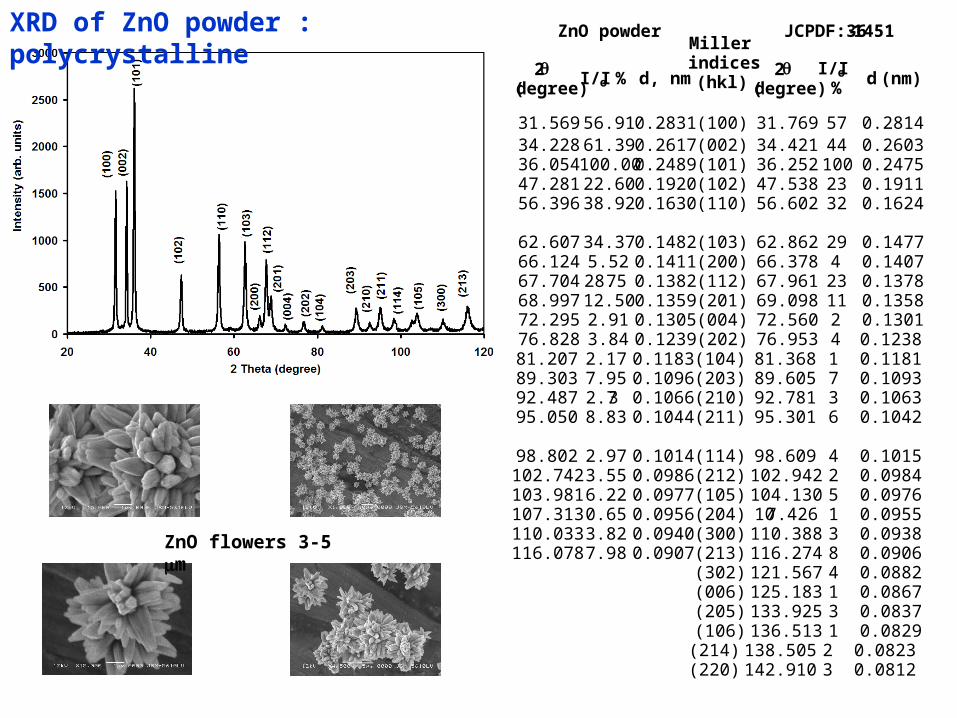
ZnO flowers 3-5 m
XRD of ZnO powder : polycrystalline ZnO powder JCPDF:36-1451
2(degree)
I/Io % d, nm
Miller indices (hkl)
2(degree)
I/Io % d (nm)
31.569 56.91 0.2831 (100) 31.769 57 0.2814 34.228 61.39 0.2617 (002) 34.421 44 0.2603 36.054 100.00 0.2489 (101) 36.252 100 0.2475 47.281 22.60 0.1920 (102) 47.538 23 0.1911 56.396 38.92 0.1630 (110) 56.602 32 0.1624
62.607 34.37 0.1482 (103) 62.862 29 0.1477 66.124 5.52 0.1411 (200) 66.378 4 0.1407 67.704 28.75 0.1382 (112) 67.961 23 0.1378 68.997 12.50 0.1359 (201) 69.098 11 0.1358 72.295 2.91 0.1305 (004) 72.560 2 0.1301 76.828 3.84 0.1239 (202) 76.953 4 0.1238 81.207 2.17 0.1183 (104) 81.368 1 0.1181 89.303 7.95 0.1096 (203) 89.605 7 0.1093 92.487 2.73 0.1066 (210) 92.781 3 0.1063 95.050 8.83 0.1044 (211) 95.301 6 0.1042
98.802 2.97 0.1014 (114) 98.609 4 0.1015 102.742 3.55 0.0986 (212) 102.942 2 0.0984 103.981 6.22 0.0977 (105) 104.130 5 0.0976 107.313 0.65 0.0956 (204) 107.426 1 0.0955 110.033 3.82 0.0940 (300) 110.388 3 0.0938 116.078 7.98 0.0907 (213) 116.274 8 0.0906
(302) 121.567 4 0.0882 (006) 125.183 1 0.0867 (205) 133.925 3 0.0837 (106) 136.513 1 0.0829 (214) 138.505 2 0.0823
(220) 142.910 3 0.0812
200 nm
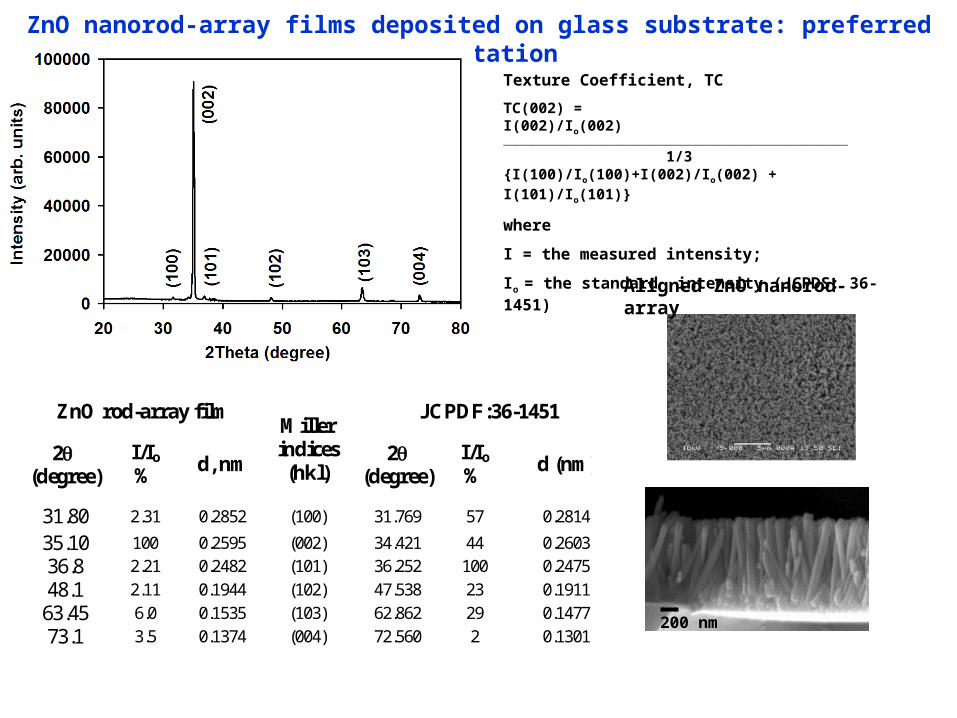
Aligned ZnO nanorod-array
Texture Coefficient, TC
TC(002) = I(002)/Io(002) ____________________________________________________________________________________________________________
1/3 {I(100)/Io(100)+I(002)/Io(002) + I(101)/Io(101)}
where
I = the measured intensity;
Io = the standard intensity (JCPDS: 36-1451)
ZnO nanorod-array films deposited on glass substrate: preferred orientation
ZnO rod-array film JCPDF:36-1451
2(degree)
I/Io %
d, nm
Miller indices (hkl)
2(degree)
I/Io %
d (nm)
31.80 2.31 0.2852 (100) 31.769 57 0.2814
35.10 100 0.2595 (002) 34.421 44 0.2603
36.8 2.21 0.2482 (101) 36.252 100 0.2475
48.1 2.11 0.1944 (102) 47.538 23 0.1911
63.45 6.0 0.1535 (103) 62.862 29 0.1477
73.1 3.5 0.1374 (004) 72.560 2 0.1301
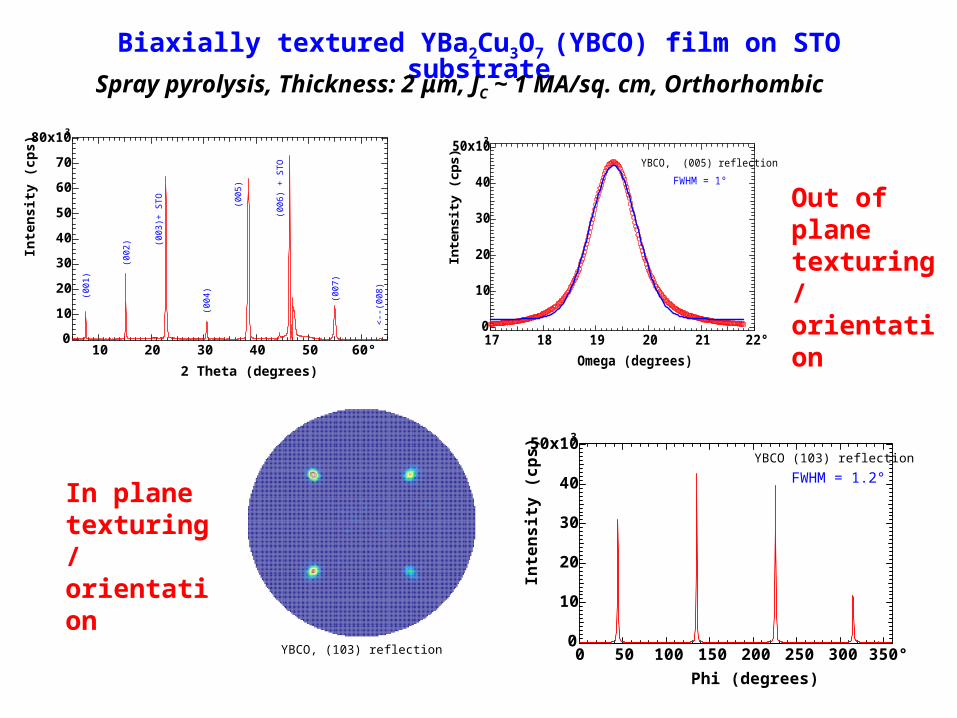
Biaxially textured YBa2Cu3O7 (YBCO) film on STO substrate
Spray pyrolysis, Thickness: 2 μm, JC ~ 1 MA/sq. cm, Orthorhombic
80x103
70
60
50
40
30
20
10
0
Inte
nsit
y (c
ps)
60°5040302010
2 Theta (degrees)
(00
1)
(00
3)+
STO
(00
4)
(00
5)
(00
6)
+ S
TO
(00
7)
<--
(00
8)
(00
2)
50x103
40
30
20
10
0
Inte
nsity
(cps
)
22°2120191817
Omega (degrees)
YBCO, (005) reflection
FWHM = 1°
Out of plane texturing / orientation
YBCO, (103) reflection
50x103
40
30
20
10
0
Inte
nsi
ty (
cps)
350°300250200150100500
Phi (degrees)
YBCO (103) reflection
FWHM = 1.2°In plane texturing / orientation
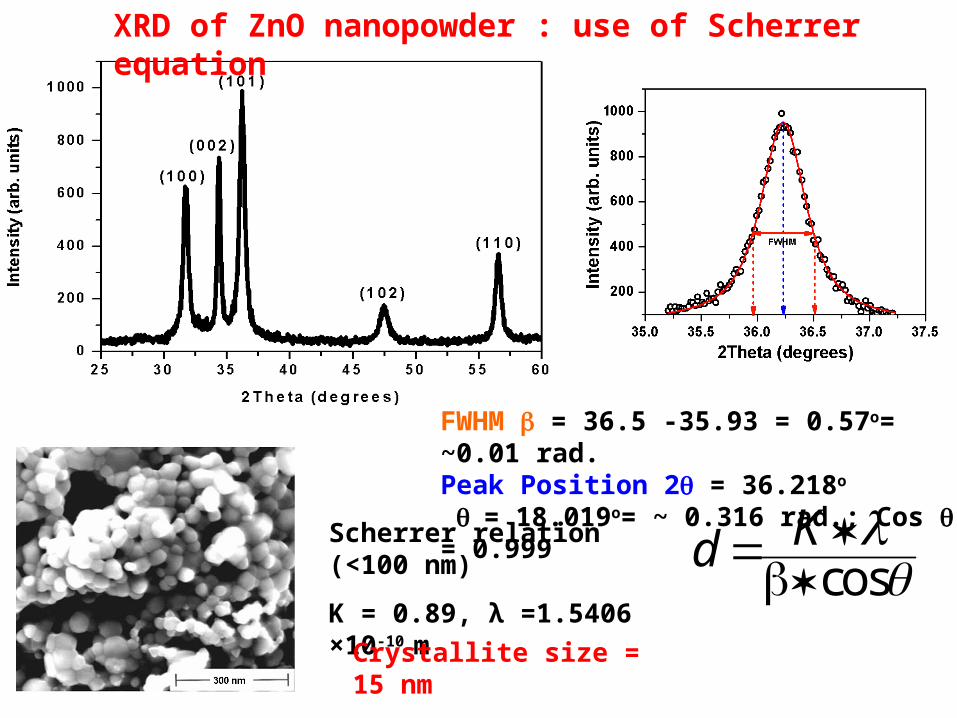
FWHM = 36.5 -35.93 = 0.57o= ~0.01 rad.Peak Position 2 = 36.218o
= 18.019o= ~ 0.316 rad.; Cos = 0.999
cosKd
Scherrer relation (<100 nm)
K = 0.89, λ =1.5406 ×10⁻¹⁰ m
Crystallite size = 15 nm
XRD of ZnO nanopowder : use of Scherrer equation

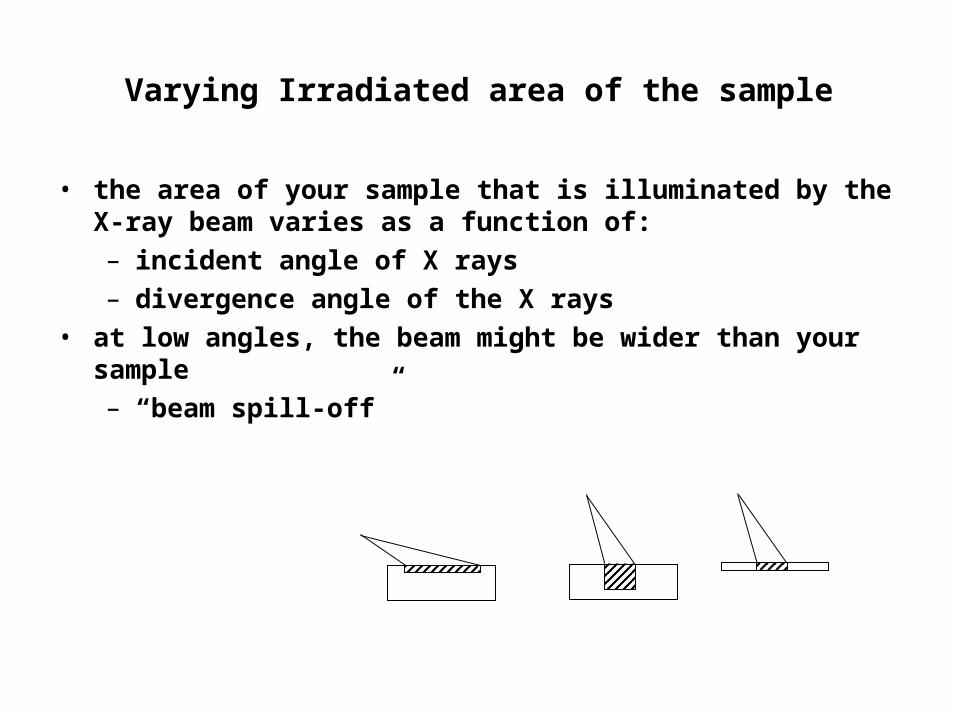
Varying Irradiated area of the sample
• the area of your sample that is illuminated by the X-ray beam varies as a function of:– incident angle of X rays– divergence angle of the X rays
• at low angles, the beam might be wider than your sample– “beam spill-off”
The constant volume assumption
• In a polycrystalline sample of ‘infinite’ thickness, the change in the irradiated area as the incident angle varies is compensated for by the change in the penetration depth
• These two factors result in a constant irradiated volume– (as area decreases, depth increase; and vice versa)
• This assumption is important for many aspects of XRPD– Matching intensities to those in the PDF reference database– Crystal structure refinements– Quantitative phase analysis
• This assumption is not necessarily valid for thin films or small quantities of sample on a ZBH
Sources of Error in XRD Data
• Sample Displacement– occurs when the sample is not on the focusing circle
(or in the center of the goniometer circle)– Can be minimized by using a zero background sample
holder– Can be corrected by using an internal calibration
standard – Can be analyzed and compensated for with many data
analysis algorithms– can be eliminated by using parallel-beam optics
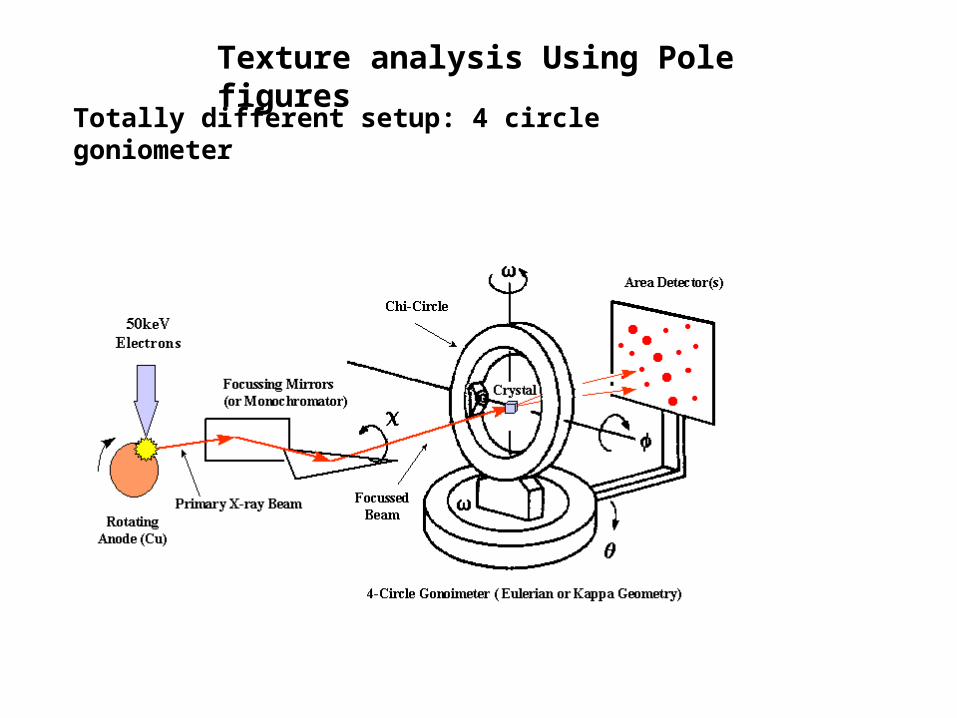
Texture analysis Using Pole figures
Totally different setup: 4 circle goniometer
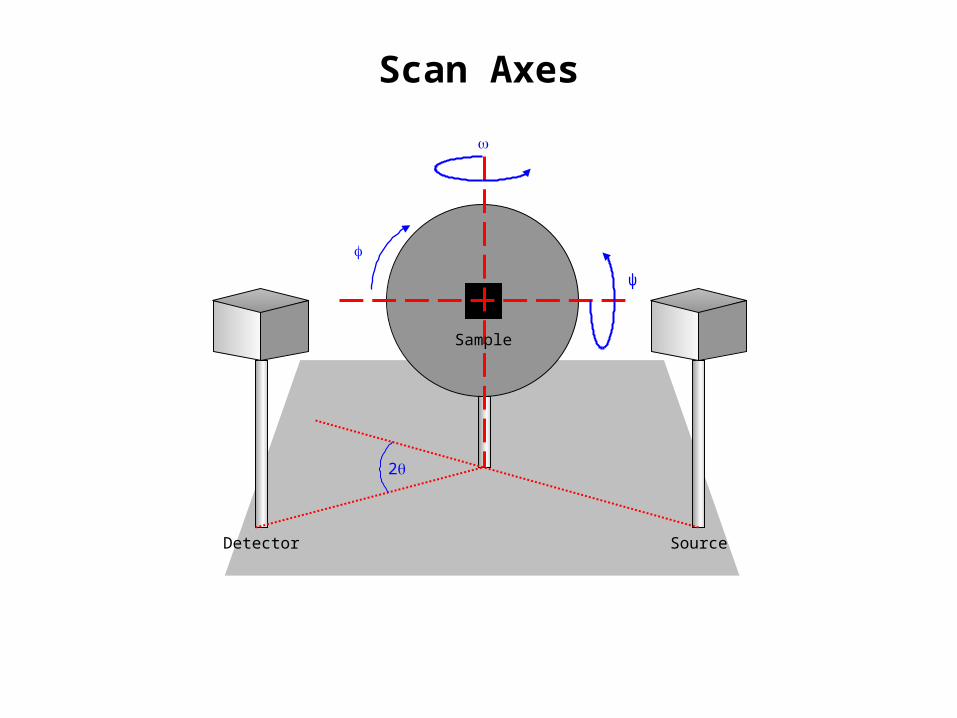
Scan Axes
Detector
Sample
ψ
2
Source
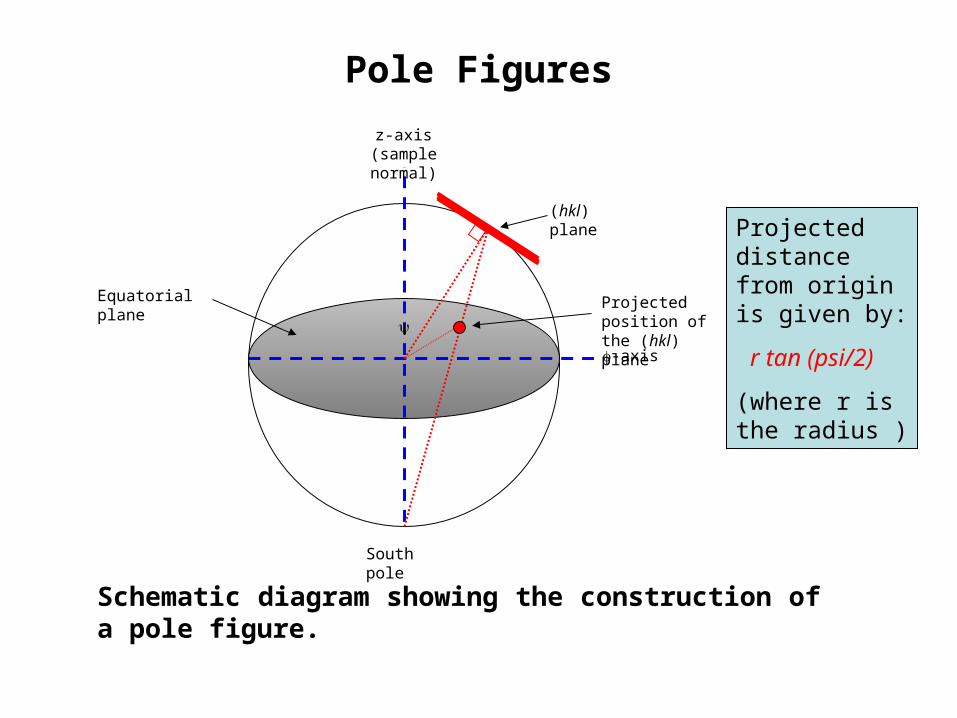
Pole Figures
z-axis(sample normal)
South pole
-axis
(hkl) plane
Equatorial plane Projected position of the (hkl) plane
Schematic diagram showing the construction of a pole figure.
Projected distance from origin is given by:
r tan (psi/2)
(where r is the radius )
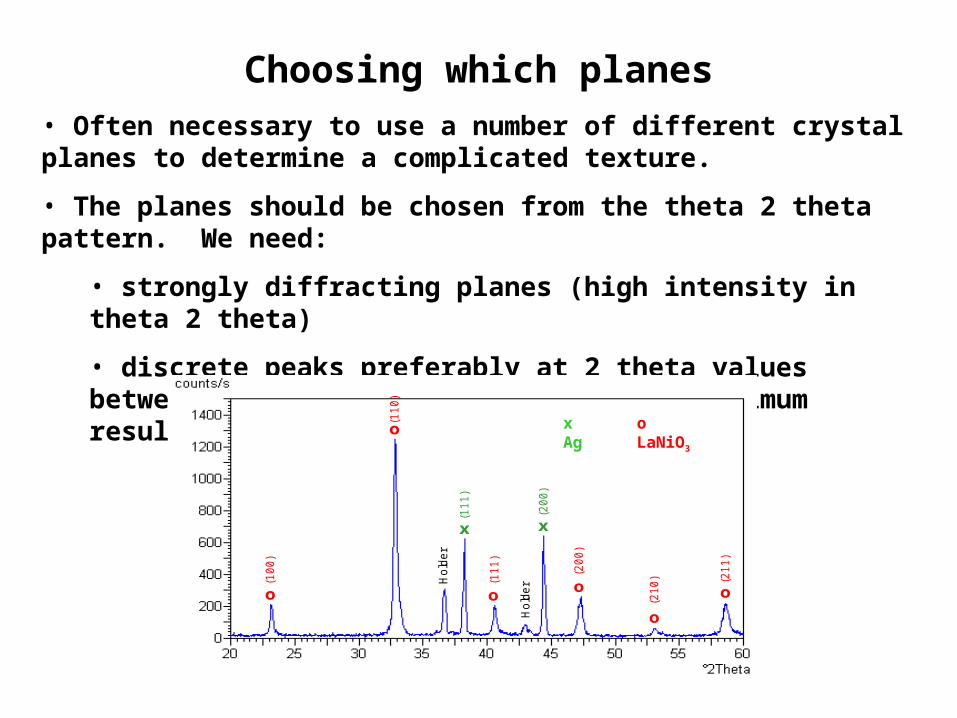
Choosing which planes• Often necessary to use a number of different crystal planes to determine a complicated texture.
• The planes should be chosen from the theta 2 theta pattern. We need:
• strongly diffracting planes (high intensity in theta 2 theta)
• discrete peaks preferably at 2 theta values between 20 degrees and 50 degrees for optimum results.
x x
o
o
oo o
o
(11
1)
(20
0)
(10
0)
(11
0)
(11
1)
(20
0)
(21
0) (2
11
)
Ho
lde
r
Ho
lde
rx x
o
o
oo o
o
(11
1)
(20
0)
(10
0)
(11
0)
(11
1)
(20
0)
(21
0) (2
11
)
Ho
lde
r
Ho
lde
r
x Ag o LaNiO3
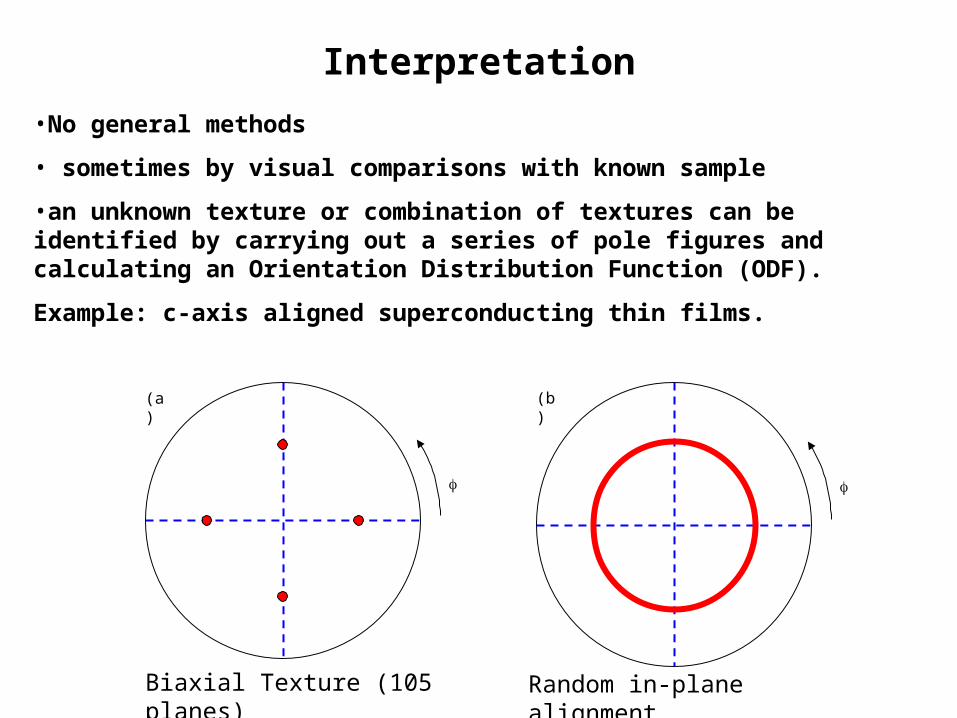
Interpretation
•No general methods
• sometimes by visual comparisons with known sample
•an unknown texture or combination of textures can be identified by carrying out a series of pole figures and calculating an Orientation Distribution Function (ODF).
Example: c-axis aligned superconducting thin films.
(b)
(a)
Biaxial Texture (105 planes) Random in-plane alignment