Embed Size (px)
Citation preview

Appendix B: Alcohol-related mortality (deaths)
Section Description
1 1
2 2
3 Trends in alcohol-related mortality Scotland3.1 Mortality by age group and gender - tables3.2 Mortality by age group and gender - charts3.3 Mortality by area deprivation - tables3.4 Mortality by area deprivation - charts3.5 Slope Index of inequality (SII) - table and chart3.6 Relative Index of Inequality (RII) - table and chart
4 Alcoholic Liver Disease (ALD) mortality4.1 ALD mortality by age group and gender - tables4.2 ALD mortality by age group and gender - charts
5
5.1
This Excel workbook provides the raw data and charts which underpin Chapter 2 of the 5th Annual MESAS report (March 2016). Source: ISD Scotland, SMR99 (Sep 2015)
Worksheet number
Methods: Definitions of terminology used and methods of calculation
Key points: Summary of main findings
Comparing alcohol-related mortality in Scotland and England & WalesAlcohol-related deaths (underlying cause), Scotland and England & Wales by gender - table and chart

Appendix B: Alcohol-related mortality (deaths)
Tables/Charts available:
By gender
Y Y Y Y YY Y Y Y Y
Y YY Y
YY
Y Y Y Y YY Y Y Y Y
Y
This Excel workbook provides the raw data and charts which underpin Chapter 2 of the 5th Annual MESAS report (March 2016). Source:
By age group
- All persons
Scotland overall
By age group - Males
By age group -
Females

1. Methods
1.1 Source of mortality data
1.2. Scottish Index of Multiple Deprivation (SIMD)
1.3. Diagnostic codes
The following ICD-9 codes were used for reporting alcohol-related mortality:291 Alcohol-induced mental disorders303 Alcohol dependence syndrome3050 Alcohol4255 Alcoholic cardiomyopathy5710 Alcoholic fatty liver5711 Acute alcoholic hepatitis5712 Alcoholic cirrhosis of liver5713 Alcoholic liver damage, unspecified5714 Chronic hepatitis5715 Cirrhosis of liver without mention of alcohol5718 Other chronic nonalcoholic liver disease5719 Unspecified chronic liver disease without mention of alcoholE860 Accidental poisoning by alcohol, not elsewhere classified
The following ICD-10 codes were used for reporting alcohol-related mortality:F10 Mental and behavioural disorders due to use of alcoholK70 Alcoholic liver diseaseK73 Chronic hepatitis, not elsewhere classifiedX45 Accidental poisoning by and exposure to alcoholX65 Intentional self-poisoning by and exposure to alcoholY15 Poisoning by and exposure to alcohol, undetermined intentG312 Degeneration of nervous system due to alcoholG621 Alcoholic polyneuropathyI426 Alcoholic cardiomyopathyK292 Alcoholic gastritisK740 Hepatic fibrosisK741 Hepatic sclerosisK742 Hepatic fibrosis with hepatic sclerosisK746 Other and unspecified cirrhosis of liverK860 Alcohol-induced chronic pancreatitis
The National Records of Scotland (NRS) routinely reports national statistics on all deaths for Scotland. ICD codes are used to categorise cause(s) of death. In this publication only the underlying (primary) cause of death has been used for reporting. Comparable available data are presented for alcohol-related deaths for England and Wales, published by the Office of National Statistics (ONS).
The Scottish Index of Multiple Deprivation (SIMD) is a measure of multiple deprivation which ranks the relative deprivation of each area (datazone) of Scotland in a number of domains (such as income, employment, education, but also health) and then combines the individual scores to produce a composite score for each area. Datazones were introduced in 2004 to replace postcode sectors as the key small area geography for Scotland. They were based on 2001 Census Output Areas and were intended to be a stable geography over time, with a reasonably consistent population size, and boundaries set to respect physical boundaries and natural communities as far as possible. For reporting, the 6,505 datazones are aggregated into 10 groups (deciles) with approximately equal population size. Decile 1 contains the most deprived datazones and decile 10 the least deprived datazones. The patient's residential postcode is routinely mapped to datazones so health data can also be reported by deprivation decile. There have been SIMD releases in 2004, 2006, 2009 and 2012. The SIMD version used varies for different years of data to best capture deprivation at a particular point in time, using the latest version availabe. More information on SIMD can be found here: http://www.gov.scot/Topics/Statistics/SIMD.
Because the full SIMD used in these analyses of health harms includes health indicators there is a degree of circularity. However the SIMD health domain has a relatively small weighting in the overall index and therefore the impact of this is expected to be very small.
Diagnoses are coded using the World Health Organization's International Classification of Diseases 9th Revision (ICD9) and 10th Revision (ICD10). ISD moved from using ICD9 to ICD10 in 1996. The change introduced a number of new alcohol-related ICD codes. However, mapping of codes from ICD9 to ICD10 is not exact and so caution must be used when interpreting trends over longer timeframes. Also note that where alcohol misuse is suspected but unconfirmed it may not be recorded by the hospital and hence recording may vary between hospitals; therefore caution is necessary when interpreting these figures.

2. Key Points
2.1. Deaths from any alcohol-related condition
2.2. Measure of inequalities (SII and RII)- The SII for standardised rates of alcohol-related deaths peaked in 2002, and has decreased since.
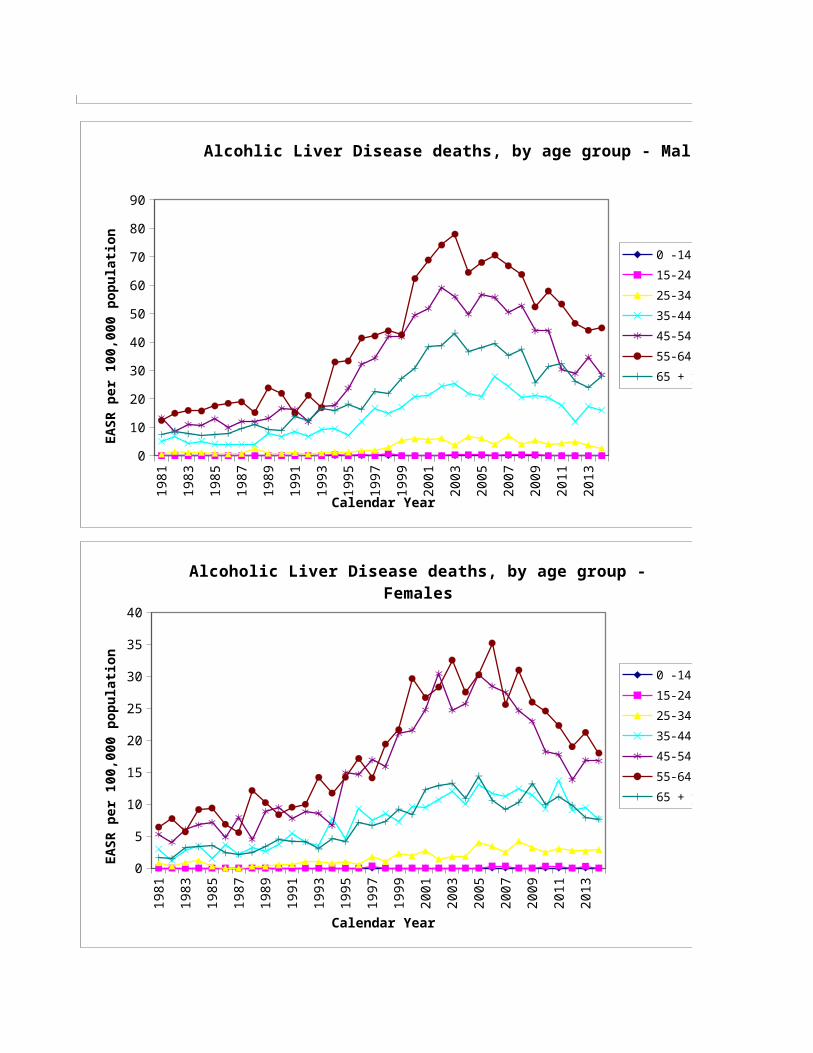
2.3. Deaths from alcohol-related liver disease
- Rates were highest in the 45-64 year age groups.2.4. Comparing mortality in Scotland versus England & Wales
Back to Contents page
- From the early nineties, alcohol-related death rates have increased sharply to a peak in 2003 of 33.2 deaths per 100,000 population. Over the full time period (from 1981 to 2014), alcohol-related mortality rates have increased by 49% (53% for men and 41% for women).
- Since the peak in death rates in 2003, rates have generally been decreasing. Alcohol-related mortality has now fallen by 33% (35% for males and 29% for females) from the peak rate in 2003. However, the decrease has appeared to come to an end over the last few years. In some, particularly older age groups (over 45) and in the most deprived decile, rates have been increasing again in recent years.
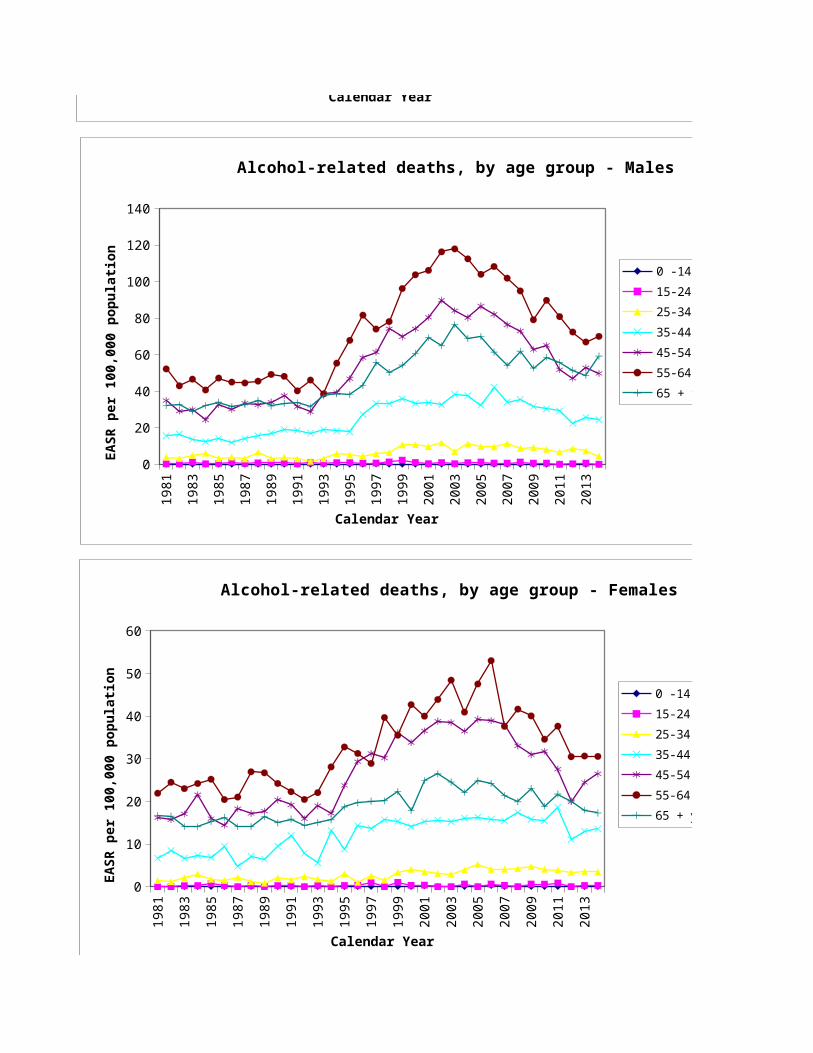
- Alcohol-related death rates have consistently been at least twice as high in males compared to females. Rates have generally been highest in 55-64 year olds, followed by 45-54 year olds and 65+ years. Age-specific trends are similar for males and females.
- The RII for rates of alcohol-related deaths increased from 2.0 in 1997 to 2.5 in 2002, and then decreased again to fluctuate around 2.0 in recent years.
- Deaths from alcohol-related liver disease peaked in 2003 in males and a couple of years later in females, and have generally followed a downward trend since.
- Where deaths in Scotland showed a substantial rise from the early nineties up to a peak in 2003 (for males) or 2006 (for females), the rates in England & Wales rose much more moderately to a peak in 2008. The highest value in Scotland was 47.7 per 100,000 population in males and 19.6 per 100,000 for females, compared to 19.8 per 100,000 in males and 9.6 per 100,000 in females in England & Wales. Since then Scotland has seen a much more substantial drop than in England & Wales, but in 2013 rates in Scotland were still 1.7 times higher for males and 1.5 times higher for females compared to England & Wales.

MESAS - Alcohol-related deaths (numbers): Scotland by age groupRate per 100,000 population Number of deaths
Scotland1981 0.0 0.1 2.6 11.1 25.5 37.1 24.5 14.9 1981 0 1 19 66 148 200 1771982 0.0 0.1 2.2 12.5 22.4 33.7 24.5 14.2 1982 0 1 15 75 129 185 1771983 0.0 0.7 3.4 10.1 23.5 34.8 21.4 13.8 1983 0 6 24 63 135 192 1541984 0.0 0.2 4.5 9.8 22.9 32.4 23.1 13.7 1984 0 2 31 62 132 184 1611985 0.0 0.6 2.4 10.5 24.3 36.2 24.6 14.6 1985 0 5 17 67 138 199 1741986 0.0 0.7 2.7 10.7 22.3 32.7 23.9 13.8 1986 0 6 19 70 125 177 1711987 0.0 0.2 2.6 9.3 25.9 32.8 23.5 13.9 1987 0 2 19 62 145 176 1651988 0.0 0.5 3.9 11.3 24.8 36.2 24.5 14.9 1988 0 4 28 76 140 195 1841989 0.0 0.4 2.0 11.8 25.8 37.9 24.1 15.0 1989 0 3 15 80 147 202 1791990 0.0 0.5 3.0 14.2 29.0 36.2 24.2 15.7 1990 0 4 23 98 166 192 1741991 0.0 0.3 2.2 15.2 25.3 31.2 24.8 14.7 1991 0 2 17 106 147 165 1871992 0.0 0.4 1.9 12.4 22.3 33.3 22.9 13.8 1992 0 3 15 85 133 175 1711993 0.0 0.4 2.4 12.2 28.9 30.3 26.2 15.0 1993 0 3 19 83 175 160 1931994 0.0 0.4 3.6 15.7 28.2 41.7 27.1 17.1 1994 0 3 28 108 177 220 2051995 0.0 0.6 4.1 13.3 35.3 50.3 28.4 19.2 1995 0 4 32 92 222 265 2171996 0.0 0.5 2.7 20.8 43.8 56.4 31.4 22.6 1996 0 3 21 147 280 294 2381997 0.1 0.8 4.1 23.5 46.3 51.4 37.9 24.2 1997 1 5 32 168 303 268 2841998 0.0 0.7 4.0 24.4 52.2 58.9 35.2 25.5 1998 0 4 30 178 345 312 2581999 0.0 1.6 7.0 25.5 52.9 65.9 38.3 27.7 1999 0 10 52 191 354 351 2912000 0.0 0.6 7.4 23.7 53.9 73.2 39.3 28.7 2000 0 4 53 179 366 394 2962001 0.1 0.3 6.5 24.5 58.5 73.1 47.1 30.8 2001 1 2 46 188 402 396 3632002 0.0 0.5 7.4 24.1 64.3 80.1 45.6 32.3 2002 0 3 50 187 437 452 3582003 0.0 0.2 4.9 26.8 61.3 83.2 50.5 33.2 2003 0 1 32 209 416 481 3862004 0.0 0.8 7.5 26.8 58.3 76.7 45.5 31.4 2004 0 5 48 211 400 456 3582005 0.0 0.6 7.4 24.3 63.0 75.8 47.3 31.9 2005 0 4 47 192 438 459 3732006 0.1 0.6 6.8 29.0 60.5 80.6 42.8 31.9 2006 1 4 42 228 427 498 3462007 0.0 0.5 7.7 24.7 57.2 69.7 37.8 28.6 2007 0 3 47 194 410 439 3062008 0.0 0.6 6.4 26.5 53.0 68.3 40.9 28.5 2008 0 4 39 205 389 435 3392009 0.0 0.6 7.0 23.7 46.9 59.6 37.9 25.7 2009 0 4 43 182 351 385 3172010 0.0 0.6 6.1 22.9 48.4 62.2 38.7 26.1 2010 0 4 39 171 370 406 3282011 0.0 0.4 5.3 23.9 39.7 59.2 38.7 24.6 2011 0 3 34 175 308 393 3342012 0.0 0.1 5.9 16.7 33.5 51.4 35.8 21.2 2012 0 1 39 119 263 338 3202013 0.0 0.4 5.4 19.3 38.6 48.8 33.3 21.4 2013 0 3 36 135 305 321 3002014 0.0 0.1 3.9 19.0 38.1 50.3 38.2 22.2 2014 0 1 27 129 303 334 358
3.1. Alcohol-related Deaths1,2,3 by age group and gender (calendar years 1981 to 2014) Back to Contents page
MESAS - Alcohol-related deaths (EASR4): Scotland by age group
0 -14 years
15-24 years
25-34 years
35-44 years
45-54 years
55-64 years
65 + years
0 -14 years
15-24 years
25-34 years
35-44 years
45-54 years
55-64 years
65 + years
Calendar Year of Registration of Death
Calendar Year of Registration of Death

MESAS - Alcohol-related deaths (numbers): Males by age groupRate per 100,000 population Number of deaths
Males1981 0.0 0.2 3.9 15.6 34.9 52.2 32.2 20.4 1981 0 1 14 46 99 135 981982 0.0 0.2 3.1 16.5 29.1 42.9 32.6 18.5 1982 0 1 11 49 82 112 1001983 0.0 1.2 4.8 13.6 29.9 46.6 28.8 18.3 1983 0 5 17 42 84 123 881984 0.0 0.2 6.0 12.4 24.3 40.6 32.1 17.2 1984 0 1 21 39 68 109 971985 0.0 0.5 3.1 14.1 32.6 47.2 34.0 19.5 1985 0 2 11 45 91 124 1031986 0.0 1.2 3.9 11.9 30.1 45.0 31.5 18.3 1986 0 5 14 39 83 117 941987 0.0 0.5 3.0 13.9 33.5 44.5 32.9 19.0 1987 0 2 11 46 92 115 981988 0.0 0.7 6.6 15.5 32.5 45.5 34.9 20.1 1988 0 3 24 52 90 117 1171989 0.0 0.7 3.2 17.1 34.0 49.2 31.9 20.0 1989 0 3 12 58 95 126 1011990 0.0 0.8 3.9 19.0 37.6 48.1 33.4 21.0 1990 0 3 15 65 106 123 1031991 0.0 0.3 2.9 18.5 31.5 40.2 33.8 19.0 1991 0 1 11 64 90 102 1111992 0.0 0.8 1.6 17.0 28.7 46.1 31.4 18.6 1992 0 3 6 58 84 117 1031993 0.0 0.6 3.1 18.8 38.8 38.5 37.4 20.6 1993 0 2 12 64 116 98 1221994 0.0 0.9 5.9 18.2 39.2 55.3 38.5 23.3 1994 0 3 23 62 122 141 1311995 0.0 0.9 5.2 17.8 46.8 67.8 38.1 25.7 1995 0 3 20 61 146 173 1281996 0.0 0.6 4.4 27.3 58.3 81.6 43.1 31.2 1996 0 2 17 96 185 207 1461997 0.2 0.7 5.8 33.3 61.4 74.0 55.7 34.2 1997 1 2 22 118 200 188 1891998 0.0 1.3 6.4 33.2 74.2 78.1 50.3 35.6 1998 0 4 24 119 244 201 1631999 0.0 2.3 10.7 35.7 69.7 96.2 54.3 39.0 1999 0 7 39 132 232 251 1862000 0.0 1.0 10.8 33.3 74.1 103.7 60.7 41.3 2000 0 3 38 124 250 273 2122001 0.0 0.3 9.6 33.7 80.5 106.1 69.3 44.0 2001 0 1 33 127 275 282 2462002 0.0 0.9 11.8 32.6 89.9 116.3 64.8 45.9 2002 0 3 39 124 303 322 2322003 0.0 0.3 6.9 38.3 84.1 117.9 76.5 47.7 2003 0 1 22 147 283 334 2692004 0.0 0.9 11.1 37.6 80.2 112.4 68.8 45.5 2004 0 3 35 145 272 329 2532005 0.0 1.2 9.7 32.3 86.6 104.0 69.9 44.6 2005 0 4 30 125 298 309 2552006 0.0 0.6 9.5 42.2 82.1 108.2 61.4 44.2 2006 0 2 29 163 286 328 2322007 0.0 0.6 11.3 34.0 76.3 101.9 54.2 40.2 2007 0 2 34 131 270 317 2052008 0.0 1.2 8.6 35.5 72.9 94.9 61.9 40.3 2008 0 4 26 135 265 299 2422009 0.0 0.6 9.2 31.6 62.8 79.1 52.7 34.6 2009 0 2 28 119 232 252 2042010 0.0 0.6 8.1 30.3 65.1 89.8 58.6 37.1 2010 0 2 26 111 245 290 2352011 0.0 0.0 6.7 29.2 51.8 80.8 55.7 33.1 2011 0 0 21 105 198 265 2262012 0.0 0.3 8.5 22.3 47.0 72.4 51.5 29.9 2012 0 1 28 78 182 235 2172013 0.0 0.6 7.3 25.7 52.7 66.9 48.7 29.8 2013 0 2 24 88 205 217 2052014 0.0 0.0 4.4 24.4 49.7 70.0 59.2 31.2 2014 0 0 15 81 194 229 265
MESAS - Alcohol-related deaths (EASR4): Males by age group
0 -14 years
15-24 years
25-34 years
35-44 years
45-54 years
55-64 years
65 + years
0 -14 years
15-24 years
25-34 years
35-44 years
45-54 years
55-64 years
65 + years
Calendar Year of Registration of Death
Calendar Year of Registration of Death

MESAS - Alcohol-related deaths (numbers): Females by age groupRate per 100,000 population Number of deaths
Females1981 0.0 0.0 1.4 6.6 16.2 21.9 16.7 9.4 1981 0 0 5 20 49 65 791982 0.0 0.0 1.2 8.4 15.7 24.5 16.5 9.8 1982 0 0 4 26 47 73 771983 0.0 0.2 2.0 6.7 17.1 23.0 14.1 9.2 1983 0 1 7 21 51 69 661984 0.0 0.2 3.0 7.3 21.6 24.2 14.0 10.2 1984 0 1 10 23 64 75 641985 0.0 0.7 1.7 6.9 16.0 25.2 15.3 9.6 1985 0 3 6 22 47 75 711986 0.0 0.2 1.5 9.5 14.4 20.4 16.3 9.3 1986 0 1 5 31 42 60 771987 0.0 0.0 2.2 4.8 18.3 21.0 14.1 8.9 1987 0 0 8 16 53 61 671988 0.0 0.2 1.2 7.1 17.1 26.9 14.1 9.7 1988 0 1 4 24 50 78 671989 0.0 0.0 0.8 6.5 17.7 26.7 16.4 10.0 1989 0 0 3 22 52 76 781990 0.0 0.3 2.0 9.5 20.4 24.2 15.0 10.4 1990 0 1 8 33 60 69 711991 0.0 0.3 1.6 12.0 19.2 22.3 15.8 10.5 1991 0 1 6 42 57 63 761992 0.0 0.0 2.3 7.8 15.9 20.4 14.3 9.0 1992 0 0 9 27 49 58 681993 0.0 0.3 1.8 5.5 19.0 22.1 15.1 9.4 1993 0 1 7 19 59 62 711994 0.0 0.0 1.3 13.2 17.2 28.1 15.7 11.0 1994 0 0 5 46 55 79 741995 0.0 0.3 3.0 8.8 23.7 32.8 18.7 12.7 1995 0 1 12 31 76 92 891996 0.0 0.3 1.0 14.3 29.3 31.3 19.7 14.0 1996 0 1 4 51 95 87 921997 0.0 1.0 2.5 13.6 31.2 28.9 20.1 14.2 1997 0 3 10 50 103 80 951998 0.0 0.0 1.5 15.7 30.2 39.7 20.1 15.5 1998 0 0 6 59 101 111 951999 0.0 1.0 3.3 15.3 36.1 35.5 22.3 16.5 1999 0 3 13 59 122 100 1052000 0.0 0.3 4.1 14.0 33.8 42.7 17.9 16.1 2000 0 1 15 55 116 121 842001 0.2 0.3 3.5 15.2 36.5 40.0 24.9 17.6 2001 1 1 13 61 127 114 1172002 0.0 0.0 3.1 15.6 38.8 43.9 26.4 18.6 2002 0 0 11 63 134 130 1262003 0.0 0.0 2.9 15.2 38.5 48.4 24.5 18.7 2003 0 0 10 62 133 147 1172004 0.0 0.6 3.9 16.1 36.5 40.9 22.1 17.3 2004 0 2 13 66 128 127 1052005 0.0 0.0 5.2 16.3 39.3 47.5 24.8 19.2 2005 0 0 17 67 140 150 1182006 0.2 0.6 4.1 15.8 38.9 53.0 24.2 19.6 2006 1 2 13 65 141 170 1142007 0.0 0.3 4.1 15.4 38.1 37.6 21.4 16.9 2007 0 1 13 63 140 122 1012008 0.0 0.0 4.2 17.4 33.0 41.6 19.9 16.7 2008 0 0 13 70 124 136 972009 0.0 0.6 4.7 15.8 31.0 40.1 23.0 16.7 2009 0 2 15 63 119 133 1132010 0.0 0.6 4.1 15.5 31.7 34.6 18.9 15.2 2010 0 2 13 60 125 116 932011 0.0 0.9 3.9 18.6 27.6 37.6 21.7 16.0 2011 0 3 13 70 110 128 1082012 0.0 0.0 3.3 11.0 19.9 30.5 20.1 12.5 2012 0 0 11 41 81 103 1032013 0.0 0.3 3.5 13.0 24.4 30.6 18.0 13.0 2013 0 1 12 47 100 104 952014 0.0 0.3 3.4 13.6 26.5 30.5 17.3 13.3 2014 0 1 12 48 109 105 93
1. Deaths recorded using the World Health Organization's International Classification of Diseases 9th Revision (ICD9) and 10th Revision (ICD10).2. Deaths where an alcohol-related condition is coded as the underlying (main) cause of death.3. Data are based on the calendar year of registration of death.4. The European Age-Standardised Rate (EASR) per 100,000 population is calculated using the 2013 European Standard Population.
Source: ISD Scotland, SMR99 (Sep 2015)
MESAS - Alcohol-related deaths (EASR4): Females by age group
0 -14 years
15-24 years
25-34 years
35-44 years
45-54 years
55-64 years
65 + years
0 -14 years
15-24 years
25-34 years
35-44 years
45-54 years
55-64 years
65 + years
Calendar Year of Registration of Death
Calendar Year of Registration of Death
MESAS - Alcohol-related deaths (numbers): Scotland by age groupNumber of deaths
Scotland611582574572600568569627626657624582633741832983
1,0611,1271,2491,2921,3981,4871,5251,4781,5131,5461,3991,4111,2821,3181,2471,0801,1001,152
Back to Contents page

MESAS - Alcohol-related deaths (numbers): Males by age groupNumber of deaths
Males393355359335376352364403395415379371414482531653720755847900964
1,0231,0561,0371,0211,040
959971837909815741741784

MESAS - Alcohol-related deaths (numbers): Females by age groupNumber of deaths
Females218227215237224216205224231242245211219259301330341372402392434464469441492506440440445409432339359368

3.2. Alcohol-related Deaths1,2,3 by age group and gender (calendar years 1981 to 2014)
1981
1983
1985
1987
1989
1991
1993
1995
1997
1999
2001
2003
2005
2007
2009
2011
2013
0
10
20
30
40
50
60
70
80
90
Alcohol-related deaths, by age group - Scotland
0 -14 years15-24 years25-34 years35-44 years45-54 years55-64 years65 + years
Calendar Year
EASR
per
100
,000
pop
ulat
ion
1981
1983
1985
1987
1989
1991
1993
1995
1997
1999
2001
2003
2005
2007
2009
2011
2013
0
10
20
30
40
50
60
Alcohol-related deaths, by gender
Males
Females
Scotland
Calendar Year
EASR
per
100
,000
pop
ulat
ion
1981
1983
1985
1987
1989
1991
1993
1995
1997
1999
2001
2003
2005
2007
2009
2011
2013
0
20
40
60
80
100
120
140
Alcohol-related deaths, by age group - Males
0 -14 years15-24 years25-34 years35-44 years45-54 years55-64 years65 + years
Calendar Year
EASR
per
100
,000
pop
ulat
ion
1. Deaths recorded using the World Health Organization's International Classification of Diseases 9th Revision (ICD9) and 10th Revision (ICD10).2. Deaths where an alcohol-related condition is coded as the underlying (main) cause of death.3. Data are based on the calendar year of registration of death.4. The European Age-Standardised Rate (EASR) per 100,000 population is calculated using the 2013 European Standard Population.
Source: ISD Scotland, SMR99 (Sep 2015)
1981
1983
1985
1987
1989
1991
1993
1995
1997
1999
2001
2003
2005
2007
2009
2011
2013
0
20
40
60
80
100
120
140
Alcohol-related deaths, by age group - Males
0 -14 years15-24 years25-34 years35-44 years45-54 years55-64 years65 + years
Calendar Year
EASR
per
100
,000
pop
ulat
ion
1981
1983
1985
1987
1989
1991
1993
1995
1997
1999
2001
2003
2005
2007
2009
2011
2013
0
10
20
30
40
50
60
Alcohol-related deaths, by age group - Females
0 -14 years15-24 years25-34 years35-44 years45-54 years55-64 years65 + years
Calendar Year
EASR
per
100
,000
pop
ulat
ion

by age group and gender (calendar years 1981 to 2014) Back to Contents page
1981
1983
1985
1987
1989
1991
1993
1995
1997
1999
2001
2003
2005
2007
2009
2011
2013
0
10
20
30
40
50
60
70
80
90
Alcohol-related deaths, by age group - Scotland
0 -14 years15-24 years25-34 years35-44 years45-54 years55-64 years65 + years
Calendar Year
EASR
per
100
,000
pop
ulat
ion
1981
1983
1985
1987
1989
1991
1993
1995
1997
1999
2001
2003
2005
2007
2009
2011
2013
0
10
20
30
40
50
60
Alcohol-related deaths, by gender
Males
Females
Scotland
Calendar Year
EASR
per
100
,000
pop
ulat
ion
1981
1983
1985
1987
1989
1991
1993
1995
1997
1999
2001
2003
2005
2007
2009
2011
2013
0
20
40
60
80
100
120
140
Alcohol-related deaths, by age group - Males
0 -14 years15-24 years25-34 years35-44 years45-54 years55-64 years65 + years
Calendar Year
EASR
per
100
,000
pop
ulat
ion

1. Deaths recorded using the World Health Organization's International Classification of Diseases 9th Revision (ICD9) and 10th Revision (ICD10).
4. The European Age-Standardised Rate (EASR) per 100,000 population is calculated using the 2013 European Standard Population.
1981
1983
1985
1987
1989
1991
1993
1995
1997
1999
2001
2003
2005
2007
2009
2011
2013
0
20
40
60
80
100
120
140
Alcohol-related deaths, by age group - Males
0 -14 years15-24 years25-34 years35-44 years45-54 years55-64 years65 + years
Calendar Year
EASR
per
100
,000
pop
ulat
ion
1981
1983
1985
1987
1989
1991
1993
1995
1997
1999
2001
2003
2005
2007
2009
2011
2013
0
10
20
30
40
50
60
Alcohol-related deaths, by age group - Females
0 -14 years15-24 years25-34 years35-44 years45-54 years55-64 years65 + years
Calendar Year
EASR
per
100
,000
pop
ulat
ion
Rate per 100,000 populationSIMD 10 SIMD 9 SIMD 8 SIMD 7 SIMD 6 SIMD 5
1996 10.4 6.8 11.3 13.0 17.4 20.11997 9.3 11.9 13.5 16.3 18.7 19.71998 9.1 10.3 13.6 15.0 21.9 21.71999 11.4 11.5 13.0 21.5 18.7 25.32000 10.7 12.7 14.5 14.9 21.6 26.12001 12.9 13.5 16.3 16.6 19.2 26.82002 8.3 12.9 15.4 18.6 21.5 27.92003 10.9 14.3 12.8 21.1 25.3 26.72004 10.3 12.3 15.6 16.6 20.6 24.52005 10.8 13.6 13.4 18.4 24.5 27.32006 9.0 12.7 17.3 15.7 24.6 26.92007 7.9 12.9 13.5 17.8 17.6 26.72008 7.5 11.5 10.7 12.0 21.8 29.92009 7.4 12.2 14.2 17.1 16.6 21.72010 9.0 12.1 12.2 15.2 17.0 24.72011 9.3 10.6 12.6 17.5 15.3 23.32012 8.8 8.2 11.9 9.5 14.5 21.32013 7.6 9.2 9.9 15.3 14.4 20.72014 7.4 8.5 12.7 13.3 16.1 23.1
Rate per 100,000 populationSIMD 10 SIMD 9 SIMD 8 SIMD 7 SIMD 6 SIMD 5
1996 15.6 7.3 17.6 16.0 25.9 25.91997 13.0 14.2 19.8 22.4 29.4 29.21998 11.6 14.2 20.8 20.1 31.2 32.11999 13.7 16.0 15.6 29.2 26.0 36.62000 13.6 16.6 18.6 21.5 30.0 39.32001 15.5 16.7 24.5 26.9 25.4 39.32002 9.2 17.3 17.1 28.5 30.5 38.42003 15.6 20.7 15.7 28.9 33.8 39.62004 14.5 17.4 20.2 21.1 28.1 36.82005 13.2 18.7 17.5 25.7 30.0 40.22006 10.8 14.8 18.3 20.6 35.5 37.42007 10.8 16.6 18.4 21.5 24.5 37.32008 7.0 14.6 14.4 17.0 30.9 43.62009 8.9 14.7 15.8 22.8 22.0 26.0
3.3. Alcohol-related Deaths1,2,3 by Scottish Index of Multiple Deprivation (SIMD)5 (calendar years 1996 to 2014)
MESAS - Alcohol-related deaths (EASR4): Scotland by SIMD decile (1 = most deprived, 10 = least deprived)
Calendar Year of Registration of Death
MESAS - Alcohol-related deaths (EASR4): Males by SIMD decile (1 = most deprived, 10 = least deprived)
Calendar Year of Registration of Death

2010 11.1 17.1 15.7 21.7 22.2 35.42011 9.9 13.0 15.7 25.0 21.0 30.62012 10.3 10.7 17.7 12.9 19.9 31.92013 10.0 12.8 13.7 20.1 17.3 27.32014 8.6 9.6 17.2 19.0 24.2 29.5
Rate per 100,000 populationSIMD 10 SIMD 9 SIMD 8 SIMD 7 SIMD 6 SIMD 5
1996 5.1 6.3 5.1 9.9 8.8 14.31997 5.7 9.6 7.3 10.3 8.0 10.21998 6.7 6.4 6.3 9.9 12.5 11.31999 9.2 7.0 10.3 13.8 11.5 14.12000 7.9 8.9 10.3 8.3 13.3 12.82001 10.2 10.2 8.0 6.3 13.0 14.42002 7.5 8.5 13.7 8.7 12.5 17.32003 6.2 8.0 9.9 13.3 16.8 13.82004 6.2 7.1 10.9 12.2 13.1 12.32005 8.4 8.5 9.3 11.1 19.0 14.32006 7.1 10.6 16.3 10.7 13.7 16.52007 5.1 9.1 8.5 14.2 10.7 16.22008 7.9 8.4 7.1 7.1 12.9 16.22009 5.9 9.8 12.6 11.4 11.2 17.42010 6.9 7.1 8.7 8.7 11.9 14.12011 8.7 8.2 9.5 9.9 9.8 15.92012 7.3 5.7 6.1 6.2 9.2 10.62013 5.2 5.6 6.0 10.5 11.4 14.02014 6.2 7.4 8.3 7.5 8.0 16.8
1. Deaths recorded using the World Health Organization's International Classification of Diseases 9th Revision (ICD9) and 10th Revision (ICD10).2. Deaths where an alcohol-related condition is coded as the underlying (main) cause of death.3. Data are based on the calendar year of registration of death.4. The European Age-Standardised Rate (EASR) per 100,000 population is calculated using the 2013 European Standard Population.5. Deciles of the Scottish Index of Multiple Deprivation (SIMD) divide the Scottish population into ten equal categories based on the deprivation scores of the area in which they live, so that 10% of the population falls into each decile. Decile 1 includes the most deprived areas, decile 10 the least deprived areas.
Source: ISD Scotland, SMR99 (Sep 2015)
Calendar Year of Registration of Death
MESAS - Alcohol-related deaths (EASR4): Females by SIMD decile (1 = most deprived, 10 = least deprived)
Calendar Year of Registration of Death

Rate per 100,000 population Number of deathsSIMD 4 SIMD 3 SIMD 2 SIMD 1 SIMD 10
22.4 29.0 36.4 60.1 1996 3920.9 32.5 40.1 61.1 1997 3726.4 32.1 36.4 69.5 1998 3826.8 32.0 41.9 79.9 1999 5229.3 33.8 50.8 79.6 2000 4529.8 41.7 49.4 89.2 2001 5733.1 43.7 52.9 102.4 2002 3933.4 44.8 59.2 96.6 2003 5040.7 42.4 52.5 88.6 2004 4732.5 47.4 60.0 80.3 2005 4831.9 42.9 56.4 95.9 2006 3930.2 33.7 55.5 77.4 2007 3736.1 35.8 53.1 77.0 2008 3626.3 39.5 44.6 62.0 2009 3530.7 33.5 45.7 67.0 2010 4526.6 34.9 41.4 57.6 2011 4624.2 27.9 34.9 54.7 2012 4524.2 34.3 34.9 46.5 2013 3924.8 29.7 36.4 56.8 2014 38
Rate per 100,000 population Number of deathsSIMD 4 SIMD 3 SIMD 2 SIMD 1 SIMD 10
31.5 44.4 50.4 79.6 1996 2828.8 47.2 51.8 89.3 1997 2431.6 44.3 48.1 99.4 1998 2334.8 50.1 55.3 119.6 1999 2940.2 49.8 72.5 123.3 2000 2739.1 59.3 70.9 133.8 2001 3345.5 62.9 79.7 152.4 2002 2146.9 62.1 92.5 140.2 2003 3559.5 59.6 79.5 135.2 2004 3247.9 62.0 83.4 123.4 2005 2847.8 61.8 83.8 133.4 2006 2243.9 48.5 82.4 112.4 2007 2450.6 50.6 76.2 114.9 2008 1632.7 55.8 68.6 86.8 2009 20
by Scottish Index of Multiple Deprivation (SIMD)5 (calendar years 1996 to 2014) Back to Contents page
): Scotland by SIMD decile (1 = most deprived, 10 = least deprived)
MESAS - Alcohol-related deaths (numbers): Scotland by SIMD decile (1 = most deprived, 10 = least deprived)
Calendar Year of Registration of Death
): Males by SIMD decile (1 = most deprived, 10 = least deprived)
MESAS - Alcohol-related deaths (numbers): Males by SIMD decile (1 = most deprived, 10 = least deprived)
Calendar Year of Registration of Death

46.2 46.9 63.0 100.1 2010 2733.0 49.3 58.1 81.0 2011 2333.1 38.7 49.6 80.9 2012 2529.9 47.5 50.9 71.8 2013 2533.0 46.2 55.5 82.7 2014 21
Rate per 100,000 population Number of deathsSIMD 4 SIMD 3 SIMD 2 SIMD 1 SIMD 10
13.3 13.5 22.4 40.7 1996 1113.0 17.9 28.4 33.0 1997 1321.1 19.8 24.7 39.5 1998 1518.9 14.0 28.6 40.3 1999 2318.3 17.8 29.1 36.0 2000 1820.6 24.1 28.2 44.6 2001 2420.7 24.4 26.1 52.4 2002 1819.8 27.5 25.8 53.1 2003 1522.0 25.3 25.5 41.6 2004 1517.1 32.8 36.6 37.6 2005 2015.9 24.0 29.3 58.4 2006 1716.5 18.9 28.6 42.6 2007 1321.7 21.0 30.1 39.0 2008 2019.9 23.5 20.7 37.0 2009 1515.2 20.2 28.3 33.8 2010 1820.2 20.3 24.5 34.1 2011 2315.2 17.1 20.0 28.4 2012 2018.4 21.1 18.6 21.2 2013 1416.6 13.2 17.6 30.9 2014 17
1. Deaths recorded using the World Health Organization's International Classification of Diseases 9th Revision (ICD9) and 10th Revision (ICD10).
4. The European Age-Standardised Rate (EASR) per 100,000 population is calculated using the 2013 European Standard Population.5. Deciles of the Scottish Index of Multiple Deprivation (SIMD) divide the Scottish population into ten equal categories based on the deprivation scores of the area in which they live, so that 10% of the population falls into each decile. Decile 1 includes the most deprived areas, decile 10 the least deprived areas.
Calendar Year of Registration of Death
): Females by SIMD decile (1 = most deprived, 10 = least deprived)
MESAS - Alcohol-related deaths (numbers): Females by SIMD decile (1 = most deprived, 10 = least deprived)
Calendar Year of Registration of Death

Number of deathsSIMD 9 SIMD 8 SIMD 7 SIMD 6 SIMD 5 SIMD 4 SIMD 3 SIMD 2
26 47 57 75 89 97 123 15850 55 71 82 87 94 141 17443 56 66 100 100 119 139 16347 58 96 86 117 120 140 18654 67 66 98 118 132 147 22260 72 78 91 121 136 183 21956 73 86 100 130 150 193 23267 61 99 119 125 155 198 25253 74 83 99 115 188 195 23562 63 88 123 126 154 223 27160 87 78 121 136 151 198 25865 65 93 87 133 147 159 25656 54 62 113 148 176 172 24460 74 90 86 111 132 193 20661 61 81 88 123 152 165 22057 66 93 81 119 134 173 20142 62 51 79 108 124 139 16848 55 82 78 110 127 169 16846 67 72 86 120 128 148 175
Number of deathsSIMD 9 SIMD 8 SIMD 7 SIMD 6 SIMD 5 SIMD 4 SIMD 3 SIMD 2
13 34 34 54 55 65 91 10528 39 46 63 62 62 97 10730 42 43 70 72 68 93 10431 34 63 57 82 75 106 11833 41 45 66 86 88 104 15235 52 63 58 85 85 126 15036 39 64 68 85 99 133 16947 36 65 75 89 106 133 19135 46 51 66 84 132 131 17340 39 59 73 89 109 140 18133 44 49 85 91 110 138 18441 43 54 59 90 104 111 18434 35 43 77 105 119 118 16935 40 58 55 65 79 129 155
MESAS - Alcohol-related deaths (numbers): Scotland by SIMD decile (1 = most deprived, 10 = least deprived)
MESAS - Alcohol-related deaths (numbers): Males by SIMD decile (1 = most deprived, 10 = least deprived)

42 38 56 54 86 112 112 14532 40 65 53 76 80 119 13826 45 33 52 80 83 92 11632 38 52 45 70 77 113 12024 44 50 62 74 83 111 127
Number of deathsSIMD 9 SIMD 8 SIMD 7 SIMD 6 SIMD 5 SIMD 4 SIMD 3 SIMD 2
13 13 23 21 34 32 32 5322 16 25 19 25 32 44 6713 14 23 30 28 51 46 5916 24 33 29 35 45 34 6821 26 21 32 32 44 43 7025 20 15 33 36 51 57 6920 34 22 32 45 51 60 6320 25 34 44 36 49 65 6118 28 32 33 31 56 64 6222 24 29 50 37 45 83 9027 43 29 36 45 41 60 7424 22 39 28 43 43 48 7222 19 19 36 43 57 54 7525 34 32 31 46 53 64 5119 23 25 34 37 40 53 7525 26 28 28 43 54 54 6316 17 18 27 28 41 47 5216 17 30 33 40 50 56 4822 23 22 24 46 45 37 48
MESAS - Alcohol-related deaths (numbers): Females by SIMD decile (1 = most deprived, 10 = least deprived)

Number of deaths TotalSIMD 1 Sum
270 981267 1,058298 1,122343 1,245333 1,282373 1,390421 1,480393 1,519380 1,469348 1,506415 1,543349 1,391344 1,405288 1,275315 1,311272 1,242260 1,078224 1,100262 1,142
Number of deaths TotalSIMD 1 Sum
172 651189 717205 750249 844251 893270 957303 1,017274 1,051283 1,033258 1,016282 1,038244 954250 966196 832
Back to Contents page
MESAS - Alcohol-related deaths (numbers): Scotland by SIMD decile
MESAS - Alcohol-related deaths (numbers): Males by SIMD decile

230 902185 811188 740169 741183 779
Number of deaths TotalSIMD 1 Sum
98 33078 34193 37294 40182 389
103 433118 463119 46897 43690 490
133 505105 43794 43992 44385 40987 43172 33855 35979 363
MESAS - Alcohol-related deaths (numbers): Females by SIMD decile

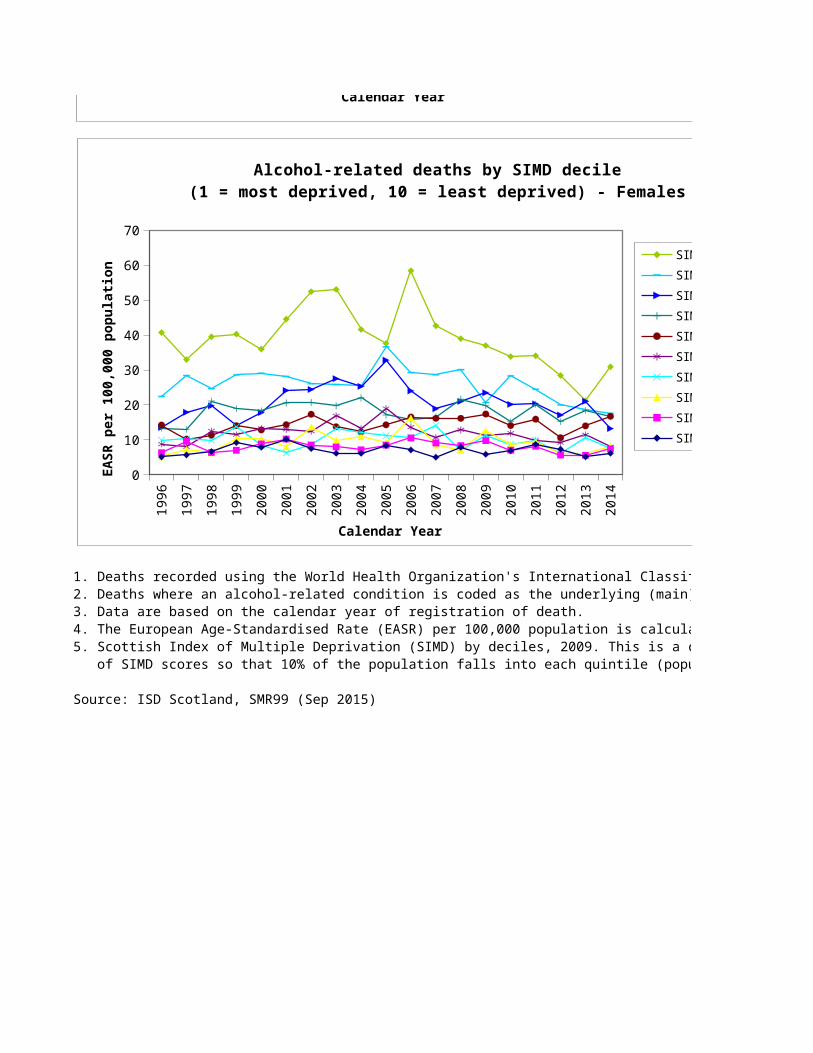
3.4. Alcohol Related Deaths1,2,3 by Scottish Index of Multiple Deprivation (SIMD)5 (calendar years 1996 to 2014)
1996
1997
1998
1999
2000
2001
2002
2003
2004
2005
2006
2007
2008
2009
2010
2011
2012
2013
2014
0
20
40
60
80
100
120
Alcohol-related deaths by SIMD decile(1 = most deprived, 10 = least deprived) - Scotland
SIMD 1SIMD 2SIMD 3SIMD 4SIMD 5SIMD 6SIMD 7SIMD 8SIMD 9SIMD 10
Calendar Year
EASR
per
100
,000
pop
ulat
ion
1996
1997
1998
1999
2000
2001
2002
2003
2004
2005
2006
2007
2008
2009
2010
2011
2012
2013
2014
0
20
40
60
80
100
120
140
160
180
Alcohol-related deaths by SIMD decile(1 = most deprived, 10 = least deprived) - Males
SIMD 1SIMD 2SIMD 3SIMD 4SIMD 5SIMD 6SIMD 7SIMD 8SIMD 9SIMD 10
Calendar Year
EASR
per
100
,000
pop
ulat
ion
1996
1997
1998
1999
2000
2001
2002
2003
2004
2005
2006
2007
2008
2009
2010
2011
2012
2013
2014
0
10
20
30
40
50
60
70
Alcohol-related deaths by SIMD decile(1 = most deprived, 10 = least deprived) - Females
SIMD 1SIMD 2SIMD 3SIMD 4SIMD 5SIMD 6SIMD 7SIMD 8SIMD 9SIMD 10
Calendar Year
EASR
per
100
,000
pop
ulat
ion

1. Deaths recorded using the World Health Organization's International Classification of Diseases 9th Revision (ICD9) and 10th Revision (ICD10).2. Deaths where an alcohol-related condition is coded as the underlying (main) cause of death.3. Data are based on the calendar year of registration of death.4. The European Age-Standardised Rate (EASR) per 100,000 population is calculated using the 2013 European Standard Population.5. Scottish Index of Multiple Deprivation (SIMD) by deciles, 2009. This is a categorisation which divides the Scottish population into ten equal categories based on the range of SIMD scores so that 10% of the population falls into each quintile (population weighted). Quintile 1 is the most deprived, quintile 10 the least deprived.
Source: ISD Scotland, SMR99 (Sep 2015)
1996
1997
1998
1999
2000
2001
2002
2003
2004
2005
2006
2007
2008
2009
2010
2011
2012
2013
2014
0
10
20
30
40
50
60
70
Alcohol-related deaths by SIMD decile(1 = most deprived, 10 = least deprived) - Females
SIMD 1SIMD 2SIMD 3SIMD 4SIMD 5SIMD 6SIMD 7SIMD 8SIMD 9SIMD 10
Calendar Year
EASR
per
100
,000
pop
ulat
ion

by Scottish Index of Multiple Deprivation (SIMD)5 (calendar years 1996 to 2014) Back to Contents page
1. Deaths recorded using the World Health Organization's International Classification of Diseases 9th Revision (ICD9) and 10th Revision (ICD10).
4. The European Age-Standardised Rate (EASR) per 100,000 population is calculated using the 2013 European Standard Population.5. Scottish Index of Multiple Deprivation (SIMD) by deciles, 2009. This is a categorisation which divides the Scottish population into ten equal categories based on the range of SIMD scores so that 10% of the population falls into each quintile (population weighted). Quintile 1 is the most deprived, quintile 10 the least deprived.

3.5. Trends in Slope Index of Inequality (SII) for alcohol-related mortality, Scotland 1996 to 2014, (using EASR)
Year 1996 48.411997 48.041998 52.691999 58.182000 62.772001 67.472002 79.332003 76.932004 72.642005 70.572006 76.672007 65.142008 68.262009 53.272010 56.072011 48.522012 44.512013 41.602014 46.68
Back to Contents page
SII for alcohol-related mortality
1996
1997
1998
1999
2000
2001
2002
2003
2004
2005
2006
2007
2008
2009
2010
2011
2012
2013
2014
0
10
20
30
40
50
60
70
80
90SII for alcohol-related mortality
Year

Back to Contents page

3.6. Trends in Relative Index of Inequality (RII) for alcohol-related mortality, Scotland 1996 to 2014, (using EASR)
Year 1996 2.141997 1.981998 2.061999 2.102000 2.192001 2.192002 2.462003 2.322004 2.312005 2.212006 2.402007 2.282008 2.392009 2.082010 2.152011 1.982012 2.102013 1.942014 2.10
Back to Contents page
RII for alcohol-related mortality
1996
1997
1998
1999
2000
2001
2002
2003
2004
2005
2006
2007
2008
2009
2010
2011
2012
2013
2014
0.00
0.50
1.00
1.50
2.00
2.50
3.00RII for alcohol-related mortality
Year

Back to Contents page

MESAS - Alcoholic Liver Disease deaths (numbers): Scotland by age group
Rate per 100,000 population Number of deaths
Scotland1981 0.0 0.0 0.7 4.0 9.3 9.4 4.6 4.0 1981 0 0 5 241982 0.0 0.0 0.9 4.1 6.3 11.3 5.1 4.0 1982 0 0 6 241983 0.0 0.0 1.0 3.6 8.5 10.8 5.4 4.2 1983 0 0 7 221984 0.0 0.0 1.2 4.3 8.7 12.4 5.2 4.5 1984 0 0 8 271985 0.0 0.0 0.6 2.8 10.0 13.4 5.4 4.6 1985 0 0 4 181986 0.0 0.0 0.3 3.8 7.3 12.6 5.1 4.2 1986 0 0 2 251987 0.0 0.0 0.4 3.0 10.0 12.2 5.9 4.5 1987 0 0 3 201988 0.0 0.0 1.4 3.6 8.2 13.6 6.7 4.8 1988 0 0 10 241989 0.0 0.0 0.6 5.1 11.0 17.0 6.3 5.7 1989 0 0 4 351990 0.0 0.0 0.6 5.2 13.1 15.1 6.7 5.8 1990 0 0 5 361991 0.0 0.0 0.8 6.9 12.0 12.2 9.0 6.0 1991 0 0 6 481992 0.0 0.0 0.8 5.4 10.4 15.6 8.1 5.8 1992 0 0 6 371993 0.0 0.0 1.0 6.3 12.9 15.5 9.9 6.7 1993 0 0 8 431994 0.0 0.1 1.0 8.6 12.2 22.3 10.2 7.8 1994 0 1 8 591995 0.0 0.0 1.1 5.8 19.4 23.8 11.1 8.8 1995 0 0 9 401996 0.0 0.2 1.2 10.6 23.4 29.3 11.7 10.9 1996 0 1 9 751997 0.0 0.2 1.8 12.1 25.6 28.1 14.6 11.9 1997 0 1 14 861998 0.0 0.3 2.0 11.6 28.9 31.7 14.6 12.8 1998 0 2 15 851999 0.0 0.0 3.9 12.2 31.4 32.1 18.1 14.1 1999 0 0 29 912000 0.0 0.0 3.9 15.1 35.5 46.0 19.5 17.1 2000 0 0 28 1152001 0.0 0.0 4.1 15.4 38.3 47.7 25.3 18.9 2001 0 0 29 1182002 0.0 0.0 3.8 17.6 44.7 51.2 25.7 20.6 2002 0 0 26 1362003 0.0 0.2 2.7 18.7 40.3 55.2 28.2 21.0 2003 0 1 18 1462004 0.0 0.2 4.2 15.9 37.7 46.0 23.7 18.4 2004 0 1 27 1252005 0.0 0.2 5.0 16.9 43.4 49.1 26.2 20.3 2005 0 1 32 1342006 0.0 0.2 3.7 19.8 42.1 52.9 25.0 20.6 2006 0 1 23 1562007 0.0 0.3 4.8 17.9 39.0 46.2 22.2 18.7 2007 0 2 29 1402008 0.0 0.2 4.1 16.5 38.7 47.4 23.9 18.8 2008 0 1 25 1282009 0.0 0.2 4.3 16.2 33.4 39.2 19.4 16.2 2009 0 1 26 1242010 0.0 0.1 3.3 14.8 31.0 41.2 20.7 16.0 2010 0 1 21 1102011 0.0 0.1 3.7 15.7 24.0 37.8 21.8 15.0 2011 0 1 24 1152012 0.0 0.0 3.8 10.5 21.3 32.8 17.9 12.5 2012 0 0 25 752013 0.0 0.1 3.2 13.4 25.8 32.7 15.9 13.1 2013 0 1 21 942014 0.0 0.0 2.8 11.8 22.6 31.5 17.8 12.6 2014 0 0 19 80
4.1. Alcoholic Liver Disease (ALD) Deaths1,2,3 by age group and gender (calendar years 1981 to 2014) Back to Contents page
MESAS - Alcoholic Liver Disease deaths (EASR4): Scotland by age group
0 -14 years
15-24 years
25-34 years
35-44 years
45-54 years
55-64 years
65 + years
0 -14 years
15-24 years
25-34 years
35-44 years
Calendar Year of Registration of Death
Calendar Year of Registration of Death

MESAS - Alcoholic Liver Disease deaths (numbers): Males by age groupRate per 100,000 population Number of deaths
Males1981 0.0 0.0 0.6 5.0 13.4 12.4 7.5 5.7 1981 0 0 2 151982 0.0 0.0 1.5 6.9 8.5 14.9 8.7 5.9 1982 0 0 5 201983 0.0 0.0 1.1 4.3 11.0 15.9 7.7 5.8 1983 0 0 4 131984 0.0 0.0 1.2 5.1 10.7 15.7 7.1 5.7 1984 0 0 4 161985 0.0 0.0 0.9 4.0 12.9 17.5 7.3 6.1 1985 0 0 3 131986 0.0 0.0 0.6 3.9 9.8 18.4 7.9 5.8 1986 0 0 2 131987 0.0 0.0 0.8 3.9 12.0 18.9 9.6 6.6 1987 0 0 3 131988 0.0 0.0 2.6 3.9 11.9 15.1 10.9 6.6 1988 0 0 9 131989 0.0 0.0 0.9 7.7 13.2 23.9 9.2 7.8 1989 0 0 3 261990 0.0 0.0 0.8 6.7 16.7 21.9 8.9 7.8 1990 0 0 3 231991 0.0 0.0 1.1 8.4 16.2 15.0 13.9 8.2 1991 0 0 4 291992 0.0 0.0 0.5 6.7 11.9 21.2 12.2 7.7 1992 0 0 2 231993 0.0 0.0 1.0 9.1 17.2 16.9 16.7 9.2 1993 0 0 4 311994 0.0 0.3 1.3 9.4 17.8 33.0 15.8 11.2 1994 0 1 5 321995 0.0 0.0 1.3 7.1 23.8 33.3 18.2 12.2 1995 0 0 5 241996 0.0 0.3 1.8 11.9 32.3 41.4 16.4 14.8 1996 0 1 7 421997 0.0 0.0 1.8 16.7 34.3 42.1 22.6 17.0 1997 0 0 7 591998 0.0 0.7 2.9 14.8 42.0 43.9 21.9 18.1 1998 0 2 11 531999 0.0 0.0 5.5 17.1 41.8 42.5 27.1 19.5 1999 0 0 20 632000 0.0 0.0 5.9 20.7 49.4 62.3 30.7 24.3 2000 0 0 21 772001 0.0 0.0 5.6 21.3 51.8 68.8 38.3 27.0 2001 0 0 19 802002 0.0 0.0 6.2 24.5 59.0 74.1 38.6 29.3 2002 0 0 21 932003 0.0 0.3 3.7 25.3 55.9 78.0 43.1 30.0 2003 0 1 12 972004 0.0 0.3 6.7 21.8 49.7 64.5 36.5 26.1 2004 0 1 21 842005 0.0 0.3 6.1 20.7 56.6 68.0 37.9 27.5 2005 0 1 19 802006 0.0 0.0 3.9 27.9 55.7 70.6 39.4 28.7 2006 0 0 12 1082007 0.0 0.3 7.1 24.4 50.5 66.8 35.2 26.6 2007 0 1 21 942008 0.0 0.3 4.0 20.6 52.7 63.8 37.5 26.1 2008 0 1 12 782009 0.0 0.3 5.4 21.0 43.9 52.4 25.6 21.3 2009 0 1 16 792010 0.0 0.0 4.0 20.3 43.9 57.9 31.4 22.9 2010 0 0 13 742011 0.0 0.0 4.4 17.7 30.3 53.3 32.4 20.3 2011 0 0 14 642012 0.0 0.0 4.9 11.9 28.9 46.5 26.0 17.2 2012 0 0 16 412013 0.0 0.0 3.7 17.4 34.7 44.1 24.0 18.0 2013 0 0 12 602014 0.0 0.0 2.6 16.0 28.5 44.9 27.9 17.6 2014 0 0 9 53
MESAS - Alcoholic Liver Disease deaths (EASR4): Males by age group
0 -14 years
15-24 years
25-34 years
35-44 years
45-54 years
55-64 years
65 + years
0 -14 years
15-24 years
25-34 years
35-44 years
Calendar Year of Registration of Death
Calendar Year of Registration of Death

MESAS - Alcoholic Liver Disease deaths (numbers): Females by age groupRate per 100,000 population Number of deaths
Females1981 0.0 0.0 0.8 3.0 5.3 6.4 1.6 2.4 1981 0 0 3 91982 0.0 0.0 0.3 1.2 4.0 7.7 1.5 2.0 1982 0 0 1 41983 0.0 0.0 0.9 2.8 6.0 5.7 3.2 2.7 1983 0 0 3 91984 0.0 0.0 1.2 3.5 6.7 9.2 3.3 3.4 1984 0 0 4 111985 0.0 0.0 0.3 1.5 7.1 9.4 3.5 3.1 1985 0 0 1 51986 0.0 0.0 0.0 3.6 4.8 6.8 2.4 2.5 1986 0 0 0 121987 0.0 0.0 0.0 2.1 7.9 5.5 2.1 2.5 1987 0 0 0 71988 0.0 0.0 0.3 3.3 4.5 12.1 2.5 3.1 1988 0 0 1 111989 0.0 0.0 0.3 2.6 8.9 10.2 3.4 3.6 1989 0 0 1 91990 0.0 0.0 0.5 3.8 9.5 8.4 4.5 3.8 1990 0 0 2 131991 0.0 0.0 0.5 5.4 7.7 9.5 4.2 3.9 1991 0 0 2 191992 0.0 0.0 1.0 4.0 8.8 10.0 4.1 4.0 1992 0 0 4 141993 0.0 0.0 1.0 3.5 8.6 14.2 3.0 4.2 1993 0 0 4 121994 0.0 0.0 0.8 7.7 6.6 11.7 4.6 4.5 1994 0 0 3 271995 0.0 0.0 1.0 4.6 14.9 14.2 4.1 5.4 1995 0 0 4 161996 0.0 0.0 0.5 9.3 14.6 17.1 7.1 6.9 1996 0 0 2 331997 0.0 0.3 1.7 7.5 16.9 14.1 6.7 6.7 1997 0 1 7 271998 0.0 0.0 1.0 8.5 15.8 19.4 7.3 7.4 1998 0 0 4 321999 0.0 0.0 2.3 7.2 21.0 21.6 9.2 8.7 1999 0 0 9 282000 0.0 0.0 1.9 9.6 21.6 29.6 8.4 9.9 2000 0 0 7 382001 0.0 0.0 2.7 9.5 24.8 26.7 12.2 10.8 2001 0 0 10 382002 0.0 0.0 1.4 10.7 30.4 28.3 12.8 12.0 2002 0 0 5 432003 0.0 0.0 1.8 12.0 24.7 32.5 13.3 12.0 2003 0 0 6 492004 0.0 0.0 1.8 10.0 25.7 27.5 10.9 10.8 2004 0 0 6 412005 0.0 0.0 4.0 13.1 30.3 30.2 14.4 13.2 2005 0 0 13 542006 0.0 0.3 3.4 11.6 28.4 35.2 10.5 12.5 2006 0 1 11 482007 0.0 0.3 2.5 11.3 27.5 25.6 9.2 10.8 2007 0 1 8 462008 0.0 0.0 4.2 12.4 24.6 31.0 10.3 11.6 2008 0 0 13 502009 0.0 0.0 3.2 11.4 22.9 25.9 13.2 11.0 2009 0 0 10 452010 0.0 0.3 2.5 9.3 18.2 24.6 9.9 9.2 2010 0 1 8 362011 0.0 0.3 3.0 13.7 17.8 22.3 11.1 9.8 2011 0 1 10 512012 0.0 0.0 2.7 9.1 13.8 19.0 9.8 7.8 2012 0 0 9 342013 0.0 0.3 2.7 9.5 16.9 21.2 7.8 8.2 2013 0 1 9 342014 0.0 0.0 2.9 7.7 16.7 18.0 7.6 7.5 2014 0 0 10 27
1. Deaths recorded using the World Health Organization's International Classification of Diseases 9th Revision (ICD9) and 10th Revision (ICD10).2. Deaths where an alcohol-related condition is coded as the underlying (main) cause of death.3. Data are based on the calendar year of registration of death.4. The European Age-Standardised Rate (EASR) per 100,000 population is calculated using the 2013 European Standard Population.
Source: ISD Scotland, SMR99 (Sep 2015)
MESAS - Alcoholic Liver Disease deaths (EASR4): Females by age group
0 -14 years
15-24 years
25-34 years
35-44 years
45-54 years
55-64 years
65 + years
0 -14 years
15-24 years
25-34 years
35-44 years
Calendar Year of Registration of Death
Calendar Year of Registration of Death

MESAS - Alcoholic Liver Disease deaths (numbers): Scotland by age group
Number of deaths
65 + years Scotland54 51 33 16736 62 35 16349 59 40 17750 70 38 19357 74 40 19341 68 37 17356 65 41 18546 74 51 20563 90 47 23975 80 52 24869 65 66 25462 82 61 24878 83 71 28375 117 77 337
122 125 82 378149 153 91 478168 146 112 527191 167 105 565210 172 136 638241 248 147 779263 259 197 866304 290 201 957273 320 218 976259 275 189 876302 296 211 976297 327 199 1,003280 291 178 920283 302 197 936250 253 166 820237 269 176 814187 251 186 764168 215 163 646204 215 147 682180 209 170 658
Back to Contents page
45-54 years
55-64 years

MESAS - Alcoholic Liver Disease deaths (numbers): Males by age groupNumber of deaths
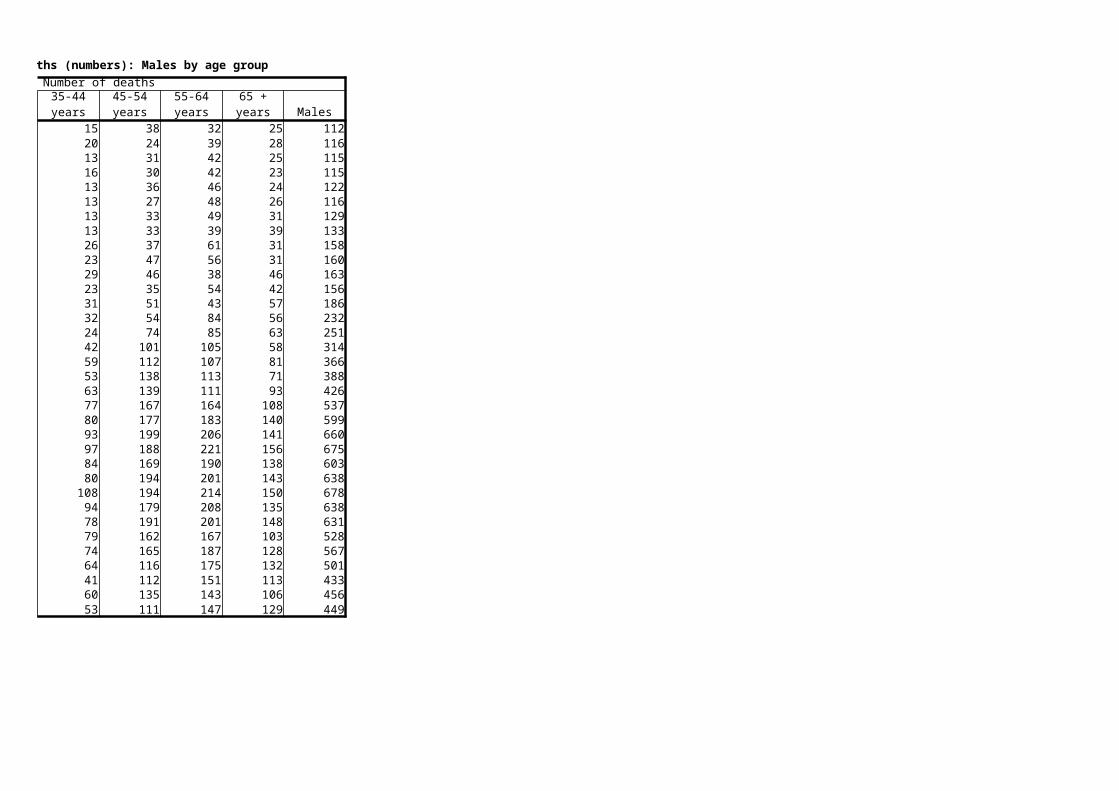
65 + years Males38 32 25 11224 39 28 11631 42 25 11530 42 23 11536 46 24 12227 48 26 11633 49 31 12933 39 39 13337 61 31 15847 56 31 16046 38 46 16335 54 42 15651 43 57 18654 84 56 23274 85 63 251
101 105 58 314112 107 81 366138 113 71 388139 111 93 426167 164 108 537177 183 140 599199 206 141 660188 221 156 675169 190 138 603194 201 143 638194 214 150 678179 208 135 638191 201 148 631162 167 103 528165 187 128 567116 175 132 501112 151 113 433135 143 106 456111 147 129 449
45-54 years
55-64 years

MESAS - Alcoholic Liver Disease deaths (numbers): Females by age groupNumber of deaths
65 + years Females16 19 8 5512 23 7 4718 17 15 6220 28 15 7821 28 16 7114 20 11 5723 16 10 5613 35 12 7226 29 16 8128 24 21 8823 27 20 9127 28 19 9227 40 14 9721 33 21 10548 40 19 12748 48 33 16456 39 31 16153 54 34 17771 61 43 21274 84 39 24286 76 57 267
105 84 60 29785 99 62 30190 85 51 273
108 95 68 338103 113 49 325101 83 43 282
92 101 49 30588 86 63 29272 82 48 24771 76 54 26356 64 50 21369 72 41 22669 62 41 209
45-54 years
55-64 years

4.2. Alcoholic Liver Disease (ALD) Deaths1,2,3 by age group and gender (calendar years 1981 to 2014)
1981
1983
1985
1987
1989
1991
1993
1995
1997
1999
2001
2003
2005
2007
2009
2011
2013
0
10
20
30
40
50
60
Alcoholic Liver Disease deaths, by age group - Scotland
0 -14 years15-24 years25-34 years35-44 years45-54 years55-64 years65 + years
Calendar Year
EASR
per
100
,000
pop
ulat
ion
1981
1983
1985
1987
1989
1991
1993
1995
1997
1999
2001
2003
2005
2007
2009
2011
2013
0
5
10
15
20
25
30
35
Alcoholic Liver Disease deaths, by gender
Males
Females
Scotland
Calendar Year
EASR
per
100
,000
pop
ulat
ion
1981
1983
1985
1987
1989
1991
1993
1995
1997
1999
2001
2003
2005
2007
2009
2011
2013
0
10
20
30
40
50
60
70
80
90
Alcohlic Liver Disease deaths, by age group - Males
0 -14 years15-24 years25-34 years35-44 years45-54 years55-64 years65 + years
Calendar Year
EASR
per
100
,000
pop
ulat
ion
1. Deaths recorded using the World Health Organization's International Classification of Diseases 9th Revision (ICD9) and 10th Revision (ICD10).2. Deaths where an alcohol-related condition is coded as the underlying (main) cause of death.3. Data are based on the calendar year of registration of death.4. The European Age-Standardised Rate (EASR) per 100,000 population is calculated using the 2013 European Standard Population.
Source: ISD Scotland, SMR99 (Sep 2015)
1981
1983
1985
1987
1989
1991
1993
1995
1997
1999
2001
2003
2005
2007
2009
2011
2013
0
10
20
30
40
50
60
70
80
90
Alcohlic Liver Disease deaths, by age group - Males
0 -14 years15-24 years25-34 years35-44 years45-54 years55-64 years65 + years
Calendar Year
EASR
per
100
,000
pop
ulat
ion
1981
1983
1985
1987
1989
1991
1993
1995
1997
1999
2001
2003
2005
2007
2009
2011
2013
0
5
10
15
20
25
30
35
40
Alcoholic Liver Disease deaths, by age group - Females
0 -14 years15-24 years25-34 years35-44 years45-54 years55-64 years65 + years
Calendar Year
EASR
per
100
,000
pop
ulat
ion

by age group and gender (calendar years 1981 to 2014) Back to Contents page

1. Deaths recorded using the World Health Organization's International Classification of Diseases 9th Revision (ICD9) and 10th Revision (ICD10).
4. The European Age-Standardised Rate (EASR) per 100,000 population is calculated using the 2013 European Standard Population.
Scotland England & WalesMales Females Males Females
1991 19.0 10.51992 18.6 9.01993 20.6 9.41994 23.3 11.0 11.1 5.81995 25.7 12.7 12.4 6.41996 31.2 14.0 12.8 6.61997 34.2 14.2 14.1 7.31998 35.6 15.5 15.2 7.41999 39.0 16.5 15.5 7.82000 41.3 16.1 15.5 8.02001 44.0 17.6 17.0 8.32002 45.9 18.7 17.1 8.42003 47.7 18.7 18.4 8.72004 45.5 17.3 18.2 9.02005 44.6 19.2 18.6 8.82006 44.2 19.6 19.1 9.42007 40.2 16.9 18.9 9.52008 40.3 16.7 19.8 9.62009 34.6 16.7 18.8 9.22010 37.1 15.2 19.0 9.12011 33.1 16.0 19.0 9.12012 29.9 12.5 17.9 9.02013 29.8 13.1 18.0 8.82014 31.2 13.3 18.2 9.21. Deaths recorded using the World Health Organization's International Classification of Diseases 9th Revision (ICD9) and 10th Revision (ICD10).2. Deaths where an alcohol-related condition is coded as the underlying (main) cause of death.3. The European Age-Standardised Rate (EASR) per 100,000 population is calculated using the 2013 European Standard Population.
Source: NRS (August 2015, ISD analysis)
5.1. Alcohol-related1 deaths (underlying cause)2, Scotland, EASR3, by gender, calendar years 1991 to 2014 Back to Contents page
Calendar Year
http://www.nrscotland.gov.uk/statistics-and-data/statistics/statistics-by-theme/vital-events/deaths/age-standardised-death-rates-calculated-using-the-esp#Tables
1991
1992
1993
1994
1995
1996
1997
1998
1999
2000
2001
2002
2003
2004
2005
2006
2007
2008
2009
2010
2011
2012
2013
2014
0
10
20
30
40
50
60
Alcohol-related deaths (underlying cause), Scotland and England & Wales, EASR, by gender, 1991 to 2014
Scotland Males
Females
England & Wales Males
Females
Calendar Year
EASR
per
100
,000
pop
ulat
ion