Embed Size (px)
Citation preview
1 | P a g e
XLCubed v9.2
QuickStart
2 | P a g e
Contents
Background ....................................................................................................................................................................... 3
Connecting to your data .................................................................................................................................................... 3
Building a Report ............................................................................................................................................................... 3
Working with Grids ............................................................................................................................................................ 5
Grid Components .......................................................................................................................................................... 5
Basic Navigation ............................................................................................................................................................ 5
Member Selector ........................................................................................................................................................... 7
Excel Range (base selection on an Excel range) ...................................................................................................... 8
XLCubed Slicers (User makes selections using an XLCubed Slicer) ....................................................................... 8
Formatting Grids ............................................................................................................................................................ 9
User Calculations ........................................................................................................................................................ 10
Grid Calculations ...................................................................................................................................................... 10
Workbook Calculations (Custom Groupings / MDX) ............................................................................................... 10
Slicers .............................................................................................................................................................................. 12
Workbook slicers ...................................................................................................................................................... 14
Formula Reporting .......................................................................................................................................................... 15
Formula vs. Grid Based Reporting – Key Differences ................................................................................................ 15
Creating Formula Reports ........................................................................................................................................... 15
Charting & Data Visualization ......................................................................................................................................... 17
Standard Excel Charts ................................................................................................................................................. 17
Small Multiples and Interactive Charts ........................................................................................................................ 17
In-Cell Charts............................................................................................................................................................... 17
Treemaps ..................................................................................................................................................................... 18
XLCubed Grid Charts .................................................................................................................................................. 18
Mapping ....................................................................................................................................................................... 18
Viewports ..................................................................................................................................................................... 19
Dashboard Sheets .......................................................................................................................................................... 21
Web Publication .............................................................................................................................................................. 22
Web Edition – Ad-hoc reports ......................................................................................................................................... 24
Creating a new book ............................................................................................................................................... 24
Report Types ............................................................................................................................................................ 25
XLCubed for Pivot Table users ....................................................................................................................................... 26
3 | P a g e
Background XLCubed helps business users in all aspects of reporting and analytics. It connects Excel to corporate data
which avoids the issues associated with Excel as a data store, while extending the Excel flexibility business
users love. XLCubed also addresses many of the common pain-points users find with Excel pivot tables,
providing a richer and a more productive reporting experience.
A key aspect of XLCubed is that the data itself is not held in Excel but in a central database. XLCubed
connects to a wide range of sources including Microsoft Analysis Services (Tabular, Multidimensional, and
Azure), Power BI, SAP HANA, IBM TM1, Oracle Essbase and icCube. XLCubed can also connect directly to
relational databases.
Reports and dashboards developed in Excel can easily be shared with portal and mobile users through
XLCubed Web Edition. Web published reports remain data-connected, and are fully interactive, secured,
and governed. To evaluate XLCubed Web Edition please contact us at [email protected].
Connecting to your data The evaluation version is fully functional and includes a 30-day evaluation license which allows you to
connect to your own data.
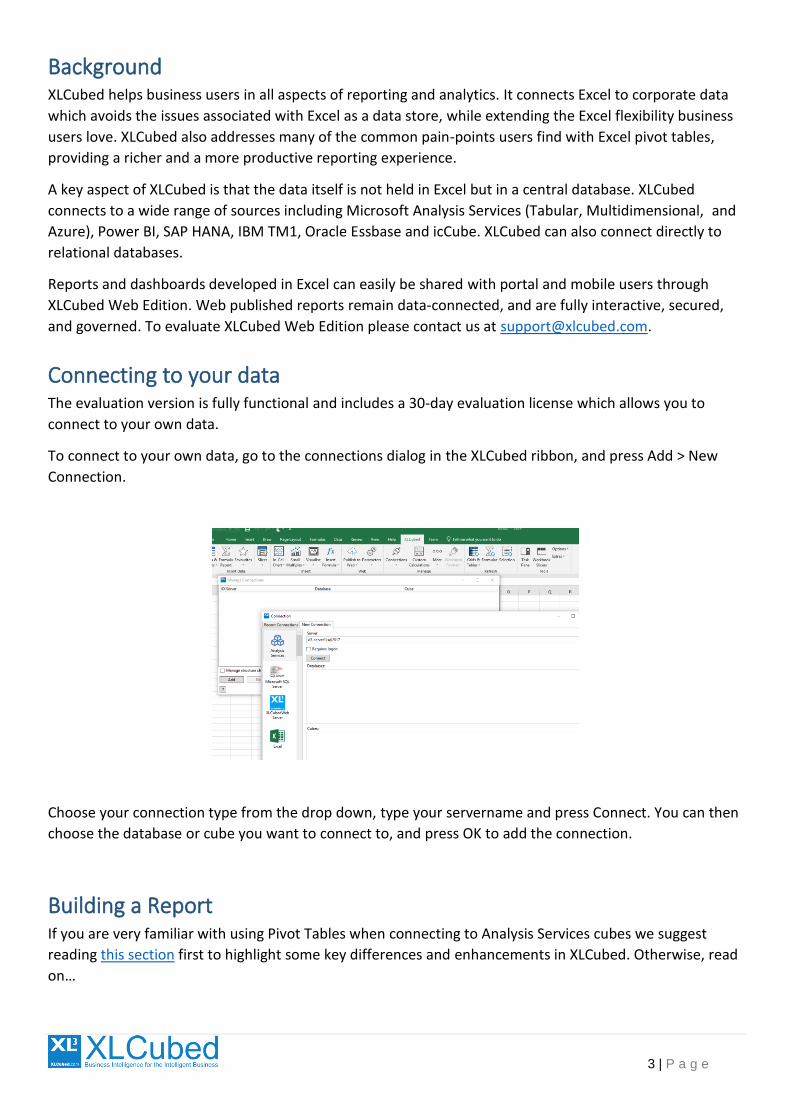
To connect to your own data, go to the connections dialog in the XLCubed ribbon, and press Add > New
Connection.
Choose your connection type from the drop down, type your servername and press Connect. You can then
choose the database or cube you want to connect to, and press OK to add the connection.
Building a Report If you are very familiar with using Pivot Tables when connecting to Analysis Services cubes we suggest
reading this section first to highlight some key differences and enhancements in XLCubed. Otherwise, read
on…
4 | P a g e
XLCubed has two main reporting modes, Grids and Formulae. Grids are similar to a pivot table but
optimised for data-connected BI. Grids are what most XLCubed users primarily use. Formulae are well
suited to highly formatted or financial reporting. The product also provides report slicers and a number of
data visualisations and charts which work well in business-focused dashboards and scorecards.
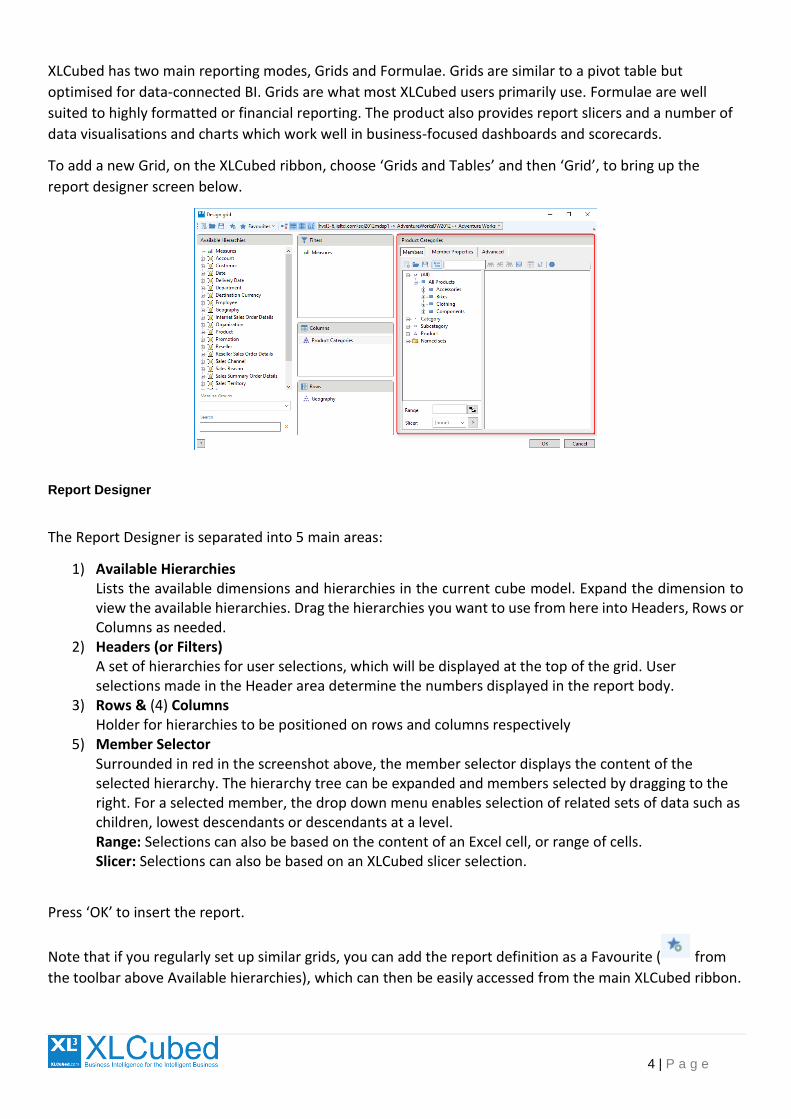
To add a new Grid, on the XLCubed ribbon, choose ‘Grids and Tables’ and then ‘Grid’, to bring up the
report designer screen below.
Report Designer
The Report Designer is separated into 5 main areas:
1) Available Hierarchies Lists the available dimensions and hierarchies in the current cube model. Expand the dimension to view the available hierarchies. Drag the hierarchies you want to use from here into Headers, Rows or Columns as needed.
2) Headers (or Filters) A set of hierarchies for user selections, which will be displayed at the top of the grid. User selections made in the Header area determine the numbers displayed in the report body.
3) Rows & (4) Columns Holder for hierarchies to be positioned on rows and columns respectively
5) Member Selector Surrounded in red in the screenshot above, the member selector displays the content of the selected hierarchy. The hierarchy tree can be expanded and members selected by dragging to the right. For a selected member, the drop down menu enables selection of related sets of data such as children, lowest descendants or descendants at a level. Range: Selections can also be based on the content of an Excel cell, or range of cells. Slicer: Selections can also be based on an XLCubed slicer selection.
Press ‘OK’ to insert the report.
Note that if you regularly set up similar grids, you can add the report definition as a Favourite ( from
the toolbar above Available hierarchies), which can then be easily accessed from the main XLCubed ribbon.
5 | P a g e
Working with Grids Multiple grids can exist in the workbook, and in individual worksheets. Each grid is an XLCubed object, and
is manipulated through the grid designer, the task pane, the Grid Ribbon or the XLCubed right click menu.
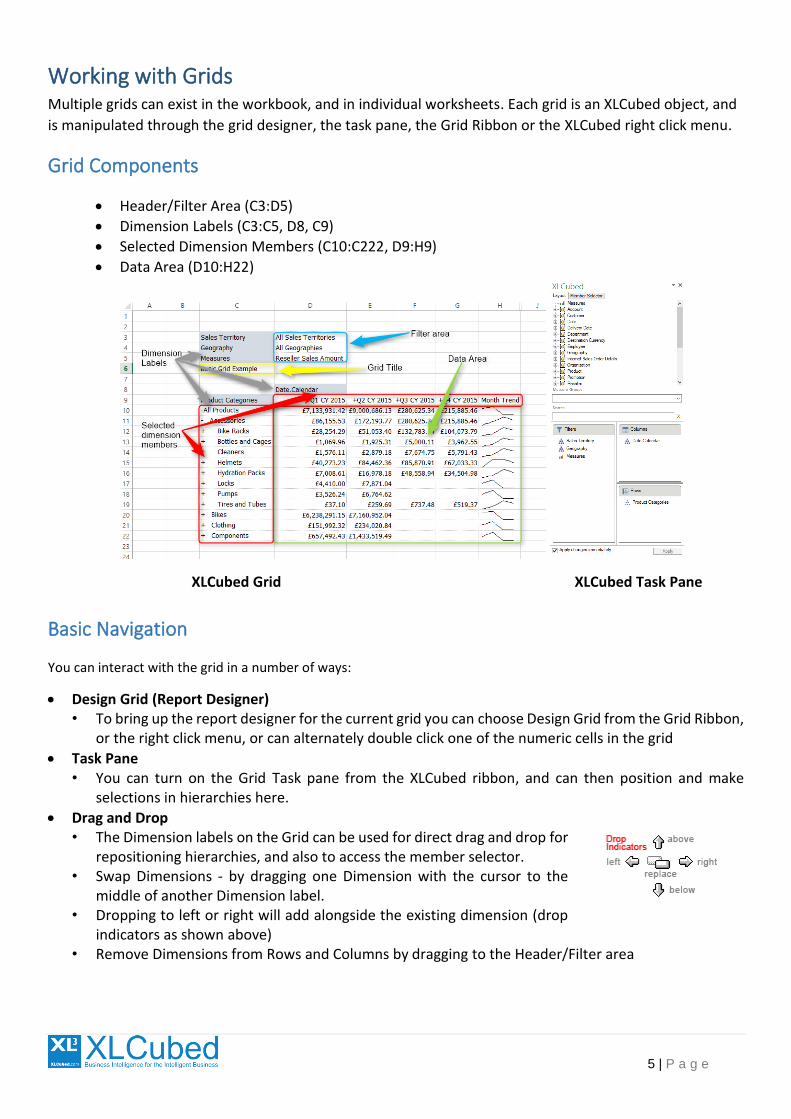
Grid Components
• Header/Filter Area (C3:D5)
• Dimension Labels (C3:C5, D8, C9)
• Selected Dimension Members (C10:C222, D9:H9)
• Data Area (D10:H22)
XLCubed Grid XLCubed Task Pane
Basic Navigation
You can interact with the grid in a number of ways:
• Design Grid (Report Designer) • To bring up the report designer for the current grid you can choose Design Grid from the Grid Ribbon,
or the right click menu, or can alternately double click one of the numeric cells in the grid
• Task Pane • You can turn on the Grid Task pane from the XLCubed ribbon, and can then position and make
selections in hierarchies here.
• Drag and Drop • The Dimension labels on the Grid can be used for direct drag and drop for
repositioning hierarchies, and also to access the member selector. • Swap Dimensions - by dragging one Dimension with the cursor to the
middle of another Dimension label. • Dropping to left or right will add alongside the existing dimension (drop
indicators as shown above) • Remove Dimensions from Rows and Columns by dragging to the Header/Filter area

6 | P a g e
• Changing Selections directly on the grid – For filters, double click on the Filter Selection or dimension label for the required hierarchy (C3:D5). For rows or columns, double click on the dimension label (C9/ D8). This brings up the member selector for the selected hierarchy.
• Drilling applies to Members located on either Rows or Columns. • Drill up/down by double clicking on a Member. • “Drill all” currently selected members by right clicking on a Member and selecting the ‘Drill All’ option
from the XLCubed menu.
• Quick Selection • Keep just the selected Member(s) by right-clicking on them • Keep This Member; Remove the selected Member(s); Keep all other Members
7 | P a g e
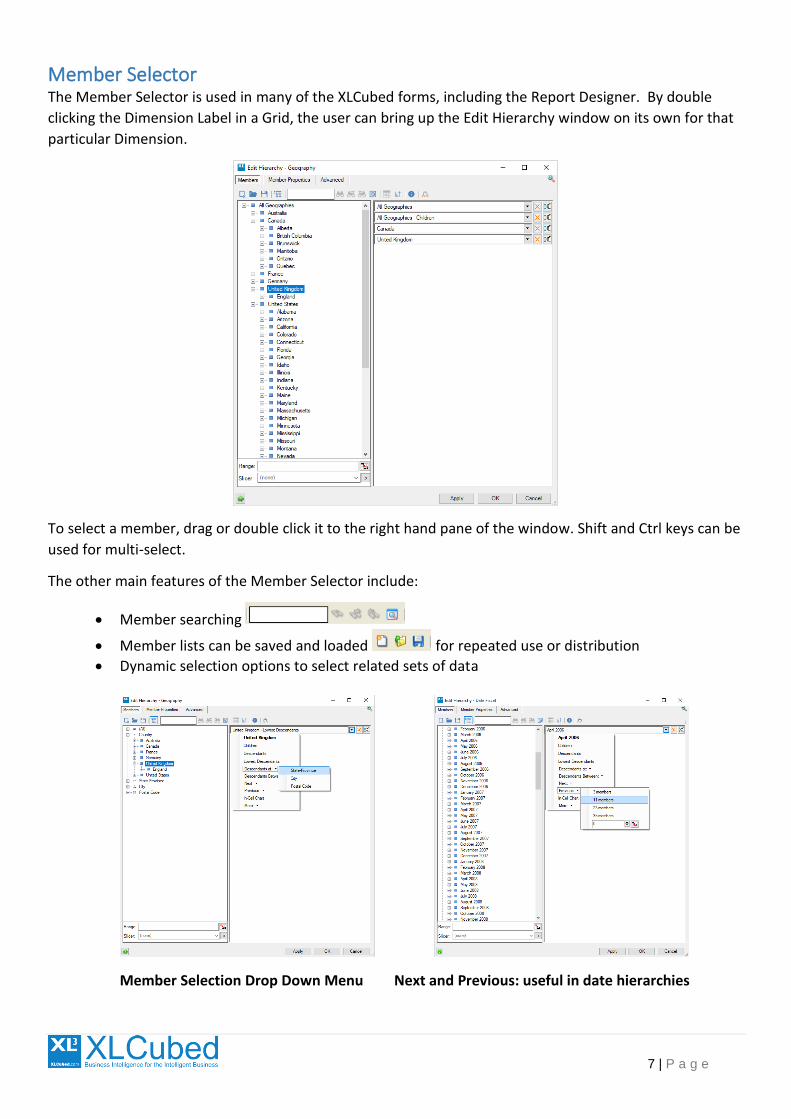
Member Selector The Member Selector is used in many of the XLCubed forms, including the Report Designer. By double
clicking the Dimension Label in a Grid, the user can bring up the Edit Hierarchy window on its own for that
particular Dimension.
To select a member, drag or double click it to the right hand pane of the window. Shift and Ctrl keys can be
used for multi-select.
The other main features of the Member Selector include:
• Member searching
• Member lists can be saved and loaded for repeated use or distribution
• Dynamic selection options to select related sets of data
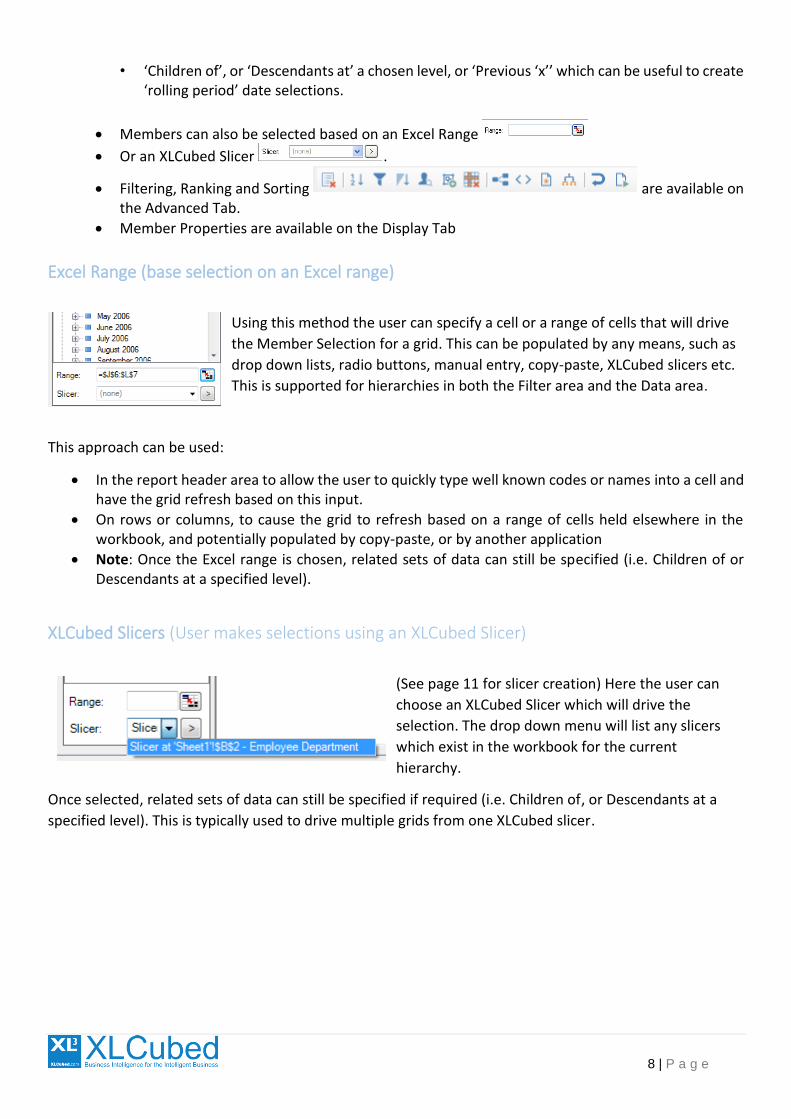
Member Selection Drop Down Menu Next and Previous: useful in date hierarchies
8 | P a g e
• ‘Children of’, or ‘Descendants at’ a chosen level, or ‘Previous ‘x’’ which can be useful to create ‘rolling period’ date selections.
• Members can also be selected based on an Excel Range
• Or an XLCubed Slicer .
• Filtering, Ranking and Sorting are available on the Advanced Tab.
• Member Properties are available on the Display Tab
Excel Range (base selection on an Excel range)
Using this method the user can specify a cell or a range of cells that will drive
the Member Selection for a grid. This can be populated by any means, such as
drop down lists, radio buttons, manual entry, copy-paste, XLCubed slicers etc.
This is supported for hierarchies in both the Filter area and the Data area.
This approach can be used:
• In the report header area to allow the user to quickly type well known codes or names into a cell and have the grid refresh based on this input.
• On rows or columns, to cause the grid to refresh based on a range of cells held elsewhere in the workbook, and potentially populated by copy-paste, or by another application
• Note: Once the Excel range is chosen, related sets of data can still be specified (i.e. Children of or Descendants at a specified level).
XLCubed Slicers (User makes selections using an XLCubed Slicer)
(See page 11 for slicer creation) Here the user can
choose an XLCubed Slicer which will drive the
selection. The drop down menu will list any slicers
which exist in the workbook for the current
hierarchy.
Once selected, related sets of data can still be specified if required (i.e. Children of, or Descendants at a
specified level). This is typically used to drive multiple grids from one XLCubed slicer.
9 | P a g e
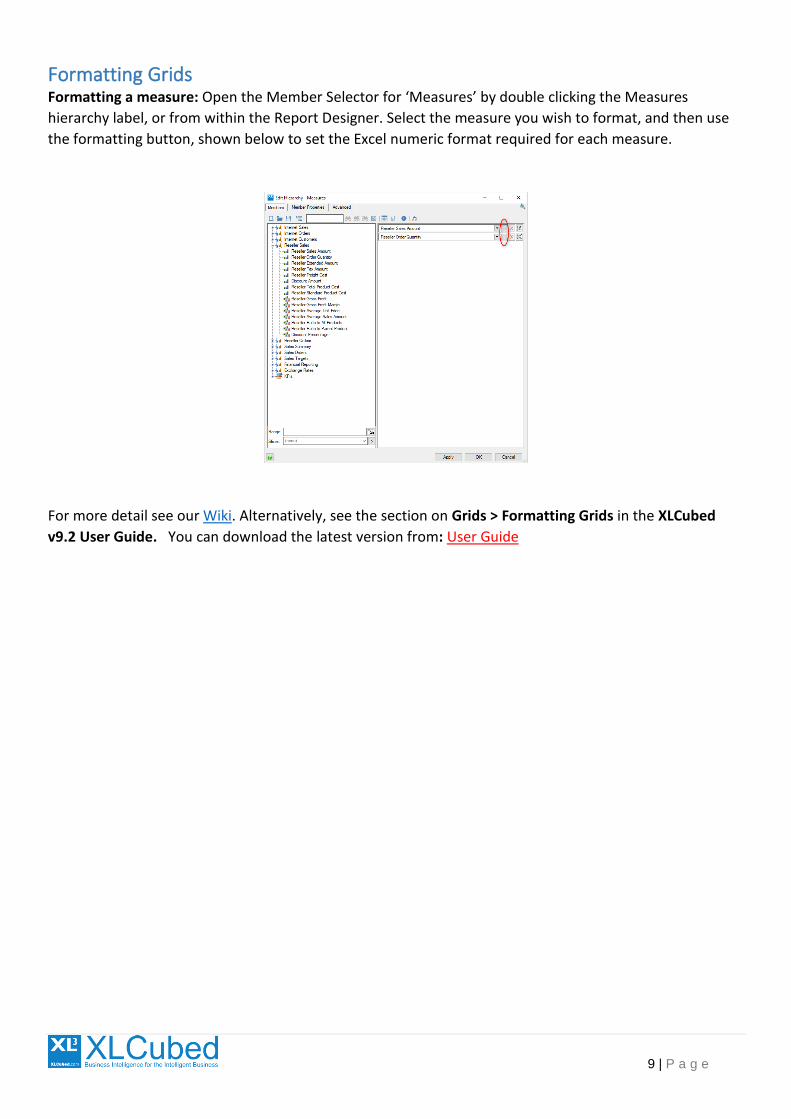
Formatting Grids Formatting a measure: Open the Member Selector for ‘Measures’ by double clicking the Measures
hierarchy label, or from within the Report Designer. Select the measure you wish to format, and then use
the formatting button, shown below to set the Excel numeric format required for each measure.
For more detail see our Wiki. Alternatively, see the section on Grids > Formatting Grids in the XLCubed
v9.2 User Guide. You can download the latest version from: User Guide
10 | P a g e
User Calculations
There are two main types of dynamic user calculations in XLCubed - Grid calculations and Workbook Calculations.
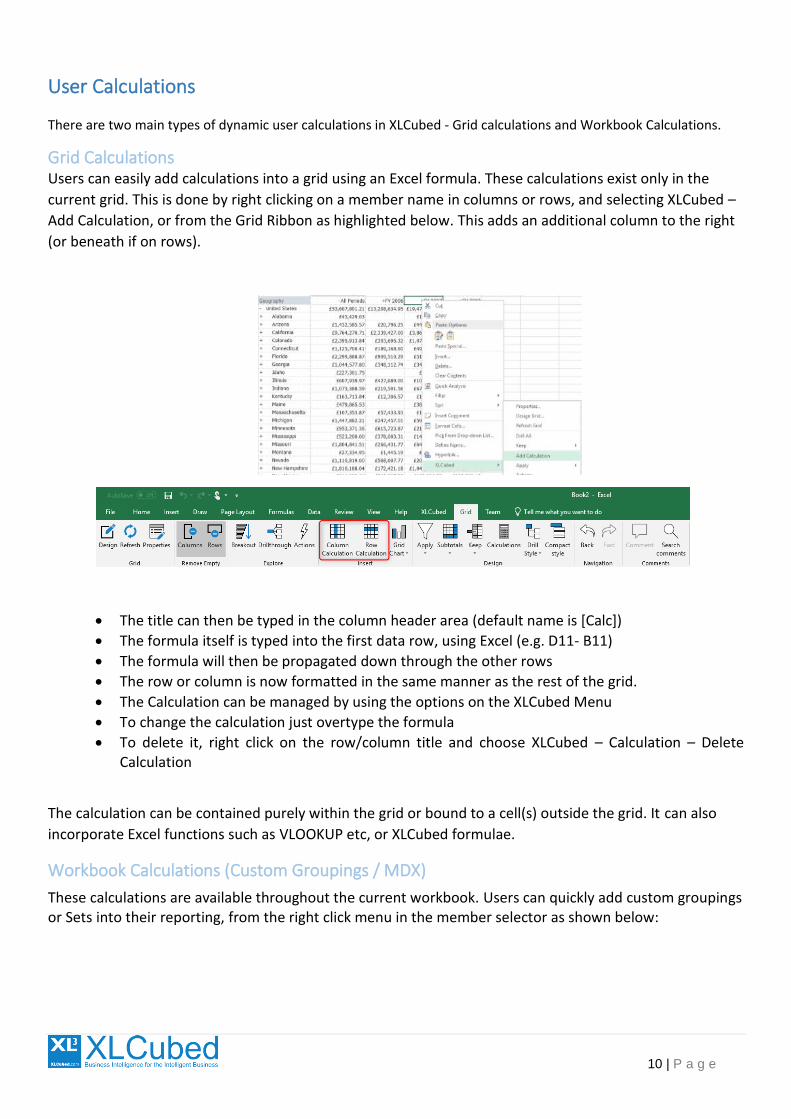
Grid Calculations Users can easily add calculations into a grid using an Excel formula. These calculations exist only in the
current grid. This is done by right clicking on a member name in columns or rows, and selecting XLCubed –
Add Calculation, or from the Grid Ribbon as highlighted below. This adds an additional column to the right
(or beneath if on rows).
• The title can then be typed in the column header area (default name is [Calc])
• The formula itself is typed into the first data row, using Excel (e.g. D11- B11)
• The formula will then be propagated down through the other rows
• The row or column is now formatted in the same manner as the rest of the grid.
• The Calculation can be managed by using the options on the XLCubed Menu
• To change the calculation just overtype the formula
• To delete it, right click on the row/column title and choose XLCubed – Calculation – Delete Calculation
The calculation can be contained purely within the grid or bound to a cell(s) outside the grid. It can also
incorporate Excel functions such as VLOOKUP etc, or XLCubed formulae.
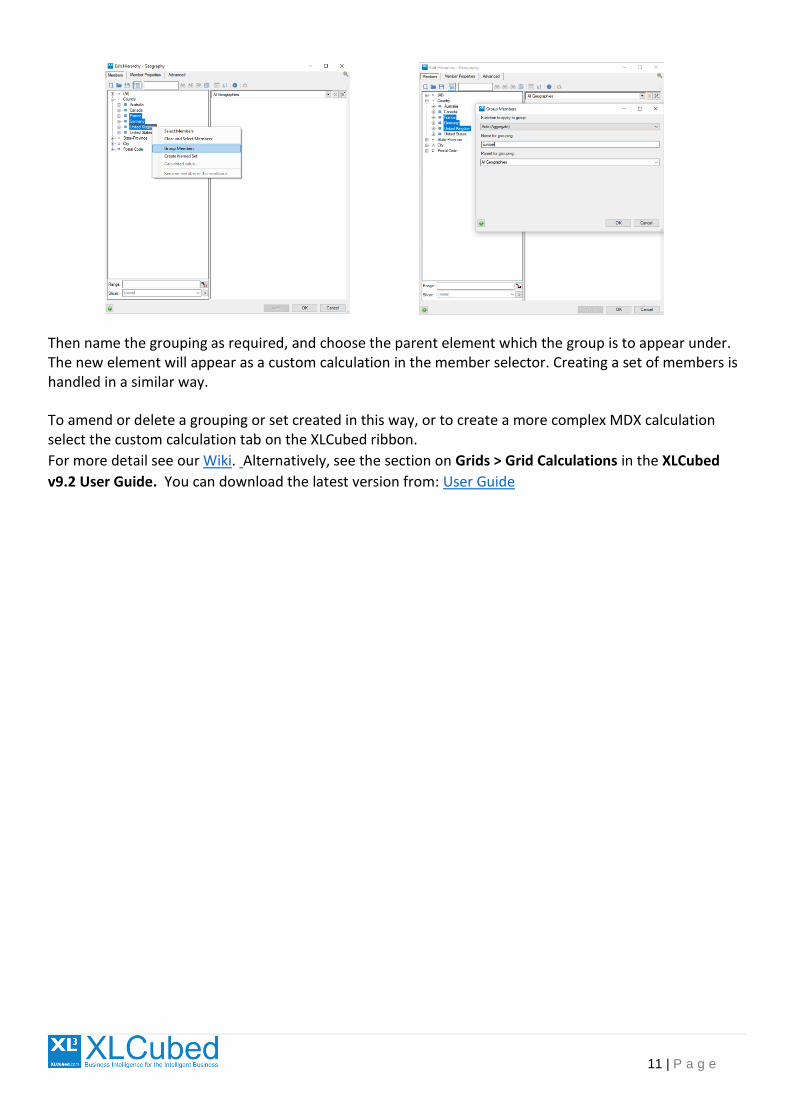
Workbook Calculations (Custom Groupings / MDX)
These calculations are available throughout the current workbook. Users can quickly add custom groupings or Sets into their reporting, from the right click menu in the member selector as shown below:
11 | P a g e
Then name the grouping as required, and choose the parent element which the group is to appear under. The new element will appear as a custom calculation in the member selector. Creating a set of members is handled in a similar way.
To amend or delete a grouping or set created in this way, or to create a more complex MDX calculation select the custom calculation tab on the XLCubed ribbon.
For more detail see our Wiki. Alternatively, see the section on Grids > Grid Calculations in the XLCubed
v9.2 User Guide. You can download the latest version from: User Guide
12 | P a g e
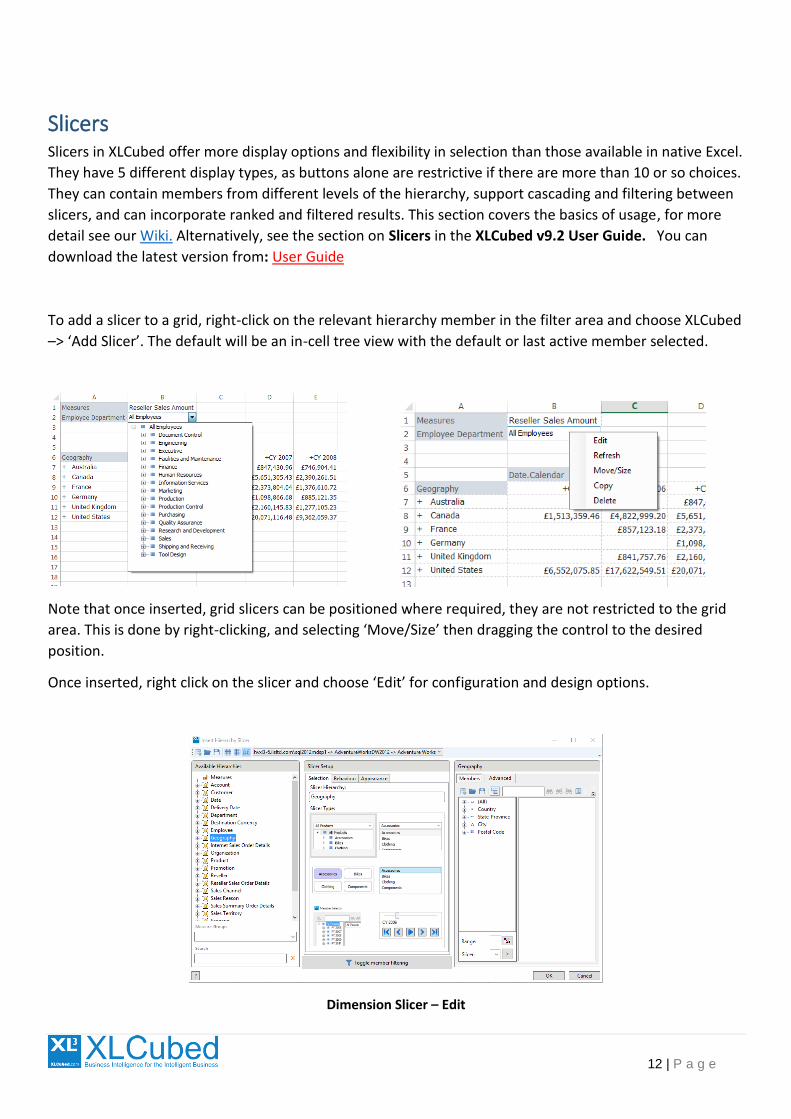
Slicers Slicers in XLCubed offer more display options and flexibility in selection than those available in native Excel.
They have 5 different display types, as buttons alone are restrictive if there are more than 10 or so choices.
They can contain members from different levels of the hierarchy, support cascading and filtering between
slicers, and can incorporate ranked and filtered results. This section covers the basics of usage, for more
detail see our Wiki. Alternatively, see the section on Slicers in the XLCubed v9.2 User Guide. You can
download the latest version from: User Guide
To add a slicer to a grid, right-click on the relevant hierarchy member in the filter area and choose XLCubed
–> ‘Add Slicer’. The default will be an in-cell tree view with the default or last active member selected.
Note that once inserted, grid slicers can be positioned where required, they are not restricted to the grid
area. This is done by right-clicking, and selecting ‘Move/Size’ then dragging the control to the desired
position.
Once inserted, right click on the slicer and choose ‘Edit’ for configuration and design options.
Dimension Slicer – Edit
13 | P a g e
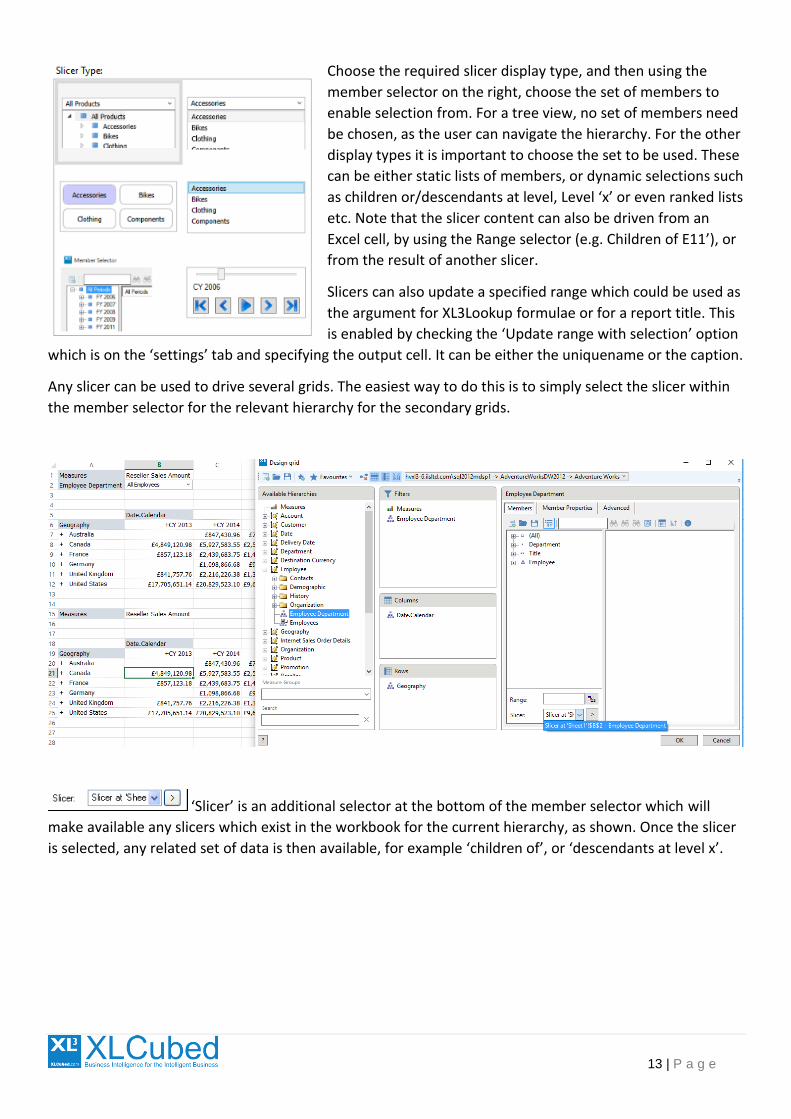
Choose the required slicer display type, and then using the
member selector on the right, choose the set of members to
enable selection from. For a tree view, no set of members need
be chosen, as the user can navigate the hierarchy. For the other
display types it is important to choose the set to be used. These
can be either static lists of members, or dynamic selections such
as children or/descendants at level, Level ‘x’ or even ranked lists
etc. Note that the slicer content can also be driven from an
Excel cell, by using the Range selector (e.g. Children of E11’), or
from the result of another slicer.
Slicers can also update a specified range which could be used as
the argument for XL3Lookup formulae or for a report title. This
is enabled by checking the ‘Update range with selection’ option
which is on the ‘settings’ tab and specifying the output cell. It can be either the uniquename or the caption.
Any slicer can be used to drive several grids. The easiest way to do this is to simply select the slicer within
the member selector for the relevant hierarchy for the secondary grids.
‘Slicer’ is an additional selector at the bottom of the member selector which will
make available any slicers which exist in the workbook for the current hierarchy, as shown. Once the slicer
is selected, any related set of data is then available, for example ‘children of’, or ‘descendants at level x’.
14 | P a g e
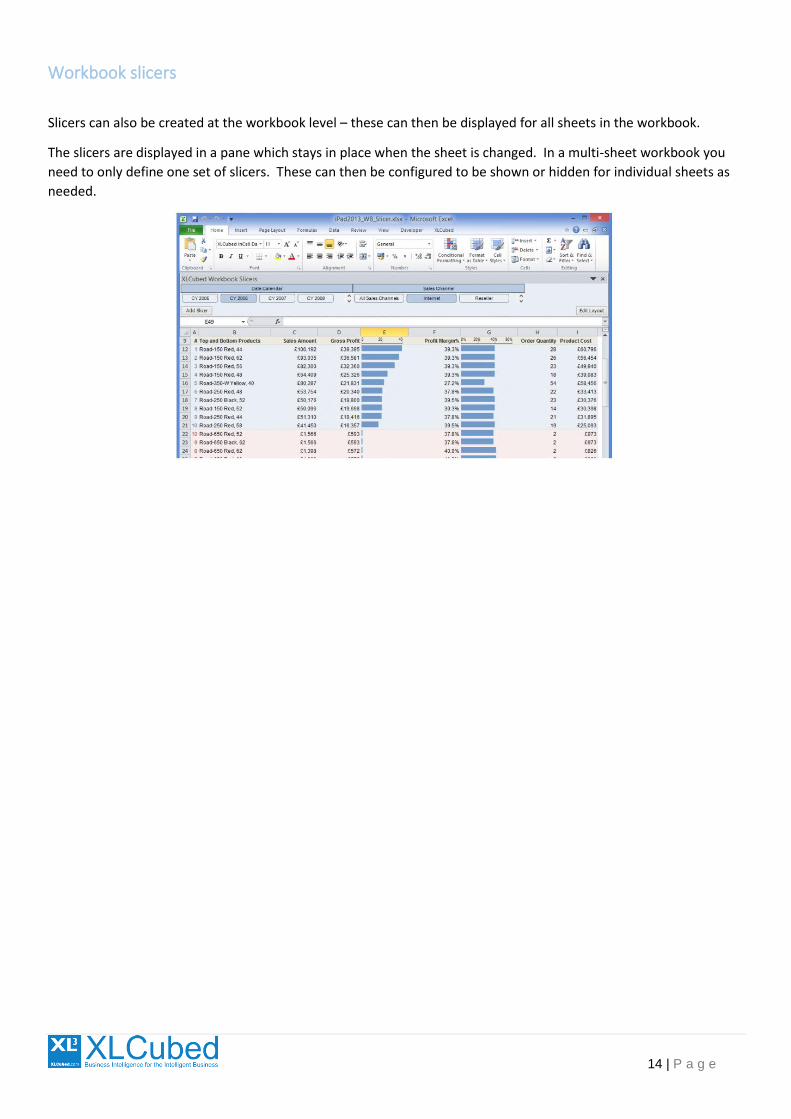
Workbook slicers
Slicers can also be created at the workbook level – these can then be displayed for all sheets in the workbook.
The slicers are displayed in a pane which stays in place when the sheet is changed. In a multi-sheet workbook you
need to only define one set of slicers. These can then be configured to be shown or hidden for individual sheets as
needed.
15 | P a g e
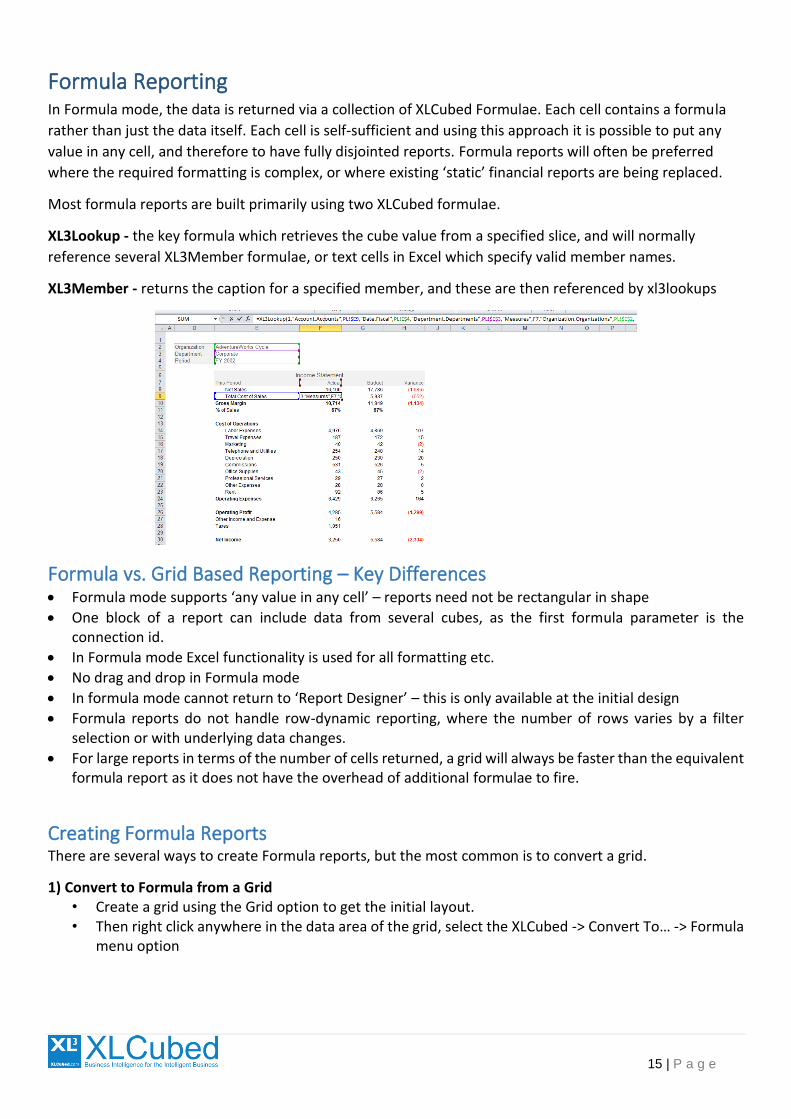
Formula Reporting In Formula mode, the data is returned via a collection of XLCubed Formulae. Each cell contains a formula
rather than just the data itself. Each cell is self-sufficient and using this approach it is possible to put any
value in any cell, and therefore to have fully disjointed reports. Formula reports will often be preferred
where the required formatting is complex, or where existing ‘static’ financial reports are being replaced.
Most formula reports are built primarily using two XLCubed formulae.
XL3Lookup - the key formula which retrieves the cube value from a specified slice, and will normally
reference several XL3Member formulae, or text cells in Excel which specify valid member names.
XL3Member - returns the caption for a specified member, and these are then referenced by xl3lookups
Formula vs. Grid Based Reporting – Key Differences • Formula mode supports ‘any value in any cell’ – reports need not be rectangular in shape
• One block of a report can include data from several cubes, as the first formula parameter is the connection id.
• In Formula mode Excel functionality is used for all formatting etc.
• No drag and drop in Formula mode
• In formula mode cannot return to ‘Report Designer’ – this is only available at the initial design
• Formula reports do not handle row-dynamic reporting, where the number of rows varies by a filter selection or with underlying data changes.
• For large reports in terms of the number of cells returned, a grid will always be faster than the equivalent formula report as it does not have the overhead of additional formulae to fire.
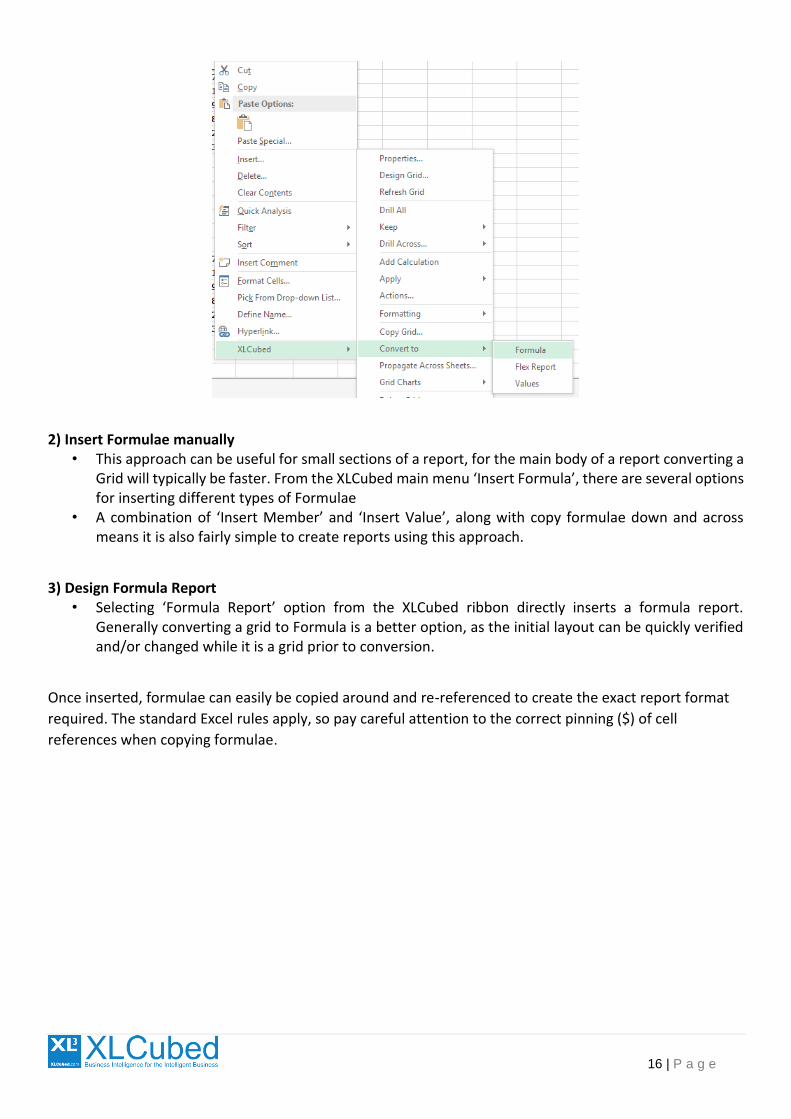
Creating Formula Reports There are several ways to create Formula reports, but the most common is to convert a grid.
1) Convert to Formula from a Grid • Create a grid using the Grid option to get the initial layout. • Then right click anywhere in the data area of the grid, select the XLCubed -> Convert To… -> Formula
menu option
16 | P a g e
2) Insert Formulae manually • This approach can be useful for small sections of a report, for the main body of a report converting a
Grid will typically be faster. From the XLCubed main menu ‘Insert Formula’, there are several options for inserting different types of Formulae
• A combination of ‘Insert Member’ and ‘Insert Value’, along with copy formulae down and across means it is also fairly simple to create reports using this approach.
3) Design Formula Report • Selecting ‘Formula Report’ option from the XLCubed ribbon directly inserts a formula report.
Generally converting a grid to Formula is a better option, as the initial layout can be quickly verified and/or changed while it is a grid prior to conversion.
Once inserted, formulae can easily be copied around and re-referenced to create the exact report format
required. The standard Excel rules apply, so pay careful attention to the correct pinning ($) of cell
references when copying formulae.
17 | P a g e
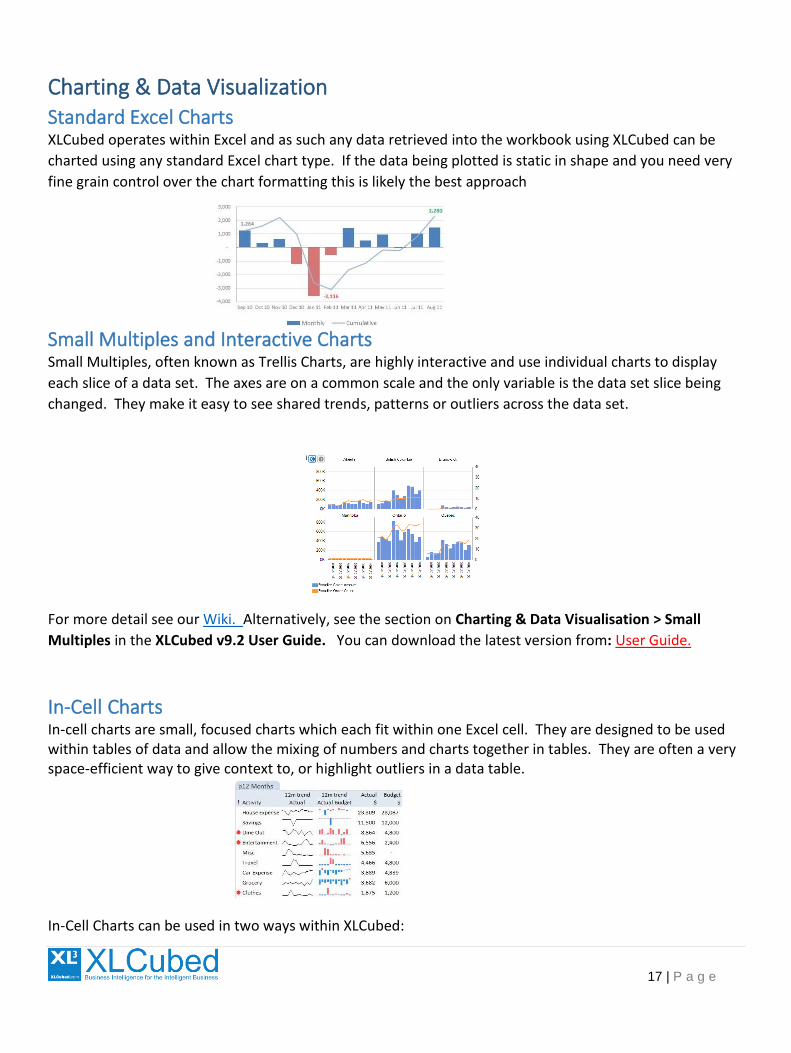
Charting & Data VisualizationStandard Excel Charts XLCubed operates within Excel and as such any data retrieved into the workbook using XLCubed can be
charted using any standard Excel chart type. If the data being plotted is static in shape and you need very
fine grain control over the chart formatting this is likely the best approach
Small Multiples and Interactive Charts Small Multiples, often known as Trellis Charts, are highly interactive and use individual charts to display
each slice of a data set. The axes are on a common scale and the only variable is the data set slice being
changed. They make it easy to see shared trends, patterns or outliers across the data set.
For more detail see our Wiki. Alternatively, see the section on Charting & Data Visualisation > Small
Multiples in the XLCubed v9.2 User Guide. You can download the latest version from: User Guide.
In-Cell Charts In-cell charts are small, focused charts which each fit within one Excel cell. They are designed to be used within tables of data and allow the mixing of numbers and charts together in tables. They are often a very space-efficient way to give context to, or highlight outliers in a data table.
In-Cell Charts can be used in two ways within XLCubed:
18 | P a g e
Formula-based: where an XLCubed formula controls the chart and the data being plotted must first be returned into Excel. Embedded in grids: where the charts are generated directly as part of the gird and support data growth.
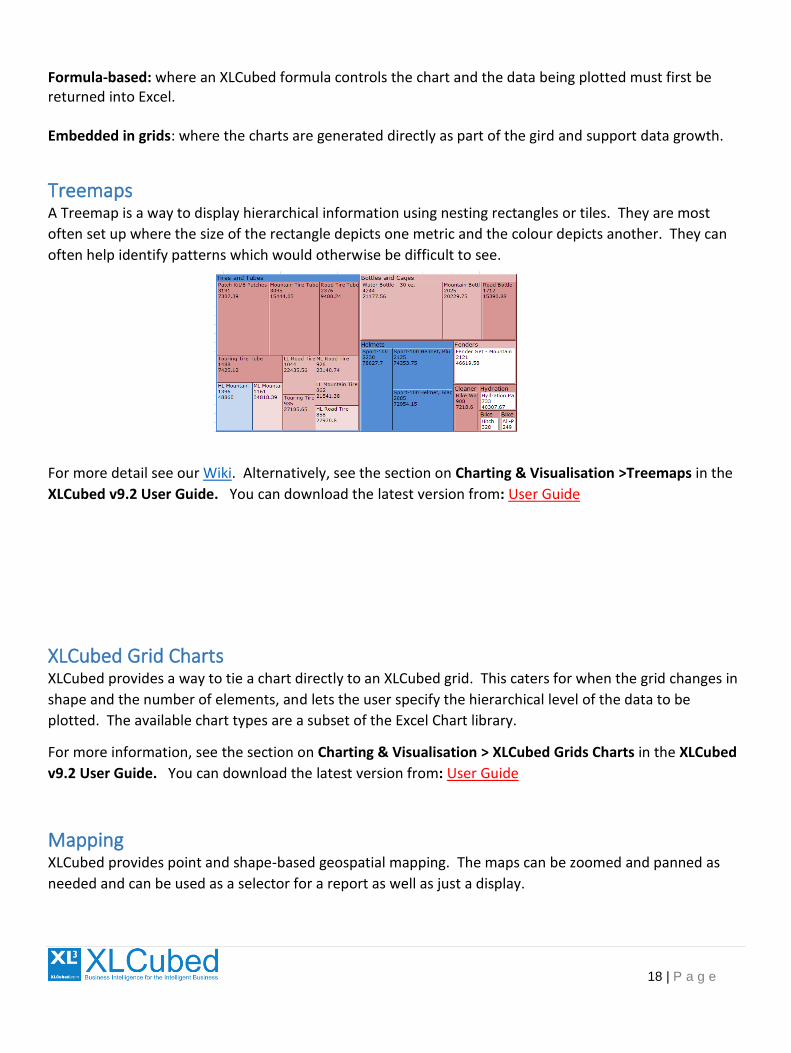
Treemaps A Treemap is a way to display hierarchical information using nesting rectangles or tiles. They are most
often set up where the size of the rectangle depicts one metric and the colour depicts another. They can
often help identify patterns which would otherwise be difficult to see.
For more detail see our Wiki. Alternatively, see the section on Charting & Visualisation >Treemaps in the
XLCubed v9.2 User Guide. You can download the latest version from: User Guide
XLCubed Grid Charts XLCubed provides a way to tie a chart directly to an XLCubed grid. This caters for when the grid changes in
shape and the number of elements, and lets the user specify the hierarchical level of the data to be
plotted. The available chart types are a subset of the Excel Chart library.
For more information, see the section on Charting & Visualisation > XLCubed Grids Charts in the XLCubed
v9.2 User Guide. You can download the latest version from: User Guide
Mapping XLCubed provides point and shape-based geospatial mapping. The maps can be zoomed and panned as
needed and can be used as a selector for a report as well as just a display.
19 | P a g e
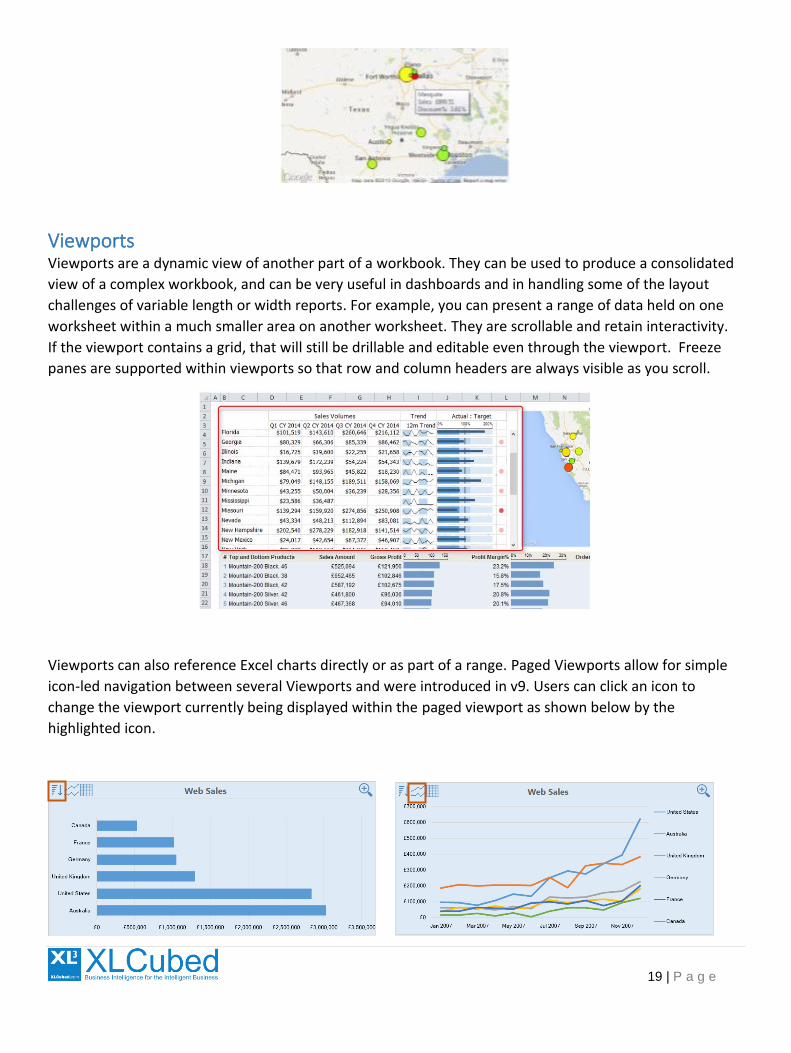
Viewports Viewports are a dynamic view of another part of a workbook. They can be used to produce a consolidated
view of a complex workbook, and can be very useful in dashboards and in handling some of the layout
challenges of variable length or width reports. For example, you can present a range of data held on one
worksheet within a much smaller area on another worksheet. They are scrollable and retain interactivity.
If the viewport contains a grid, that will still be drillable and editable even through the viewport. Freeze
panes are supported within viewports so that row and column headers are always visible as you scroll.
Viewports can also reference Excel charts directly or as part of a range. Paged Viewports allow for simple
icon-led navigation between several Viewports and were introduced in v9. Users can click an icon to
change the viewport currently being displayed within the paged viewport as shown below by the
highlighted icon.

20 | P a g e
Viewports, Paged Viewports and Popup Viewports are inserted from the Visualise ribbon item.
21 | P a g e
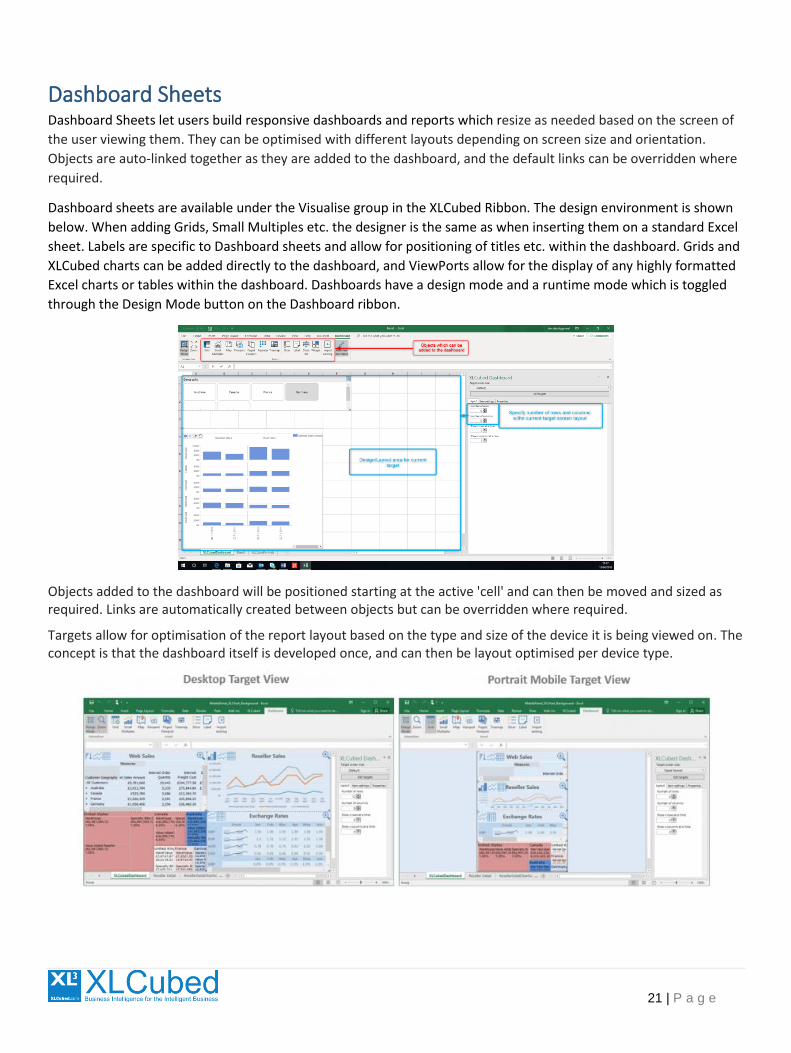
Dashboard Sheets Dashboard Sheets let users build responsive dashboards and reports which resize as needed based on the screen of
the user viewing them. They can be optimised with different layouts depending on screen size and orientation.
Objects are auto-linked together as they are added to the dashboard, and the default links can be overridden where
required.
Dashboard sheets are available under the Visualise group in the XLCubed Ribbon. The design environment is shown
below. When adding Grids, Small Multiples etc. the designer is the same as when inserting them on a standard Excel
sheet. Labels are specific to Dashboard sheets and allow for positioning of titles etc. within the dashboard. Grids and
XLCubed charts can be added directly to the dashboard, and ViewPorts allow for the display of any highly formatted
Excel charts or tables within the dashboard. Dashboards have a design mode and a runtime mode which is toggled
through the Design Mode button on the Dashboard ribbon.
Objects added to the dashboard will be positioned starting at the active 'cell' and can then be moved and sized as required. Links are automatically created between objects but can be overridden where required.
Targets allow for optimisation of the report layout based on the type and size of the device it is being viewed on. The concept is that the dashboard itself is developed once, and can then be layout optimised per device type.
22 | P a g e
Web Publication Any reports, Dashboards or pieces of analysis you develop in the Excel Edition can be shared with other
Excel Edition users by:
• Saving and sharing the Excel file as normal with other users who have the XLCubed Excel add-in.
• By publishing the report to XLCubed Web Edition. Web users can still use the report interactivity but do not need the Excel add-in.
• XLCubed Web can optionally be embedded in other portals including SharePoint.
To publish reports from XLCubed you will need to have the XLCubed Web Edition installed on an
appropriate server. The publication process itself is very straightforward.
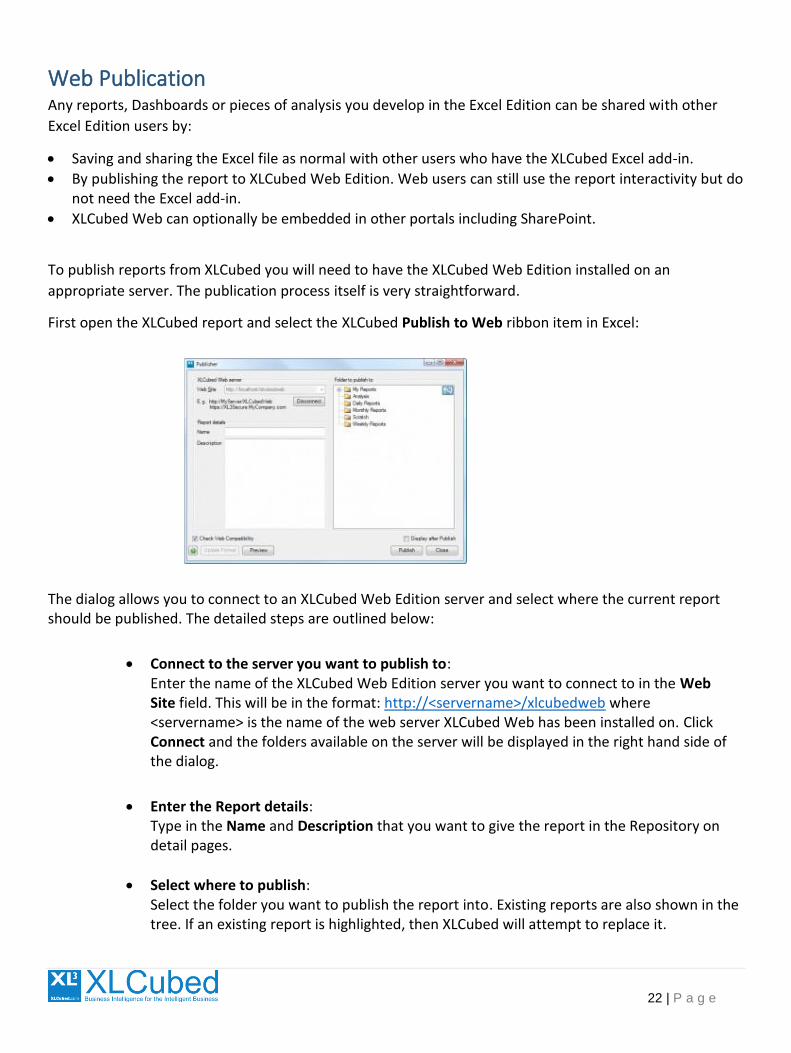
First open the XLCubed report and select the XLCubed Publish to Web ribbon item in Excel:
The dialog allows you to connect to an XLCubed Web Edition server and select where the current report should be published. The detailed steps are outlined below:
• Connect to the server you want to publish to: Enter the name of the XLCubed Web Edition server you want to connect to in the Web Site field. This will be in the format: http://<servername>/xlcubedweb where <servername> is the name of the web server XLCubed Web has been installed on. Click Connect and the folders available on the server will be displayed in the right hand side of the dialog.
• Enter the Report details: Type in the Name and Description that you want to give the report in the Repository on detail pages.
• Select where to publish: Select the folder you want to publish the report into. Existing reports are also shown in the tree. If an existing report is highlighted, then XLCubed will attempt to replace it.
23 | P a g e
• Publish:
Click the Publish button to publish the report to the server. On successful completion a publication successful message is displayed. Alternately click the Preview button to allow you to view the report in a browser without permanently publishing it to the server.
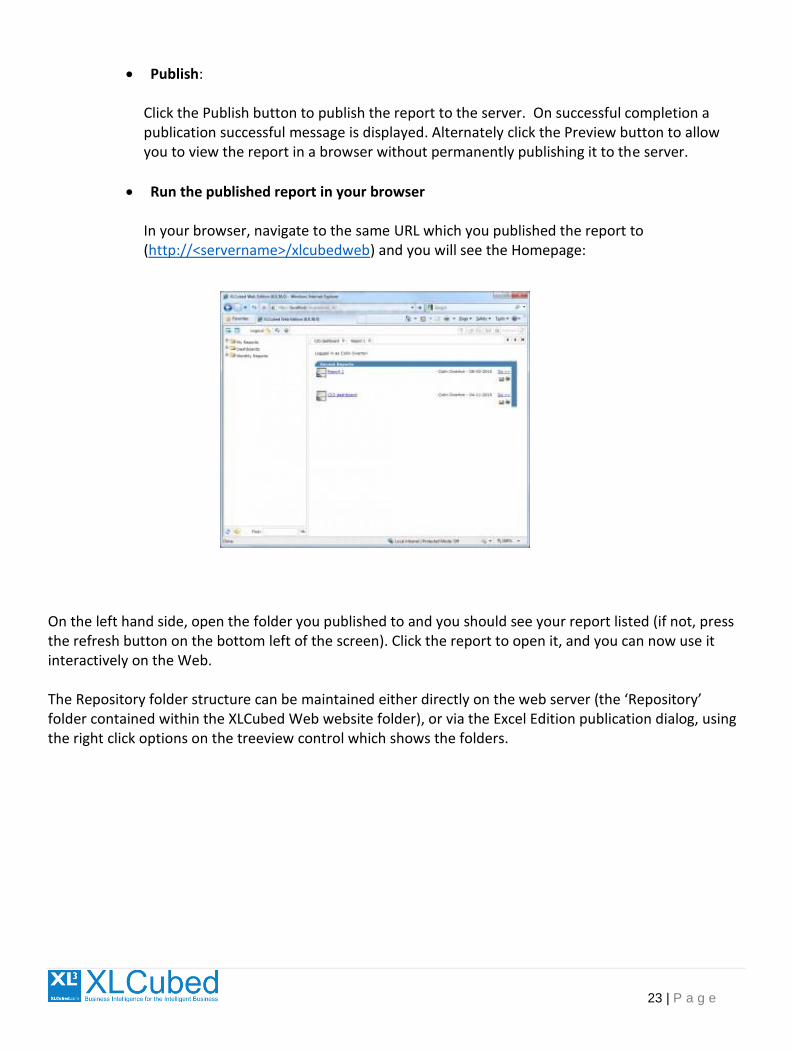
• Run the published report in your browser
In your browser, navigate to the same URL which you published the report to (http://<servername>/xlcubedweb) and you will see the Homepage:
On the left hand side, open the folder you published to and you should see your report listed (if not, press the refresh button on the bottom left of the screen). Click the report to open it, and you can now use it interactively on the Web.
The Repository folder structure can be maintained either directly on the web server (the ‘Repository’ folder contained within the XLCubed Web website folder), or via the Excel Edition publication dialog, using the right click options on the treeview control which shows the folders.
24 | P a g e
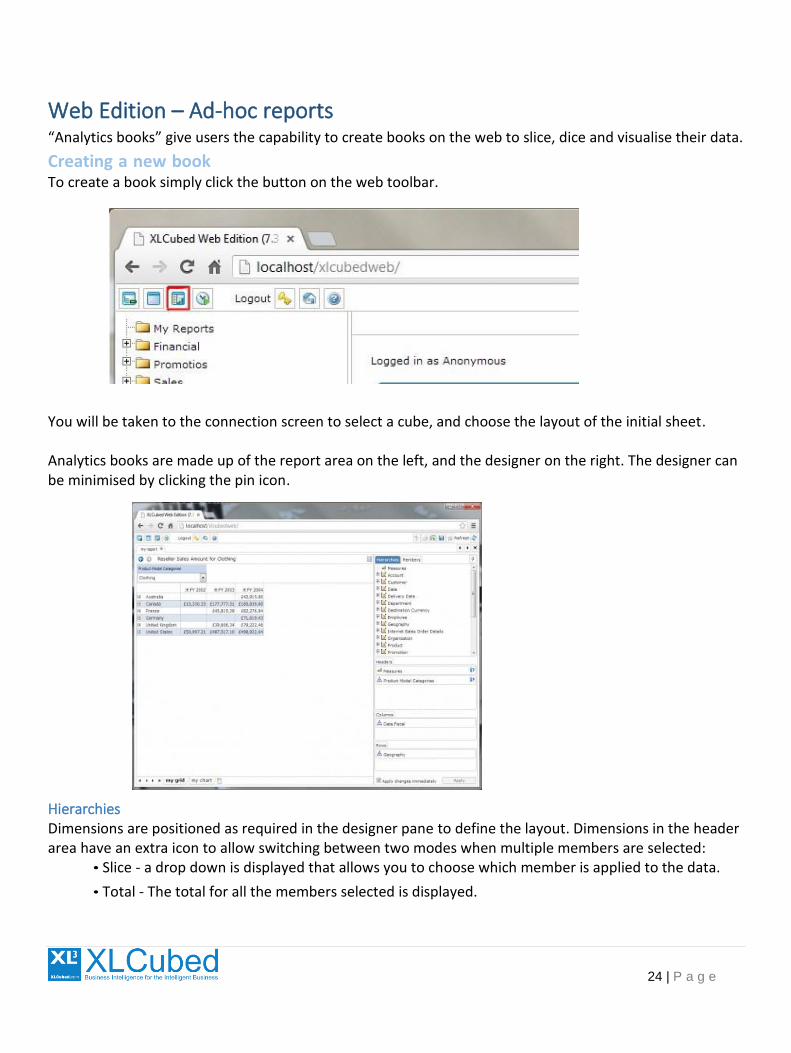
Web Edition – Ad-hoc reports “Analytics books” give users the capability to create books on the web to slice, dice and visualise their data.
Creating a new book To create a book simply click the button on the web toolbar.
You will be taken to the connection screen to select a cube, and choose the layout of the initial sheet. Analytics books are made up of the report area on the left, and the designer on the right. The designer can be minimised by clicking the pin icon.
Hierarchies Dimensions are positioned as required in the designer pane to define the layout. Dimensions in the header area have an extra icon to allow switching between two modes when multiple members are selected:
• Slice - a drop down is displayed that allows you to choose which member is applied to the data.
• Total - The total for all the members selected is displayed.
25 | P a g e
Members If you select a dimension in the designer, the header area will automatically switch to display the members view. You can select individual members, or multi-select using the Ctrl and Shift keys.
Report Types
There are several sheet layouts available when you create a new sheet.
Grid This is simply a table of data which you can manipulate. You can drill into the data using the drill indicators, and sort the data by clicking the arrows in columns headers. Context menus on right click provide access to more complex functions such as ranking and filtering the columns.
Grid and Chart This adds a standard chart type (line/column etc) that visualises the grid and stays in-synch with the grid. You can set the chart type, and select data to allow you to highlight outliers.
Grid and TreeMap This adds a TreeMap to visualise and stay in-synch with the grid.
Small Multiple / Small Multiple Scatter This allows the building of Small Multiple or Trellis Charts.
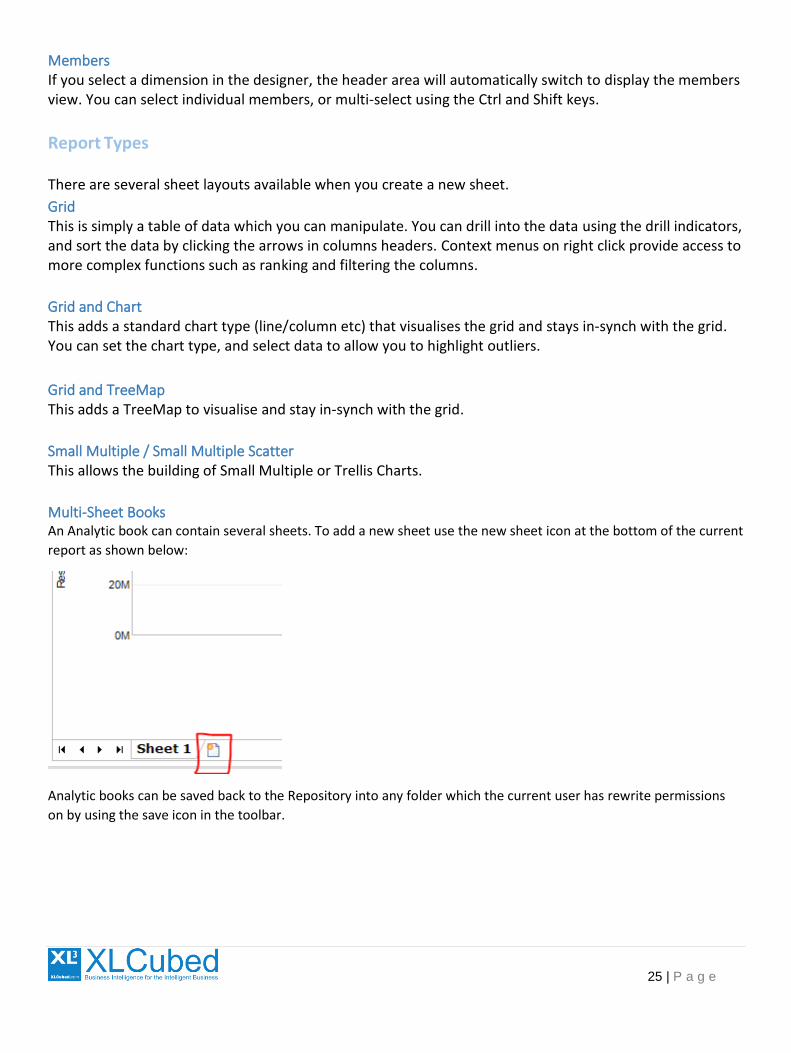
Multi-Sheet Books An Analytic book can contain several sheets. To add a new sheet use the new sheet icon at the bottom of the current
report as shown below:
Analytic books can be saved back to the Repository into any folder which the current user has rewrite permissions
on by using the save icon in the toolbar.
26 | P a g e
XLCubed for Pivot Table users Many users find XLCubed when looking for alternatives to Pivot Tables which can give more flexibility and
functionality. It’s generally a quick transition, but there are a few key differences in how Pivot Tables and
XLCubed interacts with Analysis Services which are detailed below.
Handling of ‘Measures’.
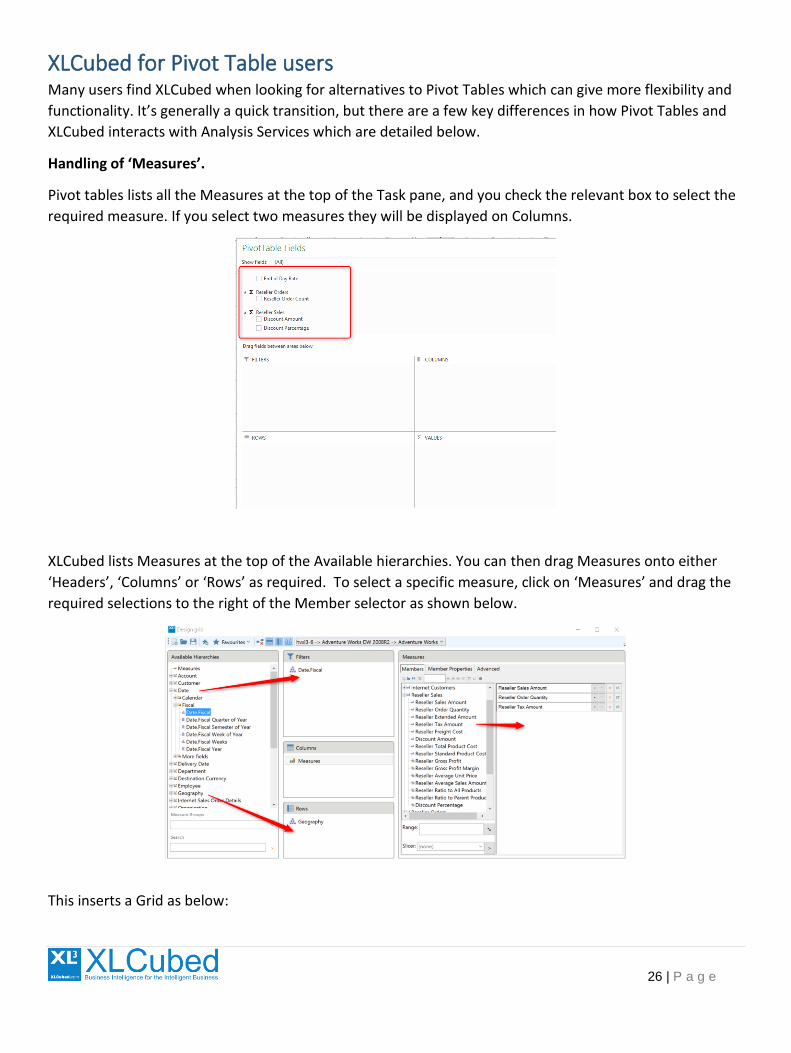
Pivot tables lists all the Measures at the top of the Task pane, and you check the relevant box to select the
required measure. If you select two measures they will be displayed on Columns.
XLCubed lists Measures at the top of the Available hierarchies. You can then drag Measures onto either
‘Headers’, ‘Columns’ or ‘Rows’ as required. To select a specific measure, click on ‘Measures’ and drag the
required selections to the right of the Member selector as shown below.
This inserts a Grid as below:
27 | P a g e
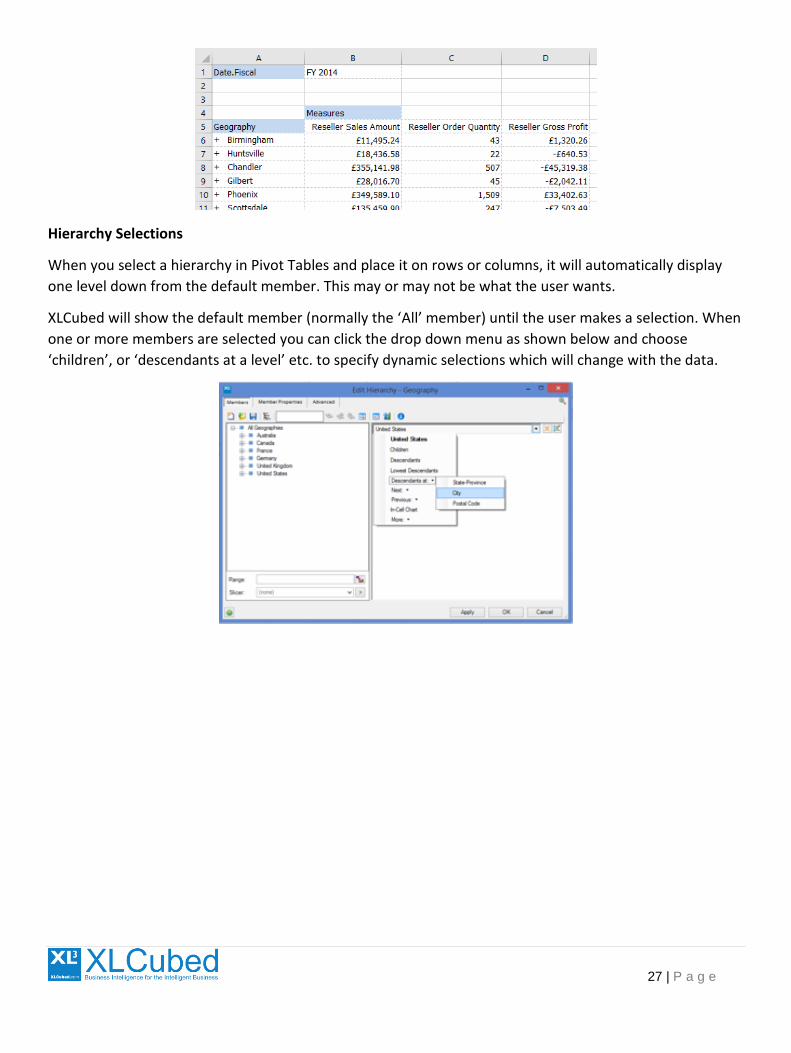
Hierarchy Selections
When you select a hierarchy in Pivot Tables and place it on rows or columns, it will automatically display
one level down from the default member. This may or may not be what the user wants.
XLCubed will show the default member (normally the ‘All’ member) until the user makes a selection. When
one or more members are selected you can click the drop down menu as shown below and choose
‘children’, or ‘descendants at a level’ etc. to specify dynamic selections which will change with the data.