Embed Size (px)
Citation preview

XII. COMMUNICATIONS BIOPHYSICS
Prof. L. D. BraidaProf. S. K. BurnsProf. H. S. ColburntProf. L. S. FrishkopfProf. J. L. GoldsteintProf. J. J. Guinan, Jr.tProf. R. G, Mark$Prof. W. T. PeaketProf. W. M. SiebertProf. T. F. Weissf 'Dr. I. M. Asherlf
K. C. BayerJ. E. BerlinerT. R. BourkC. H. ConradR. H. DomnitzG. S. FerlaS. A. FriedelD. E. GorelickZ. Hasan
Academic and Research Staff
Dr. J. S. BarlowjjN. I. DurlachDr. R. D. HallDr. A. J. M. HoutsmaDr. N. Y. S. KiangTDr. L. U. E. KbhlloffellDr. H. J. LiffDr. E. C. MoxonytDr. M. J. MulroytDr. W. R. Webster,**'Dr. D. M. YaminsTft
Graduate Students
B. L. HicksA. Y. HouD. H. JohnsonC. H. KaraianJ. I. KleinbaumR. P. LippmannL. C. MakowskiS. L. MoshierJ. Myers
D. W. AltmanntR. M. BrowntD. J. CallahanA. H. CristlB. GaimanP. W. Herman, Jr.W. F. KelleyElizabeth M. MarrJ. M. Onorato, Jr.L. H. SeifelJ. B. Walters, Jr.
S. NaganoV. NedzelnitskyC. M. OmanXV. M. RabinowitzJ. B. RobertsP. L. SmithS. L. SulmanR. G. Turner, Jr.T. R. Willemain
A. CONTOUROGRAPHIC DISPLAY IN INCORPORATING HIDDEN LINES
A contourographic display 1 , 2 is, essentially, a raster-type display in which the
beam is both intensified and deflected vertically in proportion to the instantaneous ampli-
tude of one variable. Raster-based displays have been used to good advantage
in examining noisy data for long-term trends, as well as for the detection of
This work was supported principally by the National Institutes of Health (Grant
5 PO1 GM14940-05), and by the National Aeronautics and Space Administration
(Grant NGL 22-009-304), and in part by the National Institutes of Health (Grant5 TO1 GM01555-05), Boston City Hospital Purchase Order 10656, and by a grant from
B-D Electrodyne Division, Becton Dickinson and Company.
TAlso at Eaton-Peabody Laboratory, Massachusetts Eye and Ear Infirmary, Cam-
bridge, Massachusetts.t Also Instructor in Medicine, Harvard Medical School, Boston, Massachusetts.
Also Instructor in Preventive Medicine, Harvard Medical School, Boston, Massa-chusetts.
-JAlso Visiting Lecturer in Physics, University of Massachusetts, Boston, Massa-
chusetts.
t tResearch Affiliate in Communication Sciences from the Neurophysiological Lab-
oratory of the Neurology Service of the Massachusetts General Hospital, Boston, Massa-chusetts.
Visiting Scientist from Monash University, Australia.
Visiting Scientist from Albert Einstein College of Medicine.
QPR No. 105 153

(XII. COMMUNICATIONS BIOPHYSICS)
occasional transients.3-5
As well as the usual application of observing variations in the beat-to-beat rhythm
of the electrocardiogram, we have found the contourogram to be particularly useful in
detecting rare, atypically shaped beats.6 We have regularly incorporated a grid in
our displays of electrophysiologic data. The vertical grid is formed by blanking the
oscilloscope beam periodically as it moves uniformly from left to right. The horizontal
grid is formed by periodically adding a constant to the X and Y components of the sig-
nal forming the undeflected raster. In addition to facilitating the temporal location of
an event, this grid strikingly enhances the three-dimensional appearance of the display.
The key to simplicity in implementing this grid is the fact that it is formed by blanking
the oscilloscope. Thus hidden lines are truly hidden. The grid seems particularly use-
ful in examining structures that are rather smooth and lack abrupt transitions.
Oblique presentation also seems to enhance the three-dimensional appearance of the
picture.
Fig. XII- 1. Rescan of a single frame from a motion picture of a fluoroscopicimage of the left ventricle of the human heart. This frame wasscanned while the ventricle was relatively uniformly filled withthe radio-opaque substance. The oscilloscope beam is deflectedvertically in proportion to the intensity of the spot. Thus high spotsare brighter and the resultant image looks something like a side-lighted mountain range. The rectilinear grid is an important fea-ture of the display which has been added to enhance the three-dimensional appearance of the presentation.
Application of this same technique to raster displays of data that actually originate
from a three-dimensional source, such as an x-ray image or micrograph, results in
a similarly striking picture. Figure XII-i is an example of the process applied to a
QPR No. 105
_ ___ ___
154

(XII. COMMUNICATIONS BIOPHYSICS)
single frame of a cine-angiogram of a human heart. The actual scanning process is
rather elaborate and employs a high-resolution scanner interfaced to a PDP-9 computer
(Digital Equipment Corporation, Maynard, Massachusetts). The resulting signal,
however, is equivalent to that of a low-speed television camera. Clearly, it is pos-
sible to process television signals in the same manner. We intend to pursue this rather
simple process of image enchancement by developing a television display that includes
a contourographic mode. Provision will also be included for both logarithmic and linear
processing of the video signal. Initial application will be in the area of image-enhancing
fluoroscopy. Scanning micrographs appears to be another useful application of the
technique.
S. K. Burns, I. T. Young
References
1. B. N. Webb, "The Contourogram," Bull. Johns Hopkins Hospital 116, 211-228 (1965).
2. S. K. Burns, A. A. Borbely, and R. D. Hall, "Evoked Potentials: Three-DimensionalDisplay," Science 157, 457-459 (1967).
3. Al. I. Skolnik and D. G. Tucker, " Discussion on Detection of Pulse Signals in VisualDisplays," J. Brit. Inst. Radio Engrs. 17, 705-706 (1957).
4. D. G. Tucker, " Detection of Pulse Signals in Noise Trace-to-Trace Correlation inVisual Displays," J. Brit. Inst. Radio Engrs. 17, 319-329 (1957).
5. S. K. Burns, " Methods for the Description of the Temporal Structure of the HumanElectroencephalogram," Ph. D. Thesis, Department of Electrical Engineering,
. I. T. , May 26, 1967.
6. J. R. Hammerly, "Ectopic Beat Detector," S. B. Thesis, Department of ElectricalEngineering, - I. .T. , MIay 23, 1970.
B. DIGITAL MATCHED FILTER FOR ELECTROCARDIOGRAMS
In the detection or recording of electrocardiogram signals from patients, unwanted
muscle noise or power line interference often obscures the desired signal. A notch
filter will eliminate the 60-Hz noise but a more complicated filter is needed to sup-
press the spurious muscle signals. The use of a filter whose impulse response is
matched to the desired transient will yield the maximum signal-to-noise ratio under
random-noise conditions. One such filter was partially designed by R. A. Collesidis 1
and P. B. Jergens. The design was completed and preliminary evaluation was made
by the author.
The filter is a digital system which has two recirculating memories to implement
convolution (Fig. XII-2). The input signal is sampled at up to 5 kHz (528-Hz sample
rate is used for electrocardiograms), and 256 contiguous 4-bit samples are stored in
a MOS shift register. These samples are multiplied with corresponding samples
QPR No. 105

(XII. COMMUNICATIONS BIOPHYSICS)
INPUTFig. XII-2.
Samples of the input signal are convertedf MEMORY to 4-bit digital representations gated to
UTPUT - either the fi(t) or h(t) memory, depending
LOAD A upon the "load-store" condition. TheSTORE M C memories are clocked by a 125-kHz
L U clock that provides the 8-4s shift period.A -257 125 T Cell 257 of the h(t) memory is bypassedS -256 kHz U TO in the "load h(t)" mode, which allows h(t)
L A to be loaded in a manner similar to f(t).LOAD T Outputs of the memory are multiplied
STORE R and accumulated until 257 operationsL - have been completed. The digital result
h(t) MEMORYC2E5L7L is converted back into analog form. The+257,256 control allows fi(t) to be viewed
repeatedly on an oscilloscope. Normaloperation uses the +257 position.
of a similarly stored impulse response template, and the products are accumulated to
form the output at that time. The entire contents of each memory is completely cir-
culated once in each sample period so that the output appears in "real time." (That is,
in the time between samples, the last 256 samples of the input are convolved with the
256 samples of the stored impulse response.) Precession of the input signal with respect
to the stored h(t) is accomplished by the addition of one extra memory cell and the
accumulation of 257 products during each sample period. 2
The multiplication is implemented with a combinatorial multiplier which gener-
ates a 7-bit signed number. A clocked 8-bit arithmetic unit and 8 bits of counter
overflow, combined with D-type flip-flops as storage, form a 16-bit accumulator. The
sign of the 7-bit product determines whether it is added or subtracted from the pre-
vious accumulator value. Another set of flip-flops is connected as an output memory
and is strobed after all 257 operations have been performed. The template memory was
loaded with a pulse illustrated as follows:
- +A
r 2T
- A -
The input was a low-frequency square wave to simulate a train of steps. Since, for a lin-
ear filter, the impulse response is the derivative of the step response, the impulse
QPR No. 105 156

(XII. COMMUNICATIONS BIOPHYSICS)
response of the filter, as shown in Fig. XII-3, is indeed the one that we programmed.
The average value of the impulse response is zero, resulting in a zero dc response that
is shown on the output as a return to zero after each transient.
Fig. XII-3. Step response with stored test template.
The filter was programmed with an electrocardiogram waveform such as the one
shown in Fig. XII-4. The signals used were from test tapes on which muscle noise was
deliberately generated along with the electrocardiogram signal. As can be seen from
Fig. XII-5, substantial reduction of this kind of noise is possible. The filter also offers
good 60-Hz suppression, as shown in Fig. XII-6.
Fig. XII-4. A noiseless electrocardiogram as recorded in memory. TheQRS complex and the f"t" wave are clearly visible. The signalwas amplified past clipping so that more of the "t" wave wouldappear.
QPR No. 105
--
157

(XII. COMMUNICATIONS BIOPHYSICS)
" I 7 V F l-11111 IE
(a)
(b)
Fig. XII-5. Result of filtering a very noisy electrocardiogram signal throughthe filter programmed with a normal transient as in Fig. XII-4.(a) Input. (b) Output.
Since the impulse response is programmed by a captured transient signal, the filter
is easily programmed, even when the available signal sources are free from noise for
short periods. Because it is easy to program, and has an error rate of approximately
1%0, the filter is a very useful device for the detection of low-frequency transient
(b)
Fig. XII-6. (a) Input. Electrocardiogram signal with 60-Hz power lineinterference.
(b) Output. Power line interference noise is markedly reduced.
QPR No. 105
I ill " 1I 1 V I i
I - -
i
_ _
-- __ -; -r--iF---t-l--~--t
F I I U I V
158

(XII. COMMUNICATIONS BIOPHYSICS)
signals. The filter is also useful as a demonstration device for convolution, Fourier
principles, and digital-filtering techniques.
Future effort on this filter will be to reduce the amount of hardware and increase
the operating efficiency. Since the filter involved the efforts of many people, interfacing
was necessary, which would not be the case in a better-planned system. Redesign
of the system would also include a method of automatically storing the impulse response
for easier programming.
P. I. Smith
References
1. R. A. Collesidis, "A Digital System to Time Compress an Electrocardiogram,"S. B. Thesis, Department of Electrical Engineering, M. I. T. , June 1970.
2. P. B. Jergens, "Programmable Linear Time Domain Filter," S. MA. Thesis, Depart-ment of Electrical Engineering, M. I. T. , December 1970.
3. P. L. Smith, " Digital Correlation Filter: Programmable by an Analog Signal," S.B.Thesis, Department of Electrical Engineering, M. I. T. , December 1971.
C. VECTORCARDIOGRAPHIC DISPLAY AND MEASUREMENT SYSTEM
The fundamental theoretical basis of vectorcardiography is Einthoven' s " dipole the-
ory" which states that the electrical field generated by the heart is equivalent to that
produced by a simple dipole with fixed origin and time-variant magnitude and direction.
Resulting potentials are obtained from the body surface by means of multiple recording
leads that are algebraically combined to produce three signals that are more or less
orthogonal. These signals represent the projection of the equivalent electrical vector
onto the axes of an orthogonal coordinate system. In standard clinical vectorcardi-
ography, pairs of these signals are used as horizontal and vertical deflection of an
oscilloscope beam that thus displays a point representing the projection of the vector on
the frontal, horizontal, and sagittal plane. The QRS complex, representing ventricular
depolarization, occurs in approximately 80 ms. Hence direct writers are unfea-
sible and to get hard copy of a record requires an intermediate photographic
process.
Extending the work of Sheridan,1 we have developed a vectorcardiographic display
and measurement system using our general-purpose programmable Electrophysiologic
Data Processing System. This system is capable of acquiring and displaying vectorcar-
diograms in an extremely flexible manner. It has three-dimensional perspective, and
can make a quantitative examination of vectorcardiographic data.
Operation of the system includes 3 basic processes: signal acquisition, scalar dis-
play, and vector display. Having acquired a signal, the operator can readily switch
QPR No. 105 159

(XII. COMMUNICATIONS BIOPHYSICS)
between scalar and vector display modes; and in the vector mode, he has the option of
selecting a three-dimensional perspective presentation that may be viewed with special
glasses. Normal presentations are on an oscilloscope, but all displays may be pre-
sented on an X-Y plotter for permanent records.
In the signal acquisition process, the X, Y, and Z signals are samples by a stand-
ard clinical vectorcardiograph machine (1000 samples/s). The samples are then
stored in the system's core memory. Front-panel knobs allow establishment of a
threshold on one of the channels. When the signal exceeds this threshold, an adjustable
number of additional samples are stored and these, together with the previously acquired
points, form the 1000-point record that will be displayed. This phase also has pro-
visions for calibration and normalization of the three leads.
The scalar display mode presents the stored data on the oscilloscope and allows the
user to select a portion of the vector complex to analyze and display as a vector loop.
The selected portion is delimited by visible cursors and the time interval between these
cursors may be displayed numerically. The first cursor selects the E-point, usually
the initial point of depolarization, and this point determines the origin of the orthogonal
coordinate system.
In the vector mode, the selected complex is displayed on the oscilloscope in three-
dimensional form with provision for rotating the viewing position by means of front-
panel knobs. The standard clinical views, frontal, horizontal, and sagittal, may be
CURSOR WIDTH 462
MEAN VECTOR: 58, 185
AREA: 25321
POINTER RNGLES: 72, 122M'GNI TUDE: 267 , SAMPLE NO. 254
Fig. XII-7. Nornal horizontal plane vector loop.
QPR No. 105 160
(XII. COMMUNICATIONS BIOPHYSICS)
selected by means of front-panel switches. Available numerical data include the pro-
jected area delimited by a displayed loop, and the mean vector of the loop. A visible
pointer representing the instantaneous vector may be superposed and positioned by the
operator to any displayed point. The angle, magnitude, and latency (relative to the E-
point) of this vector may be displayed.
Other features include adjustable magnification of the vector loop and optional display
of 1-mV calibration marks on the three orthogonal axes. By allowing examination
of a magnified view of only the initial portion of the loop, the system provides more
detailed information on the important initial forces of depolarization than can be obtained
by standard vectorcardiograph techniques.
Recent trends in clinical vectorcardiography 2 ' 3 indicate that the full potential of this
technique for improved diagnosis will depend on quantitative analysis of vectorcar-
diogram data. The VCG Display System provides a unique combination of flexible
quantitative capabilities, as well as the stereo three-dimensional perspective display
of the vector loops. Preliminary clinical trials, conducted with data from selected
patients at Boston City Hospital who had a variety of abnormalities, suggest that the sys-
tem enhances the qualitative differentiation of the vector loop, as well as quantitative
analysis. In these cases several characteristics of potential diagnostic value were studied.
The relative planarity of normal loops compared with abnormal loops could be readily
appreciated and quantitated. In certain cases of myocardial infarction, stereo viewing
CURSOR WIDTH 8e
MEAN VECTOR: 20, 87
AREA: 23223
Fig. XII-8. Rotated three-dimensional vector loop
QPR No. 105 161

(XII. COMMUNICATIONS BIOPHYSICS)
of the loop, with examination from several viewpoints, disclosed alterations that are
not ordinarily found in the standard planes. The three-dimensional capability provides
a more unified representation of the cardiac dipole than is obtained by using 3 orthogonal
planar component views, and may assist in revealing new criteria relevant to
diagnosis.
Examples of the output from the VCG Display System, recorded on an X-Y plotter,
are shown in Figs. XII-7 and XII-8. Figure XII-7 shows a standard horizontal plane
vector loop from a normal person. Data specifying width of the vector complex, the
projected planar area, the mean vector, and the instantaneous vector (254 ms from the
E-point) are presented at the top of the display. Figure XII-8 shows a rotated view of
the same person' s vector. These figures are normally viewed with stereo glasses, but
some observers are able to achieve the three-dimensional effect by crossing their
eyes.
The VCG Display System may be used to analyze vectorcardiogram data recorded
from astronauts and scientists aboard NASA's SkyLab Project. It should aid in the
analysis by allowing changes of the vector in normal subjects to be readily observed
and quantitatively measured.
B. Gaiman, [R. Rifkin, S. K. Burns
lReferences
1. J. N. Sheridan, "Stereo Display of Vectorcardiograms," S. B. Thesis, Departmentof Electrical Engineering, M. I. T. , June 1971.
2. Eliot Young, M. D. , and Conger Williams, M.D., " The Frontal Plane Vectorcardio-gram in Old Inferior Myocardial Infarction," Circulation, Vol. 27, April 1968.
3. E. -Massie and T. J. Walsh, Clinical Vectorcardiography and Electrocardiography(Yearbook Medical Publishing Company, Inc., Chicago, Ill., 1969).
D. CRYOPROTECTIVE ACTION OF DIMETHYL SULPHOXIDE
(DMSO) ON HOMARUS AXONS
1. Introduction
1,2The cryoprotective ability of DMSO in simple cellular systems is well known, 1,2 but
attempts to revive vertebrate nervous tissue frozen below -10°C have been only par-
tially successful.3, 4 The work of Pascoe5 furnishes an exception; he reports complete
recovery of desheathed rat superior cervical ganglia treated with 15% glycerol and kept
at -76°C for 24 hours or less; untreated ganglia could not withstand a 5-min exposure
to temperatures below -15'C. Menz 4 reports, however, that rat cutaneous nerves
treated with 15% glycerol or DSMO show no recovery after 5 min at -10'C.
Pribor and Nara 3 report limited cryoprotection in DMSO-treated frog sciatic nerves
QPR No. 105 162
(XII. COMMUNICATIONS BIOPHYSICS)
kept at -10 C for 5 min after the external Ringer' s solution was completely frozen. The
action potential regains 20-55% of its total value for 5-15% DMSO-treated nerves, but
there is no recovery at all for glycerol-treated nerves or nerves with intact perineural
sheaths.
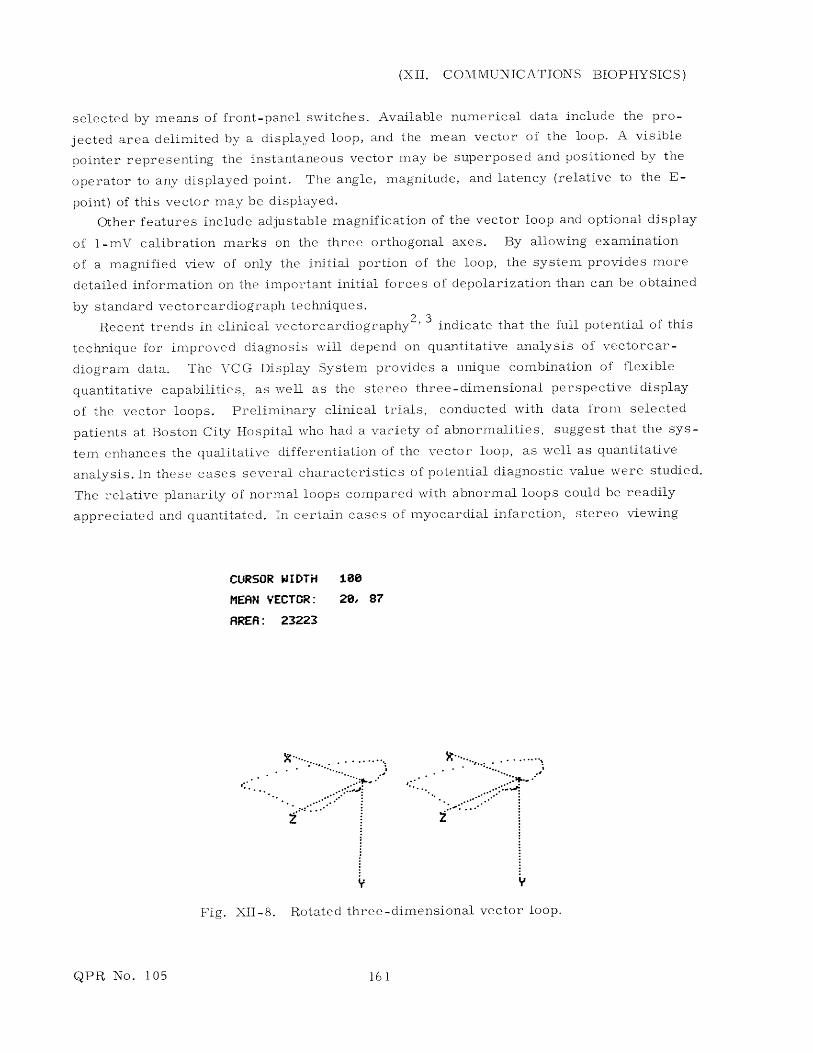
We report here the preservation of the electrical response in DMSO-treated Homarus
nerves frozen for as long as 2 h at temperatures between -20 0 C and -30'C. These
experiments follow a preliminary study of the effects of DMSO on Homarus nerve
response at room temperature, and are part of an investigation of cryoprotection in
invertebrate nervous tissue.
2. Methods
The electrical response of each Homarus ventral nerve is recorded before and after
a 30-min treatment with a solution of 5-10% DMSO in artificial seawater. The dissec-
tion and recording procedures are similar to those reported previously. 6
The fiber is placed on a glass slide, covered with a small amount of DMSO solution
and placed on a copper block in the freezer compartment of a standard refrigerator. A
thermometer is kept in contact with the block to monitor the temperature (-20'C to
-30 C). After an hour in the freezer, the nerve is thawed in DMSO solution at room
temperature, and is left in artificial sea water for 90 min before further testing.
Departures from this procedure are noted below.
3. Initial Results
There is no observable electrical response in untreated Homarus ventral nerves
frozen for 30 min or more at -20 C to -300C independent of the presence or absence
of the perineural sheath. In contrast, prior treatment with 5-10% DMSO solution is
found to exert a consistent cryoprotective effect on the electrical response of both
sheathed and desheathed nerves.
In our first experiments the perineural sheath was removed before treatment with
10% DMISO. Figure XII-9b and c show the electrical response of such a nerve 20 min
after a 40-min exposure at -20OC. Typically the compound action potential (CAP) is
distorted, delayed, and attenuated (note scale change). The stimulus threshold is
greatly increased. Nonetheless, the nerve continues to respond to electrical stimula-
tion.
It is difficult for us to determine, at this time, the nature of the observed freezing
damage, since we have yet to identify which axon populations are being recorded at
each stage of the procedure. For example, a large delay can result from a decrease
in the conduction velocity of individual axons, from the preferential survival of small-
diameter fibers, or from both. DMSO toxicity, mechanical strain, and osmotic stress
may also weaken the nerve before freezing, or may damage it during thawing. In later
QPR No. 105 163

(XII. COMMUNICATIONS BIOPHYSICS)
experiments we attempted to minimize these extraneous effects by leaving the perineu-
ral sheath intact, and by using only 5% DMSO.
4. Further Results
It is possible to stimulate and record the CAP of Homarus ventral nerves without
removing the perineural connective sheath, although the stimulus threshold is thereby
(a) (b)
(c) (d)
Fig. XII-9. (a)-(c) Cryoprotection in desheathed DMSO-treated Homarusnerves, at -20 C. The compound action potential is recorded.(a) Desheathed nerve before treatment. Stimuli: 41-47 p.A;
scale: 1 mV/cm, 1 ms/cm.(b) Same nerve after 40 min in 10% DMSO, 40 min at -200 C,
and 20 min in room-temperature artificial sea water.Stimuli: 125-175 pA; scale: 0. 1 mV/cm, 2 ms/cm.
(c) Same as (b). Increased stimulation 185-260 [LA.(d) Another nerve, perineural sheath intact, before (two lower
traces) and after (upper traces) 10 min in 10% DMSO.Stimuli: 150, 220 pA and 100, 135 pA; scale: 2 mV/cm,
2 ms/cm.
increased (Fig. XII-9d). DMSO affects the CAP of sheathed nerves in the same char-
acteristic manner as reported previously 6 for desheathed nerves, although the observed
changes in Fig. XII-9d are somewhat smaller.
A CAP response can also be obtained from DMSO-treated sheathed nerves kept
QPR No. 105
- - -- -----i--~ ~L- Le --c~
164

(XII. COMMUNICATIONS BIOPHYSICS)
for an hour at -20 C (Fig. XII-10). Again the threshold is greatly increased (35 pA -
360 ±A), as is the delay between stimulus and response signals. The threshold is reduced
by putting the stimulating and recording sets of electrodes closer together (1 cm -0.5 cm),
a procedure that has no effect on the threshold of normal, fresh nerves. Of course,
decreasing the propagation distance automatically reduces the observed delay.
Reducing the freezing temperature from -20 0 C to -30 0 C (Fig. XII-10c and d and
(a)
(c)
(b)
(d)
Fig. XII- 10. Cryoprotection in sheathed DMSO-treated Homarus nerves at-20°C. Time scale: 2 ms/cm.(a) Response of nerve treated 30 min with 5% DMSO. Stimuli:
35-88 pA; scale: 2 mV/cm.(b) Same nerve exposed 60 min at -200C; thawed 90 min at
room temperature. Stimuli: 235, 260, 300, 360, 430,500 A; scale: 0. 2 mV/cm.
(c) Same as (b), with closer electrode configuration (see
text). Stimuli: 180, 220, 260, 300, 360, 430 pA; scale:0. 2 mV/cm.
(d) Another nerve, treated 30 min with 5% DMSO, exposed30 min to -24°C; thawed 90 min. Stimulus: 185-260 pA;scale: 0. 1 mV/cm; close electrodes.
QPR No. 105
~ ~__ __ __ __I
165

Fig. XII-11.
Effects of DMSO concentration oncryoprotection for 1-hour exposureat -30*C. (a)-(d) use a close elec-trode configuration (see text). Timescale: 2 ms/cm.(a) Response of sheathed Homarus
ventralnerve after 30-min treat-ment with 5% DMSO. Stimuli:150 [A-450 A. Scale: 2 mV/cm.
(a) (b) (b) Same nerve exposed 60 min at-300 C. Stimuli: 485, 560, 630 1 ±A;scale: 0. 2 mV/cm.
(c) Response of nerve similarlytreated with 10% DMSO. Stimu-li: 450, 500, 560, 630 A; scale:0. 2 mV/cm.
(d) Response of nerve similarlytreated with 2. 5% DMSO. Stim-uli: 450, 500, 560 [iA; scale:0. Z mV/cm.
(c) (d)
Fig. XII-12.
DMSO-induced cryoprotection for2-hour exposure at -30 0 C. Timescale: 2 ms/cm.(a) Response of sheathed Homarus
ventral nerve before treatment.(a) (b) Stimuli: 100-180 LA; scale:
2 mV/cm.M t 2(b) Same nerve treated 30 min with
50jo DMSO. Stimuli: 68-135 1iA;scale: 2 mV/cm.
(c) Same nerve exposed 120 min to
610 p A; scale: 0. 2 mV/cm.(d) Same as (c) using closer elec-
trodes. Stimuli: 485, 520, 560,610 1±A; scale: 0. 2 mV/cm.
(c) (d)
QPR No. 105 166

(XII. COMMUNICATIONS BIOPHYSICS)
Fig. XII-1 b) has little effect on the overall level of response (-10-20% original CAP
height), but the stimulus threshold is further increased. The post-freezing CAP becomes
increasingly smooth, and all evidence of individual peaks disappears at -30'C, the lowest
temperature obtainable with our present apparatus.
Cryoprotection at -30 C has been found over a range of experimental conditions.
DMSO provides comparable cryoprotection in a 5-10% concentration (Fig. XII-11b and c),
but 2. 5o DMSO is considerably less effective (Fig. XII-11d) and is often ineffective. The
effects of a 2-hour exposure to -30'C (Fig. XII-12) differ little from those of a 1-hour
exposure (Fig. XII-11), but we have yet to obtain a response from nerves kept 3 hours
at that temperature. Unfortunately, one of the most important variables, the freezing
rate, cannot be controlled with our present apparatus, 7 but work on a feedback-controlled
freezer is already underway.
I. M. Asher, S. Carney
Footnotes and References
1. J. E. Lovelock and M. W. H. Bishop, Nature 183, 1394 (1959).
2. M. J. Ashwood-Smith, Ann. N. Y. Acad. Sci. 141, 45 (1967).
3. D. B. Pribor and A. Nara, Cryobiol. 5, 355 (1969).
4. L. J. MvIenz, Cryobiol. 8, 1 (1971).
5. J. E. Pascoe, Proc. Roy. Soc. (London) 147B, 510 (1957).
6. I. PM. Asher, Quarterly Progress Report No. 103, Research Laboratory of Elec-
tronics, M.I.T., October 15, 1971, pp. 165-171.
7. The uncontrolled cooling rate, as measured with a thin calibrated resistor, decreasestypically from 45 0C/min(first 30 s)to 20° C/min(next 20 s) to 6° C/min(next 180 s).
QPR No. 105 167


![XV. COMMUNICATIONS BIOPHYSICS Prof. W. A. - [email protected]](https://img.pdfslide.us/doc/110x75/6206285b8c2f7b173004f8a0/xv-communications-biophysics-prof-w-a-emailprotected.jpg)