Embed Size (px)
Citation preview
BRILLIANT PUBLIC SCHOOL, SITAMARHI
(Affiliated up to +2 level to C.B.S.E., New Delhi)
XI_Maths Chapter Notes
Session: 2014-15
Office: Rajopatti, Dumra Road, Sitamarhi (Bihar), Pin-843301
Ph.06226-252314 , Mobile:9431636758, 9931610902 Website: www.brilliantpublicschool.com; E-mail: [email protected]

1
Class XI: Maths
Chapter:1, Sets
Points to Remember
Key Concepts
1. A set is a well-defined collection of objects.
2. Sets can be represented by two ways: Roster or tabular Form and Set
builder Form
3. Roster form: All the elements of a set are listed separated by commas
and are enclosed within braces { }.Elements are not repeated
generally.
4. Set Builder form: In set-builder form, set is denoted by stating the
properties that its members satisfy.
5. A set does not change if one or more elements of the set are repeated.
6. Empty set is the set having no elements in it. It is denoted by or { }
7. On the basis of number of elements sets are of two types: Finite and
Infinite Sets.
8. Finite set is a set in which there are definite number of elements. or
{ } or Null set is a finite set as it has 0 number of elements which is a
definite number.
9. A set that is not finite is called infinite set.
10. All infinite sets cannot be described in the roster form.
11. Two sets are equal if they have exactly same elements.
12. Two sets are said to be equivalent if they have the same number of
elements.

2
13. Set A is a subset of set B if every element of A is in B, i.e there is no
element in A which is not in B. Denoted by A B.
14. A is a proper subset of B if and only if every element in A is also in B,
and there exists at least one element in B that is not in A.
15. If A is a proper subset of B then B is a superset of A. Denoted by B A
16. Common Set Notations
N : the set of all natural numbers
Z : the set of all integers Q : the set of all rational numbers
R : the set of real numbers
Z+ : the set of positive integers Q+ : the set of positive rational numbers,
R+ : the set of positive real numbers
N R , Q R , Q Z, R Z , NR+
17. Two sets are equal if A B and B A then A = B.
18. Null set is subset of every set including the null set itself.
19. The set of all the subsets of A is known as the Power Set of A
20. Open Interval: The interval
which contains all the elements between a and b excluding a and b. In
set notations:
(a, b) ={ x : a < x < b}
Closed Interval :The interval which contains all the elements
between a and b and also the end points a and b is called closed
interval.

3
[a, b] = {x : a x b}
21. Semi open intervals:
[a, b) = {x : a x < b}includes all the elements from a to b including
a and excluding b
(a, b] = {x : a < x b}includes all the elements from a to b excluding
a and including b.
22. Universal set refers to a particular context.
It is the basic set that is relevant to that context. The universal set is
usually denoted by U
23. Union of sets A and B, denoted by A B is defined as the set of all the
elements which are either in A or in B or in both.
24. Intersection of Sets A and B, denoted by A B is defined as the set
of all the elements which are common to both A and B
25. The difference of the sets A and B is the set of elements which belong
to A but not to B. Written as A-B and read as ‘A minus B’.
In set notations A-B = {x: xA, xB} and B –A = {x: xB, xA}
26. If the intersection of two non empty sets is empty i.e A B = then A
and B are disjoint sets.
27. Let U be the universal set and A be a subset of U. Then the
complement of A, written as A’ or Ac, is the set of all elements of U
that are not in set A.

4
28. The number of elements present in a set is known as the cardinal
number of the set or cardinality of the set. It is denoted by n(A).
29. If A is a subset of U, then A’ is also a subset of U
30. Counting Theorems are together known as Inclusion –Exclusion
Principle. It helps in determining the cardinality of union and
intersection of sets.
31. Sets can be represented graphically using Venn diagrams. Venn
diagrams, consist of rectangles and closed curves, usually circles. The
universal set is generally represented by a rectangle and its subsets by
circles.
Universal Set
Sets
Key Formulae
1. Union of sets AB ={x:x A or x B }
2. Intersection of sets AB ={x:x A and x B }
3. Complement of a set A’ = {x: xU and xA}, A’ = U-A
4. Difference of sets A-B = {x: xA, xB} and B –A = {x: xB, xA}
5. Properties of the Operation of Union.
a. Commutative Law:

5
A B = B A
b. Associative Law:
(AB) C = A (BC)
c. Law of Identity
A = A
d. Idempotent law
A A = A
e. Law of U
U A = U
6. Properties of Operation of Intersection
i) Commutative Law:
A B = B A
ii) Associative Law:
(AB) C = A (BC)
iii) Law of and U
A =, U A = U
iv) Idempotent law
A A = A
v) Distributive law
A (B C) = (A B) (A C)
7. Properties of complement of sets:
a. Complement laws:
i. A A’ = U
ii. A A’ =

6
b. De-Morgan’s law:
i. (A B)’ = A’ B’
ii. (A B)’ = A’ B’
c. Law of double complementation:
(A’)’ = A
d. Laws of empty set and universal set:
’ = U and U’ =
8. Counting Theorems
a. If A and B are finite sets, and A B = then number of elements
in the union of two sets
n(AB) = n(A) + n(B)
b. If A and B are finite sets, A B = then
n(A B ) = n(A) + n(B) - n(A B)
c. n(AB) = n(A – B) + n(B – A) + n(AB)
d. n(A B C) = n(A) + n(B) + n(C) – n(BC) – n(AB) – n(AC) +
n(ABC)
9. Number of elements in the power set of a set with n elements =2n.
Number of Proper subsets in the power set = 2n-2

1
Class XI
Mathematics
Chapter:2 Relations and Functions
Points to Remember
Key Concepts
1. A pair of elements grouped together in a particular order is known as
an ordered pair.
2. The two ordered pairs (a, b) and (c, d) are said to be equal if and only
if a = c and b = d.
3. Let A and B be any two non empty sets. The Cartesian product A × B
is the set of all ordered pairs of elements of sets from A and B defined
as follows: A × B = {(a, b) : a A, b B}.
Cartesian product of two sets is also known as Product Set.
4. If any of the sets of A or B or both are empty then the set A × B will
also be empty and consequently, n(A × B) =0
5. If the number of elements in A is m and the number of elements in
set B is n then the set A × B will have mn elements
6. If any of the sets A or B is infinite, then A × B is also an infinite set.
7. Cartesian product of sets can be extended to three or more sets If A, B
and C are three non empty sets, then A × B × C = {(a, b, c): a A,
bB, cC}.Here (a, b, c) is known as an ordered triplet.
8. Cartesian product of a non empty set A with an empty set is empty set
i.e A X Φ = Φ

2
9. The Cartesian product is not commutative, namely A x B is not the
same as B x A, unless A and B are equal.
10.Cartesian product is associative, namely A x (B x C)=(A x B) x C
11. R × R = {(a, b) : a R, b R} represents the coordinates of all points
in two dimensional plane. R × R × R = {(a, b, c): a R, b R, c C}
represents the coordinates of all points in three dimensional plane.
12. A relation R from the non empty set A to another non empty set B is
a subset of their Cartesian product A × B, i.e R A × B.
13. If (x, y) R or x R y then x is related to y and (x, y) R or x R y then
x is not related to y.
14.The second element b in the ordered pair (a,b) is the image of first
element a and a is the pre-image of b.
15.The Domain of R is the set of all first elements of the ordered pairs in
a relation R. In other words domain is the set of all the inputs of the
relation.
16. If the relation R is from a non empty set A to non empty set B then
set B is called the co - domain of relation R.
17.The set of all the images or the second element in the ordered pair
(a,b) of relation R is called the Range of R.
18.The total number of relations that can be defined from a set A to a set
B is the number is possible subsets of A X B.
19.A × B can have 2mn subsets. This means there are 2mn relations from A
to B

3
20.Relation can be represented algebraically and graphically. The various
methods are as follows:
21. A relation f from a non –empty set A to another non- empty set B is
said to be a function if every element of A has a unique image in B.
22. The domain of f is the set A. No two distinct ordered pairs in f have
the same first element.
23. Every function is a relation but converse is not true
24. If f is a function from A to B and (a, b) f, then f (a) = b, where b is
called image of a under f and a is called the pre-image of b under f
25. If f: A B A is the domain and B is the co domain of f.
26. The Range of the function is the set of images.
27. A real function has the set of real numbers or one of its subsets both
as its domain and as its range.
28.Identity function: f: X X is an identity function if f(x) = x for each
x A

4
29.Graph of the identity function is a straight line that makes an angle of
45o with both x and y axes. All points on this line have their x and y
coordinates equal.
30.Constant function: A constant function is one that maps each
element of the domain to a constant. Domain of this function is R and
range is the singleton set {c} where c is a constant.
31.. Graph of constant function is a line parallel to the x axis. The graph
lies above x axis if the constant c > 0, below the x axis if the constant
c < 0 and is same as x axis if c = 0
32. Polynomial function: f: R R defined as y = f(x) = a0 + a1x +a2x2
+ …. + an xn where n is a non-negative integer and a0, a1, a2, …an R.
33. A linear polynomial represents a straight line, a quadratic polynomial
represents a parabola.
34. Functions of the form f(x)
g(x), where f(x) and
g(x) 0 are polynomial functions are called rational functions.
35. Domain of rational functions does not include those points where g(x)
= 0. For example domain of f(x)=1
x 2 is R-{2}.
36. Modulus function: f: R R defined by f(x) = |x| for each x R
f(x) = x if x0 f(x) = -x if x<0 is called modulus or absolute value
function. The graph of modulus function is above the x axis.
37.. Step or greatest integer function: A function f: R R defined by
f(x) = [x], x R where [x] is the value of greatest integer, less than
or equal to x is called a step or greatest integer function.

5
38. Signum function: f(x)=|x|
x,x 0 and 0 for x=0. The domain of signum
function is R and range is {-1,0,1}.
Key Formulae
1. R X R = { (x, y): x, y R}
and R X R x R = (x, y, z): x, y, z R}
2. If (a, b) =(x, y), then a = x and b = y.
3. (a, b, c) = (d, e, f) if a = d, b = e , c = f
4. If n (A) = n and n (B) = m, then n (A X B) = mn
5. If n (A) = n and n (B) = m, then 2mn relations can be defined from A
to B
6. Algebra of Real function For function f : X → R and g: X → R , we
have
(f + g) (x) = f (x) + g (x), x X
(f – g) (x) = f (x) – g (x), x X
(f.g) (x) = f (x). g (x), x X
(kf) (x) = kf (x) x X, where k is a real number.
f xf(x) ,x X, g (x) 0
g g x

1
Class XI: Maths
Ch 3: Trigonometric Function
Chapter Notes
Top Concepts
1. An angle is a measure of rotation of a given ray about its initial point. The
original ray is called the initial side and the final position of the ray after rotation is called the terminal side of the angle. The point of rotation is called
the vertex.
2. If the direction of the rotation is anticlockwise, the angle is said to be
positive and if the direction of the rotation is clockwise, then the angle is
negative.
Positive Angle- Anticlockwise
Negative Angle- Clockwise
3. If a rotation from the initial side to terminal side is 1
360
th
of a revolution,
the angle is said to have a measure of one degree, I t is denoted by 1o.
4. A degree is divided into 60 minutes, and a minute is divided into 60
seconds. One sixtieth of a degree is called a minute, written as 1’, and one
sixtieth of a minute is called a second, written as 1”

2
Thus, 1o = 60’, 1’ = 60”
5. Angle subtended at the centre by an arc of length 1 unit in a unit circle is
said to have a measure of 1 radian
6. If a point on the unit circle is on the terminal side of an angle in standard
position, then the sine of such an angle is simply the y-coordinate of the point, and the cosine of the angle is the x-coordinate of that point.
7. All the angles which are integral multiples of2
are called quadrantal
angles .Values of quadrantal angles are as follows:
0 1 0 0
0 12 2
1
30 1
2 2
2 1 2 0
cos ,sin
cos ,sin
cos ,sin
cos ,sin
cos ,sin

3
8 .Cosine is even and sine is odd function cos(-x) = cos x
sin(-x) = - sin x
9. Signs of Trigonometric functions in various quadrantsIn quadrant I, all the trigonometric functions are positive.
In quadrant II, only sine is positive. In quadrant III, only tan is positive,
quadrant IV, only cosine function is positive. This is depicted as follows
10. In quadrants where Y-axis is positive (i.e. I and II), sine is positive and
in quadrants where X-axis is positive (i.e. I and IV), cosine is positive
11. A function f is said to be a periodic function if there exists a real number
T>0, such that f(x + T) = f(x) for all x. This T is the period of function.
12. sin (2+ x ) = sin x so the period of sine is 2. Period of its reciprocal is
also 2
13. cos (2+ x) = cos x so the period of cos is 2. Period of its reciprocal is
also 2
14. tan (+ x) = tan x Period of tangent and cotangent function is
15.The graph of cos x can be obtained by shifting the sin function by the
factor 2
16. The tan function differs from the previous two functions in two ways (i)tan is not defined at the odd multiples of /2 (ii) tan function is not
bounded.
17. Function Period
y=sin x 2
y=sin (ax) 2
a
y=cos x 2
y=cos (ax) 2
a
y=cos 3x 2
3
y=sin 5x 2
5

4
18. For a function of the form y= kf(ax+b) range will be k times the range of function x, where k is any
real number if f(x)= sine or cosine function
range will be equal to R-[-k, k] if function is of the form sec x or cosec x,
Period is equal to the period of function f by a. The position of the graph is b units to the right/left of y=f(x) depending on
whether b>0 or b<0
19. The solutions of a trigonometric equation for which 0 ≤ x ≤ 2 are called
principal solutions.
20.The expression involving integer ‘n’ which gives all solutions of a
trigonometric equation is called the general solution.
21. The numerical smallest value of the angle (in degree or radian) satisfying
a given trigonometric equation is called the Principal Value. If there are two
values, one positive and the other negative, which are numerically equal,
then the positive value is taken as the Principal value.
Top Formulae
1. 1 radian =180
57 16o
o '
approximately
2. 1o = 0 01746180o
radians . radians
approximately
3.
s= r θ Length of arc= radius angle in radian
This relation can only be used when is in radians

5
4. Radian measure= Degree measure180
5. Degree measure =180
Radian measure
6. Trigonometric functions in terms of sine and cosine
1
cosecx ,x n ,where n is any integersinx
1
2 12
secx ,x ( n ) ,where n is any int egercosx
sinx
tanx ,x (2n 1) ,where n is any integercosx 2
1
cotx ,x n ,where n is any integertanx
7. Fundamental Trigonometric Identities
sin2x + cos2x = 1 1 + tan2x = sec2 x
1 + cot2x = cosec2x
8 Values of Trigonometric ratios:
0° 6
4
3
2
π
3π
22π
sin 0 1
2
1
2
3
210 0 –1 0
cos 1 3
2
1
2
1
20 –1 0 1
tan 0 1
31 3
not
defined 0
not
defined 0
9. Domain and range of various trigonometric functions:
Function Domain Range
y = sin x
2 2
,[–1, 1]
y = cos x 0 , [–1, 1]
y = cosec x 0
2 2
,R – (–1,1)
y = sec x 0
2
,
R – (–1, 1)
6
y = tan x
2 2
,R
y = cot x 0 , R
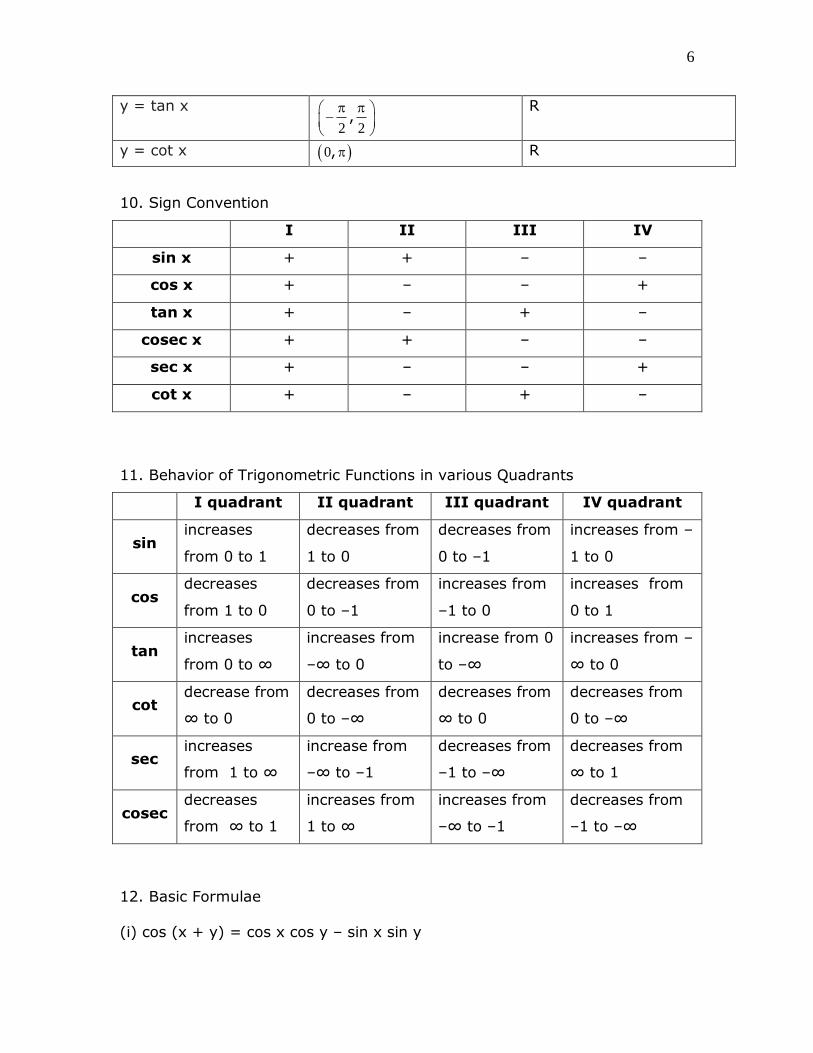
10. Sign Convention
I II III IV
sin x + + – –
cos x + – – +
tan x + – + –
cosec x + + – –
sec x + – – +
cot x + – + –
11. Behavior of Trigonometric Functions in various Quadrants
I quadrant II quadrant III quadrant IV quadrant
sin increases
from 0 to 1
decreases from
1 to 0
decreases from
0 to –1
increases from –
1 to 0
cos decreases
from 1 to 0
decreases from
0 to –1
increases from
–1 to 0
increases from
0 to 1
tan increases
from 0 to ∞
increases from
–∞ to 0
increase from 0
to –∞
increases from –
∞ to 0
cot decrease from
∞ to 0
decreases from
0 to –∞
decreases from
∞ to 0
decreases from
0 to –∞
sec increases
from 1 to ∞
increase from
–∞ to –1
decreases from
–1 to –∞
decreases from
∞ to 1
cosec decreases
from ∞ to 1
increases from
1 to ∞
increases from
–∞ to –1
decreases from
–1 to –∞
12. Basic Formulae
(i) cos (x + y) = cos x cos y – sin x sin y

7
(ii) cos (x - y) = cos x cos y + sin x sin y
(iii) sin (x + y) = sin x cos y + cos x sin y
(iv) sin (x – y) = sin x cos y – cos x sin y
If none of the angles x, y and (x + y) is an odd multiple of 2
, then
(v) tan (x + y) = tanx tany
1 tanx tany
(vi) tan (x – y) = tanx tany
1 tanx tany
If none of the angles x, y and (x + y) is a multiple of , then
(vii) cot (x + y) = cot xcot y 1
cot xcot y
(viii) cot (x – y) = cot xcot y 1
cot y cot x
13. Allied Angle Relations
cos x2
= sin x
sin x2
= cos x
con x2
= –sin x sin x
2
= cos x
cos ( – x) = –cos x sin ( – x) = sin x
cos ( + x) = –cos x sin ( + x) = –sin x
cos (2 – x) = cos x sin (2 – x) = –sin x
cos (2n + x) = cos x sin (2n + x) = sin x

8
14. Sum and Difference Formulae
(i) cos x + cos y = x y x y
2cos cos2 2
(ii) cos x – cos y = x y x y
2sin sin2 2
(iii) sin x + sin y = x y x y
2sin cos2 2
(iv) sin x – sin y = x y x y
2cos sin2 2
(v) 2cos x cos y = cos (x + y) + cos (x – y)
(vi) –2sin x sin y = cos (x + y) – cos (x – y)
(vii) 2sin x cos y = sin (x +y) + sin (x – y)
(viii) 2cos x sin y = sin (x + y) – sin (x – y)
15. Multiple Angle Formulae
(i) cos 2x = cos2 x – sin2 x = 2 cos2 x – 1 = 1 – 2 sin2 x = 2
2
1 tan x
1 tan x
(ii) sin 2x = 2 sin x cos x = 2
2tanx
1 tan x
(iii) tan 2x = 2
2tanx
1 tan x
(iv) sin 3x = 3 sin x – 4 sin³ x
(v) cos 3x = 4 cos³ x – 3 cos x
(vi) tan 3x = 3
2
3tanx tan x
1 3tan x
16.Trigonometric Equations
No. Equations General Solution
Principal value

9
1 sin θ = 0 θ = n, nZ θ = 0
2 cos θ = 0 θ = (2n + 1)
2
,
nZ
θ = 2
3 tan θ = 0 θ = n θ = 0
4 sin θ = sin α θ = n + (-1)ⁿ α
nZ
θ = α
5 cos θ = cos α θ = 2n ± α nZ θ = 2α, α > 0
6 tan θ = tan α θ = n + α nZ θ = α
14. (i) sin θ = k = sin (n + (–1)ⁿ α), n є Z
θ = nπ + (–1)ⁿ α, n є Z
cosec θ = cosec α sin θ = sin α
θ = n + (–1)ⁿ α, n є Z
(ii) cos θ = k = cos (2n ± α), n є Z
θ = 2n ± α, n є Z
Top Diagrams
1. Graphs helps in visualization of properties of trigonometric functions.
The graph of y = sin can be drawn by plotting a number of points (,
sin ) as takes a series of different values. Since the sine function is
continuous, these points can be joined with a smooth curve. Following
similar procedures graph of other functions can be obtained.
i. Graph of sin x

10
ii. Graph of cos x
iii. Graph of tan x
iv. Graph of sec x
v. Graph of cosec x
vi. Graph of cot x

11

1
Class XI: Mathematics
Chapter 5
Complex Numbers & Quadratic Equations
Chapter Notes
Top Definitions
1. A number of the form a + ib, where a and b are real numbers, is said to
be a complex number.
2. In complex number z = a + ib, a is the real part, denoted by Re z and b is
the imaginary part denoted by Im z of the complex number z.
3 1 =i is called the iota the complex number.
4. For any non – zero complex number z = a + ib (a ≠ 0, b ≠ 0), there exists
a complex number 2 2 2 2
a bi ,
a b a b
denoted by 11
or z ,z
called the
multiplicative inverse of z such that (a + ib) 2
2 2 2 2
a bi 1 i0 1
a b a b
.
5. Modulus of a complex number z = a+ib , denoted by |z|, is defined to be
the non – negative real number 2 2a b , i.e 2 2| z| a b
6. Conjugate of a complex number z =a+ib, denoted as z , is the complex
number a – ib.
7. z=r(cos θ +isin θ) is the polar form of the complex number z=a+ib.
here r = 2 2a b is called the modulus of z and θ = 1 btan
a
is called the
argument or amplitude of z, denoted by arg z.
8. The value of θ such that –π < θ ≤ π, called principal argument of z.

2
9 The plane having a complex number assigned to each of its points is
called the complex plane or the Argand plane.
10.Fundamental Theorem of Algebra states that “A polynomial equation of
degree n has n roots.”
Top Concepts
1. Addition of two complex numbers:If z1 = a + ib and z2 = c +id be any
two complex numbers then, the sum
z1 + z2 = (a + c) + i(b + d).
2. Sum of two complex numbers is also a complex number. this is known as
the closure property.
3. The addition of complex numbers satisfy the following properties:
i. Addition of complex numbers satisfies the commutative law. For any two
complex numbers z1 and z2, z1 + z2 = z2 + z1.
ii. Addition of complex numbers satisfies associative law for any three
complex numbers z1, z2, z3, (z1 + z2) + z3 = z1 + (z2 + z3).
iii. There exists a complex number 0 + i0 or 0, called the additive identity or
the zero complex number, such that, for every complex number z,
z + 0 = 0+z = z.
iv. To every complex number z = a + ib, there exists another complex
number –z =–a + i(-b) called the additive inverse of z. z+(-z)=(-z)+z=0
4 Difference of two complex numbers: Given any two complex numbers
If z1 = a + ib and z2 = c +id the difference z1 – z2 is given by
z1 – z2 = z1 + (-z2) = (a - c) + i(b - d).
5 Multiplication of two complex numbers Let z1 = a + ib and z2 = c + id
be any two complex numbers. Then, the product z1 z2 is defined as follows:
z1 z2 = (ac – bd) + i(ad + bc)

3
6. Properties of multiplication of complex numbers: Product of two
complex numbers is a complex number, the product z1 z2 is a complex
number for all complex numbers z1 and z2.
i. Product of complex numbers is commutative i.e for any two complex
numbers z1 and z2,
z1 z2 = z2 z1
ii. Product of complex numbers is associative law For any three complex
numbers z1, z2, z3,
(z1 z2) z3 = z1 (z2 z3)
iii. There exists the complex number 1 + i0 (denoted as 1), called the
multiplicative identity such that z.1 = z for every complex number z.
iv. For every non- zero complex number z = a + ib or a + bi (a ≠ 0, b ≠ 0),
there is a complex number 2 2 2 2
a bi
a b a b
, called the multiplicative
inverse of z such that
1z 1
z
v. The distributive law: For any three complex numbers z1, z2, z3,
a. z1 (z2 + z3) = z1.z2 + z1.z3
b. (z1 + z2) z3 = z1.z3 + z2.z3
7.Division of two complex numbers Given any two complex numbers z1 =
a + ib and z2 = c + id z1 and z2, where z2 ≠ 0, the quotient 1
2
z
z is defined by
11
2 2
z 1z .
z z=
2 2 2 2
ac bd bc adi
c d c d
8. Identities for the complex numbers
i. (z1 + z2)² = z1² + z2² = 2z1.z2, for all complex numbers z1 and z2.
ii (z1 – z2)² = z1² - 2z1z2 + z2²
iii.(z1 + z2)³ = z1³ + 3z1²z2 + 3z1z2² + z2³
iv (z1 – z2)³ = z1³ = 3z1²z2 + 3z1z2³ - z2³
v z1² - z2² = (z1 + z2) (z1 – z2)

4
9. Properties of modulus and conjugate of complex numbers
For any two complex numbers z1 and z2,
i. |z1 z2| = |z1||z2|
ii. 1 1
2 2
z | z |
z | z | provided |z2| ≠ 0
iii. 1 2 1 2z z z z
iv. 1 2 1 2z z z z
v. 11
22
z z
z z
provided z2 ≠ 0
10. For any integer k, i4k = 1, i4k+1 = i, i4k+2 = –1, i4k+3 = –
i. a b ab when a<0and b<0.
11.The polar form of the complex number z = x + iy is r (cos θ + i sinθ),
where r is the modulus of z and θ is known as the argument of z.
12.For a quadratic equation ax² + bx + c = 0 with real coefficient a, b, c and
a ≠ 0.
If discriminant D = b² - 4ac 0 then the equation has two real roots given by
2b b 4acx
2a or
bx
2a
13. Roots of the quadratic equation ax² + bx + c = 0, where a, b, cR, a ≠
0,when discriminant b²-4ac < 0, are imaginary given by
2b 4ac b ix
2a
.Complex roots occurs in pairs.
14. A polynomial equation of n degree has n roots. These n roots could be
real or complex.
15. Complex numbers are represented in Argand plane with x axis being
real and y axis imaginary

5
16. Representation of complex number z=x+iy in Argand Plane
17. Argument of the complex number z can take any value in the interval
[0, 2). Different orientations of z are as follows

6

1
Class XI
Mathematics
Chapter Notes
Linear Inequalities
Definitions
1. Two real numbers or two algebraic expressions related by the symbol
‘<’, ‘>’, ‘≤’ or ‘≥’ form an inequality.
2. Inequalities containing ‘<’, or ‘>’ are called strict inequalities.
3. Inequalities containing ‘≤’ or ‘≥’ are called slack inequalities.
4. An inequality containing any two of‘<’, ‘>’, ‘≤’ or ‘≥’is called double
inequality.
5. Solution of an inequality in one variable is the value of the variable
which makes it a true statement
6. A linear expression in one variable involving the inequality symbol is
linear inequality in one variable. General forms:
ax + b < 0 (1)
ax + b > 0 (2)
ax + b ≤ 0 (3)
ax + b ≥ 0 (4)
7. A linear inequality involving two variables is known as a linear
inequality in two variables. General forms
ax + by < c (5)
ax + by > c (6)
ax + by ≤ c (7)
ax + by ≥ c (8)
ax² + bx + c ≤ 0 (9)
ax² + bx + c ≥ 0 (10)
7. The region containing all the solutions of an inequality is called the
solution region.
8. The solution region of the system of inequalities is the region which
satisfies all the given inequalities in the system simultaneously.

2
9. Quadratic inequality is quadratic polynomial with inequality sign.
Generic quadratic inequality is of the form ax2+bx+c > 0
Concepts
1. If two real numbers are related by the symbols ‘<’, ‘>’, ‘≤’ or ‘≥’ then
the inequality is a numerical inequality and in case of algebraic
expressions it is literal inequality.
2<3 is numerical inequality
5x+2≤7 is literal inequality
2. Rules for simplifying the inequalities
Rule 1: Equal numbers may be added to (or subtracted from) both
sides of an equation.
If a < b then a + c < b + c.
Rule 2: Both sides of an equation may be multiplied (or divided) by
the same non – zero number.
If a < b then ac < bc
Rule 3: Sign of inequality is reversed in case of multiplication (or
division) by a negative number
If a < b then ak > bk, where k is a negative number
Rule 4: Sign of inequality is reversed in case of taking the reciprocals
3. A linear inequality in one variable can be represented graphically as
follows:
Representation of x1
Representation of x1
Representation of x>1
3
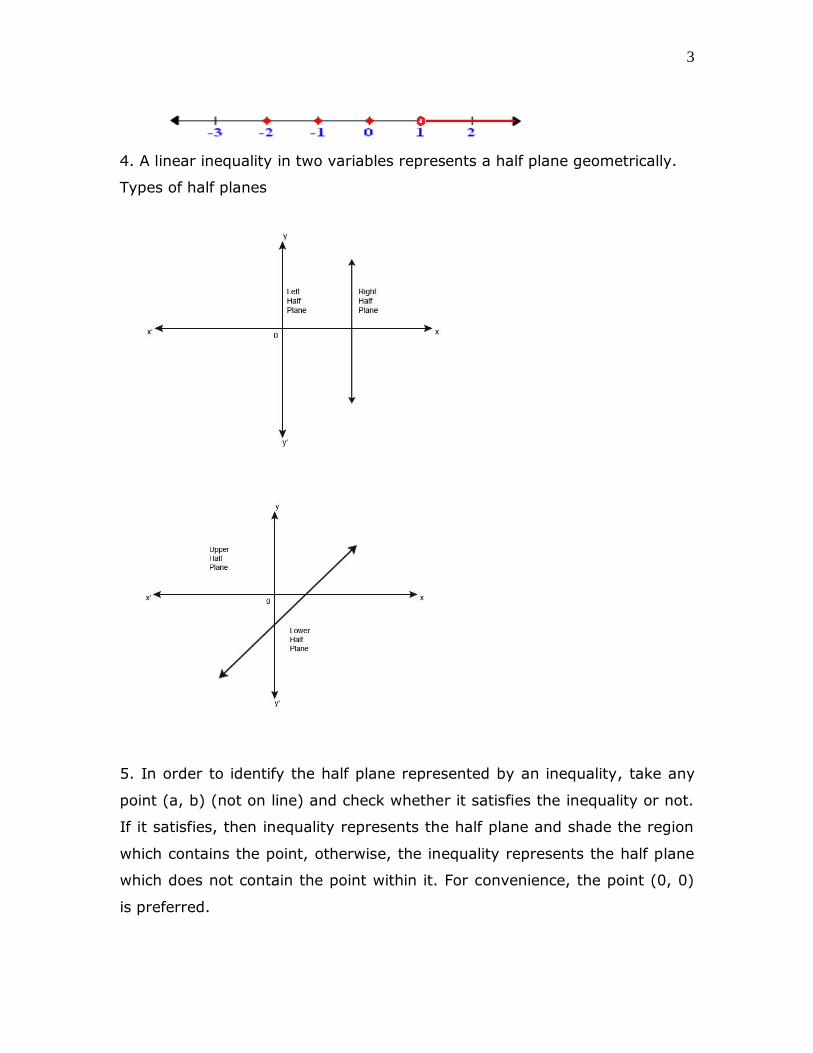
4. A linear inequality in two variables represents a half plane geometrically.
Types of half planes
5. In order to identify the half plane represented by an inequality, take any
point (a, b) (not on line) and check whether it satisfies the inequality or not.
If it satisfies, then inequality represents the half plane and shade the region
which contains the point, otherwise, the inequality represents the half plane
which does not contain the point within it. For convenience, the point (0, 0)
is preferred.

4
6. If an inequality is of the type ax + b ≥ c or ax + b c i.e slack inequality
then the points on the line ax + b = c are also included in the solution region
Solution of Slack Inequality
7. If an inequality is of the form ax + by > c or ax + by < c, then the points
on the line ax + by = c are not to be included in the solution region.
Solution of Strict Inequality
8. To represent x < a (or x > a) on a number line, put a circle on the number
a and dark line to the left (or right) of the number a.
9. To represent x ≤ a (or x ≥ a) on a number line, put a dark circle on the
number a and dark the line to the left (or right) of the number x.
10. Steps to represent the linear inequality in two variables graphically
Step 1 Rewrite the inequality as linear equation, that is ax+by = c
step 2: Put x=0 to get y-intercept of the line i.e. (0, c/b)
Step 3: Put y=0 to get x intercept of the line i.e. (c/a, 0)

5
Step 4: Join the two points, each on x axis and y axis to get the graphical representation of the line.
Step5: Choose a point (x1, y1) in one of the planes i.e. either to the left or
right or upper or lower half of the line, but not on the line.
Step 6 If (x1, y1) satisfies the given inequality. Then the required region is
that particular half plane in which (x1, y1) lie.
On the other hand, if (x1, y1) does not satisfy the given inequality, then the required solution region is the half plane which does not contain (x1,y1)
11. Linear inequalities represent regions; regions common to the giveninequalities will be the solution region.
Like linear equations, there can be cases of overlapping of regions or no
common regions for the given inequalities.
12. To solve a system of inequalities graphically
Change the sign of equality to inequality and draw the graph of eachline.
Shade the region for each inequality.
Common region to all the inequalities is the solution.
13. A linear inequality divides the plane into two half planes while a quadraticinequality is represented by a parabola which divides the plane into different
regions.
Region Represented by the inequality x2 + 5x + 6 > 0
14. Interval Notations:
Open Interval: The interval
which contains all the elements between a and b excluding a and b. In set

6
notations:
(a, b) ={ x : a < x < b}
Closed Interval :The interval which contains all the elements between a and
b and also the end points a and b is called closed interval.
[a, b] = {x : a x b}
Semi open intervals:
[a, b) = {x : a x < b}includes all the elements from a to b including
a and excluding b
(a, b] = {x : a < x b}includes all the elements from a to b excluding
a and including b.

1
Class XI: Math
Chapter 7: permutation and Combination
Chapter Notes
Key Concepts
1. Fundamental principle of counting: These are two fundamental
principles of counting as follows:
1) Multiplication Principle2) Addition Principle
2.Multiplication Principle: If an event can occur in M different ways,
following which another event can occur in N different ways, then the total number of occurrence of the events in the given order is M x N. This
principle can be extended to any number of finite events. Keyword here is
“And”
3. Addition Principle: If there are two jobs such that they can be
performed independently in M and N ways respectively, then either of the
two jobs can be performed in (M + N) ways. This principle can be extended to any number of finite events. Keyword here is “OR”
4. The notation n! represents the product of first n natural numbers. n!=1.2.3.4…….n
5. A permutation is an arrangement in a definite order of a number of objectstaken some or all at a time. In permutations order is important.
6. The number of permutation of n different objects taken r at a time, where0< r ≤ n and the objects do not repeat is n(n – 1)(n – 2). . . (n – r + 1)
which is denoted by nPr
7. The number of permutation of n different objects taken r at a time, where
repetition is allowed is nr.
8. The number of permutation of n objects, where p, objects are of one kind
and rest are all different is given byn!
p!.

2
9.The number of permutation of n objects, where p1, objects are of one kind,
p2, are of second kind, … pk, are of kth kind and the rest, if any are of
different kind is 1 2 k
n!
p !p ! p !.
10. Keyword of permutations is “arrangement”
11. The number of combinations or selection of r different objects out of n
given different objects is nCr which is given by
n!nC 0 r nr
r! n r !
12 Number of combinations of n different things taken nothing at all is
considered to be 1
13. Counting combinations is merely counting the number of ways in whichsome or all objects at a time are selected.
14. Keyword of combinations is “selection”.
15. Selecting r objects out of n objects is same as rejecting (n – r) objects
so nCn-r= nCr
16.Order is not important in combinations.
Key Formulae
1. n! = 1 x 2 x 3 x …x n or n! = n x (n -1)!
2. n!=n(n-1)(n-2)!(provided n2)
3. n!=n n(n-1)(n-2)(n-3)! (provided n3)
4. 0!=1!=1
5.
n
r
n!P , 0 r n
n r !
6.
n
n
n! n!P n!
n n ! 0!
7.
n
0
n! n!P 1
n 0 ! n!

3
8. n!nC 0 r nr
r! n r !
9. n n
r rP C r!, 0 r n
10.nC0 = 1
11.n n
0 nC C 1
12.n nC C nn 1
13.nCn-r =
n! n! nCrn r !r!n r ! n n r !
14.nCa=nCb a=b

1
Class XI: Math
Chapter 8: Binomial Theorem
Chapter Notes
Key Concepts
1. A binomial expression is an algebraic expression having two terms, forexample (a+b),(a-b) etc.
2. The expansion of a binomial for any positive integral n is given byBinomial Theorem. The binomial theorem says that
(x+y)n = xn + nC1xn-1y+nC2x
n-2y2+----+nCr xn-ryr+ -----+nCn-1xyn-1 + ncny
n
In summation notation (x+y)n = n
n n k k
k
k 0
C x y
3. (i)In the binomial expansion of (x+y)n the number of terms is (n+1)i.e one more than the exponent.
(ii)The exponent of x goes on decreasing by unity and y increases by unity. Exponent of x is n in the first term, (n - 1) in the second term,
and so on ending with zero in the last term.
(iii)The sum of the indices of x and y is always equal to the index of the expression.
4. The coefficients ⁿCr, the number of combinations of n objects taken r
at a time, occurring in the binomial theorem are known as binomial coefficients.
5. Binomial coefficients when arranged in the form given below is knownas Pascals Triangle

2
6. The array of numbers arranged in the form of triangle with 1 at the
top vertex and running down the two slanting sides is known as Pascal’s triangle, after the name of French mathematician
Blaise Pascal. It is also known as Meru Prastara by Pingla.
7. Pascal's Triangle is a special triangle of numbers. It has an infinite
number of rows. Pascal's Triangle is a storehouse of patterns.
8. In order to construct the elements of following rows, add the number
directly above and to the left with the number directly above and to the right to find the new value. If either the number to the right or left
is not present, substitute a zero in its place.
9. Using binomial theorem for non –negative index(x – y)ⁿ = [x + (-y)]ⁿ
(x – y)ⁿ = nn n n n 1 n n 2 2 n n 3 3 n n
0 1 2 3 nC x C x y C x y C x y 1 C y
In summation notation (x – y)ⁿ = n
k n n k k
k
k 0
( 1) C x y
10.Binomial theorem can be used to expand trinomial by applying thebinomial expansion twice.
11. General term in the expansion of (x+y)n is Tk+1 =nCk x
n-k yk
12.General term in the expansion of (x-y)n is Tk+1 = nCk (-1)k x
n-k yk
13.If n is even , there is only one middle term in the expansion of (x + y)n
and will be the
thn
12
term

3
14.If n is odd, there are two middle terms in the expansion of
(x + y)n and they are
thn 1
2
and
thn 3
2
term.
15.In the expansion
2n1
xx
, where x ≠ 0, the middle term is
th2n 1 1
2
i.e., (n + 1)th term, as 2n is even

4
Summary
, which is (a + b)ⁿ = ⁿC0aⁿ + ⁿC1an-1b + ⁿC2a
n-2b² + …+ ⁿCn-1a.bn-1 + ⁿCnbⁿ.
The coefficients of the expansions are arranged in an array. This array is called Pascal’s triangle.
The general term of an expansion (a + b)ⁿ is Tr+1 = ⁿCr an-r. br.
In the expansion (a + b)ⁿ, if n is even, then he middle term is the th
n1
2
term. If n is odd, then the middle term are
thn 1
2
and
thn 1
12
terms.
1
Class XI: Mathematics
Chapter 9: Sequence and Series
Chapter Notes
Top Definitions
1. A Sequence is an ordered list of numbers according to some rule. A
sequence is denoted by <an> n1 = a1,a2,a3, …….an
2. The various numbers occurring in a sequence are called its terms.
3. A sequence containing finite number of terms is called a finite
sequence. A finite sequence has last term.
4. A sequence which is not a finite sequence, i.e. containing infinite
number of terms is called an infinite sequence. There is no last term in
an infinite sequence.
5. A sequence is said to be an arithmetic progression if every term differs
from the preceding term by a constant number. For example,
sequence a1, a2, a3, … an, … is called an arithmetic sequence or an AP
if an+1 = an + d
for all n N , where d is a constant called the common difference of
AP.
6. A is the arithmetic mean of two numbers a and b if a,A,b forms an
arithmetic progression.
7. A sequence is said to be a geometric progression or G.P., if the ratio of
any tem to its preceding term is same throughout. Constant Ratio is
common ratio denoted by r.

2
8. If three numbers are in GP, then the middle term is called the
geometric mean of the other two.
Top Concepts
1. A sequence has a definite first member, second member, third
member and so on.
2. The nth term <an> is called the general term of the sequence.
3. Fibonacci sequence 1, 1, 2, 3, 5, 8,.. … is generated by therecurrence relation given by
a1 = a2 = 1
a3 = a1 + a2……
an = an-2 + an-1, n > 2
4. A sequence is a function with domain the set of natural numbers
or any of its subsets of the type {1, 2, 3, … k}.
5. The sum of the series is the number obtained by adding the
terms. 6. General form of AP is a, a + d, a + 2d, ...a+(n-1)d. a is called
the first term of the AP and d is called the common
difference of the AP. d can be any real number.
7. If d>0 then AP is increasing if d< 0then AP is decreasing and
d=0 then AP is constant.
8. For AP a , (a + d) , (a + 2d) , ... , ( - 2d) , ( - d), with
first term a and common difference d and last term
general term is -(n-1)d.
9. Properties of Arithmetic Progression
i. If a constant is added to each term of an A.P., the resulting
sequence is also an A.P.

3
ii. If a constant is subtracted from each term of an A.P., the resulting
sequence is also an A.P.
iii. If each term of an A.P. is multiplied by a constant, then the
resulting sequence is also an A.P.
iv. If each term of an A.P. is divided by a non – zero constant then the
resulting sequence is also an A.P.
10. The arithmetic mean A of any two numbers a and b is given by
a b
2
11. General Form of GP: a, ar, ar2, ar3, ..... where a is the first term
and r is the constant ratio r can take any non zero real number.
12. A sequence in geometric progression will remain in geometric progression
if each of its terms is multiplied by a non zero constant.
13. A sequence obtained by the multiplying two GPs term by term results in
a GP with common ratio the product of the common ratio of the two GPs.
14. The geometric mean (G.M.) of any two positive numbers a and b is given
by ab .
15. Let A and G be A.M. and G.M. of two given positive real numbers a and b,
respectively, then A ≥ G
Where A = a b
, andG ab2

4
Top Formulae
1. nth term or general term of the A.P. is an = a + (n – 1)d where
a is the first term, d is common difference.
2. General term of AP given its last term is - (n – 1)d
3. Let a, a + d, a + 2d, …, a + (n – 1)d be an A.P. Then
n
nS 2a n 1 d
2 or n
nS a
2 where = a + (n -1) d
4. Let A1, A2, A3, …An be n numbers, between a and b such that a,
A1, A2, A3, …An, b is an A.P. n numbers between a and b are as
follows:
A1 = a + d = a + b a
n 1
A2 = a + 2d = a + 2 b a
n 1
A3 = a + 3d = a + 3 b a
n 1
… … … …
… … … …
An = a + nd = a + n b a
n 1
5. General term of GP is arn-1 where a is the first termand r is the
common ratio.
6. Sum to first n terms of GP Sn = a + ar + ar² + … + arn-1
(i)if r = 1, Sn = a + a + a + … + a (n terms) = na

5
(ii) If r<1 Sn = nq 1 r
1 r
(iii)If r>1 Sn = na r 1
r 1
7. Let G1, G2, ……, Gn be n numbers between positive numbers a
and b such that a, G1, G2, G3, …… Gn, b is a G.P.
Thus b = brn+1, or r =
1
n 1b
a
G1 = ar = a
1
n 1b
a
, G2 = ar² = a
2
n 1b
a
, G3 ar³ = a
3
n 1b
a
Gn = arⁿ = a
n
n 1b
a
8. The sum of first n natural Numbers is
1 + 2 + 3 + … + n = n n 1
2
9. Sum of squares of the first n natural numbers
12+22+32+……..n2= n n 1 2n 1
6
10. Sum of cubes of first n natural numbers
1³ + 2³ + … + n³=
222 n n 1n n 1
4 4

Class-XI
Mathematics Conic Sections
Chapter-11
Chapter Notes
Key Concepts 1. Let be a fixed vertical line and m be another line intersecting it at a fixed
point V and inclined to it at and angle
On rotating the line m around the line in such a way that the angle
remains constant a surface is generated is a double-napped right circular
hollow cone.
2. The point V is called the vertex; the line is the axis of the cone. The
rotating line m is called a generator of the cone. The vertex separates the

cone into two parts called nappes.
3. The sections obtained by cutting a double napped cone with a plane
are called conic sections. Conic sections are of two types (i) degenerate conics (ii) non degenerate conics.
4. If the cone is cut at its vertex by the plane then degenerate conicsare obtained.
5. If the cone is cut at the nappes by the plane then non degenerate
conics are obtained.
6. Degenerate conics are point, line and double lines.
7. Circle, parabola, ellipse and hyperbola are degenerate conics.
8. When the plane cuts the nappes (other than the vertex) of the cone,degenerate conics are obtained.
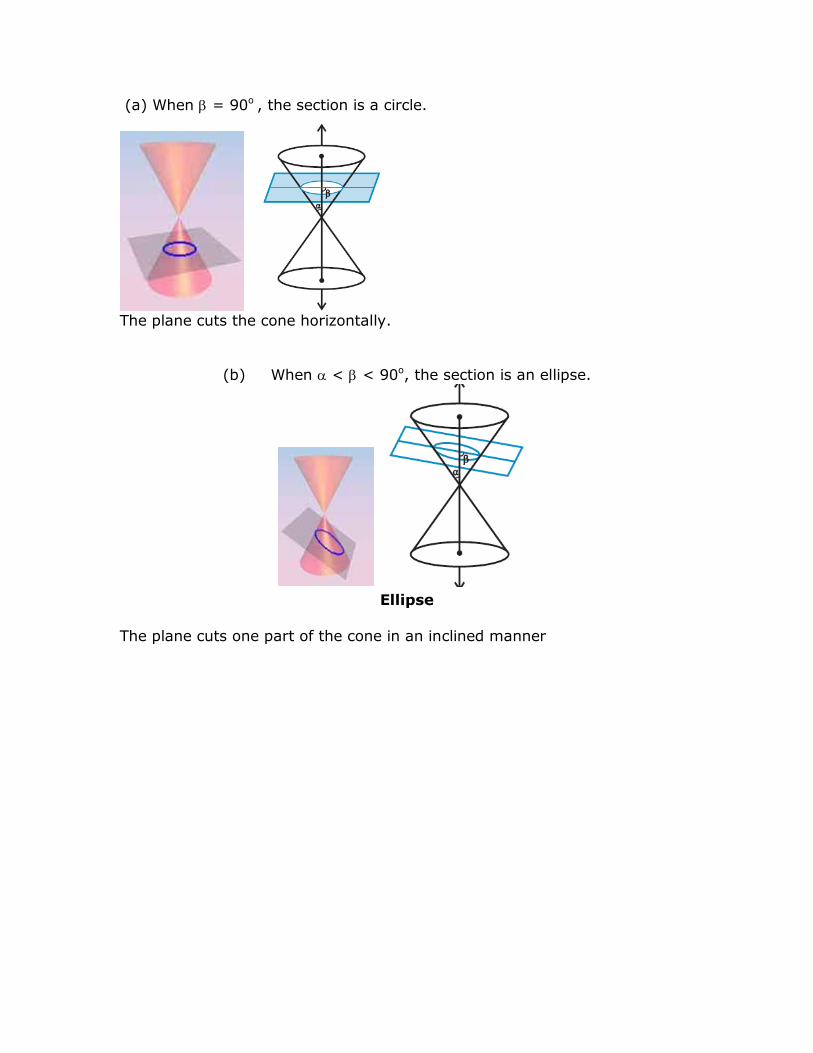
(a) When = 90o , the section is a circle.
The plane cuts the cone horizontally.
(b) When < < 90o, the section is an ellipse.
Ellipse
The plane cuts one part of the cone in an inclined manner

(c) When = ; the section is a parabola.
Parabola
The plane cuts the cone in such a way that it is parallel to a generator
(d) When 0 < ; the plane cuts through both the nappes the curve of
intersection is a hyperbola.
Hyperbola
The plane cuts both parts of the cone.
9. When the plane cuts at the vertex of the cone, we have the following
different cases:

(a) When < 900, then the section is a point.
Point degenerated case of a circle.
(b) When = , the plane contains a generator of the cone and the
section is a straight line.
Line
It is the degenerated case of parabola.

(c) When 0 < , the section is a pair of intersecting straight lines . It is
the degenerated case of a hyperbola.
Double Line
10. A circle is the set of all points in a plane that are equidistant from a
fixed point in the plane.
11. The fixed point is called the centre of the circle and the distance from
the centre to a point on the circle is called the radius of the circle.
In the circle O is the centre and O A = OB = OC are the radii.
12. If the centre of a circle is (h, k) and the radius is r, then the equation of
the circle is given by (x - h)2 + (y - k)2 = r 2
13. A circle with radius of length zero is a point circle.
14. If the centre of a circle is at origin and the radius is r, then the equationof the circle is given by x2 + y2 = r 2
15. A parabola is the locus of a point, which moves in a plane in such a waythat its distance from a fixed point (not on the line) in the plane is equal to

its distance from a fixed straight line in the same plane.
15. If the fixed point is on the fixed line then the set of points which are equidistant from the line and focus will be straight line which passes through
the fixed point focus and perpendicular to the given line. This straight line is
the degenerate case of the parabola.
16. The fixed line is called the directrix of the parabola and the fixed
point F is called the focus.
17. Para’ means ‘for’ and ‘bola’ means throwing. The path taken by the
trajectory of a rocket artillery etc are parabolic.
One of nature's best known approximations to parabolas is the path taken by a body projected upward and obliquely to the pull of
gravity, as in the parabolic trajectory of a golf ball.
18. A line through the focus and perpendicular to the directrix is
called the axis of the parabola. The point of intersection of parabola

with the axis is called the vertex of the parabola.
19. A chord of a parabola is the line segment joining any two points on the
parabola. If the chord passes through the focus it is focal chord. LM and PQ
are both chords but PQ is focal chord.
20. The chord which passes through the focus is called focal chord. Focalchord perpendicular to the axis is called the latus rectum of the parabola.
21. The equation of a parabola is simplest if the vertex is at the origin andthe axis of symmetry is along the x-axis or y-axis. The four possible such
orientations of parabola are shown below:
22. In terms of loci, the conic sections can be defined as follows: Given a lineZ and a point F not on Z a conic is the locus of a point P such that the
distance from P to F divided by the distance from P to Z is a constant. i.e
PF/PM = e, a constant called eccentricity.

In case of parabola eccentricity e =1.
23. Parabola is symmetric with respect to its axis. If the equation has a y2
term, than the axis of symmetry is along the x-axis and if the equation has
an x2 term, then the axis of symmetry is along the y-axis.
24. When the axis of symmetry is along the x-axis the parabola opens to
the (a) Right if the coefficient of x is positive,
(b) Left if the coefficient of x is negative.
25. When the axis of symmetry is along the y-axis the parabola opens
(c) Upwards if the coefficient of y is positive.
(d) Downwards if the coefficient of y is negative.
26. An ellipse is the set of all points in a plane, the sum of whose distance
from two fixed points in the plane is a constant. These
two fixed points are called the foci. For instance, if F1 and F2 are the foci and P1, P2, P3 are the points on the ellipse then
P1F1+P1F2=P2F1+P2F2=P3F1+P3F2 is a constant and this constant is more than
the distance between the two foci.
27. An ellipse is the locus of a point that moves in such a way that its
distance from a fixed point (called focus) bears a constant ratio, to its
distance from a fixed line (called directrix). The ratio e is called the eccentricity of the ellipse. For an ellipse e <1.

28. The eccentricity is a measure of the flatness of the ellipse. The
eccentricity of a conic section is a measure of how far it deviates from being circular
29. Terms associated with ellipse
(a) The mid point of the line segment joining the foci is called the centre of
the ellipse. In the figure O is the centre of ellipse. For the simplest ellipse the centre is at origin.
(b) The line segment through the foci of the ellipse is called the major axis
and the line segment through the centre and perpendicular to the major axis is called the minor axis. In the figure below AB and In case of simplest
ellipse the two axes are along the coordinate axes. Two axes intersect at the
centre of ellipse.
(c) Major axes represent longer section of parabola and the foci lies on major axes.
(d) The end points of the major axis are called the vertices of the ellipse.
30. If the distance from each vertex on the major axis to the centre be a,
then the length of the major axis is 2a. Similarly, if the distance of each
vertex on minor axis to the centre is b, the length of the minor axis is 2b. Finally, the distance from each focus to the centre is c. So, distance between foci is 2c.

31. Semi major axis a, semi minor axis b and distance of focus from centre c
are connected by the relation a2 = b2+ c2 or c2 = a2 – b2
32. In the equation c2 = a2 – b2, if a is fixed and c vary from 0 to a, then
resulting ellipses will vary in shape.
Case (i) When c = 0, both foci merge together with the centre of the ellipse
and a2 = b2, i.e., a = b, and so the ellipse becomes circle .Thus circle is a special case of an ellipse.
Case (ii) When c = a, then b = 0. The ellipse reduces to the line segment
F1F2 joining the two foci.
33. The eccentricity of an ellipse is the ratio of the distances form the
centre of the ellipse to one of the foci and to one of the vertices of the
ellipse. Eccentricity is denoted by e i.e., c
ea
.
34. The standard form of ellipses having centre at the origin and the major
and minor axis as coordinate axes. There are two possible orientations:

35. Ellipse is symmetric with respect to both the coordinate axes andacross the origin. Since if (x, y) is a point on the ellipse, then (- x, y), (x, -y)
and (-x, y) are also points on the ellipse.
36. Since the ellipse is symmetric across the y-axis. It follows that another
point F2(-c,0) may be considered as a focus, corresponding to another
directrix. Thus every ellipse has two foci and two directrices.
37. The foci always lie on the major axis. The major axis can be determined
by finding the intercepts on the axes of symmetry. That is, major axis is
along the x-axis if the coefficient of x2 has the larger denominator and it is along the y-axis if the coefficient of y2 has the larger denominator.
38. Lines perpendicular to the major axis A'A through the foci F1 and F2respectively are called latus rectum. Lines LL’ and MM’ are latus rectum.
39. The sum of focal distances of any point on an ellipse is a constant and is
equal to the major axis.
40. Conic ellipse can be seen in the physical world. The orbital of planets is
elliptical.

Apart from this one can see an ellipse at many places since every circle,
viewed obliquely, appears elliptical.
If the glass of water is seen from top or if it is held straight it appears to be
circular but if it is tilt it will be elliptical.
41. A hyperbola is the set of all points in a plane, the difference of whose
distances from two fixed points in the plane is a constant. The two fixed
points are called the foci of the hyperbola.
(Distance to F1) − (distance to F2) = constant
42. A hyperbola is the locus of a point in the plane which moves in such a
way that its distance from a fixed point in the plane bears a constant ratio, e
> 1, to its distance from a fixed line in the plane. The fixed point is called
focus, the fixed line is called directrix and the constant ratio e is called the eccentricity of the hyperbola.

43. Terms associated with hyperbola
(a) The mid-point of the line segment joining the foci is called the centre of
the hyperbola.
(b) The line through the foci is called the transverse axis and the line through
the centre and perpendicular to the transverse axis is conjugate axis.
(c)The points at which the hyperbola intersects the transverse axis are called
the vertices of the hyperbola.
44. The hyperbola is perfectly symmetrical about the centre O.
45. Let the distance of each focus from the centre be c, and the distance ofeach vertex from the centre be a.
Then, F1F2 = 2c and AB = 2a
If the point P is taken at A or B then PF2-PF1 =2a
46. If the distance between two foci is 2c, between two vertices is 2a i.e
length of the transverse axis is 2a , length of conjugate axis is 2b then
a,b,c are connected as c2 = a2 + b2
47. The ratio c
ea
is called the eccentricity of the hyperbola. From the
shape of the hyperbola, we can see that the distance of focus from

origin, c is always greater than or equal to the distance of the vertex
from the centre, so c is always greater than or equal to a. Since c a, the eccentricity is never less then one.
48. The simplest hyperbola is the one in which the two axes lie along the axes and centre is at origin. Two possible orientations of hyperbola are
"north-south" opening hyperbola.
East-West Opening Hyperbola
49. A hyperbola in which a = b called an equilateral hyperbola.
50. Hyperbola is symmetric with respect to both the axes, since if (x, y) is
a point on the hyperbola. (-x, y), (x, -y) and (-x, -y) are also points on the
hyperbola.
51. The foci are always on the transverse axis. Denominator of positive
term gives the transverse axis.
52. Latus rectum of hyperbola is a line segment perpendicular to the
transverse axis through any of the foci and whose end points lie on the
hyperbola.
Key Formulae
1. The equation of a circle with centre (h, k) and the radius r is
(x – h)2 + (y –k)2 = r2.
2. If the centre of the circle is the origin O(0, 0), then the equation of the circle reduces to x2 + y2 = r2

3.
y2 = 4ax y
2 = - 4ax x
2 = 4ay x
2 = - 4ay
Coordinates of vertex
(0,0) (0,0) (0,0) (0,0)
Coordinates of focus
(a,0) (-a,0) (0, a) (0, -a)
Equation of the directrix
x = -a x = a y = -a y = a
Equation of the axis
y = 0 y = 0 x = 0 x = 0
Length of the Latus Rectum
4a 4a 4a 4a
4.

Coordinates of the centre (0, 0) (0, 0)
Coordinates of the vertices (a, 0) and (-a, 0) (0, +b) and (0, -b)
Coordinates of foci (ae, 0) and (-ae, 0) (0, be) and (0, -be)
Length of the major axis 2a 2b
Length of the minor axis 2b 2a
Equation of the major axis y = 0 x = 0
Equation of the minor axis x = 0 y = 0
Equations of the directrices
Eccentricity
2
2
c be 1
a a
2
2
c ae 1
b b
Length of the latus rectum 22b
a
22a
b
5.

2 2
2 2
x y1
a b
2 2
2 2
y x1
b a
Coordinates of the centre (0, 0) (0, 0)
Coordinates of the vertices
(a, 0) and (-a, 0) (0, b) and (0, -b)
Coordinates of foci
Length of the transverse axis
2a 2b
Length of the conjugate axis
2b 2a
Equations of the directrices
Eccentricity 2
2
c be 1
a a
2
2
c ae 1
b b
Length of the latus rectum
22b
a
22a
b
Equation of the transverse axis
y = 0 x = 0
Equation of the conjugate axis
x = 0 y = 0
Class-XI
Mathematics Three Dimensional Geometry
Chapter-12
Chapter Notes
Key Concepts
1. A point in space has three coordinates.
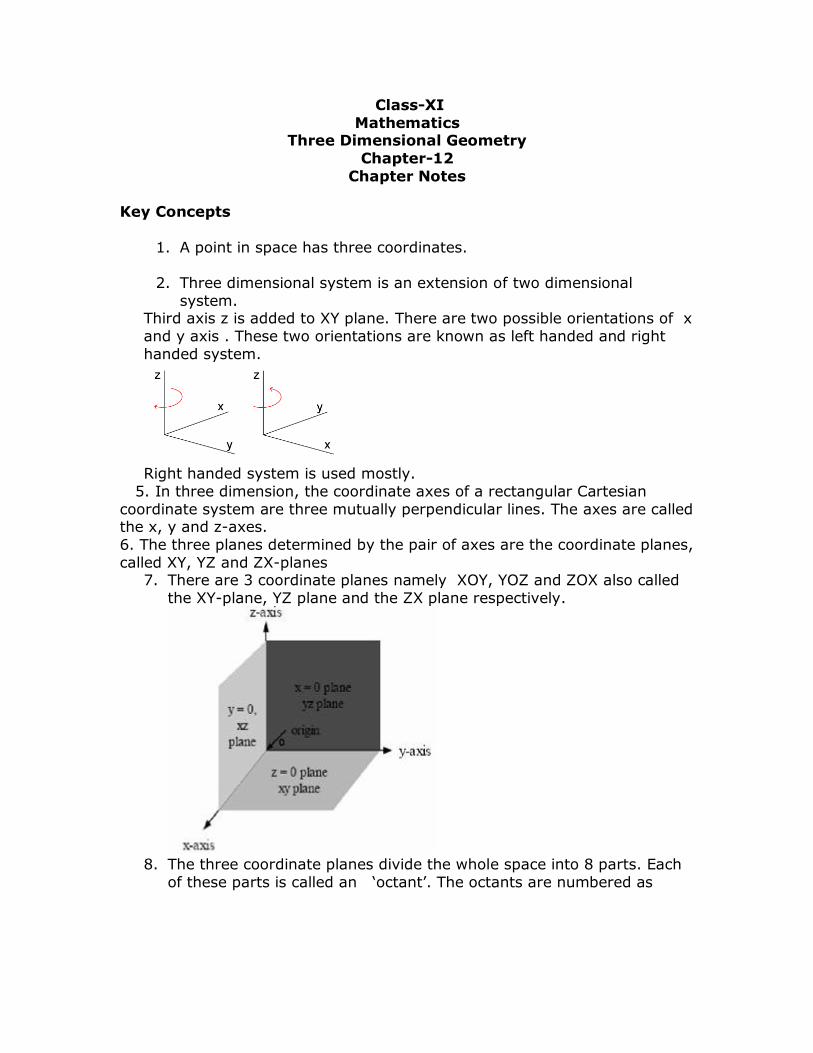
2. Three dimensional system is an extension of two dimensional
system. Third axis z is added to XY plane. There are two possible orientations of x
and y axis . These two orientations are known as left handed and right
handed system.
Right handed system is used mostly.
5. In three dimension, the coordinate axes of a rectangular Cartesian
coordinate system are three mutually perpendicular lines. The axes are called the x, y and z-axes.
6. The three planes determined by the pair of axes are the coordinate planes,
called XY, YZ and ZX-planes 7. There are 3 coordinate planes namely XOY, YOZ and ZOX also called
the XY-plane, YZ plane and the ZX plane respectively.
8. The three coordinate planes divide the whole space into 8 parts. Each
of these parts is called an ‘octant’. The octants are numbered as

roman numerals I,II,III ,… etc
9. To each point in space, there corresponds an ordered triplet
(x,y,z) of real numbers. There is a one to one correspondence
between the points in space and ordered triplet (x,y,z) of real numbers.
10.If P(x, y, z) is any point in space, then x, y and z are perpendicular
distances from YZ,ZX and XY planes.
11.The coordinates of the origin O are (0,0, 0).
12.The coordinates of any point on the x –axis are of the type (x,0,0).
The coordinates of any point on the y –axis are of the type (0,y,0). The coordinates of any point on the z –axis are of the type (0,0,z)
13. The x coordinate of the point in the YZ plane must be zero.A point in the XY plane will have its z coordinate zero
A point in the XZ plane will have its y coordinate zero.

14. Three points are said to be collinear if the sum of distances between any
two pairs of the points is equal to the distance between the third pair of points. Distance formula can be used to prove collinearity.
15. If we were dealing in one dimension then x=a is a single point and if it is
two dimensions then it will be a straight line and in 3 D it’s a plane || to YZ plane and passing through point a.
16. The distance of any point from the XY plane = | z coordinate | andsimilarly for the other 2 planes.
17.A line segment is trisected means it is divided into 3 equal parts by 2points R and S. This is equivalent to saying that either R or S divides the line
segment in the ratio 2:1 or 1:2.
Key Formulae
1.
Octants Coordinates
I II III IV V VI VII VIII
x + - - + + - - +
y + + - - + + - -
z + + + + - - - -
2. Distance between two points P(x1, y1, z1) and Q (x2, y2, z2) is given
by PQ 2 2 22 1 2 1 2 1(x x ) (y y ) (z z )
3. Distance between two points P(x1, y1, z1) and Q (0,0,0) is given by
PQ 2 2 21 1 1x y z
4. The coordinates of the point R which divides the line segment
joining two points P (x1y1z1) and Q (x2, y2, z2) internally and externally
in the ratio m : n are given by
2 1 2 1 2 1 2 1 2 1 2 1mx nx my ny mz na mx nx my ny mz nz, , and , ,
m n m n m n m n m n m n
5. The coordinates of the mid-point of the line segment joining two points
P(x1, y1, z1) and Q(x2, y2, z2) are 1 2 1 2 1 2x x y y z z, , .
2 2 2

6. The coordinates of the centroid of the triangle, whose vertices are
(x1, y1, z1) (x2, y2, z2) and (x3, y3, z3) are
1 2 3 1 2 3 1 2 3x x x y y y z z z, , .
3 3 3
7. The coordinates of the point R which divides the line segment joining twopoints P (x1, y1, z1) and Q (x2, y2, z2) in the ratio k:1 are
2 1 2 1 2 1kx x ky y kz z, ,
1 k 1 k 1 k

1
Class XI: Math
Chapter 13: Limits and Derivatives
Chapter Notes
Key-Concepts
1. The expected value of the function as dictated by the points to the leftof a point defines the left hand limit of the function at that point.
x alimf(x)
is the expected value of f at x =a given the values of f near x to the left of
a
2. The expected value of the function as dictated by the points to theright of point a defines the right hand limit of the function at that point.
x alim f(x)
is the expected value of f at x =a given the values of f near x to
the left of a.
3. Let y = f(x) be a function. Suppose that a and L are numbers such that
as x gets closer and closer to a, f(x) gets closer and closer to L we say that the limit of f(x) at x =a is L i.e
x alimf(x) L
.
4. Limit of a function at a point is the common value of the left and right
hand limit, if they coincide. i.e x alimf(x)
= x alim f(x)
.
5. Real life Examples of LHL and RHL
(a) If a car starts from rest and accelerates to 60 kms/hr in 8 seconds,
means initial speed of the car is 0 and reaches 60 at 8 seconds after the start.

2
On recording the speed of the car we can see that this sequence of numbers
is approaching 60 in such a way that each member of the sequence is less than 60. This sequence illustrates the concept of approaching a number from
the left of that number.
(b) Boiled Milk at 100 degrees is placed on a shelf; temperature goes on
dropping till it reaches room temperature. As time increases, temperature of milk, t approaches room temperature say
30o .This sequence illustrates the concept of approaching a number from the
right of that number.
6. Let f and g be two functions such that both x alim f(x)
and x alim g(x)
exists
then
a) Limit of sum of two functions is sum of the limits of the functions, i.e.,
x a x a x alim [f(x) g(x)] lim f(x) lim g(x)
b) Limit of difference of two functions is difference of the limits of the
functions i.e.,
x a x a x alim [f(x) g(x)] lim f(x) lim g(x)
c) Limit of product of two functions is product of the limits of the
functions, i.e.,
x a x a x alim [f(x).g(x)] lim f(x).lim g(x)
d) Limit of quotient of two functions is quotient of the limits of the
functions (whenever the denominator is non zero), i.e.,
x a
x a
x a
lim f(x)f(x)lim
g(x) lim g(x)
7. For any positive integer n,
n nn 1
x a
x alim na
x a
8. Limit of polynomial function can be computed using substitution or Algebra
of Limits.
9. For computing the limit of a Rational Function when direct substitution fails
then use factorisation , rationalization or the theorem .

3
10. Let f and g be two real valued functions with the same domain such that
f(x) ≤ g(x) for all x in the domain of definition. For some a, if both x alim f(x)
and x alim g(x)
exist, then x a x alim f(x) lim g(x)
.
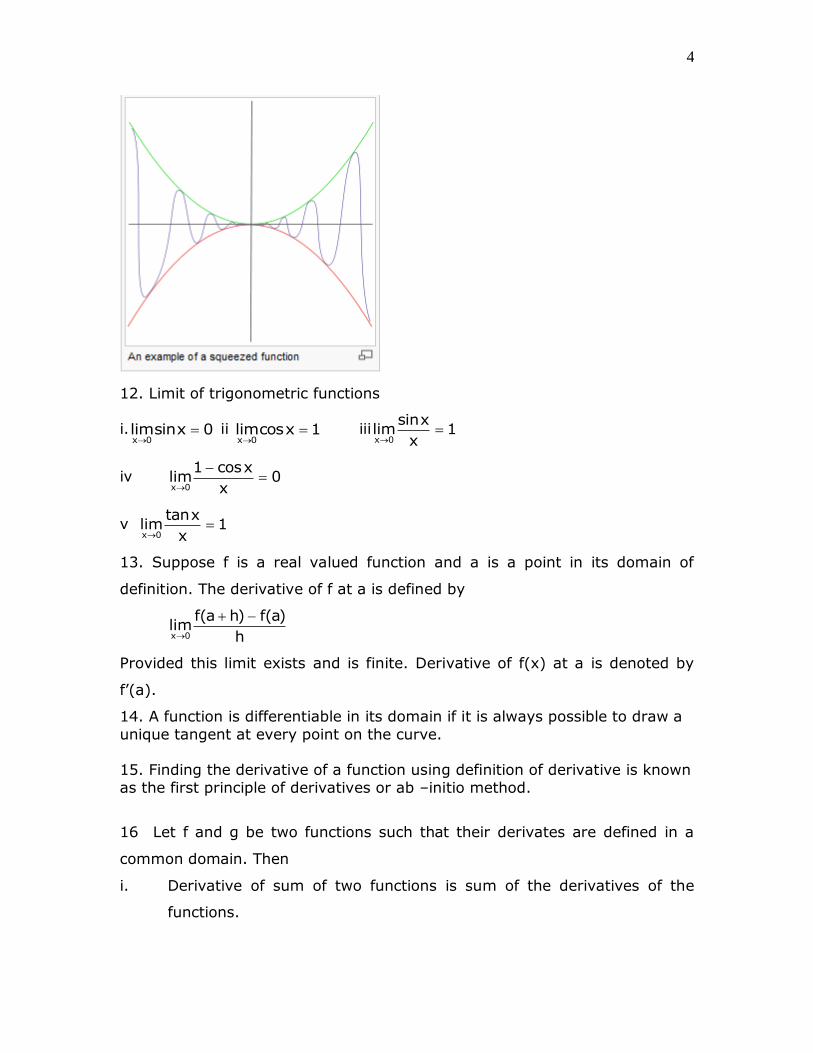
11. Let f, g and h be real functions such that f(x) ≤ g(x) ≤ h(x) for all x in
the common domain of definition. For some real number a, if x alim
f(x) = ℓ=
x alim
h(x), then x alim
g(x) = ℓ.
R T
F
Rational
Functions
4
12. Limit of trigonometric functions
i.x 0limsinx 0
ii x 0limcosx 1
iiix 0
sinxlim 1
x
iv x 0
1 cosxlim 0
x
v x 0
tanxlim 1
x
13. Suppose f is a real valued function and a is a point in its domain of
definition. The derivative of f at a is defined by
x 0
f(a h) f(a)lim
h
Provided this limit exists and is finite. Derivative of f(x) at a is denoted by
f’(a).
14. A function is differentiable in its domain if it is always possible to draw a
unique tangent at every point on the curve.
15. Finding the derivative of a function using definition of derivative is known
as the first principle of derivatives or ab –initio method.
16 Let f and g be two functions such that their derivates are defined in a
common domain. Then
i. Derivative of sum of two functions is sum of the derivatives of the
functions.

5
d d df(x) g(x) f(x) g(x)
dx dx dx
ii. Derivative of difference of two functions is difference of the derivatives
of the functions.
d d df(x) g(x) f(x) g(x)
dx dx dx
iii. Derivative of product of two functions is given by the following
products rule.
d d df(x).g(x) f(x).g(x) f(x). g(x)
dx dx dx
iv. Derivative of quotient of two functions is given by the following
quotient rule (whenever the denominator is non – zero).
2
d df(x).g(x) f(x) g(x)
d f(x) dx dxdx g(x) (g(x))
17. Derivative of f(x) = xⁿ is nxn-1 for any positive integer n.
18. Let f(x) = anxn-1 + (n-1)an-1x
n-2+…+2a2x+a1.
a2x are all real numbers and an ≠ 0. Then, the derivative functions is given
by
n 1 n 2
n n 1 2 1
df(x)na x (n 1)a x 2a x a .
dx
19. For a function f and a real number a, x alim f(x)
and f(a) may not be same
(In fact, one may be defined a d not the other one).
20. Standard Derivatives
f(x) f’(x)
sin x cos x
cos x - sin x
tan x sec2x
cot x - cosec2x
sec x sec x tan x
cosec x - cosec x
cot x
xn nxn-1
c 0
21. The derivative is the instantaneous rate of change in terms of Physics
and is the slope of the tangent at a point.

6
22 A function is not differentiable at the points where it is not defined or at
the points where the unique tangent cannot be drawn.
23. ' 'dy df(x)f (x) , , , y
dx dx are all different notations for the derivative
w.r.t x
1
Class XI
Mathematics
Chapter:14 Mathematical Reasoning
Chapter Notes
Key Concepts
1. There are two types of reasoning the deductive and inductive.
Deductive reasoning was developed by Aristotle, Thales,
Pythagoras in the classical Period (600 to 300 B.C.).
2. In deduction, given a statement to be proven, often called a
conjecture or a theorem, valid deductive steps are derived and a proof
may or may not be established. Deduction is the application of a
general case to a particular case.
3. Inductive reasoning depends on working with each case, and
developing a conjecture by observing incidence till each and every
case is observed.
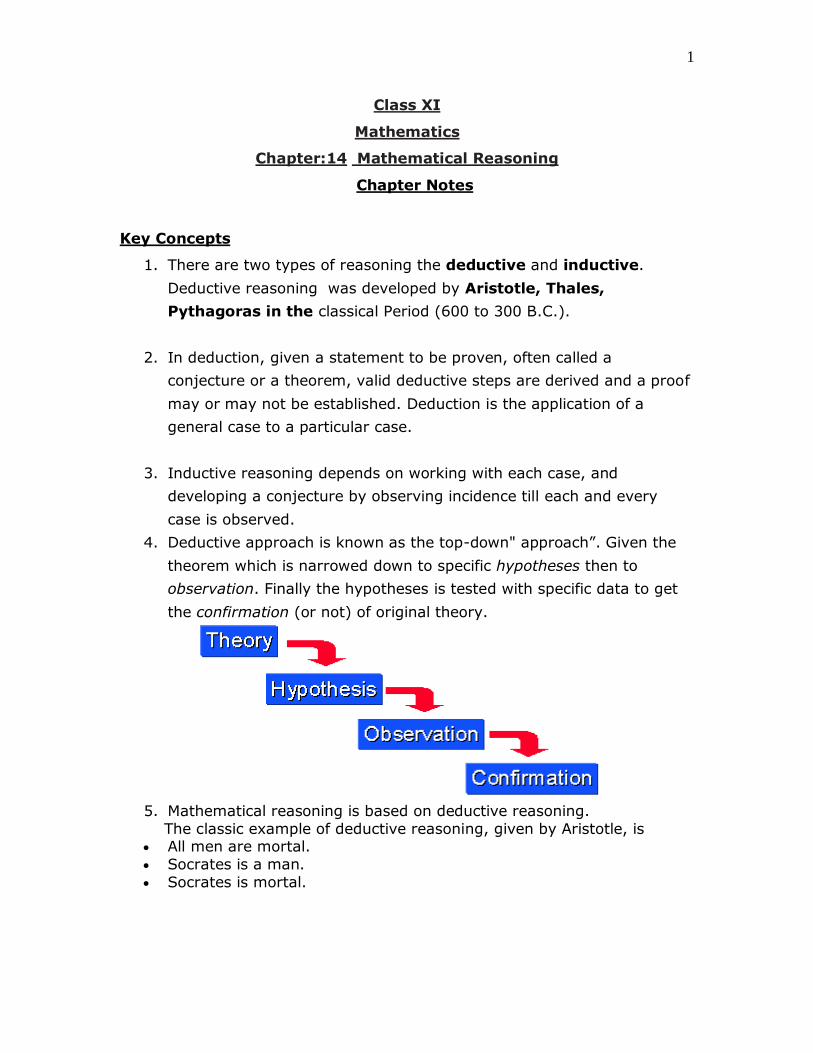
4. Deductive approach is known as the top-down" approach”. Given the
theorem which is narrowed down to specific hypotheses then to
observation. Finally the hypotheses is tested with specific data to get
the confirmation (or not) of original theory.
5. Mathematical reasoning is based on deductive reasoning.
The classic example of deductive reasoning, given by Aristotle, is All men are mortal.
Socrates is a man.
Socrates is mortal.

2
6. The basic unit involved in reasoning is mathematical statement.
7. A sentence is called a mathematically acceptable statement if it is
either true or false but not both. A sentence which is both true and
false simultaneously is called a paradox.
8. Sentences which involve tomorrow, yesterday, here, there etc i.e
variables etc are not statements.
9. The sentence expresses a request, a command or is simply a question
are not statements.
10.The denial of a statement is called the negation of the statement.
11.Two or more statements joined by words like “and” “or” are called
Compound statements. Each statement is called a component statement. “and” “or” are connecting words.
12.An “ And” statement is true if each of the component statement is trueand it is false even if one component statement is false.
13.An “OR” statement is will be true when even one of its components istrue and is false only when all its components are false
14.The word “OR” can be used in two ways (i) Inclusive OR (ii) Exclusive
OR. If only one of the two options is possible then the OR used is Exclusive OR.
If any one of the two options or both the options are possible then the
OR used is Inclusive OR.
15.There exists “” and “For all” are called quantifiers.
16.A statement with quantifier “There exists” is true, if it is true for at
least one case.
17.If p and q are two statements then a statement of the form 'If p then
q' is known as a conditional statement. In symbolic form p implies q is denoted by p q.
18.The conditional statement p q can be expressed in the various
other forms:
(i) q if p (ii) p only if q (iii) p is sufficient for q (iv) q is necessary for
p.
19. A statement formed by the combination of two statements of the form
if p then q and if q then p is p if and only if q. It is called biconditional
statement.

3
20. Contrapositive and converse can be obtained by a if then statement
The contrapositive of a statement p q is the statement q p
The converse of a statement p q is the statement q p
21. Truth values of various statement
p q p and q p or q pq
T T T T T
T F F T F
F T F T T
F F F F T
22. Two prove the truth of an if p- then q statement . there are two ways :
the first is assume p is true and prove q is true. This is called the direct
method. Or assume that q is false and prove p is false. This is called the
Contrapositive method.
23. To prove the truth of “ p if and only if q” statement , we must prove twothings , one that the truth of p implies the truth of q and the second that the
truth of q implies the truth of p.
24. The following methods are used to check the validity of statements:
(i) Direct method
(ii) Contra positive method (iii) Method of contradiction
(iv) Using a counter example
25. To check whether a statement p is true , we assume that it is not true,
i.e. p is true . Then we arrive at some result which contradicts our
assumption.

1
XI: Math
Chapter 15: Statistics
Chapter Notes
Key Concepts
1. Statistics deals with collection presentation, analysis and interpretation of
the data.
2. Data can be either ungrouped or grouped. Further, grouped data could be
categorized into: (a) Discrete frequency distribution,
(b) Continuous frequency distribution.
3. Data can be represented in the form of tables or in the form of graphs.
Common graphical forms are: Bar charts,pie diagrams, histograms,
frequency polygons ogives, etc.
4. First order of comparison for the given data is the measures of central
tendencies. Commonly used measures are (i) Arithmetic mean (ii) Median(iii)
Mode.
5. Arithmetic mean or simply mean is the sum of all observations divided by
the number of observations. It cannot be determined graphically. Arithmetic
mean is not a suitable measure in case of extreme values in the data.
6. Median is the measure which divides the data in two equal parts. The
median is the middle term when the data is sorted.
Incase of odd observations the middle observation is median. In case of
even observations the median is the average of the two middle observations.

2
7. Median can be determined graphically. It does not take into account all the
observations.
8. The mode is the most frequently occurring observation. For a frequency
distribution mode may or may not be defined uniquely.
9. Measures of central tendencies namely mean, median and mode provide
us with a single value which is the representative of the entire data. These
three measures try to condense the entire data into a single central value
10. Central tendencies indicate the general magnitude of the data.
11. Two frequency distributions may have same central value but still they
have different spread or they vary in their variation from central position. So
it is important to study how the other observations are scattered around this
central position.
12. Two distributions with same mean can have different spread as shown
below.
13. Variability or dispersion captures the spread of data. Dispersion helps us
to differentiate the data when the measures of central tendency are the same.
14. Like ‘measures of central tendency’ gives a single value to describe the
magnitude of data. Measures of dispersion gives a single value to describe variability.

3
15. The dispersion or scatter of a dataset can be measured from twoperspectives:
(i) Taking the order of the observations into consideration, two
measures are
(a) Range (b) Quartile deviation
(ii)Taking the distance of each observation from the central position, yields
two measures, (a) Mean deviation, (b) Variance and Standard deviation
The greater the range is for a data, its observations are far more scattered than the one whose range is smaller.
17. The range at best gives a rough idea of the variability or scatter.
18. Quartile divides the data into 4 parts. There are three quartiles namely Q1
Q2 Q3 and Q2 is the median only.
19. The quartile deviation is one-half of the difference between the upper
quartile and the lower quartile.
20. If x1, x2, … xn are the set of points and point a is the mean of the data.
Then the quantity xi –a is called the deviation of xi from mean a. Then the
sum of the deviations from mean is always zero.
21.In order to capture average variation we must get rid of the negative
signs of deviations.
There are two remedies
Remedy I: take the Absolute values of the deviations.
Remedy II: take the squares of the deviation.
16. Range is the difference between the highest and the lowest observation
in the given data.

4
22. Mean of the absolute deviations about a gives the ‘mean deviation abouta’, where a is the mean. It is denoted as M.D. (a). Therefore,
M.D.(a) = Sum of absolute values of deviations from the mean 'a ' divided by
the number of observations. Mean deviation can be calculated about median
or mode or any other observations.
23. Merits of mean deviation
(1) It utilizes all the observations of the set. (2) It is least affected by the extreme values.
(3) It is simple to calculate and understand.
24. Mean deviation is the least when calculated about the median.
If the variations between the values is very high, then the median will not be
an appropriate central tendency representative.
.
25. Limitations of Mean Deviation
i)The foremost weakness of mean deviation is that in its calculations,negative differences are considered positive without any sound reasoning
ii) It is not amenable to algebraic treatment.
(iii) It cannot be calculated in the case of open end(s) classes in the
frequency distribution.
26. Measure of variation based on taking the squares of the deviation iscalled the variance.
27. Let the observations are x1, x2, x3,..,xn
let mean = x
Squares of deviations: 2 d ( ) i ix x
Case 1: The sum di is zero. This will imply that all observations are equal to
the mean x bar. Case 2: The sum di is relatively small. This will imply that there is a lower
degree of dispersion. And case three
Case 3: The sum di is large. There seems to be a high degree of dispersion.
28. Variance is given by the mean of squared deviations. If variance is small
the data points are clustering around mean otherwise they are spread across.
29. Standard deviation is simply expressed as the positive square root of
variance of the given data set. Standard deviation of the set of observations

5
does not change if a non zero constant is added or subtracted from each
bservations. 30. Variance takes into account the square of the deviations.
Hence, the unit of variance is in square units of observations.
For standard deviation, its units are the same as that of the observations.
Thats the reason why standard deviation is preferred over variance.
31. Standard deviation can help us compare two sets of observations bydescribing the variation from the "average" which is the mean.Its widely
used in comparing the performance of two data sets. Such as two cricket
matches or two stocks. In Finance it is used to access the risk associated with a particular mutual
fund.
32. Merits of Standard deviationi) It is based on all the observations.
(ii) It is suitable for further mathematical treatments.
(iii) It is less affected by the fluctuations of sampling.
33. A measure of variability which is independent of the units is called as
coefficient of variation. Denoted as C.V. It is given by the ratio of σ the standard deviation and the mean x bar of the
data.
34. It is useful for comparing data sets with different units, and wildlyvarying means. But mean should be non zero. If mean is zero or even if it is
close to zero the Coefficient of Variation fails to help.
35. Coefficient of Variation-a dimensionless constant that helps compares thevariability of two observations with same or different units.
Key Formulae
1. Arithmetic mean
(a) Raw data
(b) Discrete data
(c) Step Deviation Method:

6
2. Median
(a)
(b) Median= l +
n-cf
2 × hf
Where, l= the lower limit of median class.
cf = the cumulative frequency of the class preceding the median class.
f = the frequency of the median class. h =the class size
3. Mode for a grouped data is given by
Mode= l + 1 0
1 0 2
f -f×h
2f -f -f
l = lower limit of the modal class h = size o f the class interval
1f = frequency of the modal class
0f =frequency of the class preceding the modal class
2f = frequency of the class succeeding the modal class
3. Mean Deviation about mean
n
i ni l
i ini l
ii=l
x1
M.D.(x) x xN
4. Mean Deviation about median n
i ii l
1M.D.(M) x M
N
5. Variance
(a)for ungrouped data 2
i2 i
(x x)
n

7
(b) For grouped data 2
i i2 i
f(x x)
n
6. Standard Deviations
(a) For ungrouped data 2
i(x -x )
n
(b) For grouped data2
2i i
i l
1f(x x)
N
where x is the mean of
the distribution and n
ii=l
N = ƒ .
(c) Short Cut Method 2n n
2i i i i
i l i l
hN fy fy
N
7. Coefficient of Variation: C.V. 100,x 0,x

1
Class XI: Math
Chapter: Probability Chapter Notes
Key Concepts
1. The theory of probability is a branch of mathematics that deals with
uncertain or unpredictable events. Probability is a concept that gives a
numerical measurement for the likelihood of occurrence of an event.
2. An act which gives some result is an experiment.
3. A possible result of an experiment is called its outcome.
4. The sample space S of an experiment is the set of all its outcomes.
Thus, each outcome is also called a sample point of the experiment
5. An experiment repeated under essentially homogeneous and similar
conditions may result in an outcome, which is either unique or not unique but one of the several possible outcomes.
6. An experiment is called random experiment if it satisfies the following
two conditions: (i) It has more than one possible outcome.
(ii) It is not possible to predict the outcome in advance.
7. The experiment that results in a unique outcome is called a
deterministic experiment.
8. Sample space is a set consisting of all the outcomes, its cardinality is
given by n(S).
9. Any subset ‘E’ of a sample space for an experiment is called an event.
10.The empty set and the sample space S describe events. In fact is
called an impossible event and S, i.e., the whole sample space is called
the sure event.
11.Whenever an outcome satisfies the conditions, given in the event, wesay that the event has occurred
12.If an event E has only one sample point of a sample space, it is calleda simple (or elementary) event. In the experiment of tossing a coin,
the sample space is {H,T}and the event of getting a {H} or a {T}is a
simple event.

2
13.A subset of the sample space, which has more than on element is
called a compound event. In throwing a dice, the event of appearing of odd numbers is a compound event, because E={1,3,5} has '3' sample
points or elements in it.
14.Events are said to be equally likely, if we have no reason to believethat one is more likely to occur than the other. The outcomes of an
unbiased coin are equally likely.
15.Probability of an event E, is the ratio of happening of the number of element in
the event to the number of elements in the sample space.
(i) P(E) = n(E)
n(S) (ii) 0P(E) 1
16.Independent Events: Two or more events are said to be independent if
occurrence or non-occurrence of any of them does not affect the probability of occurrence or non-occurrence of the other event.
17.The complement of an event A, is the set of all outcomes which are
not in A (or not favourable to) A. It is denoted by A’ .
18.Events Aand B are said to be mutually exclusive if and only if they
have no elements in common.
19.When every possible outcome of an experiment is considered, the
events are called exhaustive events.
Events E1, E2,..., En are mutually exclusive and exhaustive if E1 E2….En = S and Ei ∩ Ej = φ, for every distinct pair of events.
20. When the sets A and B are two events associated with a samplespace, then ‘A B’ is the event ‘either A or B or both.
Therefore Event ‘ A or B’ = A B = {: A or B}

3
21.If A and B are events, then the event 'A and B' is defined as the set of
all the outcomes which are favourable to both A and B, i.e. 'A and B' is
the event A B. This is represented diagrammatically as follows
22. If A and B are events, then the event 'A - B' is defined to be the set ofall outcomes which are favourable to a but not to B. A - B = = A B’ = { x:
x A and x B}
This is represented diagrammatically as:
23. If S is the sample space of an experiment with n equally likely outcomes S= {w1, w2,w3,----wn} then P(w1) = P(w2) = P(wn) = n
n
ii 1
P(w )
= 1
So P(wn) = 1/n
24. Let S be the sample space of a random experiment. The probability P is a
real valued function with domain the power set of S and range the interval [0,1] satisfying the axioms that
(i) For any event E, P (E) is greater than or equal to 1.
(ii) P (S) = 1 (iii) Number P (ωi) associated with sample point ωi such that

4
i0 P( ) 1
25. Addition Theorem of probability If ‘A’ and ‘B’ be any two events, thenthe probability of occurrence of at least one of the events ‘A’ and ‘B’ is given
by:
P(AB) = P(A) + P(B) – P (A B)
(a) If A and B are mutually exclusive events then
P(A B) = P(A) + P(B)
26. Addition Theorem for 3 events
P(AUBUC) =P(A)+P(B)+P(C)-P(AB)-P(BC)-P(AC)+P(ABC)
27. If ‘E’ is any event and E’ be the complement of event ‘E’, then
P(E’) = 1 - P(E)
28. Probability of difference of events: Let A and B be events.
Then, P(A - B) = P(A) - P(A B)
29. Addition theorem in terms of difference of events:
P(A B) = P(A-B)+P(B-A)+ P(A B)