Embed Size (px)
Citation preview

XWages and working conditions in the coffee sector: the case of Costa Rica, Ethiopia, India, Indonesia and Viet Nam
Background note
by Luis Pinedo Caro

Wages and working conditions in the coffee sector: the case of Costa Rica, Ethiopia, India, Indonesia and Viet Nam
Background note
by Luis Pinedo Caro

Copyright © International Labour Organization 2020First published year 2020
Publications of the International Labour Office enjoy copyright under Protocol 2 of the Universal Copyright Convention. Nevertheless, short excerpts from them may be reproduced without authorization, on condition that the source is indicated. For rights of reproduction or translation, application should be made to ILO Publishing (Rights and Licensing), International Labour Office, CH-1211 Geneva 22, Switzerland, or by email: [email protected]. The International Labour Office welcomes such applications.
Libraries, institutions and other users registered with a reproduction rights organization may make copies in accordance with the licences issued to them for this purpose. Visit www.ifrro.org to find the reproduction rights organization in your country.
Wages and working conditions in the coffee sector: the case of Costa Rica, Ethiopia, India, Indonesia and Viet NamBackground noteGeneva: International Labour Office, December 2020ISBN 978-92-2-033986-2 (web PDF)
The designations employed in ILO publications, which are in conformity with United Nations practice, and the pre-sentation of material therein do not imply the expression of any opinion whatsoever on the part of the International Labour Office concerning the legal status of any country, area or territory or of its authorities, or concerning the delimitation of its frontiers.
The responsibility for opinions expressed in signed articles, studies and other contributions rests solely with their authors, and publication does not constitute an endorsement by the International Labour Office of the opinions expressed in them.
Reference to names of firms and commercial products and processes does not imply their endorsement by the International Labour Office, and any failure to mention a particular firm, commercial product or process is not a sign of disapproval.
Information on ILO publications and digital products can be found at: www.ilo.org/publns.Picture on cover © Panos Pictures (UK)Printed in Switzerland
Contents
Acknowledgements ...................................................................................................................................................v
Executive Summary ................................................................................................................................................ vii
1. Introduction ...................................................................................................................................................................1
2. Database description ..................................................................................................................................................2
3. Working conditions in the coffee sector ................................................................................................................4
3.1 Employment levels in the coffee sector ..............................................................................................................4
3.2 Socio-demographics of coffee workers ..............................................................................................................7
3.3 Structure of the workforce in the coffee sector ................................................................................................9
3.4 Earnings and hours worked in the coffee sector ............................................................................................10
3.5 Company size: Does it matter? ............................................................................................................................15
4. Conclusions ..................................................................................................................................................................17
References ........................................................................................................................................................................18
Appendices .......................................................................................................................................................................19
Acknowledgements
This background note is one of three in a research series on wages and working conditions in different sectors, including tea, coffee and banana. The reports seek to contribute to a better understanding of the prevailing wages and working conditions in these selected sectors to feed into the knowledge base for setting of adequate minimum wages, statutory or negotiated. These background notes are undertaken as part of an ILO project on Indicators and methodologies for wage setting supported by the Ministry of Foreign Affairs of the Netherlands. The project seeks to develop indicators and methodologies that will strengthen the capacity of governments and social partners to negotiate and set adequate wage levels, which take into account the needs of workers and their families along with economic factors. The project covers five pilot countries namely, Costa Rica, Ethiopia, India, Indonesia and Vietnam. This report has been prepared by Luis Pinedo Caro under the supervision of Nicolas Maitre.
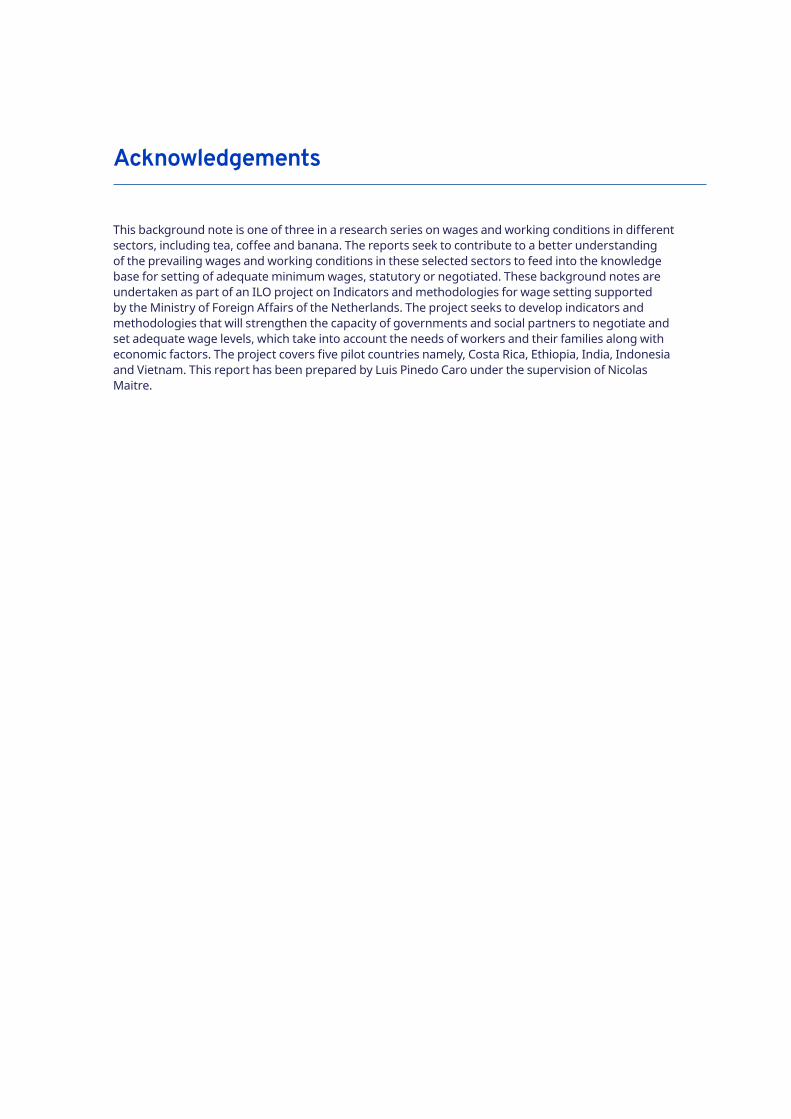
Executive Summary
This study provides estimates on wages, employment levels and hours worked in the coffee sector in five countries -all of them major coffee producers- namely, Costa Rica (15th largest producer), Ethiopia (5th), India (7th), Indonesia (4th) and Viet Nam (2nd). This study is based on the analysis of 33 household and labour force surveys from the 5 countries under review. Altogether, this report has used the responses of 165,388 coffee workers over the last two decades representing1 nearly 19 million workers.
1 After using the survey weights provided by the national statistical offices.
Some of the main estimates are the following:
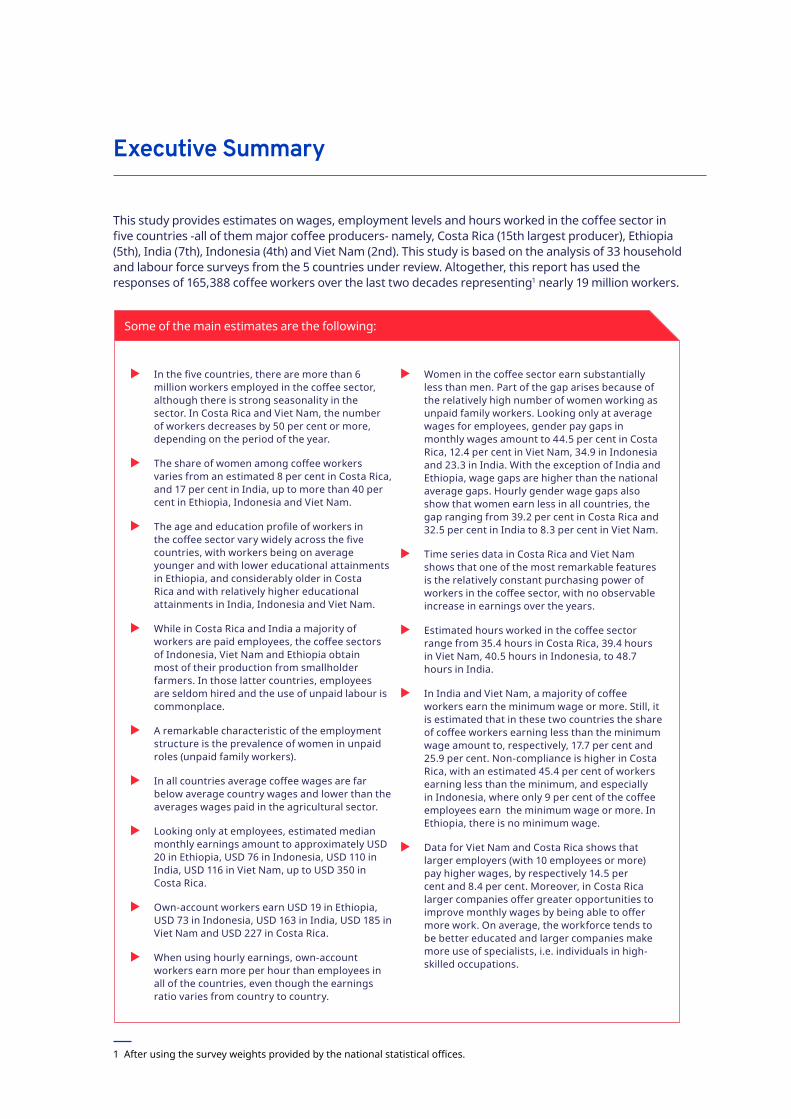
X In the five countries, there are more than 6 million workers employed in the coffee sector, although there is strong seasonality in the sector. In Costa Rica and Viet Nam, the number of workers decreases by 50 per cent or more, depending on the period of the year.
X The share of women among coffee workers varies from an estimated 8 per cent in Costa Rica, and 17 per cent in India, up to more than 40 per cent in Ethiopia, Indonesia and Viet Nam.
X The age and education profile of workers in the coffee sector vary widely across the five countries, with workers being on average younger and with lower educational attainments in Ethiopia, and considerably older in Costa Rica and with relatively higher educational attainments in India, Indonesia and Viet Nam.
X While in Costa Rica and India a majority of workers are paid employees, the coffee sectors of Indonesia, Viet Nam and Ethiopia obtain most of their production from smallholder farmers. In those latter countries, employees are seldom hired and the use of unpaid labour is commonplace.
X A remarkable characteristic of the employment structure is the prevalence of women in unpaid roles (unpaid family workers).
X In all countries average coffee wages are far below average country wages and lower than the averages wages paid in the agricultural sector.
X Looking only at employees, estimated median monthly earnings amount to approximately USD 20 in Ethiopia, USD 76 in Indonesia, USD 110 in India, USD 116 in Viet Nam, up to USD 350 in Costa Rica.
X Own-account workers earn USD 19 in Ethiopia, USD 73 in Indonesia, USD 163 in India, USD 185 in Viet Nam and USD 227 in Costa Rica.
X When using hourly earnings, own-account workers earn more per hour than employees in all of the countries, even though the earnings ratio varies from country to country.
X Women in the coffee sector earn substantially less than men. Part of the gap arises because of the relatively high number of women working as unpaid family workers. Looking only at average wages for employees, gender pay gaps in monthly wages amount to 44.5 per cent in Costa Rica, 12.4 per cent in Viet Nam, 34.9 in Indonesia and 23.3 in India. With the exception of India and Ethiopia, wage gaps are higher than the national average gaps. Hourly gender wage gaps also show that women earn less in all countries, the gap ranging from 39.2 per cent in Costa Rica and 32.5 per cent in India to 8.3 per cent in Viet Nam.
X Time series data in Costa Rica and Viet Nam shows that one of the most remarkable features is the relatively constant purchasing power of workers in the coffee sector, with no observable increase in earnings over the years.
X Estimated hours worked in the coffee sector range from 35.4 hours in Costa Rica, 39.4 hours in Viet Nam, 40.5 hours in Indonesia, to 48.7 hours in India.
X In India and Viet Nam, a majority of coffee workers earn the minimum wage or more. Still, it is estimated that in these two countries the share of coffee workers earning less than the minimum wage amount to, respectively, 17.7 per cent and 25.9 per cent. Non-compliance is higher in Costa Rica, with an estimated 45.4 per cent of workers earning less than the minimum, and especially in Indonesia, where only 9 per cent of the coffee employees earn the minimum wage or more. In Ethiopia, there is no minimum wage.
X Data for Viet Nam and Costa Rica shows that larger employers (with 10 employees or more) pay higher wages, by respectively 14.5 per cent and 8.4 per cent. Moreover, in Costa Rica larger companies offer greater opportunities to improve monthly wages by being able to offer more work. On average, the workforce tends to be better educated and larger companies make more use of specialists, i.e. individuals in high-skilled occupations.

1. Introduction
Coffee is one of the most traded products in the world, a truly global commodity that attracts attention from several economic actors. As such, information on exported quantities, consumption and price levels is commonplace and detailed studies can be found for several countries. Yet, not as much is known about wages and working conditions in producing countries. The International Labour Organization (ILO) has therefore embarked on a project aimed at improving the information on wages, employment levels and hours worked in the coffee sector to fill the existing knowledge gap, and to strengthen the ability of governments, social partners, and others to negotiate and set adequate wage levels in the sector. This study covers the five pilot countries of the project -all of them major coffee producers- namely, Costa Rica (15th largest producer),2 Ethiopia (5th), India (7th), Indonesia (4th) and Viet Nam (2nd).
TABLE 1. RANKING, TOP COFFEE PRODUCING COUNTRIES, 2018
Position, country Output (000’ Tons) Position, country Output (000’ Tons)
1. Brazil 3,744 6. Honduras 439
2. Viet Nam 1,801 7. India 360
3. Colombia 831 8. Uganda 282
4. Indonesia 600 9. Mexico 261
5. Ethiopia 452 15. Costa Rica 86
This study is based on the analysis of 33 household and labour force surveys from the 5 countries under review. These databases have provided useful time-series to explore and construct trends and to compare the current conditions in the coffee sector across countries. Altogether, this report has used the responses of 165,388 coffee workers over the last two decades representing3 nearly 19 million workers.
In addition to basic information on working conditions, the analysis of the post-harvest modules of the Ethiopian household survey allows us to obtain output figures as well as quantifying labour demand. More importantly, it provides a rather unique snapshot of the Ethiopian coffee sector, including its structure. Thanks to this dataset we are able to compare output figures and find that Ethiopia’s coffee production may be larger than expected due to a large number of farms cultivating coffee for their own consumption.
The report is divided into three sections. Section 2 describes the dataset and offers details on how coffee workers are identified in each country. Section 3 contains the core of the analysis and it is divided into five subsections. These describe the employment structure, some characteristics of the workers such as their age and education profile, their monthly and hourly wages and their hours worked. In addition, section 3.5 looks at company size and assesses whether scaling up businesses pays off for workers. At last, Section 4 concludes.
2 See ICO’s official figures at http://www.ico.org/prices/po-production.pdf. Costa is ranked 15th due to China’s expected output being estimated at 132,000 Tons for the 2018/2019 year, from statista.com.3 After using the survey weights provided by the national statistical offices.
Wages and working conditions in the coffee sector: the case of Costa Rica, Ethiopia, India, Indonesia and Viet NamBackground note 1

2. Database description
This study uses 33 household and labour force surveys from five countries, Costa Rica, Ethiopia, India, Indonesia, and Viet Nam. For more information regarding the data sources, Table A.1 in Appendix A provide a visual description of the type of survey, the exact years for which data have been collected and the periodicity (monthly, quarterly) of the data.
Given the numerous sources of data an effort is made to harmonize a number of variables in a way they can be used in a cross-country report. This harmonization has followed a similar process to the one found in the Labour Force Micro-dataset of the Global Employment Trends for Youth 2017 and 2020, both published by the ILO.
The complete list of harmonized variables can be retrieved from the database documentation which is available in the form of a separate Excel file. As a summary, variables concerning age, educational attainment, region, labour market status, status in employment, economic activity, occupation, hours worked, and earnings are included in the dataset. Even though the documentation provides an explanation for all the variables contained in the dataset we offer some additional details on how certain critical variables have been harmonized and the limitations/comparability issues that may exist across countries/datasets.
Seasonality. Coffee, as many other agricultural products, is highly seasonal. If we were to ask people on a random week whether they were involved or not in any coffee-related activity for at least an hour during the previous week, chances are we would either overestimate (during peak periods) or underestimate (off-season periods) both the average number of people involved and the average number of hours worked in such activity. This issue has been dealt with in this study by the generalization of quarterly or even monthly household and labour force surveys; the higher periodicity has allowed us to calculate more accurate yearly averages and to better understand the effects of seasonality on workers’ working conditions.
The labour force surveys of Costa Rica (2010-2018), Viet Nam (2011-2018) and India (2000, 2005 and 2012) are all carried out either quarterly or monthly and, thus, estimates from these surveys should not suffer from seasonality bias. However, estimates from the Costa Rican household survey (2001-2009), the Ethiopian household survey (2016) and the Indonesian labour force survey (2007, 2010 and 2018) are all based on interviews that took place during the third quarter of the year (Costa Rica, Indonesia) or during the first quarter (Ethiopia). Having a single quarter may not produce a major distortion in Indonesia because the country has two harvesting seasons, July-September in the island of Java and November-January in Sumatra,4 i.e. they may compensate each other. However, in Costa Rica and Ethiopia employment figures are expected to be underestimated.
Identifying coffee workers in Indonesia. Indonesia follows the KBLI5 2005 (2007 and 2010 LFS) and the KBLI 2015 (2018 LFS) to assign economic activities to workers. These two classifications are adapted from, respectively, the International Standard Industrial Classification of All Economic Activities (ISIC) rev.3 and rev.4. In both cases coffee has been placed together with tea, mate, and cocoa (code 1135 in the KBLI 2005 and 1270 in the KBLI 2015). In order to isolate coffee workers, we follow a geographical identification strategy based on the provincial distribution of each product’s area planted. As a result of comparing the areas planted, coffee was found to be the leading product in 13 Indonesian provinces and all labour involved in the coffee, tea or cocoa activities of those provinces was assigned to the coffee sector. We can expect a 73.5 per cent accuracy in the matching, i.e. roughly 3 out of 4 identified workers are actual coffee workers.
Identifying coffee workers in Ethiopia. The harmonization of employment figures in the Ethiopian household survey goes beyond finding an activity code and needs to be described in detail. The main issue is brought by economic activities not being disaggregated beyond some broad groups. For example, all agricultural activities are put together, thus, not allowing us to identify coffee
4 See Appendix C for information on the season duration in each of the 5 countries of the study.5 Klasifikasi Baku Lapangan Usaha Indonesia, Indonesian Standard Industrial Classification.
Wages and working conditions in the coffee sector: the case of Costa Rica, Ethiopia, India, Indonesia and Viet NamBackground note2
workers. In order to circumvent this problem we use the so-called “Post-Harvest” modules of the survey; a set of questions directed at every smallholder farm about their agricultural production. Thanks to these modules we can identify coffee farms and distinguish among employers, own-account workers and unpaid family workers based on the characteristics of the farm and the workers’ responsibilities within the farm.
Unfortunately, the above-described strategy does not solve the problem of identifying labourers (i.e. employees) in the coffee sector. In order to have an estimate on the number of people employed by the farms, their wages or the characteristics of those employed we use the Ethiopian Household Survey as if it were an enterprise survey. Based on the information reported by each farm with respect to how many people were hired during the last harvesting season we are able to collect average wages as well as the number of (paid) labourers hired. In both instances the information comes disaggregated by gender and by age group. There are two caveats with respect to how to interpret this information; first, labourers may have been counted more than once since some of them may be going from farm to farm during the harvesting period. In this sense, the number of workers cannot be compared to figures from other countries. Second, the information collected from the farms refers to the harvesting period, i.e. it is an overestimation of the average number of people the sector may be actually providing a job.
Assigning status in employment in Ethiopia. A recurrent issue when assigning statuses in employment to smallholder farmers is related to the own-account/unpaid family worker dichotomy. Usually women and children tend to be labelled unpaid family workers while men tend to hold the own-account worker title. In Ethiopia we used the households’ own responses with respect to who in the household was responsible for coffee parcels when assigning these statuses. As a result, every person named as responsible of at least 1 parcel was assigned own-account worker status -usually the husband and the wife. The rest of the household members -if working in agricultural activities- are given an unpaid family worker status. Even though the results (see Figure 5) shows a much more balanced gender split of statuses in employment than in other countries we did not make any attempt to re-balance it as the criteria used seems to do justice to family members’ self-reported managerial roles.
Earnings. Data on earnings exist for all five countries -with some limitations.6 The most challenging dataset is, again, Ethiopia. Smallholder farms are not asked about their average monthly profit -as it is done in other surveys. Instead, they report how much coffee is produced, how much coffee they have already sold, the price at which they sell it and the percentage of coffee they plan to sell (out of their total production). Farmers that do not sell and do not expect to sell coffee (own consumption only) are not considered employed even if they carried out farm activities during the reference week. For those that had already sold some coffee the earnings were calculated by multiplying the price per kilo received by the amount of output that is for sale. In the event farmers expect to sell some coffee but have not done so yet, an average price calculated at the region level and is applied to calculate their expected yearly earnings. Then, the earnings are divided by 12 so that the figure can be compared to the ones from other countries.
To facilitate the comparability across countries and years, earnings were deflated/inflated to 2011 using the World Bank’s inflation rates. Then, all local currencies were converted to $USD using the exchange rate that prevailed in 2011 and inflated to 2020 using, again, World Bank inflation rates. All figures shown in this report are, thus, provided in 2020 $USD. Last but not least, the reader may notice that even in the countries where employer’s earnings are available, they are seldom reported throughout the report. This has to do with the small sample size usually surrounding this group of workers.
6 India 2000 and Viet Nam 2011-2014 only provide earnings for employees. Indonesia does not provide earnings for employers.
Wages and working conditions in the coffee sector: the case of Costa Rica, Ethiopia, India, Indonesia and Viet NamBackground note 3
3.1 Employment levels in the coffee sector
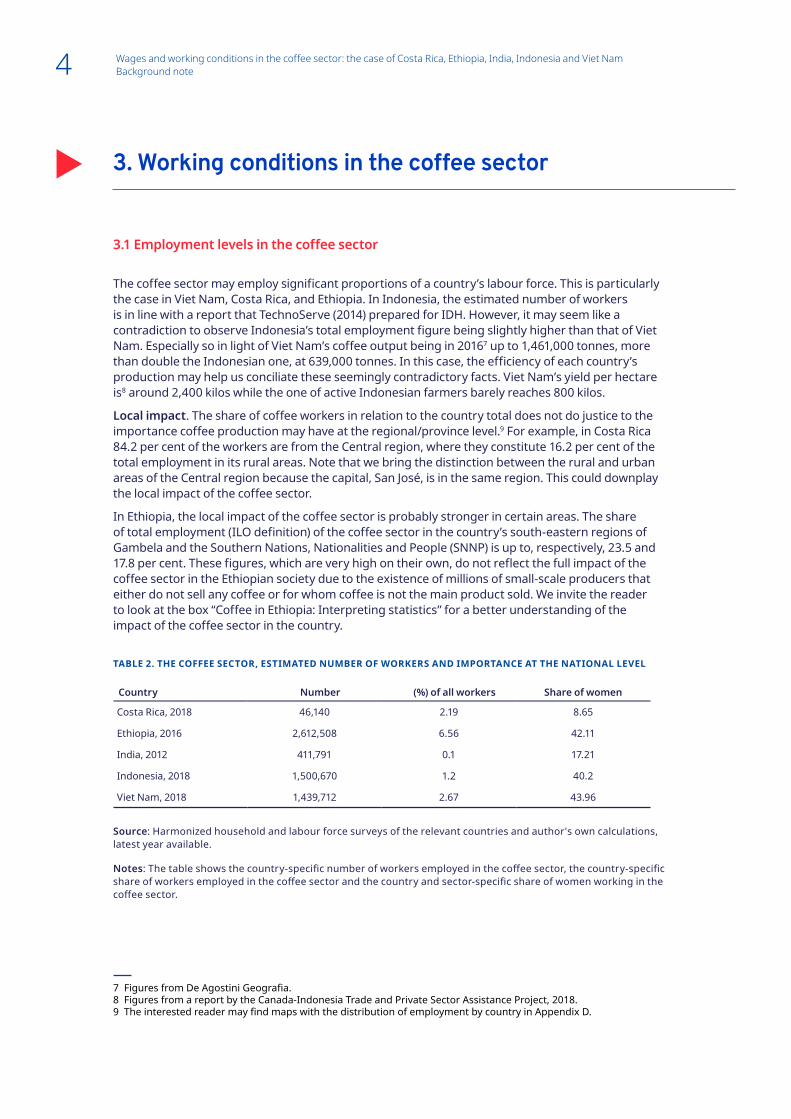
The coffee sector may employ significant proportions of a country’s labour force. This is particularly the case in Viet Nam, Costa Rica, and Ethiopia. In Indonesia, the estimated number of workers is in line with a report that TechnoServe (2014) prepared for IDH. However, it may seem like a contradiction to observe Indonesia’s total employment figure being slightly higher than that of Viet Nam. Especially so in light of Viet Nam’s coffee output being in 20167 up to 1,461,000 tonnes, more than double the Indonesian one, at 639,000 tonnes. In this case, the efficiency of each country’s production may help us conciliate these seemingly contradictory facts. Viet Nam’s yield per hectare is8 around 2,400 kilos while the one of active Indonesian farmers barely reaches 800 kilos.
Local impact. The share of coffee workers in relation to the country total does not do justice to the importance coffee production may have at the regional/province level.9 For example, in Costa Rica 84.2 per cent of the workers are from the Central region, where they constitute 16.2 per cent of the total employment in its rural areas. Note that we bring the distinction between the rural and urban areas of the Central region because the capital, San José, is in the same region. This could downplay the local impact of the coffee sector.
In Ethiopia, the local impact of the coffee sector is probably stronger in certain areas. The share of total employment (ILO definition) of the coffee sector in the country’s south-eastern regions of Gambela and the Southern Nations, Nationalities and People (SNNP) is up to, respectively, 23.5 and 17.8 per cent. These figures, which are very high on their own, do not reflect the full impact of the coffee sector in the Ethiopian society due to the existence of millions of small-scale producers that either do not sell any coffee or for whom coffee is not the main product sold. We invite the reader to look at the box “Coffee in Ethiopia: Interpreting statistics” for a better understanding of the impact of the coffee sector in the country.
TABLE 2. THE COFFEE SECTOR, ESTIMATED NUMBER OF WORKERS AND IMPORTANCE AT THE NATIONAL LEVEL
Country Number (%) of all workers Share of women
Costa Rica, 2018 46,140 2.19 8.65
Ethiopia, 2016 2,612,508 6.56 42.11
India, 2012 411,791 0.1 17.21
Indonesia, 2018 1,500,670 1.2 40.2
Viet Nam, 2018 1,439,712 2.67 43.96
Source: Harmonized household and labour force surveys of the relevant countries and author's own calculations, latest year available.
Notes: The table shows the country-specific number of workers employed in the coffee sector, the country-specific share of workers employed in the coffee sector and the country and sector-specific share of women working in the coffee sector.
7 Figures from De Agostini Geografia.8 Figures from a report by the Canada-Indonesia Trade and Private Sector Assistance Project, 2018.9 The interested reader may find maps with the distribution of employment by country in Appendix D.
3. Working conditions in the coffee sector
Wages and working conditions in the coffee sector: the case of Costa Rica, Ethiopia, India, Indonesia and Viet NamBackground note4

Even though India ranks 7th in terms of coffee production with 348,000 tonnes in 2016, the size of the country prevents almost any activities from becoming relevant even at the local level. The only exception is Karnataka, where 82.3 per cent of the Indian coffee workers are employed. But even in this state coffee only represents 1.5 per cent of the total employment, and 2.2 per cent of the employment in rural areas.
In terms of local impact we may observe the exact opposite in Viet Nam; the Central Highlands region not only employs 91.7 per cent of all the coffee workers of the country and produces most of Viet Nam’s coffee, it also provides an employment opportunity to 37.3 per cent of all the workers in the region. The local importance of coffee in the Central Highlands’ provinces has made the region earn the label of the “Kingdom of Coffee” thanks to fertile earth and the optimal altitude and climate.
Indonesia offers a different picture; the production of coffee is scattered all over the country even if the plantations located in the islands of Java, Sumatra and Nusa Tenggara claim a larger share of the local employment.10 The dispersion of smallholder farms around the country’s numerous islands may have favoured the atomization of the farms and increased the difficulty for setting up sustainability initiatives given they would need to incur a much higher cost. In terms of local impact, I find the coffee taking the largest shares with respect to the local workers in the provinces of Aceh (5.2 per cent), South Sumatra (7.1 per cent), Bengkulu (13.9 per cent) and Lampung (8.0 per cent).
Seasonality in the coffee sector. Seasonality may be just another variable to keep in mind for a coffee buyer or something that can be used to trade financial products for speculators. However, for coffee workers and their families seasonal activities may be a constant struggle. Even if a given job in a plantation is temporary in the sense that it will only last for a few weeks, the job of a picker is arguably a permanent one. Many coffee workers are constantly moving so as to find plantations in peak season.
A question that immediately arises is related to the importance of this phenomenon. A visual overview is provided in Figure 1 for Costa Rica with quarterly data and in Figure 2 for Viet Nam, this time with monthly data and both of them covering the 2011-2018 period. In both graphs we may observe the already known seasonal patterns of Costa Rica,11 October to March or 4th and 1st quarter, and the slightly shorter one in Viet Nam,12 November to February. According to the graphs, employees are more affected by seasonality than own-account workers, with employment levels plummeting as soon as the harvesting season is over. One way to measure the extent to which employees are affected is by calculating the highest potential loss of employment; this can be defined as the percentage by which the highest employee count within a year decreases with respect to the lowest one in the same year. For example, in Costa Rica the highest number of employees in 2016 was 45,528 in the first quarter and the lowest was 22,392 in the second quarter of 2016, the percentage decrease is 50.8 per cent. In other words, there would be potential to lose 5 out of every 10 employee jobs after the end of the season. On average (2011-2018), in Costa Rica the potential employee loss is 51.5 per cent.
FIGURE 1. EMPLOYMENT LEVELS IN THE COFFEE SECTOR OF COSTA RICA, 2011-2018, QUARTERLY DATA
Source: Harmonized labour force survey of Costa Rica and author's own calculations, quarterly data, 2011-2018.
Notes: The figure shows the number of own-account workers (OAW) and employees in the Costa Rican coffee sector between 2011 and 2018.
10 Sulawesi is also known to be a main area of coffee production. Please, see the data section in relation to the identifi-cation of coffee workers in Indonesia for an explanation of why I cannot mention it.11 Dates obtained from Driftaway Coffee at https://driftaway.coffee/when-is-coffee-harvested/.12 Dates obtained from Strauss at https://www.strauss-group.com/cr_newsmention/the-coffee-secrets-of-vietnam-the-story-of-beans-in-distant-fields/
50.000
40.000
30.000
20.000
10.000
0
Wor
kers
2011 2012 2013 2014 2015 2016 2017 2018
Q1 Q2 Q3 Q4 Q1 Q2 Q3 Q4 Q1 Q2 Q3 Q4 Q1 Q2 Q3 Q4 Q1 Q2 Q3 Q4 Q1 Q2 Q3 Q4 Q1 Q2 Q3 Q4 Q1 Q2 Q3 Q4
Employee OAW
Wages and working conditions in the coffee sector: the case of Costa Rica, Ethiopia, India, Indonesia and Viet NamBackground note 5

Box. Coffee in Ethiopia: Interpreting statistics.
The implementation of the ILO employment definition in Ethiopia yields a mere 2.6 million active farmers in Ethiopia. Yet according to Minten (2014) around 4 million families and a quarter of the country’s population are involved to a greater or lesser extent in coffee production. Can we reconcile these two figures?
Yes, probably; it all depends on how workers are counted. In fact, our estimates from the Ethiopian Household Survey show that 4.6 million families involving 26.2 million individuals and a maximum of 3.5 million labourers were involved at some point during the 2015/2016 cycle in coffee production. These figures are much closer to the just cited sources’ estimates. In fact, we find that in areas populated by tens of thousands of tiny coffee producers like the SNNP or Oromia the percentage of workers involved in coffee production reaches, respectively, 55.6 per cent and 31.0 per cent. Obviously, there are not 4.6 million major coffee plantations in Ethiopia filled with labourers working every week over large areas of land. In fact, half of the Ethiopian coffee producing households cultivated less than 310 square metres with coffee trees while only 25 per cent cultivated an area larger than 1,000 square metres (equivalent to 0.1 ha). Production-wise we are able to retrieve a similar picture; half of the farms produced less than 43 kilos of coffee while only 25 per cent of the farms yielded more than 131 kilos.
The above-mentioned farm size distribution should also be kept in mind when reading estimates on total output. It may be surprising to see sources like Gro Intelligence reporting Ethiopia’s coffee output to be around 390,000 tonnes in 2016 while the microdata estimates are up to 566,353 tonnes. These two figures may be reconciled too if we disregard non-market oriented farms (farms that produce coffee exclusively for their own consumption). Doing so would bring the figure down to 523,314 tonnes. It can be brought closer to the official production estimates if we were to disregard small farms (with less than 500 square metres of area cultivated) even if they sell some of their output. This would bring the total output further down to 428,557 tonnes, almost matching the official figures.
Is it reasonable to think that the official figures underestimate Ethiopia’s coffee output? It is a possibility, es-pecially once we weigh in the effort made by the Central Statistical Agency of Ethiopia to find a representative sample of small coffee producers and how difficult it would be to trace these farms without a face to face inter-view. Indeed, only satellite imagery could one day, perhaps, be able to bring out the production of amounts of coffee ranging between 1 to 60 kilos that no one except the people that cultivated it know of their existence.
All in all, what the different figures on employment and production are telling us is the existence of a truly diverse population of coffee producers. On the one hand, there is a rather small number of relatively large plantations while, on the other hand, the majority of coffee producers remain away from the markets. As a consequence, policies intended to help coffee producers should be tailored to a specific type of producer. Some may be directed at connecting tiny farms to the market so that they can sell some of their output locally. Some may be directed at improving the competitiveness, including the yield per hectare and the product quality management system, of those aiming at exporting their production.
In Vietnam, the potential loss of employment is even higher, at 54.5 per cent over the 2011-2018 period, i.e. more than 5 jobs out of every 10 would be destroyed after the end of the peak season. The effects are milder for own-account workers but still significant, 15.3 per cent of this type of jobs in Viet Nam and 27.0 in Costa Rica can be expected to disappear at the end of the peak season.
It should be noted that in spite of the existence of monthly data in Viet Nam, the potential loss of employment at the end of the peak season have been calculated with quarterly data in both countries. This is to facilitate the comparison of the figures across countries. In addition, the comparisons between monthly employment levels are done yearly because in both cases the number of workers have been increasing.
Indeed, a particularity of the coffee industry is its continuous expansion in recent years in all countries under the scope of this report but India. In India (mostly Karnataka) the number of coffee workers have had a negative evolution, with 440,671 in 2000 and 411,791 in 2012. This contrasts with the evolution the sector have had in Viet Nam (Figure 2), where the number of workers grew from 1,086,726 in 2011 to 1,439,712 in 2018, a 32.5 per cent increase. Likewise, in Costa Rica (Figure 1) the number of workers increased by 26.3 since 2011 after touching rock bottom in 2009. Costa Rica’s low in 2009 was due to a number of circumstances, like the ageing of the plantations and a sharp and severe depreciation of the local currency, the Colon, against the American Dollar, losing around 20 per cent of its value. Indonesia too, attested an increase in the number of workers employed. It increased by 20.6 per cent between 2007 and 2018.
Wages and working conditions in the coffee sector: the case of Costa Rica, Ethiopia, India, Indonesia and Viet NamBackground note6
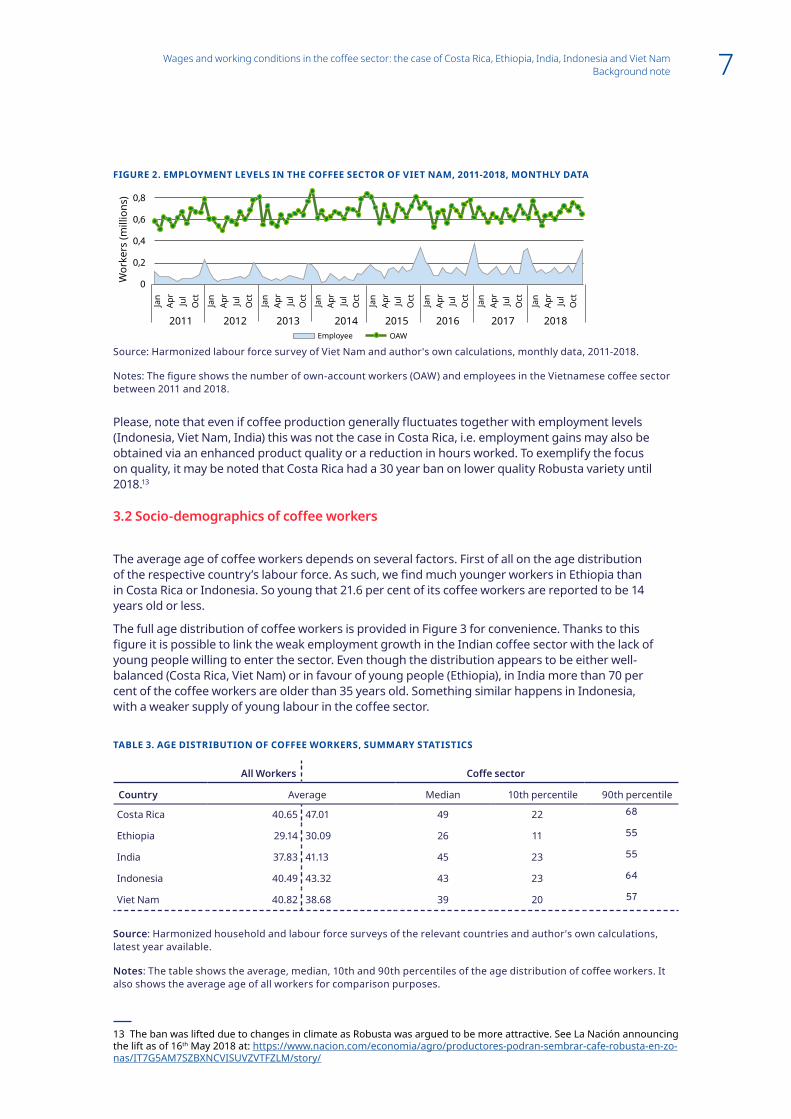
FIGURE 2. EMPLOYMENT LEVELS IN THE COFFEE SECTOR OF VIET NAM, 2011-2018, MONTHLY DATA
Source: Harmonized labour force survey of Viet Nam and author's own calculations, monthly data, 2011-2018.
Notes: The figure shows the number of own-account workers (OAW) and employees in the Vietnamese coffee sector between 2011 and 2018.
Please, note that even if coffee production generally fluctuates together with employment levels (Indonesia, Viet Nam, India) this was not the case in Costa Rica, i.e. employment gains may also be obtained via an enhanced product quality or a reduction in hours worked. To exemplify the focus on quality, it may be noted that Costa Rica had a 30 year ban on lower quality Robusta variety until 2018.13
3.2 Socio-demographics of coffee workers
The average age of coffee workers depends on several factors. First of all on the age distribution of the respective country’s labour force. As such, we find much younger workers in Ethiopia than in Costa Rica or Indonesia. So young that 21.6 per cent of its coffee workers are reported to be 14 years old or less.
The full age distribution of coffee workers is provided in Figure 3 for convenience. Thanks to this figure it is possible to link the weak employment growth in the Indian coffee sector with the lack of young people willing to enter the sector. Even though the distribution appears to be either well-balanced (Costa Rica, Viet Nam) or in favour of young people (Ethiopia), in India more than 70 per cent of the coffee workers are older than 35 years old. Something similar happens in Indonesia, with a weaker supply of young labour in the coffee sector.
TABLE 3. AGE DISTRIBUTION OF COFFEE WORKERS, SUMMARY STATISTICS
All Workers Coffe sector
Country Average Median 10th percentile 90th percentile
Costa Rica 40.65 47.01 49 22 68
Ethiopia 29.14 30.09 26 11 55
India 37.83 41.13 45 23 55
Indonesia 40.49 43.32 43 23 64
Viet Nam 40.82 38.68 39 20 57
Source: Harmonized household and labour force surveys of the relevant countries and author's own calculations, latest year available.
Notes: The table shows the average, median, 10th and 90th percentiles of the age distribution of coffee workers. It also shows the average age of all workers for comparison purposes.
13 The ban was lifted due to changes in climate as Robusta was argued to be more attractive. See La Nación announcing the lift as of 16th May 2018 at: https://www.nacion.com/economia/agro/productores-podran-sembrar-cafe-robusta-en-zo-nas/IT7G5AM7SZBXNCVISUVZVTFZLM/story/
0,8
0,6
0,4
0,2
0Wor
kers
(mill
ions
)
2011 2012 2013 2014 2015 2016 2017 2018Employee OAW
Jan
Apr
Jul
Oct Jan
Apr
Jul
Oct Jan
Apr
Jul
Oct Jan
Apr
Jul
Oct Jan
Apr
Jul
Oct Jan
Apr
Jul
Oct Jan
Apr
Jul
Oct Jan
Apr
Jul
Oct
Wages and working conditions in the coffee sector: the case of Costa Rica, Ethiopia, India, Indonesia and Viet NamBackground note 7
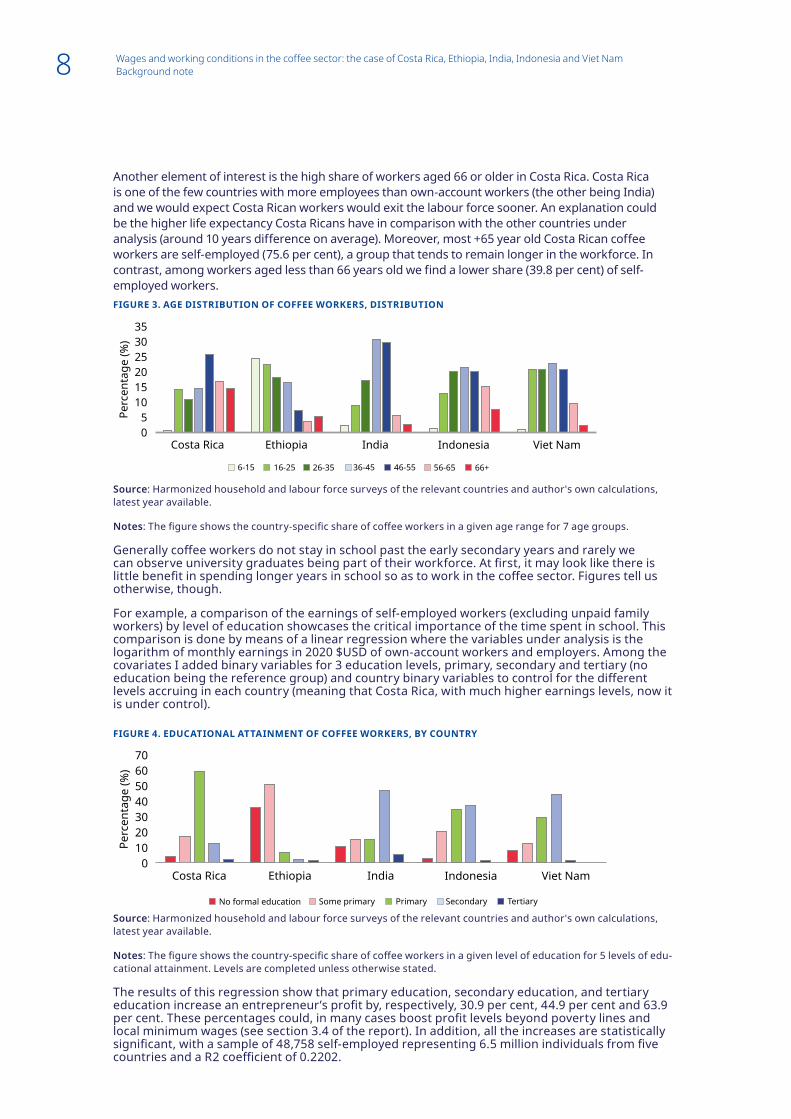
Another element of interest is the high share of workers aged 66 or older in Costa Rica. Costa Rica is one of the few countries with more employees than own-account workers (the other being India) and we would expect Costa Rican workers would exit the labour force sooner. An explanation could be the higher life expectancy Costa Ricans have in comparison with the other countries under analysis (around 10 years difference on average). Moreover, most +65 year old Costa Rican coffee workers are self-employed (75.6 per cent), a group that tends to remain longer in the workforce. In contrast, among workers aged less than 66 years old we find a lower share (39.8 per cent) of self-employed workers.FIGURE 3. AGE DISTRIBUTION OF COFFEE WORKERS, DISTRIBUTION
Source: Harmonized household and labour force surveys of the relevant countries and author's own calculations, latest year available.
Notes: The figure shows the country-specific share of coffee workers in a given age range for 7 age groups.
Generally coffee workers do not stay in school past the early secondary years and rarely we can observe university graduates being part of their workforce. At first, it may look like there is little benefit in spending longer years in school so as to work in the coffee sector. Figures tell us otherwise, though.
For example, a comparison of the earnings of self-employed workers (excluding unpaid family workers) by level of education showcases the critical importance of the time spent in school. This comparison is done by means of a linear regression where the variables under analysis is the logarithm of monthly earnings in 2020 $USD of own-account workers and employers. Among the covariates I added binary variables for 3 education levels, primary, secondary and tertiary (no education being the reference group) and country binary variables to control for the different levels accruing in each country (meaning that Costa Rica, with much higher earnings levels, now it is under control).
FIGURE 4. EDUCATIONAL ATTAINMENT OF COFFEE WORKERS, BY COUNTRY
Source: Harmonized household and labour force surveys of the relevant countries and author's own calculations, latest year available.
Notes: The figure shows the country-specific share of coffee workers in a given level of education for 5 levels of edu-cational attainment. Levels are completed unless otherwise stated.
The results of this regression show that primary education, secondary education, and tertiary education increase an entrepreneur’s profit by, respectively, 30.9 per cent, 44.9 per cent and 63.9 per cent. These percentages could, in many cases boost profit levels beyond poverty lines and local minimum wages (see section 3.4 of the report). In addition, all the increases are statistically significant, with a sample of 48,758 self-employed representing 6.5 million individuals from five countries and a R2 coefficient of 0.2202.
Perc
enta
ge (%
)
6-15 16-25 26-35 36-45 46-55 56-65 66+
353025201510
50
Costa Rica Ethiopia India Indonesia Viet Nam
Perc
enta
ge (%
)
Primary Secondary TertiarySome primaryNo formal education
70605040302010
0Costa Rica Ethiopia India Indonesia Viet Nam
Wages and working conditions in the coffee sector: the case of Costa Rica, Ethiopia, India, Indonesia and Viet NamBackground note8

3.3 Structure of the workforce in the coffee sector
The five countries under study show more differences with one another than similarities; this is the case in, for instance, productivity or geographical distribution of the production. The type of workers14 employed is no exception. From Costa Rica and India, who has a majority of its workers employed in relatively big (>10 employees) plantations, to Indonesia, Viet Nam and Ethiopia where employees are seldom hired and where the use of unpaid labour is commonplace.15 In fact, even two countries like Viet Nam and Indonesia that show similar structures of employment diverge in the trend. On the one hand, Viet Nam has been showcasing a moderate growth in the number of employees over the last decade. The share of employees increased from 7.9 per cent in 2020 to 11.1 in 2018. On the other hand, the same share in Indonesia has remained almost stagnant, changing from 8.4 in 2007 to 8.9 in 2018. The notable change in Viet Nam is one of the few structural changes attested in the coffee sector of these 5 countries. In addition, it may also be one of the likely outcomes of the 10-year plan that the Vietnamese government adopted to improve agricultural productivity in the country.
A noticeable characteristic of the employment structure (Figure 5) is the prevalence of women in unpaid roles (unpaid family workers). This is the case in all countries but Ethiopia, where the assignment from the raw data based on self-reported control over parcels was made. It might be that Ethiopia is an exception and in countries like Indonesia or Viet Nam women take on minor roles in the family business. However, if this were not the case, the assignment of statuses should, perhaps, be revised. It may just be a statistical matter (in practice, coffee producing families do not follow international classifications when managing a farm) but it still distorts the gender picture and may help supporting damaging gender stereotypes.
FIGURE 5. STATUS IN EMPLOYMENT, COFFEE SECTOR, BY COUNTRY AND SEX
Perc
enta
ge (%
)
Employee Unpaid family workerOAW Employer
70605040302010
0
Costa Rica Ethiopia India Indonesia Viet NamMen Women Men Women Men Women Men Women Men Women
Source: Harmonized household and labour force surveys of the relevant countries and author's own calculations, latest year available.
Notes: The figure shows country, sector and sex-specific percentages of coffee workers in four employment sta-tuses, employee, own-account worker (OAW), employer and unpaid family worker.
In some countries the coffee sector employs mostly employees and in others self-employed workers. This has a likely influence in the occupations held by workers. It can be seen in Table 4 that Costa Rica and India (employee-intensive countries) appear to be the only ones employing non-field workers. This suggests that the plantations tend to be bigger, more vertically integrated and more capable of taking on coffee processing activities. The vertical integration of a supply chain should, in principle, allow companies to increase profit levels by increasing the value added to the product.
Still, even though India and Costa Rica seem to host some big plantations, most of the people employed are field workers. The share of this type of worker ranges from 94.7 per cent in India (lowest) to 99.9 per cent in Ethiopia (lowest). As a result, the earnings/profits (for self-employed) and wages (for employees) offered in this report are averaged across the coffee sector, without distinguishing among occupations.
14 By type of worker is meant the categories of the International Classification of Status in Employment, ICSE-93. Even though a new classification has been brought up recently, the ICSE-18, the older version is still widely utilized by national statistical systems and it is the one used in the micro-datasets analysed in this report.15 See section 2 of this report, it explains very few farms rely on paid labour for the harvest of coffee.
Wages and working conditions in the coffee sector: the case of Costa Rica, Ethiopia, India, Indonesia and Viet NamBackground note 9

TABLE 4. OCCUPATIONS OF COFFEE WORKERS, BY COUNTRY
Country Costa Rica Ethiopia India Indonesia Viet Nam
Professionals and technicians 0.9 0.0 1.1 0.0 0.1
Salesmen, clerks 0.9 0.0 0.0 0.1 0.0
Factory workers 2.1 0.0 4.2 0.2 0.2
Field workers 96.1 100.0 94.7 99.7 99.8
Source: Harmonized household and labour force surveys of the relevant countries and author's own calculations, latest year available.
Notes: The table shows country and sector-specific shares of coffee workers in four occupations. Occupations are defined using ISCO-08 codes, "Professionals and technicians" refer to major groups 1, 2 and 3; "Salesmen, clerks" to groups 4 and 5; "Factory workers" to groups 7, 8 and subgroups 91, 93, 94, 95 and 96; at last, "Field workers" refer to the group 6 and the subgroup 92.
3.4 Earnings and hours worked in the coffee sector
Information regarding wages and own-account workers’ earnings exists for all five countries. Unfortunately, we are not able to report detailed information on employers’ earnings levels for all of them. In India, for example, the sample size is too small and the method of calculating earnings (based on thresholds) too unreliable to estimate distributions with an expected long right tail. In Indonesia, even though the LFS provides own-account workers’ earnings, it excludes employers from that same set of questions. Something similar happens in Viet Nam, whose labour force survey was not providing information on earnings for any self-employed worker until 2015. This shortage of information is felt in Figure 6, where the time-series on monthly labour earnings for Vietnamese own-account workers only covers the 2015-2018 period.
Labour earnings in the coffee sector vary widely. From 382.1 $USD earned monthly by Costa Rican plantation employees to the 37.5 $USD earned by Ethiopian field workers during the harvesting season. How come there is a 10-fold difference in wages for an export-oriented good like the coffee? First of all, not all coffees are regarded equally; marketing, quality control processes (including the quality and the amount of pesticides) and the type of coffee variety all affect the price received by the producer and, as a result, affect wages as well. In addition, wages are adjusted to the income level of the country where workers live. That said, it should also be noted that the process whereby wages adjust to local rates is not a natural one. It happens because workers have little bargaining power, or because they do not have much better outside opportunities.
TABLE 5. MONTHLY LABOUR EARNINGS IN THE COFFEE SECTOR, BY STATUS IN EMPLOYMENT
Average Median
Country Employee OAW Employer Employee OAW Employer
Costa Rica 382.1 331.7 594.9 349.7 226.9 393.9
Ethiopia 37.5 43.1 220.2 20.5 18.9 138.3
India 104.4 167.7 na 109.6 162.5 na
Indonesia 86.2 100.1 na 76.2 73.3 na
Viet Nam 125.2 222.3 446.6 115.6 184.9 308.2
Source: Harmonized household and labour force surveys of the relevant countries and author's own calculations, latest year available.
Notes: The table shows summary statistics on monthly labour earnings by status in employment. Earnings measured in 2020 $USD.
Wages and working conditions in the coffee sector: the case of Costa Rica, Ethiopia, India, Indonesia and Viet NamBackground note10

Women in the coffee sector earn substantially less than men, this can be seen in Table 6, left hand side columns referring to all workers in the sector. The exception to this trend is Ethiopia although as it happens with other statistics shown in the report, this is due to the way status in employment is allocated to household members. Therefore, figures cannot be compared.
Leaving Ethiopia aside for the above-mentioned considerations, the relatively high number of women working as unpaid family workers may be artificially increasing the gender pay gap. In an attempt to cancel this effect, the four right-hand side columns of Table 6 show average wages for employees. Gender pay gaps using this methodology are 44.5 per cent in Costa Rica, 12.4 per cent in Viet Nam, 34.9 in Indonesia and 23.3 in India. With the exception of India and Ethiopia, these wage gaps are higher than the national average gaps (same methodology, using only employees).
TABLE 6. MONTHLY LABOUR EARNINGS IN THE COFFEE SECTOR, BY SEX
All workers Employees
Average Median Average Median
Country Men Women Men Women Men Women Men Women
Costa Rica 362.9 256.1 311.9 151.9 399.3 221.5 368.6 189.1
Ethiopia 36.7 35.6 0.5 3.1 37.4 25.0 34.4 23.0
India 129.7 79.0 124.3 78.3 110.1 84.4 109.6 78.3
Indonesia 85.9 23.3 64.1 0.0 101.2 65.9 88.0 59.6
Viet Nam 163.7 61.1 134.8 0.0 131.5 115.2 119.4 104.0
Source: Harmonized household and labour force surveys of the relevant countries and author's own calculations, latest year available.
Notes: The table shows summary statistics on monthly labour earnings by sex. Earnings measured in 2020 $USD. Employees not included in Ethiopia’s figures.
The availability of reliable and comparable time series data in Costa Rica and Viet Nam allows us to look into how purchasing power has been evolving for coffee workers. Figure 6 shows monthly earnings measured in 2020 $USD from 2011 to 2018 using monthly (Viet Nam) and quarterly data (Costa Rica). Note that data on own-account workers’ earnings is not available in Viet Nam between 2011 and 2014. One of the main features is the relatively constant purchasing power of workers in the coffee sector. Still, even if workers seem to maintain the same level of real earnings, the presence of sharp fluctuations in average earnings are a source of concern and a probable cause of financial distress.
From the point of view of an international comparison, it may be surprising to observe how different the earnings’ levels are between Viet Nam and Costa Rica. Even more surprising is to observe that the differences are not homogenous across statuses in employment. Costa Rican employees earn 3 times more than the Vietnamese ones (2011-2018) but among own-account workers the difference is reduced to 1.5 times (2015-2018). That hints that even though productivity related reasons may reduce earnings by 50 per cent, local employers may be using their bargaining power to set employees’ wages based on local labour market conditions.
Wages and working conditions in the coffee sector: the case of Costa Rica, Ethiopia, India, Indonesia and Viet NamBackground note 11

FIGURE 6. MONTHLY LABOUR EARNINGS IN THE COFFEE SECTOR, 2011-2018 BY STATUS IN EMPLOYMENT
Source: Harmonized labour force survey of Viet Nam and Costa Rica and author's own calculations.
Notes: The figure shows average monthly labour earnings by status in employment in Viet Nam and Costa Rica, 2011-2018, 2020 $USD. Data not available for own-account workers for the 2011-2014 period in Viet Nam.
Similar conclusions in terms of bargaining power can be reached by looking at hourly earnings ($USD 2020) in Table 5. The OAW-employee earnings ratio varies from country to country, yet own-account workers earn more per hour than employees in all of them. I find the OAW-employee ratio to be smaller in Indonesia. The Indian coffee plantations do not have yields as low as the Indonesian ones although the ones accruing to own-account workers are probably not far from them based on their profit levels. Even though the comparison between employees’ wages and own-account workers’ earnings is revealing, the lack of information on employer earnings in India and in Indonesia does not allow us to reach more detailed conclusions.
TABLE 7. HOURLY EARNINGS AND MINIMUM WAGE IN THE COFFEE SECTOR, BY STATUS IN EMPLOYMENT
Hourly wages (employees) Hourly earnings (OAW)
Country Coffee Agriculture Country Minimum Wage
Coffee Agriculture Country
Costa Rica 2.53 2.87 4.51 2.38 2.16 2.34 3.23
Ethiopia 0.18 na 0.90 na 0.21 0.30 0.32
India 0.49 0.37 0.74 0.31-0.51 0.80 0.70 0.72
Indonesia 0.51 0.77 1.29 0.77-1.44 0.67 1.07 1.17
Viet Nam 0.77 0.75 1.10 0.51 1.28 0.87 1.09
Source: Harmonized household and labour force surveys of the relevant countries, official minimum wages and author's own calculations, latest year available.
Notes: The table shows average hourly labour earnings in 2020 $USD for employees and own-account workers. In ad-dition, it shows hourly minimum wages wherever applicable; ranges are shown for countries where minimum wages vary by region, only the regions with coffee workers are considered.
Hourly gender wage gaps show that women earn less in all countries although the gap is not uniform. It goes from 39.2 per cent in Costa Rica and 32.5 per cent in India to 8.3 per cent in Viet Nam. The 30 percentage points difference attested between the gaps of Costa Rica and Viet Nam might suggests the existence of varying degrees of discrimination.
500
400
300
200
100
0
$ U
SD 2
020
2011 2012 2013 2014 2015 2016 2017 2018
Employee OAW
Jan Jul
Jan Jul
Jan Jul
Jan Jul
Jan Jul
Jan Jul
Jan Jul
Jan Jul
(a) Viet Nam
500
400
300
200
100
0
$ U
SD 2
020
2011 2012 2013 2014 2015 2016 2017 2018
Employee OAW
(b) Costa Rica
Q1Q3 Q1Q3 Q1Q3 Q1Q3 Q1Q3 Q1Q3 Q1Q3 Q1Q3
Wages and working conditions in the coffee sector: the case of Costa Rica, Ethiopia, India, Indonesia and Viet NamBackground note12

In all countries average coffee wages are far from average country wages. The difference is particularly dramatic in Ethiopia, with the average employee earning five times more than the average field worker. To better understand the Ethiopian case we should keep in mind that only 1 in 10 workers are employees -and half of those are civil servants-, in other words, precarious employee jobs are relatively scarce.
Hours worked. The average number of weekly hours worked is shown in Table 8. The averages are provided separately for employees and own-account workers. In addition, we provide -right column- the number of hours that constitute a normal workweek. Generally speaking hours worked do not seem to be excessive. India stands out of the group with 48.7 hours for employees and 47.8 for own-account workers. Ethiopia, in turn, showcases very small figures. In the case of Ethiopia it is necessary to remember the hours worked were recorded in March -low season- and by no means they can be taken as the yearly average. Still, Ethiopia also shows a country average at 24.6 hours a week. This may be explained by a high rate of underemployment among the self-employed as well as multitasking between farm, and non-farm work, which may reduce the number of hours spent in the primary job. Ethiopian figures are recorded in low season and they may pick up if we were to measure them in Autumn or early Winter.
TABLE 8. WEEKLY HOURS WORKED IN THE COFFEE SECTOR, A COMPARISON
Employees Own-account workers
Country Coffee Agriculture Country Coffee Agriculture Country Workweek
Costa Rica 35.4 46.3 44.4 37.3 37.5 36.0 48
Ethiopia 39.9 18.3 22.6 24.6 48
India 48.7 47.6 51.0 47.8 50.6 51.3 48
Indonesia 40.5 39.9 44.4 38.1 33.0 40.9 40
Viet Nam 39.4 44.2 47.4 40.9 33.3 39.0 48
Source: Harmonized household and labour force surveys of the relevant countries and author's own calculations, latest year available.
Notes: The table shows the country-specific number of weekly hours worked in the coffee sector, in the agricultural sector and in the country as a whole.
A reduction in hours worked is not the only possibility to reduce activity levels in the low season. As an alternative, farmers and employees could stop working altogether while the remaining workers continue working a similar number of hours all year long. I use the Vietnamese and Costa Rican time series to exemplify the two mentioned possibilities, see Figure 7.
FIGURE 7. WEEKLY HOURS WORKED IN COSTA RICA AND VIET NAM, 2011-2018, QUARTERLY DATA
Source: Harmonized labour force survey of Costa Rica and Viet Nam and author's own calculations, 2011-2018.
Notes: The figure shows average weekly hours worked in the Costa Rican and Vietnamese coffee sector by status in employment for employees and own-account workers.
55
50
45
40
35
30
Wee
kly
hour
s
2011 2012 2013 2014 2015 2016 2017 2018
Employee OAW
(a) Viet Nam
Q1 Q4 Q3 Q2 Q1 Q4 Q3 Q2 Q1 Q4 Q3
55
50
45
40
35
30
Wee
kly
hour
s
2011 2012 2013 2014 2015 2016 2017 2018
Employee OAW
(b) Costa Rica
Q1 Q4 Q3 Q2 Q1 Q4 Q3 Q2 Q1 Q4 Q3
Wages and working conditions in the coffee sector: the case of Costa Rica, Ethiopia, India, Indonesia and Viet NamBackground note 13

On the left hand-side of Figure 7 we show weekly hours of work in the Vietnamese coffee sector from 2011 to 2018 by quarter and by status in employment for employees and own-account workers. According to the data, Viet Nam is a case of adjustments via employment levels (see Figure 2) while keeping the hours worked by both, employees, and own-account workers, relatively constant across months. The right-hand side of Figure 7 shows the same statistic for Costa Rica. In this country the type of adjustments in off-season periods vary by status in employment. For employees we find that both, employment levels and hours worked are adjusted downwards. On the other hand, Costa Rican own-account workers do not see their number reduced in the low season, in contrast with their Vietnamese counterparts see their working hours significantly reduced.
In addition to seasonality, Figure 7 (a) allows us to attest a significant reduction in the weekly hours worked of Vietnamese employees. This reduction paired with constant real monthly wages during the same period translate in higher earnings per hour.
Minimum wage compliance. Compliance with prevailing minimum wages is desirable and -if minimum wages are calculated by taking into account not only economic factors but also the need of workers and their families - it is a measure that may tell us something about the living conditions of the workers. With this in mind we estimated the compliance level for four of the five countries of the study, having to exclude Ethiopia because it does not have a minimum wage. These calculations are shown in Table 9, where the share of employees whose earnings fall below 95 per cent, between 95 and 105 per cent, and above 105 per cent are reported.
In addition to higher occupational rates, Costa Rica has a national minimum wage (the minimum minimorum) that applies to all regions, but Viet Nam, India and Indonesia use regional minimum wages, sometimes combined with occupational minimum wages. In these countries compliance is calculated at the state (India), province (Indonesia) and regional (Viet Nam) level. In particular, for Viet Nam we use the minimum wage that applies in Region IV for 2018, which is the one applying to the location of coffee plantations. In India, there are five provinces where coffee was produced in 2012, Mizoram, Tripura, Karnataka, Kerala and Tamil Nadu; we use the respective states’ minimum wages. At last, we use the 2018 minimum wages for the 12 provinces of Indonesia where coffee producers were identified.16
TABLE 9. MINIMUM WAGE COMPLIANCE IN THE COFFEE SECTOR
Costa Rica India Indonesia Viet Nam
Minimum wage
Employees OAW Employees OAW Employees OAW Employees OAW
<95% 45.4 74.3 17.7 9.1 91.0 84.9 25.9 11.6
95%-105% 14.3 5.2 0.0 0.0 2.8 2.9 4.8 2.7
>105% 40.3 20.6 82.2 90.9 6.2 12.2 69.4 85.7
Source: Harmonized household and labour force surveys of the relevant countries, official minimum wages and author's own calculations, latest year available.
Notes: The table shows the country, sector and status in employment-specific share of workers earnings less than 95%, between 95% and 105% and above 105% of the applicable hourly minimum wage. Minimum wages do not apply to self-employed workers, their potential compliance levels are shown for informative purposes.
In addition to compliance levels for employees we also report them for own-account workers. OAW’s are not subject to minimum wage legislation and the figures does not have any legal meaning. They are shown for information purposes only.
We distinguish different cases from the data of Table 9. In India and Viet Nam, a majority of coffee workers earn the minimum wage or more. It is estimated that in these two countries the share of workers earning less than the minimum wage amount to, respectively, 17.7 per cent and 25.9 per cent. Non-compliance is higher in Costa Rica, with an estimated 45.4 per cent of workers 16 These provinces are Aceh, North Sumatra, Jambi, South Sumatra, Bengkulu, Lampung, Central Java, East Java, Bali, West Nusa Tenggara, East Nusa Tenggara, and West Kalimantan. See Section 2, data description, for an explanation of why coffee was not found in other provinces.
Wages and working conditions in the coffee sector: the case of Costa Rica, Ethiopia, India, Indonesia and Viet NamBackground note14

earning less than the minimum, and especially in Indonesia, where only 6.2 per cent of the coffee employees earn more than the minimum wage.
3.5 Company size: Does it matter?
Sections 3.1 to 3.4 distinguish between employees and own-account workers. The distinction is useful for several reasons but still the efficiency of companies with only a handful employees may not differ much from the one achieved by a smallholder farm. We take advantage of the information on company size in certain labour force surveys (Costa Rica and Viet Nam) to further split employees between those working in micro businesses (less than 10 workers) and in bigger companies.
TABLE 10. COMPANY SIZE DISTRIBUTION IN THE COFFEE SECTOR
Type Costa Rica Viet Nam
Self-employed 45.2 92.1
<10 employees 41.1 5.3
10+ employees 13.7 2.6
Source: Harmonized household and labour force surveys of the relevant countries and author's own calculations, latest year available.
Notes: The table shows the country and sector-specific share of self-employed in the coffee sector. In addition, it shows the percentage of employees working in coffee companies with less than 10 and 10 or more employees. Figures represent the yearly average, not a particular quarter.
The purpose is to identify whether size matters for workers’ working conditions. Also to see whether there are efficiency gains and, more importantly, whether they reach coffee labourers. Unfortunately, company size is elusive; Indonesia does not ask that type of information to respondents and India avoids asking that information to certain agricultural workers. In Ethiopia, even though we do have information on company size the structure of the data does not allow us to investigate further coffee employees. In Viet Nam data on company size stopped being collected in 2012 while only Costa Rica continues asking regularly this question all workers. This section is, thus, filled with information from Costa Rica (2018) and Viet Nam (2011). The former is a country that relies extensively on employees (54.8 per cent) for coffee production and the latter a country that historically has not used many employees but has started to increasingly rely on them over the last decade.
Wages and working conditions in the coffee sector: the case of Costa Rica, Ethiopia, India, Indonesia and Viet NamBackground note 15

FIGURE 8. EMPLOYMENT STRUCTURE OF THE COFFEE SECTOR IN COSTA RICA, 2001-2018, THIRD QUARTER
Source: Harmonized household and labour force survey of Costa Rica and author's own calculations, 2001-2018.
Notes: The figure shows the country and sector-specific share of workers in three categories, self-employed (own-ac-count workers, employers, and unpaid family workers), employees in companies that have less than 10 employees and employees in companies with 10 or more employees.
Even if they provide jobs to a small share of the coffee workers, we were able to find companies with 10 or more employees in both countries. These companies take on 13.7 per cent and 2.6 per cent of total coffee employment in, respectively, Costa Rica and Viet Nam. On top of this, it is possible to look at the employment shares in the coffee sector of Costa Rica since 2001 (Figure 8). Even if it looks like the share of employment taken by the relatively large companies has decreased over the last 20 years, it has more likely remained constant. The reason is likely due to the change in the data sources from 2010 onwards, going from the household survey to the labour force survey. It may be guessed that there was a change in methodology when assigning employer status, arguably stricter in the labour force survey (2010-2018).
TABLE 11. CHARACTERISTICS OF COFFEE SECTOR EMPLOYEES, BY COMPANY SIZE
Statistic
Country Company size Hourly wage Hours worked Secondary+ High skilled
Costa Rica Less than 10 2.48 32.3 15.1 0.00
10 or more 2.70 44.9 45.2 0.80
Viet Nam Less than 10 0.64 44.6 12.8 0.00
10 or more 0.74 45.2 28.2 0.37
Source: Harmonized household and labour force surveys of the relevant countries and author's own calculations, latest year available, surveys represent the yearly average, not a particular quarter.
Notes: The table shows country, sector and size-specific average hourly wages ($USD 2020), weekly hours worked, share of workers with secondary or tertiary education and share of high skilled workers in the coffee industry of Viet Nam and Costa Rica. High skilled refers to employees classified within groups 1, 2 or 3 of the ISCO-08 classification.
In what follows we analyze four indicators by company size; hourly wages measured in 2020 $USD, weekly hours worked, the educational attainment distribution of the workforce and the skill required in the occupations held by the employees. In all of them we find that company size matters and scaling up coffee production may be positive for workers. In terms of wages we find increases of 14.5 per cent and 8.4 per cent in, respectively, Viet Nam and Costa Rica. Moreover, in Costa Rica larger companies offer greater opportunities to improve monthly wages by being able to offer more work (12.6 hours per week). On average, the workforce tends to be better educated and, more importantly, bigger companies make use of specialists, i.e. individuals in high-skilled occupations, which probably has a positive effect on companies’ profit level.
Self-employed 10+ employees<10 employees
100%
80%
60%
40%
20%
02001 2002 2003 2004 2005 2006 2007 2008 2009 2010 2011 2012 2013 2014 2015 2016 2017 2018
Wages and working conditions in the coffee sector: the case of Costa Rica, Ethiopia, India, Indonesia and Viet NamBackground note16
This report analyzes the employment structure and the working conditions of the coffee sector in five of the world’s major producers, Costa Rica, Ethiopia, India, Indonesia, and Viet Nam. This report benefits from the harmonization of 33 household and labour force surveys. Thanks to this unique database we are able to look at the coffee sector from a cross-country perspective as well as using historical data.
The study shows the diverse employment structures. While Costa Rica and India tend to rely on employees, the coffee sectors of Indonesia, Viet Nam and Ethiopia obtain most of their production from smallholder farmers.
The employment structure seems to have a direct influence on several aspects of working conditions. One of them is the regularity of employment and the average number of hours worked. Due to seasonality, both fluctuate much more for employees than they do for own-account workers. For example, in Viet Nam 51.5 per cent and in Costa Rica 54.5 per cent of the sector wage employment is destroyed after every peak season. The employment structure also affects gender roles due to the classic dichotomy between unpaid family labour and own-account worker statuses. As it is common in agricultural activities women tend to be assigned the former status, boosting, as a result, gender pay gaps.
From a gender perspective we find that female employees earn less (per hour) than men in all countries under study. Still, gender pay gaps differ widely from country to country. Costa Rica leads the way with a 39.2 per cent wage gap while Viet Nam showcases the smallest gap at 8.3 per cent. This hints that pay differentials may be influenced by the countries’ respective gender roles and employers’ attitudes and beliefs.
At the country level we find wages are much lower than the country averages and even lower than the averages wages paid in the agricultural sector. There is also substantial non-compliance with minimum wages. Questions thus arise on what could be done in the future to further improve wages and productivity with a view to ensuring a sustainable coffee sector in which workers’ wages and earnings are sufficient to meet the basic needs of their families.
4. Conclusions
Wages and working conditions in the coffee sector: the case of Costa Rica, Ethiopia, India, Indonesia and Viet NamBackground note 17
References
Minten B. (2014). Structure and performance of Ethiopia’s coffee export sector. ESSP Working papers No. 66 from International Food Policy Research Institute (IFPRI).
______. (2017). IFPRI blog. Available at https://www.ifpri.org/blog/ethiopias-coffee-farmers-struggle-realize-benefits-international-markets
Petit, N. (2007). Ethiopia’s coffee sector: A bitter or better future? Journal of Agrarian Change, No. 7, Vol. 2, pp. 225-262, 2007.
TPSA (2018). An analysis of the global value chain for Indonesian coffee exports. Report, January 2018, by the Canada-Indonesia Trade and Private Sector Assistance Project.
TechnoServe (2014). Indonesia: A business case for sustainable coffee production. An industry study by TechnoServe for the Sustainable Coffee Program, powered by IDH, 2014.
Wages and working conditions in the coffee sector: the case of Costa Rica, Ethiopia, India, Indonesia and Viet NamBackground note18

Appendices
Appendix A. Data availability and periodicity
TABLE A.1 SOURCES, TYPE OF DATA AND YEARS AVAILABLE, BY COUNTRY
Country
Year Costa Rica Ethiopia India Indonesia Vietnam
2000 E-U NSSO
2001 HS
2002 HS
2003 HS
2004 HS
2005 HS E-U NSSO
2006 HS
2007 HS LFS
2008 HS
2009 HS
2010 LFS LFS
2011 LFS LFS
2012 LFS E-U NSSO LFS
2013 LFS LFS
2014 LFS LFS
2015 LFS LFS
2016 LFS HS LFS
2017 LFS LFS
2018 LFS LFS LFS
Monthly Quarterly 3rd quarter 1st quarter
Wages and working conditions in the coffee sector: the case of Costa Rica, Ethiopia, India, Indonesia and Viet NamBackground note 19

Appendix B. Regression results, returns to schooling
TABLE B.1 RETURN TO SCHOOLING (% CHANGE) FOR SELF-EMPLOYED IN THE COFFEE SECTOR
Variable Marginal effect Variable Marginal effect
Costa Rica (default=0) No education (default=0)
Ethiopia -619.1*** Primary/lower secondary 36.2***
India -90.5*** Upper secondary 56.7***
Indonesia -242.3*** Tertiary 89.6***
Viet Nam -45.0***
Observations 48,760
Adjusted R2 0.3451
Source: Harmonized household and labour force surveys of the relevant countries and author's own calculations, all years avail-able.
Notes: Earnings are measured in $USD 2020. The logarithm of monthly earnings is the dependent variable. The population includes employers and own-account workers. Significance, *** at 1%, ** at 5%, * at 10%.
Wages and working conditions in the coffee sector: the case of Costa Rica, Ethiopia, India, Indonesia and Viet NamBackground note20

Appendix C. Coffee seasonality
TABLE C.1 HARVEST SEASON BY COUNTRY, COFFEE SECTOR 17
Country, region Season
Costa Rica October - December
Ethiopia October - December
India January - March
Viet Nam January - March
Indonesia, Sumatra November - January
Indonesia, Java July-September
17 See https://www.ptscoffee.com/blogs/news/coffee-seasonality and https://www.expat.or.id/info/coffeeinindonesia.html
Wages and working conditions in the coffee sector: the case of Costa Rica, Ethiopia, India, Indonesia and Viet NamBackground note 21

Appendix D. Employment and output (only Ethiopia) distribution, by country
FIGURE D.1 INDIA, COFFEE WORKERS DISTRIBUTION IN 2012
Source: Harmonized labour force survey of India and author's own calculations.
Notes: The map shows the geographical distribution of 411,791 workers in 2012. The borders may not show the latest administrative changes occurred in India.
Wages and working conditions in the coffee sector: the case of Costa Rica, Ethiopia, India, Indonesia and Viet NamBackground note22
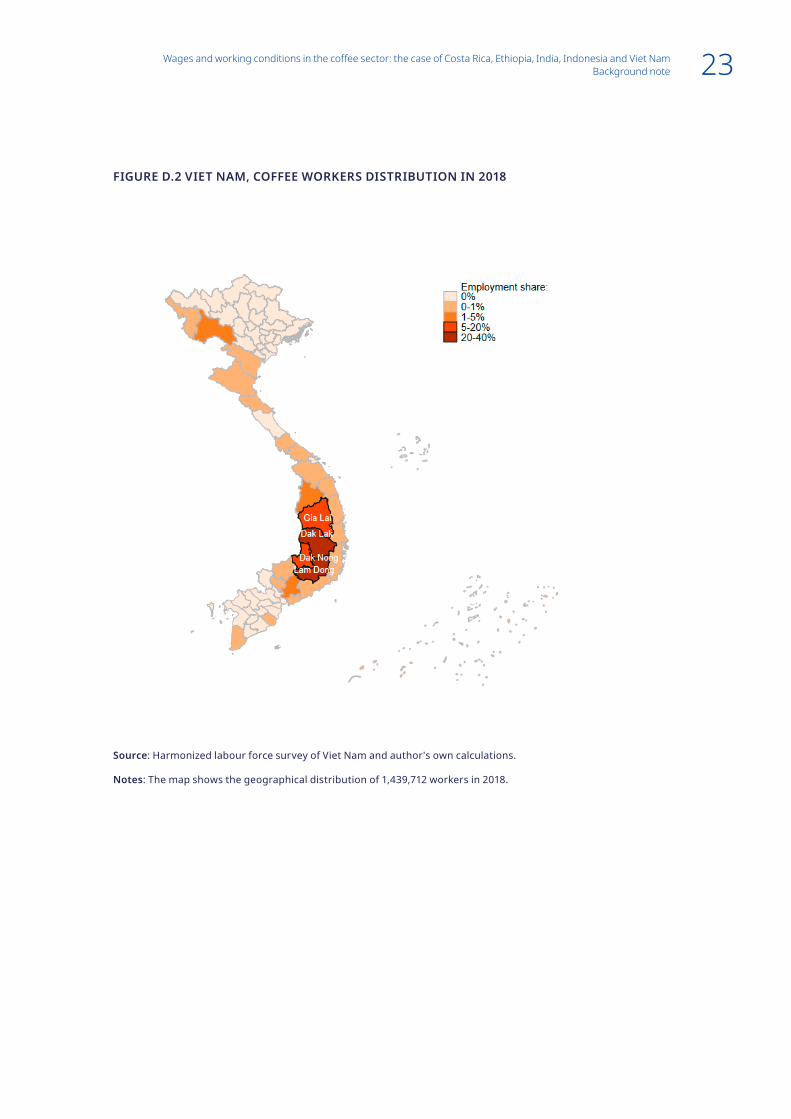
FIGURE D.2 VIET NAM, COFFEE WORKERS DISTRIBUTION IN 2018
Source: Harmonized labour force survey of Viet Nam and author's own calculations.
Notes: The map shows the geographical distribution of 1,439,712 workers in 2018.
Wages and working conditions in the coffee sector: the case of Costa Rica, Ethiopia, India, Indonesia and Viet NamBackground note 23
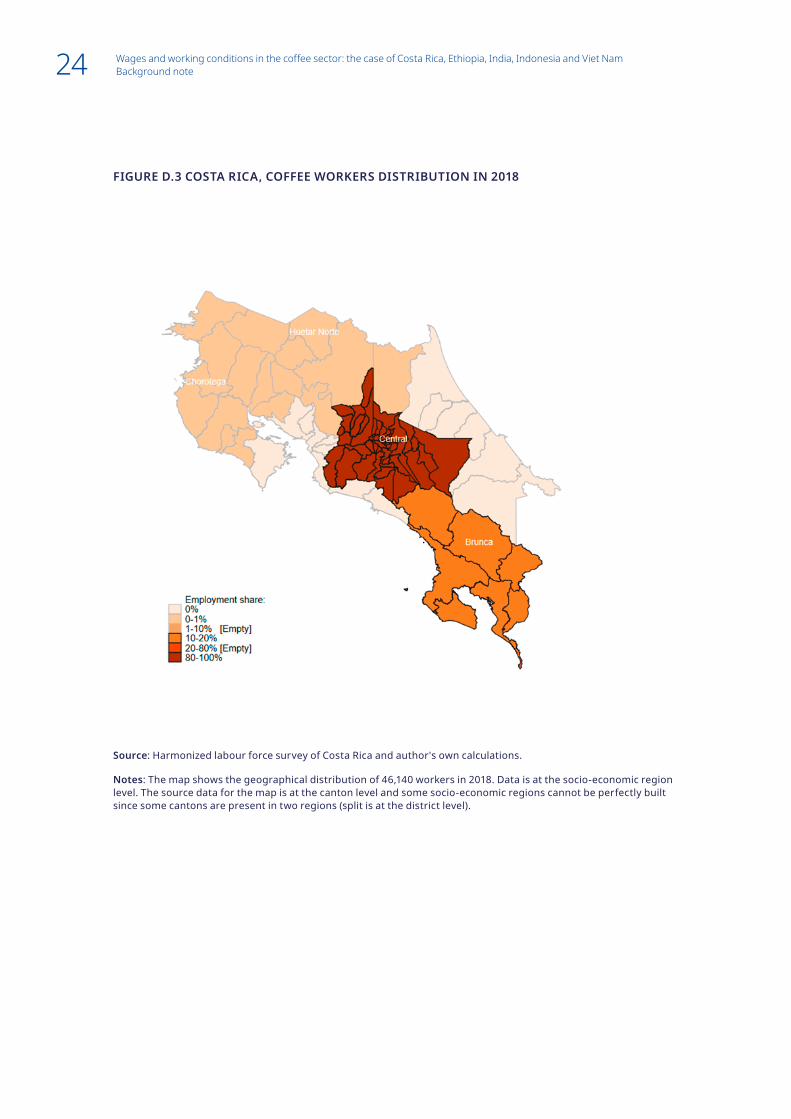
FIGURE D.3 COSTA RICA, COFFEE WORKERS DISTRIBUTION IN 2018
Source: Harmonized labour force survey of Costa Rica and author's own calculations.
Notes: The map shows the geographical distribution of 46,140 workers in 2018. Data is at the socio-economic region level. The source data for the map is at the canton level and some socio-economic regions cannot be perfectly built since some cantons are present in two regions (split is at the district level).
Wages and working conditions in the coffee sector: the case of Costa Rica, Ethiopia, India, Indonesia and Viet NamBackground note24

FIGURE D.4 ETHIOPIA, COFFEE WORKERS DISTRIBUTION IN 2016
Source: Harmonized labour force survey of Ethiopia and author's own calculations.
Notes: The map shows the geographical distribution of 26,177,404 workers in 2016.
Wages and working conditions in the coffee sector: the case of Costa Rica, Ethiopia, India, Indonesia and Viet NamBackground note 25

FIGURE D.5 ETHIOPIA, COFFEE OUTPUT DISTRIBUTION IN 2016
Source: Harmonized labour force survey of Ethiopia and author's own calculations.
Notes: The map shows the geographical distribution of 533,860,105 kg. of coffee in 2016.
Wages and working conditions in the coffee sector: the case of Costa Rica, Ethiopia, India, Indonesia and Viet NamBackground note26

© International Labour Organization 2020
Contact details International Labour OrganizationRoute des Morillons 4 CH-1211 Geneva 22 Switzerland
Inclusive Labour Markets, Labour Relations and Working Conditions Branch