Embed Size (px)
Citation preview

This is an electronic reprint of the original article.This reprint may differ from the original in pagination and typographic detail.
Powered by TCPDF (www.tcpdf.org)
This material is protected by copyright and other intellectual property rights, and duplication or sale of all or part of any of the repository collections is not permitted, except that material may be duplicated by you for your research use or educational purposes in electronic or print form. You must obtain permission for any other use. Electronic or print copies may not be offered, whether for sale or otherwise to anyone who is not an authorised user.
Marscher, Alan P.; Jorstad, Svetlana G.; Williamson, Karen E.; Lähteenmäki, Anne;Tornikoski, Merja; Hunter, John M.; Leidig, Katya A.; Mobeen, Muhammad Zain; VeraRodríguez, Rafael; Chamani Velasco, WaraX-Ray, UV, and Radio Timing Observations of the Radio Galaxy 3C 120
Published in:Astrophysical Journal
DOI:10.3847/1538-4357/aae4de
Published: 10/11/2018
Document VersionPublisher's PDF, also known as Version of record
Please cite the original version:Marscher, A. P., Jorstad, S. G., Williamson, K. E., Lähteenmäki, A., Tornikoski, M., Hunter, J. M., ... Chamani,W. (2018). X-Ray, UV, and Radio Timing Observations of the Radio Galaxy 3C 120. Astrophysical Journal,867(2), [128]. DOI: 10.3847/1538-4357/aae4de

X-Ray, UV, and Radio Timing Observations of the Radio Galaxy 3C 120
Alan P. Marscher1 , Svetlana G. Jorstad1,2 , Karen E. Williamson1 , Anne Lähteenmäki3,4, Merja Tornikoski3 ,John M. Hunter1, Katya A. Leidig1, Muhammad Zain Mobeen1, Rafael J. C. Vera3,4, and Wara Chamani3,41 Institute for Astrophysical Research Boston University 725 Commonwealth Avenue, Boston, MA 02215, USA; [email protected]
2 Astronomical Institute St. Petersburg State University Universitetskij Pr. 28 Petrodvorets 198504 St. Petersburg, Russia3 Aalto University Metsähovi Radio Observatory Metsähovintie 114 FI-02540 Kylmälä, Finland
4 Aalto University Department of Electronics and Nanoengineering P.O. Box 15500 FI-00076 Aalto, FinlandReceived 2018 July 5; revised 2018 September 5; accepted 2018 September 25; published 2018 November 7
Abstract
We report the results of monitoring of the radio galaxy 3C120 with the Neil Gehrels Swift Observatory, VeryLong Baseline Array, and Metsähovi Radio Observatory. The UV-optical continuum spectrum and R-bandpolarization can be explained by a superposition of an inverted-spectrum source with a synchrotron componentcontaining a disordered magnetic field. The UV-optical and X-ray light curves include dips and flares, whileseveral superluminal knots appear in the parsec-scale jet. The recovery time of the second dip was longer atUV-optical wavelengths, in conflict with a model in which the inner accretion disk (AD) is disrupted during a dipand then refilled from outer to inner radii. We favor an alternative scenario in which occasional polar alignments ofthe magnetic field in the disk and corona cause the flux dips and formation of shocks in the jet. Similar toobservations of Seyfert galaxies, intra-band time lags of flux variations are longer than predicted by the standardAD model. This suggests that scattering or some other reprocessing occurs. The 37 GHz light curve is well-correlated with the optical-UV variations, with a ∼20 day delay. A radio flare in the jet occurred in a superluminalknot 0.14 milliarcseconds downstream of the 43 GHz “core,” which places the site of the preceding X-ray/UV/optical flare within the core 0.5–1.3pc from the black hole. The inverted UV-optical flare spectrum can beexplained by a nearly monoenergetic electron distribution with energy similar to the minimum energy inferred inthe TeV γ-ray emitting regions of some BLLacertae objects.
Key words: accretion, accretion disks – galaxies: active – galaxies: individual (3C 120) – radio continuum: galaxies –ultraviolet: galaxies – X-rays: galaxies
Supporting material: data behind figure
1. Introduction
The connection between the accretion disk (AD) and the jetsof active galactic nuclei (AGN) is a key aspect of our physicalpicture of how these extremely energetic objects operate. Thereare, however, only a small number of AGN with luminous,relativistic jets where emission from the inner AD plus coronaof hot electrons is not overwhelmed by nonthermal emissionfrom one of the two jets. One of these is the Fanaroff–Riley 1(FR 1) (Fanaroff & Riley 1974) radio galaxy 3C120(z=0.033). The mass of the central black hole in 3C120, asdetermined from time delays between variations in the opticalcontinuum and emission-line fluxes (“reverberation mapping”),combined with the virial theorem, is M5.6 0.5 107 ´ (Bentz & Katz 2015), This mass is similar to that obtained fromcomparing the break in the X-ray power spectral density to thatof Cygnus X-1 (Chatterjee et al. 2009; Marshall et al. 2009).Previous Rossi X-ray Timing Explorer and Very Long BaselineArray (VLBA) observations of 3C120 have revealed that theemergence of an apparently superluminal radio knot in the jet ispreceded by a dip in the X-ray flux (Marscher et al. 2002;Chatterjee et al. 2009). Persistent Fe Kα emission lines in theX-ray spectrum of 3C120 (e.g., Eracleous et al. 2000; Ogleet al. 2005) imply that the bulk of its X-ray emission originatesin the AD-corona system. Observations of nine such dip-ejection events and a similar X-ray spectrum in the FR2 radiogalaxy 3C111 (Chatterjee et al. 2011) suggest that thebehavior is a general characteristic of radio galaxies.
At radio frequencies, 3C 120 possesses blazar-like characteristics:variability on timescales of weeks to years and a one-sided parsec-scale jet with bright superluminal knots ejected 2–6 times per yearat apparent speeds of 3–9c (Gómez et al. 2001a; Jorstad et al. 2005,2017; Chatterjee et al. 2009; Casadio et al. 2015). The mean timedelay of 68±14 days between X-ray dips and the passage ofsuperluminal knots through the 43GHz “core” (nearly unresolved,bright emission feature at the upstream end of the jet in 43GHzVLBA images) in 3C120 indicates that the core lies ∼0.5–1 pcfrom the corona (Marscher et al. 2002; Chatterjee et al. 2009) and isprobably a standing shock in the jet.While the temporary drop in X-ray flux followed by the
appearance of a superluminal radio knot in the jet suggests thatradio galaxies and black hole X-ray binary systems (Fenderet al. 2004) behave in a similar fashion, there are importantdifferences, as noted by Chatterjee et al. (2009) and Punslyet al. (2015). The inner AD surrounding a supermassive blackhole, as in 3C120, is not hot enough to emit X-rays. Rather,the emission from the AD is at UV and longer wavelengths.The primary X-rays therefore originate in the corona of hotelectrons, which scatters optical-UV photons emitted by theAD up to X-ray energies (e.g., Fabian et al. 2015, 2017). In thestandard model, some of these X-rays penetrate into the AD,where they are re-processed to produce the “reflection”spectrum that includes the Fe Kα line (e.g., Ogle et al. 2005;Lohfink et al. 2013) and UV-optical continuum (e.g., McHardyet al. 2014; Gardner & Done 2017).
The Astrophysical Journal, 867:128 (16pp), 2018 November 10 https://doi.org/10.3847/1538-4357/aae4de© 2018. The American Astronomical Society. All rights reserved.
1

Two distinct models have emerged to explain the observedX-ray/radio link in 3C120. Lohfink et al. (2013) havesuggested that the jet–disk connection occurs via a jet cyclesimilar to that of X-ray binary systems. The cycle consists offour stages: (1) full AD; (2) disappearance of the innermostregions of the AD and ejection of matter out of the disk plane,causing an X-ray and UV-optical dip; (3) mass–energy ejectionalong the jet, resulting in a radio flare and the formation of anew superluminal knot; and (4) refilling of the AD from outerto inner radii. Under a model by Chatterjee et al. (2009), thebulk of the optical emission in 3C 120 is generated in the AD,while most of the X-ray continuum is produced by scattering inthe corona of mainly UV radiation emitted by the AD. In thismodel, the corona is actually the base of the jet, very close tothe black hole, as proposed for X-ray binaries (Markoffet al. 2005) and AGN (King et al. 2017). An increase in thespeed of flow through the base lowers the density of Compton-scattering electrons, causing a dip in the X-ray flux whilesending a shock wave down the jet. The shock becomes visiblein VLBA images ∼2 months later as a superluminal knotemerging from the core.
The Lohfink et al. (2013) model predicts that the UVcontinuum should drop along with the X-rays during a flux dip,and then recover first at longer and then at shorter wavelengths.The decrease in UV flux should occur slightly ahead of the startof the X-ray decline. Under the Chatterjee et al. (2009) model,the UV-optical flux should decline after the X-ray dip starts, ifthe temperature of the UV-optical emitting region changes inresponse to the lower X-ray flux. In order to test thesepredictions, we carried out a nine-month campaign of monitor-ing observations of 3C 120 with the X-Ray Telescope (XRT)and UV-Optical Telescope (UVOT) of the Earth-orbiting NeilGehrels Swift Observatory (hereafter, Swift). In order to monitorchanges in the relativistic jet, we imaged 3C120 with the VLBAat 43GHz as part of the VLBA-BU-BLAZAR program (Jorstad& Marscher 2016). Here, we present and interpret the resultingmulti-band X-ray, UV, and optical light curves, at a cadence of2–3 observations per week, as well as roughly monthly VLBAimages of 3C120. Section 2 describes the observations and datareduction procedures, Section 3 presents the results of theobservations, and Section 4 discusses and interprets the results.We summarize our conclusions in Section 5.
2. Observations and Data Analysis
2.1. X-Ray
Swift observed 3C120 approximately three times per weekbetween 2016 July 14 and 2017 March 27 with the XRT over aphoton energy range of 0.3–10 keV. Most of the observationswere in Window Timing mode in order to avoid pileup ofphotons in individual pixels in between data readouts. Weprocessed the data with the standard HEAsoft (Arnaud 1996)package [versions 6.19 (2016 data) and 6.21 (2017 data)],using the task xrtpipeline to identify times of acceptabledata quality and to calibrate the data. This included examina-tion of the path of 3C120 across the detector, which led to theexclusion of a small number of observations during which3C120 was outside the field over �50% of the exposure time.We created an ancillary response file with correction for thepoint spread function via task xrtmkarf, and then rebinnedthe data with task grppha in order to include at least20 photons in each energy channel. We used XSPEC
(Arnaud 1996) to fit the spectra with a single power-lawmodel, setting the neutral hydrogen column density to a fixedGalactic value of 1.11×1021 cm−2 (Dickey & Lockman1990). We employed the Monte Carlo method in XSPEC todetermine the goodness of the fit at each epoch. A χ2 perdegree of freedom less than 2 was required to consider the fit tobe acceptable. Uncertainties in the spectral index, normal-ization, and integrated flux are given at the 90% confidencelevel.Lohfink et al. (2013) fit the X-ray spectrum of 3C120 with a
model that includes a power-law soft-excess component. Wecan place a limit on the level of such a soft excess in our Swiftspectra by adding a second power-law component anddetermining how high its flux could be without degrading theχ2 of the fit to the data to a statistically unacceptable value.Lampton et al. (1976) determined that, for three adjustableparameters, an increase in the χ2 by 11.3 from the best-fit valueallows one to reject a spectral model at the 99% confidencelevel. We fit the X-ray spectra from four epochs duringrelatively quiescent periods of the X-ray light curve with thedouble power-law model. We set the power-law photon indexof the tentative soft-excess spectrum to 2.5—the lowest valuederived for the Lohfink et al. (2013) spectral fits (whichminimizes the disagreement with our data)—and allowed thespectral index of the main power-law component, as well asthe flux normalizations of both components, to vary. Addingthe soft excess component did not improve the fit at any of theepochs. We found that the maximum allowed normalization ofthe soft excess is 3×10⁻³ photons keV−1 cm−2 s−1, abouthalf of the lowest value in the Lohfink et al. (2013) model.
2.2. Ultraviolet and Optical
Simultaneous with the XRT observations, fluxes weremeasured in the UVW2 (central wavelength of 192.8 nm),UVM2 (224.6 nm), UVW1 (260.0 nm), U (346.5 nm), andV (546.8 nm) bands of the UVOT onboard Swift. Weincorporated the current (at the time of data processing)version of the calibration files with the current version of theHEAsoft package to reduce the data. Fluxes were extractedover an aperture of radius 5″after subtraction of thebackground flux measured within a source-free region ofradius 20″. We summed all exposures composing each imagewith uvotimsum, and processed the data with uvot-source with parameter σ=5. Five of the UVOT fluxes thusderived were isolated outliers, with the UVW2 flux lower thancontiguous points by 30–50% and fluxes at the other bandslower by smaller fractions. Similar outliers have beeninvestigated by Gelbord et al. (2015), who determined thatthey are caused by bad pixels on the CCD. Therefore, we haveexcluded the outliers from our data set.We supplement the Swift data with I, R, V, and B band
fluxes and linear polarization measured with the 1.83 m PerkinsTelescope of Lowell Observatory in Flagstaff, AZ. The dataacquisition, reduction, and analysis procedures are described byJorstad et al. (2010). The polarization is corrected for theinterstellar value of 1.22±0.06% in position angle 98°±1°,as determined from observations of three comparison stars inthe field, which we assume to be intrinsically unpolarized.We apply corrections for interstellar extinction with values
from Schlafly & Finkbeiner (2011) listed in the NASAExtragalactic Database (NED) for the I, R, V, B, and U filters.For the UV data, we adopt the interstellar extinction curve of
2
The Astrophysical Journal, 867:128 (16pp), 2018 November 10 Marscher et al.

Fitzpatrick (1999) with RV=3.1. The values of extinction thusderived are Aλ=0.448, 0.645, 0.816, 1.079, 1.289, 1.734,2.412, and 2.132 for the I, R, V, B, U, UVW1, UVM2, andUVW2 bands, respectively.
2.3. Light Curve at 37 GHz
The 13.7 m radio telescope at Aalto University MetsähoviRadio Observatory includes 3C120 in its regular monitoringprogram, measuring its millimeter-wave flux density multipletimes per month during the period covered by the current study.The observations utilized a 1 GHz band dual beam receiverwith a central frequency of 36.8 GHz. Flux densities arecalibrated by observations of DR21, with NGC 7027, 3C274,and 3C84 serving as secondary calibrators. A detaileddescription of the data reduction and analysis is given inTeräsranta et al. (1998).
2.4. Millimeter-wave VLBA Imaging
Since early 2012, we have routinely (roughly once per month)observed 3C120 with the VLBA under the VLBA-BU-BLAZARmonitoring project. Each 24 hr session includes 40–48 minutes ofobservations of 3C120, split into 10–13 scans of 3–5 minutedurations. After correlation of the data from the ten antennas withthe DiFX software correlator at the Long Baseline Observatorysite in Socorro, New Mexico, we calibrate the data with theAstronomical Image Processing System (AIPS) software providedby the National Radio Astronomy Observatory. We then useDifmap (Shepherd 1997) to perform imaging and self-calibrationthrough an iterative procedure. This involves making apreliminary image that is then used in the AstronomicalImage Processing Software (AIPS) (van Moorsel et al.1996) routine CALIB, which independently adjusts the left andright circularly polarized visibility phases, guided by the image,before final imaging and self-calibration in Difmap. Calibration ofthe electric-vector position angle χ of the linear polarization isbased on the multi-faceted approach of Jorstad et al. (2005).Jorstad et al. (2017) list further details of the data analysisprocedures.
In order to quantify the emission structure in the jet, at eachepoch we use the Difmap model fitting procedure to divide thesource into a number of emission components, each with acircular Gaussian intensity distribution. The starting model isthe best-fit model of the previous epoch. The model fitdetermines the position relative to the core, flux density, andfull width at half maximum (FWHM) angular size of eachcomponent. Jorstad et al. (2017) discuss the uncertainties in themodel-fit parameters.
3. Results
3.1. Light Curves
Figure 1 presents the Swift X-ray light curves, with theunsmoothed 0.3–10 keV data in the top panel, and smoothed0.3–10 keV, 2–10 keV (hard X-ray), and 0.3–2 keV (softX-ray) data in the next three panels. The bottom panel displaysthe smoothed spectral index α, where the flux densityFν∝ν−α. The smoothing is over five consecutive points,with the flux at the epoch of the data point assigned 40%weight, contiguous points given 20% weight, and points twoepochs earlier or later given 10% weight. (The first and lastdata points are not smoothed, while the second and penultimate
are smoothed over three epochs.) The smoothed data facilitatevisual comparison with the UV and optical light curves, whosecharacteristic timescales of variation are longer than that ofthe X-ray flux. However, in the correlation analysis below, weuse the unsmoothed values.Figure 2 displays the UV and optical light curves of 3C120,
along with the smoothed 0.3–10 keV X-ray data. Minima in thelight curves (“dips”) are denoted by red vertical dashed linesand numbered for reference. In order to be classified as a dip,the minimum in flux needs to be apparent at all bands. Thelocal minimum near MJD 57760 is not included becausethe flux exceeds the mean flux in the UV-optical bands, andthe minimum appears to be part of a double-flare outburstrather than a dip as defined by Chatterjee et al. (2009). Figure 3expands the portions of the light curves that include dips 1and 2.The top panel of Figure 4 presents the 37 GHz light curve of
3C120 during our Swift monitoring campaign, as well asduring the previous year. The earlier data include the highest-amplitude millimeter-wave outburst ever observed in 3C120.In Section 4.4, we compare the multi-waveband behaviorduring this event with that of the strong outburst in 2017. Forcomparison, the V-band optical light curve is also displayed, asare the R-band degree (P) and electric-vector position angle (χ)of linear polarization. There is a V-band counterpart to eachradio flare.
3.2. Changes in the Jet
Figure 5 presents a time sequence of 16 VLBA images at afrequency of 43 GHz from 2016 June to 2017 August. Theangular resolution of the longest baselines is ∼0.1 mas along
Figure 1. Light curves of 3C120 and (bottom panel) energy spectral indexfrom Swift XRT observations over the indicated X-ray energy ranges. Exceptfor the top panel, the values plotted are smoothed over five consecutiveobservations (see text). The data used to create this figure are available.
3
The Astrophysical Journal, 867:128 (16pp), 2018 November 10 Marscher et al.

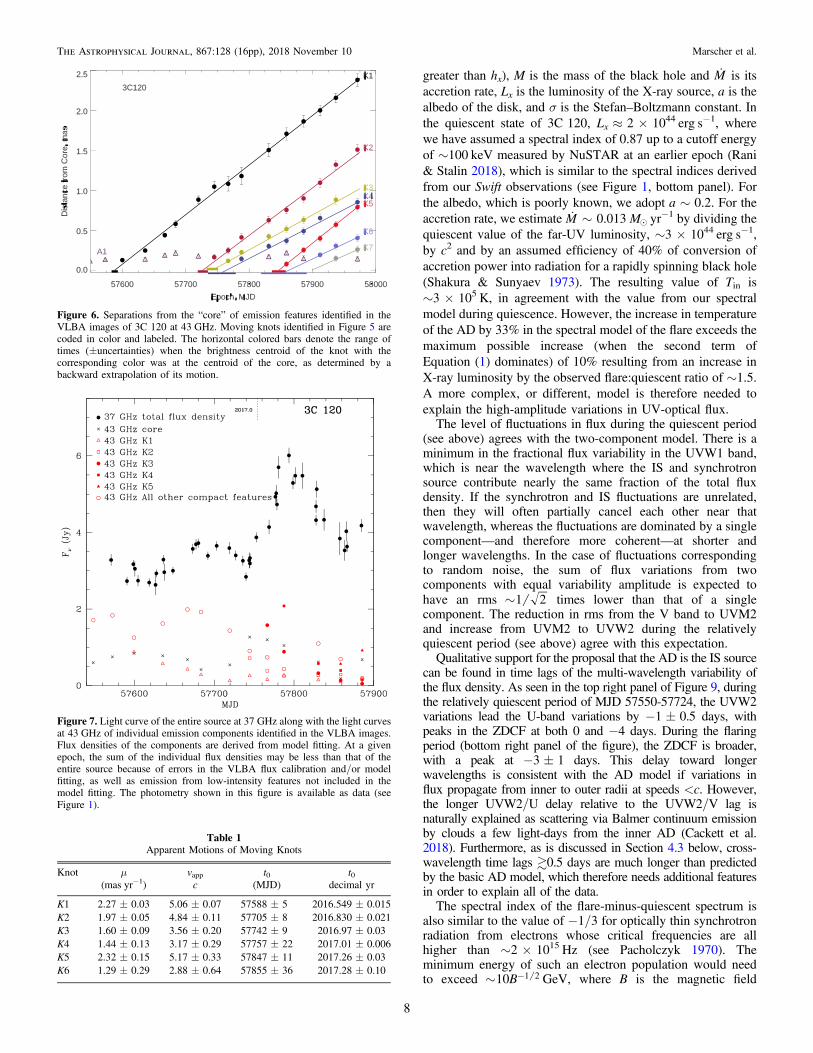
the direction of the jet. At a distance of 140 Mpc (for a Hubbleconstant of 70 km s−1 Mpc−1), 0.1 mas corresponds to a lengthof 0.064 pc projected on the sky. For an angle θ between the jetand the line of sight (∼10° Jorstad et al. 2017), the deprojectedconversion is 0.1 mas=0.36 (sin 10°/sin θ) pc. The “core” isthe bright feature (A0 in Figure 5) at the eastern end of the jet,and is presumed to be stationary. In compact extragalactic radiosources, the properties of the parsec-scale core are consistentwith those expected from a standing conical shock in the jet(Cawthorne 2006, 2013; Marscher 2014; Marscher et al. 2017).The images reveal a second quasi-stationary emission feature,A1, located 0.14 mas (0.51 pc for θ=10°) downstream of thecore. Figure 6 plots the separation of each knot from the core asa function of time (as determined by model fitting; see above),with a straight-line fit to the apparent motion. Extrapolation ofthe fit to zero separation yields the “ejection” time t0 when thebrightness centroid of each moving knot coincided with that ofthe core. Table 1 lists the apparent motions and values of t0 forknots K1 to K6; there are insufficient data in Figure 6 todetermine the motion of K7.
Figure 7 displays the 37 GHz flux density of the entiresource versus time, along with the flux densities of thebrightest individual emission features identified on the43 GHz VLBA images. It is apparent that the maximum influx density at MJD 57795 is mainly the result of increases influx density of superluminal knots K3 and K4 when they were0.17 and 0.25 mas, respectively, downstream of the core (seeFigure 6).
3.3. Correlation Analysis
In order to relate the flux variations across the X-ray, UV,and optical bands, we use the z-transformed discrete correlationfunction maximum likelihood methods ZDCF (Alexander1997) and PLIKE (Alexander 2013), which have been shownto determine correlations of unevenly sampled data effectively.In order to assess the statistical significance of the correlations,we create 3000 artificial light curves (ALCs) at each wavebandby using the actual data points. As in Williamson et al.(2014, 2016), active periods are identified and randomlyassigned start dates from the list of actual dates of observation.After this procedure, which preserves the structure of flarespresent in the light curves, the remaining observed fluxes arerandomly assigned to vacant actual observation dates. TheALCs of the two wavebands being correlated are thenrandomly paired and processed with the ZDCF routine. AZDCF value is considered to be statistically significant at the95% level if its magnitude exceeds that of 95% of the artificialvalues. The flux redistribution/random subset selection method(Peterson et al. 1998) was also employed as a check on theZDCF results. We found complete consistency between the twomethods.Figure 8 presents the cross-correlations of the Swift data.
The hard (2–10 keV) and soft (0.3–2 keV) X-ray variations arewell-correlated, as are the UV and optical bands. Thecorrelation between the X-ray and UV variations, however, ismore complex. As seen in the middle left panel in Figure 8, theX-ray/UVW2 correlation is moderately strong (peak ZDCF of0.5) and flat from −12 days (X-ray leading) to zero. A non-zerolag over a ∼40 day time span is apparent in the light curvesexhibited in Figure 2, starting with the event designated“dip 2.” In order to determine whether this change in lag isstatistically significant, we perform the correlation analysisseparately on two halves of the light curves: from MJD 57550to 57724, and from 57726 to 57850. The result is displayed inFigure 9. The ZDCF for the first time range peaks sharply atzero lag, with a somewhat lower maximum value of 0.41 (atleast partly caused by the lower flux level, which increases thefraction of the flux contained in non-variable—or slowlyvarying—components, such as starlight from the host galaxy).In contrast, there is a maximum of 0.48 at −6 days and from−10 to −14 days for the second time interval, with lesspronounced peaks of 0.31, 0.36, and 0.38 at lags of zero, −20,and −26 days, respectively. All of these local maxima of theZDCF are significant beyond the 95% level. The difference inthe correlations between the first and second halves of ourmonitoring period implies that the multi-waveband behaviorwas more complex during the period of the double flare thanduring the previous, more quiescent period.We determine the cross-wavelength time lags by calculat-
ing the centroids of the cross-correlations, calculated over thearea above 80% of the maximum ZDCF value. We obtain
Figure 2. Smoothed 0.3–10 keV X-ray and unsmoothed UV-optical lightcurves of 3C120 from Swift observations. Three minima in the light curves aremarked as “dips” with red vertical dashed lines, a flare is indicated by a verticaldashed line, and epochs t0 when a superluminal knot passed the “core” of thejet, as seen in 43 GHz VLBA images, are denoted by upward arrows in thebottom panel. The uncertainty in each epoch is denoted by a horizontal line.The photometry shown in this figure is available as data (see Figure 1).
4
The Astrophysical Journal, 867:128 (16pp), 2018 November 10 Marscher et al.

the following lags, with negative lags corresponding tovariations at the first waveband listed leading those atthe second waveband. Hard/soft X-ray: −0.25±0.68 days;X-ray(0.3–10 keV)/UVW2: −6.2±2.4 days; UVW2/UVM2:−0.87±1.0 days; UVW2/UVW1: −1.2±1.0 days; UVW2/U: −3.3±1.0 days; and UVW2/V: −1.4±1.6 days. For thecorrelations during two separate time periods displayed inFigure 9, we find lags of: X-ray (0.3–10 keV)/UVW2: +0.1±0.5 days and UVW2/U: −1±1 days over MJD 57550-57724,and X-ray (0.3–10 keV)/UVW2: −10±3 days and UVW2/U:3±2 days for MJD 57726-57850. The lags between the X-rayand both UVW2 and U variations are consistent with thoseobtained by Buisson et al. (2017), whose uncertainties are higherowing to sparser time coverage.
3.4. Linear Polarization
The optical linear polarization measurements are plotted inthe bottom two panels of Figure 4. Values range from ∼1 to2.2%, with uncertainties of ±0.1–0.2%. The electric-vectorposition angle χ lies within ∼45° of the jet axis at all of theepochs. The VLBA images presented in Figure 5 indicatethe polarized intensity and EVPAs at various locations in theparsec-scale jet. As has been the case at most earlier epochs(Gómez et al. 2001a, 2001b), polarization is not detected infeature A0 (the “core”) at any of the epochs. This could resultfrom either Faraday depolarization or a highly disorderedmagnetic field. Stationary feature A1 is significantly polarizedonly at epochs when a superluminal knot passes through it. The
Figure 3. Expanded view of the light curves (without smoothing) over time spans that include dip 1 (left side) and dip 2 (right side). The red vertical dashed lines markthe epochs of minimum UVW2 flux, while the horizontal blue lines indicate the pre-dip flux level, obtained by averaging the three data points immediately precedingthe corresponding dip. The photometry shown in this figure is available as data (see Figure 1).
5
The Astrophysical Journal, 867:128 (16pp), 2018 November 10 Marscher et al.

value of χ when this occurs is usually ∼90°, parallel to theinner jet direction and within ∼45° of the optical EVPA.
4. Discussion
4.1. Modeling the UV-Optical Emission
The X-ray, UV, and optical light curves displayed inFigures 1 and 2 are characterized by major dips and flares, aswell as apparently random, lower-amplitude fluctuations.(Three dips and the most pronounced flare at UV-opticalwavelengths are marked in Figure 2.) This behavior is similarto that reported in 2002–08 by Chatterjee et al. (2009),although the X-ray and R-band quiescent flux levels are∼20% and ∼100% higher, respectively, in 2016–17 relativeto the average levels in 2002–08. During the relativelyquiescent period of MJD 57683-57717, the error-correctedrms variability (see Buisson et al. 2017) after removal ofa linear trend is V band: 0.81±0.30 mJy (14±5.2%),U band: 0.56±0.20 mJy (9.7± 3.5%), UVW1 band: 0.42±0.16 mJy (7.4± 2.8%), UVM2 band: 0.41±0.16 mJy(5.7± 2.2%), UVW2 band: 0.52±0.14 mJy (6.7± 1.9%),and X-ray (0.3–10 keV): (8.1±3.0)×10−12 erg cm−2 s−1
(14±5.2%). A least-squares straight line with αrms=0.48±0.22 passes within 0.7σ of all of the UV-optical rms-variabilitydata points, although the U, UVW1, and UVM2 measurementsall lie below the line and the UVW2 value lies above. Buissonet al. (2017) measured a quite different slope for 3C120,αrms=−0.21±0.10 in 2011–12, similar to their values forradio-quiet Seyfert galaxies. This implies a more significantsteep-slope, variable UV-optical component in 3C120 in2016–17.
Between dips 2 and 3, the X-ray, UV, and optical lightcurves are dominated by a double flare. The top panel ofFigure 10 displays the UV-optical spectrum on MJD 57655, a
date during a relatively quiescent period when we obtaineddata from all optical and UV bands listed in Section 2.2. Themiddle panel of Figure 10 presents the spectrum at thepeak of the second flare on MJD 57783. (We have notsubtracted the flux of emission lines or starlight from the hostgalaxy.) The spectrum at both epochs can be fit by a simplepower law that is flatter during the flare, when the spectralindex α=0.46±0.03, compared with the quiescent valueof 0.71±0.05. The power laws are too steep and extendto frequencies too high to be explained by a superpositionof blackbody emission from hot dust, starlight, and the AD,as found in several quasars (Kishimoto et al. 2008). Instead,the spectra are consistent with synchrotron radiation, at leastat the longer optical wavelengths. In this case, the flatteningof the UV-optical spectrum during the flare would correspondto an increase in efficiency of acceleration of electronstoward higher energies. This interpretation is consistentwith the optical linear polarization of 1–2% measured duringthe Swift monitoring (see Figure 4), as is discussed inSection 4.4.The zero lag between the X-ray and UV-optical variations
during the quiescent period (see Section 3.3 and Figures 8and 9) requires the UV emission region to lie within 0.5 light-days (the uncertainty in the peak lag value) of the X-ray source,and could be coincident with it. One possibility is that theX-ray and UV-optical emission both originate in the base of thejet, as has been proposed for X-ray binaries by Markoff et al.(2005). However, models for relativistic jet formation that relyon strong helical magnetic fields within ∼1000Rg of the base(e.g., Blandford & Znajek 1977; Blandford & Payne 1982;Vlahakis & Königl 2004; McKinney & Narayan 2007;Tchekhovskoy et al. 2011) predict a high degree of linearpolarization unless the jet points within ∼2° of our line of sight(Lyutikov et al. 2005), contrary to observations (see above;Jorstad et al. 2017).An interpretation that explains various aspects of the data
incorporates two main UV-optical emission components: aninverted-spectrum (IS) source plus a steep-spectrum synchro-tron source. In order to assess whether the AD could be the ISsource, we integrate the Planck function over radius to producea thin-disk spectrum, and add a power-law nonthermalspectrum Fν∝ν−α for both the quiescent and flaring states.The best-fit model, which is compared to the observed spectrain Figure 10, combines a synchrotron component with α=1.2with an AD of inner radius rin=1.3×1013 cm (1.6Rg, whereR GM cg
2= is the gravitational radius for a black hole ofmass M), outer radius rout�1.3×1016 cm (5.0 light-days),and temperature as a function of distance r from the black holeT r T r rin in
3 4= -( ) ( ) . In the model, Tin=3.0×10⁵ K at thequiescent epoch MJD 57655. The thermal component has aninverted UV-optical spectrum with the standard AD spectralindex of α=−1/3. In order to reproduce the flattening of thespectrum during the flare, we increase the flux of only the ADcomponent by raising Tin by 33% to 4.0×10⁵ K at the peak ofthe flare while keeping the synchrotron component constant. Asmaller range of AD radii would result in curvature of thespectrum well beyond the observational constraint. A largervalue of rin would increase the flux by increasing the area of thedisk at a given temperature, and would thus require a small areafilling factor, r1.3 10 cm13
in2´( ) , to match the observed flux
level. The flare minus quiescent spectrum, displayed in thebottom panel of Figure 10, rises with frequency, and can be fit
Figure 4. Top panel: light curve of 3C120 at 37 GHz from measurementsmade at the Metsähovi Radio Observatory. Second panel from top: opticalV-band light curve; bottom two panels: degree and electric-vector positionangle of optical R-band linear polarization. The direction of the innermost jet in43 GHz VLBA images is indicated in the bottom panel for comparison. Thephotometry shown in this figure is available as data (see Figure 1).
6
The Astrophysical Journal, 867:128 (16pp), 2018 November 10 Marscher et al.

by a power law with spectral index α=−0.28±0.07,consistent with the theoretical value of −1/3. (Note that thisdifference spectrum subtracts any steady emission componentsuch as starlight from the host galaxy.)
The value of Tin agrees roughly with the expectations of anAD model. When irradiated by a small (compared to the ADdimensions) X-ray source with luminosity Lx located at a height
hx above the center of the disk, the model gives
T rGMM
r
a L h
r
3
8
1
4, 1x x
x3 3
1 4
ps ps» +
-⎡⎣⎢
⎤⎦⎥( )
˙ ( ) ( )
(Cackett et al. 2007; Lira et al. 2011), where rx is the distancebetween the X-ray source and disk at radius r (assumed to be
Figure 5. VLBA images of 3C120 at 43 GHz. Contours: total intensity in factors of 2 starting at 0.25% of the global peak of (left panel) 1.17 Jy beam−1 (attained on2016 October 6), and (right panel) 2.41 Jy beam−1 (attained on 2017 February 4), with images at these two epochs including an extra contour at 95%. Color: linearlypolarized intensity. Red line segments: electric-vector position angle of linear polarization. The “core” (A0), stationary feature A1, and superluminal knots (Kn) areindicated. The elliptical Gaussian restoring beam of FWHM dimensions 0.34×0.14 mas with major axis along position angle −10° is displayed in the bottom leftcorner of each panel.
7
The Astrophysical Journal, 867:128 (16pp), 2018 November 10 Marscher et al.
greater than hx), M is the mass of the black hole and M is itsaccretion rate, Lx is the luminosity of the X-ray source, a is thealbedo of the disk, and σ is the Stefan–Boltzmann constant. Inthe quiescent state of 3C120, Lx≈2×1044 erg s−1, wherewe have assumed a spectral index of 0.87 up to a cutoff energyof ∼100 keV measured by NuSTAR at an earlier epoch (Rani& Stalin 2018), which is similar to the spectral indices derivedfrom our Swift observations (see Figure 1, bottom panel). Forthe albedo, which is poorly known, we adopt a∼0.2. For theaccretion rate, we estimate M M0.013~ ˙ yr−1 by dividing thequiescent value of the far-UV luminosity, ∼3×1044 erg s−1,by c2 and by an assumed efficiency of 40% of conversion ofaccretion power into radiation for a rapidly spinning black hole(Shakura & Sunyaev 1973). The resulting value of Tin is∼3×10⁵ K, in agreement with the value from our spectralmodel during quiescence. However, the increase in temperatureof the AD by 33% in the spectral model of the flare exceeds themaximum possible increase (when the second term ofEquation (1) dominates) of 10% resulting from an increase inX-ray luminosity by the observed flare:quiescent ratio of ∼1.5.A more complex, or different, model is therefore needed toexplain the high-amplitude variations in UV-optical flux.The level of fluctuations in flux during the quiescent period
(see above) agrees with the two-component model. There is aminimum in the fractional flux variability in the UVW1 band,which is near the wavelength where the IS and synchrotronsource contribute nearly the same fraction of the total fluxdensity. If the synchrotron and IS fluctuations are unrelated,then they will often partially cancel each other near thatwavelength, whereas the fluctuations are dominated by a singlecomponent—and therefore more coherent—at shorter andlonger wavelengths. In the case of fluctuations correspondingto random noise, the sum of flux variations from twocomponents with equal variability amplitude is expected tohave an rms 1 2~ times lower than that of a singlecomponent. The reduction in rms from the V band to UVM2and increase from UVM2 to UVW2 during the relativelyquiescent period (see above) agree with this expectation.Qualitative support for the proposal that the AD is the IS source
can be found in time lags of the multi-wavelength variability ofthe flux density. As seen in the top right panel of Figure 9, duringthe relatively quiescent period of MJD 57550-57724, the UVW2variations lead the U-band variations by −1±0.5 days, withpeaks in the ZDCF at both 0 and −4 days. During the flaringperiod (bottom right panel of the figure), the ZDCF is broader,with a peak at −3±1 days. This delay toward longerwavelengths is consistent with the AD model if variations influx propagate from inner to outer radii at speeds <c. However,the longer UVW2/U delay relative to the UVW2/V lag isnaturally explained as scattering via Balmer continuum emissionby clouds a few light-days from the inner AD (Cackett et al.2018). Furthermore, as is discussed in Section 4.3 below, cross-wavelength time lags 0.5 days are much longer than predictedby the basic AD model, which therefore needs additional featuresin order to explain all of the data.The spectral index of the flare-minus-quiescent spectrum is
also similar to the value of −1/3 for optically thin synchrotronradiation from electrons whose critical frequencies are allhigher than ∼2×10¹⁵ Hz (see Pacholczyk 1970). Theminimum energy of such an electron population would needto exceed B10 1 2~ - GeV, where B is the magnetic field
Figure 6. Separations from the “core” of emission features identified in theVLBA images of 3C120 at 43 GHz. Moving knots identified in Figure 5 arecoded in color and labeled. The horizontal colored bars denote the range oftimes (±uncertainties) when the brightness centroid of the knot with thecorresponding color was at the centroid of the core, as determined by abackward extrapolation of its motion.
Table 1Apparent Motions of Moving Knots
Knot μ vapp t0 t0(mas yr−1) c (MJD) decimal yr
K1 2.27±0.03 5.06±0.07 57588±5 2016.549±0.015K2 1.97±0.05 4.84±0.11 57705±8 2016.830±0.021K3 1.60±0.09 3.56±0.20 57742±9 2016.97±0.03K4 1.44±0.13 3.17±0.29 57757±22 2017.01±0.006K5 2.32±0.15 5.17±0.33 57847±11 2017.26±0.03K6 1.29±0.29 2.88±0.64 57855±36 2017.28±0.10
Figure 7. Light curve of the entire source at 37 GHz along with the light curvesat 43 GHz of individual emission components identified in the VLBA images.Flux densities of the components are derived from model fitting. At a givenepoch, the sum of the individual flux densities may be less than that of theentire source because of errors in the VLBA flux calibration and/or modelfitting, as well as emission from low-intensity features not included in themodel fitting. The photometry shown in this figure is available as data (seeFigure 1).
8
The Astrophysical Journal, 867:128 (16pp), 2018 November 10 Marscher et al.

strength in Gauss. The maximum energy could not be greaterthan ∼3 times higher than the minimum. Otherwise, the softX-ray synchrotron flux would exceed the observed value; cf.the spectral energy distribution (SED) during the flare,displayed in Figure 11. Such a sharply peaked SED is apossible outcome of particle acceleration by magnetic recon-nection (see Petropoulou et al. 2016). In fact, models of veryhigh-energy γ-ray emission from BL Lacertae objects—whichare associated with FR1 radio sources—generally requireminimum energies of ∼10 GeV (e.g., Balokovic et al. 2016). InSection 4.4 below, we find that this alternative model for the IScomponent during the flaring period is consistent with a strongcorrelation found between the UV-optical and 37 GHz varia-tions of 3C120.
4.2. Dips in Flux
As is discussed in Section 1, the inner-disk disruptionscenario for 3C120 proposed by Lohfink et al. (2013) predictsthat, during dips in flux, the UV flux should decrease a shorttime before the X-ray flux. Because the inner disk is refilledfrom larger to smaller radii, the recovery of the flux to its pre-dip value should proceed from longer to shorter wavelengths ata propagation speed vrefill=c.As seen in Figure 3, during dip 1 the UVW2 flux decreased
by 15% prior to the first significant decrease (by about thesame percentage) in the X-ray flux one observation (2.2 days)later. However, a pre-dip X-ray flare, which is also apparentin the UVM2 data, took place immediately before the dip,
Figure 8. ZDCF cross-correlations (normalized) of selected unsmoothed light curves as indicated in each panel. The hard X-ray photon energy range is 2–10 keV,while the soft X-ray range is 0.3–2 keV. The correlation functions are smoothed over three lag times, with 50% weight for the central time and 25% weight for each ofthe preceding and succeeding times. Negative lags correspond to the first waveband listed leading the variations. Dotted curves delimit the 95% confidence level. Seethe text for details.
9
The Astrophysical Journal, 867:128 (16pp), 2018 November 10 Marscher et al.

compromising our ability to determine the start time of theX-ray dip. Compared with the UVW2 flux, the UVM2 andUVW1 fluxes reached their minima later, while the U-banddip was delayed by 4 days and its recovery was completed1–2 days later. The light curves at different wavelengths thereforepossess a similar overall pattern, as well as cross-wavelengthdiscrepancies, indicative of overlapping—but not identical—emission regions. While the earlier initial drop in UV relative toX-ray flux agrees with the Lohfink et al. (2013) picture, as doesthe later minimum at longer wavelengths, the recovery does notoccur earlier at longer wavelengths, contradicting the model.
A superluminal knot (K2; see Figures 5 and 6) passedthrough the core in the 43 GHz VLBA images about 75 daysafter the start of dip 1. This conforms with the range of timedelays reported by Chatterjee et al. (2009), who found a mean
delay of 68±14 days. At the apparent speed of K2,2.0 mas yr−1=4.3c, the knot traveled about 1.3 pc beforereaching the centroid of the core if the angle between thevelocity vector and line of sight is θ∼10°. A shorter distanceto the core was derived in Chatterjee et al. (2009), based on awider viewing angle.In contrast with dip 1, dip 2 (see Figure 3) started with a
decline in the X-ray flux, which reached its lowest level (34%below the pre-dip flux) 4.4 days before the UVW2 minimum(23% drop). As opposed to dip 1, the X-ray recovery led that atUV-optical wavelengths, although the immediate transitionfrom the dip to a flare complicates the interpretation if the flareoccurred through another process at another location. The earlyX-ray start implies that the dip was initiated by changes inthe corona rather than the AD. This conclusion is compatible
Figure 9. Cross-correlation function of (left) X-ray/UVW2 and (right) UVW2/U variations over time spans (top)MJD=57583-57724 and (bottom)MJD 57724-57840.Negative lags correspond to the first waveband listed leading the variations.
10
The Astrophysical Journal, 867:128 (16pp), 2018 November 10 Marscher et al.

with the Chatterjee et al. (2009) scenario (see Section 1).However, the UV-optical dips and recoveries were simulta-neous to within the uncertainties. This, alongside the >4 daytime lag between the X-ray and UVW2 dips, is difficult tounderstand if the change in physical conditions in the ADpropagates at a speed =c.
As was the case for dip 2, dip 3 began with a decrease inX-ray flux. However, our observational campaign ended beforethe flux recovered completely. Hence, we cannot perform ameaningful analysis of the behavior of the emission over theentire event.
A pair of new superluminal knots appeared after both dips2 (K3 and K4) and 3 (K5 and K6). It is possible that these knotsare examples of shock pairs, with both a forward (K3 and K5)and reverse (K4 and K6) shock. Casadio et al. (2015) haveinterpreted a previously observed, closely spaced pair ofsuperluminal knots in 3C120 in this manner. Such a shock paircan arise from a disturbance caused by an increase in the flowvelocity, as expected in the proposal of Chatterjee et al. (2009).This scenario predicts that the first knot should be faster thanthe second for each pair, as is the case (see Figure 6). However,the delay between the starts of dips 2 and 3 and the passage ofleading knots K3 and K5 through the core was considerablyshorter than for dip 1 and knot K2: 32±6 days and 20±6 days, respectively. This is compatible with higher actualspeeds in these knots compared with K2 only if the angle θbetween the velocity vector and line of sight is much less thanfor K2, given that the apparent speed of K2, 4.3c, is greater thanthat of K3, c3.4 . For example, an increase in the bulk Lorentzfactor Γ from 4.5 for K2 to 5.3 for K3 while θ decreased from11° to 4° would correspond to the observed decrease in theapparent speed and reduce the apparent transit time to the coreby 50%. This would cause an increase in the Doppler beamingfactor from ∼5 to ∼9, leading to knots K3 and K4 having muchhigher fluxes than their predecessors. The high-amplitude radioflare apparent in Figure 4 is consistent with this scenario:Figure 7 demonstrates that the flare is the result of knots K3 andK4 appearing in the jet at 43 GHz with fluxes that areextraordinarily high for superluminal knots in 3C120. Thisproposed change in θ is quite large and would need to occurover a short time span. On the other hand, such a possibilitymight be indicated by the discrepant values from θ=20° to3.6° derived from previous VLBA observations (Jorstad et al.2005; Casadio et al. 2015; Jorstad et al. 2017). The proposedchange in actual velocity of the flow corresponds to a relativevelocity of c0.17 , 0.29 times the sound speed of an ultra-relativistic plasma. This is consistent with the formation of ashock if the plasma contains enough non-relativistic protons toreduce its sound speed to c0.29< .Under the magnetic jet launching scenario, all X-ray/
UV-optical dips could arise from occasional, probablyrandomly occurring, alignment of the magnetic field alongthe polar direction in the AD and corona (Livio et al. 2003).According to these authors, this would disable the magneto-rotational instability, disrupting the accretion flow whilepromoting faster flow in the polar direction into the coronaand jet. In dip 1, the earlier UV flux decline suggests that the
Figure 10. UV-optical spectrum during quiescence (MJD 57655, top panel),the peak of the double flare at MJD 57783 (middle panel), and the differencebetween the two (bottom panel). The black dashed lines correspond to the best-fit single power laws, with spectral indices of α=0.71±0.05, 0.46±0.03,and −0.28±0.07 for the top, middle, and bottom panels, respectively, wherethe flux density Fν∝ν−α. The red dotted line indicates the spectrum of amodel synchrotron component with α=1.2. The red dashed line correspondsto the computed spectrum of a standard thin accretion disk (AD) model withinner radius rin=1.3×1013 cm and outer radius rout=1.3×1016 cm, witha temperature T r T rin
3 4= -( ) . (An identical spectrum would result fromsynchrotron emission from a nearly monoenergetic population of electrons withenergies exceeding ∼10 GeV.) In the top panel, Tin=3.0×10⁵ K, while inthe middle panel, Tin=4.0×10⁵ K. The solid red curve shows the sum of thesynchrotron plus AD models. The photometry shown in this figure is availableas data (see Figure 1).
Figure 11. Spectral energy distribution at the peak of one of the flares; no softX-ray excess is apparent.
11
The Astrophysical Journal, 867:128 (16pp), 2018 November 10 Marscher et al.

alignment occurred first in the inner AD and then propagated(presumably at the magnetosonic speed) into the corona. In dip2, the data imply that the alignment occurred first in theinnermost AD and corona and propagated outward throughthe AD.
Random fluctuations in local conditions (e.g., density ortemperature of the Compton scattering electrons in a section ofthe corona), superposed on the systematic trends (such as ashort-term X-ray and UVM2 flare observed prior to dip 1),could cause enough complexity in the light curves to lead us toinfer an incorrect start and end time of dips. Futureobservations of more such events would provide betterstatistics on the time delays across wavelengths.
4.3. Timescales of Variations and Cross-wavelength Lags
The time lags predicted by the AD model proposed inSection 4.1 are all <1 day, because the inner radius is only 0.12light-hours and the radius where the blackbody spectrum peaksin the V band is only 100 times larger, 0.5 light-days. (For anarea filling factor f, this size should be multiplied by f−1/2.)This is consistent with the UV/optical lags over the periodMJD 57550-57724 reported in Section 3.3 and seen in the toppanels of Figure 9, although there is some longer lag present inthe U band that we address below. However, longer lags arepresent from MJD 57726 to 57850 when slower, higher-amplitude variations occurred. This included the flare thatpeaked near MJD 57783. It therefore appears that the shorter-term variations are essentially simultaneous at the differentwavelengths to within the limits of our sampling, while longer-term flares tend to lag at longer wavelengths by up to∼10 days. We present evidence in Section 4.4 that these flaresoccur in the parsec-scale jet rather than the AD.
Recent well-sampled, long-term Swift monitoring observa-tions of the Seyfert galaxies NGC 5548 (McHardy et al. 2014;Edelson et al. 2015), NGC 4151 (Edelson et al. 2017), andNGC 4593 (Cackett et al. 2018; McHardy et al. 2018) havemeasured time lags between hard and soft X-ray (in somecases), UV, and optical variations, with longer-wavelengthvariations delayed. The ratios of the delays follow thoseexpected from standard thin AD models (Shakura &Sunyaev 1973), but the lags at individual frequencies are afew times longer than the model would predict. The mass of theblack hole in 3C120 is within 30% of those in NGC5548 andNGC4151, (although ∼7 times that in NGC4593 (Bentz &Katz 2015; Edelson et al. 2017)), hence one might expectsimilar temporal behavior. It is therefore interesting that thecorrelations over MJD 57550-57724 are consistent with the<0.5 day time lags predicted by the AD model, in contrast withthe case of the Seyfert galaxies. There is one exception,however: the U-band variations lag those in the UVW2 band.Cackett et al. (2018) and McHardy et al. (2018) propose that thetime lags longer than predicted by the AD model are caused byscattering of AD photons by emission-line clouds that lie1 light-day from the black hole. In this scenario, supported by monitoringof emission-line fluxes, the U-band lag is longer because moredistant clouds re-emit the absorbed AD radiation as Balmercontinuum photons whose wavelengths fall within this band.
A qualitative similarity between Swift observations of3C120 and the Seyfert galaxies is the smoothness of theUV-optical variations of the latter compared with the X-rayfluctuations (McHardy et al. 2014; Edelson et al. 2015, 2017).Smoother UV-optical than X-ray variations in 3C120 are
evident when comparing Figures 1 and 2. The smoothing timeneeded to match the X-ray with the UV timescales, ∼4 days, isless than the mean X-ray/UVW2 lag of 6 days (see Section 3.3and Figure 8). The smoothing time is, however, much longerthan the light-travel time in the UV-optical region in the ADmodel. We detect no time delay in the radio galaxy between thehard and soft X-ray variations, as seen in NGC 4151 (Edelsonet al. 2017). Furthermore, the spectral fits to the XRT data of3C120 at all epochs are consistent with a single power law(see Section 2.1 and Figure 1), with no prominent soft X-rayexcess in 3C120 in 2016–17. We note that such an excess hasbeen reported at earlier epochs; Lohfink et al. (2013) suggestedthat it could be a synchrotron component from the jet. If so, thevalue of the maximum relativistic electron energy and/ormagnetic field would need to be lower in 2016–17 in order forus not to detect a soft X-ray excess.In the cases of NGC 5548 and NGC 4151, Gardner & Done
(2017) and Edelson et al. (2017) have proposed that the lagscorrespond to reprocessing of coronal X-ray emission intoextreme UV (EUV) photons by a hot plasma torus in theinnermost portion of the accretion flow, plus the reaction timeof the AD atmosphere to adjust to changes in the EUV flux.The plasma torus emits the soft X-ray excess and mediates thereprocessing of the corona’s X-rays, with the re-emittedphotons heating the disk at larger radii. The double reproces-sing leads to longer time delays between X-ray and UV-opticalvariations than predicted by the standard AD model. The lackof such a hot torus in 3C120 in 2016–17, inferred from theabsence of a soft X-ray excess, requires another explanation forthe X-ray/UV time lag during dip 2 and the MJD 57726-57850flaring episodes, and the smoothness of the UV-optical relativeto the X-ray variations.A departure of the data from the expectations of the variable
AD model for the flares in 3C120 proposed in Section 4.1 isthe X-ray/UVW2 lag of −10±3 days during the flaringperiod (see Figure 9, bottom left panel). Inspection of the lightcurves (Figure 2) reveals that this is mainly due to thevariability over ∼50 days following flux dip 2. Such long lagscould have been caused by a disturbance starting in theinnermost AD and corona that then propagated outwardthrough the AD at a speed much less than c, heating thesurface of the AD as it passed through. Such slow (as well asmuch slower) disturbances were inferred to propagate bothinward and outward in the study of Chatterjee et al. (2009)based on correlations between X-ray and optical variability.Dip 1 could have been caused by such a disturbance that startedin the AD at a radius somewhat greater than rin, affecting theUVW2 and UVM2 flux first, then the corona and larger radii inthe AD. However, dip 2 (Figure 3, right) started first with theX-ray decline, followed several days later by roughlysimultaneous drops, and then recoveries, at all UV-opticalbands. Instead, we conclude in Section 4.4 below that the X-rayand UV-optical flares following dip 2 occurred in the parsec-scale jet.The shorter-term, relatively low-amplitude X-ray and UV-
optical variations seen in 3C120, with time lags <1 day, canpotentially still be explained by heating of the disk byirradiation from a variable flux of X-rays generated in thecorona (Fabian et al. 2015, 2017). The changes in X-ray fluxwould need to heat and cool the disk on timescales on the orderof, or shorter than, the light-travel time from the corona to theaffected area of the disk.
12
The Astrophysical Journal, 867:128 (16pp), 2018 November 10 Marscher et al.

The complex longer-term, higher-amplitude variations, withtime delays that extended up to 14 days in 2016–17 andtemperature variations in excess of that predicted byEquation (1)—including dip 2 with its long X-ray/UV lagbut no significant UVW2/V lag—requires one or moreadditional physical processes that contribute to the observedUV-optical flux. Propagating changes in the magnetic field,discussed in Section 4.2, might be one such mechanism.Another possible effect can be found within the “bird’s nest”geometry of thermal gas in an active nucleus (Mannucciet al. 1992; Gaskell & Goosmann 2013; Abolmasov 2017). Inthis picture, illustrated in Figure 12, the disk flares out into avery broad (polar opening angle 40°), clumpy distribution ofclouds. The clouds closest to the symmetry axis (which wouldpresumably be the jet direction in 3C 120) are essentiallyfalling toward the black hole. If the clouds are optically thick,then they scatter into our direction light from the AD only onthe side facing the disk, hence we observe scattered photonsmainly from clouds on the far side of the system. Thispresumes that the area filling factor of the AD f0.5, suchthat most photons can cross the AD from the far side to reachthe observer. A flare in the corona or inner disk is then bothobserved directly and scattered with a time delay equal to twicethe distance from the inner disk to the scattering cloud. Some ofthe scattering might be in the Rayleigh regime, leading towavelength dependence of the amplitude and time delays of theflux variations, as in dip 1. Thomson scattering would producesimilar light-curve profiles, as in the UVM2 to V variations ofdip 2, which all decreased by 12±1% and varied with little orno cross-frequency lag. In such a remote scattering geometry,the short-term fluctuations would all be smoothed out, so suchfluctuations are from emission viewed directly from the AD.Only major, longer-term variations would be apparent in thescattered light. Clouds located ∼3 light-days from the inner ADhave a freefall velocity of ∼0.05c and cross the region over atime of ∼60 days. This is similar to the timescales of the flaresseen in the light curves (Figure 2), although we find below thatthe location of the flares is in the parsec-scale jet. In order to
scatter (with an albedo a) enough radiation to cause a fluxincrease by a factor (1+x), a disk-shaped cloud at a radialdistance r would need to have a radius R x a R r4 1 4
AD1 2~ ( ) ( ) ,
which results in R∼7×1014 cm=0.3 light-days for x∼0.3,a∼0.2, R R2 2.6 10AD in
13~ ~ ´ cm(the radial position inthe AD where the photons that are scattered originate), andr∼3 light-days. The size requirement is therefore not excessivefor such a scattering event. Furthermore, multiple clouds may beinvolved at any given time.
4.4. Correlation of 37 GHz and Optical-UV light Curves:Flares in the Jet
A similarity between the 37 GHz and UV-optical lightcurves, with a radio lag, is apparent in Figure 4. The correlationbetween the UVW2 and 37 GHz variations over the period ofour Swift monitoring (Figure 13) is strong and highlystatistically significant, although rather flat at lags from 10 to40 days, indicating a mean delay of 25 days relative to UVW2.(The V/37 GHz correlation is very similar.) As seen inFigure 9, the mean X-ray/UVW2 lag during the flaring periodwas 10 days, for a total X-ray to 37 GHz lag of 35 days. Oursequence of VLBA images demonstrates that the 37 GHz flarein 2017 occurred mainly in knots K3 and K4 (see Figure 7).(Images available on the Boston University website5 showthat a bright knot ejected earlier was responsible for the radioflare in early 2016, which was also preceded by an optical flare;see Figure 4.) Analysis of the sequence of VLBA images(Figure 6) indicates that K4 was crossing quasi-stationaryfeature A1 0.14 mas downstream of the core during the peakflux density of the 37 GHz flare. Given its apparent speedof 1.44±0.13 mas yr−1, K4 traversed 0.14±0.1 mas over35 days, and therefore was crossing the core at the time of theX-ray flare, 0.5–1.3 pc from the black hole (see Section 4.2above).Because there is no plausible source of thermal radiation at
0.5–1.3 pc with the observed inverted spectral slope of ∼0.3 of
Figure 12. Sketch of model (not drawn to scale) for 3C120 discussed in the text. The infalling clouds, whose ionized sides face the AD, scatter radiation from thecorona (drawn at the base of the jet) and disk. The area filling factor of the accretion disk needs to be 0.5 for most of the scattered photons to cross the disk planetoward the observer without being absorbed.
5 http://www.bu.edu/blazars/VLBA_GLAST/3c120.html
13
The Astrophysical Journal, 867:128 (16pp), 2018 November 10 Marscher et al.

the flare, we conclude that the UV-optical flare wassynchrotron radiation from a narrow energy distribution ofelectrons, as discussed in Section 4.1 above. The most likelyX-ray emission mechanism is inverse Compton scattering. Theseed photons for the scattering are probably from emission-lineclouds or hot nuclear dust, because the synchrotron self-Compton process would require the synchrotron flare to peakprior to the X-ray flare, contrary to the ∼−10 day X-ray/UVW2 lag. The decline in available seed photons with distancefrom the black hole can explain why the X-ray variations leadthose at longer wavelengths.
We note that the optical light curve in Chatterjee et al. (2009)contained three major flares. Only one of these was temporallyassociated with an outburst at 37 GHz, with a ∼1 month delayrelative to the optical event. From this, we conclude that some,but not all, major optical flares occur in the parsec-scale jet.
Although our optical linear polarization observations (seeFigure 4) are sparse, some of the measurements were obtainednear the peak of the UV-optical flares. The degree ofpolarization P was between 1.0% and 2.2%, with the highestvalue occurring when χ was nearly parallel to the inner jetdirection. This is consistent with turbulent plasma crossing astanding conical shock, as has been proposed to explain quasi-stationary features in relativistic jets, such as the core and A1(Marscher 2014). Jorstad et al. (2007) reported a lower value ofP∼0.3% at R-band in 1999–2001, which was consistent withinterstellar rather than intrinsic polarization. The degree ofpolarization via electron scattering of thermal AD emission isexpected to be considerably lower than 1% at opticalwavelengths for a disk whose pole subtends an angle 20°to the line of sight (Laor et al. 1990; Marin et al. 2015). Theelectric vector should be transverse to the polar direction, andtherefore perpendicular to the jet axis. The values of P and χthat we measured during the flare are therefore inconsistentwith that expected from the AD. The low degree of polarizationcorresponds to a rather disordered magnetic field, as iscommonly found in the 43 GHz cores of compact extragalactic
jets (Jorstad et al. 2007). This conclusion is supported by thetime variability of both the degree and position angle of thepolarization, which is a sign of turbulence (e.g., Marscher2014). The position angles of polarization of the moving knotsappear unrelated to those measured in the R band (cf. Figures 4and 5), hence there is no indication that they producesubstantial optical emission when they are not interacting witheither the core or feature A1.Based on 15 GHz VLBA images, Leon-Tavares et al. (2010)
found a coincidence between epochs of optical flares in 3C120and times when a superluminal knot was crossing a stationaryemission feature ∼0.7 mas from the core. Our model fits to the43 GHz VLBA data do not include a stationary feature near thesame location, although it could be confused with emissionfrom the superluminal knots, which were ejected morefrequently than normal in 2016–17. At the peak of the opticalflare, there is a local maximum in the 43 GHz intensity 0.8 masfrom the core. However, the feature is very weak (∼0.07 Jy), sowe consider it unlikely to be the source of the steadier UV-optical synchrotron emission inferred in Section 4.1 to bepresent in 3C120 in 2016–17.
5. Summary
Our monitoring of the radio galaxy 3C120 at X-ray, UV-optical, and millimeter wavelengths over a nine-month timespan has revealed that dips in X-ray flux prior to the appearanceof new superluminal radio knots are accompanied by dips inthe UV-optical flux as well. Short-term, low-amplitudevariations in flux in 3C120 are well-correlated across wave-lengths, with zero lag to within the uncertainties. An exceptionis the U band, whose variations lag by ∼1 day, probably fromscattering via Balmer continuum emission in clouds ∼1 light-day from the black hole. In contrast, longer-term, morepronounced variations have lags from days to weeks.The relative timing of the decline in X-ray and UVW2 flux
favors an origin in the innermost AD for dip 1 and in the X-rayemitting corona for dip 2. After the minimum flux occurs indip 1, the time for restoration of the flux to pre-dip levels isshorter in the UVW1 and UVM2 bands than at the U band,contrary to the Lohfink et al. (2013) scenario in which the innerAD is refilled from larger to smaller radii. During dip 2, theX-ray flux declines and recovers first, with the UV-optical fluxvarying simultaneously within the uncertainties. The timedelays of the high-amplitude variations are generally longerthan predicted by a standard AD model. A scenario thatexplains such events as the result of realignment of themagnetic field to expedite flow into the base of the jet, whichplays the role of a corona of hot electrons (Livio et al. 2003;Chatterjee et al. 2009), is more consistent with the observa-tions. An additional feature, such as the addition of scatteringclouds falling toward the black hole, is needed to explain thelack of long time delays at longer wavelengths during dip 2.A two-component model consisting of an inverted-spectrum
(IS) source plus a synchrotron source with a spectral index of1.2 can explain the UV-optical spectrum in both quiescent andflaring states. The spectral index α∼1/3 of the IS source isconsistent with either thermal emission from a standard thinAD or synchrotron radiation from a nearly monoenergeticpopulation of electrons of energy ∼10 GeV. The low-but-significant R-band polarization supports the synchrotron modeland implies that the magnetic field is highly disordered in theemission region.
Figure 13. Cross-correlation function of UVW2 and 37 GHz variations. Dottedlines have same meaning as in Figure 8. Negative lags correspond to the firstwaveband listed leading the variations.
14
The Astrophysical Journal, 867:128 (16pp), 2018 November 10 Marscher et al.

In contrast to observations of the radio-weak Seyfert galaxyNGC 4151 (Edelson et al. 2017), 3C120 does not exhibit a softX-ray excess whose variations are time-delayed relative toharder X-rays in 2016–17. There is also no evidence in theradio galaxy for a hot torus that mediates reprocessing ofX-rays from the corona to heat more extended regions of theAD (Gardner & Done 2017). Instead, we find that the X-rayand UV-optical variations that we have observed in 3C120 canbe attributed to physical changes (e.g., magnetic reconfigura-tions) that propagate at subluminal speeds through the innerAD and corona, effects that a varying flux of X-rays from thecorona have on the inner AD, and scattering of AD emission byhot clouds falling toward the AD at a distance of a few light-days from the black hole. Some longer-term flares, such asthose observed in 2015–17, correspond to nonthermal radiationemitted as a superluminal knot crosses the 43 GHz core andquasi-stationary feature A1 that lies 0.14 mas from the core. Asthe knot crosses the core, a nearly monoenergetic population ofelectrons with energies above 10 GeV is added to the power-law distribution at lower energies. This could result from eithermagnetic reconnections (Petropoulou et al. 2016) or diffusiveshock acceleration in locations where the turbulent magneticfield has an orientation that is favorable for particle acceleration(Marscher 2014). A similar narrow energy distribution ofelectrons at energies 10 GeV is required by models for TeVγ-ray emission from some BL Lacertae objects (e.g., Balokovicet al. 2016).
Our observations of 3C120 and those of Seyfert galaxieswithout strong relativistic jets reveal AGN to contain extremelycomplex environments. It appears that nearly all physicalprocesses that can happen do occur at different times and evendifferent locations. The emission that we observe includesphotons that arrive to us (and to scattering regions) bothdirectly and indirectly. Except for the nonthermal flares that canerupt on occasion in the parsec-scale jet, there is no obviousmajor difference in the observed X-ray, UV, and opticalproperties of 3C120 and Seyfert galaxies as a class. Instead,the physical conditions of the inner AD and its surroundingsappear rather similar. This implies that the difference betweenAGNn with and without powerful jets lies in the propertiesof the black holes and their immediate environs, such as themagnetic flux accumulated near the event horizon (Tchekhovskoyet al. 2011).
The authors thank I. McHardy, R. Antonucci, and B. Punslyfor informative discussions. This study was supported in part byNASA through Swift Guest Investigator grant NNX16AN69G,Fermi Guest Investigator grants NNX14AQ58G and80NSSC17K0649, and by National Science Foundation grantAST-1615796. This publication makes use of data obtained atthe Metsähovi Radio Observatory, operated by Aalto Universityin Finland. The VLBA is an instrument of the National RadioAstronomy Observatory. The National Radio AstronomyObservatory is a facility of the National Science Foundationoperated under cooperative agreement by Associated Univer-sities, Inc. This research has made use of the NASA/IPACExtragalactic Database (NED), which is operated by the JetPropulsion Laboratory, California Institute of Technology,under contract with the National Aeronautics and SpaceAdministration.
Facilities: Swift, VLBA.
Software: XSPEC (Arnaud 1996), Difmap (Shepherd 1997),AIPS (van Moorsel et al. 1996), HEAsoft (v6.19, 6.21; Arnaud1996).
ORCID iDs
Alan P. Marscher https://orcid.org/0000-0001-7396-3332Svetlana G. Jorstad https://orcid.org/0000-0001-6158-1708Karen E. Williamson https://orcid.org/0000-0003-1318-8535Merja Tornikoski https://orcid.org/0000-0003-1249-6026
References
Abolmasov, P. 2017, A&A, 600, A79Alexander, T. 2013, arXiv:1302.1508Alexander, T. 1997, in Astronomical Time Series, Vol. 218, ed. D. Maoz,
A. Sternberg, & E. M. Leibowitz (Dordrecht: Kluwer), 163Arnaud, K. A. 1996, in ASP Conf. Ser. 101, Astronomical Data Analysis
Software and Systems V, ed. G. Jacoby & J. Barnes (San Francisco, CA:ASP), 17
Balokovic, M., Paneque, D., Madejski, G., et al. 2016, ApJ, 819, 156Bentz, M. C., & Katz, S. 2015, PASP, 127, 67Blandford, R. D., & Payne, D. G. 1982, MNRAS, 199, 883Blandford, R. D., & Znajek, R. 1977, MNRAS, 179, 433Buisson, D. J. K., Lohfink, A. M., Alston, W. N., & Fabian, A. C. 2017,
MNRAS, 464, 3194Cackett, E. M., Chiang, C.-Y., McHardy, I. M., et al. 2018, ApJ, 857, 53Cackett, E. M., Horne, K., & Winkler, H. 2007, MNRAS, 380, 669Casadio, C., Gómez, J. L., Grandi, P., et al. 2015, ApJ, 808, 162Cawthorne, T. V. 2006, MNRAS, 367, 851Cawthorne, T. V. 2013, ApJ, 772, 14Chatterjee, R., Marscher, A. P., Jorstad, S. G., et al. 2009, ApJ, 704, 1689Chatterjee, R., Marscher, A. P., Jorstad, S. G., et al. 2011, ApJ, 734, 43Dickey, J. M., & Lockman, F. J. 1990, ARA&A, 28, 215Edelson, R., Gelbord, J. M., Cackett, E., et al. 2017, ApJ, 840, 41Edelson, R., Gelbord, J. M., Horne, K., et al. 2015, ApJ, 806, 129Eracleous, M., Sambruna, R., & Mushotzky, R. F. 2000, ApJ, 537, 654Fabian, A. C., Lohfink, A., Belmont, R., Malzac, J., & Coppi, P. 2017,
MNRAS, 467, 2566Fabian, A. C., Lohfink, A., Kara, E., et al. 2015, MNRAS, 451, 4375Fanaroff, B. L., & Riley, J. M. 1974, MNRAS, 167, 31PFender, R. P., Belloni, T. M., & Gallo, E. 2004, MNRAS, 355, 1105Fitzpatrick, E. L. 1999, PASP, 111, 63Gardner, E., & Done, C. 2017, MNRAS, 470, 3591Gaskell, C. M., & Goosmann, R. W. 2013, ApJ, 769, 30Gelbord, J., Gronwall, C., Grupe, D., Vanden Berk, D., & Wu, J. 2015, Swift:
10 Years of Discovery, ed. P. Caraveo et al., 137Gómez, J. L., Marscher, A. P., Alberdi, A., Jorstad, S. G., & Agudo, I. 2001a,
ApJL, 561, L161Gómez, J. L., Roca-Sogorb, M., Agudo, I., Marscher, A. P., & Jorstad, S. G.
2001b, ApJ, 733, 11Jorstad, S. G., & Marscher, A. P. 2016, Galax, 4, 47Jorstad, S. G., Marscher, A. P., Larionov, V. M., et al. 2010, ApJ, 715, 362Jorstad, S. G., Marscher, A. P., Lister, M. L., et al. 2005, AJ, 130, 1418Jorstad, S. G., Marscher, A. P., Morozova, D. A., et al. 2017, ApJ, 846, 98Jorstad, S. G., Marscher, A. P., Stevens, J. A., et al. 2007, AJ, 134, 799King, A. L., Lohfink, A., & Kara, E. 2017, ApJ, 835, 226Kishimoto, M., Antonucci, R., Blaes, O., et al. 2008, Natur, 454, 492Lampton, M., Margon, B., & Bowyer, S. 1976, ApJ, 208, 177Laor, A., Netzer, H., & Piran, T. 1990, MNRAS, 242, 560Leon-Tavares, J., Lobanov, A. P., Chavushyan, V. H., et al. 2010, ApJ,
715, 355Lira, P., Arévalo, P., Uttley, P., McHardy, I., & Breedt, E. 2011, MNRAS,
415, 1290Livio, M., Pringle, J. E., & King, A. R. 2003, ApJ, 593, 184Lohfink, A. M., Reynolds, C. S., Jorstad, S. G., et al. 2013, ApJ, 772, 83Lyutikov, M., Pariev, V. I., & Gabuzda, D. C. 2005, MNRAS, 360, 869Mannucci, F., Salvati, M., & Stanga, R. M. 1992, ApJ, 394, 98Marin, F., Goosmann, R. W., & Gaskell, C. M. 2015, A&A, 577, A66Markoff, S., Nowak, M. A., & Wilms, J. 2005, ApJ, 635, 1203Marscher, A. P. 2014, ApJ, 780, 87Marscher, A. P., Jorstad, S. G., Gómez, J. L., et al. 2002, Natur, 417, 625Marscher, A. P., Jorstad, S. G., & Williamson, K. E. 2017, Galax, 5, 63
15
The Astrophysical Journal, 867:128 (16pp), 2018 November 10 Marscher et al.

Marshall, K., Ryle, W. T., Miller, H. R., et al. 2009, ApJ, 696, 601McHardy, I. M., Cameron, D. T., Dwelly, T., et al. 2014, MNRAS, 444, 1469McHardy, I. M., Connolly, S. D., Horne, K., et al. 2018, MNRAS, 480, 2881McKinney, J. C., & Narayan, R. 2007, MNRAS, 375, 513Ogle, P. M., Davis, S. W., Antonucci, R. R. J., et al. 2005, ApJ, 618, 139Pacholczyk, A. G. 1970, Radio Astrophysics (San Francisco, CA: Freeman), 90Peterson, B. M., Wanders, I., Horne, K., et al. 1998, PASP, 110, 660Petropoulou, M., Giannios, D., & Sironi, L. 2016, MNRAS, 462, 3325Punsly, B., Marziani, P., Kharb, P., O’Dea, C. P., & Vestergaard, M. 2015,
ApJ, 812, 79Rani, P., & Stalin, C. S. 2018, ApJ, 856, 120Schlafly, E. F., & Finkbeiner, D. P. 2011, ApJ, 737, 103
Shakura, N., & Sunyaev, R. 1973, A&A, 24, 337Shepherd, M. C. 1997, in ASP Conf. Proc. 125, Astronomical Data Analysis
Software and Systems VI, ed. G. Hunt & H. E. Payne (San Francisco, CA:ASP), 77
Tchekhovskoy, A., Narayan, R., & McKinney, J. C. 2011, MNRAS, 418, L79Teräsranta, H., Tornikoski, M., Mujunen, A., et al. 1998, A&AS, 132, 305van Moorsel, G., Kemball, A., & Greisen, E. 1996, in ASP Conf. Ser. 101,
Astronomical Data Analysis Software and Systems V, ed. G. H. Jacoby &J. Barnes (San Francisco, CA: ASP), 37
Vlahakis, N., & Königl, A. 2004, ApJ, 605, 656Williamson, K. E., Jorstad, S. G., Marscher, A. P., et al. 2014, ApJ, 789, 135Williamson, K. E., Jorstad, S. G., Marscher, A. P., et al. 2016, Galax, 4, 64
16
The Astrophysical Journal, 867:128 (16pp), 2018 November 10 Marscher et al.