Embed Size (px)
Citation preview
An introduction to the ED-XRF technique
X-RAY FLUORESCENCE (XRF)
Asma KhalidJanuary 14th, 2011
X-Ray Fluorescence
X-Ray Fluorescence is defined as “The emission of characteristic "secondary" (or fluorescent) X-rays from a material that has been excited by bombarding with high-energy X-rays.
The phenomenon is widely used for elemental analysis.
Characteristic X-Rays When high energy photons are absorbed by atoms, inner
shell electrons are ejected from the atom. This leaves the atom in an excited state, with a vacancy in
the inner shell. Outer shell electrons then fall into the vacancy High energy X-ray photons are emitted with energy equal
to difference in the binding energies of the two shells involved in the transition E2-E1=hνchar.
Each element has a unique set of energy levels, thus each element emits a pattern of X-rays characteristic of the element, termed “characteristic X-rays”.
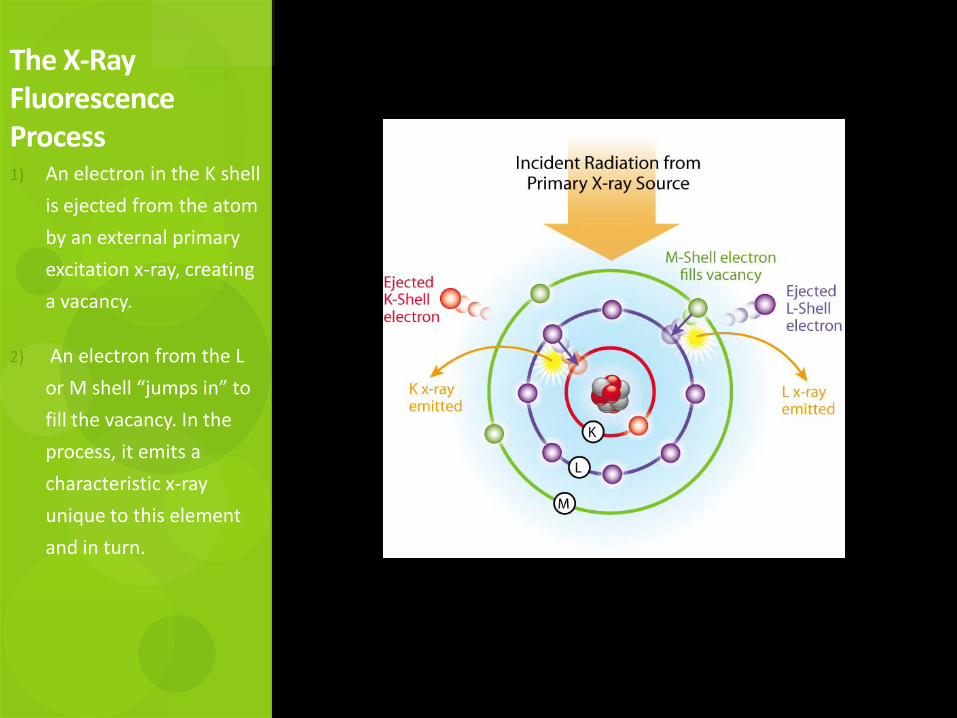
1) An electron in the K shell is ejected from the atom by an external primary excitation x-ray, creating a vacancy.
2) An electron from the L or M shell “jumps in” to fill the vacancy. In the process, it emits a characteristic x-ray unique to this element and in turn.
The X-Ray Fluorescence Process
XRF spectrometer and its types X-Ray Fluorescent (XRF) Spectrometers use a technique, in which x-
rays are used to excite a sample and generate secondary x-rays. The technique provides determination of major and trace elements
in solids.
The two main types of XRF spectrometers are 1. Energy dispersive (EDXRF), using a solid-state detector (usually
silicon): distinguishes each elemental peak according to its Energy.2. Wavelength dispersive (WDXRF), which use a scanning crystal as
the dispersive element: separates each elemental peak according to its Wavelength.
EDXRF typically detects elements from at least sodium (Na) to uranium (U), while WDXRF can extend down to beryllium (Be).
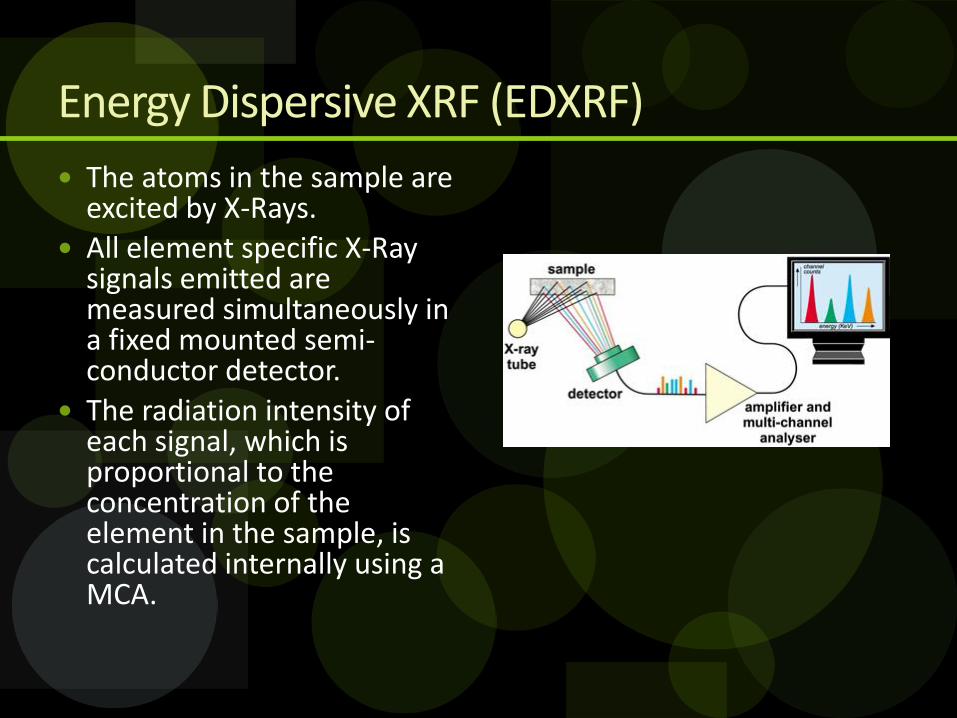
Energy Dispersive XRF (EDXRF) The atoms in the sample are
excited by X-Rays. All element specific X-Ray
signals emitted are measured simultaneously in a fixed mounted semi-conductor detector.
The radiation intensity of each signal, which is proportional to the concentration of the element in the sample, is calculated internally using a MCA.
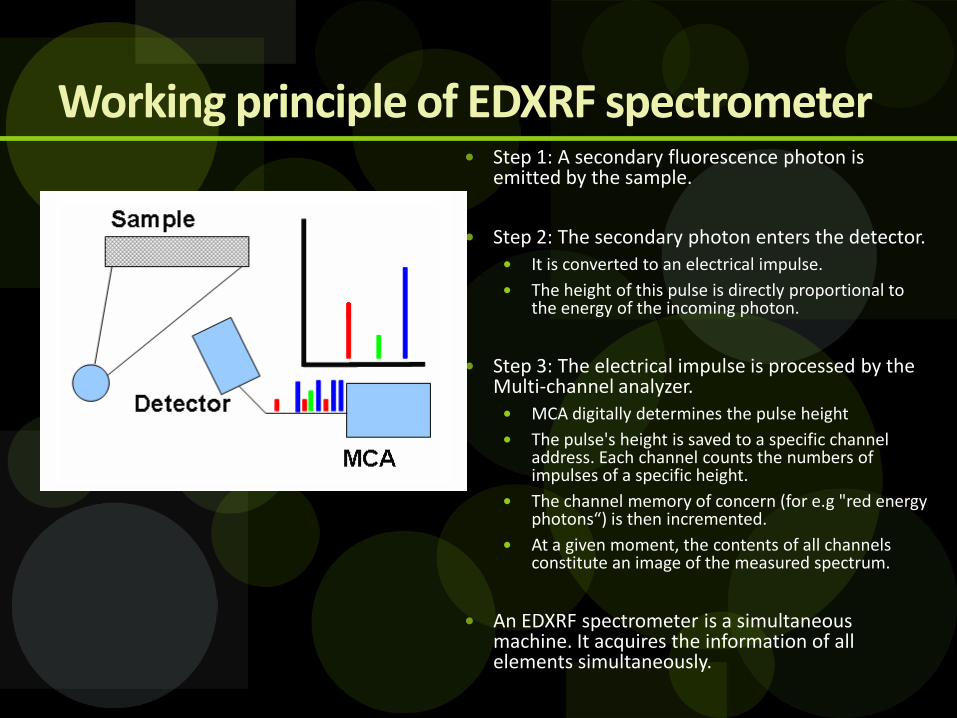
Working principle of EDXRF spectrometer Step 1: A secondary fluorescence photon is
emitted by the sample.
Step 2: The secondary photon enters the detector. It is converted to an electrical impulse. The height of this pulse is directly proportional to
the energy of the incoming photon.
Step 3: The electrical impulse is processed by the Multi-channel analyzer. MCA digitally determines the pulse height The pulse's height is saved to a specific channel
address. Each channel counts the numbers of impulses of a specific height.
The channel memory of concern (for e.g "red energy photons“) is then incremented.
At a given moment, the contents of all channels constitute an image of the measured spectrum.
An EDXRF spectrometer is a simultaneous machine. It acquires the information of all elements simultaneously.
HARDWARE COMPONENTS IN AMPTEK XRF SYSTEM
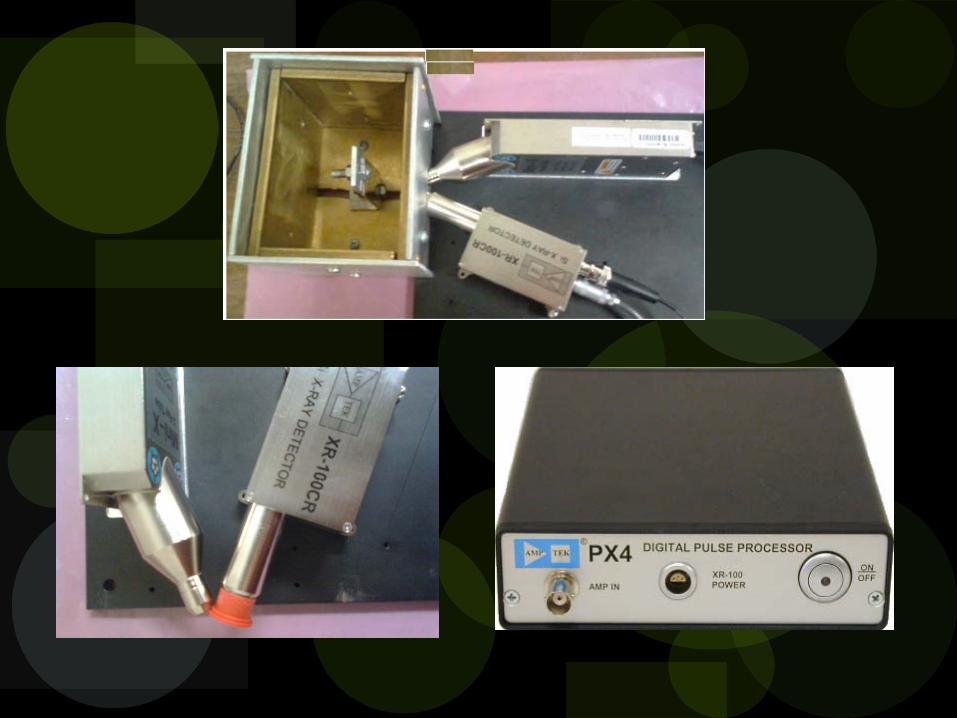
• X-ray generator (Mini-X)• Si X-ray detector (XR100CR)• Digital pulse processor (DP4)• Base plate• Calibration sample (stainless steel)
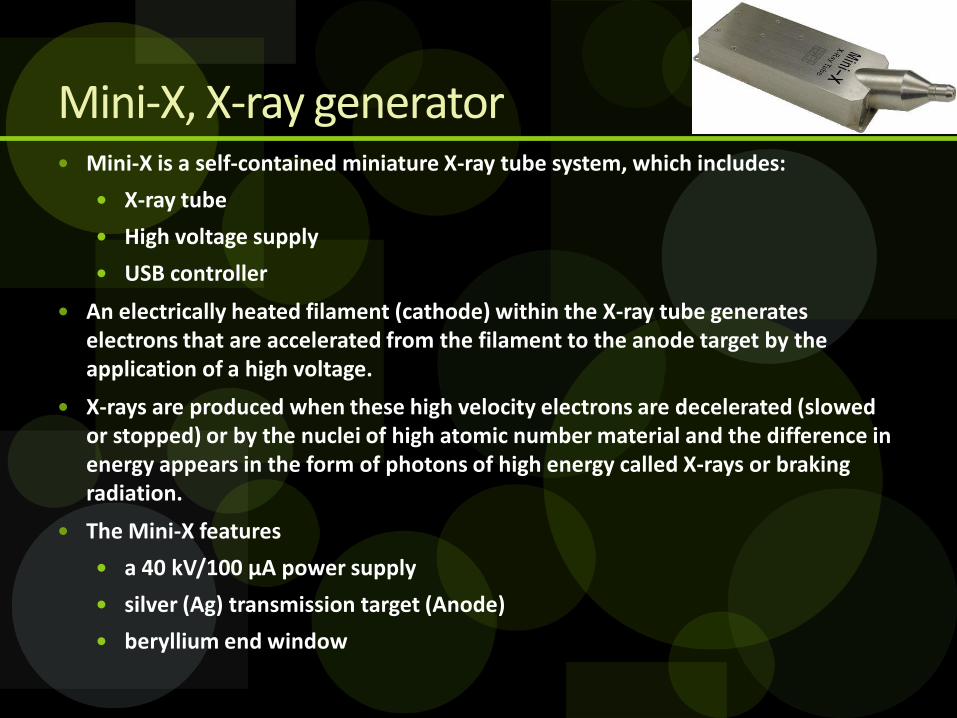
Mini-X, X-ray generator Mini-X is a self-contained miniature X-ray tube system, which includes:
X-ray tube High voltage supply USB controller
An electrically heated filament (cathode) within the X-ray tube generates electrons that are accelerated from the filament to the anode target by the application of a high voltage.
X-rays are produced when these high velocity electrons are decelerated (slowed or stopped) or by the nuclei of high atomic number material and the difference in energy appears in the form of photons of high energy called X-rays or braking radiation.
The Mini-X features a 40 kV/100 µA power supply silver (Ag) transmission target (Anode) beryllium end window
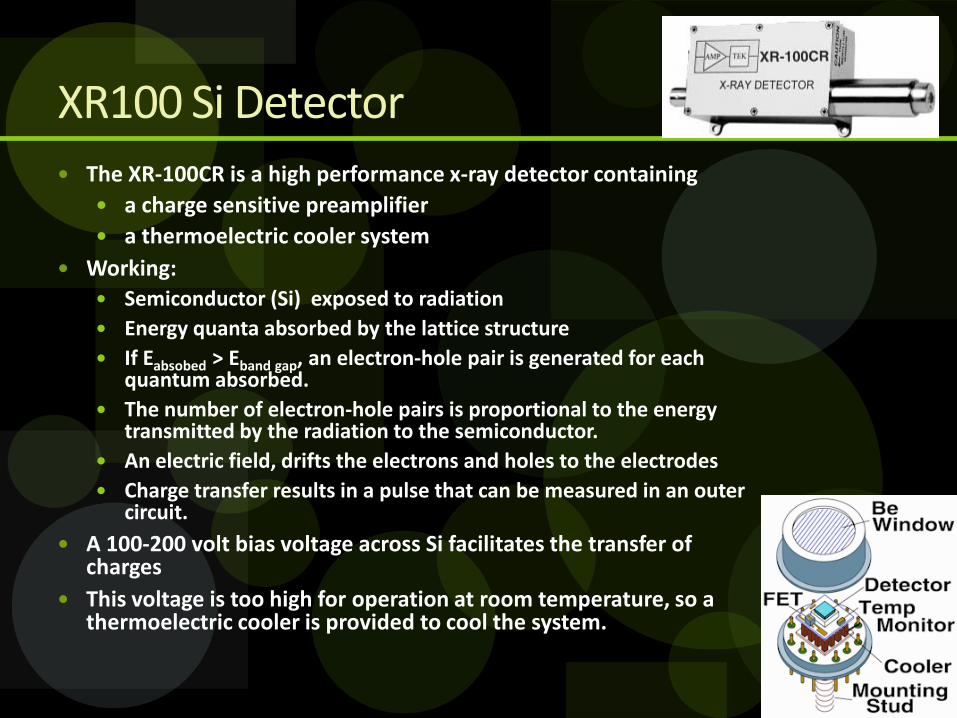
XR100 Si Detector The XR-100CR is a high performance x-ray detector containing
a charge sensitive preamplifier a thermoelectric cooler system
Working: Semiconductor (Si) exposed to radiation Energy quanta absorbed by the lattice structure If Eabsobed > Eband gap, an electron-hole pair is generated for each
quantum absorbed. The number of electron-hole pairs is proportional to the energy
transmitted by the radiation to the semiconductor. An electric field, drifts the electrons and holes to the electrodes Charge transfer results in a pulse that can be measured in an outer
circuit. A 100-200 volt bias voltage across Si facilitates the transfer of
charges This voltage is too high for operation at room temperature, so a
thermoelectric cooler is provided to cool the system.
Digital Pulse Processor DP4
The DP4 is a component in the complete signal processing chain, which consists of:
MCA Power supply
The input to the DP4 is the preamplified output from the Si detector. The DP4 performs the following tasks:
digitizes the preamplifier output (AD conversion) detects the peak amplitude (digitally) stores this value in its histogramm memory, generating an energy
spectrum. The spectrum is then transmitted over the DP4’s serial interface to
the user’s computer.
QUANTITATIVE ANALYSIS OF SPECTRA
An introduction to the XRF analysis software
1. ADMCA 2.0
2. XRS-FP
ADMCA 2.0 : Display and Acquisition Software
ADMCA 2.0 is a Windows software package that Acquires the spectral data Displays the data Has got controls for signal processing. Spectral analysis features
Energy calibration Setting regions of interest (ROI) to be examined Computing ROI information (centroid, total area, FWHM) Also performs spectrum fine tunning, subtraction and
scaling of background.
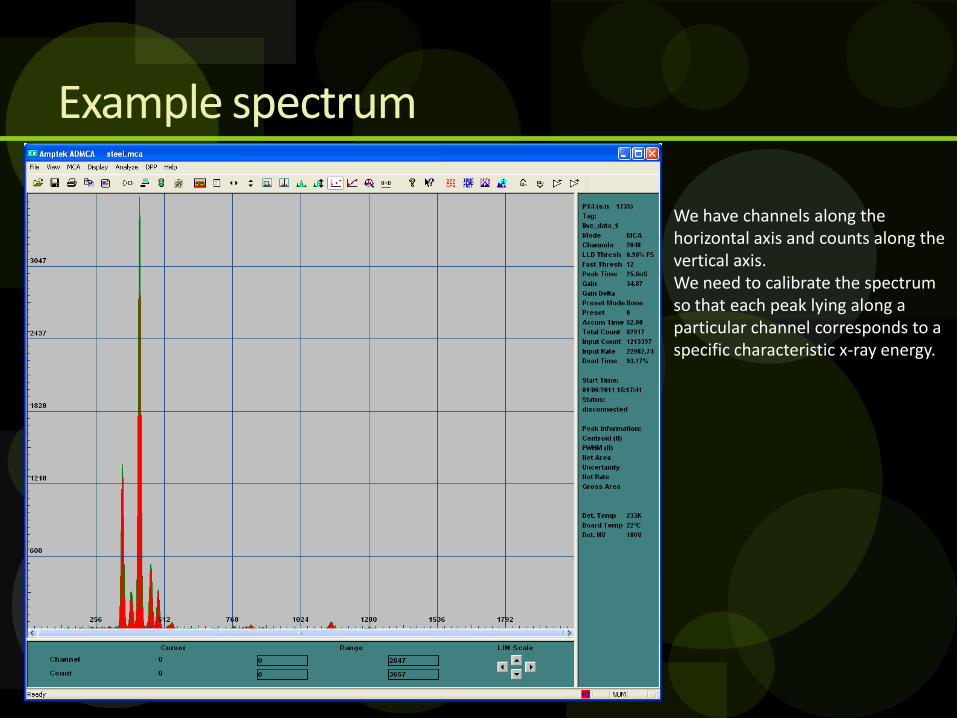
Example spectrum
We have channels along the horizontal axis and counts along the vertical axis.We need to calibrate the spectrum so that each peak lying along a particular channel corresponds to a specific characteristic x-ray energy.
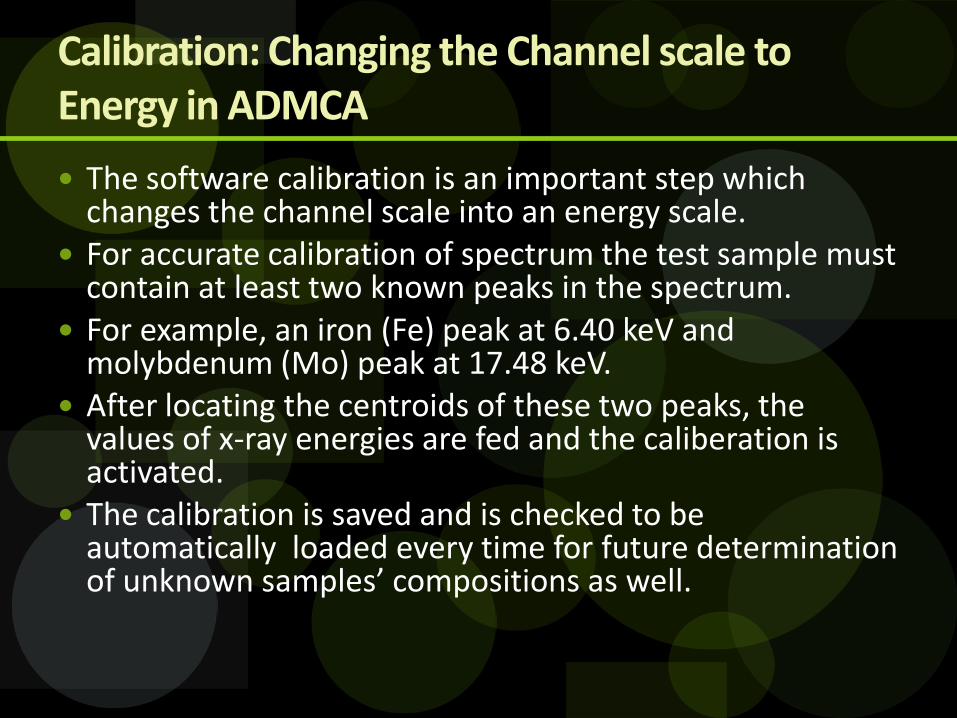
Calibration: Changing the Channel scale to Energy in ADMCA The software calibration is an important step which
changes the channel scale into an energy scale. For accurate calibration of spectrum the test sample must
contain at least two known peaks in the spectrum. For example, an iron (Fe) peak at 6.40 keV and
molybdenum (Mo) peak at 17.48 keV. After locating the centroids of these two peaks, the
values of x-ray energies are fed and the caliberation is activated.
The calibration is saved and is checked to be automatically loaded every time for future determination of unknown samples’ compositions as well.
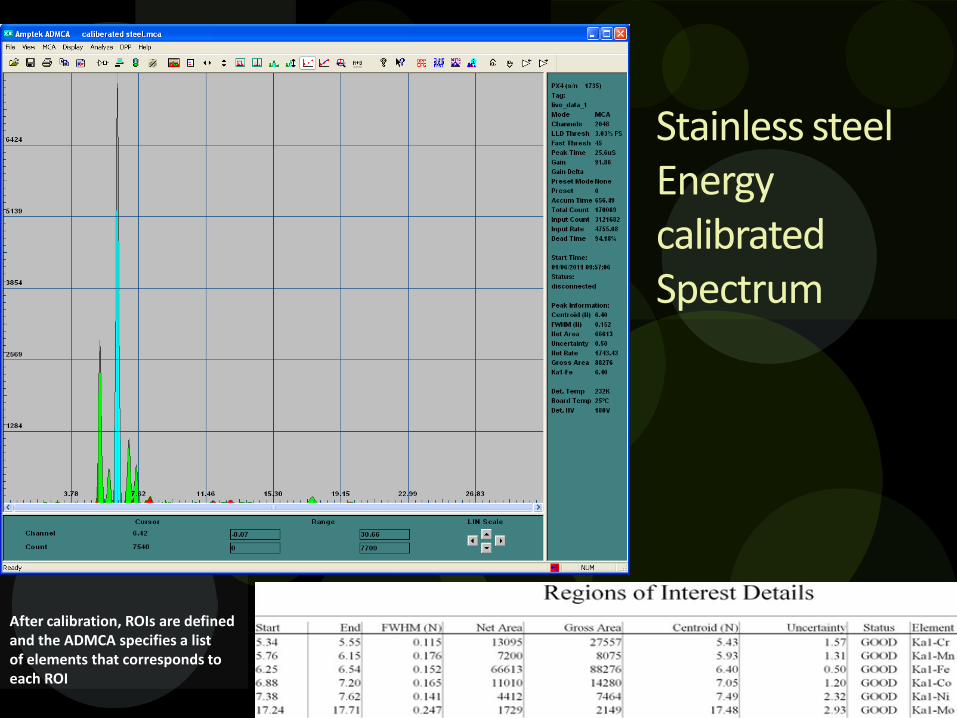
Stainless steel Energy calibrated Spectrum
After calibration, ROIs are definedand the ADMCA specifies a listof elements that corresponds toeach ROI
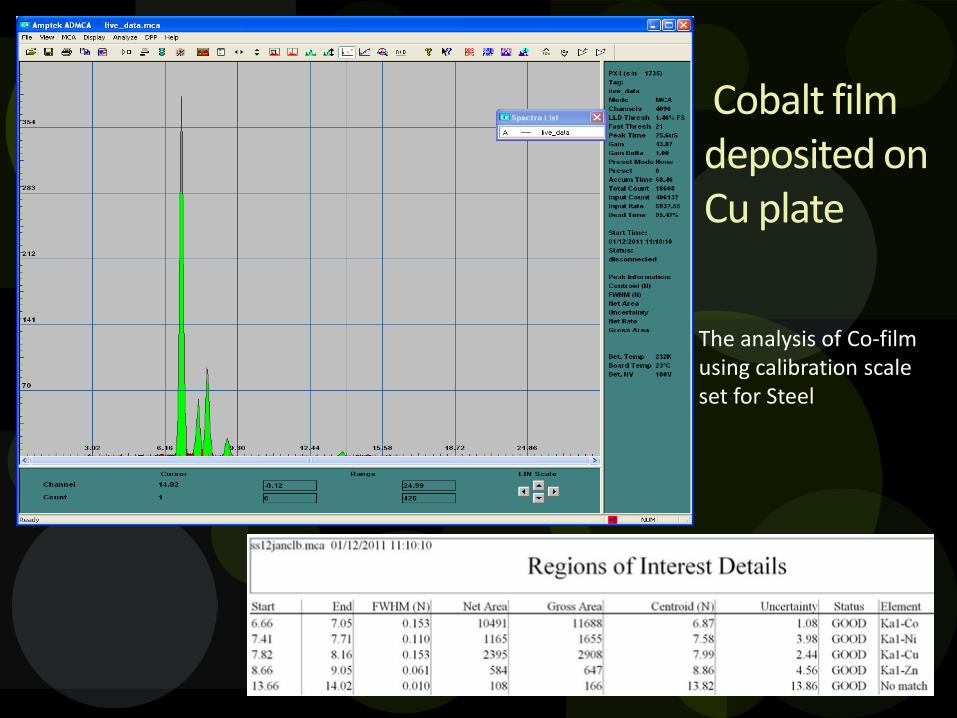
Cobalt film deposited on Cu plate
The analysis of Co-filmusing calibration scaleset for Steel
XRS-FP: Fundamental Parameters analysis software
The ADMCA 2.0 has an active link to FP software. Purpose of FP software:
Interrelate the intensities of the characteristic X-ray lines to the concentration of the element in the sample.
Significance of the software
The peaks in the spectrum correspond to the elements in the sample.
The number of X-rays in each peak is proportional to the number of atoms.
The software• Detects which peaks are present• Finds the relative intensity of each peak• Computes the concentration of each element in the
sample.
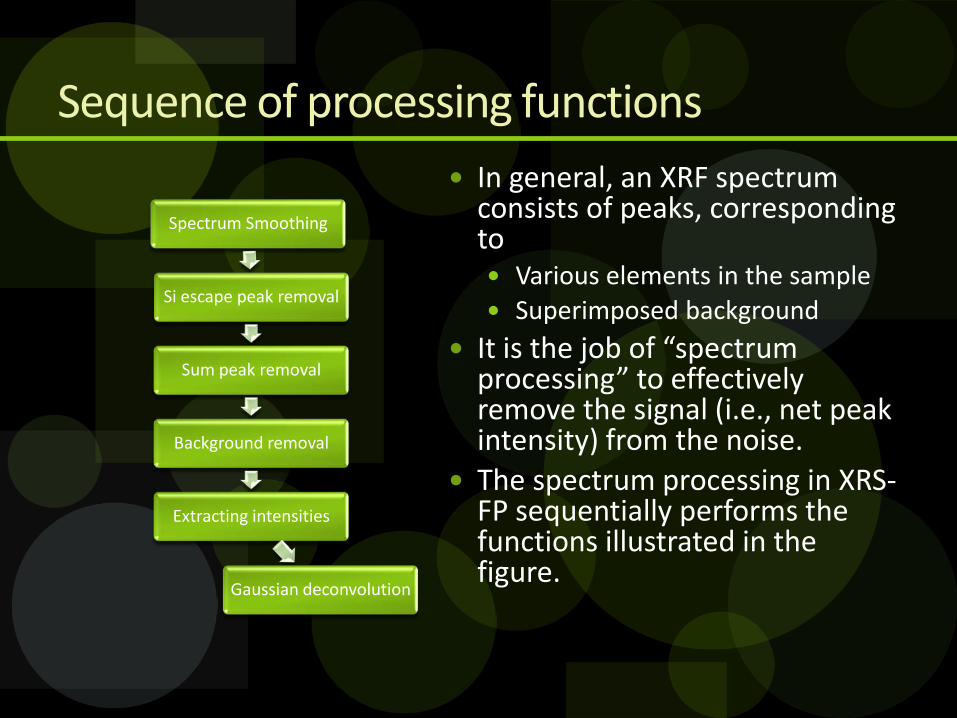
Sequence of processing functions In general, an XRF spectrum
consists of peaks, corresponding to Various elements in the sample Superimposed background
It is the job of “spectrum processing” to effectively remove the signal (i.e., net peak intensity) from the noise.
The spectrum processing in XRS-FP sequentially performs the functions illustrated in the figure.
Spectrum Smoothing
Si escape peak removal
Sum peak removal
Background removal
Extracting intensities
Gaussian deconvolution
Spectrum smoothing
A Gaussian smoothing is the result of smoothing an image by a Gaussian function implemented to reduce noise reduce extra details
This operation typically performs a Gaussian smooth of each channel in the spectrum, for the specified number of times.
Escape peaks removal Escape peaks arise when a fraction of parent
characteristic X-rays gets absorbed as Si-Kα escape (1.75 keV) photons. The deposited energy is reduced. e.g. a 6.4 keV X-ray (Fe Kα) deposits only 4.65 keV.
Every feature in the spectrum will have an associated escape feature at 1.75 keV lower energy.
The software removes the effect by adding the equivalent x-ray event at the parent peak’s energy.
Sum Peak Removal
Sum, or pileup, peaks arise because two incoming x rays arrive at the pulse processor within a time frame that is less than peak discriminating time of two events.
For example, two incoming Fe-Kα photons (each with an energy of 6.4 keV), which pileup, would produce a count at 12.8 keV.
This correction is not as accurate as the escape peak removal, and may leave some residual sum peaks in the spectrum.
Background Removal
The only method used, in the current software, is the Automatic background method.
The method distinguishes fast-changing regions of the spectrum (i.e., peaks) from slowly changing regions (i.e., background).
The background curvature arises primarily from scattered x-ray continuum from an x-ray tube whose shape depends on the anode atomic number and incident electron-beam energy (high voltage, in kV).
Intensity Extraction by Gaussian Deconvolution Deconvolution: Process of fitting the spectrum to a sum of
separate photopeaks.
Purpose: We need net peak intensities which help convert each element’s peaks to elemental concentrations.
Method: peaks are synthesized for all the expected lines (Kα, Kβ, L α, L β) in the region of the sample’s peaks.
Note: The expected lines should already be provided by the user (using the ROI details from ADMCA) that will be used for the (FP) analysis.
Analyze This is the main command for the quantitative
analysis of samples using the FP software. Using all the previous steps’ information this
command will convert the elemental intensities to composition, using required libraries and other information (geometric parameters, calibration).
After this command is completed, the elemental compositions will be updated in a list as shown below in example for stainless steel.
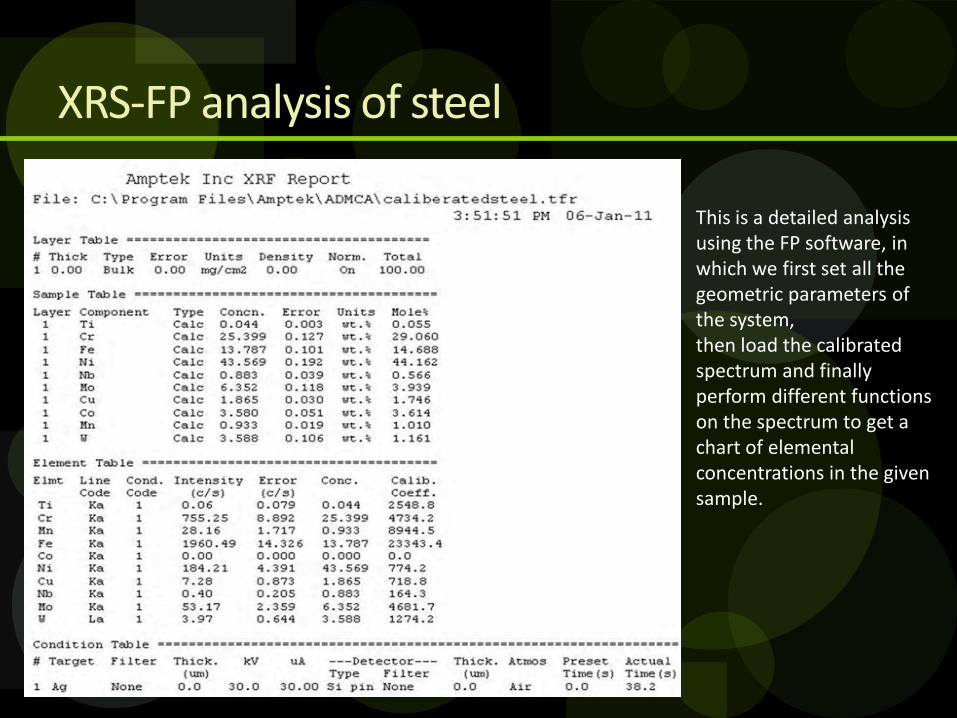
XRS-FP analysis of steel
This is a detailed analysis using the FP software, in which we first set all the geometric parameters of the system, then load the calibrated spectrum and finally perform different functions on the spectrum to get a chart of elemental concentrations in the given sample.
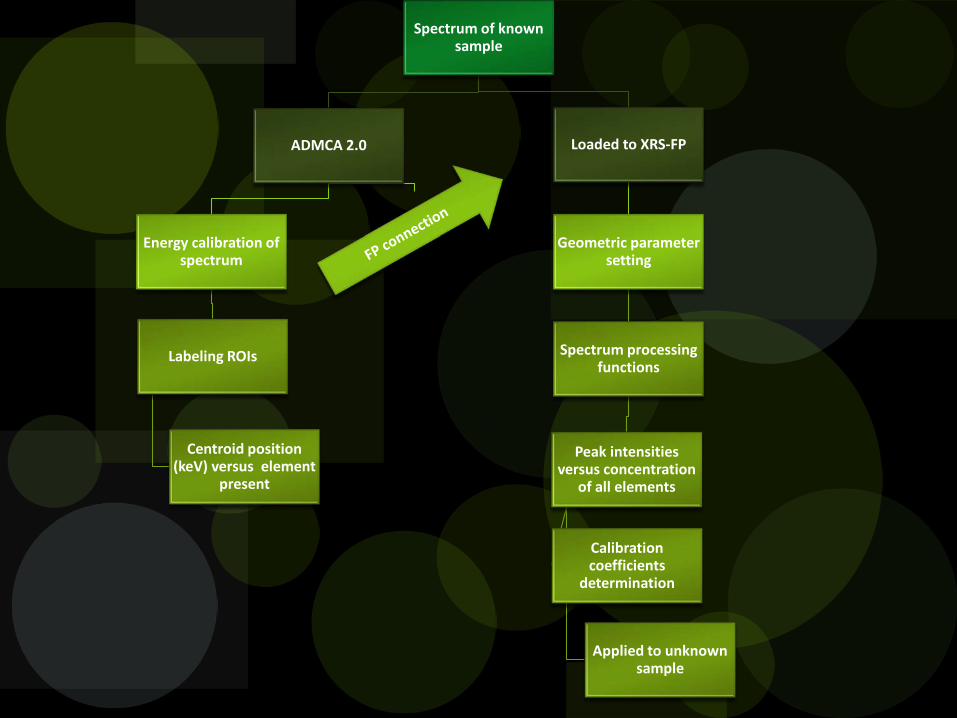
Spectrum of known sample
ADMCA 2.0
Energy calibration of spectrum
Labeling ROIs
Centroid position (keV) versus element
present
Loaded to XRS-FP
Geometric parameter setting
Spectrum processing functions
Peak intensities versus concentration
of all elements
Calibration coefficients
determination
Applied to unknown sample
References http://www.amptek.com/products.html http://users.skynet.be/xray_corner/xtb/chap011.html http://www.microsemi.com/brochures/pindiodes/appendix%2
0f.pdf http://www.panalytical.com/index.cfm?pid=137 http://www.spectro.com/pages/e/p0105wp01.htm