Embed Size (px)
Citation preview
Volume 98 Number 3 May-June 1993
Journal of Research of the National Institute of Standards and Technology
[J Res Natl Inst Stand Technol 98 321 (1993)]
X-Ray Diffraction Line Broadening Modeling and Applications to High-Tc Superconductors
Volume 98 Number 3 May-June 1993
Davor Balzar
National Institute of Standards and Technology Boulder CO 80303-3328
A method to analyze powder-diffraction line broadening is proposed and ap- plied to some novel high-Tc supercon- ductors Assuming that both size-broadened and strain-broadened profiles of the pure-specimen profile are described with a Voigt function it is shown that the analysis of Fourier coefficients leads to the Warren-Aver- bach method of separation of size and strain contributions The analysis of size coefficients shows that the hook ef- fect occurs when the Cauchy content of the size-broadened profile is underesti- mated The ratio of volume-weighted and surface-weighted domain sizes can change from mdash131 for the minimum allowed Cauchy content to 2 when the size-broadened profile is given solely by a Cauchy function If the distortion co- efficient is approximated by a harmonic term mean-square strains decrease lin- early with the increase of the averaging distance The local strain is finite only in the case of pure-Gauss strain broad- ening because strains are then indepen- dent of averaging distance Errors of root-mean-square strains as well as do- main sizes were evaluated The method was applied to two cubic structures with average volume-weighted domain sizes up to 3600 A as well as to tetrag- onal and orthorhombic (La-Sr)2Cu04 which exhibit weak line broadenings and highly overlapping reflections Comparison with the integral-breadth
methods is given Reliability of the method is discussed in the case of a cluster of the overlapping peaks The analysis of La2Cu04 and Lairaquo5Moi5Cu04(M = Ca Ba Sr) high-Tc superconductors showed that micro- strains and incoherently diffracting do- main sizes are highly anisotropic In the superconductors stacking-fault probabil- ity increases with increasing Tc micro- strain decreases In La^CuOA different broadening of (hOQ) and (040) reflec- tions is not caused by stacking faults it might arise from lower crystallographic symmetiy The analysis of Bi-Cu-0 superconductors showed much higher strains in the [001] direction than in the basal a -b plane This may be caused by stacking disorder along the c-axis because of the two-dimensional weakly bonded BiO double layers Results for the specimen containing two related high-rc phases indicate a possible mechanism for the phase trans- formation by the growth of faulted regions of the major phase
Key words diffraction line broaden- ing lattice defects profile fitting superconductors Voigt function Warren-Averbach analysis x-ray diffraction
Accepted January 25 1992
Contents
1 Introduction 323 11 Powder X-Ray Diffraction 323
Visiting scientist on leave from the Department of Physics Faculty of Metallurgy University of Zagreb Sisak Croatia
12 Diffraction-Line Broadening 323 13 Superconductivity and Defects 324 14 Purpose of the Study 324 Previous Studies 325 [ 21 Size and Strain Broadening 325
321
Volume 98 Number 3 May-June 1993
Journal of Research of the National Institute of Standards and Technology
4
5
6
7 8
211 Determination of the Pure Specimen-Broadened Profile 325
212 Separation of Size and Strain Broadening 326
22 Diffraction-Line-Broadening Analysis of Superconductors 328
Experiment 329 31 Materials 329
311 Preparation of Specimens for X-Ray Diffraction 329
32 Measurement 329 33 Data Analysis 329 Methodology 330 41 Separation of Size and Strain
Broadenings 330 42 Size Coefficient 331 43 Distortion Coefficient 333 44 Discussion 333 45 Random Errors of Derived
Parameters 335 Application 336 51 Correction for Instrumental
Broadening 337 52 Applicability of the Method 337
521 Silver and Tungsten Powders 337
522 La2-xSrxCu04 Powders 340 53 Comparison with the Integral-
Breadth Methods 342 54 Reliability of Profile Fitting 343 55 Remarks 344 Analysis of Superconductors 345 61 (La-M)2Cu04 Superconductors 345 62 Bi-Cu-O Superconductors 348 63 Remarks 349 Conclusions 350 References 351
Glossary
a b c m m U V W U V W ixz A fl3
D
General constants General constants General constants General variables Fourier coefficient Edge of orthorhombic cell orthogonal to diffracting planes Domain size orthogonal to diffracting planes Interplanar spacing Upper limit of strain
FWHM Full width at half maximum of profile
fF Pure-specimen (physically) broadened profile and its Fourier transform
ampG Instrumentally broadened profile and its Fourier transform
hH Observed broadened profile and its Fourier transform
hkl Miller indices I Intensity Jc Critical superconducting current
density K Scherrer constant k Pciir^^ Pc) characteristic
integral-breadth ratio of a Voigt function
L naj column length (distance in real space) orthogonal to diffracting planes
I Order of reflection MSS Mean-square strains N Average number of cells per
column n Harmonic number P Column-length distribu-
tion function R Relative error RMSS Root-mean-square strains s 2sin eX = Vd variable in
reciprocal space Tc Critical superconducting
transition temperature w Observation weight Z Displacement of two cells in a
column a Stacking-fault probability a Twin-fault probability P )3(20)cos0oA integral breadth
in units of 5(A) 7 Geometrical-aberration profile S Fraction of oxygen atoms
missing per formula unit eL)) Mean-square strain orthogonal
to diffracting planes averaged over the distance L
V Apparent strain e Bragg angle eo Bragg angle of Kai reflection
maximum A
CO
X-ray wavelength Span of profile in real space Wavelength-distribution profile
322
Volume 98 Number 3 May-June 1993
Journal of Research of the National Institute of Standards and Technology
Superscripts
D Denotes the distortion-related parameter S Denotes the size-related parameter
Subscripts
C Denotes Cauchy component of Voigt function
D Denotes distortion-related parameter Denotes pure-specimen (physically)
broadened profile G Denotes Gauss component of Voigt function g Denotes instrumentally broadened profile h Denotes observed broadened profile S Denotes size-related parameter s Denotes surface-weighted parameter V Denotes volume-weighted parameter wp Denotes weighted-residual error
Operators
Convolution g(x)f(x) = Sg(z)f(jc -z)dz
1 Introduction
X-ray diffraction is one of the oldest tools used to study the structure of matter In 1912 Laue [1] demonstrated in a single experiment that crystals consist of regularly repeating elementary building blocks and that x rays show wave nature Since then x-ray diffraction has become one of the basic and the most widely used methods for characteriza- tion of a broad range of materials
11 Powder X-Ray Diffraction
Many materials are not available in a monocrys- tal form Moreover powders and bulk materials are more easily obtainable practical and less ex- pensive A powder-diffraction experiment requires an order-of-magnitude shorter time than a monocrystal experiment Thus powder diffraction is used very often However because data are of lower quality and peaks are generally highly over- lapped at higher diffracting angles until 25 years ago powder diffraction was mostly used for qualita- tive phase analysis Through advances by Rietveld [2 3] powder-diffraction patterns become used in structure analysis so-called structure (Rietveld) re- finement Development of fast on-line computer- controlled data acquisition has allowed a quick analysis of the whole diffraction pattern Table 1 summarizes uses of different diffraction line-pro- file parameters in various types of analyses (after
Howard and Preston [4]) We shall focus on line- profile analysis to obtain information about mi- crostructural properties of materials microstrains in the lattice and size of incoherently diffracting domains in crystals
Table 1 Use of diffraction line-profile parameters
Position Intensity Shape Shift Method Identification
V Indexing Cell parameters
V V Phase Identification analysis and quantity
V Peak-shift Internal strain analysis (residual stress)
V V Profile Microstrain analysis crystallite size
lattice defects
V V V Structure Atomic posi- refine- tions Debye- ment Waller factors
others
12 Diffraction-Line Broadening
Diffraction from crystal planes occurs at well- defined angles that satisfy the Bragg equation
= 2dhkisin6iM (1)
Theoretically intensity diffracted from an infinite crystal should consist of diffraction lines without width (Dirac delta functions) at some discrete dif- fraction angles However both instrument and specimen broaden the diffraction lines and the ob- served line profile is a convolution of three func- tions [5 6]
h (26) = [io)y)f] (20) + background (2)
Wavelength distribution and geometrical aberra- tions are usually treated as characteristic for the particular instrument (instrumental profile)
gi2e) = icoy)i2d) (3)
To obtain a specimens microstructural parameters the specimen (physically) broadened profilemust be extracted from the observed profile h
Origins of specimen broadening are numerous Generally any lattice imperfection will cause
323
Volume 98 Number 3 May-June 1993
Journal of Research of the National Institute of Standards and Technology
additional diffraction-line broadening Therefore dislocations vacancies interstitials substitutions and similar defects manifest themselves through the lattice strain If a crystal is broken into smaller incoherently diffracting domains by dislocation arrays stacking faults twins or any other extended imperfections then domain-size broadening occurs
13 Superconductivity and Defects
Since discovery of the ~90 K superconductor YBa2Cu307-laquo [7] it became clear that the novel su- perconductivity relates closely to defects in struc- ture Both point and extended defects relate closely to the physical properties of superconduc- tors [8 9] Defects play an important role both in the critical superconducting transition temperature Tc [10] and in the critical current density c [H] Some theories also connect Tc with lattice distor- tion [12] with strains around dislocations [13] and with interaction of current carriers and the elastic- strain field [14]
The Tc of YBajCuaOv-ji for instance depends strongly on the ojq^gen stoichiometry that is num- ber of oxygen vacancies in the charge-reservoir lay- ers and their arrangement (see Jorgensen [15] and references therein) Superconductivity in La2Cu04 appears either by the partial substitution of La with Sr Ba Ca [16 17] or by the introduction of inter- stitial oxygen defects in the La202 layer [18] Some substitutions especially on Cu sites destroy the su- perconductivity
For classical superconductors c can be drasti- cally increased by introducing defects to pin mag- netic flux vortices The layered structure of high-Tc cuprates causes the vortices to be pinned in the form of pancakes rather than long qflinders [19] Because of relatively small coherence length of vortices pinning can not be increased in the classi- cal way by introducing second-phase precipitates Instead submicroscopic lattice defects caused by local stoichiometry fluctuations vacancies substi- tutions Guinier-Preston zones and the strain field of small coherent precipitates are much more ef- fective Especially in highly anisotropic Tl-based and Bi-based cuprates substitutions are very suc- cessful Even a 5 Mg for Ba substitution in Tl2Ba2CaCu208 increases c by 25 [20]
14 Purpose of the Study
We know that defects have a very important role in novel high-Tc superconductivity Defects can be characterized and quantified by analyzing the x-ray
diffraction broadening Basically there are two ap- proaches
(i) The Stokes deconvolution method [21] com- bined with the Warren and Averbach analysis [22] give the most rigorous and unbiased approach be- cause no assumption about the analytical form of diffraction-peak shape is required However when peaks overlap and specimen broadening is com- parable with the instrumental broadening the Stokes method gives unstable solutions and large errors or can not be performed at all To obtain reliable results proper corrections have to account for truncation background sampling and the stan- dards errors [23]
(ii) The simplified integral-breadth methods (summarized by Klug and Alexander [24]) are more convenient and easier to use but they require that size and strain broadening are modeled by ei- ther Cauchy or Gauss functions Experience has shown however that in most cases both size and strain profiles can not be satisfactorily represented with either function However there is some theo- retical and experimental evidence that the effect of small-domain-size broadening produces long pro- file tails of the Cauchy function and that the lat- tice-strain distribution is more Gauss-like Langford [25 26] used the convolution of Cauchy and Gauss functions (Voigt function) to model specimen broadening However the results ob- tained by the integral-breadth and Warren-Aver- bach analyses are usually not comparable the first methods give volume-weighted domain sizes and upper limit of strain the second gives surface- weighted domain sizes and mean-square strain av- eraged over some distance perpendicular to diffracting planes
Unfortunately most high-Tc superconductors show weak peak broadening (because of high an- nealing temperatures) and strong peak overlapping (because of relatively complicated crystal struc- tures) which makes it very difficult to apply the Stokes deconvolution method to extract pure speci- men broadening The aim in this study is twofold
(i) To develop a reliable method for analysis of a pattern with highly overlapping reflections and weak structural broadening and to compare it with the previously described approaches It will be shown that the Voigt-function modeling of the specimen broadening concurs with the Warren- Averbach approach
(ii) To apply the method to the same high-Tc superconductors and conclude how much informa- tion about defects can be extracted from analysis of the x-ray diffraction broadening
324
Volume 98 Number 3 May-June 1993
Journal of Research of the National Institute of Standards and Technology
2 Previous Studies 21 Size and Strain Broadening
Some important methods to extract specimen size and strain broadening and information about domain sizes and strains will be reviewed briefly An excellent review about Fourier methods and in- tegral-breadth methods is given by Klug and Alex- ander [24] A survey of single-line methods was authored by Delhez de Keijser and Mittemeijer [27] The use of variance (reduced second moment of the line profile) in the analysis of broadening will not be treated here Wilson described the con- tributions to variance by crystallite size [28] and strain [29]
211 Determination of the Pure Specimen- Broadened Profile As mentioned in Sec 12 be- fore the specimens size and strain broadening can be obtained the observed profile must be cor- rected for instrumental broadening Most used methods are the Fourier-transform deconvolution method [30 21] and simplified integral-breadth methods that rely on some assumed analytical forms of the peak profiles The iterative method of successive foldings [31 32] is not used extensively and will not be considered here
Deconvolution Method of Stokes From Eqs (2) and (3) it follows that deconvolution can be per- formed easily in terms of Fourier transforms of re- spective functions
F(n) = =H(nl G(ny (4)
Hence the physically broadened profile is re- trieved from the observed profile h without any as- sumption on the peak-profile shape (see Fig 1) This method is the most desirable approach be- cause it is totally unbiased However because of the deconvolution process there are many prob- lems Equation (4) may not give a solution if the Fourier coefficients of the profile do not vanish before those of the g profile Furthermore if physi- cal broadening is small compared with instrumen- tal broadening deconvolution becomes too unstable and inaccurate [33 34] If the h profile is 20 broader than the g profile this gives an upper limit of about 1000 A for the determination of ef- fective domain size [34] Regardless of the degree of broadening deconvolution produces unavoid- able profile-tail ripples because of truncation ef- fects To obtain reliable results these errors have to be corrected along with errors of incorrect background sampling and the standard specimen
[23 35 36] The largest problem however is peak overlapping If the complete peak is not separated the only possible solution is to try to reconstruct the missing parts That would require some as- sumption on the peak-profile shape that is intro- duction of bias into the method The application of the Stokes method is therefore limited to materials having the highest crystallographic symmetry
dh(x)
Fig 1 Observed profile n is a convolution of the instrumental profile g with the specimen profile Adapted from Warren [59]
Integral-Breadth Methods The basic assumption of these methods is that diffraction profiles can be ap- proximated with some analytical function In the beginning two commonly used functions were Gauss
(x)=(0)exp[-7|^] (5)
and Cauchy
(gt=) =(0) 4+
(6)
From the convolution integral it follows easily that
Ac = ftc + iE^c (7)
for Cauchy profiles and
l3lG = lih + Ph (8)
for Gauss profiles However the observed x-ray diffraction line profiles can not be well represented with a simple Cauchy or Gauss function [24 37] But they are almost pure Cauchy at highest angles because the dominant cause of broadening be- comes the spectral distribution in radiation [24] Different geometrical aberrations of the instru- ment are difficult to describe with simple analytical functions In the case of closely Gaussian broaden- ing of y following Eq (3) the instrumental line profile can be best described by a convolution of Cauchy and Gauss functions which is the Voigt
325
Volume 98 Number 3 May-June 1993
Journal of Research of the National Institute of Standards and Technology
function Experience shows that the Voigt function [38] (or its approximations pseudo-Voigt [39 40] and Pearson-VII [41 42]) fits very well the ob- served peak profiles [25 43 37] The Voigt func- tion is usually represented following Langford [25]
nx)=m^)Rc[ctn(^ + ik)] (9)
Here the complex error function is defined as
erfi(z) = exp( -z^) [1 - erf( -raquo)] (10)
Its evaluation can be accomplished using Sundius [44] or Armstrong [45] algorithms with eight-digit accuracy Useful information about the Voigt func- tion can be found in papers of Kielkopf [46] As- thana and Kiefer [47] and de Vreede et al [48] Figure 2 presents a Voigt function for different val- ues of Cauchy and Gauss integral breadths
causes diffraction-line broadening
12
Pc=005 pc=005
Pc = 01pc=001
PG=001PC=01
283 26
Fig 2 Voigt functions for different values of Cauchy and Gauss integral breadths Adapted from Howard and Preston [4]
Integral breadth of the Voigt function is expressed through its constituent integral breadths [49]
^ erfc(A) (11)
Here erfc denotes the complementary error func- tion
Because convolution of two Voigt functions is also a Voigt function integral breadths are easily separable conforming to Eqs (7) and (8)
212 Separation of Size and Strain Broadening After removing the instrumental broadening from the observed line profile it is possible to analyze the pure-specimen (physically) broadened line pro- file to consider the origins and amount of broad- ening
In 1918 Scherrer [50] recognized that break- ing the crystal into domains smaller than ~1000 A
ltZ)gtv = KX
3(20) cos9 (12)
The constant K depends on the crystallite shape [515253545556] but generally is close to unity The main characteristic of size broadening is that it is independent of the reflection order that is inde- pendent of diffraction angle
Most of the work on x-ray diffraction line broad- ening was done on metals and alloys It is widely accepted that plastic deformation in metals pro- duces dislocation arrays which divide crystallites into much smaller incoherently scattering domains These dislocations produce strains within the do- mains causing strain broadening It was elaborated in Sec 12 that any lattice imperfection (vacancies interstitials and substitutions) would broaden the diffraction peaks These effects would be inter- preted in the frame of this theory as a strain broad- ening too Stokes and Wilson [57] defined apparent strain as
Tj=3(20)cot0 (13)
Strain broadening is angle dependent Therefore the angle dependence of the line broadening gives a possibility to distinguish between contributions of size and strain However when we speak of size and strain broadening they may include other con- tributions For instance stacking faults and twins will contribute to broadening similar to size effects
Warren-Averbach Method This method was devel- oped originally for plastically deformed metals but since its introduction [58 22] it found successful application to many other materials The method is extensively described in Warrens publications [59 60] Each domain is represented by columns of cells along the 03 direction [61] (see Fig 3) The crystal has orthorhombic axes with the direction 03 normal to the diffracting planes (00) The experi- mentally observable diffraction power may be ex- pressed as a Fourier series
(20)=-^ 2 An expilvina^s) (14)
Here experimentally measurable coefficients Abdquo are
Nbdquo Abdquo =T^ ltexp(2m7Zbdquo)) (15)
326
Volume 98 Number 3 May-June 1993
Journal of Research of the National Institute of Standards and Technology
m 3
^i
m I
Fig 3 Representation of the crystal in terms of columns of cells along the a^ direction [59]
The Abdquo coefficients are the product of two terms The first term depends only on the column length (size coefficient) the second depends only on dis- tortion in domains (distortion coefficient)
An mdashAn An bull
Nbdquo lf = ltexp(2TrZbdquo))
(16)
(17)
It is more convenient to express the distortion coef- ficient in terms of the strain component If L =laquoa3 is the undistorted distance between a pair of cells along direction 03 and distortion changes distance by 4L = a^Zn the component of strain in the as direction (orthogonal to reflecting planes) aver- aged over distance L can be defined as (L) = A(L) L Because oil^d interplanar spacing the distortion coefficient can be rewritten
Ideg(L) = exp(2TrLe(L)d)) (18)
To obtain the strain component it is necessary to approximate the exponential term For not too large L
exp(2mLe(L)d)
laquoexp(-2Tr^L2lte2(L))d^) (19)
This relationship is exact if the distributions of e(L) for all L values follow the Gauss function and is generally true as far as terms in e^(L) because
these distributions are usually sufficiently symmet- rical [57] Now Eq (16) can be approximated as
InA L)=lnAL)- 2TTeL))LW) (20)
Warren and Averbach [22] derived this relation- ship in a similar way It separates size and strain contributions to the broadening and allows for their simultaneous evaluation
If the size coefficients are obtained by applica- tions of Eq (20) it is possible to evaluate the aver- age surface-weighted domain size and the surface-weighted column-length distribution func- tion [59]
idAHL) ^ 1_
Ps(L) dMU) dL^
(21)
(22)
Figure 4 shows how (D) can be obtained from both the size coefficients ^^(L) and the column- length distribution function
Fig 4 Surface-weighted domain size is determined (a) by the intercept of the initial slope on the L-axis (b) as a mean value of the distribution function
Multiple-Line Integral-Breadth Methods To sepa- rate size and strain broadening by using integral breadths it is necessary to define the functional form for each effect In the beginning size and strain contributions were described by Cauchy or Gauss functions Using Eqs (12) and (13) on the s scale and additive relations for the integral breadths following Eqs (7) and (8)
1 j8 =77vr + 2es (Cauchy-Cauchy) (23)
8=T^ + ^y- (Cauchy-Gauss) (24)
327
Volume 98 Number 3 May-June 1993 Journal of Research of the National Institute of Standards and Technology
^^=7^ + 4e^s^ (Gauss-Gauss) (25)
Here e = Tj4raquo4dd is the upper limit for a strain Equation (24) uses the Haider and Wagner [62] parabolic approximation for the integral breadth of the Voigt function expressed by Eq (11)
3 I3) (26)
Experience shows however that neither Cauchy nor Gauss functions can model satisfactorily size or strain broadening in a general case Langford [26] introduced the so-called multiple-line Voigt-func- tion analysis Both size-broadened and strain- broadened profiles are assumed to be Voigt functions Using Eqs (12) and (13) it follows sym- bolically for Cauchy and Gauss parts that
j8c = i3sc+j8Dcs
ph = Plc + plcs^
(27)
(28)
This approach disagrees with the Warren- Averbach analysis that is the two methods give different results (see Sec 44) [63 64]
Single-Line Methods There are cases where only the first order of reflection is available or higher- order reflections are severely suppressed (ex- tremely deformed materials multiphase com- posites catalysts and oriented thin films) Many methods exist to separate size and strain broaden- ing from only one diffraction peak However it was stated in Sec 212 that the different size and strain broadening angle dependence is a basis for their separation hence using only one diffraction line introduces a contradiction Consequently single- line methods should be used only when no other option exists The single-line methods can be di- vided in two main parts Fourier-space and real- space methods Fourier-space methods are based on the Warren-Averbach separation of size and strain broadening following Eq (20) The func- tional form of E^(L)) is assumed either to be con- stant [65666768] or assumed to depend on L as eL))=cL [69707172] Then Eq (20) can be fitted to few points of A(L) for the small averaging distance L to obtain size and strain parameters All Fourier-space methods have the serious prob-
lem that the Fourier coefficients 4 (L) are usually uncertain for small L because of the so-called hook effect [60] (see Sec 42) 2occhi [73] sug- gested that fitting the straight line through the first derivatives of the Fourier coefficients instead of through the coefficients themselves would solve the hook-effect problem
All real-space methods [747576] are based on the assumption that the Cauchy function deter- mines size and that the Gauss function gives strain The most widely used method of de Keijser et al [76] gives size and strain parameters from Cauchy and Gauss parts of the Voigt function respectively
P)v=^
e=^ 2s
(29)
(30)
22 Diffraction-Line-Broadening Analysis of Superconductors
In this field very few studies exist Williams et al [77] reported isotropic strains in YBa2Cu307-laquo powder by the simultaneous Rietveld refinement of pulsed-neutron and x-ray diffraction data Using a GSAS Rietveld refinement program [78] both size and strain broadening were modeled with the Gauss functions for the neutron-diffraction data [79 80] and with the Cauchy functions for the x- ray diffraction data (modified method of Thomp- son Cox and Hastings [81]) Interestingly both the neutron and x-ray data gave identical values for the isotropic strain (023) and no size broaden- ing Singh et al [82] studied internal strains in YBa2Cu307-laquo extruded wires by pulsed-neutron diffraction They separated size and strain parame- ters by means of Eq (25) (Gauss-Gauss approxi- mation) Size broadening was found to be negligible but (isotropic) microstrains range from 005 for the coarse-grained material to 03 for the fine-grained samples Eatough Ginley and Morosin [83] studied Tl2Ba2Ca2Cu30io (Tl-2223) and Tl2Ba2CaCu208 (Tl-2212) superconducting thin films by x-ray diffraction Using the Gauss-Gauss approximafion they found strains of 014-018 in both phases and domain sizes of 1200-1400 A for Tl-2212 but 500 A for Tl-2223
We are aware of only two more unpublished studies [84 85] involving size-strain analysis in high-Tc superconductors The probable reason is that any analysis is very difficult because of weak line broadening and overlapping reflections This
328
Volume 98 Number 3 May-June 1993
Journal of Research of the National Institute of Standards and Technology
precludes application of reliable analysis such as the Stokes deconvolution method with the Warren- Averbach analysis of the broadening Instead sim- ple integral-breadth methods are used which gives generally different results for each approach Moreover for x-ray diffraction broadening appli- cation of the Gauss-Gauss approximation does not have any theoretical merit although reasonable values especially of domain sizes may be obtained [86] We showed [878889] that reliable diffrac- tion-line-broadening analysis of superconductors can be accomplished and valuable information about anisotropic strains and incoherently diffract- ing domain sizes obtained
3 Experiment 31 Materials
The materials used for this study were tungsten and silver commercially available powders with nominal grain sizes 4-12 ijim La2-xSriCu04(jc = 0 006 015 024) powders Lai^Moi5Cu04(M = Ca Ba) powders Bi2Sr2CaCu208 (Bi-2212) sinter (BiPb)2Sr2Ca2Cu30io(BiPb-2223) sinter and (BiPb)2(SrMg)2(BaCa)2Cu30io (BiPbMgBa-2223) sinter
Powders with nominal compositions La2-xSrCuO4(c=0 006 015 024) and Laig5Moi5Cu04(M = Ca Ba) were prepared at the National Institute of Standards and Technology Boulder Colorado by A Roshko using a freeze- drying acetate process [90] Acetates of the various cations were assayed by mass by calcining to the corresponding oxide or carbonate The appropriate masses of the acetates for the desired compositions were dissolved in deionized water The acetate so- lutions were then sprayed through a fine nozzle into liquid nitrogen to preserve the homogeneous cation distributions Frozen particles were trans- ferred to crystallization dishes and dried in a com- mercial freeze dryer to a final temperature of 100 degC After drying the powders except the Lai^Baoi5Cu04 were calcined in alumina (998) crucibles at 675 C for 1 h in a box furnace with the door slightly open to increase ventilation Because BaCOs is difficult to decompose the Laig5Baoi5Cu04 was calcined under a vacuum of 2 Pa at 800 C for 4 h then cooled slowly in flowing oxygen (2degCmin) The calcined powders were oxidized in platinum-lined alumina boats in a tube furnace with flowing oj^gen at 700 degC After 3 h at 700 C the powders were pushed to a cold end of the furnace tube where they cooled quickly (20 Cs) while still in flowing oxygen
The cylindrical specimens (23 mm in diameter and 9 mm thick) of Bi-2212 BiPb-2223 and BiPbMgBa-2223 were prepared at the National Research Institute for Metals Tsukuba Japan by K Togano [91] Starting oxides and carbonates were Pb304 61203 CuO SrCOs MgCOs and BaC03 They were calcinated in air at 800 C for 12 h Powders were then pressed and sintered in 8 oxygen-92 argon mixture at 835 degC for 83 h Specimens were furnace cooled to 750 degC held for 3 h in flowing oxygen and then furnace cooled in ojygen to room temperature
311 Preparation of Specimens for X-ray Diffraction The bulk specimens were surface polished if necessary and mounted in specimen holders Coarse-grained powders of La2-cSrxCu04 (x=Q 006 015 024) and Lai8sMoi5Cu04 (M = Ca Ba) were ground with a mortar and pestle in toluene and passed through a 635-mesh sieve (20-|xm nominal opening size) Silver and tungsten powders were dry ground with a mortar and pestle All powders were mixed with about 30 silicone grease and loaded into rectangular cavities or slur- ried with amyl acetate on a zero-background quartz substrate
32 Measurements
X-ray-diffraction data were collected using a standard two-circle powder goniometer in Bragg- Brentano parafocusing geometry [92 93] (see Fig 5) A flat sample is irradiated at some angle incident to its surface and diffraction occurs only from crystallographic planes parallel to the speci- men surface The goniometer had a vertical 0-26 axis and 22 cm radius CnKa radiation ex- cited at 45 kV and 40 mA was collimated with Seller slits [94] and a 2 mm divergence slit SoUer slits in the diffracted beam 02 mm receiving slit and Ge solid-state detector were used in a step- scanning mode (OOI7IO s for a standard specimen 002deg-005730-80 s for other specimens depending on the amount of broadening)
33 Data Analysis
The diffractometer was controlled by a com- puter and all measurements were stored on hard disc Data were transferred to a personal computer for processing
We used computer programs for most calcula- tions X-ray diffraction patterns were fitted with the program SHADOW [95] This program allows a choice of the fitting function and gives refined positions of the peak maximums intensities and function-dependent parameters It also has the
329
Volume 98 Number 3 May-June 1993
Journal of Research of the National Institute of Standards and Technology
Seller Slits
Source S
Specimen
Fig 5 Optical arrangement of an x-ray diffractometer Adapted from Klug and Alexander [24]
ability to convolute the predefined instrumental profile with the specimen function to match the ob- served pattern Choice of the specimen function in- cludes Gauss and Cauchy functions We added the ability to model the specimen broadening with an exact Voigt function and implemented SHADOW on a personal computer In the fitting procedure for every peak in the pattern the program first gen- erates the instrumental profile at the required dif- fraction angle The instrumental profile is deter- mined from prior measurements on a well-annealed standard specimen (see Sec 51) Then it assumes parameters of the specimen profile For an exact Voigt function parameters are peak position peak intensity and Cauchy and Gauss integral breadths of the Voigt function By convoluting the instru- mental profile with the specimen profile and adding a background the calculated pattern is ob- tained [Eq (2)] Parameters of the specimen profile are varied until the weighted least-squares error of calculated and observed patterns Eq (59) reaches a minimum This process avoids the unstable Stokes deconvolution method It is possible that the refine- ment algorithm is being trapped in a false minimum [96] but it can be corrected by constraining some parameters Refined parameters of the pure-speci- men profile are input for the size-strain analysis of the broadening A program for this analysis was written in Fortran
Lattice parameters of powder specimens were calculated by the program NBSLSQ85 based on the method of Appleman and Evans [97] A pro- gram in Fortran was written to apply corrections to observed peak maximums by using NIST standard reference material 660 LaB6 as an external stan-
dard Lattice parameters of bulk specimens were determined by the Fortran program which uses a modified Cohens method [9899100] to correct for systematic diffractometer errors Lattice parame- ters were also calculated by the Rietveld refinement programs GSAS [78] and DBW32S [101 102]
4 Methodology
When instrumental and specimen contributions to the observed line profile must be modeled sepa- rately adopting a specimen function is a critical step Yau and Howard [103104] used Cauchy and Enzo et al [105] pseudo-Voigt functions Benedetti Fagherazzi Enzo and Battagliarin [106] showed that modeling the specimen function with the pseudo-Voigt function gives results comparable to those of the Stokes deconvolution method when combined with the Warren-Averbach analysis of Fourier coefficients De Keijser Mittemeijer and Rozendaal [107] analytically derived domain sizes and root-mean-square strains for small averaging distance L in the case of the Voigt and related func- tions
The aim here is to study more thoroughly the consequences of assumed Voigt specimen function on the size-strain analysis of the Fourier coeffi- cients of the broadened peaks It is shown that some experimentally observed interrelations between derived parameters (particularly volume-weighted and surface-weighted domain sizes) and their be- havior (the hook effect and dependence of mean- square strains on the averaging distance) can be explained by this simple assumption Moreover the discrepancy between the integral-breadth methods and Warren-Averbach analysis results from differ- ent approximations for the strain broadening and the background experimental errors
41 Separation of Size and Strain Broadenings
The normalized Fourier transform of a Voigt function is easily computable [46]
^ =exD[-2laquo^e^-7m^^fi^l fan ^bdquo-exp|^ ^ cr(2e) ^ a^(2e) T ^^^^
It is convenient to express Fourier coefficients in terms of distance L by immediately making the ap- proximation A (26) = Ascos do
AL) = exp[-2L^-7rL^pl] (32)
330
Volume 98 Number 3 May-June 1993
Journal of Research of the National Institute of Standards and Technology
Equation (32) is a good approximation even for large specimen broadening Even for a profile span of A (29) = 80deg the error made by replacing this in- terval by an adequate A(sin9 ) range is 2 How- ever strictly speaking the profile will be asym- metrical in reciprocal space and Fourier-interval limits will not correspond to the 29i and Idz peak- cutoff values in real space It is important to keep Fourier interval limits identical for all multiple-or- der reflections otherwise serious errors in the sub- sequent analysis will occur [108] If higher accuracy for a considerable broadening is desired profile fit- ting can be accomplished In terms of the recipro- cal-space variable s instead of in a real 29 space
Assuming that only the Cauchy function deter- mines domain size [4(L) = exp(-L(Z))s)] and only the Gauss function gives root-mean-square strain (RMSS) [^deg(L) = exp(-27r=L2(e)d^)] Eq (32) leads to the Warren-Averbach [Eq (20)] for the separation of size and strain contribution [62] Experience shows that Cauchy and Gauss functions can not satisfactory model specimen broadening Balzar and Ledbetter [64] postulate that the speci- men function includes contributions of size and strain effects both approximated with the Voigt functions Because the convolution of two Voigt functions is also a Voigt function Cauchy and Gauss integral breadths of the specimen profile are easily separable
3c=i3sc + 3DC (33)
(34)
Langford [26] separated the contributions from size and strain broadening in a similar way (See Eqs (27) and (28)) Note however that Eqs (33) and (34) do not define size and strain angular or- der-dependence
Because Fourier coefficients are a product of a size and a distortion coefficient from Eqs (32) (33) and (34) we can obtain the separation of size and strain contributions to the pure specimen broadening
^S(L) = exp(-2Li3sc-TrL^3io) (35)
Adeg(L) = eM-2LpDc-TrL^Phc) (36)
Wang Lee and Lee [109] modeled the distortion coefficient and Selivanov and Smislov [110] mod- eled the size coefficient in the same way
To obtain size and distortion coefficients at least two reflections from the same crystallographic- plane family must be available
42 Size Coefficient
Surface-weighted domain size is calculated from the size coefficients following Eq (21) From Eq (35) we obtain
lt^gts = 1
2i3sc (37)
Therefore surface-weighted domain size depends only on the Cauchy part of the size-integral breadth
The second derivative of the size coefficients is proportional to the surface-weighted column-length distribution function Eq (22) The volume- weighted column-length distribution function fol- lows similarly [111]
p(L)ocL^j^ (38)
By differentiating Eq (35) twice we obtain
^^4^ = [(2^L^ic + 2^sc)^- dL
2TrplcAL) (39)
Because the column-length distribution function should always be positive [59] the Cauchy part must dominate Inspection of Eq (39) shows that for small L we must require
(40)
Otherwise the hook effect will occur in the plot of size coefficientsI (L) versus L that is the plot will be concave downward for small L (Fig 6) The hook effect is usually attributed to experimental errors connected with the truncation of the line profiles and consequently overestimation of background [59] This is a widely encountered prob- lem in the Fourier analysis of line broadening It results in overestimation of effective domain sizes and underestimation of the RMSS [36] Some authors [106] claim that the preset specimen- broadening function eliminates the hook effect However Eq (39) shows that effectively too high
331
Volume 98 Number 3 May-June 1993
Journal of Research of the National Institute of Standards and Technology
08-
04-
mdash^ 1 J 1 x
^~ ( ^ ^ i I
1 t 1 11
jl u
V 1 iJ
J
c^
100 200
Fig 6 (upper) The hook effect of the size coefficients A ^ (full line) at small L (lower) it causes negative values (set to zero) of the column-length distribution functions
background causes underestimation of the Cauchy content of the Voigt function because the long tails are truncated prematurely It has to be men- tioned that Wilkens [112] proposed tilted small-an- gle boundaries to be the source of the hook effect Liu and Wang [113] defined a minimum particle size present in a specimen depending on the size of the hook effect Figure 6 shows that negative values of the column-length distribution functions (set to zero) do not affect the shape but shift the entire distribution toward larger L values
Note also that the surface-weighted column- length distribution function ps(L) will usually have a maximum at L = 0 but for the particular ratio of integral breadths determined by Eq (40) it can be zero The volume-weighted column-length distribu- tion function7v(L) will always have a maximum for LsO
If the column-length distribution functions are known it is possible to evaluate mean values of respective distributions
lt^kv =
00
J ^ _0
(L)dL
raquosv(L)dL (41)
Integrals of this type can be evaluated analytically [114]
OQ
J cexp( - to^ - a )dc = i^y^ ^ of
hd^^^^fe)]- (^2)
Surface-weighted domain size (D)s must be equal to the value obtained from Eq (37) The volume- weighted domain size follows
ltD)v = ^^erfc(A) = js (43)
Using Eqs (37) and (43) we can evaluate the ratio of domain sizes
i^ = 7r lt^gts
= 2vn-^exp(A2)erfc(^) (44)
Theoretically k can change from zero to infinity However the minimum value of k is determined by Eq (40)
1V2 ltk lt laquogt (45)
Hence the ratio of domain sizes can change in a limited range (see also Fig 7)
131laquo V2^ erfc (^ ) s ^ lt 2 (46)
10^ 10^ 10- 10deg 10 10^ 10-
Fig 7 The ratio of volume-weighted and surface-weighted domain sizes as a function of the characteristic ratio of Cauchy and Gauss integral breadths k
332
Volume 98 Number 3 May-June 1993
Journal of Research of the National Institute of Standards and Technology
It may be noted that most experiments give the ratio D)vD)s in this range (see for instance re- view by Klug and Alexander [24]) When k goes to infinity the size broadening is given only by the Cauchy component and (JD)V=2(D)S This is a case of pure Cauchy size broadening described by Haider and Wagner [62] and de Keijser Mittemei- jer and Rozendaal [107] It is possible to imagine a more complicated column-length distribution func- tion [27] than Eq (39) which would allow even larger differences between surface-weighted and volume-weighted domain sizes However we are not aware of any study reporting a difference larger than 100
43 Distortion Coefficient
In Sec 212 it was shown that the distortion co- efficient can be approximated by the exponential
Adeg(L) = exp(-ITTVLeL))) (47)
Comparing with Eq (36) we can write
Therefore mean-square strains (MSS) decrease linearly with averaging distance L This behavior is usually observed in the Warren-Averbach analysis Rothman and Cohen [115] showed that such be- havior would be expected of strains around disloca- tions Adler and Houska [116] Houska and Smith [117] and Rao and Houska [118] demonstrated for a number of materials that MSS can be repre- sented by a sum of two terms given by Cauchy and Gauss strain-broadened profiles
However for i3Dc=0 the MSS are independent ofL
(^2)12 ^ ^Dc(2g) cotg = ^ 2V2 V2TT
(49)
where the upper limit of strain e is defined as 7j4 (see Sec 212) This is a limiting case of pure- Gauss strain broadening described by de Keijser Mittemeijer and Rozendaal [107]
44 Discussion
To calculate domain sizes and strain it is neces- sary to define size and distortion integral-breadths angular order-dependence From Eq (43) It fol- lows that the domain size D )v is always indepen- dent of the order of reflection
)3sc = const JSSG = const
However from Eq (48) we find
^^ = const ^^ = const
(50)
(51)
An important consequence is that apparent strain TJ will be independent of angle of reflection only in the case of pure-Gauss strain broadening because 3DC and JSDG depend differently on the dif- fraction angle If we compare Eq (51) with the multiple-line Voigt-function analysis [26] given by Eqs (27) and (28) it is evident that they disagree Therefore recombination of constituent integral breadths 3DC and 3DO to Voigt strain-broadened in- tegral breadth Pdeg and the subsequent application of Eq (49) to calculate strain [26 119] will concur with the Fourier methods if strain broadening is entirely Gaussian and for the asymptotic value of MSS ((e^( 00))) However neither volume-weighted domain sizes D)y will agree although they are de- fined identically in both approaches because size- broadened and strain-broadened integral breadths are dependent variables
If at least two orders of reflection ( and +1) of the same plane (hkl) are available using Eqs (50) and (51) we can solve Eqs (33) and (34)
(52)
^^deg sl + l)-sil) ^^^^
^^=sHl + l)-sl) [fc( + l)-3c()3 (54)
^^=sl + l)-sl) [^(^ + ^)-^(0]- (55)
If we substitute these expressions into Eqs (35) and (36) we see that this approach leads exactly to the Warren-Averbach Eq (20) for two orders of reflections This is expected because the distortion coefficient is approximated with the exponential (47)] Delhez de Keijser and Mittemeijer [23] ar- gued that instead of Eq (20) the following rela- tion would be more accurate
A(L)=AXL) (1 -27r^(e^(L))LVd (56)
333
Volume 98 Number 3 May-June 1993
Journal of Research of the National Institute of Standards and Technology
These two approximations differ with fourth-order terms in the power-series expansion In terms of this approach Eq (48) has to be rewritten
2r ^^ l-exp(-2LI3DC-TTL^0DG) (57)
This means that even if the strain-broadened pro- file is given entirely by the Gauss function the MSS depend on distance L (see Fig 8) In this ap- proximation no simple relation for the distortion integral-breadths angular order-dependence exists For not so large L however Eq (51) holds and approximations from Eqs (20) and (56) do not dif- fer much (see Fig 8)
1500 Warren- Averbach approximation ^
Delhez de Kcijscr and ^^^ Minemeijer approximation ^y^
^ 1000 A
500
mdashI
1 1
Oc 300 600 IL k^) X 10^
90
o ^ 60 A
30
1
J Warren- Averbach approximation
Delhez de Keijser and Minemeijer approximation
0 0 150 300
1L (A-1 ) X 10^
Fig 8 Mean-square strains pound^(L)) for two approximations of the distortion coefficient (upper) Voigt strain broadening (lower) pure-Gauss strain broadening
Generally it was shown that in the size-broad- ened profile the Cauchy part must dominate No similar requirement for the strain-broadened pro- file exists However experience favors the assump- tion that it has to be more of Gauss-type The Warren-Averbach approach is exact if strain broad- ening is purely Gaussian so Eqs (20) and (48) are
better approximations as strain profile is closer to the Gauss function In any case both approaches given by Eqs (20) and (56) are good up to the third power in strain and the Warren-Averbach relation [Eq (20)] does not assume that MSS are independent of distance L [27] it also represents a harmonic approximation
If at least two orders of reflection from the same plane (hkl) are available we can use Eqs (52) (53) (54) and (55) to calculate size-related and strain-related integral breadths Subsequent appli- cation of Eqs (37) (43) and (48) gives directly domain sizes (D) and (D)v and mean-square strains (e^(L)) This approach is more straightfor- ward and much simpler than the original Warren- Averbach analysis Great care should be given to the possible systematic errors The easiest way to observe the hook effect is to plot column-length distribution functions as a function of averaging distance L If they show negative values for small L (see Fig 6) all derived parameters will be in error This is because (i) only the positive values of the column-length distribution functions are numeri- cally integrated or (ii) the intercept on the L-axis of the linear portion of the A^ vs L curve is taken (see Fig 4) always larger values of domain sizes will be obtained than by the application of Eqs (37) and (43) Therefore we conclude that the dis- crepancy between integral-breadth and Fourier methods is always present by the appearance of the hook effect in the A^ vs L curve An analogous discrepancy exists between integral-breadth and variance methods [119] In such cases correction methods for truncation can be applied [35 119 120] but the best procedure is to repeat the pat- tern fitting with the correct background
In the Fourier analysis it is usually observed that the mean-square strains diverge as the averaging distance L approaches zero This also follows from Eqs (48) and (57) However because the MSS de- pendence on distance L is not defined in Warren- Averbach analysis it was suggested [27 107 121] that local strain can be obtained by taking the sec- ond derivative of the distortion coefficient or by a Taylor-series expansion of local strain Therefore we obtain from Eq (36)
i^m-M^-^) (58)
It is evident that this relation is wrong It holds only for a special case of pure-Gauss strain-broad- ened profile when the MSS are equal for any L Otherwise if the Cauchy function contributes to
334
Volume 98 Number 3 May-June 1993
Journal of Research of the National Institute of Standards and Technology
strain broadening all derivatives of strain in L = 0 are infinite and local strain can not be defined If the main origin of strains is dislocations [115] strains are defined after some distance from the dislocation (cutoff radius) to be finite Averaging strains over a region smaller than the Burgers vector is probably not justified For instance Eq (48) gives even for a small averaging distance L = 1 A and considerable strain broadening (J3DG(20) = 3DC(20) = 1O) root-mean-square strain eL = 1A))^ laquo02 that is about the elastic limit
45 Random Errors of Derived Parameters
Errors in size and strain analysis of broadened peaks are relatively difficult to evaluate Following Langford [26] sources of the systematic errors in- clude choice of standard specimen background and type of analytical function used to describe the line profiles The first two errors should be mini- mized in the experimental procedure Errors caused by inadequate choice of specimen function would systematically affect all derived results but they can not be evaluated Random errors caused by counting statistics have been computed by Wilson [122 123 124] and applied to the Stokes deconvolution method by Delhez de Keijser and Mittemeijer [23] as well as by Langford [26] and de Keijser et al [76] using single-line Voigt-func- tion analysis Nevertheless the approximate error magnitude can be calculated from estimated stan- dard deviations (esd) of the parameters refined in the fitting procedure In the program SHADOW the weighted least-squares error is minimized
7wp mdash RES
Here
)=1
RES = 2 vfi [ (obs) - (cal)]
(59)
(60)
and weights are the reciprocal variances of the ob- servations
H = l(obs) (61)
Each line profile has four parameters varied inde- pendently position intensity and Cauchy and Gauss integral breadths of the Voigt profile In least-squares refinement esds are computed as
^^ bu RES (62) m mdashm
Here ba are diagonal elements of the inverse matrix of the equation coefficients m is the number of observations and m is the number of refined parameters The main source of errors is integral breadths Errors in peak position peak intensity and background are much smaller and can be ne- glected in this simple approach For two indepen- dent variables )3G and Pc covariance vanishes and from Eqs (37) and (38) for the two orders of re- flection and +1 it follows that
RD =
si+i)m)RHMi))+si)m+i)i^(3c(+D)
(63)
ReL)r) =
pHDRHPcG)) + m + miPcJl + D) 2[3c(+1) - i8c()3+TTL [m+1) - mw
-n-LmiDRHihd))+m+mWcH+i))i ^ 2[)3c(+1) - iSc()+TTLim+1) - mw
(65)
Here Rx) are relative standard deviations The error in D would be complicated to evaluate but because 131D)s^(Igt)vlt2(pound))s Eq (63) gives a good estimation for the error in (Z))v as well Alter- natively to see how errors depend on the Fourier coefficients errors can be estimated from the Warren-Averbach relationship [Eq (20)] (86) From Eq (32) it follows that
RA (L)) = ATr^Lpos)R^2d)) +
4Lph(s)RPci2e)) (66)
Errors in root-mean-square strains and domain sizes are
i^((e^(L ))bulllaquo) =
RHA(Ll))+RHA(Ll + l)) (67)
ALl + l)
335
Volume 98 Number 3 May-June 1993
Journal of Research of the National Institute of Standards and Technology
^^laquo^))=(T^)
s(l + 1)RHA (Ll)) +SV)RHA (Ll + D) lsl + l)-sl)f (68)
Here (D) is approximately defined with A^(L) = l-L(D)j Errors in Fourier coefficients increase with L while factors in Eqs (67) and (68) lower the errors for large L In general errors of domain sizes and strains are of the same order of magnitude as errors of integral breadths [86]
5 Application 51 Correction for Instrumental Broadening
Before specimen broadening is analyzed instru- mental broadening must be determined This is ac- complished by carefully measuring diffraction peaks of some well-annealed defect-free speci- men It is then assumed that its broadening may be attributed only to the instrument The usual proce- dure is to anneal the specimen However in some instances that is not possible because either the material undergoes an irreversible phase transition on annealing or the number of defects can not be successfully decreased by annealing Another pos- sibility is to measure the whole diffraction pattern of the material showing the minimal line broaden- ing and then to synthesize the instrumental profile at the needed diffraction angle This approach re- quires the modeling of the angle dependence of the instrumental (standard) parameters Cagliotti Pao- letti and Ricci [125] proposed the following func- tion to describe the variation of the full width at the half maximum of profile with the diffraction angle
F9miA^(2e) = Utan^9 + Vtand + W (69)
Although this function was derived for neutron dif- fraction it was confirmed to work well also in x-ray diffraction case [126 127] A more appropriate function for the x-ray angle-dispersive powder dif- fractometer based on theoretically predicted er- rors of some instrumental parameters [128] may be the following [129]
FWHNf (2 e) = W+Vsin^l 6 +
UtanH + UcotH (70)
This function may better model the increased axial divergency at low angles and correct for the speci- men transparency [129] However contrary to the requirement on the specimen function most im- portant for the instrumental function is to correctly describe the angular variation of parameters re- gardless of its theoretical foundation
When specimen broadening is modeled with a Voigt function the simplest way to correct for the instrumental broadening is by fitting the line pro- files with the Voigt function too Cauchy and Gauss integral breadths of the specimen-broad- ened profile are then easily computable by Eqs (7) and (8) However because the instrumental broad- ening is asymmetric [24] modeling with the sym- metric Voigt function can cause a fictitious error distribution resulting in errors of strain up to 35 [76] Another approach is to model the instrumen- tal-broadening angle dependence by fitting the profile shapes of a standard specimen with some asymmetrical function split-Pearson-VII [95] or pseudo-Voigt convoluted with the exponential function [105] The instrumental function can then be synthesized at any desired angle of diffraction and convoluted with the assumed specimen func- tion to match the observed profile by means of Eq (2)
In the program SHADOW instrumental para- meters are determined by fitting the split-Pearson VII function (see Fig 9) to line profiles of a standard specimen
iix)=m- 2 m
with
c =-
mc^f
mm) mv-rim-12)
(71)
(72)
Here m = 1 or m = ltraquo yields a Cauchy or Gauss function respectively Refined full widths at half maximum (FWHM) and shape factors m for both low-angle and high-angle sides of the profiles are fitted with second-order polynomials To fit the FWHM we used Eq (69) and for the shape fac- tors
m(2e) = U(20f + V(2e) + W (73)
The resulting coefficients U V W U V and W permit synthesis of the asymmetrical instrumental line profile at any desired angle
336
Volume 98 Number 3 May-June 1993
Journal of Research of the National Institute of Standards and Technology
2 0(deg)
le
Fig 9 A split-Pearson VII profile The two half profiles have same peak position and intensity Adapted from Howard and Preston [4]
The basic requirement on the standard specimen is however to show as small a line broadening as possible To minimize physical contributions to the Une broadening of the standard specimen a few moments were emphasized as follows Because dif- fraction-line width depends strongly on degree of annealing it is preferable to use some reference powder-diffraction standard Furthermore asym- metry in the peak profiles is introduced by axial divergence of the beam flat specimen surface and specimen transparency [24] Choosing a standard specimen with low absorption coefficient would cause transparency effects to dominate If the stud- ied specimen has a large absorption coefficient (compared to the standard) this might produce a fictitious size contribution and errors in micro- strains All of the specimens studied have absorp- tion coefficients exceeding 1000 cm^ so a NIST standard reference material 660 LaBe was chosen to model the instrumental broadening (p = 1098 cm) According to Fawcett et al [130] LaBe showed the narrowest lines of all studied com- pounds Furthermore LaB6_has a primitive cubic structure (space group Pm3m) resulting in rela- tively large number of peaks equally distributed over 26 This allows for better characterization and lower errors of FWHMs and shape factors of split- Pearson VII functions (Fig 10)
52 Applicability of the Method
To study the applicability of method described in Sec 4 we first studied simple cubic-structure mate- rials such as silver and tungsten Tungsten has very narrow line profiles allowing us to obtain the up- per limit of domain sizes that can be studied Silver is easily deformed which provides a possibility to apply the method to broad line profiles To test the
009
-a
OH
006
003
1 1 m low-angle side n m high-angle side
bullz w 2 o OH
X
tancopy
Fig 10 Refined FWHMs and shape factors (exponents) m for low-angle and high-angle sides of LaBe line profiles Second- order polynomials were fitted through points
case of relatively complicated patterns and weak line broadening the method was also applied to Lai85Sroi5Cu04 and La2Cu04 powders In this sec- tion only the mechanical aspects of the line broad- ening are discussed Discussion about the origins of broadening of superconductors can be found in Sec 6
521 Silver and Tungsten Powders Figure 11 shows observed and refined peaks of tungsten un- treated and silver ground powders In Table 2 are listed results of fitted pure-specimen Voigt profiles for silver and tungsten specimens Table 3 and Fig 12 give results of the line-broadening analysis Untreated tungsten powder shows relatively weak broadening Instrumental profile FWHMs at angle positions of (110) and (220) tungsten lines are 0059deg and 0081deg respectively close to values mea- sured for tungsten 0065deg and 0100deg Results in Table 3 reveal that small broadening is likely caused by domain sizes because microstrains have negligible value This pushes the limit for measur- able domain sizes probably up to 4500-5000 A However one must be aware that weak specimen broadening implies higher uncertainty of all derived parameters Moreover the choice of the instrumental standard becomes more crucial
Both silver and tungsten line profiles become more Cauchy-like after grinding which probably increases dislocation density in the crystallites This is consistent with the presumption that small crystallites and incoherently diffracting domains separated by dislocations within grains affect the tails of the diffraction-line profiles [60115] Figure 13 illustrates the dependence of MSS on the recip- rocal of the averaging distance L
337
Volume 98 Number 3 May-June 1993
Journal of Research of the National Institute of Standards and Technology
C8
z
7- ^95
29 (deg) 405
bullJf^r-
z S 08
Ez U o u OS
a
04 bull
o Es
4P
2000 z^fA
4000
B
z u f- z
425 435 445 29 (deg)
455
yr 600 SOO
L(A)
Fig 11 Observed points (pluses) refined pattern (full line) and difference pattern (below) (110) W untreated (upper) (200) Ag ground (lower)
Fig 12 Fourier coefficients for the first- (pluses) and second- order (crosses) reflection and size coefficients (circles) [111] Ag untreated (upper) [100] Ag ground (lower)
Table 2 Parameters of the pure-specimen Voigt function as obtained from profile-fitting procedure for tungsten and silver powders
Specimen hkl 2ft(deg) 3c(deg) 3G(deg) FWHM(deg) Rwp()
W untreated 110 220
4028 8705
00065(7) 00301(6)
0020(2) ltio-
0021 0019
90 44
W ground 110 220
4029 8705
0100(2) 0222(3)
0038(4) 0069(6)
0080 0166
90 42
Ag untreated 111 222 200 400
3806 8151 4425 9786
0056(1) 0105(4) 0118(2) 0274(21)
ltio- 00008(21)
ltio-^ ltio-5
0036 0067 0075 0175
105 97
105 122
Ag ground 111 222 200 400
3807 8151 4424 9783
0175(3) 0410(26) 0365(10) 1079(82)
0038(12) ltio-
0076(29) ltio-
0121 0261 0250 0687
99 145 99
145
338
Volume 98 Number 3 May-June 1993
Journal of Research of the National Institute of Standards and Technology
Table 3 Microstructural parameters for tungsten and silver powders
Specimen Direction (poundgt)raquo( A) (2))v(A) ltpound^(fl3))laquo (^laquoD)v2)gtw
W untreated [110] 3200(200) 3500(200) 000038 000008(2)
W ground [110] 620(20) 1030(30) 00023 000054(2)
Ag untreated [111] [100]
1000(20) 510(20)
2000(20) 1030(20)
00010 00022
000024(1) 000047(5)
Ag ground [111] [100]
380(20) 210(10)
650(20) 350(20)
00047 00100
000095(7) 000180(14)
100 -_ - [100) Ag ground ^ ^~ mdash C1111 Ag ground ^bull
y y
o y ^ 50 A y
y y
y
0
y - y ^--
c ) 50 100 150
lLfAjxlO^
Fig 13 Mean-square strains (E^) as a function of VL
Errors in integral breadths allow estimation of errors in strain and size parameters (Sec 45) but in some cases the refinement algorithm gives unre- liable errors of integral breadths When a particu- lar parameter is close to the limiting value (for instance 10^ degrees has been put as the mini- mum value for integral breadths) errors become large However in Eqs (63) (65) (66) (67) and (68) only the product of integral breadth and ac- companying error is significant which is roughly equal for Cauchy and Gauss parts Errors of do- main sizes and strains are of the same order of magnitude as errors of integral breadths
The possible source of systematic error is poten- tial inadequacy of Voigt function to accurately de- scribe specimen broadening This effect can not be evaluated analytically but it would affect all derived parameters especially the column-length distribution functions The logical relationship be- tween values of domain sizes (see Table 3) for dif- ferent degrees of broadening indicates that possible systematic errors can not be large
Equation (41) allows computation of volume- weighted and surface-weighted average domain sizes if respective column-length distribution func- tions can be obtained Figure 14 gives surface- weighted and volume-weighted average column- length distribution functions following Eqs (39) and (38) Width of the distribution function deter- mines the relative difference between (D) and (pound))v The broader the distribution the larger the differences because small crystallites contribute more to the surface-weighted average That is much more evident comparing the surface- weighted column-length distribution with the vol- ume-weighted If they have similar shape and maximum position as in Fig 15 differences are small Conversely if the surface-weighted distribu- tion function has a sharp maximum toward smaller sizes differences are larger (see Fig 14) The dif- ference between (poundgt)s and (D)v and the actual mean dimension of the crystallites in a particular direction also depends strongly on the average shape of the crystallites [52 131 132]
If experimental profiles are deconvoluted by the Stokes method even for considerable specimen broadening size coefficients A ^ usually oscillate at larger L values [59 106] preventing computation of the column-length distribution function Few techniques were used to deal with this problem successive convolution unfolding method [32 133] smoothing and iterative methods [134 135 136 137] Figures 14 and 15 show very smooth column- length distribution functions However they follow from size coefficients ^4^ that depend on the accu- racy of the approximation for the distortion coeffi- cient given by Eq (47) Equation (47) is exact if the strain distribution is Gaussian but in general holds only for small harmonic numbers n if strain broadening is not negligible
339
Volume 98 Number 3 May-June 1993
Journal of Research of the National Institute of Standards and Technology
500 1000 L(A)
Fig 14 Surface-weighted and volume-weighted column-length distribution functions normalized on unit area [111] Ag un- treated (upper) [100] Ag ground (lower)
Fig 15 Surface-weighted and volume-weighted column-length distribution functions for [010] La2Cu04 normalized on unit area
522 La2-xSrtCu04 Powders To test the applicability of the discussed method to more com- plicated patterns two compounds with lower crystallographic symmetry were studied Lai85Sroi5Cii04 has a tetragonal K2NiF4-type struc- ture space group lAlmmm La2Cu04 is orthorhom-
bic at room temperature Both compounds show slight line broadening and relatively highly overlap- ping peaks (see Fig 16) which makes it very diffi- cult if not impossible to perform a Stokes analysis
25
-25
26 (deg)
yNraquo-
Fig 16 Observed points (pluses) refined pattern (full line) convoluted profiles (dashed line) and difference plot (below) for part of La2Cu04 pattern
Tables 4 and 5 list results from the fitting proce- dure and the analysis of specimen-broadened inte- gral breadths There are no qualitative differences in results for tungsten and silver powders How- ever average errors are higher as expected be- cause of overlapping peaks while weighted errors wp are surprisingly smaller This fact illustrates the unreliability of iwp when only a segment of the pat- tern is being refined because it depends on the number of counts accumulated in points as well as on the 28 range of the refinement
Figures 17 and 18 represent Fourier coefficients of Lai85Sroi5Cu04 [110] and La2Cu04 [010] direc- tions In the second plot the A (L )-versus-L plot shows a concave-downward part near L =0 the so- called hook effect It was shown in Sec 42 that the hook effect originates because of underesti- mation of background connected with the trunca- tion of profiles In the profile refinement all peaks separated less than 4deg 20 have been included in the refinement region to avoid possible overlapping of peak tails and specimen profiles have been trun- cated below 01 of the maximum intensity How- ever because the polynomial background was determined prior to profile refinement it may be overestimated for complicated patterns containing many overlapping peaks If background is refined with other profile parameters undesirable correla- tion with integral breadths occurs
340
Volume 98 Number 3 May-June 1993
Journal of Research of the National Institute of Standards and Technology
Table 4 Parameters of the pure-specimen Voigt function as obtained from profile-fitting procedure for La2-^SrCu04 powders
Specimen hid 2Hdeg) Pen PcO FWHM(deg) Rp()
Lai85Sroi5Cu04 004 2695 0046(4) 0024(8) 0042 34 006 4092 0083(5) ltio-= 0053 62 110 3352 0110(5) ltio- 0070 125 220 7046 0171(9) ltio- 0109 43
La2Cu04 004 2713 0061(8) 0045(9) 0067 39 006 4119 0124(7) ltio-^ 0079 77 020 3316 0074(10) 0078(10) 0102 29 040 6957 0210(30) 0026(81) 0135 29 200 3345 0074(8) 0061(10) 0087 69 400 7028 0130(10) 0023(95) 0089 29
Table 5 Microstructural parameters for Laij(5Srai3Cu04 and La2Cu04 powders
Specimen Direction (DUA) Pgt(A) lte^(fl3))laquo lte2((Z)gt2))laquo
Lai83Sro5Cu04
La2Cu04
[001] [110]
[001] [010] [100]
1700(300) 470(20)
1100(100) 680(50) 680(50)
2000(200) 940(20)
1200(100) 760(50) 810(50)
00024 00017
00038 00033 00016
000049(9) 000044(6)
00008(1) 00007(2) 00003(3)
c i ^- raquo sect 08 bulli - U
^0
ti- bull ll bull bullbullo
ffl M P bull- u ^ Di 04 Si - M bulldiamsbullbull a bull-v 3 o ^^=s^
u ^N^Sraquoraquo^
0 ^^^aaaa 1000
L(A) 2000
OQ bullbulldego UM o z a 08
o o bull bull bull
- u u bull raquo UU bull
a diams o bull o u ft 04 bull deg raquo deg - U bull bull deg Oi bullbullgt =3 bull- l o k u
0 bullbullbullraquo aaaMMi
500 1000
L(A)
Fig 17 Fourier coefficients for the first- (pluses) and second- order (crosses) reflection and size coefficients (circles) for [110] Lai^Sroi5Cu04
Fig 18 Fourier coefficients for first- (pluses) and second- order (crosses) reflection and size coefficients (circles) for [010] La2Cu04
341
Volume 98 Number 3 May-June 1993
Journal of Research of the National Institute of Standards and Technology
S3 Comparison with the Integral-Breadth Methods
Knowing the specimen integral breadths simpli- fied methods can be applied In Sec 212 we re- viewed multiple-line and single-line integral- breadth methods We shall compare the simplified multiple-line methods [Eqs (23) (24) and (30)] and the single-line method [76] [Eqs (29) and (30)] with results obtained for silver tungsten and La2-xSrxCu04 powders (Tables 3 and 5) We did not compare with the multiple-line Voigt-function method [26] because it was shown in Sec 44 that it is incompatible with the Warren-Averbach analy- sis In Table 6 integral breadth Pi was computed according to Eq (11) This value was compared with )8A integral breadth computed from Fourier coefficients [58]
i8A=- laquo3 2^(L)
(74)
Results obtained by the Warren-Averbach analysis are significantly smaller for both size and strain Integral-breadth methods give the upper limit for strain so comparison is limited Considering the approximation e = 125e^(L))^ [138] with L=(D)v2 or L=(D)s2 strains resemble more closely than crystallite sizes It must be noted how- ever that this approximation makes sense only in the case of pure-Gauss strain broadening Benedetti et al [106] reported excellent agreement for both size and strain using Warren-Averbach and Cauchy-Gauss [Eq (24)] methods Results from Table 6 on the contrary indicate that the Gauss-Gauss approximation gives values closest to the Warren-Averbach method for crystallite sizes whereas the Cauchy-Gauss and especially the Cauchy-Cauchy approximation tend to give too large values For strain the trend is opposite The Cauchy-Cauchy approximation resembles most
Table 6 Comparison of results obtained with the integral-breadth methods Cauchy-Cauchy (C-C) Cauchy-Gauss (C-G) Gauss- Gauss (G-G) and single-line (S-L) analysis
Specimen hkl PiXKP PAXKP ltigt)v (Z)gt(A) (e^((DV2)gt2 eXlO^ (A-) (A-0 (A) C-C C-G G-G S-L xlO^ C-C C-G G-G S-L
W untreated 110 220
0259 0247
0259 0247
3500 3700 3810 3810 14500 4040
008 -001 -003 -005 024 0
W ground 110 220
125 204
125 205
1030 2240 1450 1220 940 550
054 090 093 105 045 032
Ag untreated 111 2
0600 0901
0600 0900
2000 3340 2390 2190 1670 1110
024 035 039 095 0 0
200 124 124 1030 2270 1470 1230 810 047 082 085 095 0 400 204 204 490 0
Ag ground 111 222
198 352
200 352
650 2080 1240 910 530 280
095 179 182 197 048 0
200 403 406 350 9380 4780 1320 260 180 405 405 408 082 400 803 803 120 0
Lai85Sroi3Cu04 004 006
0657 0881
0650 0880
2000 5230 3290 2660 1970 1140
049 076 078 088 044 0
110 119 119 940 1240 1000 970 840 044 052 064 080 0 220 158 158 630 0
La2Cu4 004 006
0988 132
0998 131
1200 2980 1940 1630 1490 760
08 107 112 127 081 0-
020 143 142 760 1200 910 860 1240 07 079 090 110 114 040 198 200 510 016 200 126 124 810 810 810 810 1250 03 002 011 015 089 400 1S 126 830 014
Not possible to evaluate because of too small Gauss integral breadth
342
Volume 98 Number 3 May-June 1993
Journal of Research of the National Institute of Standards and Technology
closely a Warren-Averbach method These results concur with the Klug and Alexander [24] compari- son of the published size and strain values obtained by Warren-Averbach (Stokes) and integral-breadth methods However for x-ray diffraction the Cauchy-Gauss assumption for the size-strain broadening is theoretically and experimentally more favored thpoundm the other two models The fact that the Gauss-Gauss method for crystallite size and the Cauchy-Cauchy method for strain give more realistic results may mean that the presump- tion that size and strain broadening are exclusively of one type is an oversimplification
The single-line method seems much less reliable If Gaussian breadth is very small no information about strain is obtained Moreover second-order reflections give much lower values of both size and strain than do basic reflections However if multi- ple reflections are not available the single-line method can give satisfactory estimations
54 Reliability of Profile Fitting
The profile fitting of a cluster of even severely overlapping peaks can be accomplished with a low error and excellent fit of total intensity But how reliable is information obtained about separate peaks in the cluster In the fitting procedure it is possible to put constraints on the particular profile parameter to limit intensity position and width of the peak If anisotropic broadening or different phases are present constraints may not be realistic Morever acceptable results can be obtained even using a different number of profiles in refinement [4] Hence the first condition for the successful ap- plication of this method is knowledge of actual phases present in the sample and their crystalline structures
In this regard two powders were measured or- thorhombic Lai94Sroo6Cu04 has a slightly distorted K2NiF4-type structure (space group Bmab a =53510(2) A b =53692 A(2) c = 131931(7) A) and tetragonal Lai76Sro24Cu04 (space group I4mmm a =37711(3) A c = 132580(8) A) Data were collected for each specimen separately and for a specimen obtained by mixing the same pow- ders Because diffracted intensity of each phase was lower for the mixture counting time was pro- portionally increased to obtain roughly the same counting statistics Figure 19 shows two partially separated orthorhombic (020) (200) and (040) (400) peaks overlapped with tetragonal (110) and (220) reflections During the profile fitting of the mixed powders (200) orthorhombic peak tended to disappear on account of neighboring (020) and
(110) reflections Its intensity was constrained to vary in range plusmn 30 of (020) peak intensity which can be justified if the crystallographic structure is known
60
-60
345
345
335 29 (deg)
345
Fig 19 (upper) Lai76Sro24Cu04 (110) peak (middle) Lai94Sroo6Cu04 (020) and (200) peaks (lower) (110) (020) and (200) peaks
Table 7 contains results of fitted specimen-Voigt functions as well as size and strain values obtained by the analysis of broadening Comparing integral breadths of the starting and mixed powders some profiles change from more Cauchy-like to Gauss- like and vice versa This is especially evident for the (400) reflection meaning that accurate deter- mination of the profile tails is indeed affected in the cluster of overlapping peaks However integral breadth does not change significantly so results of
343
Volume 98 Number 3 May-June 1993
Journal of Research of the National Institute of Standards and Technology
Table 7 Comparison between two specimens run separately and mixed togetlier
Specimen hkl 2Hdeg) )3cO PoO DUA) (D)v(A) (e2laquoD)v2))laquoxlO
Lai76Sroj4CuOr 110 3369 0058(6) 0094(7) 780(60) 850(60) 10(1) 220 7073 022(2) 013(2)
LaiMSro(KiCu04 020 3342 0084(9) 055(14) 500(90) 1000(200) 07(1) 040 7012 010(2) 014(1) 200 3353 00216(85) 0061(8) 1100(100) 1200(100) 03(1) 400 7040 0026(11) 0088(8)
Mix 110 3367 0083(21) 0064(14) 800(300) 1200(300) 08(3) Lai76Sro24Cu04 220 7072 019(7) 013(4)
+ 020 3343 0066(35) 0070(23) 800(300) 1000(300) 07(4) Lai94Sroo6Cu04 040 7012 0116(93) 013(5)
200 3354 0024(156) 0071(61) 900(700) 1000(600) 04(12) 400 7041 011(2) 0003(320)
the multiple-line methods are not much influenced On the contrary the single-line method gives quite different results This may support the conclusion of Suortti Ahtee and Unonius [43] that the Voigt function fails to account properly for size and strain broadening simultaneously if only Cauchy integral breadth determines crystallite size
Table 7 shows that the results of Warren- Averbach analysis of starting and mixed powders agree in the range of standard deviations How- ever errors are much larger especially for the hid- den (200)-(400) reflections From Eq (62) it follows that more counts (longer counting times) and more observables (smaller step-size) would lower standard deviations Therefore in the case of highly overlapping patterns to obtain desirable ac- curacy much longer measurements are needed al- though that will not change the fact that higher overlapping implies intrinsically higher errors of all refinable parameters To further minimize possible artifacts of the fitting procedure it is desirable to include in the analysis as many reflections in the same ciystallographic direction as possible
55 Remarks
By modeling the specimen size and strain broad- ening with the simple Voigt function it is possible to obtain domain sizes and strains that agree with experiment and show a logical interrelationship Furthermore the Voigt function shows the correct 1A(26y asymptotic behavior of peak tails as ex- pected from kinematical theory [139] However if the specimen profile is significantly asymmetric (because of twins and extrinsic stacking faults [140 59]) or the ratio FWHM^ is not intermediate to the Cauchy (2Tr) and Gauss (2(ln27r)^) functions then the Voigt function can not be applied [25]
Suortti Ahtee and Unonius [43] found good over- all agreement by fitting the Voigt function to the pure-specimen profiles of a Ni powder deconvo- luted by the instrumental function However more accurate comparison is limited because of unavoid- able deconvolution ripples of specimen profiles Furthermore the Voigt function might not be flex- ible enough to model a wide range of specimen broadening as well as the different causes of broadening Therefore the question whether the Voigt function can satisfactorily describe complex specimen broadening over the whole 20 range in a general case needs further evaluation
This method of Fourier analysis with the as- sumed profile-shape function is most useful in cases when the classical Stokes analysis fails there- fore when peak overlapping occurs and specimen broadening is comparable to instrumental broaden- ing It was shown that for a high degree of peak overlapping the fitting procedure can give unreli- able results of Gauss and Cauchy integral breadths that is the peak can change easily from predomi- nantly Cauchy-like to Gauss-like and contrary This can lead to illogical values of size-integral and strain-integral breadths according to Eqs (52) (53) (54) and (55) and to irregularities in the be- havior of Fourier coefficients for large L Simulta- neously if the size-broadened profile has a large Gauss-function contribution the hook effect will occur However volume-weighted domain sizes D)y and MSS eL)) for small L are much less affected because they rely on both Cauchy and Gauss parts of the broadened profile Any integral- breadth method that attempts to describe the size and strain broadening exclusively by a Cauchy or Gauss function in this case fails completely For specimens with lower crystallographic symmetry
344
Volume 98 Number 3 May-June 1993
Journal of Research of the National Institute of Standards and Technology
when many multiple-order reflections are avail- able but the peaks are overlapped it is therefore desirable to include in the analysis as many reflec- tions as possible to minimize the potential artifacts of the fltting process
6 Analysis of Superconductors 61 (La-M)2Cu04 Superconductors
Bednorz and Miiller [16] found the first high- temperature oxide superconductor in the La-Ba- Cu-O system Soon after substituting Ba with Sr and Ca Kishio et al [17] found superconductivity in two similar compounds Later many compounds with much higher transition temperatures (Tc) were found The (La-M)2Cu04 system remains favorable for study because the cation content responsible for the superconductivity is easier to control and measure than the oxygen stoichiometry Also this system provides a wide range of substitutional cation solubility in which the tetragonal K2NiF4- type structure is maintained Compared with much- studied Y-Ba-Cu-O this structure is simpler because it contains only one copper-ion site and two oxygen-ion sites
The undoped compound La2Cu04 is orthorhom- bic at room temperature It becomes superconduct- ing either with cation substitution on La sites or increased oxygen content to more than four atoms per formula unit Doping with divalent cations in- creases the itinerant hole carriers in the oxygen- derived electron band [141] which probably causes the superconductivity However different dopants influence the transition temperature Tc Although the unit-cell c-parameter simply reflects ionic dopant size [142] the in-plane unit-cell parameter (and accordingly the Cu-0 bond length) correlates with Tc for different dopants and for different dop- ing amounts [142 143]
LaiB5MouCu04 (M = Ba Ca Sr) have a tetrago- nal K2NiF4-type structure space group lAlmmm with four atoms in the asymmetric unit [117] One site is occupied with La partially substituted with dopant ions (Fig 20) La2Cu04 is orthorhombic at room temperature The best way to correlate these two structures is to describe La2Cu04 in space group Bmab the c axis remains the same tetrago- nal [110] and [110] directions become [010] and [100] orthorhombic axes and size of the unit cell is doubled [144]
Figure 21 shows parts of the x-ray diffraction patterns observed and refined of Lai85Moi5Cu04 (M = Sr Ba Ca) and La2Cu04 Refined lattice
parameters are given in Table 8 Table 9 shows resuhs of the line-broadening analysis Relatively
La(BaCaSr)
0(2)
0(1)
Fig 20 Ciystal structure of (La-M)2Cu04 showing one unit cell
300 JUU
(b)
200
100
U 0 M J Js-r-^
30
-30
300
40 41 42 43 44 45 40 41 42 43 44 45 29 (deg) 29 (deg)
mdashA-
gt t 200
Z
F-
- 100
(c)
f V kgt ii I 40 41 42 43 44 45 40 41 42 43 44 45
e (deg) ^^ 26 (deg)
-30 wwX mdash Wlaquo-
Fig 21 Diffraction patterns of LaiH5Moi5Cu04 specimens (a) M=Sr (b) M = Ba (c)M = Ca (d) M = U
345
Volume 98 Number 3 May-June 1993
Journal of Research of the National Institute of Standards and Technology
Table 8 Lattice parameters and T^ at zero resistivity (Ac method at 10 Ma current)
Specimen a (A) bk) c(A) rc(K)
Lairaquo5Sroi5Cu04 377814(7)
Lairaquo3Baoi3Cu04 37846(2)
LaiiijCaoi5Cu04 37863(7)
La2Cu04 53558(2) 54053(2)
231(2) 36
288(4) 28
17(2) 19
1451(8)
Table 9 Results of line-broadening analysis for (La-M)2Cu4 specimens
Specimen hkl PcO PoO (DUk) (Iraquo)(A) lte^((D)2))
Lai(laquoSroj5Cu04 004 006
0046(4) 0083(5)
0024(8) ltio-
1700(300) 2000(200) 000049(9)
110 0110(5) ltio- 470(20) 940(20) 000044(6) 220 0171(9) ltio-
Lai85Baoi3Cu04 004 006
0049(6) 0110(7)
0076(6) 0089(9)
1100(200) 1100(100) 00011(2)
110 0087(4) 000042(6) 560(20) 1110(20) 000024(5) 220 0116(3) ltio-5
Laiji5Caoi5Cu04 004 006
0120(13) 0146(12)
0032(22) 0033(27)
440(70) 780(90) 00007(4)
110 0045(25) 0200(19) 340(30) 360(20) 00013(2) 220 0343(22) ltio-
La2Cu04 004 006
0061(8) 0124(7)
0045(9) ltio-
1100(100) 1200(100) 00008(1)
020 0074(10) 0078(10) 680(50) 760(50) 00007(2) 040 0210(30) 0026(81) 200 0074(8) 0061(10) 680(50) 810(50) 00003(3) 400 0130(10) 0023(95)
weak peak broadening was observed which can not be attributed to the proximity of the phase trans- formation Lai85SroisCu04 is tetragonal down to = 170 K [145] Lai85Baoi5Cu04 to 140 K [146147] and Lai85Caoi5Cu04 to 130 K [148] Another possi- ble reason for peak broadening might be continu- ous compositional variations in dopant content The scanning Auger microprobe analysis of La2-SrtCu04 compounds [149] showed that grain- boundary segregation of Sr is weak and limited to a narrow region near the grain surface In the case of the separation of two phases with different Sr con- tent and similar lattice parameters asymmetry of some reflections would be observed [150] More- over in the case of compositional inhomogeneity microstrains eL)) would be roughly independent of the averaging distance L in the grains [151] therefore distribution of strains would be Gaus- sian For all specimens microstrain behavior is identical it decreases linearly with distance L
Rothman and Cohen [115] showed that such be- havior of microstrains is caused by dislocations that might arise during grinding Assuming the same applied stress microstrain would be approximately inversely proportional to the elastic moduli of these materials If mean microstrain is defined as the arithmetic average of strains for the [001] and [110] directions results agree with values of the Youngs moduli for polycrystalline La2Cu04 Lai85Moi5Cu04 (M = Sr Ba Ca) [152] However other factors may contribute to the microstrain Coordination-6 ionic radii of La^+ Sr Ba^+ Ca^+ are 106 116 136 100 A respectively [153] Substitution of La with ions of different sizes affects the lattice parameter [142] and may cause much larger strains in the [001] direction when some of the ions are replaced with Ba^ than with Sr^ in accord with results in Table 9 Substitution of Ca^^ ions produces an entirely different effect microstrains in the [110] direction are larger This may be explained by
346
Volume 98 Number 3 May-June 1993
Journal of Research of the National Institute of Standards and Technology
comparing effects of substitutional ions on the unit-cell a -parameter The Ba-doped specimen has a larger a-parameter than the Sr-doped but the Ca-doped a-parameter is largest although Ca^^ has the smallest ionic size This should increase the cell distortion in the a-b plane
Table 9 reveals high anisotropy in these materi- als consistent with other physical properties such as thermal expansion [154] and upper critical mag- netic field [155] Differences of domain sizes might arise from a layered structure in the [001] direction and consequently easy incorporation of stacking faults between regularly stacked layers The stack- ing-fault and twin-fault probabilities can be esti- mated from the average surface-weighted domain sizes [59]
^ = TAN + cf1fun(aa) (75) m im - (D)
Here c is a constant for the particular [hkl] direction and fun(a a) a linear combination of stacking-fault probability and twin-fault probability a The exact form of Eq (75) was derived only for the cubic and hexagonal crystal structures On con- dition that the true domain dimension D is isotropic or so large that the second term of Eq (75) dominates a linear function of stacking-fault and twin-fault probability is
fun(aa) = c( 1
) (76) Zgt)J (Dgttrade
Here c denotes a constant that depends only on geometrical factors and is the same for all three doped compounds
Figure 22 shows a possible correlation between Tc and fault-defect probabilities computed from TEM observations of La2-jcSrCu04 revealed that stacking-fault density increased with Sr content up to jc = 015 [156] That study suggests that a shear mechanism forming the fault-boundary dislocations implies oxygen vacancies andor cation deficiency We did not measure oxygen content but neutron- diffraction studies showed that oxygen deficiency starts to appear at much higher Sr content [157] However the increase of fault probability with the simultaneous decrease of microstrain in Fig 22 supports the assumption that defects are intro- duced to accommodate lattice strains [156] A simi- lar increase in Te was found in Y2Ba4Cu802o-laquo thin films [158] Compounds with asymmetric broad- ened and shifted peaks showed higher Tc which
was attributed to stacking faults Although extrinsic stacking faults may cause asymmetric peak broad- ening [140] it is probably caused by twinning Twinning in La-M-Cu-0 materials is less abundant than in Y-Ba-Cu-O compounds but it was ob- served in (La-Sr)2Cu04 monocrystals on (110) planes [159] In the profile-fitting procedure peak asymmetry is incorporated only in the instrumental function therefore we could not model asymmetric peak broadening However any significant asym- metry of the specimen profile would cause an un- even fit of low-angle and high-angle sides of peaks which was not observed This gives much more im- portance to stacking faults in Eq (76)
Fig 22 Arithmetic average of [110] and [001] root-mean- square strains and linear function of stacking-fault and twin- fault probabilities as a function of Tc
In Fig 22 average microstrains defined as the arithmetic average of [001] and [110] directions correlate inversely with Tc However we did not find a correlation of Tc and microstrains in a partic- ular direction [001] microstrains simply reflect dif- ference in size of dopant and host La^ ions (see Table 9)
In La2Cu04 (OkO) reflections are significantly broader than (hOO) This has also been observed in low-temperature orthorhombic Lai85Sroi5Cu04 and Lai85Baoi5Cu04 [160] and explained by either stacking faults or possible lower symmetry Our results reveal that domain sizes (D) have identical values for [010] and [100] directions (Table 9) From Eq (76) it follows that stacking-fault proba- bilities in these directions have the same values However microstrains in the [010] direction are roughly twice as large as in the [100] direction which is responsible for the different broadening In the case of doped La2Cu04 compounds different microstrains might be caused by oxygen
347
Volume 98 Number 3 May-June 1993
Journal of Research of the National Institute of Standards and Technology
vacancies ordered along one direction in the a-b plane similar to effects found in YBa2Cu307-laquo However undoped La2Cu04 is not expected to have significant o^Qgen deficiency Other possibili- ties are lower ciystallographic symmetry andor La vacancies although they were not reported for this system but La deficiency was found in an La2Co04 compound [161]
We can conclude that lattice strains and incoher- ently diffracting domain sizes confirm high an- isotropy in these materials This simple approach however does not allow unambiguous identifica- tion of the strains origin Probably the strains originate from dislocations and from different sizes of host and dopant ions Domain sizes of all com- pounds are larger in the c-direction than in the a-6 plane This indicates existence of stacking faults and twins However because estimated errors are relatively large and only three materials were stud- ied the possible connection between stacking faults and 7c needs further study
62 Bi-Cu-O Superconductors
Among the high-Tc superconductors the Bi- Cu-O compounds appear intriguing especially because their incommensurate structure modula- tion remains incompletely understood [162 163] The crystal structure consists of perovskite-like SrO-(Cu02Ca)mi-Cu02-SrO layers separated by NaCl-like BiO double layers (see Fig 23 [164]) The number m of Cu02 layers alters the supercon- ducting transition temperature Tc (for m = 12 and 3 rclaquo10 90 and 110 K respectively) This two- dimensional layered structure makes these materi- als highly anisotropic and favours the creation of defects
Bulk sintered specimens showed relatively weak peak broadening Moreover the diffraction pat- terns contained many overlapping peaks because the compound crystallizes in an orthorhombic low- symmetry space group A2aa [165] and incommen- surate modulation gives superlattice reflections All patterns revealed a strong [001] texture (Fig 24) making reflections other than (001) difficult to ana- lyze The lattice parameters vary depending on the exact compound stoichiometry and processing his- tory but characteristically they have almost identi- cal a and b parameters and large c parameter fl =54095 A 6=54202 A c =309297 A for Bi2Sr2CaCu208 (Bi-2212 [166] and A =5392 A b =5395 A c =36985 A for (BiPb)2Sr2Ca2Cu30io (BiPb-2223) [165] Thus we treated (hOO) and (0^0) reflections as single peaks Table 10 gives the
results for three specimens Bi-2212 (BiPb)2 (SrMg)2(BaCa)2Cu30io (BiPbMgBa-2223) which were one-phase specimens and BiPb-2223 con- taining approximately equal amounts of 2212 and 2223 phases The in-plane lattice parameters of 2212 and 2223 phases differ little hence only the [00] directions of the mixed-phase specimen were evaluated
b^ (c)
Fig 23 Average crystal structure of Bi2Sr2Cam-iCum04+2m for (a) m = 1 (b) w =2 (c) m =3 [164]
35
-35
42 44 46 48 50 52 54 56 58 60 62 26 (deg)
^ ^^^MK^Aa^Ndllaquop
Fig 24 Part of BiPbMgBa-2223 refined pattern There are 48 fundamental reflections in this region
Interpretation of the results in the case of these complicated compounds must be considered care- fully Microstrains are probably caused by disloca- tion arrays However substitution of different-sized ions and vacancies would also contribute to the strains as would other kinds of disorder especially
348
Volume 98 Number 3 May-June 1993
Journal of Research of the National Institute of Standards and Technology
Table 10 Results of line-btoadening analysis for Bi-Cu-O supreconductors
Specimen Phase hkl (A)
eD)sa)y^
Bi-2212 2212 008 0012
0163(8) 022(3)
001(6) 005(6)
420(80) 00021(6)
020+200 0104(4) ltio-^ 580(30) 00007(1) 040+400 018(2) 00004(6300)
BiPbMgBa-2223 7773 0010 0020
0097(1) 021(2)
00002(1700) 0007(150)
770(60) 00012(1)
020 + 200 012(27) 013(10) 380(430) 00009(71) 040 + 400 015(95) 021(33)
BiPb-73 2212 008 0012
023(2) 025(5)
0002(350) 0001(1000)
220(30) 00013(26)
2223 0010 0020
022(8) 023(99)
0092(67) 018(47)
230(190) 00012(197)
Stacking faults and twins Table 10 shows larger strains in the [001] direction that in the basal plane This can be explained by stacking disorder along the c-axis which was frequently observed in electron-diffraction patterns as streaking [167 168] Easy incorporation of stacking faults is possi- ble because of the two-dimensional weak-bonded layers (BiO double layers are spaced about 3 A apart) The difference in microstrain between in- plane and the c-direction is much smaller for the BiPbMgBa-2223 phase probably because Pb low- ers the faulting by stabilizing the higher-Tc 2223 phase [167] For the BiPb-2223 specimen with two phases there are two possibilities Either the speci- men consists mainly of a mk of two kinds of one- phase grains or both phases occur within the same grains The second possibility was confirmed exper- imentally [169 170] and our results concur be- cause microstrain in the 2212 phase is much smaller than in the one-phase Bi-2212 specimen Processing conditions and cation content probably favour development of the macroscopic inter- growth of both phases within the grains that is microscopic defects grow to sufficiently large re- gions to give a diffraction pattern of another phase with the different number of Cu02 layers As a re- sult strain is relieved and both strains and domain sizes being quite different in one-phase specimens tend to equalize
For the Bi-Cu-O specimens the mean surface- weighted domain sizes are generally smaller than for (La-M)2Cu04 compounds Therefore the com- putation of the stacking- and twin-fault probabili- ties by using Eq (75) may be wrong It would be very instructive to compare the different broaden-
ing of satellite and fundamental reflections which indicates a more pronounced stacking disorder in the modulated structure [171]
In summary we found that for both Bi-2212 and BiPbMgBa-2223 superconductors the c-axis strain exceeds the in-plane strain The BiPb-2223 specimen containing both 2212 and 2223 phases within the single grains shows smaller incoherently diffracting domains and lower c-axis strain than the one-phase specimens This fact may direct us to- ward the mechanism of the second-phase forma- tion in these materials
63 Remarks
It was shown that this particular method of the line-broadening analysis can give information about the size of incoherently diffracting domains and lattice strains in (La-M)2Cu04 and Bi-Clu-O superconductors Moreover results show high an- isotropy of both size and strain parameters as one may expect because of the layered structure of all superconducting cuprates Generally structural line broadening is not large that is a result of rela- tively large domain sizes (200-2000 A) and small strains (002-02) It is interesting to compare these values with the published results for YBa2Cu307-laquo (isotropic strains of 023 [77] and 005-03 [82]) Although the different materi- als were studied they seem too large especially be- cause they are the average of strains in different directions
The main drawback of the line-broadening the- ory is the uncertainty about the origins of the line broadening that is it is difficult to distinguish the main effects responsible for the broadening For
349
Volume 98 Number 3 May-June 1993
Journal of Research of the National Institute of Standards and Technology
the novel superconductors particularly the numer- ous defects (substitutions vacancies stacking faults dislocations and similar) can occur simulta- neously which makes it very difficult to determine their individual contributions Furthermore the crystal structures of most novel superconductors are relatively complicated The average structure has mostly a slightly distorted tetragonal symmetry very similar a and b lattice parameters and a large c parameter but c=36 for YBa2Cu307-laquo for in- stance This results in a large number of overlap- ping peaks and consequently in large errors of all results This showed especially in the case of Bi-Cu-O superconductors (see Table 10) Follow- ing the discussion of reliability of profile fitting in Sec 54 it would be desirable to include more than two reflections in the analysis of broadening but higher-order peaks are usually too weak and over- lapped One way to partially solve this problem would be a whole pattern fitting [172 173] and Rietveld structure refinement [23] in terms of size and strain parameters This requires an accurate preset function to model specimen broadening and precise definition of angular dependence of size and strain parameters The Rietveld programs that model the line broadening in terms of size and strain parameters are based either on the simpli- fied integral-breadth methods [78 95] or on the single-line method [174]
7 Conclusions
A method for analyzing the pure-specimen (structural) broadening of x-ray diffraction line profiles is proposed By modeling the specimen size and strain broadenings with the simple Voigt func- tion it is possible to obtain domain sizes and strains that agree with experiment and show a logi- cal interrelationship Furthermore some common consequences and problems in the Fourier-method analysis follow easily The specimen function is convoluted with the instrumental function to match the observed x-ray diffraction-line profile This avoids the Stokes deconvolution method thus al- lowing analysis of patterns with highly overlapping peaks and weak structural broadening Therefore the method was applied to some novel high-Tc superconductors We reached the following conclu- sions
(i) Surface-weighted domain size depends only on the Cauchy integral breadth of the size-broad- ened profile
(ii) The hook effect occurs when the Cauchy-content of the size-broadened profile is un-
derestimated that is for ^sc(n2)^3sG Usually this happens when the background is estimated too high so the long tails of the Cauchy function are prematurely cut off
(iii) It also follows from conclusion (ii) that the volume-weighted domain size can not be more than twice the surface-weighted domain size (limiting value D)v=2D)i is obtained for the pure-Cauchy size-broadened profile) Minimum value for D)J (D)j should not be less than -131
(iv) If the distortion coefficient is approxi- mated with a harmonic term this leads exactly to the Warren-Averbach method of separation of size and strain broadenings
(v) In that case mean-square strains decrease linearly with the distance L
(vi) It is possible to evaluate local strain ((e^(0))^) only in the case of pure-Gauss strain broadening Then root-mean-square strain is inde- pendent of the distance L and related to the upper limit of strain obtained from the integral breadth of the strain-broadened profile
(vii) If strain broadening is not described exclu- sively with the Gauss function the multiple-line Voigt integral breadth and Warren-Averbach analyses can not give the same results for volume- weighted domain size although D)v is defined identically in both approaches because the appar- ent strain -q = pdeg(29)cot9 is not angular- independent
(viii) Smooth size coefficients give column- length distribution functions without oscillations and make possible a computation of volume- weighted average domain sizes up to ~5000 A
(ix) Comparison with the simplified integral- breadth methods in most cases has shown not large but systematic discrepancy of results indicat- ing that size and strain broadening can not be accu- rately modeled by a single Cauchy or Gauss function Moreover the application of the single- line method is much less reliable and it should not be used where multiple reflections are available
(x) The knowledge of all phases present in the sample and their crystallographic structure is re- quired to successfully fit a cluster of overlapping peaks Although it is very difficult to accurately de- termine the Cauchy-Gauss ratio of an overlapped peak final results of domain size and strain are much less affected Therefore connecting the crys- tallite size exclusively with the Cauchy content and strain with the Gauss content of a specimen profile might be doubtful
(xi) Evaluated errors of domain sizes and strains increase substantially with the degree of
350
Volume 98 Number 3 May-June 1993
Journal of Research of the National Institute of Standards and Technology
peak overlapping Hence for complicated patterns very accurate measurements are necessary and one needs to analyze as many reflections in the same crystallographic direction as possible
(xii) Line-broadening analysis of (La-M)2Cu04 and Bi-Cu-O compounds confirms high anisotropy in these materials
(xiii) Strains in (La-M)2Cu04 probably origi- nate from dislocations and from different sizes of host and dopant ions
(xiv) Stacking-fault probability in (La-M)2Cu04 (M = Ba Ca Sr) increases with increasing Tc whereas the average strain decreases
(xv) In La2Cu04 different broadening of (lOO) and (OfcO) reflections is not caused by stacking faults
(xvi) All Bi-Cu-0 superconductors show larger strain in the c-direction than in the a-b plane which can be explained by stacking disorder along the [001] direction
(xvii) In the specimen with approximately equal amounts of Tl-2212 and TlPb-2223 phases it is likely that a secondary phase develops by the growth of the microscopic faulted regions of the primary phase
Acknowledgments
I am thankful to Dr Harry McHenry for his support and especially to Dr Hassel Ledbetter for his wise guidance and most useful help during my stay at NIST I am also indebted to my home insti- tution the Faculty of Metallurgy of the University of Zagreb for allowing me the leave of absence at NIST
8 References
[1] W Friedrich P Knipping and M v Laue Ann Physik 41 971 (1912)
[2] H M Rietveld Acta Cryst 22 151 (1967) [3] H M Rietveld J Appl Cryst 2 65 (1969) [4] S A Howard and K D Preston in Modern Powder Dif-
fraction Vol 20 The Mineralogical Society of America Washington DC (1989) p 217
[5] D Taupin J Appl Cryst 6 266 (1973) [6] T C Huang and W Parrish Appl Phys Lett 27 123
(1975) [7] M K Wu J R Ashburn C J Torng P H Hor R L
Meng L Gao Z J Hwang Y Q Wang and C W Chu Phys Rev Lett 58 908 (1987)
[8] D Shi MRS Bull 16 37 (1991) [9] D Larbalestier Phys Today 44 74 (1991)
[10] J C Phillips Phys Rev B 4512647 (1992) [11] B Raveau Phys Today 45 53 (1992) [12] A J Millis and K M Rabe Phys Rev B 38 8908 (1988)
[13] F Guinea Europhys Lett 7 549 (1988) [14] C P Dhard and P Singh in Proc Int Symp High-Temp
Supercond Jaipur India Oxford amp IBH Publishing New Delhi (1988) p 271
[15] J D Jorgensen Phys Today 44 34 (1991) [16] J G Bednorz and K A Muller Z Phys B 64 189
(1986) [17] K Kishio K Kitazawa S Kaube I Yasuda N Sugii H
Takagi S Uchida K Fueki and S Tanaka Chem Lett 429 (1987)
[18] J D Jorgensen B Dabrowski S Pei D G Hinks L Soderholm B Morosin J E Venturini and D S Ginley Phys Rev B 38 11337 (1988)
[19] J R Clem Phys Rev B 43 7837 (1991) [20] M Paranthaman M Foldejiki D Balzar H Ledbetter
A J Nelson and A M Hermann submitted to Phys Rev B
[21] A R Stokes Proc Phys Soc Lond 61 382 (1948) [22] B E Warren and B L Averbach J Appl Phys 23 497
(1952) [23] R Delhez Th H de Keijser and E J Mittemeijer in
Accuracy in Powder Diffraction S Block and C R Hub- bard eds Natl Bur Stand (US) Special Publication 567 (1980) p 213
[24] H P Klug and L E Alexander X-ray Diffraction Proce- dures 2nd Edition John Wiley New York (1974) p 661
[25] J I Langford J Appl Ciyst 11 10 (1978) [26] J I Langford in Accuracy in Powder Diffraction S
Block and C R Hubbard eds Natl Bur Stand (US) Special Pubication 567 (1950) p 255
[27] R Delhez Th H de Keijser and E J Mittemeijer Fre- senius Z Anal Chem 312 1 (1982)
[28] A J C Wilson Proc Phys Soc Lond 80 286 (1962) [29] A J C Wilson Proc Phys Soc Lond 81 41 (1963) [30] L P Smith Phys Rev 46 343 (1934) [31] H C Burger and P H van Cittert Z Phys 79 722
(1932) [32] S Ergun J Appl Ciyst 1 19 (1968) [33] R Croche and L Gatineau J Appl Ciyst 10479 (1977) [34] L H Schwarz and J B Cohen Diffraction from Materi-
als Academic Press New York (1977) p 391 [35] R Delhez Th H de Keijser E J Mittemeijer and J I
Langford J Appl Cryst 19 459 (1986) [36] R Delhez Th H de Keijser E J Mittemeijer and J I
Langford Aust J Phys 41 213 (1988) [37] R A Young and D B Wiles J Appl Cryst 15 430
(1982) [38] W Voigt Stizungsber K Bayer Akad Wiss 42 603
(1912) [39] E E Whiting J Quant Spectrosc Radiat Transfer 8
1379 (1968) [40] G K Wertheim M A Butler K W West and D N E
Buchanan Rev Sci Instrum 111369 (1974) [41] M M Hall Jr V G Veeraraghavan H Rubin and P G
Winchell J Appl Cryst 10 66 (1977) [42] A Brown and J W Edmonds Adv X-Ray Anal 23 361
(1980) [43] P Suortti M Ahtee L Unonius J Appl Cryst 12 365
(1979) [44] T Sundius J Raman Spectrosc 1 471 (1973) [45] B H Armstrong J Quant Spectrosc Radiat Transfer 7
61 (1967) [46] J F Kielkopf J Opt Soc Am 63 987 (1973) [47] B P Asthana and W Kiefer Appl Spectr 36 250
(1982)
351
Volume 98 Number 3 May-June 1993
Journal of Research of the National Institute of Standards and Technology
[48] J P M de Vreede S C Mehrotra A Tal and H A Dijkerraan Appl Spectr 36 227 (1982)
[49] F R L Schoening Ada Ciyst 18 975 (1965) [50] P Scherrer Gott Nachr 2 98 (1918) [51] A R Stokes and A J C Wilson Proc Cambridge
Philos Soc 38 313 (1942) [52] A J C Wilson X-Ray Optics 2nd edition Methuen
London (1962) [53] S Leie and T R Anantharaman Proc Indian Acad
Sci Sect A H 261 (1966) [54] D Louer D Weigel and J I Langford J Appl Ciyst
5 353 (1972) [55] A J C Wilson J Appl Ciyst 2 181 (1969) [56] J I Langford and A J C Wilson J Appl Ciyst 11102
(1978) [57] A R Stokes and A J C Wilson Proc Phys Soc Lond
56174 (1944) [58] B E Warren and B L Averbach J Appl Phys 21 595
(1950) [59] B E Warren X-Ray Diffraction Addison-Wesley
Reading Massachusetts (1969) p 264 [60] B E Warren in Progress in Metal Physics Vol 8 Perg-
amon Press London (1959) p 146 [61] F Bertaut C R Acad Sci Paris 228 187 (1949) [62] N C Haider and C N J Wagner Acta Cryst 20 312
(1966) [63] D Balzar and H Ledbetter in Proceedings of the Accu-
racy in Powder Diffraction II Natl Inst Stand Technol (1992) p 37
[64] D Balzar and H Ledbeter J Appl Cryst 26 (1993) in press
[65] J N Eastabrook and A J C Wilson Proc Phys Soc Lond B 65 67 (1952)
[66] R S Smith IBM J Res Develop 4 205 (1960) [67] B Y Pines and A F Sirenko Soviet Physics Ciyst 715
(1962) [68] G B Mitra and N K Misra Acta Ciyst 22 454 (1967) [69] A Gangulee J Appl Ciyst 7 434 (1974) [70] J Mignot D Rondot Acta Met 231321 (1975) [71] J Mignot and D Rondot Acta Ciyst A 33 327 (1977) [72] R K Nandi H K Kuo W Schlosberg G Wissler J B
Cohen and B Crist Jr J Appl Ciyst 17 22 (1984) [73] M Zocchi Acta Ciyst A 36164 (1980) [74] P Ramarao and T R Anantharaman Trans Ind Ins
Metals 18 181 (1965) [75] R K Nandi and S P Sen Gupta J App Cryst 11 6
(1978) [76] Th H de Keijser J I Langford E J Mittemeijer and
B P Vogels J Appl Ciyst IS 308 (1982) [77] A Williams G H Kwei R B Von Dreele A C Lar-
son L D Raistrick and D L Bish Phys Rev B 37 7960 (1988)
[78] A C Larson and R B Von Dreele Los Alamos Na- tional Laboratory Report No LA-UR-86-748 (1988)
[79] J D Jorgensen D H Johnson M H Mueller J G Worlton and R B Von Dreele in Proceedings of the Conference on Diffraction Profile Analysis Cracow Poland (1978) p 20
[80] R B Von Dreele J D Jorgensen and C G Windsor J Appl Ciyst 15 581 (1982)
[81] P Thompson D E Cox and J B Hastings J Appl Ciyst 20 79 (1987)
[82] J P Singh R A Guttschow D S Kupperman J T Dusek and R B Poeppel in High Temperature Super-
conducting Compounds III S Whang A Gupta and E Ceilings eds TMS AIME Warrendale (1991) p 281
[83] M O Eatough D S Glnley and B Morosin Adv X- Ray Anal 33 145 (1990)
[84] E J Peterson P J Kung R E Muenchausen and D M Smith in Proceedings of the 41st Annual Denver Conference on Applications of X-Ray Analysis Colo- rado Springs Colorado (1992) p 74
[85] M Rand J I Langford and J S Abell submitted to J Cryogenics (1992)
[86] D Balzar J Appl Ciyst 25 559 (1992) [87] D Balzar H Ledbetter and A Roshko Physica C 185-
189 871 (1991) [88] D Balzar and H Ledbetter J Mater Sci Lett 111419
(1992) [89] D Balzar H Ledbetter and A Roshko Pow Diffr 8
(1993) in press [90] S Johnson M Gusraan D Rowcliffe T Geballe and J
Sun Adv Ceram Mater 2 337 (1987) [91] H Ledbetter S A Kim R B Goldfarb and K Togano
Phys Rev B 39 9689 (1989) [92] H Friedman Electronics 132 (1945) [93] W Parrish (ed) in Advances in X-Ray Diffractometry
and X-Ray Spectrography Centrex Publishing Company Eindhoven The Netheriands (1962)
[94] W Soller Phys Rev 24158 (1924) [95] S A Howard R L Snyder J Appl Ciyst 22 238
(1989) [96] G H Stout and L H Jensen X-Ray Structure Determi-
nation 2nd edition Wiley New York (1989) p 373 [97] D E Appleman and T Evans Jr Final Report 92-14
US Geological Survey Washington DC (1973) Avail- able as NTIS Document No PB-216188
[98] M U Cohen Rev Sci Instrum 6 68 (1935) [99] M U Cohen Rev Sci Instrum 7 155 (1936) [100] M H Mueller L Heaton and K T Miller Acta Ciyst
13 828 (1960) [101] R A Young P E Mackie and R B Von Dreele J
Appl Ciyst 10 262 (1977) [102] D B Wiles and R A Young J Appl Cryst 14 149
(1981) [103] J K Yau and S A Howard J Appl Ciyst 22 244
(1989) [104] S A Howard J K Yau and H U Anderson J Appl
Phys 65 1492 (1989) [105] S Enzo G Fagherazzi A Benedetti and S Poilizzi J
Appl Ciyst 21 536 (1988) [106] A Benedetti G Fagherazzi S Enzo and M
Battagliarin J Appl Cryst 21 543 (1988) [107] Th H de Keijser E J Mittemeijer and H C F Rozen-
daal J Appl Ciyst 16 309 (1983) [108] Y Zhang J M Stewart C R Hubbard and B Mo-
rosin Adv X-Ray Anal 33 373 (1990) [109] Y Wang S Lee and Y Ue J Appl Ciyst IS 35
(1982) [110] V N Selivanov and E F Smislov Zavod Lab 57 28
(1991) [Ill] A Guinier X-Ray Diffraction W H Freeman San
Francisco (1963) p 139 [112] M Wilkens J Appl Cryst 12119 (1979) [113] D Du and Y Wang Pow Diffr 2180 (1987) [114] A P Prudnikov Yu A Brychkov and O L Marichev
Integrals and Series Vol 1 Gordon and Breach Am- sterdam The Netheriands (1986) p 344
352
Volume 98 Number 3 May-June 1993
Journal of Research of the National Institute of Standards and Technology
[115] R L Rothman and J B Cohen J Appl Phys 42 971 (1971)
[116] T Adier and C R Houska J Appl Phys 50 3282 (1979)
[117] C R Houska and T M Smith J Appl Phys 52 748 (1981)
[118] S Rao and C R Houska Acta Ciyst A 4214 (1986) [119] J I Langford R Delhez Th H de Keijser and E J
Mittemeijer Ausi J Phys 41173 (1988) [120] J I Langfoid J Appl Cryst IS 315 (1982) [121] M J Turunen Th H de Keijser R Delhez and N M
van der Pers J Appl Ciyst 16176 (1983) [122] A J C Wilson Acta Ciyst 23 888 (1967) [123] A J C Wilson Acta Ciyst A 24 478 (1968) [124] A J C Wilson Acta Ciyst A 25 584 (1969) [125] G Gagliotti A Paoletti and F P Ricci Nucl Instrum
3 223 (1958) [126] J I Langford R J Cernik and D Louer J Appl
Ciyst 24 913 (1991) [127] J I Langford in Accuracy in Powder Diffraction II
preprint [128] A J C Wilson Mathematical Theory of X-Ray Powder
Diffractometiy Centrex Eindhoven The Netherlands (1963)
[129] J L Langford Prog Ciyst Growth and Charact 14185 (1987)
[130] T G Fawcett C E Crowder S J Brownell Y Zhang C R Hubbard W Schreiner G P Hamill T C Huang E Sabino J I Langford R Hamilton and D Louer Pow Diffr 3 209 (1988)
[131] W L Smith J Appl Ciyst 9187 (1976) [132] J L Langford and D Louer J Appl Ciyst 15 20
(1982) [133] Fl Popescu and L Benes Acta Ciyst A 33 323 (1977) [134] P PSuse^cu R MSnaila M Popescu and E Jijovici j
Appl Cryst 7 281 (1974) [135] P F Bley Y Calvayrac and M Fayard J Appl Ciyst
7 493 (1974) [136] B Moraweck Ph de Montgolfier and A J Renouprez
J Appl Ciyst 10191 (1977) [137] A Le Bail and D Louer J Appl Cryst 11 50 (1978) [138] D R Buchanan R L McCuUough and R L Miller
Acta Ciyst 20 922 (1966) [139] P Suortti and L D Jennings Acta Cryst A 33 1012
(1977) [140] J B Cohen and C N J Wagner J Appl Phys 33 2073
(1962) [141] A Bianconi J Budnick A M Flank A Fontaine P
Lagarde A Marcelli H Tolentino B Chamberland C Michel B Raveau and G Demazeau Phys Lett A127 285 (1988)
[142] K Fueki K Kitazawa K Kishio T Hasegawa S Uchida H Takagi and S Tanaka in Chemistiy of High- Temperature Superconductors D L Nelson M S Whittingham and T F George eds American Chemi- cal Society (1987) p 38
[143] T Fujita Y Aoki Y Maeno J Sakurai H Fukuba and H Fujii J Appl Phys 26 U68 (1987)
[144] R M Hazen in Physical Properties of High-rc Super- conductors Vol 2 D M Ginsberg ed World Scien- tific Singapore (1990) p 121
[145] J B Torrance A Bezinge A I Nazzal T C Huang S P Parkin D T Keane S J LaPlaca P M Horn and G A Held Phys Rev B 40 8872 (1989)
[146] J D Axe A H Moudden D Hohlwein D E Cox K
M Mohanty A R Moodenbaugh and Y Xu Phys Rev Lett 62 2751 (1989)
[147] T Suzuki and T Fujita Physica C 159 111 (1989) [148] T Fujita and Y Maeno in Superconducting Materials
JJAP Series 1 (1988) p 34 [149] A Roshko and Y-M Chiang J Appl Phys 66 3710
(1989) [150] D E Cox S C Moss R L Meng P H Hor and C W
Chu J Mater Res 31327 (1988) [151] B Crist and J B Cohen J Polym Sci 17 1001 (1979) [152] H Ledbetter S Kim and A Roshko Z Phys B 89275
(1992) [153] R D Shannon and C T Prewitt Acta Ciyst B 25 925
(1969) [154] M Lang H Spille F Steglich Y Hidaka T Murakami
and Y Endoh Physica C 162-1641037 (1989) [155] Y Hidaka and T Murakami Phase trans 15 241
(1989) [156] P L Gai and E M McCarron Science 247 553 (1990) [157] T Kamiyama I Izumi H Asano H Takagi S Uchida
Y Tokura E Takayama-Muromachi M Matsuda K Yamada Y Endoh and Y Hidaka Physica C 172 120 (1990)
[158] A Kapitulnik Physica C 153-155 520 (1988) [159] L A Muradyan V N Molchanov R A Tamazyan and
V I Simonov Physica C 162-164 536 (1989) [160] P Day M Rosseinsky K Prassides W I F David O
Moze and A Soper J Phys C 20 L429 (1987) [161] J T Lewandowski R A Beyerlein J M Longo and R
A McCauley J Amer Ceram Soc 69 699 (1986) [162] R Ramesh G van Tendeloo G Thomas S M Green
Y Mei C Jiang and H L Luo Appl Phys Lett 53 2220 (1988)
[163] J Schneck L Pierre J C Tolddano and C Daguet Phys Rev B 39 9624 (1989)
[164] O Eibl Physica C 168 215 (1990) [165] W Carrilo-Cabrera and W Gopel Physica C 161 373
(1989) [166] P Bordet J J Capponi C Chaillout J Chenavas A
W Hewat E A Hewat J L Hodeau M Marezio J L Tholence and D Tranqui Physica C 156189 (1988)
[167] R Ramesh K Remschnig J M Tarascon and S M Green J Mater Res 6 278 (1991)
[168] Z Hiroi Y Ikeda M Takano and Y Bando J Mater Res 6 435 (1991)
[169] Y Inoue M Hasegawa Y Shichi I Munakata M Ya- manaka S Hiyama and O Nittono J Mater Res 5 737 (1990)
[170] R Ramesh B G Bagley J M Tarascon S M Green M L Rudee and H L Luo J Appl Phys 67 379 (1990)
[171] X B Kan J Kulik P C Chow S C Moss Y F Yan J H Wang and Z X Zhao J Mater Res 5 731 (1990)
[172] G S Pawley J Appl Ciyst 13 630 (1980) [173] H Toraya J Appl Ciyst 19 440 (1986) [174] L Lutterotti and P Scardi J Appl Ciyst 23 246
(1990)
About the author Davor Balzar is with Faculty of Metallurgy of the University of Zagreb Sisak Croatia and was a Guest Researcher at fflST The National Institute of Standards and Technology is an agency of the Technology Administration US Department of Commerce
353
Volume 98 Number 3 May-June 1993
Journal of Research of the National Institute of Standards and Technology
4
5
6
7 8
211 Determination of the Pure Specimen-Broadened Profile 325
212 Separation of Size and Strain Broadening 326
22 Diffraction-Line-Broadening Analysis of Superconductors 328
Experiment 329 31 Materials 329
311 Preparation of Specimens for X-Ray Diffraction 329
32 Measurement 329 33 Data Analysis 329 Methodology 330 41 Separation of Size and Strain
Broadenings 330 42 Size Coefficient 331 43 Distortion Coefficient 333 44 Discussion 333 45 Random Errors of Derived
Parameters 335 Application 336 51 Correction for Instrumental
Broadening 337 52 Applicability of the Method 337
521 Silver and Tungsten Powders 337
522 La2-xSrxCu04 Powders 340 53 Comparison with the Integral-
Breadth Methods 342 54 Reliability of Profile Fitting 343 55 Remarks 344 Analysis of Superconductors 345 61 (La-M)2Cu04 Superconductors 345 62 Bi-Cu-O Superconductors 348 63 Remarks 349 Conclusions 350 References 351
Glossary
a b c m m U V W U V W ixz A fl3
D
General constants General constants General constants General variables Fourier coefficient Edge of orthorhombic cell orthogonal to diffracting planes Domain size orthogonal to diffracting planes Interplanar spacing Upper limit of strain
FWHM Full width at half maximum of profile
fF Pure-specimen (physically) broadened profile and its Fourier transform
ampG Instrumentally broadened profile and its Fourier transform
hH Observed broadened profile and its Fourier transform
hkl Miller indices I Intensity Jc Critical superconducting current
density K Scherrer constant k Pciir^^ Pc) characteristic
integral-breadth ratio of a Voigt function
L naj column length (distance in real space) orthogonal to diffracting planes
I Order of reflection MSS Mean-square strains N Average number of cells per
column n Harmonic number P Column-length distribu-
tion function R Relative error RMSS Root-mean-square strains s 2sin eX = Vd variable in
reciprocal space Tc Critical superconducting
transition temperature w Observation weight Z Displacement of two cells in a
column a Stacking-fault probability a Twin-fault probability P )3(20)cos0oA integral breadth
in units of 5(A) 7 Geometrical-aberration profile S Fraction of oxygen atoms
missing per formula unit eL)) Mean-square strain orthogonal
to diffracting planes averaged over the distance L
V Apparent strain e Bragg angle eo Bragg angle of Kai reflection
maximum A
CO
X-ray wavelength Span of profile in real space Wavelength-distribution profile
322
Volume 98 Number 3 May-June 1993
Journal of Research of the National Institute of Standards and Technology
Superscripts
D Denotes the distortion-related parameter S Denotes the size-related parameter
Subscripts
C Denotes Cauchy component of Voigt function
D Denotes distortion-related parameter Denotes pure-specimen (physically)
broadened profile G Denotes Gauss component of Voigt function g Denotes instrumentally broadened profile h Denotes observed broadened profile S Denotes size-related parameter s Denotes surface-weighted parameter V Denotes volume-weighted parameter wp Denotes weighted-residual error
Operators
Convolution g(x)f(x) = Sg(z)f(jc -z)dz
1 Introduction
X-ray diffraction is one of the oldest tools used to study the structure of matter In 1912 Laue [1] demonstrated in a single experiment that crystals consist of regularly repeating elementary building blocks and that x rays show wave nature Since then x-ray diffraction has become one of the basic and the most widely used methods for characteriza- tion of a broad range of materials
11 Powder X-Ray Diffraction
Many materials are not available in a monocrys- tal form Moreover powders and bulk materials are more easily obtainable practical and less ex- pensive A powder-diffraction experiment requires an order-of-magnitude shorter time than a monocrystal experiment Thus powder diffraction is used very often However because data are of lower quality and peaks are generally highly over- lapped at higher diffracting angles until 25 years ago powder diffraction was mostly used for qualita- tive phase analysis Through advances by Rietveld [2 3] powder-diffraction patterns become used in structure analysis so-called structure (Rietveld) re- finement Development of fast on-line computer- controlled data acquisition has allowed a quick analysis of the whole diffraction pattern Table 1 summarizes uses of different diffraction line-pro- file parameters in various types of analyses (after
Howard and Preston [4]) We shall focus on line- profile analysis to obtain information about mi- crostructural properties of materials microstrains in the lattice and size of incoherently diffracting domains in crystals
Table 1 Use of diffraction line-profile parameters
Position Intensity Shape Shift Method Identification
V Indexing Cell parameters
V V Phase Identification analysis and quantity
V Peak-shift Internal strain analysis (residual stress)
V V Profile Microstrain analysis crystallite size
lattice defects
V V V Structure Atomic posi- refine- tions Debye- ment Waller factors
others
12 Diffraction-Line Broadening
Diffraction from crystal planes occurs at well- defined angles that satisfy the Bragg equation
= 2dhkisin6iM (1)
Theoretically intensity diffracted from an infinite crystal should consist of diffraction lines without width (Dirac delta functions) at some discrete dif- fraction angles However both instrument and specimen broaden the diffraction lines and the ob- served line profile is a convolution of three func- tions [5 6]
h (26) = [io)y)f] (20) + background (2)
Wavelength distribution and geometrical aberra- tions are usually treated as characteristic for the particular instrument (instrumental profile)
gi2e) = icoy)i2d) (3)
To obtain a specimens microstructural parameters the specimen (physically) broadened profilemust be extracted from the observed profile h
Origins of specimen broadening are numerous Generally any lattice imperfection will cause
323
Volume 98 Number 3 May-June 1993
Journal of Research of the National Institute of Standards and Technology
additional diffraction-line broadening Therefore dislocations vacancies interstitials substitutions and similar defects manifest themselves through the lattice strain If a crystal is broken into smaller incoherently diffracting domains by dislocation arrays stacking faults twins or any other extended imperfections then domain-size broadening occurs
13 Superconductivity and Defects
Since discovery of the ~90 K superconductor YBa2Cu307-laquo [7] it became clear that the novel su- perconductivity relates closely to defects in struc- ture Both point and extended defects relate closely to the physical properties of superconduc- tors [8 9] Defects play an important role both in the critical superconducting transition temperature Tc [10] and in the critical current density c [H] Some theories also connect Tc with lattice distor- tion [12] with strains around dislocations [13] and with interaction of current carriers and the elastic- strain field [14]
The Tc of YBajCuaOv-ji for instance depends strongly on the ojq^gen stoichiometry that is num- ber of oxygen vacancies in the charge-reservoir lay- ers and their arrangement (see Jorgensen [15] and references therein) Superconductivity in La2Cu04 appears either by the partial substitution of La with Sr Ba Ca [16 17] or by the introduction of inter- stitial oxygen defects in the La202 layer [18] Some substitutions especially on Cu sites destroy the su- perconductivity
For classical superconductors c can be drasti- cally increased by introducing defects to pin mag- netic flux vortices The layered structure of high-Tc cuprates causes the vortices to be pinned in the form of pancakes rather than long qflinders [19] Because of relatively small coherence length of vortices pinning can not be increased in the classi- cal way by introducing second-phase precipitates Instead submicroscopic lattice defects caused by local stoichiometry fluctuations vacancies substi- tutions Guinier-Preston zones and the strain field of small coherent precipitates are much more ef- fective Especially in highly anisotropic Tl-based and Bi-based cuprates substitutions are very suc- cessful Even a 5 Mg for Ba substitution in Tl2Ba2CaCu208 increases c by 25 [20]
14 Purpose of the Study
We know that defects have a very important role in novel high-Tc superconductivity Defects can be characterized and quantified by analyzing the x-ray
diffraction broadening Basically there are two ap- proaches
(i) The Stokes deconvolution method [21] com- bined with the Warren and Averbach analysis [22] give the most rigorous and unbiased approach be- cause no assumption about the analytical form of diffraction-peak shape is required However when peaks overlap and specimen broadening is com- parable with the instrumental broadening the Stokes method gives unstable solutions and large errors or can not be performed at all To obtain reliable results proper corrections have to account for truncation background sampling and the stan- dards errors [23]
(ii) The simplified integral-breadth methods (summarized by Klug and Alexander [24]) are more convenient and easier to use but they require that size and strain broadening are modeled by ei- ther Cauchy or Gauss functions Experience has shown however that in most cases both size and strain profiles can not be satisfactorily represented with either function However there is some theo- retical and experimental evidence that the effect of small-domain-size broadening produces long pro- file tails of the Cauchy function and that the lat- tice-strain distribution is more Gauss-like Langford [25 26] used the convolution of Cauchy and Gauss functions (Voigt function) to model specimen broadening However the results ob- tained by the integral-breadth and Warren-Aver- bach analyses are usually not comparable the first methods give volume-weighted domain sizes and upper limit of strain the second gives surface- weighted domain sizes and mean-square strain av- eraged over some distance perpendicular to diffracting planes
Unfortunately most high-Tc superconductors show weak peak broadening (because of high an- nealing temperatures) and strong peak overlapping (because of relatively complicated crystal struc- tures) which makes it very difficult to apply the Stokes deconvolution method to extract pure speci- men broadening The aim in this study is twofold
(i) To develop a reliable method for analysis of a pattern with highly overlapping reflections and weak structural broadening and to compare it with the previously described approaches It will be shown that the Voigt-function modeling of the specimen broadening concurs with the Warren- Averbach approach
(ii) To apply the method to the same high-Tc superconductors and conclude how much informa- tion about defects can be extracted from analysis of the x-ray diffraction broadening
324
Volume 98 Number 3 May-June 1993
Journal of Research of the National Institute of Standards and Technology
2 Previous Studies 21 Size and Strain Broadening
Some important methods to extract specimen size and strain broadening and information about domain sizes and strains will be reviewed briefly An excellent review about Fourier methods and in- tegral-breadth methods is given by Klug and Alex- ander [24] A survey of single-line methods was authored by Delhez de Keijser and Mittemeijer [27] The use of variance (reduced second moment of the line profile) in the analysis of broadening will not be treated here Wilson described the con- tributions to variance by crystallite size [28] and strain [29]
211 Determination of the Pure Specimen- Broadened Profile As mentioned in Sec 12 be- fore the specimens size and strain broadening can be obtained the observed profile must be cor- rected for instrumental broadening Most used methods are the Fourier-transform deconvolution method [30 21] and simplified integral-breadth methods that rely on some assumed analytical forms of the peak profiles The iterative method of successive foldings [31 32] is not used extensively and will not be considered here
Deconvolution Method of Stokes From Eqs (2) and (3) it follows that deconvolution can be per- formed easily in terms of Fourier transforms of re- spective functions
F(n) = =H(nl G(ny (4)
Hence the physically broadened profile is re- trieved from the observed profile h without any as- sumption on the peak-profile shape (see Fig 1) This method is the most desirable approach be- cause it is totally unbiased However because of the deconvolution process there are many prob- lems Equation (4) may not give a solution if the Fourier coefficients of the profile do not vanish before those of the g profile Furthermore if physi- cal broadening is small compared with instrumen- tal broadening deconvolution becomes too unstable and inaccurate [33 34] If the h profile is 20 broader than the g profile this gives an upper limit of about 1000 A for the determination of ef- fective domain size [34] Regardless of the degree of broadening deconvolution produces unavoid- able profile-tail ripples because of truncation ef- fects To obtain reliable results these errors have to be corrected along with errors of incorrect background sampling and the standard specimen
[23 35 36] The largest problem however is peak overlapping If the complete peak is not separated the only possible solution is to try to reconstruct the missing parts That would require some as- sumption on the peak-profile shape that is intro- duction of bias into the method The application of the Stokes method is therefore limited to materials having the highest crystallographic symmetry
dh(x)
Fig 1 Observed profile n is a convolution of the instrumental profile g with the specimen profile Adapted from Warren [59]
Integral-Breadth Methods The basic assumption of these methods is that diffraction profiles can be ap- proximated with some analytical function In the beginning two commonly used functions were Gauss
(x)=(0)exp[-7|^] (5)
and Cauchy
(gt=) =(0) 4+
(6)
From the convolution integral it follows easily that
Ac = ftc + iE^c (7)
for Cauchy profiles and
l3lG = lih + Ph (8)
for Gauss profiles However the observed x-ray diffraction line profiles can not be well represented with a simple Cauchy or Gauss function [24 37] But they are almost pure Cauchy at highest angles because the dominant cause of broadening be- comes the spectral distribution in radiation [24] Different geometrical aberrations of the instru- ment are difficult to describe with simple analytical functions In the case of closely Gaussian broaden- ing of y following Eq (3) the instrumental line profile can be best described by a convolution of Cauchy and Gauss functions which is the Voigt
325
Volume 98 Number 3 May-June 1993
Journal of Research of the National Institute of Standards and Technology
function Experience shows that the Voigt function [38] (or its approximations pseudo-Voigt [39 40] and Pearson-VII [41 42]) fits very well the ob- served peak profiles [25 43 37] The Voigt func- tion is usually represented following Langford [25]
nx)=m^)Rc[ctn(^ + ik)] (9)
Here the complex error function is defined as
erfi(z) = exp( -z^) [1 - erf( -raquo)] (10)
Its evaluation can be accomplished using Sundius [44] or Armstrong [45] algorithms with eight-digit accuracy Useful information about the Voigt func- tion can be found in papers of Kielkopf [46] As- thana and Kiefer [47] and de Vreede et al [48] Figure 2 presents a Voigt function for different val- ues of Cauchy and Gauss integral breadths
causes diffraction-line broadening
12
Pc=005 pc=005
Pc = 01pc=001
PG=001PC=01
283 26
Fig 2 Voigt functions for different values of Cauchy and Gauss integral breadths Adapted from Howard and Preston [4]
Integral breadth of the Voigt function is expressed through its constituent integral breadths [49]
^ erfc(A) (11)
Here erfc denotes the complementary error func- tion
Because convolution of two Voigt functions is also a Voigt function integral breadths are easily separable conforming to Eqs (7) and (8)
212 Separation of Size and Strain Broadening After removing the instrumental broadening from the observed line profile it is possible to analyze the pure-specimen (physically) broadened line pro- file to consider the origins and amount of broad- ening
In 1918 Scherrer [50] recognized that break- ing the crystal into domains smaller than ~1000 A
ltZ)gtv = KX
3(20) cos9 (12)
The constant K depends on the crystallite shape [515253545556] but generally is close to unity The main characteristic of size broadening is that it is independent of the reflection order that is inde- pendent of diffraction angle
Most of the work on x-ray diffraction line broad- ening was done on metals and alloys It is widely accepted that plastic deformation in metals pro- duces dislocation arrays which divide crystallites into much smaller incoherently scattering domains These dislocations produce strains within the do- mains causing strain broadening It was elaborated in Sec 12 that any lattice imperfection (vacancies interstitials and substitutions) would broaden the diffraction peaks These effects would be inter- preted in the frame of this theory as a strain broad- ening too Stokes and Wilson [57] defined apparent strain as
Tj=3(20)cot0 (13)
Strain broadening is angle dependent Therefore the angle dependence of the line broadening gives a possibility to distinguish between contributions of size and strain However when we speak of size and strain broadening they may include other con- tributions For instance stacking faults and twins will contribute to broadening similar to size effects
Warren-Averbach Method This method was devel- oped originally for plastically deformed metals but since its introduction [58 22] it found successful application to many other materials The method is extensively described in Warrens publications [59 60] Each domain is represented by columns of cells along the 03 direction [61] (see Fig 3) The crystal has orthorhombic axes with the direction 03 normal to the diffracting planes (00) The experi- mentally observable diffraction power may be ex- pressed as a Fourier series
(20)=-^ 2 An expilvina^s) (14)
Here experimentally measurable coefficients Abdquo are
Nbdquo Abdquo =T^ ltexp(2m7Zbdquo)) (15)
326
Volume 98 Number 3 May-June 1993
Journal of Research of the National Institute of Standards and Technology
m 3
^i
m I
Fig 3 Representation of the crystal in terms of columns of cells along the a^ direction [59]
The Abdquo coefficients are the product of two terms The first term depends only on the column length (size coefficient) the second depends only on dis- tortion in domains (distortion coefficient)
An mdashAn An bull
Nbdquo lf = ltexp(2TrZbdquo))
(16)
(17)
It is more convenient to express the distortion coef- ficient in terms of the strain component If L =laquoa3 is the undistorted distance between a pair of cells along direction 03 and distortion changes distance by 4L = a^Zn the component of strain in the as direction (orthogonal to reflecting planes) aver- aged over distance L can be defined as (L) = A(L) L Because oil^d interplanar spacing the distortion coefficient can be rewritten
Ideg(L) = exp(2TrLe(L)d)) (18)
To obtain the strain component it is necessary to approximate the exponential term For not too large L
exp(2mLe(L)d)
laquoexp(-2Tr^L2lte2(L))d^) (19)
This relationship is exact if the distributions of e(L) for all L values follow the Gauss function and is generally true as far as terms in e^(L) because
these distributions are usually sufficiently symmet- rical [57] Now Eq (16) can be approximated as
InA L)=lnAL)- 2TTeL))LW) (20)
Warren and Averbach [22] derived this relation- ship in a similar way It separates size and strain contributions to the broadening and allows for their simultaneous evaluation
If the size coefficients are obtained by applica- tions of Eq (20) it is possible to evaluate the aver- age surface-weighted domain size and the surface-weighted column-length distribution func- tion [59]
idAHL) ^ 1_
Ps(L) dMU) dL^
(21)
(22)
Figure 4 shows how (D) can be obtained from both the size coefficients ^^(L) and the column- length distribution function
Fig 4 Surface-weighted domain size is determined (a) by the intercept of the initial slope on the L-axis (b) as a mean value of the distribution function
Multiple-Line Integral-Breadth Methods To sepa- rate size and strain broadening by using integral breadths it is necessary to define the functional form for each effect In the beginning size and strain contributions were described by Cauchy or Gauss functions Using Eqs (12) and (13) on the s scale and additive relations for the integral breadths following Eqs (7) and (8)
1 j8 =77vr + 2es (Cauchy-Cauchy) (23)
8=T^ + ^y- (Cauchy-Gauss) (24)
327
Volume 98 Number 3 May-June 1993 Journal of Research of the National Institute of Standards and Technology
^^=7^ + 4e^s^ (Gauss-Gauss) (25)
Here e = Tj4raquo4dd is the upper limit for a strain Equation (24) uses the Haider and Wagner [62] parabolic approximation for the integral breadth of the Voigt function expressed by Eq (11)
3 I3) (26)
Experience shows however that neither Cauchy nor Gauss functions can model satisfactorily size or strain broadening in a general case Langford [26] introduced the so-called multiple-line Voigt-func- tion analysis Both size-broadened and strain- broadened profiles are assumed to be Voigt functions Using Eqs (12) and (13) it follows sym- bolically for Cauchy and Gauss parts that
j8c = i3sc+j8Dcs
ph = Plc + plcs^
(27)
(28)
This approach disagrees with the Warren- Averbach analysis that is the two methods give different results (see Sec 44) [63 64]
Single-Line Methods There are cases where only the first order of reflection is available or higher- order reflections are severely suppressed (ex- tremely deformed materials multiphase com- posites catalysts and oriented thin films) Many methods exist to separate size and strain broaden- ing from only one diffraction peak However it was stated in Sec 212 that the different size and strain broadening angle dependence is a basis for their separation hence using only one diffraction line introduces a contradiction Consequently single- line methods should be used only when no other option exists The single-line methods can be di- vided in two main parts Fourier-space and real- space methods Fourier-space methods are based on the Warren-Averbach separation of size and strain broadening following Eq (20) The func- tional form of E^(L)) is assumed either to be con- stant [65666768] or assumed to depend on L as eL))=cL [69707172] Then Eq (20) can be fitted to few points of A(L) for the small averaging distance L to obtain size and strain parameters All Fourier-space methods have the serious prob-
lem that the Fourier coefficients 4 (L) are usually uncertain for small L because of the so-called hook effect [60] (see Sec 42) 2occhi [73] sug- gested that fitting the straight line through the first derivatives of the Fourier coefficients instead of through the coefficients themselves would solve the hook-effect problem
All real-space methods [747576] are based on the assumption that the Cauchy function deter- mines size and that the Gauss function gives strain The most widely used method of de Keijser et al [76] gives size and strain parameters from Cauchy and Gauss parts of the Voigt function respectively
P)v=^
e=^ 2s
(29)
(30)
22 Diffraction-Line-Broadening Analysis of Superconductors
In this field very few studies exist Williams et al [77] reported isotropic strains in YBa2Cu307-laquo powder by the simultaneous Rietveld refinement of pulsed-neutron and x-ray diffraction data Using a GSAS Rietveld refinement program [78] both size and strain broadening were modeled with the Gauss functions for the neutron-diffraction data [79 80] and with the Cauchy functions for the x- ray diffraction data (modified method of Thomp- son Cox and Hastings [81]) Interestingly both the neutron and x-ray data gave identical values for the isotropic strain (023) and no size broaden- ing Singh et al [82] studied internal strains in YBa2Cu307-laquo extruded wires by pulsed-neutron diffraction They separated size and strain parame- ters by means of Eq (25) (Gauss-Gauss approxi- mation) Size broadening was found to be negligible but (isotropic) microstrains range from 005 for the coarse-grained material to 03 for the fine-grained samples Eatough Ginley and Morosin [83] studied Tl2Ba2Ca2Cu30io (Tl-2223) and Tl2Ba2CaCu208 (Tl-2212) superconducting thin films by x-ray diffraction Using the Gauss-Gauss approximafion they found strains of 014-018 in both phases and domain sizes of 1200-1400 A for Tl-2212 but 500 A for Tl-2223
We are aware of only two more unpublished studies [84 85] involving size-strain analysis in high-Tc superconductors The probable reason is that any analysis is very difficult because of weak line broadening and overlapping reflections This
328
Volume 98 Number 3 May-June 1993
Journal of Research of the National Institute of Standards and Technology
precludes application of reliable analysis such as the Stokes deconvolution method with the Warren- Averbach analysis of the broadening Instead sim- ple integral-breadth methods are used which gives generally different results for each approach Moreover for x-ray diffraction broadening appli- cation of the Gauss-Gauss approximation does not have any theoretical merit although reasonable values especially of domain sizes may be obtained [86] We showed [878889] that reliable diffrac- tion-line-broadening analysis of superconductors can be accomplished and valuable information about anisotropic strains and incoherently diffract- ing domain sizes obtained
3 Experiment 31 Materials
The materials used for this study were tungsten and silver commercially available powders with nominal grain sizes 4-12 ijim La2-xSriCu04(jc = 0 006 015 024) powders Lai^Moi5Cu04(M = Ca Ba) powders Bi2Sr2CaCu208 (Bi-2212) sinter (BiPb)2Sr2Ca2Cu30io(BiPb-2223) sinter and (BiPb)2(SrMg)2(BaCa)2Cu30io (BiPbMgBa-2223) sinter
Powders with nominal compositions La2-xSrCuO4(c=0 006 015 024) and Laig5Moi5Cu04(M = Ca Ba) were prepared at the National Institute of Standards and Technology Boulder Colorado by A Roshko using a freeze- drying acetate process [90] Acetates of the various cations were assayed by mass by calcining to the corresponding oxide or carbonate The appropriate masses of the acetates for the desired compositions were dissolved in deionized water The acetate so- lutions were then sprayed through a fine nozzle into liquid nitrogen to preserve the homogeneous cation distributions Frozen particles were trans- ferred to crystallization dishes and dried in a com- mercial freeze dryer to a final temperature of 100 degC After drying the powders except the Lai^Baoi5Cu04 were calcined in alumina (998) crucibles at 675 C for 1 h in a box furnace with the door slightly open to increase ventilation Because BaCOs is difficult to decompose the Laig5Baoi5Cu04 was calcined under a vacuum of 2 Pa at 800 C for 4 h then cooled slowly in flowing oxygen (2degCmin) The calcined powders were oxidized in platinum-lined alumina boats in a tube furnace with flowing oj^gen at 700 degC After 3 h at 700 C the powders were pushed to a cold end of the furnace tube where they cooled quickly (20 Cs) while still in flowing oxygen
The cylindrical specimens (23 mm in diameter and 9 mm thick) of Bi-2212 BiPb-2223 and BiPbMgBa-2223 were prepared at the National Research Institute for Metals Tsukuba Japan by K Togano [91] Starting oxides and carbonates were Pb304 61203 CuO SrCOs MgCOs and BaC03 They were calcinated in air at 800 C for 12 h Powders were then pressed and sintered in 8 oxygen-92 argon mixture at 835 degC for 83 h Specimens were furnace cooled to 750 degC held for 3 h in flowing oxygen and then furnace cooled in ojygen to room temperature
311 Preparation of Specimens for X-ray Diffraction The bulk specimens were surface polished if necessary and mounted in specimen holders Coarse-grained powders of La2-cSrxCu04 (x=Q 006 015 024) and Lai8sMoi5Cu04 (M = Ca Ba) were ground with a mortar and pestle in toluene and passed through a 635-mesh sieve (20-|xm nominal opening size) Silver and tungsten powders were dry ground with a mortar and pestle All powders were mixed with about 30 silicone grease and loaded into rectangular cavities or slur- ried with amyl acetate on a zero-background quartz substrate
32 Measurements
X-ray-diffraction data were collected using a standard two-circle powder goniometer in Bragg- Brentano parafocusing geometry [92 93] (see Fig 5) A flat sample is irradiated at some angle incident to its surface and diffraction occurs only from crystallographic planes parallel to the speci- men surface The goniometer had a vertical 0-26 axis and 22 cm radius CnKa radiation ex- cited at 45 kV and 40 mA was collimated with Seller slits [94] and a 2 mm divergence slit SoUer slits in the diffracted beam 02 mm receiving slit and Ge solid-state detector were used in a step- scanning mode (OOI7IO s for a standard specimen 002deg-005730-80 s for other specimens depending on the amount of broadening)
33 Data Analysis
The diffractometer was controlled by a com- puter and all measurements were stored on hard disc Data were transferred to a personal computer for processing
We used computer programs for most calcula- tions X-ray diffraction patterns were fitted with the program SHADOW [95] This program allows a choice of the fitting function and gives refined positions of the peak maximums intensities and function-dependent parameters It also has the
329
Volume 98 Number 3 May-June 1993
Journal of Research of the National Institute of Standards and Technology
Seller Slits
Source S
Specimen
Fig 5 Optical arrangement of an x-ray diffractometer Adapted from Klug and Alexander [24]
ability to convolute the predefined instrumental profile with the specimen function to match the ob- served pattern Choice of the specimen function in- cludes Gauss and Cauchy functions We added the ability to model the specimen broadening with an exact Voigt function and implemented SHADOW on a personal computer In the fitting procedure for every peak in the pattern the program first gen- erates the instrumental profile at the required dif- fraction angle The instrumental profile is deter- mined from prior measurements on a well-annealed standard specimen (see Sec 51) Then it assumes parameters of the specimen profile For an exact Voigt function parameters are peak position peak intensity and Cauchy and Gauss integral breadths of the Voigt function By convoluting the instru- mental profile with the specimen profile and adding a background the calculated pattern is ob- tained [Eq (2)] Parameters of the specimen profile are varied until the weighted least-squares error of calculated and observed patterns Eq (59) reaches a minimum This process avoids the unstable Stokes deconvolution method It is possible that the refine- ment algorithm is being trapped in a false minimum [96] but it can be corrected by constraining some parameters Refined parameters of the pure-speci- men profile are input for the size-strain analysis of the broadening A program for this analysis was written in Fortran
Lattice parameters of powder specimens were calculated by the program NBSLSQ85 based on the method of Appleman and Evans [97] A pro- gram in Fortran was written to apply corrections to observed peak maximums by using NIST standard reference material 660 LaB6 as an external stan-
dard Lattice parameters of bulk specimens were determined by the Fortran program which uses a modified Cohens method [9899100] to correct for systematic diffractometer errors Lattice parame- ters were also calculated by the Rietveld refinement programs GSAS [78] and DBW32S [101 102]
4 Methodology
When instrumental and specimen contributions to the observed line profile must be modeled sepa- rately adopting a specimen function is a critical step Yau and Howard [103104] used Cauchy and Enzo et al [105] pseudo-Voigt functions Benedetti Fagherazzi Enzo and Battagliarin [106] showed that modeling the specimen function with the pseudo-Voigt function gives results comparable to those of the Stokes deconvolution method when combined with the Warren-Averbach analysis of Fourier coefficients De Keijser Mittemeijer and Rozendaal [107] analytically derived domain sizes and root-mean-square strains for small averaging distance L in the case of the Voigt and related func- tions
The aim here is to study more thoroughly the consequences of assumed Voigt specimen function on the size-strain analysis of the Fourier coeffi- cients of the broadened peaks It is shown that some experimentally observed interrelations between derived parameters (particularly volume-weighted and surface-weighted domain sizes) and their be- havior (the hook effect and dependence of mean- square strains on the averaging distance) can be explained by this simple assumption Moreover the discrepancy between the integral-breadth methods and Warren-Averbach analysis results from differ- ent approximations for the strain broadening and the background experimental errors
41 Separation of Size and Strain Broadenings
The normalized Fourier transform of a Voigt function is easily computable [46]
^ =exD[-2laquo^e^-7m^^fi^l fan ^bdquo-exp|^ ^ cr(2e) ^ a^(2e) T ^^^^
It is convenient to express Fourier coefficients in terms of distance L by immediately making the ap- proximation A (26) = Ascos do
AL) = exp[-2L^-7rL^pl] (32)
330
Volume 98 Number 3 May-June 1993
Journal of Research of the National Institute of Standards and Technology
Equation (32) is a good approximation even for large specimen broadening Even for a profile span of A (29) = 80deg the error made by replacing this in- terval by an adequate A(sin9 ) range is 2 How- ever strictly speaking the profile will be asym- metrical in reciprocal space and Fourier-interval limits will not correspond to the 29i and Idz peak- cutoff values in real space It is important to keep Fourier interval limits identical for all multiple-or- der reflections otherwise serious errors in the sub- sequent analysis will occur [108] If higher accuracy for a considerable broadening is desired profile fit- ting can be accomplished In terms of the recipro- cal-space variable s instead of in a real 29 space
Assuming that only the Cauchy function deter- mines domain size [4(L) = exp(-L(Z))s)] and only the Gauss function gives root-mean-square strain (RMSS) [^deg(L) = exp(-27r=L2(e)d^)] Eq (32) leads to the Warren-Averbach [Eq (20)] for the separation of size and strain contribution [62] Experience shows that Cauchy and Gauss functions can not satisfactory model specimen broadening Balzar and Ledbetter [64] postulate that the speci- men function includes contributions of size and strain effects both approximated with the Voigt functions Because the convolution of two Voigt functions is also a Voigt function Cauchy and Gauss integral breadths of the specimen profile are easily separable
3c=i3sc + 3DC (33)
(34)
Langford [26] separated the contributions from size and strain broadening in a similar way (See Eqs (27) and (28)) Note however that Eqs (33) and (34) do not define size and strain angular or- der-dependence
Because Fourier coefficients are a product of a size and a distortion coefficient from Eqs (32) (33) and (34) we can obtain the separation of size and strain contributions to the pure specimen broadening
^S(L) = exp(-2Li3sc-TrL^3io) (35)
Adeg(L) = eM-2LpDc-TrL^Phc) (36)
Wang Lee and Lee [109] modeled the distortion coefficient and Selivanov and Smislov [110] mod- eled the size coefficient in the same way
To obtain size and distortion coefficients at least two reflections from the same crystallographic- plane family must be available
42 Size Coefficient
Surface-weighted domain size is calculated from the size coefficients following Eq (21) From Eq (35) we obtain
lt^gts = 1
2i3sc (37)
Therefore surface-weighted domain size depends only on the Cauchy part of the size-integral breadth
The second derivative of the size coefficients is proportional to the surface-weighted column-length distribution function Eq (22) The volume- weighted column-length distribution function fol- lows similarly [111]
p(L)ocL^j^ (38)
By differentiating Eq (35) twice we obtain
^^4^ = [(2^L^ic + 2^sc)^- dL
2TrplcAL) (39)
Because the column-length distribution function should always be positive [59] the Cauchy part must dominate Inspection of Eq (39) shows that for small L we must require
(40)
Otherwise the hook effect will occur in the plot of size coefficientsI (L) versus L that is the plot will be concave downward for small L (Fig 6) The hook effect is usually attributed to experimental errors connected with the truncation of the line profiles and consequently overestimation of background [59] This is a widely encountered prob- lem in the Fourier analysis of line broadening It results in overestimation of effective domain sizes and underestimation of the RMSS [36] Some authors [106] claim that the preset specimen- broadening function eliminates the hook effect However Eq (39) shows that effectively too high
331
Volume 98 Number 3 May-June 1993
Journal of Research of the National Institute of Standards and Technology
08-
04-
mdash^ 1 J 1 x
^~ ( ^ ^ i I
1 t 1 11
jl u
V 1 iJ
J
c^
100 200
Fig 6 (upper) The hook effect of the size coefficients A ^ (full line) at small L (lower) it causes negative values (set to zero) of the column-length distribution functions
background causes underestimation of the Cauchy content of the Voigt function because the long tails are truncated prematurely It has to be men- tioned that Wilkens [112] proposed tilted small-an- gle boundaries to be the source of the hook effect Liu and Wang [113] defined a minimum particle size present in a specimen depending on the size of the hook effect Figure 6 shows that negative values of the column-length distribution functions (set to zero) do not affect the shape but shift the entire distribution toward larger L values
Note also that the surface-weighted column- length distribution function ps(L) will usually have a maximum at L = 0 but for the particular ratio of integral breadths determined by Eq (40) it can be zero The volume-weighted column-length distribu- tion function7v(L) will always have a maximum for LsO
If the column-length distribution functions are known it is possible to evaluate mean values of respective distributions
lt^kv =
00
J ^ _0
(L)dL
raquosv(L)dL (41)
Integrals of this type can be evaluated analytically [114]
OQ
J cexp( - to^ - a )dc = i^y^ ^ of
hd^^^^fe)]- (^2)
Surface-weighted domain size (D)s must be equal to the value obtained from Eq (37) The volume- weighted domain size follows
ltD)v = ^^erfc(A) = js (43)
Using Eqs (37) and (43) we can evaluate the ratio of domain sizes
i^ = 7r lt^gts
= 2vn-^exp(A2)erfc(^) (44)
Theoretically k can change from zero to infinity However the minimum value of k is determined by Eq (40)
1V2 ltk lt laquogt (45)
Hence the ratio of domain sizes can change in a limited range (see also Fig 7)
131laquo V2^ erfc (^ ) s ^ lt 2 (46)
10^ 10^ 10- 10deg 10 10^ 10-
Fig 7 The ratio of volume-weighted and surface-weighted domain sizes as a function of the characteristic ratio of Cauchy and Gauss integral breadths k
332
Volume 98 Number 3 May-June 1993
Journal of Research of the National Institute of Standards and Technology
It may be noted that most experiments give the ratio D)vD)s in this range (see for instance re- view by Klug and Alexander [24]) When k goes to infinity the size broadening is given only by the Cauchy component and (JD)V=2(D)S This is a case of pure Cauchy size broadening described by Haider and Wagner [62] and de Keijser Mittemei- jer and Rozendaal [107] It is possible to imagine a more complicated column-length distribution func- tion [27] than Eq (39) which would allow even larger differences between surface-weighted and volume-weighted domain sizes However we are not aware of any study reporting a difference larger than 100
43 Distortion Coefficient
In Sec 212 it was shown that the distortion co- efficient can be approximated by the exponential
Adeg(L) = exp(-ITTVLeL))) (47)
Comparing with Eq (36) we can write
Therefore mean-square strains (MSS) decrease linearly with averaging distance L This behavior is usually observed in the Warren-Averbach analysis Rothman and Cohen [115] showed that such be- havior would be expected of strains around disloca- tions Adler and Houska [116] Houska and Smith [117] and Rao and Houska [118] demonstrated for a number of materials that MSS can be repre- sented by a sum of two terms given by Cauchy and Gauss strain-broadened profiles
However for i3Dc=0 the MSS are independent ofL
(^2)12 ^ ^Dc(2g) cotg = ^ 2V2 V2TT
(49)
where the upper limit of strain e is defined as 7j4 (see Sec 212) This is a limiting case of pure- Gauss strain broadening described by de Keijser Mittemeijer and Rozendaal [107]
44 Discussion
To calculate domain sizes and strain it is neces- sary to define size and distortion integral-breadths angular order-dependence From Eq (43) It fol- lows that the domain size D )v is always indepen- dent of the order of reflection
)3sc = const JSSG = const
However from Eq (48) we find
^^ = const ^^ = const
(50)
(51)
An important consequence is that apparent strain TJ will be independent of angle of reflection only in the case of pure-Gauss strain broadening because 3DC and JSDG depend differently on the dif- fraction angle If we compare Eq (51) with the multiple-line Voigt-function analysis [26] given by Eqs (27) and (28) it is evident that they disagree Therefore recombination of constituent integral breadths 3DC and 3DO to Voigt strain-broadened in- tegral breadth Pdeg and the subsequent application of Eq (49) to calculate strain [26 119] will concur with the Fourier methods if strain broadening is entirely Gaussian and for the asymptotic value of MSS ((e^( 00))) However neither volume-weighted domain sizes D)y will agree although they are de- fined identically in both approaches because size- broadened and strain-broadened integral breadths are dependent variables
If at least two orders of reflection ( and +1) of the same plane (hkl) are available using Eqs (50) and (51) we can solve Eqs (33) and (34)
(52)
^^deg sl + l)-sil) ^^^^
^^=sHl + l)-sl) [fc( + l)-3c()3 (54)
^^=sl + l)-sl) [^(^ + ^)-^(0]- (55)
If we substitute these expressions into Eqs (35) and (36) we see that this approach leads exactly to the Warren-Averbach Eq (20) for two orders of reflections This is expected because the distortion coefficient is approximated with the exponential (47)] Delhez de Keijser and Mittemeijer [23] ar- gued that instead of Eq (20) the following rela- tion would be more accurate
A(L)=AXL) (1 -27r^(e^(L))LVd (56)
333
Volume 98 Number 3 May-June 1993
Journal of Research of the National Institute of Standards and Technology
These two approximations differ with fourth-order terms in the power-series expansion In terms of this approach Eq (48) has to be rewritten
2r ^^ l-exp(-2LI3DC-TTL^0DG) (57)
This means that even if the strain-broadened pro- file is given entirely by the Gauss function the MSS depend on distance L (see Fig 8) In this ap- proximation no simple relation for the distortion integral-breadths angular order-dependence exists For not so large L however Eq (51) holds and approximations from Eqs (20) and (56) do not dif- fer much (see Fig 8)
1500 Warren- Averbach approximation ^
Delhez de Kcijscr and ^^^ Minemeijer approximation ^y^
^ 1000 A
500
mdashI
1 1
Oc 300 600 IL k^) X 10^
90
o ^ 60 A
30
1
J Warren- Averbach approximation
Delhez de Keijser and Minemeijer approximation
0 0 150 300
1L (A-1 ) X 10^
Fig 8 Mean-square strains pound^(L)) for two approximations of the distortion coefficient (upper) Voigt strain broadening (lower) pure-Gauss strain broadening
Generally it was shown that in the size-broad- ened profile the Cauchy part must dominate No similar requirement for the strain-broadened pro- file exists However experience favors the assump- tion that it has to be more of Gauss-type The Warren-Averbach approach is exact if strain broad- ening is purely Gaussian so Eqs (20) and (48) are
better approximations as strain profile is closer to the Gauss function In any case both approaches given by Eqs (20) and (56) are good up to the third power in strain and the Warren-Averbach relation [Eq (20)] does not assume that MSS are independent of distance L [27] it also represents a harmonic approximation
If at least two orders of reflection from the same plane (hkl) are available we can use Eqs (52) (53) (54) and (55) to calculate size-related and strain-related integral breadths Subsequent appli- cation of Eqs (37) (43) and (48) gives directly domain sizes (D) and (D)v and mean-square strains (e^(L)) This approach is more straightfor- ward and much simpler than the original Warren- Averbach analysis Great care should be given to the possible systematic errors The easiest way to observe the hook effect is to plot column-length distribution functions as a function of averaging distance L If they show negative values for small L (see Fig 6) all derived parameters will be in error This is because (i) only the positive values of the column-length distribution functions are numeri- cally integrated or (ii) the intercept on the L-axis of the linear portion of the A^ vs L curve is taken (see Fig 4) always larger values of domain sizes will be obtained than by the application of Eqs (37) and (43) Therefore we conclude that the dis- crepancy between integral-breadth and Fourier methods is always present by the appearance of the hook effect in the A^ vs L curve An analogous discrepancy exists between integral-breadth and variance methods [119] In such cases correction methods for truncation can be applied [35 119 120] but the best procedure is to repeat the pat- tern fitting with the correct background
In the Fourier analysis it is usually observed that the mean-square strains diverge as the averaging distance L approaches zero This also follows from Eqs (48) and (57) However because the MSS de- pendence on distance L is not defined in Warren- Averbach analysis it was suggested [27 107 121] that local strain can be obtained by taking the sec- ond derivative of the distortion coefficient or by a Taylor-series expansion of local strain Therefore we obtain from Eq (36)
i^m-M^-^) (58)
It is evident that this relation is wrong It holds only for a special case of pure-Gauss strain-broad- ened profile when the MSS are equal for any L Otherwise if the Cauchy function contributes to
334
Volume 98 Number 3 May-June 1993
Journal of Research of the National Institute of Standards and Technology
strain broadening all derivatives of strain in L = 0 are infinite and local strain can not be defined If the main origin of strains is dislocations [115] strains are defined after some distance from the dislocation (cutoff radius) to be finite Averaging strains over a region smaller than the Burgers vector is probably not justified For instance Eq (48) gives even for a small averaging distance L = 1 A and considerable strain broadening (J3DG(20) = 3DC(20) = 1O) root-mean-square strain eL = 1A))^ laquo02 that is about the elastic limit
45 Random Errors of Derived Parameters
Errors in size and strain analysis of broadened peaks are relatively difficult to evaluate Following Langford [26] sources of the systematic errors in- clude choice of standard specimen background and type of analytical function used to describe the line profiles The first two errors should be mini- mized in the experimental procedure Errors caused by inadequate choice of specimen function would systematically affect all derived results but they can not be evaluated Random errors caused by counting statistics have been computed by Wilson [122 123 124] and applied to the Stokes deconvolution method by Delhez de Keijser and Mittemeijer [23] as well as by Langford [26] and de Keijser et al [76] using single-line Voigt-func- tion analysis Nevertheless the approximate error magnitude can be calculated from estimated stan- dard deviations (esd) of the parameters refined in the fitting procedure In the program SHADOW the weighted least-squares error is minimized
7wp mdash RES
Here
)=1
RES = 2 vfi [ (obs) - (cal)]
(59)
(60)
and weights are the reciprocal variances of the ob- servations
H = l(obs) (61)
Each line profile has four parameters varied inde- pendently position intensity and Cauchy and Gauss integral breadths of the Voigt profile In least-squares refinement esds are computed as
^^ bu RES (62) m mdashm
Here ba are diagonal elements of the inverse matrix of the equation coefficients m is the number of observations and m is the number of refined parameters The main source of errors is integral breadths Errors in peak position peak intensity and background are much smaller and can be ne- glected in this simple approach For two indepen- dent variables )3G and Pc covariance vanishes and from Eqs (37) and (38) for the two orders of re- flection and +1 it follows that
RD =
si+i)m)RHMi))+si)m+i)i^(3c(+D)
(63)
ReL)r) =
pHDRHPcG)) + m + miPcJl + D) 2[3c(+1) - i8c()3+TTL [m+1) - mw
-n-LmiDRHihd))+m+mWcH+i))i ^ 2[)3c(+1) - iSc()+TTLim+1) - mw
(65)
Here Rx) are relative standard deviations The error in D would be complicated to evaluate but because 131D)s^(Igt)vlt2(pound))s Eq (63) gives a good estimation for the error in (Z))v as well Alter- natively to see how errors depend on the Fourier coefficients errors can be estimated from the Warren-Averbach relationship [Eq (20)] (86) From Eq (32) it follows that
RA (L)) = ATr^Lpos)R^2d)) +
4Lph(s)RPci2e)) (66)
Errors in root-mean-square strains and domain sizes are
i^((e^(L ))bulllaquo) =
RHA(Ll))+RHA(Ll + l)) (67)
ALl + l)
335
Volume 98 Number 3 May-June 1993
Journal of Research of the National Institute of Standards and Technology
^^laquo^))=(T^)
s(l + 1)RHA (Ll)) +SV)RHA (Ll + D) lsl + l)-sl)f (68)
Here (D) is approximately defined with A^(L) = l-L(D)j Errors in Fourier coefficients increase with L while factors in Eqs (67) and (68) lower the errors for large L In general errors of domain sizes and strains are of the same order of magnitude as errors of integral breadths [86]
5 Application 51 Correction for Instrumental Broadening
Before specimen broadening is analyzed instru- mental broadening must be determined This is ac- complished by carefully measuring diffraction peaks of some well-annealed defect-free speci- men It is then assumed that its broadening may be attributed only to the instrument The usual proce- dure is to anneal the specimen However in some instances that is not possible because either the material undergoes an irreversible phase transition on annealing or the number of defects can not be successfully decreased by annealing Another pos- sibility is to measure the whole diffraction pattern of the material showing the minimal line broaden- ing and then to synthesize the instrumental profile at the needed diffraction angle This approach re- quires the modeling of the angle dependence of the instrumental (standard) parameters Cagliotti Pao- letti and Ricci [125] proposed the following func- tion to describe the variation of the full width at the half maximum of profile with the diffraction angle
F9miA^(2e) = Utan^9 + Vtand + W (69)
Although this function was derived for neutron dif- fraction it was confirmed to work well also in x-ray diffraction case [126 127] A more appropriate function for the x-ray angle-dispersive powder dif- fractometer based on theoretically predicted er- rors of some instrumental parameters [128] may be the following [129]
FWHNf (2 e) = W+Vsin^l 6 +
UtanH + UcotH (70)
This function may better model the increased axial divergency at low angles and correct for the speci- men transparency [129] However contrary to the requirement on the specimen function most im- portant for the instrumental function is to correctly describe the angular variation of parameters re- gardless of its theoretical foundation
When specimen broadening is modeled with a Voigt function the simplest way to correct for the instrumental broadening is by fitting the line pro- files with the Voigt function too Cauchy and Gauss integral breadths of the specimen-broad- ened profile are then easily computable by Eqs (7) and (8) However because the instrumental broad- ening is asymmetric [24] modeling with the sym- metric Voigt function can cause a fictitious error distribution resulting in errors of strain up to 35 [76] Another approach is to model the instrumen- tal-broadening angle dependence by fitting the profile shapes of a standard specimen with some asymmetrical function split-Pearson-VII [95] or pseudo-Voigt convoluted with the exponential function [105] The instrumental function can then be synthesized at any desired angle of diffraction and convoluted with the assumed specimen func- tion to match the observed profile by means of Eq (2)
In the program SHADOW instrumental para- meters are determined by fitting the split-Pearson VII function (see Fig 9) to line profiles of a standard specimen
iix)=m- 2 m
with
c =-
mc^f
mm) mv-rim-12)
(71)
(72)
Here m = 1 or m = ltraquo yields a Cauchy or Gauss function respectively Refined full widths at half maximum (FWHM) and shape factors m for both low-angle and high-angle sides of the profiles are fitted with second-order polynomials To fit the FWHM we used Eq (69) and for the shape fac- tors
m(2e) = U(20f + V(2e) + W (73)
The resulting coefficients U V W U V and W permit synthesis of the asymmetrical instrumental line profile at any desired angle
336
Volume 98 Number 3 May-June 1993
Journal of Research of the National Institute of Standards and Technology
2 0(deg)
le
Fig 9 A split-Pearson VII profile The two half profiles have same peak position and intensity Adapted from Howard and Preston [4]
The basic requirement on the standard specimen is however to show as small a line broadening as possible To minimize physical contributions to the Une broadening of the standard specimen a few moments were emphasized as follows Because dif- fraction-line width depends strongly on degree of annealing it is preferable to use some reference powder-diffraction standard Furthermore asym- metry in the peak profiles is introduced by axial divergence of the beam flat specimen surface and specimen transparency [24] Choosing a standard specimen with low absorption coefficient would cause transparency effects to dominate If the stud- ied specimen has a large absorption coefficient (compared to the standard) this might produce a fictitious size contribution and errors in micro- strains All of the specimens studied have absorp- tion coefficients exceeding 1000 cm^ so a NIST standard reference material 660 LaBe was chosen to model the instrumental broadening (p = 1098 cm) According to Fawcett et al [130] LaBe showed the narrowest lines of all studied com- pounds Furthermore LaB6_has a primitive cubic structure (space group Pm3m) resulting in rela- tively large number of peaks equally distributed over 26 This allows for better characterization and lower errors of FWHMs and shape factors of split- Pearson VII functions (Fig 10)
52 Applicability of the Method
To study the applicability of method described in Sec 4 we first studied simple cubic-structure mate- rials such as silver and tungsten Tungsten has very narrow line profiles allowing us to obtain the up- per limit of domain sizes that can be studied Silver is easily deformed which provides a possibility to apply the method to broad line profiles To test the
009
-a
OH
006
003
1 1 m low-angle side n m high-angle side
bullz w 2 o OH
X
tancopy
Fig 10 Refined FWHMs and shape factors (exponents) m for low-angle and high-angle sides of LaBe line profiles Second- order polynomials were fitted through points
case of relatively complicated patterns and weak line broadening the method was also applied to Lai85Sroi5Cu04 and La2Cu04 powders In this sec- tion only the mechanical aspects of the line broad- ening are discussed Discussion about the origins of broadening of superconductors can be found in Sec 6
521 Silver and Tungsten Powders Figure 11 shows observed and refined peaks of tungsten un- treated and silver ground powders In Table 2 are listed results of fitted pure-specimen Voigt profiles for silver and tungsten specimens Table 3 and Fig 12 give results of the line-broadening analysis Untreated tungsten powder shows relatively weak broadening Instrumental profile FWHMs at angle positions of (110) and (220) tungsten lines are 0059deg and 0081deg respectively close to values mea- sured for tungsten 0065deg and 0100deg Results in Table 3 reveal that small broadening is likely caused by domain sizes because microstrains have negligible value This pushes the limit for measur- able domain sizes probably up to 4500-5000 A However one must be aware that weak specimen broadening implies higher uncertainty of all derived parameters Moreover the choice of the instrumental standard becomes more crucial
Both silver and tungsten line profiles become more Cauchy-like after grinding which probably increases dislocation density in the crystallites This is consistent with the presumption that small crystallites and incoherently diffracting domains separated by dislocations within grains affect the tails of the diffraction-line profiles [60115] Figure 13 illustrates the dependence of MSS on the recip- rocal of the averaging distance L
337
Volume 98 Number 3 May-June 1993
Journal of Research of the National Institute of Standards and Technology
C8
z
7- ^95
29 (deg) 405
bullJf^r-
z S 08
Ez U o u OS
a
04 bull
o Es
4P
2000 z^fA
4000
B
z u f- z
425 435 445 29 (deg)
455
yr 600 SOO
L(A)
Fig 11 Observed points (pluses) refined pattern (full line) and difference pattern (below) (110) W untreated (upper) (200) Ag ground (lower)
Fig 12 Fourier coefficients for the first- (pluses) and second- order (crosses) reflection and size coefficients (circles) [111] Ag untreated (upper) [100] Ag ground (lower)
Table 2 Parameters of the pure-specimen Voigt function as obtained from profile-fitting procedure for tungsten and silver powders
Specimen hkl 2ft(deg) 3c(deg) 3G(deg) FWHM(deg) Rwp()
W untreated 110 220
4028 8705
00065(7) 00301(6)
0020(2) ltio-
0021 0019
90 44
W ground 110 220
4029 8705
0100(2) 0222(3)
0038(4) 0069(6)
0080 0166
90 42
Ag untreated 111 222 200 400
3806 8151 4425 9786
0056(1) 0105(4) 0118(2) 0274(21)
ltio- 00008(21)
ltio-^ ltio-5
0036 0067 0075 0175
105 97
105 122
Ag ground 111 222 200 400
3807 8151 4424 9783
0175(3) 0410(26) 0365(10) 1079(82)
0038(12) ltio-
0076(29) ltio-
0121 0261 0250 0687
99 145 99
145
338
Volume 98 Number 3 May-June 1993
Journal of Research of the National Institute of Standards and Technology
Table 3 Microstructural parameters for tungsten and silver powders
Specimen Direction (poundgt)raquo( A) (2))v(A) ltpound^(fl3))laquo (^laquoD)v2)gtw
W untreated [110] 3200(200) 3500(200) 000038 000008(2)
W ground [110] 620(20) 1030(30) 00023 000054(2)
Ag untreated [111] [100]
1000(20) 510(20)
2000(20) 1030(20)
00010 00022
000024(1) 000047(5)
Ag ground [111] [100]
380(20) 210(10)
650(20) 350(20)
00047 00100
000095(7) 000180(14)
100 -_ - [100) Ag ground ^ ^~ mdash C1111 Ag ground ^bull
y y
o y ^ 50 A y
y y
y
0
y - y ^--
c ) 50 100 150
lLfAjxlO^
Fig 13 Mean-square strains (E^) as a function of VL
Errors in integral breadths allow estimation of errors in strain and size parameters (Sec 45) but in some cases the refinement algorithm gives unre- liable errors of integral breadths When a particu- lar parameter is close to the limiting value (for instance 10^ degrees has been put as the mini- mum value for integral breadths) errors become large However in Eqs (63) (65) (66) (67) and (68) only the product of integral breadth and ac- companying error is significant which is roughly equal for Cauchy and Gauss parts Errors of do- main sizes and strains are of the same order of magnitude as errors of integral breadths
The possible source of systematic error is poten- tial inadequacy of Voigt function to accurately de- scribe specimen broadening This effect can not be evaluated analytically but it would affect all derived parameters especially the column-length distribution functions The logical relationship be- tween values of domain sizes (see Table 3) for dif- ferent degrees of broadening indicates that possible systematic errors can not be large
Equation (41) allows computation of volume- weighted and surface-weighted average domain sizes if respective column-length distribution func- tions can be obtained Figure 14 gives surface- weighted and volume-weighted average column- length distribution functions following Eqs (39) and (38) Width of the distribution function deter- mines the relative difference between (D) and (pound))v The broader the distribution the larger the differences because small crystallites contribute more to the surface-weighted average That is much more evident comparing the surface- weighted column-length distribution with the vol- ume-weighted If they have similar shape and maximum position as in Fig 15 differences are small Conversely if the surface-weighted distribu- tion function has a sharp maximum toward smaller sizes differences are larger (see Fig 14) The dif- ference between (poundgt)s and (D)v and the actual mean dimension of the crystallites in a particular direction also depends strongly on the average shape of the crystallites [52 131 132]
If experimental profiles are deconvoluted by the Stokes method even for considerable specimen broadening size coefficients A ^ usually oscillate at larger L values [59 106] preventing computation of the column-length distribution function Few techniques were used to deal with this problem successive convolution unfolding method [32 133] smoothing and iterative methods [134 135 136 137] Figures 14 and 15 show very smooth column- length distribution functions However they follow from size coefficients ^4^ that depend on the accu- racy of the approximation for the distortion coeffi- cient given by Eq (47) Equation (47) is exact if the strain distribution is Gaussian but in general holds only for small harmonic numbers n if strain broadening is not negligible
339
Volume 98 Number 3 May-June 1993
Journal of Research of the National Institute of Standards and Technology
500 1000 L(A)
Fig 14 Surface-weighted and volume-weighted column-length distribution functions normalized on unit area [111] Ag un- treated (upper) [100] Ag ground (lower)
Fig 15 Surface-weighted and volume-weighted column-length distribution functions for [010] La2Cu04 normalized on unit area
522 La2-xSrtCu04 Powders To test the applicability of the discussed method to more com- plicated patterns two compounds with lower crystallographic symmetry were studied Lai85Sroi5Cii04 has a tetragonal K2NiF4-type struc- ture space group lAlmmm La2Cu04 is orthorhom-
bic at room temperature Both compounds show slight line broadening and relatively highly overlap- ping peaks (see Fig 16) which makes it very diffi- cult if not impossible to perform a Stokes analysis
25
-25
26 (deg)
yNraquo-
Fig 16 Observed points (pluses) refined pattern (full line) convoluted profiles (dashed line) and difference plot (below) for part of La2Cu04 pattern
Tables 4 and 5 list results from the fitting proce- dure and the analysis of specimen-broadened inte- gral breadths There are no qualitative differences in results for tungsten and silver powders How- ever average errors are higher as expected be- cause of overlapping peaks while weighted errors wp are surprisingly smaller This fact illustrates the unreliability of iwp when only a segment of the pat- tern is being refined because it depends on the number of counts accumulated in points as well as on the 28 range of the refinement
Figures 17 and 18 represent Fourier coefficients of Lai85Sroi5Cu04 [110] and La2Cu04 [010] direc- tions In the second plot the A (L )-versus-L plot shows a concave-downward part near L =0 the so- called hook effect It was shown in Sec 42 that the hook effect originates because of underesti- mation of background connected with the trunca- tion of profiles In the profile refinement all peaks separated less than 4deg 20 have been included in the refinement region to avoid possible overlapping of peak tails and specimen profiles have been trun- cated below 01 of the maximum intensity How- ever because the polynomial background was determined prior to profile refinement it may be overestimated for complicated patterns containing many overlapping peaks If background is refined with other profile parameters undesirable correla- tion with integral breadths occurs
340
Volume 98 Number 3 May-June 1993
Journal of Research of the National Institute of Standards and Technology
Table 4 Parameters of the pure-specimen Voigt function as obtained from profile-fitting procedure for La2-^SrCu04 powders
Specimen hid 2Hdeg) Pen PcO FWHM(deg) Rp()
Lai85Sroi5Cu04 004 2695 0046(4) 0024(8) 0042 34 006 4092 0083(5) ltio-= 0053 62 110 3352 0110(5) ltio- 0070 125 220 7046 0171(9) ltio- 0109 43
La2Cu04 004 2713 0061(8) 0045(9) 0067 39 006 4119 0124(7) ltio-^ 0079 77 020 3316 0074(10) 0078(10) 0102 29 040 6957 0210(30) 0026(81) 0135 29 200 3345 0074(8) 0061(10) 0087 69 400 7028 0130(10) 0023(95) 0089 29
Table 5 Microstructural parameters for Laij(5Srai3Cu04 and La2Cu04 powders
Specimen Direction (DUA) Pgt(A) lte^(fl3))laquo lte2((Z)gt2))laquo
Lai83Sro5Cu04
La2Cu04
[001] [110]
[001] [010] [100]
1700(300) 470(20)
1100(100) 680(50) 680(50)
2000(200) 940(20)
1200(100) 760(50) 810(50)
00024 00017
00038 00033 00016
000049(9) 000044(6)
00008(1) 00007(2) 00003(3)
c i ^- raquo sect 08 bulli - U
^0
ti- bull ll bull bullbullo
ffl M P bull- u ^ Di 04 Si - M bulldiamsbullbull a bull-v 3 o ^^=s^
u ^N^Sraquoraquo^
0 ^^^aaaa 1000
L(A) 2000
OQ bullbulldego UM o z a 08
o o bull bull bull
- u u bull raquo UU bull
a diams o bull o u ft 04 bull deg raquo deg - U bull bull deg Oi bullbullgt =3 bull- l o k u
0 bullbullbullraquo aaaMMi
500 1000
L(A)
Fig 17 Fourier coefficients for the first- (pluses) and second- order (crosses) reflection and size coefficients (circles) for [110] Lai^Sroi5Cu04
Fig 18 Fourier coefficients for first- (pluses) and second- order (crosses) reflection and size coefficients (circles) for [010] La2Cu04
341
Volume 98 Number 3 May-June 1993
Journal of Research of the National Institute of Standards and Technology
S3 Comparison with the Integral-Breadth Methods
Knowing the specimen integral breadths simpli- fied methods can be applied In Sec 212 we re- viewed multiple-line and single-line integral- breadth methods We shall compare the simplified multiple-line methods [Eqs (23) (24) and (30)] and the single-line method [76] [Eqs (29) and (30)] with results obtained for silver tungsten and La2-xSrxCu04 powders (Tables 3 and 5) We did not compare with the multiple-line Voigt-function method [26] because it was shown in Sec 44 that it is incompatible with the Warren-Averbach analy- sis In Table 6 integral breadth Pi was computed according to Eq (11) This value was compared with )8A integral breadth computed from Fourier coefficients [58]
i8A=- laquo3 2^(L)
(74)
Results obtained by the Warren-Averbach analysis are significantly smaller for both size and strain Integral-breadth methods give the upper limit for strain so comparison is limited Considering the approximation e = 125e^(L))^ [138] with L=(D)v2 or L=(D)s2 strains resemble more closely than crystallite sizes It must be noted how- ever that this approximation makes sense only in the case of pure-Gauss strain broadening Benedetti et al [106] reported excellent agreement for both size and strain using Warren-Averbach and Cauchy-Gauss [Eq (24)] methods Results from Table 6 on the contrary indicate that the Gauss-Gauss approximation gives values closest to the Warren-Averbach method for crystallite sizes whereas the Cauchy-Gauss and especially the Cauchy-Cauchy approximation tend to give too large values For strain the trend is opposite The Cauchy-Cauchy approximation resembles most
Table 6 Comparison of results obtained with the integral-breadth methods Cauchy-Cauchy (C-C) Cauchy-Gauss (C-G) Gauss- Gauss (G-G) and single-line (S-L) analysis
Specimen hkl PiXKP PAXKP ltigt)v (Z)gt(A) (e^((DV2)gt2 eXlO^ (A-) (A-0 (A) C-C C-G G-G S-L xlO^ C-C C-G G-G S-L
W untreated 110 220
0259 0247
0259 0247
3500 3700 3810 3810 14500 4040
008 -001 -003 -005 024 0
W ground 110 220
125 204
125 205
1030 2240 1450 1220 940 550
054 090 093 105 045 032
Ag untreated 111 2
0600 0901
0600 0900
2000 3340 2390 2190 1670 1110
024 035 039 095 0 0
200 124 124 1030 2270 1470 1230 810 047 082 085 095 0 400 204 204 490 0
Ag ground 111 222
198 352
200 352
650 2080 1240 910 530 280
095 179 182 197 048 0
200 403 406 350 9380 4780 1320 260 180 405 405 408 082 400 803 803 120 0
Lai85Sroi3Cu04 004 006
0657 0881
0650 0880
2000 5230 3290 2660 1970 1140
049 076 078 088 044 0
110 119 119 940 1240 1000 970 840 044 052 064 080 0 220 158 158 630 0
La2Cu4 004 006
0988 132
0998 131
1200 2980 1940 1630 1490 760
08 107 112 127 081 0-
020 143 142 760 1200 910 860 1240 07 079 090 110 114 040 198 200 510 016 200 126 124 810 810 810 810 1250 03 002 011 015 089 400 1S 126 830 014
Not possible to evaluate because of too small Gauss integral breadth
342
Volume 98 Number 3 May-June 1993
Journal of Research of the National Institute of Standards and Technology
closely a Warren-Averbach method These results concur with the Klug and Alexander [24] compari- son of the published size and strain values obtained by Warren-Averbach (Stokes) and integral-breadth methods However for x-ray diffraction the Cauchy-Gauss assumption for the size-strain broadening is theoretically and experimentally more favored thpoundm the other two models The fact that the Gauss-Gauss method for crystallite size and the Cauchy-Cauchy method for strain give more realistic results may mean that the presump- tion that size and strain broadening are exclusively of one type is an oversimplification
The single-line method seems much less reliable If Gaussian breadth is very small no information about strain is obtained Moreover second-order reflections give much lower values of both size and strain than do basic reflections However if multi- ple reflections are not available the single-line method can give satisfactory estimations
54 Reliability of Profile Fitting
The profile fitting of a cluster of even severely overlapping peaks can be accomplished with a low error and excellent fit of total intensity But how reliable is information obtained about separate peaks in the cluster In the fitting procedure it is possible to put constraints on the particular profile parameter to limit intensity position and width of the peak If anisotropic broadening or different phases are present constraints may not be realistic Morever acceptable results can be obtained even using a different number of profiles in refinement [4] Hence the first condition for the successful ap- plication of this method is knowledge of actual phases present in the sample and their crystalline structures
In this regard two powders were measured or- thorhombic Lai94Sroo6Cu04 has a slightly distorted K2NiF4-type structure (space group Bmab a =53510(2) A b =53692 A(2) c = 131931(7) A) and tetragonal Lai76Sro24Cu04 (space group I4mmm a =37711(3) A c = 132580(8) A) Data were collected for each specimen separately and for a specimen obtained by mixing the same pow- ders Because diffracted intensity of each phase was lower for the mixture counting time was pro- portionally increased to obtain roughly the same counting statistics Figure 19 shows two partially separated orthorhombic (020) (200) and (040) (400) peaks overlapped with tetragonal (110) and (220) reflections During the profile fitting of the mixed powders (200) orthorhombic peak tended to disappear on account of neighboring (020) and
(110) reflections Its intensity was constrained to vary in range plusmn 30 of (020) peak intensity which can be justified if the crystallographic structure is known
60
-60
345
345
335 29 (deg)
345
Fig 19 (upper) Lai76Sro24Cu04 (110) peak (middle) Lai94Sroo6Cu04 (020) and (200) peaks (lower) (110) (020) and (200) peaks
Table 7 contains results of fitted specimen-Voigt functions as well as size and strain values obtained by the analysis of broadening Comparing integral breadths of the starting and mixed powders some profiles change from more Cauchy-like to Gauss- like and vice versa This is especially evident for the (400) reflection meaning that accurate deter- mination of the profile tails is indeed affected in the cluster of overlapping peaks However integral breadth does not change significantly so results of
343
Volume 98 Number 3 May-June 1993
Journal of Research of the National Institute of Standards and Technology
Table 7 Comparison between two specimens run separately and mixed togetlier
Specimen hkl 2Hdeg) )3cO PoO DUA) (D)v(A) (e2laquoD)v2))laquoxlO
Lai76Sroj4CuOr 110 3369 0058(6) 0094(7) 780(60) 850(60) 10(1) 220 7073 022(2) 013(2)
LaiMSro(KiCu04 020 3342 0084(9) 055(14) 500(90) 1000(200) 07(1) 040 7012 010(2) 014(1) 200 3353 00216(85) 0061(8) 1100(100) 1200(100) 03(1) 400 7040 0026(11) 0088(8)
Mix 110 3367 0083(21) 0064(14) 800(300) 1200(300) 08(3) Lai76Sro24Cu04 220 7072 019(7) 013(4)
+ 020 3343 0066(35) 0070(23) 800(300) 1000(300) 07(4) Lai94Sroo6Cu04 040 7012 0116(93) 013(5)
200 3354 0024(156) 0071(61) 900(700) 1000(600) 04(12) 400 7041 011(2) 0003(320)
the multiple-line methods are not much influenced On the contrary the single-line method gives quite different results This may support the conclusion of Suortti Ahtee and Unonius [43] that the Voigt function fails to account properly for size and strain broadening simultaneously if only Cauchy integral breadth determines crystallite size
Table 7 shows that the results of Warren- Averbach analysis of starting and mixed powders agree in the range of standard deviations How- ever errors are much larger especially for the hid- den (200)-(400) reflections From Eq (62) it follows that more counts (longer counting times) and more observables (smaller step-size) would lower standard deviations Therefore in the case of highly overlapping patterns to obtain desirable ac- curacy much longer measurements are needed al- though that will not change the fact that higher overlapping implies intrinsically higher errors of all refinable parameters To further minimize possible artifacts of the fitting procedure it is desirable to include in the analysis as many reflections in the same ciystallographic direction as possible
55 Remarks
By modeling the specimen size and strain broad- ening with the simple Voigt function it is possible to obtain domain sizes and strains that agree with experiment and show a logical interrelationship Furthermore the Voigt function shows the correct 1A(26y asymptotic behavior of peak tails as ex- pected from kinematical theory [139] However if the specimen profile is significantly asymmetric (because of twins and extrinsic stacking faults [140 59]) or the ratio FWHM^ is not intermediate to the Cauchy (2Tr) and Gauss (2(ln27r)^) functions then the Voigt function can not be applied [25]
Suortti Ahtee and Unonius [43] found good over- all agreement by fitting the Voigt function to the pure-specimen profiles of a Ni powder deconvo- luted by the instrumental function However more accurate comparison is limited because of unavoid- able deconvolution ripples of specimen profiles Furthermore the Voigt function might not be flex- ible enough to model a wide range of specimen broadening as well as the different causes of broadening Therefore the question whether the Voigt function can satisfactorily describe complex specimen broadening over the whole 20 range in a general case needs further evaluation
This method of Fourier analysis with the as- sumed profile-shape function is most useful in cases when the classical Stokes analysis fails there- fore when peak overlapping occurs and specimen broadening is comparable to instrumental broaden- ing It was shown that for a high degree of peak overlapping the fitting procedure can give unreli- able results of Gauss and Cauchy integral breadths that is the peak can change easily from predomi- nantly Cauchy-like to Gauss-like and contrary This can lead to illogical values of size-integral and strain-integral breadths according to Eqs (52) (53) (54) and (55) and to irregularities in the be- havior of Fourier coefficients for large L Simulta- neously if the size-broadened profile has a large Gauss-function contribution the hook effect will occur However volume-weighted domain sizes D)y and MSS eL)) for small L are much less affected because they rely on both Cauchy and Gauss parts of the broadened profile Any integral- breadth method that attempts to describe the size and strain broadening exclusively by a Cauchy or Gauss function in this case fails completely For specimens with lower crystallographic symmetry
344
Volume 98 Number 3 May-June 1993
Journal of Research of the National Institute of Standards and Technology
when many multiple-order reflections are avail- able but the peaks are overlapped it is therefore desirable to include in the analysis as many reflec- tions as possible to minimize the potential artifacts of the fltting process
6 Analysis of Superconductors 61 (La-M)2Cu04 Superconductors
Bednorz and Miiller [16] found the first high- temperature oxide superconductor in the La-Ba- Cu-O system Soon after substituting Ba with Sr and Ca Kishio et al [17] found superconductivity in two similar compounds Later many compounds with much higher transition temperatures (Tc) were found The (La-M)2Cu04 system remains favorable for study because the cation content responsible for the superconductivity is easier to control and measure than the oxygen stoichiometry Also this system provides a wide range of substitutional cation solubility in which the tetragonal K2NiF4- type structure is maintained Compared with much- studied Y-Ba-Cu-O this structure is simpler because it contains only one copper-ion site and two oxygen-ion sites
The undoped compound La2Cu04 is orthorhom- bic at room temperature It becomes superconduct- ing either with cation substitution on La sites or increased oxygen content to more than four atoms per formula unit Doping with divalent cations in- creases the itinerant hole carriers in the oxygen- derived electron band [141] which probably causes the superconductivity However different dopants influence the transition temperature Tc Although the unit-cell c-parameter simply reflects ionic dopant size [142] the in-plane unit-cell parameter (and accordingly the Cu-0 bond length) correlates with Tc for different dopants and for different dop- ing amounts [142 143]
LaiB5MouCu04 (M = Ba Ca Sr) have a tetrago- nal K2NiF4-type structure space group lAlmmm with four atoms in the asymmetric unit [117] One site is occupied with La partially substituted with dopant ions (Fig 20) La2Cu04 is orthorhombic at room temperature The best way to correlate these two structures is to describe La2Cu04 in space group Bmab the c axis remains the same tetrago- nal [110] and [110] directions become [010] and [100] orthorhombic axes and size of the unit cell is doubled [144]
Figure 21 shows parts of the x-ray diffraction patterns observed and refined of Lai85Moi5Cu04 (M = Sr Ba Ca) and La2Cu04 Refined lattice
parameters are given in Table 8 Table 9 shows resuhs of the line-broadening analysis Relatively
La(BaCaSr)
0(2)
0(1)
Fig 20 Ciystal structure of (La-M)2Cu04 showing one unit cell
300 JUU
(b)
200
100
U 0 M J Js-r-^
30
-30
300
40 41 42 43 44 45 40 41 42 43 44 45 29 (deg) 29 (deg)
mdashA-
gt t 200
Z
F-
- 100
(c)
f V kgt ii I 40 41 42 43 44 45 40 41 42 43 44 45
e (deg) ^^ 26 (deg)
-30 wwX mdash Wlaquo-
Fig 21 Diffraction patterns of LaiH5Moi5Cu04 specimens (a) M=Sr (b) M = Ba (c)M = Ca (d) M = U
345
Volume 98 Number 3 May-June 1993
Journal of Research of the National Institute of Standards and Technology
Table 8 Lattice parameters and T^ at zero resistivity (Ac method at 10 Ma current)
Specimen a (A) bk) c(A) rc(K)
Lairaquo5Sroi5Cu04 377814(7)
Lairaquo3Baoi3Cu04 37846(2)
LaiiijCaoi5Cu04 37863(7)
La2Cu04 53558(2) 54053(2)
231(2) 36
288(4) 28
17(2) 19
1451(8)
Table 9 Results of line-broadening analysis for (La-M)2Cu4 specimens
Specimen hkl PcO PoO (DUk) (Iraquo)(A) lte^((D)2))
Lai(laquoSroj5Cu04 004 006
0046(4) 0083(5)
0024(8) ltio-
1700(300) 2000(200) 000049(9)
110 0110(5) ltio- 470(20) 940(20) 000044(6) 220 0171(9) ltio-
Lai85Baoi3Cu04 004 006
0049(6) 0110(7)
0076(6) 0089(9)
1100(200) 1100(100) 00011(2)
110 0087(4) 000042(6) 560(20) 1110(20) 000024(5) 220 0116(3) ltio-5
Laiji5Caoi5Cu04 004 006
0120(13) 0146(12)
0032(22) 0033(27)
440(70) 780(90) 00007(4)
110 0045(25) 0200(19) 340(30) 360(20) 00013(2) 220 0343(22) ltio-
La2Cu04 004 006
0061(8) 0124(7)
0045(9) ltio-
1100(100) 1200(100) 00008(1)
020 0074(10) 0078(10) 680(50) 760(50) 00007(2) 040 0210(30) 0026(81) 200 0074(8) 0061(10) 680(50) 810(50) 00003(3) 400 0130(10) 0023(95)
weak peak broadening was observed which can not be attributed to the proximity of the phase trans- formation Lai85SroisCu04 is tetragonal down to = 170 K [145] Lai85Baoi5Cu04 to 140 K [146147] and Lai85Caoi5Cu04 to 130 K [148] Another possi- ble reason for peak broadening might be continu- ous compositional variations in dopant content The scanning Auger microprobe analysis of La2-SrtCu04 compounds [149] showed that grain- boundary segregation of Sr is weak and limited to a narrow region near the grain surface In the case of the separation of two phases with different Sr con- tent and similar lattice parameters asymmetry of some reflections would be observed [150] More- over in the case of compositional inhomogeneity microstrains eL)) would be roughly independent of the averaging distance L in the grains [151] therefore distribution of strains would be Gaus- sian For all specimens microstrain behavior is identical it decreases linearly with distance L
Rothman and Cohen [115] showed that such be- havior of microstrains is caused by dislocations that might arise during grinding Assuming the same applied stress microstrain would be approximately inversely proportional to the elastic moduli of these materials If mean microstrain is defined as the arithmetic average of strains for the [001] and [110] directions results agree with values of the Youngs moduli for polycrystalline La2Cu04 Lai85Moi5Cu04 (M = Sr Ba Ca) [152] However other factors may contribute to the microstrain Coordination-6 ionic radii of La^+ Sr Ba^+ Ca^+ are 106 116 136 100 A respectively [153] Substitution of La with ions of different sizes affects the lattice parameter [142] and may cause much larger strains in the [001] direction when some of the ions are replaced with Ba^ than with Sr^ in accord with results in Table 9 Substitution of Ca^^ ions produces an entirely different effect microstrains in the [110] direction are larger This may be explained by
346
Volume 98 Number 3 May-June 1993
Journal of Research of the National Institute of Standards and Technology
comparing effects of substitutional ions on the unit-cell a -parameter The Ba-doped specimen has a larger a-parameter than the Sr-doped but the Ca-doped a-parameter is largest although Ca^^ has the smallest ionic size This should increase the cell distortion in the a-b plane
Table 9 reveals high anisotropy in these materi- als consistent with other physical properties such as thermal expansion [154] and upper critical mag- netic field [155] Differences of domain sizes might arise from a layered structure in the [001] direction and consequently easy incorporation of stacking faults between regularly stacked layers The stack- ing-fault and twin-fault probabilities can be esti- mated from the average surface-weighted domain sizes [59]
^ = TAN + cf1fun(aa) (75) m im - (D)
Here c is a constant for the particular [hkl] direction and fun(a a) a linear combination of stacking-fault probability and twin-fault probability a The exact form of Eq (75) was derived only for the cubic and hexagonal crystal structures On con- dition that the true domain dimension D is isotropic or so large that the second term of Eq (75) dominates a linear function of stacking-fault and twin-fault probability is
fun(aa) = c( 1
) (76) Zgt)J (Dgttrade
Here c denotes a constant that depends only on geometrical factors and is the same for all three doped compounds
Figure 22 shows a possible correlation between Tc and fault-defect probabilities computed from TEM observations of La2-jcSrCu04 revealed that stacking-fault density increased with Sr content up to jc = 015 [156] That study suggests that a shear mechanism forming the fault-boundary dislocations implies oxygen vacancies andor cation deficiency We did not measure oxygen content but neutron- diffraction studies showed that oxygen deficiency starts to appear at much higher Sr content [157] However the increase of fault probability with the simultaneous decrease of microstrain in Fig 22 supports the assumption that defects are intro- duced to accommodate lattice strains [156] A simi- lar increase in Te was found in Y2Ba4Cu802o-laquo thin films [158] Compounds with asymmetric broad- ened and shifted peaks showed higher Tc which
was attributed to stacking faults Although extrinsic stacking faults may cause asymmetric peak broad- ening [140] it is probably caused by twinning Twinning in La-M-Cu-0 materials is less abundant than in Y-Ba-Cu-O compounds but it was ob- served in (La-Sr)2Cu04 monocrystals on (110) planes [159] In the profile-fitting procedure peak asymmetry is incorporated only in the instrumental function therefore we could not model asymmetric peak broadening However any significant asym- metry of the specimen profile would cause an un- even fit of low-angle and high-angle sides of peaks which was not observed This gives much more im- portance to stacking faults in Eq (76)
Fig 22 Arithmetic average of [110] and [001] root-mean- square strains and linear function of stacking-fault and twin- fault probabilities as a function of Tc
In Fig 22 average microstrains defined as the arithmetic average of [001] and [110] directions correlate inversely with Tc However we did not find a correlation of Tc and microstrains in a partic- ular direction [001] microstrains simply reflect dif- ference in size of dopant and host La^ ions (see Table 9)
In La2Cu04 (OkO) reflections are significantly broader than (hOO) This has also been observed in low-temperature orthorhombic Lai85Sroi5Cu04 and Lai85Baoi5Cu04 [160] and explained by either stacking faults or possible lower symmetry Our results reveal that domain sizes (D) have identical values for [010] and [100] directions (Table 9) From Eq (76) it follows that stacking-fault proba- bilities in these directions have the same values However microstrains in the [010] direction are roughly twice as large as in the [100] direction which is responsible for the different broadening In the case of doped La2Cu04 compounds different microstrains might be caused by oxygen
347
Volume 98 Number 3 May-June 1993
Journal of Research of the National Institute of Standards and Technology
vacancies ordered along one direction in the a-b plane similar to effects found in YBa2Cu307-laquo However undoped La2Cu04 is not expected to have significant o^Qgen deficiency Other possibili- ties are lower ciystallographic symmetry andor La vacancies although they were not reported for this system but La deficiency was found in an La2Co04 compound [161]
We can conclude that lattice strains and incoher- ently diffracting domain sizes confirm high an- isotropy in these materials This simple approach however does not allow unambiguous identifica- tion of the strains origin Probably the strains originate from dislocations and from different sizes of host and dopant ions Domain sizes of all com- pounds are larger in the c-direction than in the a-6 plane This indicates existence of stacking faults and twins However because estimated errors are relatively large and only three materials were stud- ied the possible connection between stacking faults and 7c needs further study
62 Bi-Cu-O Superconductors
Among the high-Tc superconductors the Bi- Cu-O compounds appear intriguing especially because their incommensurate structure modula- tion remains incompletely understood [162 163] The crystal structure consists of perovskite-like SrO-(Cu02Ca)mi-Cu02-SrO layers separated by NaCl-like BiO double layers (see Fig 23 [164]) The number m of Cu02 layers alters the supercon- ducting transition temperature Tc (for m = 12 and 3 rclaquo10 90 and 110 K respectively) This two- dimensional layered structure makes these materi- als highly anisotropic and favours the creation of defects
Bulk sintered specimens showed relatively weak peak broadening Moreover the diffraction pat- terns contained many overlapping peaks because the compound crystallizes in an orthorhombic low- symmetry space group A2aa [165] and incommen- surate modulation gives superlattice reflections All patterns revealed a strong [001] texture (Fig 24) making reflections other than (001) difficult to ana- lyze The lattice parameters vary depending on the exact compound stoichiometry and processing his- tory but characteristically they have almost identi- cal a and b parameters and large c parameter fl =54095 A 6=54202 A c =309297 A for Bi2Sr2CaCu208 (Bi-2212 [166] and A =5392 A b =5395 A c =36985 A for (BiPb)2Sr2Ca2Cu30io (BiPb-2223) [165] Thus we treated (hOO) and (0^0) reflections as single peaks Table 10 gives the
results for three specimens Bi-2212 (BiPb)2 (SrMg)2(BaCa)2Cu30io (BiPbMgBa-2223) which were one-phase specimens and BiPb-2223 con- taining approximately equal amounts of 2212 and 2223 phases The in-plane lattice parameters of 2212 and 2223 phases differ little hence only the [00] directions of the mixed-phase specimen were evaluated
b^ (c)
Fig 23 Average crystal structure of Bi2Sr2Cam-iCum04+2m for (a) m = 1 (b) w =2 (c) m =3 [164]
35
-35
42 44 46 48 50 52 54 56 58 60 62 26 (deg)
^ ^^^MK^Aa^Ndllaquop
Fig 24 Part of BiPbMgBa-2223 refined pattern There are 48 fundamental reflections in this region
Interpretation of the results in the case of these complicated compounds must be considered care- fully Microstrains are probably caused by disloca- tion arrays However substitution of different-sized ions and vacancies would also contribute to the strains as would other kinds of disorder especially
348
Volume 98 Number 3 May-June 1993
Journal of Research of the National Institute of Standards and Technology
Table 10 Results of line-btoadening analysis for Bi-Cu-O supreconductors
Specimen Phase hkl (A)
eD)sa)y^
Bi-2212 2212 008 0012
0163(8) 022(3)
001(6) 005(6)
420(80) 00021(6)
020+200 0104(4) ltio-^ 580(30) 00007(1) 040+400 018(2) 00004(6300)
BiPbMgBa-2223 7773 0010 0020
0097(1) 021(2)
00002(1700) 0007(150)
770(60) 00012(1)
020 + 200 012(27) 013(10) 380(430) 00009(71) 040 + 400 015(95) 021(33)
BiPb-73 2212 008 0012
023(2) 025(5)
0002(350) 0001(1000)
220(30) 00013(26)
2223 0010 0020
022(8) 023(99)
0092(67) 018(47)
230(190) 00012(197)
Stacking faults and twins Table 10 shows larger strains in the [001] direction that in the basal plane This can be explained by stacking disorder along the c-axis which was frequently observed in electron-diffraction patterns as streaking [167 168] Easy incorporation of stacking faults is possi- ble because of the two-dimensional weak-bonded layers (BiO double layers are spaced about 3 A apart) The difference in microstrain between in- plane and the c-direction is much smaller for the BiPbMgBa-2223 phase probably because Pb low- ers the faulting by stabilizing the higher-Tc 2223 phase [167] For the BiPb-2223 specimen with two phases there are two possibilities Either the speci- men consists mainly of a mk of two kinds of one- phase grains or both phases occur within the same grains The second possibility was confirmed exper- imentally [169 170] and our results concur be- cause microstrain in the 2212 phase is much smaller than in the one-phase Bi-2212 specimen Processing conditions and cation content probably favour development of the macroscopic inter- growth of both phases within the grains that is microscopic defects grow to sufficiently large re- gions to give a diffraction pattern of another phase with the different number of Cu02 layers As a re- sult strain is relieved and both strains and domain sizes being quite different in one-phase specimens tend to equalize
For the Bi-Cu-O specimens the mean surface- weighted domain sizes are generally smaller than for (La-M)2Cu04 compounds Therefore the com- putation of the stacking- and twin-fault probabili- ties by using Eq (75) may be wrong It would be very instructive to compare the different broaden-
ing of satellite and fundamental reflections which indicates a more pronounced stacking disorder in the modulated structure [171]
In summary we found that for both Bi-2212 and BiPbMgBa-2223 superconductors the c-axis strain exceeds the in-plane strain The BiPb-2223 specimen containing both 2212 and 2223 phases within the single grains shows smaller incoherently diffracting domains and lower c-axis strain than the one-phase specimens This fact may direct us to- ward the mechanism of the second-phase forma- tion in these materials
63 Remarks
It was shown that this particular method of the line-broadening analysis can give information about the size of incoherently diffracting domains and lattice strains in (La-M)2Cu04 and Bi-Clu-O superconductors Moreover results show high an- isotropy of both size and strain parameters as one may expect because of the layered structure of all superconducting cuprates Generally structural line broadening is not large that is a result of rela- tively large domain sizes (200-2000 A) and small strains (002-02) It is interesting to compare these values with the published results for YBa2Cu307-laquo (isotropic strains of 023 [77] and 005-03 [82]) Although the different materi- als were studied they seem too large especially be- cause they are the average of strains in different directions
The main drawback of the line-broadening the- ory is the uncertainty about the origins of the line broadening that is it is difficult to distinguish the main effects responsible for the broadening For
349
Volume 98 Number 3 May-June 1993
Journal of Research of the National Institute of Standards and Technology
the novel superconductors particularly the numer- ous defects (substitutions vacancies stacking faults dislocations and similar) can occur simulta- neously which makes it very difficult to determine their individual contributions Furthermore the crystal structures of most novel superconductors are relatively complicated The average structure has mostly a slightly distorted tetragonal symmetry very similar a and b lattice parameters and a large c parameter but c=36 for YBa2Cu307-laquo for in- stance This results in a large number of overlap- ping peaks and consequently in large errors of all results This showed especially in the case of Bi-Cu-O superconductors (see Table 10) Follow- ing the discussion of reliability of profile fitting in Sec 54 it would be desirable to include more than two reflections in the analysis of broadening but higher-order peaks are usually too weak and over- lapped One way to partially solve this problem would be a whole pattern fitting [172 173] and Rietveld structure refinement [23] in terms of size and strain parameters This requires an accurate preset function to model specimen broadening and precise definition of angular dependence of size and strain parameters The Rietveld programs that model the line broadening in terms of size and strain parameters are based either on the simpli- fied integral-breadth methods [78 95] or on the single-line method [174]
7 Conclusions
A method for analyzing the pure-specimen (structural) broadening of x-ray diffraction line profiles is proposed By modeling the specimen size and strain broadenings with the simple Voigt func- tion it is possible to obtain domain sizes and strains that agree with experiment and show a logi- cal interrelationship Furthermore some common consequences and problems in the Fourier-method analysis follow easily The specimen function is convoluted with the instrumental function to match the observed x-ray diffraction-line profile This avoids the Stokes deconvolution method thus al- lowing analysis of patterns with highly overlapping peaks and weak structural broadening Therefore the method was applied to some novel high-Tc superconductors We reached the following conclu- sions
(i) Surface-weighted domain size depends only on the Cauchy integral breadth of the size-broad- ened profile
(ii) The hook effect occurs when the Cauchy-content of the size-broadened profile is un-
derestimated that is for ^sc(n2)^3sG Usually this happens when the background is estimated too high so the long tails of the Cauchy function are prematurely cut off
(iii) It also follows from conclusion (ii) that the volume-weighted domain size can not be more than twice the surface-weighted domain size (limiting value D)v=2D)i is obtained for the pure-Cauchy size-broadened profile) Minimum value for D)J (D)j should not be less than -131
(iv) If the distortion coefficient is approxi- mated with a harmonic term this leads exactly to the Warren-Averbach method of separation of size and strain broadenings
(v) In that case mean-square strains decrease linearly with the distance L
(vi) It is possible to evaluate local strain ((e^(0))^) only in the case of pure-Gauss strain broadening Then root-mean-square strain is inde- pendent of the distance L and related to the upper limit of strain obtained from the integral breadth of the strain-broadened profile
(vii) If strain broadening is not described exclu- sively with the Gauss function the multiple-line Voigt integral breadth and Warren-Averbach analyses can not give the same results for volume- weighted domain size although D)v is defined identically in both approaches because the appar- ent strain -q = pdeg(29)cot9 is not angular- independent
(viii) Smooth size coefficients give column- length distribution functions without oscillations and make possible a computation of volume- weighted average domain sizes up to ~5000 A
(ix) Comparison with the simplified integral- breadth methods in most cases has shown not large but systematic discrepancy of results indicat- ing that size and strain broadening can not be accu- rately modeled by a single Cauchy or Gauss function Moreover the application of the single- line method is much less reliable and it should not be used where multiple reflections are available
(x) The knowledge of all phases present in the sample and their crystallographic structure is re- quired to successfully fit a cluster of overlapping peaks Although it is very difficult to accurately de- termine the Cauchy-Gauss ratio of an overlapped peak final results of domain size and strain are much less affected Therefore connecting the crys- tallite size exclusively with the Cauchy content and strain with the Gauss content of a specimen profile might be doubtful
(xi) Evaluated errors of domain sizes and strains increase substantially with the degree of
350
Volume 98 Number 3 May-June 1993
Journal of Research of the National Institute of Standards and Technology
peak overlapping Hence for complicated patterns very accurate measurements are necessary and one needs to analyze as many reflections in the same crystallographic direction as possible
(xii) Line-broadening analysis of (La-M)2Cu04 and Bi-Cu-O compounds confirms high anisotropy in these materials
(xiii) Strains in (La-M)2Cu04 probably origi- nate from dislocations and from different sizes of host and dopant ions
(xiv) Stacking-fault probability in (La-M)2Cu04 (M = Ba Ca Sr) increases with increasing Tc whereas the average strain decreases
(xv) In La2Cu04 different broadening of (lOO) and (OfcO) reflections is not caused by stacking faults
(xvi) All Bi-Cu-0 superconductors show larger strain in the c-direction than in the a-b plane which can be explained by stacking disorder along the [001] direction
(xvii) In the specimen with approximately equal amounts of Tl-2212 and TlPb-2223 phases it is likely that a secondary phase develops by the growth of the microscopic faulted regions of the primary phase
Acknowledgments
I am thankful to Dr Harry McHenry for his support and especially to Dr Hassel Ledbetter for his wise guidance and most useful help during my stay at NIST I am also indebted to my home insti- tution the Faculty of Metallurgy of the University of Zagreb for allowing me the leave of absence at NIST
8 References
[1] W Friedrich P Knipping and M v Laue Ann Physik 41 971 (1912)
[2] H M Rietveld Acta Cryst 22 151 (1967) [3] H M Rietveld J Appl Cryst 2 65 (1969) [4] S A Howard and K D Preston in Modern Powder Dif-
fraction Vol 20 The Mineralogical Society of America Washington DC (1989) p 217
[5] D Taupin J Appl Cryst 6 266 (1973) [6] T C Huang and W Parrish Appl Phys Lett 27 123
(1975) [7] M K Wu J R Ashburn C J Torng P H Hor R L
Meng L Gao Z J Hwang Y Q Wang and C W Chu Phys Rev Lett 58 908 (1987)
[8] D Shi MRS Bull 16 37 (1991) [9] D Larbalestier Phys Today 44 74 (1991)
[10] J C Phillips Phys Rev B 4512647 (1992) [11] B Raveau Phys Today 45 53 (1992) [12] A J Millis and K M Rabe Phys Rev B 38 8908 (1988)
[13] F Guinea Europhys Lett 7 549 (1988) [14] C P Dhard and P Singh in Proc Int Symp High-Temp
Supercond Jaipur India Oxford amp IBH Publishing New Delhi (1988) p 271
[15] J D Jorgensen Phys Today 44 34 (1991) [16] J G Bednorz and K A Muller Z Phys B 64 189
(1986) [17] K Kishio K Kitazawa S Kaube I Yasuda N Sugii H
Takagi S Uchida K Fueki and S Tanaka Chem Lett 429 (1987)
[18] J D Jorgensen B Dabrowski S Pei D G Hinks L Soderholm B Morosin J E Venturini and D S Ginley Phys Rev B 38 11337 (1988)
[19] J R Clem Phys Rev B 43 7837 (1991) [20] M Paranthaman M Foldejiki D Balzar H Ledbetter
A J Nelson and A M Hermann submitted to Phys Rev B
[21] A R Stokes Proc Phys Soc Lond 61 382 (1948) [22] B E Warren and B L Averbach J Appl Phys 23 497
(1952) [23] R Delhez Th H de Keijser and E J Mittemeijer in
Accuracy in Powder Diffraction S Block and C R Hub- bard eds Natl Bur Stand (US) Special Publication 567 (1980) p 213
[24] H P Klug and L E Alexander X-ray Diffraction Proce- dures 2nd Edition John Wiley New York (1974) p 661
[25] J I Langford J Appl Ciyst 11 10 (1978) [26] J I Langford in Accuracy in Powder Diffraction S
Block and C R Hubbard eds Natl Bur Stand (US) Special Pubication 567 (1950) p 255
[27] R Delhez Th H de Keijser and E J Mittemeijer Fre- senius Z Anal Chem 312 1 (1982)
[28] A J C Wilson Proc Phys Soc Lond 80 286 (1962) [29] A J C Wilson Proc Phys Soc Lond 81 41 (1963) [30] L P Smith Phys Rev 46 343 (1934) [31] H C Burger and P H van Cittert Z Phys 79 722
(1932) [32] S Ergun J Appl Ciyst 1 19 (1968) [33] R Croche and L Gatineau J Appl Ciyst 10479 (1977) [34] L H Schwarz and J B Cohen Diffraction from Materi-
als Academic Press New York (1977) p 391 [35] R Delhez Th H de Keijser E J Mittemeijer and J I
Langford J Appl Cryst 19 459 (1986) [36] R Delhez Th H de Keijser E J Mittemeijer and J I
Langford Aust J Phys 41 213 (1988) [37] R A Young and D B Wiles J Appl Cryst 15 430
(1982) [38] W Voigt Stizungsber K Bayer Akad Wiss 42 603
(1912) [39] E E Whiting J Quant Spectrosc Radiat Transfer 8
1379 (1968) [40] G K Wertheim M A Butler K W West and D N E
Buchanan Rev Sci Instrum 111369 (1974) [41] M M Hall Jr V G Veeraraghavan H Rubin and P G
Winchell J Appl Cryst 10 66 (1977) [42] A Brown and J W Edmonds Adv X-Ray Anal 23 361
(1980) [43] P Suortti M Ahtee L Unonius J Appl Cryst 12 365
(1979) [44] T Sundius J Raman Spectrosc 1 471 (1973) [45] B H Armstrong J Quant Spectrosc Radiat Transfer 7
61 (1967) [46] J F Kielkopf J Opt Soc Am 63 987 (1973) [47] B P Asthana and W Kiefer Appl Spectr 36 250
(1982)
351
Volume 98 Number 3 May-June 1993
Journal of Research of the National Institute of Standards and Technology
[48] J P M de Vreede S C Mehrotra A Tal and H A Dijkerraan Appl Spectr 36 227 (1982)
[49] F R L Schoening Ada Ciyst 18 975 (1965) [50] P Scherrer Gott Nachr 2 98 (1918) [51] A R Stokes and A J C Wilson Proc Cambridge
Philos Soc 38 313 (1942) [52] A J C Wilson X-Ray Optics 2nd edition Methuen
London (1962) [53] S Leie and T R Anantharaman Proc Indian Acad
Sci Sect A H 261 (1966) [54] D Louer D Weigel and J I Langford J Appl Ciyst
5 353 (1972) [55] A J C Wilson J Appl Ciyst 2 181 (1969) [56] J I Langford and A J C Wilson J Appl Ciyst 11102
(1978) [57] A R Stokes and A J C Wilson Proc Phys Soc Lond
56174 (1944) [58] B E Warren and B L Averbach J Appl Phys 21 595
(1950) [59] B E Warren X-Ray Diffraction Addison-Wesley
Reading Massachusetts (1969) p 264 [60] B E Warren in Progress in Metal Physics Vol 8 Perg-
amon Press London (1959) p 146 [61] F Bertaut C R Acad Sci Paris 228 187 (1949) [62] N C Haider and C N J Wagner Acta Cryst 20 312
(1966) [63] D Balzar and H Ledbetter in Proceedings of the Accu-
racy in Powder Diffraction II Natl Inst Stand Technol (1992) p 37
[64] D Balzar and H Ledbeter J Appl Cryst 26 (1993) in press
[65] J N Eastabrook and A J C Wilson Proc Phys Soc Lond B 65 67 (1952)
[66] R S Smith IBM J Res Develop 4 205 (1960) [67] B Y Pines and A F Sirenko Soviet Physics Ciyst 715
(1962) [68] G B Mitra and N K Misra Acta Ciyst 22 454 (1967) [69] A Gangulee J Appl Ciyst 7 434 (1974) [70] J Mignot D Rondot Acta Met 231321 (1975) [71] J Mignot and D Rondot Acta Ciyst A 33 327 (1977) [72] R K Nandi H K Kuo W Schlosberg G Wissler J B
Cohen and B Crist Jr J Appl Ciyst 17 22 (1984) [73] M Zocchi Acta Ciyst A 36164 (1980) [74] P Ramarao and T R Anantharaman Trans Ind Ins
Metals 18 181 (1965) [75] R K Nandi and S P Sen Gupta J App Cryst 11 6
(1978) [76] Th H de Keijser J I Langford E J Mittemeijer and
B P Vogels J Appl Ciyst IS 308 (1982) [77] A Williams G H Kwei R B Von Dreele A C Lar-
son L D Raistrick and D L Bish Phys Rev B 37 7960 (1988)
[78] A C Larson and R B Von Dreele Los Alamos Na- tional Laboratory Report No LA-UR-86-748 (1988)
[79] J D Jorgensen D H Johnson M H Mueller J G Worlton and R B Von Dreele in Proceedings of the Conference on Diffraction Profile Analysis Cracow Poland (1978) p 20
[80] R B Von Dreele J D Jorgensen and C G Windsor J Appl Ciyst 15 581 (1982)
[81] P Thompson D E Cox and J B Hastings J Appl Ciyst 20 79 (1987)
[82] J P Singh R A Guttschow D S Kupperman J T Dusek and R B Poeppel in High Temperature Super-
conducting Compounds III S Whang A Gupta and E Ceilings eds TMS AIME Warrendale (1991) p 281
[83] M O Eatough D S Glnley and B Morosin Adv X- Ray Anal 33 145 (1990)
[84] E J Peterson P J Kung R E Muenchausen and D M Smith in Proceedings of the 41st Annual Denver Conference on Applications of X-Ray Analysis Colo- rado Springs Colorado (1992) p 74
[85] M Rand J I Langford and J S Abell submitted to J Cryogenics (1992)
[86] D Balzar J Appl Ciyst 25 559 (1992) [87] D Balzar H Ledbetter and A Roshko Physica C 185-
189 871 (1991) [88] D Balzar and H Ledbetter J Mater Sci Lett 111419
(1992) [89] D Balzar H Ledbetter and A Roshko Pow Diffr 8
(1993) in press [90] S Johnson M Gusraan D Rowcliffe T Geballe and J
Sun Adv Ceram Mater 2 337 (1987) [91] H Ledbetter S A Kim R B Goldfarb and K Togano
Phys Rev B 39 9689 (1989) [92] H Friedman Electronics 132 (1945) [93] W Parrish (ed) in Advances in X-Ray Diffractometry
and X-Ray Spectrography Centrex Publishing Company Eindhoven The Netheriands (1962)
[94] W Soller Phys Rev 24158 (1924) [95] S A Howard R L Snyder J Appl Ciyst 22 238
(1989) [96] G H Stout and L H Jensen X-Ray Structure Determi-
nation 2nd edition Wiley New York (1989) p 373 [97] D E Appleman and T Evans Jr Final Report 92-14
US Geological Survey Washington DC (1973) Avail- able as NTIS Document No PB-216188
[98] M U Cohen Rev Sci Instrum 6 68 (1935) [99] M U Cohen Rev Sci Instrum 7 155 (1936) [100] M H Mueller L Heaton and K T Miller Acta Ciyst
13 828 (1960) [101] R A Young P E Mackie and R B Von Dreele J
Appl Ciyst 10 262 (1977) [102] D B Wiles and R A Young J Appl Cryst 14 149
(1981) [103] J K Yau and S A Howard J Appl Ciyst 22 244
(1989) [104] S A Howard J K Yau and H U Anderson J Appl
Phys 65 1492 (1989) [105] S Enzo G Fagherazzi A Benedetti and S Poilizzi J
Appl Ciyst 21 536 (1988) [106] A Benedetti G Fagherazzi S Enzo and M
Battagliarin J Appl Cryst 21 543 (1988) [107] Th H de Keijser E J Mittemeijer and H C F Rozen-
daal J Appl Ciyst 16 309 (1983) [108] Y Zhang J M Stewart C R Hubbard and B Mo-
rosin Adv X-Ray Anal 33 373 (1990) [109] Y Wang S Lee and Y Ue J Appl Ciyst IS 35
(1982) [110] V N Selivanov and E F Smislov Zavod Lab 57 28
(1991) [Ill] A Guinier X-Ray Diffraction W H Freeman San
Francisco (1963) p 139 [112] M Wilkens J Appl Cryst 12119 (1979) [113] D Du and Y Wang Pow Diffr 2180 (1987) [114] A P Prudnikov Yu A Brychkov and O L Marichev
Integrals and Series Vol 1 Gordon and Breach Am- sterdam The Netheriands (1986) p 344
352
Volume 98 Number 3 May-June 1993
Journal of Research of the National Institute of Standards and Technology
[115] R L Rothman and J B Cohen J Appl Phys 42 971 (1971)
[116] T Adier and C R Houska J Appl Phys 50 3282 (1979)
[117] C R Houska and T M Smith J Appl Phys 52 748 (1981)
[118] S Rao and C R Houska Acta Ciyst A 4214 (1986) [119] J I Langford R Delhez Th H de Keijser and E J
Mittemeijer Ausi J Phys 41173 (1988) [120] J I Langfoid J Appl Cryst IS 315 (1982) [121] M J Turunen Th H de Keijser R Delhez and N M
van der Pers J Appl Ciyst 16176 (1983) [122] A J C Wilson Acta Ciyst 23 888 (1967) [123] A J C Wilson Acta Ciyst A 24 478 (1968) [124] A J C Wilson Acta Ciyst A 25 584 (1969) [125] G Gagliotti A Paoletti and F P Ricci Nucl Instrum
3 223 (1958) [126] J I Langford R J Cernik and D Louer J Appl
Ciyst 24 913 (1991) [127] J I Langford in Accuracy in Powder Diffraction II
preprint [128] A J C Wilson Mathematical Theory of X-Ray Powder
Diffractometiy Centrex Eindhoven The Netherlands (1963)
[129] J L Langford Prog Ciyst Growth and Charact 14185 (1987)
[130] T G Fawcett C E Crowder S J Brownell Y Zhang C R Hubbard W Schreiner G P Hamill T C Huang E Sabino J I Langford R Hamilton and D Louer Pow Diffr 3 209 (1988)
[131] W L Smith J Appl Ciyst 9187 (1976) [132] J L Langford and D Louer J Appl Ciyst 15 20
(1982) [133] Fl Popescu and L Benes Acta Ciyst A 33 323 (1977) [134] P PSuse^cu R MSnaila M Popescu and E Jijovici j
Appl Cryst 7 281 (1974) [135] P F Bley Y Calvayrac and M Fayard J Appl Ciyst
7 493 (1974) [136] B Moraweck Ph de Montgolfier and A J Renouprez
J Appl Ciyst 10191 (1977) [137] A Le Bail and D Louer J Appl Cryst 11 50 (1978) [138] D R Buchanan R L McCuUough and R L Miller
Acta Ciyst 20 922 (1966) [139] P Suortti and L D Jennings Acta Cryst A 33 1012
(1977) [140] J B Cohen and C N J Wagner J Appl Phys 33 2073
(1962) [141] A Bianconi J Budnick A M Flank A Fontaine P
Lagarde A Marcelli H Tolentino B Chamberland C Michel B Raveau and G Demazeau Phys Lett A127 285 (1988)
[142] K Fueki K Kitazawa K Kishio T Hasegawa S Uchida H Takagi and S Tanaka in Chemistiy of High- Temperature Superconductors D L Nelson M S Whittingham and T F George eds American Chemi- cal Society (1987) p 38
[143] T Fujita Y Aoki Y Maeno J Sakurai H Fukuba and H Fujii J Appl Phys 26 U68 (1987)
[144] R M Hazen in Physical Properties of High-rc Super- conductors Vol 2 D M Ginsberg ed World Scien- tific Singapore (1990) p 121
[145] J B Torrance A Bezinge A I Nazzal T C Huang S P Parkin D T Keane S J LaPlaca P M Horn and G A Held Phys Rev B 40 8872 (1989)
[146] J D Axe A H Moudden D Hohlwein D E Cox K
M Mohanty A R Moodenbaugh and Y Xu Phys Rev Lett 62 2751 (1989)
[147] T Suzuki and T Fujita Physica C 159 111 (1989) [148] T Fujita and Y Maeno in Superconducting Materials
JJAP Series 1 (1988) p 34 [149] A Roshko and Y-M Chiang J Appl Phys 66 3710
(1989) [150] D E Cox S C Moss R L Meng P H Hor and C W
Chu J Mater Res 31327 (1988) [151] B Crist and J B Cohen J Polym Sci 17 1001 (1979) [152] H Ledbetter S Kim and A Roshko Z Phys B 89275
(1992) [153] R D Shannon and C T Prewitt Acta Ciyst B 25 925
(1969) [154] M Lang H Spille F Steglich Y Hidaka T Murakami
and Y Endoh Physica C 162-1641037 (1989) [155] Y Hidaka and T Murakami Phase trans 15 241
(1989) [156] P L Gai and E M McCarron Science 247 553 (1990) [157] T Kamiyama I Izumi H Asano H Takagi S Uchida
Y Tokura E Takayama-Muromachi M Matsuda K Yamada Y Endoh and Y Hidaka Physica C 172 120 (1990)
[158] A Kapitulnik Physica C 153-155 520 (1988) [159] L A Muradyan V N Molchanov R A Tamazyan and
V I Simonov Physica C 162-164 536 (1989) [160] P Day M Rosseinsky K Prassides W I F David O
Moze and A Soper J Phys C 20 L429 (1987) [161] J T Lewandowski R A Beyerlein J M Longo and R
A McCauley J Amer Ceram Soc 69 699 (1986) [162] R Ramesh G van Tendeloo G Thomas S M Green
Y Mei C Jiang and H L Luo Appl Phys Lett 53 2220 (1988)
[163] J Schneck L Pierre J C Tolddano and C Daguet Phys Rev B 39 9624 (1989)
[164] O Eibl Physica C 168 215 (1990) [165] W Carrilo-Cabrera and W Gopel Physica C 161 373
(1989) [166] P Bordet J J Capponi C Chaillout J Chenavas A
W Hewat E A Hewat J L Hodeau M Marezio J L Tholence and D Tranqui Physica C 156189 (1988)
[167] R Ramesh K Remschnig J M Tarascon and S M Green J Mater Res 6 278 (1991)
[168] Z Hiroi Y Ikeda M Takano and Y Bando J Mater Res 6 435 (1991)
[169] Y Inoue M Hasegawa Y Shichi I Munakata M Ya- manaka S Hiyama and O Nittono J Mater Res 5 737 (1990)
[170] R Ramesh B G Bagley J M Tarascon S M Green M L Rudee and H L Luo J Appl Phys 67 379 (1990)
[171] X B Kan J Kulik P C Chow S C Moss Y F Yan J H Wang and Z X Zhao J Mater Res 5 731 (1990)
[172] G S Pawley J Appl Ciyst 13 630 (1980) [173] H Toraya J Appl Ciyst 19 440 (1986) [174] L Lutterotti and P Scardi J Appl Ciyst 23 246
(1990)
About the author Davor Balzar is with Faculty of Metallurgy of the University of Zagreb Sisak Croatia and was a Guest Researcher at fflST The National Institute of Standards and Technology is an agency of the Technology Administration US Department of Commerce
353
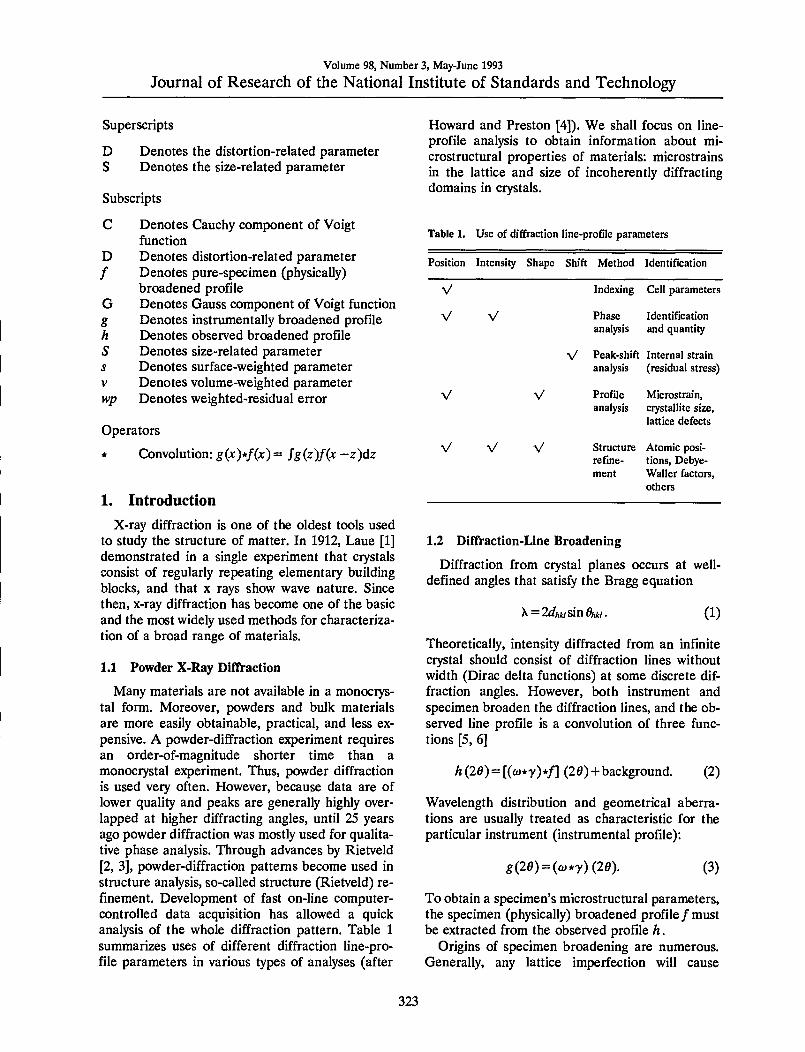
Volume 98 Number 3 May-June 1993
Journal of Research of the National Institute of Standards and Technology
Superscripts
D Denotes the distortion-related parameter S Denotes the size-related parameter
Subscripts
C Denotes Cauchy component of Voigt function
D Denotes distortion-related parameter Denotes pure-specimen (physically)
broadened profile G Denotes Gauss component of Voigt function g Denotes instrumentally broadened profile h Denotes observed broadened profile S Denotes size-related parameter s Denotes surface-weighted parameter V Denotes volume-weighted parameter wp Denotes weighted-residual error
Operators
Convolution g(x)f(x) = Sg(z)f(jc -z)dz
1 Introduction
X-ray diffraction is one of the oldest tools used to study the structure of matter In 1912 Laue [1] demonstrated in a single experiment that crystals consist of regularly repeating elementary building blocks and that x rays show wave nature Since then x-ray diffraction has become one of the basic and the most widely used methods for characteriza- tion of a broad range of materials
11 Powder X-Ray Diffraction
Many materials are not available in a monocrys- tal form Moreover powders and bulk materials are more easily obtainable practical and less ex- pensive A powder-diffraction experiment requires an order-of-magnitude shorter time than a monocrystal experiment Thus powder diffraction is used very often However because data are of lower quality and peaks are generally highly over- lapped at higher diffracting angles until 25 years ago powder diffraction was mostly used for qualita- tive phase analysis Through advances by Rietveld [2 3] powder-diffraction patterns become used in structure analysis so-called structure (Rietveld) re- finement Development of fast on-line computer- controlled data acquisition has allowed a quick analysis of the whole diffraction pattern Table 1 summarizes uses of different diffraction line-pro- file parameters in various types of analyses (after
Howard and Preston [4]) We shall focus on line- profile analysis to obtain information about mi- crostructural properties of materials microstrains in the lattice and size of incoherently diffracting domains in crystals
Table 1 Use of diffraction line-profile parameters
Position Intensity Shape Shift Method Identification
V Indexing Cell parameters
V V Phase Identification analysis and quantity
V Peak-shift Internal strain analysis (residual stress)
V V Profile Microstrain analysis crystallite size
lattice defects
V V V Structure Atomic posi- refine- tions Debye- ment Waller factors
others
12 Diffraction-Line Broadening
Diffraction from crystal planes occurs at well- defined angles that satisfy the Bragg equation
= 2dhkisin6iM (1)
Theoretically intensity diffracted from an infinite crystal should consist of diffraction lines without width (Dirac delta functions) at some discrete dif- fraction angles However both instrument and specimen broaden the diffraction lines and the ob- served line profile is a convolution of three func- tions [5 6]
h (26) = [io)y)f] (20) + background (2)
Wavelength distribution and geometrical aberra- tions are usually treated as characteristic for the particular instrument (instrumental profile)
gi2e) = icoy)i2d) (3)
To obtain a specimens microstructural parameters the specimen (physically) broadened profilemust be extracted from the observed profile h
Origins of specimen broadening are numerous Generally any lattice imperfection will cause
323
Volume 98 Number 3 May-June 1993
Journal of Research of the National Institute of Standards and Technology
additional diffraction-line broadening Therefore dislocations vacancies interstitials substitutions and similar defects manifest themselves through the lattice strain If a crystal is broken into smaller incoherently diffracting domains by dislocation arrays stacking faults twins or any other extended imperfections then domain-size broadening occurs
13 Superconductivity and Defects
Since discovery of the ~90 K superconductor YBa2Cu307-laquo [7] it became clear that the novel su- perconductivity relates closely to defects in struc- ture Both point and extended defects relate closely to the physical properties of superconduc- tors [8 9] Defects play an important role both in the critical superconducting transition temperature Tc [10] and in the critical current density c [H] Some theories also connect Tc with lattice distor- tion [12] with strains around dislocations [13] and with interaction of current carriers and the elastic- strain field [14]
The Tc of YBajCuaOv-ji for instance depends strongly on the ojq^gen stoichiometry that is num- ber of oxygen vacancies in the charge-reservoir lay- ers and their arrangement (see Jorgensen [15] and references therein) Superconductivity in La2Cu04 appears either by the partial substitution of La with Sr Ba Ca [16 17] or by the introduction of inter- stitial oxygen defects in the La202 layer [18] Some substitutions especially on Cu sites destroy the su- perconductivity
For classical superconductors c can be drasti- cally increased by introducing defects to pin mag- netic flux vortices The layered structure of high-Tc cuprates causes the vortices to be pinned in the form of pancakes rather than long qflinders [19] Because of relatively small coherence length of vortices pinning can not be increased in the classi- cal way by introducing second-phase precipitates Instead submicroscopic lattice defects caused by local stoichiometry fluctuations vacancies substi- tutions Guinier-Preston zones and the strain field of small coherent precipitates are much more ef- fective Especially in highly anisotropic Tl-based and Bi-based cuprates substitutions are very suc- cessful Even a 5 Mg for Ba substitution in Tl2Ba2CaCu208 increases c by 25 [20]
14 Purpose of the Study
We know that defects have a very important role in novel high-Tc superconductivity Defects can be characterized and quantified by analyzing the x-ray
diffraction broadening Basically there are two ap- proaches
(i) The Stokes deconvolution method [21] com- bined with the Warren and Averbach analysis [22] give the most rigorous and unbiased approach be- cause no assumption about the analytical form of diffraction-peak shape is required However when peaks overlap and specimen broadening is com- parable with the instrumental broadening the Stokes method gives unstable solutions and large errors or can not be performed at all To obtain reliable results proper corrections have to account for truncation background sampling and the stan- dards errors [23]
(ii) The simplified integral-breadth methods (summarized by Klug and Alexander [24]) are more convenient and easier to use but they require that size and strain broadening are modeled by ei- ther Cauchy or Gauss functions Experience has shown however that in most cases both size and strain profiles can not be satisfactorily represented with either function However there is some theo- retical and experimental evidence that the effect of small-domain-size broadening produces long pro- file tails of the Cauchy function and that the lat- tice-strain distribution is more Gauss-like Langford [25 26] used the convolution of Cauchy and Gauss functions (Voigt function) to model specimen broadening However the results ob- tained by the integral-breadth and Warren-Aver- bach analyses are usually not comparable the first methods give volume-weighted domain sizes and upper limit of strain the second gives surface- weighted domain sizes and mean-square strain av- eraged over some distance perpendicular to diffracting planes
Unfortunately most high-Tc superconductors show weak peak broadening (because of high an- nealing temperatures) and strong peak overlapping (because of relatively complicated crystal struc- tures) which makes it very difficult to apply the Stokes deconvolution method to extract pure speci- men broadening The aim in this study is twofold
(i) To develop a reliable method for analysis of a pattern with highly overlapping reflections and weak structural broadening and to compare it with the previously described approaches It will be shown that the Voigt-function modeling of the specimen broadening concurs with the Warren- Averbach approach
(ii) To apply the method to the same high-Tc superconductors and conclude how much informa- tion about defects can be extracted from analysis of the x-ray diffraction broadening
324
Volume 98 Number 3 May-June 1993
Journal of Research of the National Institute of Standards and Technology
2 Previous Studies 21 Size and Strain Broadening
Some important methods to extract specimen size and strain broadening and information about domain sizes and strains will be reviewed briefly An excellent review about Fourier methods and in- tegral-breadth methods is given by Klug and Alex- ander [24] A survey of single-line methods was authored by Delhez de Keijser and Mittemeijer [27] The use of variance (reduced second moment of the line profile) in the analysis of broadening will not be treated here Wilson described the con- tributions to variance by crystallite size [28] and strain [29]
211 Determination of the Pure Specimen- Broadened Profile As mentioned in Sec 12 be- fore the specimens size and strain broadening can be obtained the observed profile must be cor- rected for instrumental broadening Most used methods are the Fourier-transform deconvolution method [30 21] and simplified integral-breadth methods that rely on some assumed analytical forms of the peak profiles The iterative method of successive foldings [31 32] is not used extensively and will not be considered here
Deconvolution Method of Stokes From Eqs (2) and (3) it follows that deconvolution can be per- formed easily in terms of Fourier transforms of re- spective functions
F(n) = =H(nl G(ny (4)
Hence the physically broadened profile is re- trieved from the observed profile h without any as- sumption on the peak-profile shape (see Fig 1) This method is the most desirable approach be- cause it is totally unbiased However because of the deconvolution process there are many prob- lems Equation (4) may not give a solution if the Fourier coefficients of the profile do not vanish before those of the g profile Furthermore if physi- cal broadening is small compared with instrumen- tal broadening deconvolution becomes too unstable and inaccurate [33 34] If the h profile is 20 broader than the g profile this gives an upper limit of about 1000 A for the determination of ef- fective domain size [34] Regardless of the degree of broadening deconvolution produces unavoid- able profile-tail ripples because of truncation ef- fects To obtain reliable results these errors have to be corrected along with errors of incorrect background sampling and the standard specimen
[23 35 36] The largest problem however is peak overlapping If the complete peak is not separated the only possible solution is to try to reconstruct the missing parts That would require some as- sumption on the peak-profile shape that is intro- duction of bias into the method The application of the Stokes method is therefore limited to materials having the highest crystallographic symmetry
dh(x)
Fig 1 Observed profile n is a convolution of the instrumental profile g with the specimen profile Adapted from Warren [59]
Integral-Breadth Methods The basic assumption of these methods is that diffraction profiles can be ap- proximated with some analytical function In the beginning two commonly used functions were Gauss
(x)=(0)exp[-7|^] (5)
and Cauchy
(gt=) =(0) 4+
(6)
From the convolution integral it follows easily that
Ac = ftc + iE^c (7)
for Cauchy profiles and
l3lG = lih + Ph (8)
for Gauss profiles However the observed x-ray diffraction line profiles can not be well represented with a simple Cauchy or Gauss function [24 37] But they are almost pure Cauchy at highest angles because the dominant cause of broadening be- comes the spectral distribution in radiation [24] Different geometrical aberrations of the instru- ment are difficult to describe with simple analytical functions In the case of closely Gaussian broaden- ing of y following Eq (3) the instrumental line profile can be best described by a convolution of Cauchy and Gauss functions which is the Voigt
325
Volume 98 Number 3 May-June 1993
Journal of Research of the National Institute of Standards and Technology
function Experience shows that the Voigt function [38] (or its approximations pseudo-Voigt [39 40] and Pearson-VII [41 42]) fits very well the ob- served peak profiles [25 43 37] The Voigt func- tion is usually represented following Langford [25]
nx)=m^)Rc[ctn(^ + ik)] (9)
Here the complex error function is defined as
erfi(z) = exp( -z^) [1 - erf( -raquo)] (10)
Its evaluation can be accomplished using Sundius [44] or Armstrong [45] algorithms with eight-digit accuracy Useful information about the Voigt func- tion can be found in papers of Kielkopf [46] As- thana and Kiefer [47] and de Vreede et al [48] Figure 2 presents a Voigt function for different val- ues of Cauchy and Gauss integral breadths
causes diffraction-line broadening
12
Pc=005 pc=005
Pc = 01pc=001
PG=001PC=01
283 26
Fig 2 Voigt functions for different values of Cauchy and Gauss integral breadths Adapted from Howard and Preston [4]
Integral breadth of the Voigt function is expressed through its constituent integral breadths [49]
^ erfc(A) (11)
Here erfc denotes the complementary error func- tion
Because convolution of two Voigt functions is also a Voigt function integral breadths are easily separable conforming to Eqs (7) and (8)
212 Separation of Size and Strain Broadening After removing the instrumental broadening from the observed line profile it is possible to analyze the pure-specimen (physically) broadened line pro- file to consider the origins and amount of broad- ening
In 1918 Scherrer [50] recognized that break- ing the crystal into domains smaller than ~1000 A
ltZ)gtv = KX
3(20) cos9 (12)
The constant K depends on the crystallite shape [515253545556] but generally is close to unity The main characteristic of size broadening is that it is independent of the reflection order that is inde- pendent of diffraction angle
Most of the work on x-ray diffraction line broad- ening was done on metals and alloys It is widely accepted that plastic deformation in metals pro- duces dislocation arrays which divide crystallites into much smaller incoherently scattering domains These dislocations produce strains within the do- mains causing strain broadening It was elaborated in Sec 12 that any lattice imperfection (vacancies interstitials and substitutions) would broaden the diffraction peaks These effects would be inter- preted in the frame of this theory as a strain broad- ening too Stokes and Wilson [57] defined apparent strain as
Tj=3(20)cot0 (13)
Strain broadening is angle dependent Therefore the angle dependence of the line broadening gives a possibility to distinguish between contributions of size and strain However when we speak of size and strain broadening they may include other con- tributions For instance stacking faults and twins will contribute to broadening similar to size effects
Warren-Averbach Method This method was devel- oped originally for plastically deformed metals but since its introduction [58 22] it found successful application to many other materials The method is extensively described in Warrens publications [59 60] Each domain is represented by columns of cells along the 03 direction [61] (see Fig 3) The crystal has orthorhombic axes with the direction 03 normal to the diffracting planes (00) The experi- mentally observable diffraction power may be ex- pressed as a Fourier series
(20)=-^ 2 An expilvina^s) (14)
Here experimentally measurable coefficients Abdquo are
Nbdquo Abdquo =T^ ltexp(2m7Zbdquo)) (15)
326
Volume 98 Number 3 May-June 1993
Journal of Research of the National Institute of Standards and Technology
m 3
^i
m I
Fig 3 Representation of the crystal in terms of columns of cells along the a^ direction [59]
The Abdquo coefficients are the product of two terms The first term depends only on the column length (size coefficient) the second depends only on dis- tortion in domains (distortion coefficient)
An mdashAn An bull
Nbdquo lf = ltexp(2TrZbdquo))
(16)
(17)
It is more convenient to express the distortion coef- ficient in terms of the strain component If L =laquoa3 is the undistorted distance between a pair of cells along direction 03 and distortion changes distance by 4L = a^Zn the component of strain in the as direction (orthogonal to reflecting planes) aver- aged over distance L can be defined as (L) = A(L) L Because oil^d interplanar spacing the distortion coefficient can be rewritten
Ideg(L) = exp(2TrLe(L)d)) (18)
To obtain the strain component it is necessary to approximate the exponential term For not too large L
exp(2mLe(L)d)
laquoexp(-2Tr^L2lte2(L))d^) (19)
This relationship is exact if the distributions of e(L) for all L values follow the Gauss function and is generally true as far as terms in e^(L) because
these distributions are usually sufficiently symmet- rical [57] Now Eq (16) can be approximated as
InA L)=lnAL)- 2TTeL))LW) (20)
Warren and Averbach [22] derived this relation- ship in a similar way It separates size and strain contributions to the broadening and allows for their simultaneous evaluation
If the size coefficients are obtained by applica- tions of Eq (20) it is possible to evaluate the aver- age surface-weighted domain size and the surface-weighted column-length distribution func- tion [59]
idAHL) ^ 1_
Ps(L) dMU) dL^
(21)
(22)
Figure 4 shows how (D) can be obtained from both the size coefficients ^^(L) and the column- length distribution function
Fig 4 Surface-weighted domain size is determined (a) by the intercept of the initial slope on the L-axis (b) as a mean value of the distribution function
Multiple-Line Integral-Breadth Methods To sepa- rate size and strain broadening by using integral breadths it is necessary to define the functional form for each effect In the beginning size and strain contributions were described by Cauchy or Gauss functions Using Eqs (12) and (13) on the s scale and additive relations for the integral breadths following Eqs (7) and (8)
1 j8 =77vr + 2es (Cauchy-Cauchy) (23)
8=T^ + ^y- (Cauchy-Gauss) (24)
327
Volume 98 Number 3 May-June 1993 Journal of Research of the National Institute of Standards and Technology
^^=7^ + 4e^s^ (Gauss-Gauss) (25)
Here e = Tj4raquo4dd is the upper limit for a strain Equation (24) uses the Haider and Wagner [62] parabolic approximation for the integral breadth of the Voigt function expressed by Eq (11)
3 I3) (26)
Experience shows however that neither Cauchy nor Gauss functions can model satisfactorily size or strain broadening in a general case Langford [26] introduced the so-called multiple-line Voigt-func- tion analysis Both size-broadened and strain- broadened profiles are assumed to be Voigt functions Using Eqs (12) and (13) it follows sym- bolically for Cauchy and Gauss parts that
j8c = i3sc+j8Dcs
ph = Plc + plcs^
(27)
(28)
This approach disagrees with the Warren- Averbach analysis that is the two methods give different results (see Sec 44) [63 64]
Single-Line Methods There are cases where only the first order of reflection is available or higher- order reflections are severely suppressed (ex- tremely deformed materials multiphase com- posites catalysts and oriented thin films) Many methods exist to separate size and strain broaden- ing from only one diffraction peak However it was stated in Sec 212 that the different size and strain broadening angle dependence is a basis for their separation hence using only one diffraction line introduces a contradiction Consequently single- line methods should be used only when no other option exists The single-line methods can be di- vided in two main parts Fourier-space and real- space methods Fourier-space methods are based on the Warren-Averbach separation of size and strain broadening following Eq (20) The func- tional form of E^(L)) is assumed either to be con- stant [65666768] or assumed to depend on L as eL))=cL [69707172] Then Eq (20) can be fitted to few points of A(L) for the small averaging distance L to obtain size and strain parameters All Fourier-space methods have the serious prob-
lem that the Fourier coefficients 4 (L) are usually uncertain for small L because of the so-called hook effect [60] (see Sec 42) 2occhi [73] sug- gested that fitting the straight line through the first derivatives of the Fourier coefficients instead of through the coefficients themselves would solve the hook-effect problem
All real-space methods [747576] are based on the assumption that the Cauchy function deter- mines size and that the Gauss function gives strain The most widely used method of de Keijser et al [76] gives size and strain parameters from Cauchy and Gauss parts of the Voigt function respectively
P)v=^
e=^ 2s
(29)
(30)
22 Diffraction-Line-Broadening Analysis of Superconductors
In this field very few studies exist Williams et al [77] reported isotropic strains in YBa2Cu307-laquo powder by the simultaneous Rietveld refinement of pulsed-neutron and x-ray diffraction data Using a GSAS Rietveld refinement program [78] both size and strain broadening were modeled with the Gauss functions for the neutron-diffraction data [79 80] and with the Cauchy functions for the x- ray diffraction data (modified method of Thomp- son Cox and Hastings [81]) Interestingly both the neutron and x-ray data gave identical values for the isotropic strain (023) and no size broaden- ing Singh et al [82] studied internal strains in YBa2Cu307-laquo extruded wires by pulsed-neutron diffraction They separated size and strain parame- ters by means of Eq (25) (Gauss-Gauss approxi- mation) Size broadening was found to be negligible but (isotropic) microstrains range from 005 for the coarse-grained material to 03 for the fine-grained samples Eatough Ginley and Morosin [83] studied Tl2Ba2Ca2Cu30io (Tl-2223) and Tl2Ba2CaCu208 (Tl-2212) superconducting thin films by x-ray diffraction Using the Gauss-Gauss approximafion they found strains of 014-018 in both phases and domain sizes of 1200-1400 A for Tl-2212 but 500 A for Tl-2223
We are aware of only two more unpublished studies [84 85] involving size-strain analysis in high-Tc superconductors The probable reason is that any analysis is very difficult because of weak line broadening and overlapping reflections This
328
Volume 98 Number 3 May-June 1993
Journal of Research of the National Institute of Standards and Technology
precludes application of reliable analysis such as the Stokes deconvolution method with the Warren- Averbach analysis of the broadening Instead sim- ple integral-breadth methods are used which gives generally different results for each approach Moreover for x-ray diffraction broadening appli- cation of the Gauss-Gauss approximation does not have any theoretical merit although reasonable values especially of domain sizes may be obtained [86] We showed [878889] that reliable diffrac- tion-line-broadening analysis of superconductors can be accomplished and valuable information about anisotropic strains and incoherently diffract- ing domain sizes obtained
3 Experiment 31 Materials
The materials used for this study were tungsten and silver commercially available powders with nominal grain sizes 4-12 ijim La2-xSriCu04(jc = 0 006 015 024) powders Lai^Moi5Cu04(M = Ca Ba) powders Bi2Sr2CaCu208 (Bi-2212) sinter (BiPb)2Sr2Ca2Cu30io(BiPb-2223) sinter and (BiPb)2(SrMg)2(BaCa)2Cu30io (BiPbMgBa-2223) sinter
Powders with nominal compositions La2-xSrCuO4(c=0 006 015 024) and Laig5Moi5Cu04(M = Ca Ba) were prepared at the National Institute of Standards and Technology Boulder Colorado by A Roshko using a freeze- drying acetate process [90] Acetates of the various cations were assayed by mass by calcining to the corresponding oxide or carbonate The appropriate masses of the acetates for the desired compositions were dissolved in deionized water The acetate so- lutions were then sprayed through a fine nozzle into liquid nitrogen to preserve the homogeneous cation distributions Frozen particles were trans- ferred to crystallization dishes and dried in a com- mercial freeze dryer to a final temperature of 100 degC After drying the powders except the Lai^Baoi5Cu04 were calcined in alumina (998) crucibles at 675 C for 1 h in a box furnace with the door slightly open to increase ventilation Because BaCOs is difficult to decompose the Laig5Baoi5Cu04 was calcined under a vacuum of 2 Pa at 800 C for 4 h then cooled slowly in flowing oxygen (2degCmin) The calcined powders were oxidized in platinum-lined alumina boats in a tube furnace with flowing oj^gen at 700 degC After 3 h at 700 C the powders were pushed to a cold end of the furnace tube where they cooled quickly (20 Cs) while still in flowing oxygen
The cylindrical specimens (23 mm in diameter and 9 mm thick) of Bi-2212 BiPb-2223 and BiPbMgBa-2223 were prepared at the National Research Institute for Metals Tsukuba Japan by K Togano [91] Starting oxides and carbonates were Pb304 61203 CuO SrCOs MgCOs and BaC03 They were calcinated in air at 800 C for 12 h Powders were then pressed and sintered in 8 oxygen-92 argon mixture at 835 degC for 83 h Specimens were furnace cooled to 750 degC held for 3 h in flowing oxygen and then furnace cooled in ojygen to room temperature
311 Preparation of Specimens for X-ray Diffraction The bulk specimens were surface polished if necessary and mounted in specimen holders Coarse-grained powders of La2-cSrxCu04 (x=Q 006 015 024) and Lai8sMoi5Cu04 (M = Ca Ba) were ground with a mortar and pestle in toluene and passed through a 635-mesh sieve (20-|xm nominal opening size) Silver and tungsten powders were dry ground with a mortar and pestle All powders were mixed with about 30 silicone grease and loaded into rectangular cavities or slur- ried with amyl acetate on a zero-background quartz substrate
32 Measurements
X-ray-diffraction data were collected using a standard two-circle powder goniometer in Bragg- Brentano parafocusing geometry [92 93] (see Fig 5) A flat sample is irradiated at some angle incident to its surface and diffraction occurs only from crystallographic planes parallel to the speci- men surface The goniometer had a vertical 0-26 axis and 22 cm radius CnKa radiation ex- cited at 45 kV and 40 mA was collimated with Seller slits [94] and a 2 mm divergence slit SoUer slits in the diffracted beam 02 mm receiving slit and Ge solid-state detector were used in a step- scanning mode (OOI7IO s for a standard specimen 002deg-005730-80 s for other specimens depending on the amount of broadening)
33 Data Analysis
The diffractometer was controlled by a com- puter and all measurements were stored on hard disc Data were transferred to a personal computer for processing
We used computer programs for most calcula- tions X-ray diffraction patterns were fitted with the program SHADOW [95] This program allows a choice of the fitting function and gives refined positions of the peak maximums intensities and function-dependent parameters It also has the
329
Volume 98 Number 3 May-June 1993
Journal of Research of the National Institute of Standards and Technology
Seller Slits
Source S
Specimen
Fig 5 Optical arrangement of an x-ray diffractometer Adapted from Klug and Alexander [24]
ability to convolute the predefined instrumental profile with the specimen function to match the ob- served pattern Choice of the specimen function in- cludes Gauss and Cauchy functions We added the ability to model the specimen broadening with an exact Voigt function and implemented SHADOW on a personal computer In the fitting procedure for every peak in the pattern the program first gen- erates the instrumental profile at the required dif- fraction angle The instrumental profile is deter- mined from prior measurements on a well-annealed standard specimen (see Sec 51) Then it assumes parameters of the specimen profile For an exact Voigt function parameters are peak position peak intensity and Cauchy and Gauss integral breadths of the Voigt function By convoluting the instru- mental profile with the specimen profile and adding a background the calculated pattern is ob- tained [Eq (2)] Parameters of the specimen profile are varied until the weighted least-squares error of calculated and observed patterns Eq (59) reaches a minimum This process avoids the unstable Stokes deconvolution method It is possible that the refine- ment algorithm is being trapped in a false minimum [96] but it can be corrected by constraining some parameters Refined parameters of the pure-speci- men profile are input for the size-strain analysis of the broadening A program for this analysis was written in Fortran
Lattice parameters of powder specimens were calculated by the program NBSLSQ85 based on the method of Appleman and Evans [97] A pro- gram in Fortran was written to apply corrections to observed peak maximums by using NIST standard reference material 660 LaB6 as an external stan-
dard Lattice parameters of bulk specimens were determined by the Fortran program which uses a modified Cohens method [9899100] to correct for systematic diffractometer errors Lattice parame- ters were also calculated by the Rietveld refinement programs GSAS [78] and DBW32S [101 102]
4 Methodology
When instrumental and specimen contributions to the observed line profile must be modeled sepa- rately adopting a specimen function is a critical step Yau and Howard [103104] used Cauchy and Enzo et al [105] pseudo-Voigt functions Benedetti Fagherazzi Enzo and Battagliarin [106] showed that modeling the specimen function with the pseudo-Voigt function gives results comparable to those of the Stokes deconvolution method when combined with the Warren-Averbach analysis of Fourier coefficients De Keijser Mittemeijer and Rozendaal [107] analytically derived domain sizes and root-mean-square strains for small averaging distance L in the case of the Voigt and related func- tions
The aim here is to study more thoroughly the consequences of assumed Voigt specimen function on the size-strain analysis of the Fourier coeffi- cients of the broadened peaks It is shown that some experimentally observed interrelations between derived parameters (particularly volume-weighted and surface-weighted domain sizes) and their be- havior (the hook effect and dependence of mean- square strains on the averaging distance) can be explained by this simple assumption Moreover the discrepancy between the integral-breadth methods and Warren-Averbach analysis results from differ- ent approximations for the strain broadening and the background experimental errors
41 Separation of Size and Strain Broadenings
The normalized Fourier transform of a Voigt function is easily computable [46]
^ =exD[-2laquo^e^-7m^^fi^l fan ^bdquo-exp|^ ^ cr(2e) ^ a^(2e) T ^^^^
It is convenient to express Fourier coefficients in terms of distance L by immediately making the ap- proximation A (26) = Ascos do
AL) = exp[-2L^-7rL^pl] (32)
330
Volume 98 Number 3 May-June 1993
Journal of Research of the National Institute of Standards and Technology
Equation (32) is a good approximation even for large specimen broadening Even for a profile span of A (29) = 80deg the error made by replacing this in- terval by an adequate A(sin9 ) range is 2 How- ever strictly speaking the profile will be asym- metrical in reciprocal space and Fourier-interval limits will not correspond to the 29i and Idz peak- cutoff values in real space It is important to keep Fourier interval limits identical for all multiple-or- der reflections otherwise serious errors in the sub- sequent analysis will occur [108] If higher accuracy for a considerable broadening is desired profile fit- ting can be accomplished In terms of the recipro- cal-space variable s instead of in a real 29 space
Assuming that only the Cauchy function deter- mines domain size [4(L) = exp(-L(Z))s)] and only the Gauss function gives root-mean-square strain (RMSS) [^deg(L) = exp(-27r=L2(e)d^)] Eq (32) leads to the Warren-Averbach [Eq (20)] for the separation of size and strain contribution [62] Experience shows that Cauchy and Gauss functions can not satisfactory model specimen broadening Balzar and Ledbetter [64] postulate that the speci- men function includes contributions of size and strain effects both approximated with the Voigt functions Because the convolution of two Voigt functions is also a Voigt function Cauchy and Gauss integral breadths of the specimen profile are easily separable
3c=i3sc + 3DC (33)
(34)
Langford [26] separated the contributions from size and strain broadening in a similar way (See Eqs (27) and (28)) Note however that Eqs (33) and (34) do not define size and strain angular or- der-dependence
Because Fourier coefficients are a product of a size and a distortion coefficient from Eqs (32) (33) and (34) we can obtain the separation of size and strain contributions to the pure specimen broadening
^S(L) = exp(-2Li3sc-TrL^3io) (35)
Adeg(L) = eM-2LpDc-TrL^Phc) (36)
Wang Lee and Lee [109] modeled the distortion coefficient and Selivanov and Smislov [110] mod- eled the size coefficient in the same way
To obtain size and distortion coefficients at least two reflections from the same crystallographic- plane family must be available
42 Size Coefficient
Surface-weighted domain size is calculated from the size coefficients following Eq (21) From Eq (35) we obtain
lt^gts = 1
2i3sc (37)
Therefore surface-weighted domain size depends only on the Cauchy part of the size-integral breadth
The second derivative of the size coefficients is proportional to the surface-weighted column-length distribution function Eq (22) The volume- weighted column-length distribution function fol- lows similarly [111]
p(L)ocL^j^ (38)
By differentiating Eq (35) twice we obtain
^^4^ = [(2^L^ic + 2^sc)^- dL
2TrplcAL) (39)
Because the column-length distribution function should always be positive [59] the Cauchy part must dominate Inspection of Eq (39) shows that for small L we must require
(40)
Otherwise the hook effect will occur in the plot of size coefficientsI (L) versus L that is the plot will be concave downward for small L (Fig 6) The hook effect is usually attributed to experimental errors connected with the truncation of the line profiles and consequently overestimation of background [59] This is a widely encountered prob- lem in the Fourier analysis of line broadening It results in overestimation of effective domain sizes and underestimation of the RMSS [36] Some authors [106] claim that the preset specimen- broadening function eliminates the hook effect However Eq (39) shows that effectively too high
331
Volume 98 Number 3 May-June 1993
Journal of Research of the National Institute of Standards and Technology
08-
04-
mdash^ 1 J 1 x
^~ ( ^ ^ i I
1 t 1 11
jl u
V 1 iJ
J
c^
100 200
Fig 6 (upper) The hook effect of the size coefficients A ^ (full line) at small L (lower) it causes negative values (set to zero) of the column-length distribution functions
background causes underestimation of the Cauchy content of the Voigt function because the long tails are truncated prematurely It has to be men- tioned that Wilkens [112] proposed tilted small-an- gle boundaries to be the source of the hook effect Liu and Wang [113] defined a minimum particle size present in a specimen depending on the size of the hook effect Figure 6 shows that negative values of the column-length distribution functions (set to zero) do not affect the shape but shift the entire distribution toward larger L values
Note also that the surface-weighted column- length distribution function ps(L) will usually have a maximum at L = 0 but for the particular ratio of integral breadths determined by Eq (40) it can be zero The volume-weighted column-length distribu- tion function7v(L) will always have a maximum for LsO
If the column-length distribution functions are known it is possible to evaluate mean values of respective distributions
lt^kv =
00
J ^ _0
(L)dL
raquosv(L)dL (41)
Integrals of this type can be evaluated analytically [114]
OQ
J cexp( - to^ - a )dc = i^y^ ^ of
hd^^^^fe)]- (^2)
Surface-weighted domain size (D)s must be equal to the value obtained from Eq (37) The volume- weighted domain size follows
ltD)v = ^^erfc(A) = js (43)
Using Eqs (37) and (43) we can evaluate the ratio of domain sizes
i^ = 7r lt^gts
= 2vn-^exp(A2)erfc(^) (44)
Theoretically k can change from zero to infinity However the minimum value of k is determined by Eq (40)
1V2 ltk lt laquogt (45)
Hence the ratio of domain sizes can change in a limited range (see also Fig 7)
131laquo V2^ erfc (^ ) s ^ lt 2 (46)
10^ 10^ 10- 10deg 10 10^ 10-
Fig 7 The ratio of volume-weighted and surface-weighted domain sizes as a function of the characteristic ratio of Cauchy and Gauss integral breadths k
332
Volume 98 Number 3 May-June 1993
Journal of Research of the National Institute of Standards and Technology
It may be noted that most experiments give the ratio D)vD)s in this range (see for instance re- view by Klug and Alexander [24]) When k goes to infinity the size broadening is given only by the Cauchy component and (JD)V=2(D)S This is a case of pure Cauchy size broadening described by Haider and Wagner [62] and de Keijser Mittemei- jer and Rozendaal [107] It is possible to imagine a more complicated column-length distribution func- tion [27] than Eq (39) which would allow even larger differences between surface-weighted and volume-weighted domain sizes However we are not aware of any study reporting a difference larger than 100
43 Distortion Coefficient
In Sec 212 it was shown that the distortion co- efficient can be approximated by the exponential
Adeg(L) = exp(-ITTVLeL))) (47)
Comparing with Eq (36) we can write
Therefore mean-square strains (MSS) decrease linearly with averaging distance L This behavior is usually observed in the Warren-Averbach analysis Rothman and Cohen [115] showed that such be- havior would be expected of strains around disloca- tions Adler and Houska [116] Houska and Smith [117] and Rao and Houska [118] demonstrated for a number of materials that MSS can be repre- sented by a sum of two terms given by Cauchy and Gauss strain-broadened profiles
However for i3Dc=0 the MSS are independent ofL
(^2)12 ^ ^Dc(2g) cotg = ^ 2V2 V2TT
(49)
where the upper limit of strain e is defined as 7j4 (see Sec 212) This is a limiting case of pure- Gauss strain broadening described by de Keijser Mittemeijer and Rozendaal [107]
44 Discussion
To calculate domain sizes and strain it is neces- sary to define size and distortion integral-breadths angular order-dependence From Eq (43) It fol- lows that the domain size D )v is always indepen- dent of the order of reflection
)3sc = const JSSG = const
However from Eq (48) we find
^^ = const ^^ = const
(50)
(51)
An important consequence is that apparent strain TJ will be independent of angle of reflection only in the case of pure-Gauss strain broadening because 3DC and JSDG depend differently on the dif- fraction angle If we compare Eq (51) with the multiple-line Voigt-function analysis [26] given by Eqs (27) and (28) it is evident that they disagree Therefore recombination of constituent integral breadths 3DC and 3DO to Voigt strain-broadened in- tegral breadth Pdeg and the subsequent application of Eq (49) to calculate strain [26 119] will concur with the Fourier methods if strain broadening is entirely Gaussian and for the asymptotic value of MSS ((e^( 00))) However neither volume-weighted domain sizes D)y will agree although they are de- fined identically in both approaches because size- broadened and strain-broadened integral breadths are dependent variables
If at least two orders of reflection ( and +1) of the same plane (hkl) are available using Eqs (50) and (51) we can solve Eqs (33) and (34)
(52)
^^deg sl + l)-sil) ^^^^
^^=sHl + l)-sl) [fc( + l)-3c()3 (54)
^^=sl + l)-sl) [^(^ + ^)-^(0]- (55)
If we substitute these expressions into Eqs (35) and (36) we see that this approach leads exactly to the Warren-Averbach Eq (20) for two orders of reflections This is expected because the distortion coefficient is approximated with the exponential (47)] Delhez de Keijser and Mittemeijer [23] ar- gued that instead of Eq (20) the following rela- tion would be more accurate
A(L)=AXL) (1 -27r^(e^(L))LVd (56)
333
Volume 98 Number 3 May-June 1993
Journal of Research of the National Institute of Standards and Technology
These two approximations differ with fourth-order terms in the power-series expansion In terms of this approach Eq (48) has to be rewritten
2r ^^ l-exp(-2LI3DC-TTL^0DG) (57)
This means that even if the strain-broadened pro- file is given entirely by the Gauss function the MSS depend on distance L (see Fig 8) In this ap- proximation no simple relation for the distortion integral-breadths angular order-dependence exists For not so large L however Eq (51) holds and approximations from Eqs (20) and (56) do not dif- fer much (see Fig 8)
1500 Warren- Averbach approximation ^
Delhez de Kcijscr and ^^^ Minemeijer approximation ^y^
^ 1000 A
500
mdashI
1 1
Oc 300 600 IL k^) X 10^
90
o ^ 60 A
30
1
J Warren- Averbach approximation
Delhez de Keijser and Minemeijer approximation
0 0 150 300
1L (A-1 ) X 10^
Fig 8 Mean-square strains pound^(L)) for two approximations of the distortion coefficient (upper) Voigt strain broadening (lower) pure-Gauss strain broadening
Generally it was shown that in the size-broad- ened profile the Cauchy part must dominate No similar requirement for the strain-broadened pro- file exists However experience favors the assump- tion that it has to be more of Gauss-type The Warren-Averbach approach is exact if strain broad- ening is purely Gaussian so Eqs (20) and (48) are
better approximations as strain profile is closer to the Gauss function In any case both approaches given by Eqs (20) and (56) are good up to the third power in strain and the Warren-Averbach relation [Eq (20)] does not assume that MSS are independent of distance L [27] it also represents a harmonic approximation
If at least two orders of reflection from the same plane (hkl) are available we can use Eqs (52) (53) (54) and (55) to calculate size-related and strain-related integral breadths Subsequent appli- cation of Eqs (37) (43) and (48) gives directly domain sizes (D) and (D)v and mean-square strains (e^(L)) This approach is more straightfor- ward and much simpler than the original Warren- Averbach analysis Great care should be given to the possible systematic errors The easiest way to observe the hook effect is to plot column-length distribution functions as a function of averaging distance L If they show negative values for small L (see Fig 6) all derived parameters will be in error This is because (i) only the positive values of the column-length distribution functions are numeri- cally integrated or (ii) the intercept on the L-axis of the linear portion of the A^ vs L curve is taken (see Fig 4) always larger values of domain sizes will be obtained than by the application of Eqs (37) and (43) Therefore we conclude that the dis- crepancy between integral-breadth and Fourier methods is always present by the appearance of the hook effect in the A^ vs L curve An analogous discrepancy exists between integral-breadth and variance methods [119] In such cases correction methods for truncation can be applied [35 119 120] but the best procedure is to repeat the pat- tern fitting with the correct background
In the Fourier analysis it is usually observed that the mean-square strains diverge as the averaging distance L approaches zero This also follows from Eqs (48) and (57) However because the MSS de- pendence on distance L is not defined in Warren- Averbach analysis it was suggested [27 107 121] that local strain can be obtained by taking the sec- ond derivative of the distortion coefficient or by a Taylor-series expansion of local strain Therefore we obtain from Eq (36)
i^m-M^-^) (58)
It is evident that this relation is wrong It holds only for a special case of pure-Gauss strain-broad- ened profile when the MSS are equal for any L Otherwise if the Cauchy function contributes to
334
Volume 98 Number 3 May-June 1993
Journal of Research of the National Institute of Standards and Technology
strain broadening all derivatives of strain in L = 0 are infinite and local strain can not be defined If the main origin of strains is dislocations [115] strains are defined after some distance from the dislocation (cutoff radius) to be finite Averaging strains over a region smaller than the Burgers vector is probably not justified For instance Eq (48) gives even for a small averaging distance L = 1 A and considerable strain broadening (J3DG(20) = 3DC(20) = 1O) root-mean-square strain eL = 1A))^ laquo02 that is about the elastic limit
45 Random Errors of Derived Parameters
Errors in size and strain analysis of broadened peaks are relatively difficult to evaluate Following Langford [26] sources of the systematic errors in- clude choice of standard specimen background and type of analytical function used to describe the line profiles The first two errors should be mini- mized in the experimental procedure Errors caused by inadequate choice of specimen function would systematically affect all derived results but they can not be evaluated Random errors caused by counting statistics have been computed by Wilson [122 123 124] and applied to the Stokes deconvolution method by Delhez de Keijser and Mittemeijer [23] as well as by Langford [26] and de Keijser et al [76] using single-line Voigt-func- tion analysis Nevertheless the approximate error magnitude can be calculated from estimated stan- dard deviations (esd) of the parameters refined in the fitting procedure In the program SHADOW the weighted least-squares error is minimized
7wp mdash RES
Here
)=1
RES = 2 vfi [ (obs) - (cal)]
(59)
(60)
and weights are the reciprocal variances of the ob- servations
H = l(obs) (61)
Each line profile has four parameters varied inde- pendently position intensity and Cauchy and Gauss integral breadths of the Voigt profile In least-squares refinement esds are computed as
^^ bu RES (62) m mdashm
Here ba are diagonal elements of the inverse matrix of the equation coefficients m is the number of observations and m is the number of refined parameters The main source of errors is integral breadths Errors in peak position peak intensity and background are much smaller and can be ne- glected in this simple approach For two indepen- dent variables )3G and Pc covariance vanishes and from Eqs (37) and (38) for the two orders of re- flection and +1 it follows that
RD =
si+i)m)RHMi))+si)m+i)i^(3c(+D)
(63)
ReL)r) =
pHDRHPcG)) + m + miPcJl + D) 2[3c(+1) - i8c()3+TTL [m+1) - mw
-n-LmiDRHihd))+m+mWcH+i))i ^ 2[)3c(+1) - iSc()+TTLim+1) - mw
(65)
Here Rx) are relative standard deviations The error in D would be complicated to evaluate but because 131D)s^(Igt)vlt2(pound))s Eq (63) gives a good estimation for the error in (Z))v as well Alter- natively to see how errors depend on the Fourier coefficients errors can be estimated from the Warren-Averbach relationship [Eq (20)] (86) From Eq (32) it follows that
RA (L)) = ATr^Lpos)R^2d)) +
4Lph(s)RPci2e)) (66)
Errors in root-mean-square strains and domain sizes are
i^((e^(L ))bulllaquo) =
RHA(Ll))+RHA(Ll + l)) (67)
ALl + l)
335
Volume 98 Number 3 May-June 1993
Journal of Research of the National Institute of Standards and Technology
^^laquo^))=(T^)
s(l + 1)RHA (Ll)) +SV)RHA (Ll + D) lsl + l)-sl)f (68)
Here (D) is approximately defined with A^(L) = l-L(D)j Errors in Fourier coefficients increase with L while factors in Eqs (67) and (68) lower the errors for large L In general errors of domain sizes and strains are of the same order of magnitude as errors of integral breadths [86]
5 Application 51 Correction for Instrumental Broadening
Before specimen broadening is analyzed instru- mental broadening must be determined This is ac- complished by carefully measuring diffraction peaks of some well-annealed defect-free speci- men It is then assumed that its broadening may be attributed only to the instrument The usual proce- dure is to anneal the specimen However in some instances that is not possible because either the material undergoes an irreversible phase transition on annealing or the number of defects can not be successfully decreased by annealing Another pos- sibility is to measure the whole diffraction pattern of the material showing the minimal line broaden- ing and then to synthesize the instrumental profile at the needed diffraction angle This approach re- quires the modeling of the angle dependence of the instrumental (standard) parameters Cagliotti Pao- letti and Ricci [125] proposed the following func- tion to describe the variation of the full width at the half maximum of profile with the diffraction angle
F9miA^(2e) = Utan^9 + Vtand + W (69)
Although this function was derived for neutron dif- fraction it was confirmed to work well also in x-ray diffraction case [126 127] A more appropriate function for the x-ray angle-dispersive powder dif- fractometer based on theoretically predicted er- rors of some instrumental parameters [128] may be the following [129]
FWHNf (2 e) = W+Vsin^l 6 +
UtanH + UcotH (70)
This function may better model the increased axial divergency at low angles and correct for the speci- men transparency [129] However contrary to the requirement on the specimen function most im- portant for the instrumental function is to correctly describe the angular variation of parameters re- gardless of its theoretical foundation
When specimen broadening is modeled with a Voigt function the simplest way to correct for the instrumental broadening is by fitting the line pro- files with the Voigt function too Cauchy and Gauss integral breadths of the specimen-broad- ened profile are then easily computable by Eqs (7) and (8) However because the instrumental broad- ening is asymmetric [24] modeling with the sym- metric Voigt function can cause a fictitious error distribution resulting in errors of strain up to 35 [76] Another approach is to model the instrumen- tal-broadening angle dependence by fitting the profile shapes of a standard specimen with some asymmetrical function split-Pearson-VII [95] or pseudo-Voigt convoluted with the exponential function [105] The instrumental function can then be synthesized at any desired angle of diffraction and convoluted with the assumed specimen func- tion to match the observed profile by means of Eq (2)
In the program SHADOW instrumental para- meters are determined by fitting the split-Pearson VII function (see Fig 9) to line profiles of a standard specimen
iix)=m- 2 m
with
c =-
mc^f
mm) mv-rim-12)
(71)
(72)
Here m = 1 or m = ltraquo yields a Cauchy or Gauss function respectively Refined full widths at half maximum (FWHM) and shape factors m for both low-angle and high-angle sides of the profiles are fitted with second-order polynomials To fit the FWHM we used Eq (69) and for the shape fac- tors
m(2e) = U(20f + V(2e) + W (73)
The resulting coefficients U V W U V and W permit synthesis of the asymmetrical instrumental line profile at any desired angle
336
Volume 98 Number 3 May-June 1993
Journal of Research of the National Institute of Standards and Technology
2 0(deg)
le
Fig 9 A split-Pearson VII profile The two half profiles have same peak position and intensity Adapted from Howard and Preston [4]
The basic requirement on the standard specimen is however to show as small a line broadening as possible To minimize physical contributions to the Une broadening of the standard specimen a few moments were emphasized as follows Because dif- fraction-line width depends strongly on degree of annealing it is preferable to use some reference powder-diffraction standard Furthermore asym- metry in the peak profiles is introduced by axial divergence of the beam flat specimen surface and specimen transparency [24] Choosing a standard specimen with low absorption coefficient would cause transparency effects to dominate If the stud- ied specimen has a large absorption coefficient (compared to the standard) this might produce a fictitious size contribution and errors in micro- strains All of the specimens studied have absorp- tion coefficients exceeding 1000 cm^ so a NIST standard reference material 660 LaBe was chosen to model the instrumental broadening (p = 1098 cm) According to Fawcett et al [130] LaBe showed the narrowest lines of all studied com- pounds Furthermore LaB6_has a primitive cubic structure (space group Pm3m) resulting in rela- tively large number of peaks equally distributed over 26 This allows for better characterization and lower errors of FWHMs and shape factors of split- Pearson VII functions (Fig 10)
52 Applicability of the Method
To study the applicability of method described in Sec 4 we first studied simple cubic-structure mate- rials such as silver and tungsten Tungsten has very narrow line profiles allowing us to obtain the up- per limit of domain sizes that can be studied Silver is easily deformed which provides a possibility to apply the method to broad line profiles To test the
009
-a
OH
006
003
1 1 m low-angle side n m high-angle side
bullz w 2 o OH
X
tancopy
Fig 10 Refined FWHMs and shape factors (exponents) m for low-angle and high-angle sides of LaBe line profiles Second- order polynomials were fitted through points
case of relatively complicated patterns and weak line broadening the method was also applied to Lai85Sroi5Cu04 and La2Cu04 powders In this sec- tion only the mechanical aspects of the line broad- ening are discussed Discussion about the origins of broadening of superconductors can be found in Sec 6
521 Silver and Tungsten Powders Figure 11 shows observed and refined peaks of tungsten un- treated and silver ground powders In Table 2 are listed results of fitted pure-specimen Voigt profiles for silver and tungsten specimens Table 3 and Fig 12 give results of the line-broadening analysis Untreated tungsten powder shows relatively weak broadening Instrumental profile FWHMs at angle positions of (110) and (220) tungsten lines are 0059deg and 0081deg respectively close to values mea- sured for tungsten 0065deg and 0100deg Results in Table 3 reveal that small broadening is likely caused by domain sizes because microstrains have negligible value This pushes the limit for measur- able domain sizes probably up to 4500-5000 A However one must be aware that weak specimen broadening implies higher uncertainty of all derived parameters Moreover the choice of the instrumental standard becomes more crucial
Both silver and tungsten line profiles become more Cauchy-like after grinding which probably increases dislocation density in the crystallites This is consistent with the presumption that small crystallites and incoherently diffracting domains separated by dislocations within grains affect the tails of the diffraction-line profiles [60115] Figure 13 illustrates the dependence of MSS on the recip- rocal of the averaging distance L
337
Volume 98 Number 3 May-June 1993
Journal of Research of the National Institute of Standards and Technology
C8
z
7- ^95
29 (deg) 405
bullJf^r-
z S 08
Ez U o u OS
a
04 bull
o Es
4P
2000 z^fA
4000
B
z u f- z
425 435 445 29 (deg)
455
yr 600 SOO
L(A)
Fig 11 Observed points (pluses) refined pattern (full line) and difference pattern (below) (110) W untreated (upper) (200) Ag ground (lower)
Fig 12 Fourier coefficients for the first- (pluses) and second- order (crosses) reflection and size coefficients (circles) [111] Ag untreated (upper) [100] Ag ground (lower)
Table 2 Parameters of the pure-specimen Voigt function as obtained from profile-fitting procedure for tungsten and silver powders
Specimen hkl 2ft(deg) 3c(deg) 3G(deg) FWHM(deg) Rwp()
W untreated 110 220
4028 8705
00065(7) 00301(6)
0020(2) ltio-
0021 0019
90 44
W ground 110 220
4029 8705
0100(2) 0222(3)
0038(4) 0069(6)
0080 0166
90 42
Ag untreated 111 222 200 400
3806 8151 4425 9786
0056(1) 0105(4) 0118(2) 0274(21)
ltio- 00008(21)
ltio-^ ltio-5
0036 0067 0075 0175
105 97
105 122
Ag ground 111 222 200 400
3807 8151 4424 9783
0175(3) 0410(26) 0365(10) 1079(82)
0038(12) ltio-
0076(29) ltio-
0121 0261 0250 0687
99 145 99
145
338
Volume 98 Number 3 May-June 1993
Journal of Research of the National Institute of Standards and Technology
Table 3 Microstructural parameters for tungsten and silver powders
Specimen Direction (poundgt)raquo( A) (2))v(A) ltpound^(fl3))laquo (^laquoD)v2)gtw
W untreated [110] 3200(200) 3500(200) 000038 000008(2)
W ground [110] 620(20) 1030(30) 00023 000054(2)
Ag untreated [111] [100]
1000(20) 510(20)
2000(20) 1030(20)
00010 00022
000024(1) 000047(5)
Ag ground [111] [100]
380(20) 210(10)
650(20) 350(20)
00047 00100
000095(7) 000180(14)
100 -_ - [100) Ag ground ^ ^~ mdash C1111 Ag ground ^bull
y y
o y ^ 50 A y
y y
y
0
y - y ^--
c ) 50 100 150
lLfAjxlO^
Fig 13 Mean-square strains (E^) as a function of VL
Errors in integral breadths allow estimation of errors in strain and size parameters (Sec 45) but in some cases the refinement algorithm gives unre- liable errors of integral breadths When a particu- lar parameter is close to the limiting value (for instance 10^ degrees has been put as the mini- mum value for integral breadths) errors become large However in Eqs (63) (65) (66) (67) and (68) only the product of integral breadth and ac- companying error is significant which is roughly equal for Cauchy and Gauss parts Errors of do- main sizes and strains are of the same order of magnitude as errors of integral breadths
The possible source of systematic error is poten- tial inadequacy of Voigt function to accurately de- scribe specimen broadening This effect can not be evaluated analytically but it would affect all derived parameters especially the column-length distribution functions The logical relationship be- tween values of domain sizes (see Table 3) for dif- ferent degrees of broadening indicates that possible systematic errors can not be large
Equation (41) allows computation of volume- weighted and surface-weighted average domain sizes if respective column-length distribution func- tions can be obtained Figure 14 gives surface- weighted and volume-weighted average column- length distribution functions following Eqs (39) and (38) Width of the distribution function deter- mines the relative difference between (D) and (pound))v The broader the distribution the larger the differences because small crystallites contribute more to the surface-weighted average That is much more evident comparing the surface- weighted column-length distribution with the vol- ume-weighted If they have similar shape and maximum position as in Fig 15 differences are small Conversely if the surface-weighted distribu- tion function has a sharp maximum toward smaller sizes differences are larger (see Fig 14) The dif- ference between (poundgt)s and (D)v and the actual mean dimension of the crystallites in a particular direction also depends strongly on the average shape of the crystallites [52 131 132]
If experimental profiles are deconvoluted by the Stokes method even for considerable specimen broadening size coefficients A ^ usually oscillate at larger L values [59 106] preventing computation of the column-length distribution function Few techniques were used to deal with this problem successive convolution unfolding method [32 133] smoothing and iterative methods [134 135 136 137] Figures 14 and 15 show very smooth column- length distribution functions However they follow from size coefficients ^4^ that depend on the accu- racy of the approximation for the distortion coeffi- cient given by Eq (47) Equation (47) is exact if the strain distribution is Gaussian but in general holds only for small harmonic numbers n if strain broadening is not negligible
339
Volume 98 Number 3 May-June 1993
Journal of Research of the National Institute of Standards and Technology
500 1000 L(A)
Fig 14 Surface-weighted and volume-weighted column-length distribution functions normalized on unit area [111] Ag un- treated (upper) [100] Ag ground (lower)
Fig 15 Surface-weighted and volume-weighted column-length distribution functions for [010] La2Cu04 normalized on unit area
522 La2-xSrtCu04 Powders To test the applicability of the discussed method to more com- plicated patterns two compounds with lower crystallographic symmetry were studied Lai85Sroi5Cii04 has a tetragonal K2NiF4-type struc- ture space group lAlmmm La2Cu04 is orthorhom-
bic at room temperature Both compounds show slight line broadening and relatively highly overlap- ping peaks (see Fig 16) which makes it very diffi- cult if not impossible to perform a Stokes analysis
25
-25
26 (deg)
yNraquo-
Fig 16 Observed points (pluses) refined pattern (full line) convoluted profiles (dashed line) and difference plot (below) for part of La2Cu04 pattern
Tables 4 and 5 list results from the fitting proce- dure and the analysis of specimen-broadened inte- gral breadths There are no qualitative differences in results for tungsten and silver powders How- ever average errors are higher as expected be- cause of overlapping peaks while weighted errors wp are surprisingly smaller This fact illustrates the unreliability of iwp when only a segment of the pat- tern is being refined because it depends on the number of counts accumulated in points as well as on the 28 range of the refinement
Figures 17 and 18 represent Fourier coefficients of Lai85Sroi5Cu04 [110] and La2Cu04 [010] direc- tions In the second plot the A (L )-versus-L plot shows a concave-downward part near L =0 the so- called hook effect It was shown in Sec 42 that the hook effect originates because of underesti- mation of background connected with the trunca- tion of profiles In the profile refinement all peaks separated less than 4deg 20 have been included in the refinement region to avoid possible overlapping of peak tails and specimen profiles have been trun- cated below 01 of the maximum intensity How- ever because the polynomial background was determined prior to profile refinement it may be overestimated for complicated patterns containing many overlapping peaks If background is refined with other profile parameters undesirable correla- tion with integral breadths occurs
340
Volume 98 Number 3 May-June 1993
Journal of Research of the National Institute of Standards and Technology
Table 4 Parameters of the pure-specimen Voigt function as obtained from profile-fitting procedure for La2-^SrCu04 powders
Specimen hid 2Hdeg) Pen PcO FWHM(deg) Rp()
Lai85Sroi5Cu04 004 2695 0046(4) 0024(8) 0042 34 006 4092 0083(5) ltio-= 0053 62 110 3352 0110(5) ltio- 0070 125 220 7046 0171(9) ltio- 0109 43
La2Cu04 004 2713 0061(8) 0045(9) 0067 39 006 4119 0124(7) ltio-^ 0079 77 020 3316 0074(10) 0078(10) 0102 29 040 6957 0210(30) 0026(81) 0135 29 200 3345 0074(8) 0061(10) 0087 69 400 7028 0130(10) 0023(95) 0089 29
Table 5 Microstructural parameters for Laij(5Srai3Cu04 and La2Cu04 powders
Specimen Direction (DUA) Pgt(A) lte^(fl3))laquo lte2((Z)gt2))laquo
Lai83Sro5Cu04
La2Cu04
[001] [110]
[001] [010] [100]
1700(300) 470(20)
1100(100) 680(50) 680(50)
2000(200) 940(20)
1200(100) 760(50) 810(50)
00024 00017
00038 00033 00016
000049(9) 000044(6)
00008(1) 00007(2) 00003(3)
c i ^- raquo sect 08 bulli - U
^0
ti- bull ll bull bullbullo
ffl M P bull- u ^ Di 04 Si - M bulldiamsbullbull a bull-v 3 o ^^=s^
u ^N^Sraquoraquo^
0 ^^^aaaa 1000
L(A) 2000
OQ bullbulldego UM o z a 08
o o bull bull bull
- u u bull raquo UU bull
a diams o bull o u ft 04 bull deg raquo deg - U bull bull deg Oi bullbullgt =3 bull- l o k u
0 bullbullbullraquo aaaMMi
500 1000
L(A)
Fig 17 Fourier coefficients for the first- (pluses) and second- order (crosses) reflection and size coefficients (circles) for [110] Lai^Sroi5Cu04
Fig 18 Fourier coefficients for first- (pluses) and second- order (crosses) reflection and size coefficients (circles) for [010] La2Cu04
341
Volume 98 Number 3 May-June 1993
Journal of Research of the National Institute of Standards and Technology
S3 Comparison with the Integral-Breadth Methods
Knowing the specimen integral breadths simpli- fied methods can be applied In Sec 212 we re- viewed multiple-line and single-line integral- breadth methods We shall compare the simplified multiple-line methods [Eqs (23) (24) and (30)] and the single-line method [76] [Eqs (29) and (30)] with results obtained for silver tungsten and La2-xSrxCu04 powders (Tables 3 and 5) We did not compare with the multiple-line Voigt-function method [26] because it was shown in Sec 44 that it is incompatible with the Warren-Averbach analy- sis In Table 6 integral breadth Pi was computed according to Eq (11) This value was compared with )8A integral breadth computed from Fourier coefficients [58]
i8A=- laquo3 2^(L)
(74)
Results obtained by the Warren-Averbach analysis are significantly smaller for both size and strain Integral-breadth methods give the upper limit for strain so comparison is limited Considering the approximation e = 125e^(L))^ [138] with L=(D)v2 or L=(D)s2 strains resemble more closely than crystallite sizes It must be noted how- ever that this approximation makes sense only in the case of pure-Gauss strain broadening Benedetti et al [106] reported excellent agreement for both size and strain using Warren-Averbach and Cauchy-Gauss [Eq (24)] methods Results from Table 6 on the contrary indicate that the Gauss-Gauss approximation gives values closest to the Warren-Averbach method for crystallite sizes whereas the Cauchy-Gauss and especially the Cauchy-Cauchy approximation tend to give too large values For strain the trend is opposite The Cauchy-Cauchy approximation resembles most
Table 6 Comparison of results obtained with the integral-breadth methods Cauchy-Cauchy (C-C) Cauchy-Gauss (C-G) Gauss- Gauss (G-G) and single-line (S-L) analysis
Specimen hkl PiXKP PAXKP ltigt)v (Z)gt(A) (e^((DV2)gt2 eXlO^ (A-) (A-0 (A) C-C C-G G-G S-L xlO^ C-C C-G G-G S-L
W untreated 110 220
0259 0247
0259 0247
3500 3700 3810 3810 14500 4040
008 -001 -003 -005 024 0
W ground 110 220
125 204
125 205
1030 2240 1450 1220 940 550
054 090 093 105 045 032
Ag untreated 111 2
0600 0901
0600 0900
2000 3340 2390 2190 1670 1110
024 035 039 095 0 0
200 124 124 1030 2270 1470 1230 810 047 082 085 095 0 400 204 204 490 0
Ag ground 111 222
198 352
200 352
650 2080 1240 910 530 280
095 179 182 197 048 0
200 403 406 350 9380 4780 1320 260 180 405 405 408 082 400 803 803 120 0
Lai85Sroi3Cu04 004 006
0657 0881
0650 0880
2000 5230 3290 2660 1970 1140
049 076 078 088 044 0
110 119 119 940 1240 1000 970 840 044 052 064 080 0 220 158 158 630 0
La2Cu4 004 006
0988 132
0998 131
1200 2980 1940 1630 1490 760
08 107 112 127 081 0-
020 143 142 760 1200 910 860 1240 07 079 090 110 114 040 198 200 510 016 200 126 124 810 810 810 810 1250 03 002 011 015 089 400 1S 126 830 014
Not possible to evaluate because of too small Gauss integral breadth
342
Volume 98 Number 3 May-June 1993
Journal of Research of the National Institute of Standards and Technology
closely a Warren-Averbach method These results concur with the Klug and Alexander [24] compari- son of the published size and strain values obtained by Warren-Averbach (Stokes) and integral-breadth methods However for x-ray diffraction the Cauchy-Gauss assumption for the size-strain broadening is theoretically and experimentally more favored thpoundm the other two models The fact that the Gauss-Gauss method for crystallite size and the Cauchy-Cauchy method for strain give more realistic results may mean that the presump- tion that size and strain broadening are exclusively of one type is an oversimplification
The single-line method seems much less reliable If Gaussian breadth is very small no information about strain is obtained Moreover second-order reflections give much lower values of both size and strain than do basic reflections However if multi- ple reflections are not available the single-line method can give satisfactory estimations
54 Reliability of Profile Fitting
The profile fitting of a cluster of even severely overlapping peaks can be accomplished with a low error and excellent fit of total intensity But how reliable is information obtained about separate peaks in the cluster In the fitting procedure it is possible to put constraints on the particular profile parameter to limit intensity position and width of the peak If anisotropic broadening or different phases are present constraints may not be realistic Morever acceptable results can be obtained even using a different number of profiles in refinement [4] Hence the first condition for the successful ap- plication of this method is knowledge of actual phases present in the sample and their crystalline structures
In this regard two powders were measured or- thorhombic Lai94Sroo6Cu04 has a slightly distorted K2NiF4-type structure (space group Bmab a =53510(2) A b =53692 A(2) c = 131931(7) A) and tetragonal Lai76Sro24Cu04 (space group I4mmm a =37711(3) A c = 132580(8) A) Data were collected for each specimen separately and for a specimen obtained by mixing the same pow- ders Because diffracted intensity of each phase was lower for the mixture counting time was pro- portionally increased to obtain roughly the same counting statistics Figure 19 shows two partially separated orthorhombic (020) (200) and (040) (400) peaks overlapped with tetragonal (110) and (220) reflections During the profile fitting of the mixed powders (200) orthorhombic peak tended to disappear on account of neighboring (020) and
(110) reflections Its intensity was constrained to vary in range plusmn 30 of (020) peak intensity which can be justified if the crystallographic structure is known
60
-60
345
345
335 29 (deg)
345
Fig 19 (upper) Lai76Sro24Cu04 (110) peak (middle) Lai94Sroo6Cu04 (020) and (200) peaks (lower) (110) (020) and (200) peaks
Table 7 contains results of fitted specimen-Voigt functions as well as size and strain values obtained by the analysis of broadening Comparing integral breadths of the starting and mixed powders some profiles change from more Cauchy-like to Gauss- like and vice versa This is especially evident for the (400) reflection meaning that accurate deter- mination of the profile tails is indeed affected in the cluster of overlapping peaks However integral breadth does not change significantly so results of
343
Volume 98 Number 3 May-June 1993
Journal of Research of the National Institute of Standards and Technology
Table 7 Comparison between two specimens run separately and mixed togetlier
Specimen hkl 2Hdeg) )3cO PoO DUA) (D)v(A) (e2laquoD)v2))laquoxlO
Lai76Sroj4CuOr 110 3369 0058(6) 0094(7) 780(60) 850(60) 10(1) 220 7073 022(2) 013(2)
LaiMSro(KiCu04 020 3342 0084(9) 055(14) 500(90) 1000(200) 07(1) 040 7012 010(2) 014(1) 200 3353 00216(85) 0061(8) 1100(100) 1200(100) 03(1) 400 7040 0026(11) 0088(8)
Mix 110 3367 0083(21) 0064(14) 800(300) 1200(300) 08(3) Lai76Sro24Cu04 220 7072 019(7) 013(4)
+ 020 3343 0066(35) 0070(23) 800(300) 1000(300) 07(4) Lai94Sroo6Cu04 040 7012 0116(93) 013(5)
200 3354 0024(156) 0071(61) 900(700) 1000(600) 04(12) 400 7041 011(2) 0003(320)
the multiple-line methods are not much influenced On the contrary the single-line method gives quite different results This may support the conclusion of Suortti Ahtee and Unonius [43] that the Voigt function fails to account properly for size and strain broadening simultaneously if only Cauchy integral breadth determines crystallite size
Table 7 shows that the results of Warren- Averbach analysis of starting and mixed powders agree in the range of standard deviations How- ever errors are much larger especially for the hid- den (200)-(400) reflections From Eq (62) it follows that more counts (longer counting times) and more observables (smaller step-size) would lower standard deviations Therefore in the case of highly overlapping patterns to obtain desirable ac- curacy much longer measurements are needed al- though that will not change the fact that higher overlapping implies intrinsically higher errors of all refinable parameters To further minimize possible artifacts of the fitting procedure it is desirable to include in the analysis as many reflections in the same ciystallographic direction as possible
55 Remarks
By modeling the specimen size and strain broad- ening with the simple Voigt function it is possible to obtain domain sizes and strains that agree with experiment and show a logical interrelationship Furthermore the Voigt function shows the correct 1A(26y asymptotic behavior of peak tails as ex- pected from kinematical theory [139] However if the specimen profile is significantly asymmetric (because of twins and extrinsic stacking faults [140 59]) or the ratio FWHM^ is not intermediate to the Cauchy (2Tr) and Gauss (2(ln27r)^) functions then the Voigt function can not be applied [25]
Suortti Ahtee and Unonius [43] found good over- all agreement by fitting the Voigt function to the pure-specimen profiles of a Ni powder deconvo- luted by the instrumental function However more accurate comparison is limited because of unavoid- able deconvolution ripples of specimen profiles Furthermore the Voigt function might not be flex- ible enough to model a wide range of specimen broadening as well as the different causes of broadening Therefore the question whether the Voigt function can satisfactorily describe complex specimen broadening over the whole 20 range in a general case needs further evaluation
This method of Fourier analysis with the as- sumed profile-shape function is most useful in cases when the classical Stokes analysis fails there- fore when peak overlapping occurs and specimen broadening is comparable to instrumental broaden- ing It was shown that for a high degree of peak overlapping the fitting procedure can give unreli- able results of Gauss and Cauchy integral breadths that is the peak can change easily from predomi- nantly Cauchy-like to Gauss-like and contrary This can lead to illogical values of size-integral and strain-integral breadths according to Eqs (52) (53) (54) and (55) and to irregularities in the be- havior of Fourier coefficients for large L Simulta- neously if the size-broadened profile has a large Gauss-function contribution the hook effect will occur However volume-weighted domain sizes D)y and MSS eL)) for small L are much less affected because they rely on both Cauchy and Gauss parts of the broadened profile Any integral- breadth method that attempts to describe the size and strain broadening exclusively by a Cauchy or Gauss function in this case fails completely For specimens with lower crystallographic symmetry
344
Volume 98 Number 3 May-June 1993
Journal of Research of the National Institute of Standards and Technology
when many multiple-order reflections are avail- able but the peaks are overlapped it is therefore desirable to include in the analysis as many reflec- tions as possible to minimize the potential artifacts of the fltting process
6 Analysis of Superconductors 61 (La-M)2Cu04 Superconductors
Bednorz and Miiller [16] found the first high- temperature oxide superconductor in the La-Ba- Cu-O system Soon after substituting Ba with Sr and Ca Kishio et al [17] found superconductivity in two similar compounds Later many compounds with much higher transition temperatures (Tc) were found The (La-M)2Cu04 system remains favorable for study because the cation content responsible for the superconductivity is easier to control and measure than the oxygen stoichiometry Also this system provides a wide range of substitutional cation solubility in which the tetragonal K2NiF4- type structure is maintained Compared with much- studied Y-Ba-Cu-O this structure is simpler because it contains only one copper-ion site and two oxygen-ion sites
The undoped compound La2Cu04 is orthorhom- bic at room temperature It becomes superconduct- ing either with cation substitution on La sites or increased oxygen content to more than four atoms per formula unit Doping with divalent cations in- creases the itinerant hole carriers in the oxygen- derived electron band [141] which probably causes the superconductivity However different dopants influence the transition temperature Tc Although the unit-cell c-parameter simply reflects ionic dopant size [142] the in-plane unit-cell parameter (and accordingly the Cu-0 bond length) correlates with Tc for different dopants and for different dop- ing amounts [142 143]
LaiB5MouCu04 (M = Ba Ca Sr) have a tetrago- nal K2NiF4-type structure space group lAlmmm with four atoms in the asymmetric unit [117] One site is occupied with La partially substituted with dopant ions (Fig 20) La2Cu04 is orthorhombic at room temperature The best way to correlate these two structures is to describe La2Cu04 in space group Bmab the c axis remains the same tetrago- nal [110] and [110] directions become [010] and [100] orthorhombic axes and size of the unit cell is doubled [144]
Figure 21 shows parts of the x-ray diffraction patterns observed and refined of Lai85Moi5Cu04 (M = Sr Ba Ca) and La2Cu04 Refined lattice
parameters are given in Table 8 Table 9 shows resuhs of the line-broadening analysis Relatively
La(BaCaSr)
0(2)
0(1)
Fig 20 Ciystal structure of (La-M)2Cu04 showing one unit cell
300 JUU
(b)
200
100
U 0 M J Js-r-^
30
-30
300
40 41 42 43 44 45 40 41 42 43 44 45 29 (deg) 29 (deg)
mdashA-
gt t 200
Z
F-
- 100
(c)
f V kgt ii I 40 41 42 43 44 45 40 41 42 43 44 45
e (deg) ^^ 26 (deg)
-30 wwX mdash Wlaquo-
Fig 21 Diffraction patterns of LaiH5Moi5Cu04 specimens (a) M=Sr (b) M = Ba (c)M = Ca (d) M = U
345
Volume 98 Number 3 May-June 1993
Journal of Research of the National Institute of Standards and Technology
Table 8 Lattice parameters and T^ at zero resistivity (Ac method at 10 Ma current)
Specimen a (A) bk) c(A) rc(K)
Lairaquo5Sroi5Cu04 377814(7)
Lairaquo3Baoi3Cu04 37846(2)
LaiiijCaoi5Cu04 37863(7)
La2Cu04 53558(2) 54053(2)
231(2) 36
288(4) 28
17(2) 19
1451(8)
Table 9 Results of line-broadening analysis for (La-M)2Cu4 specimens
Specimen hkl PcO PoO (DUk) (Iraquo)(A) lte^((D)2))
Lai(laquoSroj5Cu04 004 006
0046(4) 0083(5)
0024(8) ltio-
1700(300) 2000(200) 000049(9)
110 0110(5) ltio- 470(20) 940(20) 000044(6) 220 0171(9) ltio-
Lai85Baoi3Cu04 004 006
0049(6) 0110(7)
0076(6) 0089(9)
1100(200) 1100(100) 00011(2)
110 0087(4) 000042(6) 560(20) 1110(20) 000024(5) 220 0116(3) ltio-5
Laiji5Caoi5Cu04 004 006
0120(13) 0146(12)
0032(22) 0033(27)
440(70) 780(90) 00007(4)
110 0045(25) 0200(19) 340(30) 360(20) 00013(2) 220 0343(22) ltio-
La2Cu04 004 006
0061(8) 0124(7)
0045(9) ltio-
1100(100) 1200(100) 00008(1)
020 0074(10) 0078(10) 680(50) 760(50) 00007(2) 040 0210(30) 0026(81) 200 0074(8) 0061(10) 680(50) 810(50) 00003(3) 400 0130(10) 0023(95)
weak peak broadening was observed which can not be attributed to the proximity of the phase trans- formation Lai85SroisCu04 is tetragonal down to = 170 K [145] Lai85Baoi5Cu04 to 140 K [146147] and Lai85Caoi5Cu04 to 130 K [148] Another possi- ble reason for peak broadening might be continu- ous compositional variations in dopant content The scanning Auger microprobe analysis of La2-SrtCu04 compounds [149] showed that grain- boundary segregation of Sr is weak and limited to a narrow region near the grain surface In the case of the separation of two phases with different Sr con- tent and similar lattice parameters asymmetry of some reflections would be observed [150] More- over in the case of compositional inhomogeneity microstrains eL)) would be roughly independent of the averaging distance L in the grains [151] therefore distribution of strains would be Gaus- sian For all specimens microstrain behavior is identical it decreases linearly with distance L
Rothman and Cohen [115] showed that such be- havior of microstrains is caused by dislocations that might arise during grinding Assuming the same applied stress microstrain would be approximately inversely proportional to the elastic moduli of these materials If mean microstrain is defined as the arithmetic average of strains for the [001] and [110] directions results agree with values of the Youngs moduli for polycrystalline La2Cu04 Lai85Moi5Cu04 (M = Sr Ba Ca) [152] However other factors may contribute to the microstrain Coordination-6 ionic radii of La^+ Sr Ba^+ Ca^+ are 106 116 136 100 A respectively [153] Substitution of La with ions of different sizes affects the lattice parameter [142] and may cause much larger strains in the [001] direction when some of the ions are replaced with Ba^ than with Sr^ in accord with results in Table 9 Substitution of Ca^^ ions produces an entirely different effect microstrains in the [110] direction are larger This may be explained by
346
Volume 98 Number 3 May-June 1993
Journal of Research of the National Institute of Standards and Technology
comparing effects of substitutional ions on the unit-cell a -parameter The Ba-doped specimen has a larger a-parameter than the Sr-doped but the Ca-doped a-parameter is largest although Ca^^ has the smallest ionic size This should increase the cell distortion in the a-b plane
Table 9 reveals high anisotropy in these materi- als consistent with other physical properties such as thermal expansion [154] and upper critical mag- netic field [155] Differences of domain sizes might arise from a layered structure in the [001] direction and consequently easy incorporation of stacking faults between regularly stacked layers The stack- ing-fault and twin-fault probabilities can be esti- mated from the average surface-weighted domain sizes [59]
^ = TAN + cf1fun(aa) (75) m im - (D)
Here c is a constant for the particular [hkl] direction and fun(a a) a linear combination of stacking-fault probability and twin-fault probability a The exact form of Eq (75) was derived only for the cubic and hexagonal crystal structures On con- dition that the true domain dimension D is isotropic or so large that the second term of Eq (75) dominates a linear function of stacking-fault and twin-fault probability is
fun(aa) = c( 1
) (76) Zgt)J (Dgttrade
Here c denotes a constant that depends only on geometrical factors and is the same for all three doped compounds
Figure 22 shows a possible correlation between Tc and fault-defect probabilities computed from TEM observations of La2-jcSrCu04 revealed that stacking-fault density increased with Sr content up to jc = 015 [156] That study suggests that a shear mechanism forming the fault-boundary dislocations implies oxygen vacancies andor cation deficiency We did not measure oxygen content but neutron- diffraction studies showed that oxygen deficiency starts to appear at much higher Sr content [157] However the increase of fault probability with the simultaneous decrease of microstrain in Fig 22 supports the assumption that defects are intro- duced to accommodate lattice strains [156] A simi- lar increase in Te was found in Y2Ba4Cu802o-laquo thin films [158] Compounds with asymmetric broad- ened and shifted peaks showed higher Tc which
was attributed to stacking faults Although extrinsic stacking faults may cause asymmetric peak broad- ening [140] it is probably caused by twinning Twinning in La-M-Cu-0 materials is less abundant than in Y-Ba-Cu-O compounds but it was ob- served in (La-Sr)2Cu04 monocrystals on (110) planes [159] In the profile-fitting procedure peak asymmetry is incorporated only in the instrumental function therefore we could not model asymmetric peak broadening However any significant asym- metry of the specimen profile would cause an un- even fit of low-angle and high-angle sides of peaks which was not observed This gives much more im- portance to stacking faults in Eq (76)
Fig 22 Arithmetic average of [110] and [001] root-mean- square strains and linear function of stacking-fault and twin- fault probabilities as a function of Tc
In Fig 22 average microstrains defined as the arithmetic average of [001] and [110] directions correlate inversely with Tc However we did not find a correlation of Tc and microstrains in a partic- ular direction [001] microstrains simply reflect dif- ference in size of dopant and host La^ ions (see Table 9)
In La2Cu04 (OkO) reflections are significantly broader than (hOO) This has also been observed in low-temperature orthorhombic Lai85Sroi5Cu04 and Lai85Baoi5Cu04 [160] and explained by either stacking faults or possible lower symmetry Our results reveal that domain sizes (D) have identical values for [010] and [100] directions (Table 9) From Eq (76) it follows that stacking-fault proba- bilities in these directions have the same values However microstrains in the [010] direction are roughly twice as large as in the [100] direction which is responsible for the different broadening In the case of doped La2Cu04 compounds different microstrains might be caused by oxygen
347
Volume 98 Number 3 May-June 1993
Journal of Research of the National Institute of Standards and Technology
vacancies ordered along one direction in the a-b plane similar to effects found in YBa2Cu307-laquo However undoped La2Cu04 is not expected to have significant o^Qgen deficiency Other possibili- ties are lower ciystallographic symmetry andor La vacancies although they were not reported for this system but La deficiency was found in an La2Co04 compound [161]
We can conclude that lattice strains and incoher- ently diffracting domain sizes confirm high an- isotropy in these materials This simple approach however does not allow unambiguous identifica- tion of the strains origin Probably the strains originate from dislocations and from different sizes of host and dopant ions Domain sizes of all com- pounds are larger in the c-direction than in the a-6 plane This indicates existence of stacking faults and twins However because estimated errors are relatively large and only three materials were stud- ied the possible connection between stacking faults and 7c needs further study
62 Bi-Cu-O Superconductors
Among the high-Tc superconductors the Bi- Cu-O compounds appear intriguing especially because their incommensurate structure modula- tion remains incompletely understood [162 163] The crystal structure consists of perovskite-like SrO-(Cu02Ca)mi-Cu02-SrO layers separated by NaCl-like BiO double layers (see Fig 23 [164]) The number m of Cu02 layers alters the supercon- ducting transition temperature Tc (for m = 12 and 3 rclaquo10 90 and 110 K respectively) This two- dimensional layered structure makes these materi- als highly anisotropic and favours the creation of defects
Bulk sintered specimens showed relatively weak peak broadening Moreover the diffraction pat- terns contained many overlapping peaks because the compound crystallizes in an orthorhombic low- symmetry space group A2aa [165] and incommen- surate modulation gives superlattice reflections All patterns revealed a strong [001] texture (Fig 24) making reflections other than (001) difficult to ana- lyze The lattice parameters vary depending on the exact compound stoichiometry and processing his- tory but characteristically they have almost identi- cal a and b parameters and large c parameter fl =54095 A 6=54202 A c =309297 A for Bi2Sr2CaCu208 (Bi-2212 [166] and A =5392 A b =5395 A c =36985 A for (BiPb)2Sr2Ca2Cu30io (BiPb-2223) [165] Thus we treated (hOO) and (0^0) reflections as single peaks Table 10 gives the
results for three specimens Bi-2212 (BiPb)2 (SrMg)2(BaCa)2Cu30io (BiPbMgBa-2223) which were one-phase specimens and BiPb-2223 con- taining approximately equal amounts of 2212 and 2223 phases The in-plane lattice parameters of 2212 and 2223 phases differ little hence only the [00] directions of the mixed-phase specimen were evaluated
b^ (c)
Fig 23 Average crystal structure of Bi2Sr2Cam-iCum04+2m for (a) m = 1 (b) w =2 (c) m =3 [164]
35
-35
42 44 46 48 50 52 54 56 58 60 62 26 (deg)
^ ^^^MK^Aa^Ndllaquop
Fig 24 Part of BiPbMgBa-2223 refined pattern There are 48 fundamental reflections in this region
Interpretation of the results in the case of these complicated compounds must be considered care- fully Microstrains are probably caused by disloca- tion arrays However substitution of different-sized ions and vacancies would also contribute to the strains as would other kinds of disorder especially
348
Volume 98 Number 3 May-June 1993
Journal of Research of the National Institute of Standards and Technology
Table 10 Results of line-btoadening analysis for Bi-Cu-O supreconductors
Specimen Phase hkl (A)
eD)sa)y^
Bi-2212 2212 008 0012
0163(8) 022(3)
001(6) 005(6)
420(80) 00021(6)
020+200 0104(4) ltio-^ 580(30) 00007(1) 040+400 018(2) 00004(6300)
BiPbMgBa-2223 7773 0010 0020
0097(1) 021(2)
00002(1700) 0007(150)
770(60) 00012(1)
020 + 200 012(27) 013(10) 380(430) 00009(71) 040 + 400 015(95) 021(33)
BiPb-73 2212 008 0012
023(2) 025(5)
0002(350) 0001(1000)
220(30) 00013(26)
2223 0010 0020
022(8) 023(99)
0092(67) 018(47)
230(190) 00012(197)
Stacking faults and twins Table 10 shows larger strains in the [001] direction that in the basal plane This can be explained by stacking disorder along the c-axis which was frequently observed in electron-diffraction patterns as streaking [167 168] Easy incorporation of stacking faults is possi- ble because of the two-dimensional weak-bonded layers (BiO double layers are spaced about 3 A apart) The difference in microstrain between in- plane and the c-direction is much smaller for the BiPbMgBa-2223 phase probably because Pb low- ers the faulting by stabilizing the higher-Tc 2223 phase [167] For the BiPb-2223 specimen with two phases there are two possibilities Either the speci- men consists mainly of a mk of two kinds of one- phase grains or both phases occur within the same grains The second possibility was confirmed exper- imentally [169 170] and our results concur be- cause microstrain in the 2212 phase is much smaller than in the one-phase Bi-2212 specimen Processing conditions and cation content probably favour development of the macroscopic inter- growth of both phases within the grains that is microscopic defects grow to sufficiently large re- gions to give a diffraction pattern of another phase with the different number of Cu02 layers As a re- sult strain is relieved and both strains and domain sizes being quite different in one-phase specimens tend to equalize
For the Bi-Cu-O specimens the mean surface- weighted domain sizes are generally smaller than for (La-M)2Cu04 compounds Therefore the com- putation of the stacking- and twin-fault probabili- ties by using Eq (75) may be wrong It would be very instructive to compare the different broaden-
ing of satellite and fundamental reflections which indicates a more pronounced stacking disorder in the modulated structure [171]
In summary we found that for both Bi-2212 and BiPbMgBa-2223 superconductors the c-axis strain exceeds the in-plane strain The BiPb-2223 specimen containing both 2212 and 2223 phases within the single grains shows smaller incoherently diffracting domains and lower c-axis strain than the one-phase specimens This fact may direct us to- ward the mechanism of the second-phase forma- tion in these materials
63 Remarks
It was shown that this particular method of the line-broadening analysis can give information about the size of incoherently diffracting domains and lattice strains in (La-M)2Cu04 and Bi-Clu-O superconductors Moreover results show high an- isotropy of both size and strain parameters as one may expect because of the layered structure of all superconducting cuprates Generally structural line broadening is not large that is a result of rela- tively large domain sizes (200-2000 A) and small strains (002-02) It is interesting to compare these values with the published results for YBa2Cu307-laquo (isotropic strains of 023 [77] and 005-03 [82]) Although the different materi- als were studied they seem too large especially be- cause they are the average of strains in different directions
The main drawback of the line-broadening the- ory is the uncertainty about the origins of the line broadening that is it is difficult to distinguish the main effects responsible for the broadening For
349
Volume 98 Number 3 May-June 1993
Journal of Research of the National Institute of Standards and Technology
the novel superconductors particularly the numer- ous defects (substitutions vacancies stacking faults dislocations and similar) can occur simulta- neously which makes it very difficult to determine their individual contributions Furthermore the crystal structures of most novel superconductors are relatively complicated The average structure has mostly a slightly distorted tetragonal symmetry very similar a and b lattice parameters and a large c parameter but c=36 for YBa2Cu307-laquo for in- stance This results in a large number of overlap- ping peaks and consequently in large errors of all results This showed especially in the case of Bi-Cu-O superconductors (see Table 10) Follow- ing the discussion of reliability of profile fitting in Sec 54 it would be desirable to include more than two reflections in the analysis of broadening but higher-order peaks are usually too weak and over- lapped One way to partially solve this problem would be a whole pattern fitting [172 173] and Rietveld structure refinement [23] in terms of size and strain parameters This requires an accurate preset function to model specimen broadening and precise definition of angular dependence of size and strain parameters The Rietveld programs that model the line broadening in terms of size and strain parameters are based either on the simpli- fied integral-breadth methods [78 95] or on the single-line method [174]
7 Conclusions
A method for analyzing the pure-specimen (structural) broadening of x-ray diffraction line profiles is proposed By modeling the specimen size and strain broadenings with the simple Voigt func- tion it is possible to obtain domain sizes and strains that agree with experiment and show a logi- cal interrelationship Furthermore some common consequences and problems in the Fourier-method analysis follow easily The specimen function is convoluted with the instrumental function to match the observed x-ray diffraction-line profile This avoids the Stokes deconvolution method thus al- lowing analysis of patterns with highly overlapping peaks and weak structural broadening Therefore the method was applied to some novel high-Tc superconductors We reached the following conclu- sions
(i) Surface-weighted domain size depends only on the Cauchy integral breadth of the size-broad- ened profile
(ii) The hook effect occurs when the Cauchy-content of the size-broadened profile is un-
derestimated that is for ^sc(n2)^3sG Usually this happens when the background is estimated too high so the long tails of the Cauchy function are prematurely cut off
(iii) It also follows from conclusion (ii) that the volume-weighted domain size can not be more than twice the surface-weighted domain size (limiting value D)v=2D)i is obtained for the pure-Cauchy size-broadened profile) Minimum value for D)J (D)j should not be less than -131
(iv) If the distortion coefficient is approxi- mated with a harmonic term this leads exactly to the Warren-Averbach method of separation of size and strain broadenings
(v) In that case mean-square strains decrease linearly with the distance L
(vi) It is possible to evaluate local strain ((e^(0))^) only in the case of pure-Gauss strain broadening Then root-mean-square strain is inde- pendent of the distance L and related to the upper limit of strain obtained from the integral breadth of the strain-broadened profile
(vii) If strain broadening is not described exclu- sively with the Gauss function the multiple-line Voigt integral breadth and Warren-Averbach analyses can not give the same results for volume- weighted domain size although D)v is defined identically in both approaches because the appar- ent strain -q = pdeg(29)cot9 is not angular- independent
(viii) Smooth size coefficients give column- length distribution functions without oscillations and make possible a computation of volume- weighted average domain sizes up to ~5000 A
(ix) Comparison with the simplified integral- breadth methods in most cases has shown not large but systematic discrepancy of results indicat- ing that size and strain broadening can not be accu- rately modeled by a single Cauchy or Gauss function Moreover the application of the single- line method is much less reliable and it should not be used where multiple reflections are available
(x) The knowledge of all phases present in the sample and their crystallographic structure is re- quired to successfully fit a cluster of overlapping peaks Although it is very difficult to accurately de- termine the Cauchy-Gauss ratio of an overlapped peak final results of domain size and strain are much less affected Therefore connecting the crys- tallite size exclusively with the Cauchy content and strain with the Gauss content of a specimen profile might be doubtful
(xi) Evaluated errors of domain sizes and strains increase substantially with the degree of
350
Volume 98 Number 3 May-June 1993
Journal of Research of the National Institute of Standards and Technology
peak overlapping Hence for complicated patterns very accurate measurements are necessary and one needs to analyze as many reflections in the same crystallographic direction as possible
(xii) Line-broadening analysis of (La-M)2Cu04 and Bi-Cu-O compounds confirms high anisotropy in these materials
(xiii) Strains in (La-M)2Cu04 probably origi- nate from dislocations and from different sizes of host and dopant ions
(xiv) Stacking-fault probability in (La-M)2Cu04 (M = Ba Ca Sr) increases with increasing Tc whereas the average strain decreases
(xv) In La2Cu04 different broadening of (lOO) and (OfcO) reflections is not caused by stacking faults
(xvi) All Bi-Cu-0 superconductors show larger strain in the c-direction than in the a-b plane which can be explained by stacking disorder along the [001] direction
(xvii) In the specimen with approximately equal amounts of Tl-2212 and TlPb-2223 phases it is likely that a secondary phase develops by the growth of the microscopic faulted regions of the primary phase
Acknowledgments
I am thankful to Dr Harry McHenry for his support and especially to Dr Hassel Ledbetter for his wise guidance and most useful help during my stay at NIST I am also indebted to my home insti- tution the Faculty of Metallurgy of the University of Zagreb for allowing me the leave of absence at NIST
8 References
[1] W Friedrich P Knipping and M v Laue Ann Physik 41 971 (1912)
[2] H M Rietveld Acta Cryst 22 151 (1967) [3] H M Rietveld J Appl Cryst 2 65 (1969) [4] S A Howard and K D Preston in Modern Powder Dif-
fraction Vol 20 The Mineralogical Society of America Washington DC (1989) p 217
[5] D Taupin J Appl Cryst 6 266 (1973) [6] T C Huang and W Parrish Appl Phys Lett 27 123
(1975) [7] M K Wu J R Ashburn C J Torng P H Hor R L
Meng L Gao Z J Hwang Y Q Wang and C W Chu Phys Rev Lett 58 908 (1987)
[8] D Shi MRS Bull 16 37 (1991) [9] D Larbalestier Phys Today 44 74 (1991)
[10] J C Phillips Phys Rev B 4512647 (1992) [11] B Raveau Phys Today 45 53 (1992) [12] A J Millis and K M Rabe Phys Rev B 38 8908 (1988)
[13] F Guinea Europhys Lett 7 549 (1988) [14] C P Dhard and P Singh in Proc Int Symp High-Temp
Supercond Jaipur India Oxford amp IBH Publishing New Delhi (1988) p 271
[15] J D Jorgensen Phys Today 44 34 (1991) [16] J G Bednorz and K A Muller Z Phys B 64 189
(1986) [17] K Kishio K Kitazawa S Kaube I Yasuda N Sugii H
Takagi S Uchida K Fueki and S Tanaka Chem Lett 429 (1987)
[18] J D Jorgensen B Dabrowski S Pei D G Hinks L Soderholm B Morosin J E Venturini and D S Ginley Phys Rev B 38 11337 (1988)
[19] J R Clem Phys Rev B 43 7837 (1991) [20] M Paranthaman M Foldejiki D Balzar H Ledbetter
A J Nelson and A M Hermann submitted to Phys Rev B
[21] A R Stokes Proc Phys Soc Lond 61 382 (1948) [22] B E Warren and B L Averbach J Appl Phys 23 497
(1952) [23] R Delhez Th H de Keijser and E J Mittemeijer in
Accuracy in Powder Diffraction S Block and C R Hub- bard eds Natl Bur Stand (US) Special Publication 567 (1980) p 213
[24] H P Klug and L E Alexander X-ray Diffraction Proce- dures 2nd Edition John Wiley New York (1974) p 661
[25] J I Langford J Appl Ciyst 11 10 (1978) [26] J I Langford in Accuracy in Powder Diffraction S
Block and C R Hubbard eds Natl Bur Stand (US) Special Pubication 567 (1950) p 255
[27] R Delhez Th H de Keijser and E J Mittemeijer Fre- senius Z Anal Chem 312 1 (1982)
[28] A J C Wilson Proc Phys Soc Lond 80 286 (1962) [29] A J C Wilson Proc Phys Soc Lond 81 41 (1963) [30] L P Smith Phys Rev 46 343 (1934) [31] H C Burger and P H van Cittert Z Phys 79 722
(1932) [32] S Ergun J Appl Ciyst 1 19 (1968) [33] R Croche and L Gatineau J Appl Ciyst 10479 (1977) [34] L H Schwarz and J B Cohen Diffraction from Materi-
als Academic Press New York (1977) p 391 [35] R Delhez Th H de Keijser E J Mittemeijer and J I
Langford J Appl Cryst 19 459 (1986) [36] R Delhez Th H de Keijser E J Mittemeijer and J I
Langford Aust J Phys 41 213 (1988) [37] R A Young and D B Wiles J Appl Cryst 15 430
(1982) [38] W Voigt Stizungsber K Bayer Akad Wiss 42 603
(1912) [39] E E Whiting J Quant Spectrosc Radiat Transfer 8
1379 (1968) [40] G K Wertheim M A Butler K W West and D N E
Buchanan Rev Sci Instrum 111369 (1974) [41] M M Hall Jr V G Veeraraghavan H Rubin and P G
Winchell J Appl Cryst 10 66 (1977) [42] A Brown and J W Edmonds Adv X-Ray Anal 23 361
(1980) [43] P Suortti M Ahtee L Unonius J Appl Cryst 12 365
(1979) [44] T Sundius J Raman Spectrosc 1 471 (1973) [45] B H Armstrong J Quant Spectrosc Radiat Transfer 7
61 (1967) [46] J F Kielkopf J Opt Soc Am 63 987 (1973) [47] B P Asthana and W Kiefer Appl Spectr 36 250
(1982)
351
Volume 98 Number 3 May-June 1993
Journal of Research of the National Institute of Standards and Technology
[48] J P M de Vreede S C Mehrotra A Tal and H A Dijkerraan Appl Spectr 36 227 (1982)
[49] F R L Schoening Ada Ciyst 18 975 (1965) [50] P Scherrer Gott Nachr 2 98 (1918) [51] A R Stokes and A J C Wilson Proc Cambridge
Philos Soc 38 313 (1942) [52] A J C Wilson X-Ray Optics 2nd edition Methuen
London (1962) [53] S Leie and T R Anantharaman Proc Indian Acad
Sci Sect A H 261 (1966) [54] D Louer D Weigel and J I Langford J Appl Ciyst
5 353 (1972) [55] A J C Wilson J Appl Ciyst 2 181 (1969) [56] J I Langford and A J C Wilson J Appl Ciyst 11102
(1978) [57] A R Stokes and A J C Wilson Proc Phys Soc Lond
56174 (1944) [58] B E Warren and B L Averbach J Appl Phys 21 595
(1950) [59] B E Warren X-Ray Diffraction Addison-Wesley
Reading Massachusetts (1969) p 264 [60] B E Warren in Progress in Metal Physics Vol 8 Perg-
amon Press London (1959) p 146 [61] F Bertaut C R Acad Sci Paris 228 187 (1949) [62] N C Haider and C N J Wagner Acta Cryst 20 312
(1966) [63] D Balzar and H Ledbetter in Proceedings of the Accu-
racy in Powder Diffraction II Natl Inst Stand Technol (1992) p 37
[64] D Balzar and H Ledbeter J Appl Cryst 26 (1993) in press
[65] J N Eastabrook and A J C Wilson Proc Phys Soc Lond B 65 67 (1952)
[66] R S Smith IBM J Res Develop 4 205 (1960) [67] B Y Pines and A F Sirenko Soviet Physics Ciyst 715
(1962) [68] G B Mitra and N K Misra Acta Ciyst 22 454 (1967) [69] A Gangulee J Appl Ciyst 7 434 (1974) [70] J Mignot D Rondot Acta Met 231321 (1975) [71] J Mignot and D Rondot Acta Ciyst A 33 327 (1977) [72] R K Nandi H K Kuo W Schlosberg G Wissler J B
Cohen and B Crist Jr J Appl Ciyst 17 22 (1984) [73] M Zocchi Acta Ciyst A 36164 (1980) [74] P Ramarao and T R Anantharaman Trans Ind Ins
Metals 18 181 (1965) [75] R K Nandi and S P Sen Gupta J App Cryst 11 6
(1978) [76] Th H de Keijser J I Langford E J Mittemeijer and
B P Vogels J Appl Ciyst IS 308 (1982) [77] A Williams G H Kwei R B Von Dreele A C Lar-
son L D Raistrick and D L Bish Phys Rev B 37 7960 (1988)
[78] A C Larson and R B Von Dreele Los Alamos Na- tional Laboratory Report No LA-UR-86-748 (1988)
[79] J D Jorgensen D H Johnson M H Mueller J G Worlton and R B Von Dreele in Proceedings of the Conference on Diffraction Profile Analysis Cracow Poland (1978) p 20
[80] R B Von Dreele J D Jorgensen and C G Windsor J Appl Ciyst 15 581 (1982)
[81] P Thompson D E Cox and J B Hastings J Appl Ciyst 20 79 (1987)
[82] J P Singh R A Guttschow D S Kupperman J T Dusek and R B Poeppel in High Temperature Super-
conducting Compounds III S Whang A Gupta and E Ceilings eds TMS AIME Warrendale (1991) p 281
[83] M O Eatough D S Glnley and B Morosin Adv X- Ray Anal 33 145 (1990)
[84] E J Peterson P J Kung R E Muenchausen and D M Smith in Proceedings of the 41st Annual Denver Conference on Applications of X-Ray Analysis Colo- rado Springs Colorado (1992) p 74
[85] M Rand J I Langford and J S Abell submitted to J Cryogenics (1992)
[86] D Balzar J Appl Ciyst 25 559 (1992) [87] D Balzar H Ledbetter and A Roshko Physica C 185-
189 871 (1991) [88] D Balzar and H Ledbetter J Mater Sci Lett 111419
(1992) [89] D Balzar H Ledbetter and A Roshko Pow Diffr 8
(1993) in press [90] S Johnson M Gusraan D Rowcliffe T Geballe and J
Sun Adv Ceram Mater 2 337 (1987) [91] H Ledbetter S A Kim R B Goldfarb and K Togano
Phys Rev B 39 9689 (1989) [92] H Friedman Electronics 132 (1945) [93] W Parrish (ed) in Advances in X-Ray Diffractometry
and X-Ray Spectrography Centrex Publishing Company Eindhoven The Netheriands (1962)
[94] W Soller Phys Rev 24158 (1924) [95] S A Howard R L Snyder J Appl Ciyst 22 238
(1989) [96] G H Stout and L H Jensen X-Ray Structure Determi-
nation 2nd edition Wiley New York (1989) p 373 [97] D E Appleman and T Evans Jr Final Report 92-14
US Geological Survey Washington DC (1973) Avail- able as NTIS Document No PB-216188
[98] M U Cohen Rev Sci Instrum 6 68 (1935) [99] M U Cohen Rev Sci Instrum 7 155 (1936) [100] M H Mueller L Heaton and K T Miller Acta Ciyst
13 828 (1960) [101] R A Young P E Mackie and R B Von Dreele J
Appl Ciyst 10 262 (1977) [102] D B Wiles and R A Young J Appl Cryst 14 149
(1981) [103] J K Yau and S A Howard J Appl Ciyst 22 244
(1989) [104] S A Howard J K Yau and H U Anderson J Appl
Phys 65 1492 (1989) [105] S Enzo G Fagherazzi A Benedetti and S Poilizzi J
Appl Ciyst 21 536 (1988) [106] A Benedetti G Fagherazzi S Enzo and M
Battagliarin J Appl Cryst 21 543 (1988) [107] Th H de Keijser E J Mittemeijer and H C F Rozen-
daal J Appl Ciyst 16 309 (1983) [108] Y Zhang J M Stewart C R Hubbard and B Mo-
rosin Adv X-Ray Anal 33 373 (1990) [109] Y Wang S Lee and Y Ue J Appl Ciyst IS 35
(1982) [110] V N Selivanov and E F Smislov Zavod Lab 57 28
(1991) [Ill] A Guinier X-Ray Diffraction W H Freeman San
Francisco (1963) p 139 [112] M Wilkens J Appl Cryst 12119 (1979) [113] D Du and Y Wang Pow Diffr 2180 (1987) [114] A P Prudnikov Yu A Brychkov and O L Marichev
Integrals and Series Vol 1 Gordon and Breach Am- sterdam The Netheriands (1986) p 344
352
Volume 98 Number 3 May-June 1993
Journal of Research of the National Institute of Standards and Technology
[115] R L Rothman and J B Cohen J Appl Phys 42 971 (1971)
[116] T Adier and C R Houska J Appl Phys 50 3282 (1979)
[117] C R Houska and T M Smith J Appl Phys 52 748 (1981)
[118] S Rao and C R Houska Acta Ciyst A 4214 (1986) [119] J I Langford R Delhez Th H de Keijser and E J
Mittemeijer Ausi J Phys 41173 (1988) [120] J I Langfoid J Appl Cryst IS 315 (1982) [121] M J Turunen Th H de Keijser R Delhez and N M
van der Pers J Appl Ciyst 16176 (1983) [122] A J C Wilson Acta Ciyst 23 888 (1967) [123] A J C Wilson Acta Ciyst A 24 478 (1968) [124] A J C Wilson Acta Ciyst A 25 584 (1969) [125] G Gagliotti A Paoletti and F P Ricci Nucl Instrum
3 223 (1958) [126] J I Langford R J Cernik and D Louer J Appl
Ciyst 24 913 (1991) [127] J I Langford in Accuracy in Powder Diffraction II
preprint [128] A J C Wilson Mathematical Theory of X-Ray Powder
Diffractometiy Centrex Eindhoven The Netherlands (1963)
[129] J L Langford Prog Ciyst Growth and Charact 14185 (1987)
[130] T G Fawcett C E Crowder S J Brownell Y Zhang C R Hubbard W Schreiner G P Hamill T C Huang E Sabino J I Langford R Hamilton and D Louer Pow Diffr 3 209 (1988)
[131] W L Smith J Appl Ciyst 9187 (1976) [132] J L Langford and D Louer J Appl Ciyst 15 20
(1982) [133] Fl Popescu and L Benes Acta Ciyst A 33 323 (1977) [134] P PSuse^cu R MSnaila M Popescu and E Jijovici j
Appl Cryst 7 281 (1974) [135] P F Bley Y Calvayrac and M Fayard J Appl Ciyst
7 493 (1974) [136] B Moraweck Ph de Montgolfier and A J Renouprez
J Appl Ciyst 10191 (1977) [137] A Le Bail and D Louer J Appl Cryst 11 50 (1978) [138] D R Buchanan R L McCuUough and R L Miller
Acta Ciyst 20 922 (1966) [139] P Suortti and L D Jennings Acta Cryst A 33 1012
(1977) [140] J B Cohen and C N J Wagner J Appl Phys 33 2073
(1962) [141] A Bianconi J Budnick A M Flank A Fontaine P
Lagarde A Marcelli H Tolentino B Chamberland C Michel B Raveau and G Demazeau Phys Lett A127 285 (1988)
[142] K Fueki K Kitazawa K Kishio T Hasegawa S Uchida H Takagi and S Tanaka in Chemistiy of High- Temperature Superconductors D L Nelson M S Whittingham and T F George eds American Chemi- cal Society (1987) p 38
[143] T Fujita Y Aoki Y Maeno J Sakurai H Fukuba and H Fujii J Appl Phys 26 U68 (1987)
[144] R M Hazen in Physical Properties of High-rc Super- conductors Vol 2 D M Ginsberg ed World Scien- tific Singapore (1990) p 121
[145] J B Torrance A Bezinge A I Nazzal T C Huang S P Parkin D T Keane S J LaPlaca P M Horn and G A Held Phys Rev B 40 8872 (1989)
[146] J D Axe A H Moudden D Hohlwein D E Cox K
M Mohanty A R Moodenbaugh and Y Xu Phys Rev Lett 62 2751 (1989)
[147] T Suzuki and T Fujita Physica C 159 111 (1989) [148] T Fujita and Y Maeno in Superconducting Materials
JJAP Series 1 (1988) p 34 [149] A Roshko and Y-M Chiang J Appl Phys 66 3710
(1989) [150] D E Cox S C Moss R L Meng P H Hor and C W
Chu J Mater Res 31327 (1988) [151] B Crist and J B Cohen J Polym Sci 17 1001 (1979) [152] H Ledbetter S Kim and A Roshko Z Phys B 89275
(1992) [153] R D Shannon and C T Prewitt Acta Ciyst B 25 925
(1969) [154] M Lang H Spille F Steglich Y Hidaka T Murakami
and Y Endoh Physica C 162-1641037 (1989) [155] Y Hidaka and T Murakami Phase trans 15 241
(1989) [156] P L Gai and E M McCarron Science 247 553 (1990) [157] T Kamiyama I Izumi H Asano H Takagi S Uchida
Y Tokura E Takayama-Muromachi M Matsuda K Yamada Y Endoh and Y Hidaka Physica C 172 120 (1990)
[158] A Kapitulnik Physica C 153-155 520 (1988) [159] L A Muradyan V N Molchanov R A Tamazyan and
V I Simonov Physica C 162-164 536 (1989) [160] P Day M Rosseinsky K Prassides W I F David O
Moze and A Soper J Phys C 20 L429 (1987) [161] J T Lewandowski R A Beyerlein J M Longo and R
A McCauley J Amer Ceram Soc 69 699 (1986) [162] R Ramesh G van Tendeloo G Thomas S M Green
Y Mei C Jiang and H L Luo Appl Phys Lett 53 2220 (1988)
[163] J Schneck L Pierre J C Tolddano and C Daguet Phys Rev B 39 9624 (1989)
[164] O Eibl Physica C 168 215 (1990) [165] W Carrilo-Cabrera and W Gopel Physica C 161 373
(1989) [166] P Bordet J J Capponi C Chaillout J Chenavas A
W Hewat E A Hewat J L Hodeau M Marezio J L Tholence and D Tranqui Physica C 156189 (1988)
[167] R Ramesh K Remschnig J M Tarascon and S M Green J Mater Res 6 278 (1991)
[168] Z Hiroi Y Ikeda M Takano and Y Bando J Mater Res 6 435 (1991)
[169] Y Inoue M Hasegawa Y Shichi I Munakata M Ya- manaka S Hiyama and O Nittono J Mater Res 5 737 (1990)
[170] R Ramesh B G Bagley J M Tarascon S M Green M L Rudee and H L Luo J Appl Phys 67 379 (1990)
[171] X B Kan J Kulik P C Chow S C Moss Y F Yan J H Wang and Z X Zhao J Mater Res 5 731 (1990)
[172] G S Pawley J Appl Ciyst 13 630 (1980) [173] H Toraya J Appl Ciyst 19 440 (1986) [174] L Lutterotti and P Scardi J Appl Ciyst 23 246
(1990)
About the author Davor Balzar is with Faculty of Metallurgy of the University of Zagreb Sisak Croatia and was a Guest Researcher at fflST The National Institute of Standards and Technology is an agency of the Technology Administration US Department of Commerce
353
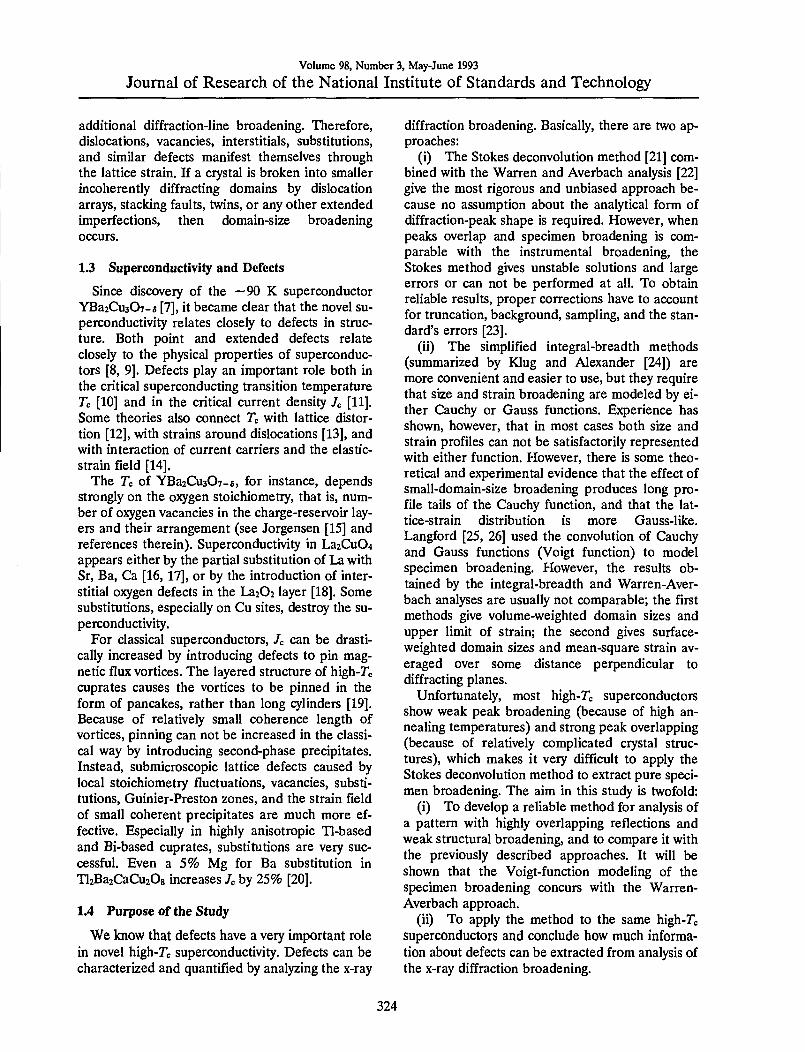
Volume 98 Number 3 May-June 1993
Journal of Research of the National Institute of Standards and Technology
additional diffraction-line broadening Therefore dislocations vacancies interstitials substitutions and similar defects manifest themselves through the lattice strain If a crystal is broken into smaller incoherently diffracting domains by dislocation arrays stacking faults twins or any other extended imperfections then domain-size broadening occurs
13 Superconductivity and Defects
Since discovery of the ~90 K superconductor YBa2Cu307-laquo [7] it became clear that the novel su- perconductivity relates closely to defects in struc- ture Both point and extended defects relate closely to the physical properties of superconduc- tors [8 9] Defects play an important role both in the critical superconducting transition temperature Tc [10] and in the critical current density c [H] Some theories also connect Tc with lattice distor- tion [12] with strains around dislocations [13] and with interaction of current carriers and the elastic- strain field [14]
The Tc of YBajCuaOv-ji for instance depends strongly on the ojq^gen stoichiometry that is num- ber of oxygen vacancies in the charge-reservoir lay- ers and their arrangement (see Jorgensen [15] and references therein) Superconductivity in La2Cu04 appears either by the partial substitution of La with Sr Ba Ca [16 17] or by the introduction of inter- stitial oxygen defects in the La202 layer [18] Some substitutions especially on Cu sites destroy the su- perconductivity
For classical superconductors c can be drasti- cally increased by introducing defects to pin mag- netic flux vortices The layered structure of high-Tc cuprates causes the vortices to be pinned in the form of pancakes rather than long qflinders [19] Because of relatively small coherence length of vortices pinning can not be increased in the classi- cal way by introducing second-phase precipitates Instead submicroscopic lattice defects caused by local stoichiometry fluctuations vacancies substi- tutions Guinier-Preston zones and the strain field of small coherent precipitates are much more ef- fective Especially in highly anisotropic Tl-based and Bi-based cuprates substitutions are very suc- cessful Even a 5 Mg for Ba substitution in Tl2Ba2CaCu208 increases c by 25 [20]
14 Purpose of the Study
We know that defects have a very important role in novel high-Tc superconductivity Defects can be characterized and quantified by analyzing the x-ray
diffraction broadening Basically there are two ap- proaches
(i) The Stokes deconvolution method [21] com- bined with the Warren and Averbach analysis [22] give the most rigorous and unbiased approach be- cause no assumption about the analytical form of diffraction-peak shape is required However when peaks overlap and specimen broadening is com- parable with the instrumental broadening the Stokes method gives unstable solutions and large errors or can not be performed at all To obtain reliable results proper corrections have to account for truncation background sampling and the stan- dards errors [23]
(ii) The simplified integral-breadth methods (summarized by Klug and Alexander [24]) are more convenient and easier to use but they require that size and strain broadening are modeled by ei- ther Cauchy or Gauss functions Experience has shown however that in most cases both size and strain profiles can not be satisfactorily represented with either function However there is some theo- retical and experimental evidence that the effect of small-domain-size broadening produces long pro- file tails of the Cauchy function and that the lat- tice-strain distribution is more Gauss-like Langford [25 26] used the convolution of Cauchy and Gauss functions (Voigt function) to model specimen broadening However the results ob- tained by the integral-breadth and Warren-Aver- bach analyses are usually not comparable the first methods give volume-weighted domain sizes and upper limit of strain the second gives surface- weighted domain sizes and mean-square strain av- eraged over some distance perpendicular to diffracting planes
Unfortunately most high-Tc superconductors show weak peak broadening (because of high an- nealing temperatures) and strong peak overlapping (because of relatively complicated crystal struc- tures) which makes it very difficult to apply the Stokes deconvolution method to extract pure speci- men broadening The aim in this study is twofold
(i) To develop a reliable method for analysis of a pattern with highly overlapping reflections and weak structural broadening and to compare it with the previously described approaches It will be shown that the Voigt-function modeling of the specimen broadening concurs with the Warren- Averbach approach
(ii) To apply the method to the same high-Tc superconductors and conclude how much informa- tion about defects can be extracted from analysis of the x-ray diffraction broadening
324
Volume 98 Number 3 May-June 1993
Journal of Research of the National Institute of Standards and Technology
2 Previous Studies 21 Size and Strain Broadening
Some important methods to extract specimen size and strain broadening and information about domain sizes and strains will be reviewed briefly An excellent review about Fourier methods and in- tegral-breadth methods is given by Klug and Alex- ander [24] A survey of single-line methods was authored by Delhez de Keijser and Mittemeijer [27] The use of variance (reduced second moment of the line profile) in the analysis of broadening will not be treated here Wilson described the con- tributions to variance by crystallite size [28] and strain [29]
211 Determination of the Pure Specimen- Broadened Profile As mentioned in Sec 12 be- fore the specimens size and strain broadening can be obtained the observed profile must be cor- rected for instrumental broadening Most used methods are the Fourier-transform deconvolution method [30 21] and simplified integral-breadth methods that rely on some assumed analytical forms of the peak profiles The iterative method of successive foldings [31 32] is not used extensively and will not be considered here
Deconvolution Method of Stokes From Eqs (2) and (3) it follows that deconvolution can be per- formed easily in terms of Fourier transforms of re- spective functions
F(n) = =H(nl G(ny (4)
Hence the physically broadened profile is re- trieved from the observed profile h without any as- sumption on the peak-profile shape (see Fig 1) This method is the most desirable approach be- cause it is totally unbiased However because of the deconvolution process there are many prob- lems Equation (4) may not give a solution if the Fourier coefficients of the profile do not vanish before those of the g profile Furthermore if physi- cal broadening is small compared with instrumen- tal broadening deconvolution becomes too unstable and inaccurate [33 34] If the h profile is 20 broader than the g profile this gives an upper limit of about 1000 A for the determination of ef- fective domain size [34] Regardless of the degree of broadening deconvolution produces unavoid- able profile-tail ripples because of truncation ef- fects To obtain reliable results these errors have to be corrected along with errors of incorrect background sampling and the standard specimen
[23 35 36] The largest problem however is peak overlapping If the complete peak is not separated the only possible solution is to try to reconstruct the missing parts That would require some as- sumption on the peak-profile shape that is intro- duction of bias into the method The application of the Stokes method is therefore limited to materials having the highest crystallographic symmetry
dh(x)
Fig 1 Observed profile n is a convolution of the instrumental profile g with the specimen profile Adapted from Warren [59]
Integral-Breadth Methods The basic assumption of these methods is that diffraction profiles can be ap- proximated with some analytical function In the beginning two commonly used functions were Gauss
(x)=(0)exp[-7|^] (5)
and Cauchy
(gt=) =(0) 4+
(6)
From the convolution integral it follows easily that
Ac = ftc + iE^c (7)
for Cauchy profiles and
l3lG = lih + Ph (8)
for Gauss profiles However the observed x-ray diffraction line profiles can not be well represented with a simple Cauchy or Gauss function [24 37] But they are almost pure Cauchy at highest angles because the dominant cause of broadening be- comes the spectral distribution in radiation [24] Different geometrical aberrations of the instru- ment are difficult to describe with simple analytical functions In the case of closely Gaussian broaden- ing of y following Eq (3) the instrumental line profile can be best described by a convolution of Cauchy and Gauss functions which is the Voigt
325
Volume 98 Number 3 May-June 1993
Journal of Research of the National Institute of Standards and Technology
function Experience shows that the Voigt function [38] (or its approximations pseudo-Voigt [39 40] and Pearson-VII [41 42]) fits very well the ob- served peak profiles [25 43 37] The Voigt func- tion is usually represented following Langford [25]
nx)=m^)Rc[ctn(^ + ik)] (9)
Here the complex error function is defined as
erfi(z) = exp( -z^) [1 - erf( -raquo)] (10)
Its evaluation can be accomplished using Sundius [44] or Armstrong [45] algorithms with eight-digit accuracy Useful information about the Voigt func- tion can be found in papers of Kielkopf [46] As- thana and Kiefer [47] and de Vreede et al [48] Figure 2 presents a Voigt function for different val- ues of Cauchy and Gauss integral breadths
causes diffraction-line broadening
12
Pc=005 pc=005
Pc = 01pc=001
PG=001PC=01
283 26
Fig 2 Voigt functions for different values of Cauchy and Gauss integral breadths Adapted from Howard and Preston [4]
Integral breadth of the Voigt function is expressed through its constituent integral breadths [49]
^ erfc(A) (11)
Here erfc denotes the complementary error func- tion
Because convolution of two Voigt functions is also a Voigt function integral breadths are easily separable conforming to Eqs (7) and (8)
212 Separation of Size and Strain Broadening After removing the instrumental broadening from the observed line profile it is possible to analyze the pure-specimen (physically) broadened line pro- file to consider the origins and amount of broad- ening
In 1918 Scherrer [50] recognized that break- ing the crystal into domains smaller than ~1000 A
ltZ)gtv = KX
3(20) cos9 (12)
The constant K depends on the crystallite shape [515253545556] but generally is close to unity The main characteristic of size broadening is that it is independent of the reflection order that is inde- pendent of diffraction angle
Most of the work on x-ray diffraction line broad- ening was done on metals and alloys It is widely accepted that plastic deformation in metals pro- duces dislocation arrays which divide crystallites into much smaller incoherently scattering domains These dislocations produce strains within the do- mains causing strain broadening It was elaborated in Sec 12 that any lattice imperfection (vacancies interstitials and substitutions) would broaden the diffraction peaks These effects would be inter- preted in the frame of this theory as a strain broad- ening too Stokes and Wilson [57] defined apparent strain as
Tj=3(20)cot0 (13)
Strain broadening is angle dependent Therefore the angle dependence of the line broadening gives a possibility to distinguish between contributions of size and strain However when we speak of size and strain broadening they may include other con- tributions For instance stacking faults and twins will contribute to broadening similar to size effects
Warren-Averbach Method This method was devel- oped originally for plastically deformed metals but since its introduction [58 22] it found successful application to many other materials The method is extensively described in Warrens publications [59 60] Each domain is represented by columns of cells along the 03 direction [61] (see Fig 3) The crystal has orthorhombic axes with the direction 03 normal to the diffracting planes (00) The experi- mentally observable diffraction power may be ex- pressed as a Fourier series
(20)=-^ 2 An expilvina^s) (14)
Here experimentally measurable coefficients Abdquo are
Nbdquo Abdquo =T^ ltexp(2m7Zbdquo)) (15)
326
Volume 98 Number 3 May-June 1993
Journal of Research of the National Institute of Standards and Technology
m 3
^i
m I
Fig 3 Representation of the crystal in terms of columns of cells along the a^ direction [59]
The Abdquo coefficients are the product of two terms The first term depends only on the column length (size coefficient) the second depends only on dis- tortion in domains (distortion coefficient)
An mdashAn An bull
Nbdquo lf = ltexp(2TrZbdquo))
(16)
(17)
It is more convenient to express the distortion coef- ficient in terms of the strain component If L =laquoa3 is the undistorted distance between a pair of cells along direction 03 and distortion changes distance by 4L = a^Zn the component of strain in the as direction (orthogonal to reflecting planes) aver- aged over distance L can be defined as (L) = A(L) L Because oil^d interplanar spacing the distortion coefficient can be rewritten
Ideg(L) = exp(2TrLe(L)d)) (18)
To obtain the strain component it is necessary to approximate the exponential term For not too large L
exp(2mLe(L)d)
laquoexp(-2Tr^L2lte2(L))d^) (19)
This relationship is exact if the distributions of e(L) for all L values follow the Gauss function and is generally true as far as terms in e^(L) because
these distributions are usually sufficiently symmet- rical [57] Now Eq (16) can be approximated as
InA L)=lnAL)- 2TTeL))LW) (20)
Warren and Averbach [22] derived this relation- ship in a similar way It separates size and strain contributions to the broadening and allows for their simultaneous evaluation
If the size coefficients are obtained by applica- tions of Eq (20) it is possible to evaluate the aver- age surface-weighted domain size and the surface-weighted column-length distribution func- tion [59]
idAHL) ^ 1_
Ps(L) dMU) dL^
(21)
(22)
Figure 4 shows how (D) can be obtained from both the size coefficients ^^(L) and the column- length distribution function
Fig 4 Surface-weighted domain size is determined (a) by the intercept of the initial slope on the L-axis (b) as a mean value of the distribution function
Multiple-Line Integral-Breadth Methods To sepa- rate size and strain broadening by using integral breadths it is necessary to define the functional form for each effect In the beginning size and strain contributions were described by Cauchy or Gauss functions Using Eqs (12) and (13) on the s scale and additive relations for the integral breadths following Eqs (7) and (8)
1 j8 =77vr + 2es (Cauchy-Cauchy) (23)
8=T^ + ^y- (Cauchy-Gauss) (24)
327
Volume 98 Number 3 May-June 1993 Journal of Research of the National Institute of Standards and Technology
^^=7^ + 4e^s^ (Gauss-Gauss) (25)
Here e = Tj4raquo4dd is the upper limit for a strain Equation (24) uses the Haider and Wagner [62] parabolic approximation for the integral breadth of the Voigt function expressed by Eq (11)
3 I3) (26)
Experience shows however that neither Cauchy nor Gauss functions can model satisfactorily size or strain broadening in a general case Langford [26] introduced the so-called multiple-line Voigt-func- tion analysis Both size-broadened and strain- broadened profiles are assumed to be Voigt functions Using Eqs (12) and (13) it follows sym- bolically for Cauchy and Gauss parts that
j8c = i3sc+j8Dcs
ph = Plc + plcs^
(27)
(28)
This approach disagrees with the Warren- Averbach analysis that is the two methods give different results (see Sec 44) [63 64]
Single-Line Methods There are cases where only the first order of reflection is available or higher- order reflections are severely suppressed (ex- tremely deformed materials multiphase com- posites catalysts and oriented thin films) Many methods exist to separate size and strain broaden- ing from only one diffraction peak However it was stated in Sec 212 that the different size and strain broadening angle dependence is a basis for their separation hence using only one diffraction line introduces a contradiction Consequently single- line methods should be used only when no other option exists The single-line methods can be di- vided in two main parts Fourier-space and real- space methods Fourier-space methods are based on the Warren-Averbach separation of size and strain broadening following Eq (20) The func- tional form of E^(L)) is assumed either to be con- stant [65666768] or assumed to depend on L as eL))=cL [69707172] Then Eq (20) can be fitted to few points of A(L) for the small averaging distance L to obtain size and strain parameters All Fourier-space methods have the serious prob-
lem that the Fourier coefficients 4 (L) are usually uncertain for small L because of the so-called hook effect [60] (see Sec 42) 2occhi [73] sug- gested that fitting the straight line through the first derivatives of the Fourier coefficients instead of through the coefficients themselves would solve the hook-effect problem
All real-space methods [747576] are based on the assumption that the Cauchy function deter- mines size and that the Gauss function gives strain The most widely used method of de Keijser et al [76] gives size and strain parameters from Cauchy and Gauss parts of the Voigt function respectively
P)v=^
e=^ 2s
(29)
(30)
22 Diffraction-Line-Broadening Analysis of Superconductors
In this field very few studies exist Williams et al [77] reported isotropic strains in YBa2Cu307-laquo powder by the simultaneous Rietveld refinement of pulsed-neutron and x-ray diffraction data Using a GSAS Rietveld refinement program [78] both size and strain broadening were modeled with the Gauss functions for the neutron-diffraction data [79 80] and with the Cauchy functions for the x- ray diffraction data (modified method of Thomp- son Cox and Hastings [81]) Interestingly both the neutron and x-ray data gave identical values for the isotropic strain (023) and no size broaden- ing Singh et al [82] studied internal strains in YBa2Cu307-laquo extruded wires by pulsed-neutron diffraction They separated size and strain parame- ters by means of Eq (25) (Gauss-Gauss approxi- mation) Size broadening was found to be negligible but (isotropic) microstrains range from 005 for the coarse-grained material to 03 for the fine-grained samples Eatough Ginley and Morosin [83] studied Tl2Ba2Ca2Cu30io (Tl-2223) and Tl2Ba2CaCu208 (Tl-2212) superconducting thin films by x-ray diffraction Using the Gauss-Gauss approximafion they found strains of 014-018 in both phases and domain sizes of 1200-1400 A for Tl-2212 but 500 A for Tl-2223
We are aware of only two more unpublished studies [84 85] involving size-strain analysis in high-Tc superconductors The probable reason is that any analysis is very difficult because of weak line broadening and overlapping reflections This
328
Volume 98 Number 3 May-June 1993
Journal of Research of the National Institute of Standards and Technology
precludes application of reliable analysis such as the Stokes deconvolution method with the Warren- Averbach analysis of the broadening Instead sim- ple integral-breadth methods are used which gives generally different results for each approach Moreover for x-ray diffraction broadening appli- cation of the Gauss-Gauss approximation does not have any theoretical merit although reasonable values especially of domain sizes may be obtained [86] We showed [878889] that reliable diffrac- tion-line-broadening analysis of superconductors can be accomplished and valuable information about anisotropic strains and incoherently diffract- ing domain sizes obtained
3 Experiment 31 Materials
The materials used for this study were tungsten and silver commercially available powders with nominal grain sizes 4-12 ijim La2-xSriCu04(jc = 0 006 015 024) powders Lai^Moi5Cu04(M = Ca Ba) powders Bi2Sr2CaCu208 (Bi-2212) sinter (BiPb)2Sr2Ca2Cu30io(BiPb-2223) sinter and (BiPb)2(SrMg)2(BaCa)2Cu30io (BiPbMgBa-2223) sinter
Powders with nominal compositions La2-xSrCuO4(c=0 006 015 024) and Laig5Moi5Cu04(M = Ca Ba) were prepared at the National Institute of Standards and Technology Boulder Colorado by A Roshko using a freeze- drying acetate process [90] Acetates of the various cations were assayed by mass by calcining to the corresponding oxide or carbonate The appropriate masses of the acetates for the desired compositions were dissolved in deionized water The acetate so- lutions were then sprayed through a fine nozzle into liquid nitrogen to preserve the homogeneous cation distributions Frozen particles were trans- ferred to crystallization dishes and dried in a com- mercial freeze dryer to a final temperature of 100 degC After drying the powders except the Lai^Baoi5Cu04 were calcined in alumina (998) crucibles at 675 C for 1 h in a box furnace with the door slightly open to increase ventilation Because BaCOs is difficult to decompose the Laig5Baoi5Cu04 was calcined under a vacuum of 2 Pa at 800 C for 4 h then cooled slowly in flowing oxygen (2degCmin) The calcined powders were oxidized in platinum-lined alumina boats in a tube furnace with flowing oj^gen at 700 degC After 3 h at 700 C the powders were pushed to a cold end of the furnace tube where they cooled quickly (20 Cs) while still in flowing oxygen
The cylindrical specimens (23 mm in diameter and 9 mm thick) of Bi-2212 BiPb-2223 and BiPbMgBa-2223 were prepared at the National Research Institute for Metals Tsukuba Japan by K Togano [91] Starting oxides and carbonates were Pb304 61203 CuO SrCOs MgCOs and BaC03 They were calcinated in air at 800 C for 12 h Powders were then pressed and sintered in 8 oxygen-92 argon mixture at 835 degC for 83 h Specimens were furnace cooled to 750 degC held for 3 h in flowing oxygen and then furnace cooled in ojygen to room temperature
311 Preparation of Specimens for X-ray Diffraction The bulk specimens were surface polished if necessary and mounted in specimen holders Coarse-grained powders of La2-cSrxCu04 (x=Q 006 015 024) and Lai8sMoi5Cu04 (M = Ca Ba) were ground with a mortar and pestle in toluene and passed through a 635-mesh sieve (20-|xm nominal opening size) Silver and tungsten powders were dry ground with a mortar and pestle All powders were mixed with about 30 silicone grease and loaded into rectangular cavities or slur- ried with amyl acetate on a zero-background quartz substrate
32 Measurements
X-ray-diffraction data were collected using a standard two-circle powder goniometer in Bragg- Brentano parafocusing geometry [92 93] (see Fig 5) A flat sample is irradiated at some angle incident to its surface and diffraction occurs only from crystallographic planes parallel to the speci- men surface The goniometer had a vertical 0-26 axis and 22 cm radius CnKa radiation ex- cited at 45 kV and 40 mA was collimated with Seller slits [94] and a 2 mm divergence slit SoUer slits in the diffracted beam 02 mm receiving slit and Ge solid-state detector were used in a step- scanning mode (OOI7IO s for a standard specimen 002deg-005730-80 s for other specimens depending on the amount of broadening)
33 Data Analysis
The diffractometer was controlled by a com- puter and all measurements were stored on hard disc Data were transferred to a personal computer for processing
We used computer programs for most calcula- tions X-ray diffraction patterns were fitted with the program SHADOW [95] This program allows a choice of the fitting function and gives refined positions of the peak maximums intensities and function-dependent parameters It also has the
329
Volume 98 Number 3 May-June 1993
Journal of Research of the National Institute of Standards and Technology
Seller Slits
Source S
Specimen
Fig 5 Optical arrangement of an x-ray diffractometer Adapted from Klug and Alexander [24]
ability to convolute the predefined instrumental profile with the specimen function to match the ob- served pattern Choice of the specimen function in- cludes Gauss and Cauchy functions We added the ability to model the specimen broadening with an exact Voigt function and implemented SHADOW on a personal computer In the fitting procedure for every peak in the pattern the program first gen- erates the instrumental profile at the required dif- fraction angle The instrumental profile is deter- mined from prior measurements on a well-annealed standard specimen (see Sec 51) Then it assumes parameters of the specimen profile For an exact Voigt function parameters are peak position peak intensity and Cauchy and Gauss integral breadths of the Voigt function By convoluting the instru- mental profile with the specimen profile and adding a background the calculated pattern is ob- tained [Eq (2)] Parameters of the specimen profile are varied until the weighted least-squares error of calculated and observed patterns Eq (59) reaches a minimum This process avoids the unstable Stokes deconvolution method It is possible that the refine- ment algorithm is being trapped in a false minimum [96] but it can be corrected by constraining some parameters Refined parameters of the pure-speci- men profile are input for the size-strain analysis of the broadening A program for this analysis was written in Fortran
Lattice parameters of powder specimens were calculated by the program NBSLSQ85 based on the method of Appleman and Evans [97] A pro- gram in Fortran was written to apply corrections to observed peak maximums by using NIST standard reference material 660 LaB6 as an external stan-
dard Lattice parameters of bulk specimens were determined by the Fortran program which uses a modified Cohens method [9899100] to correct for systematic diffractometer errors Lattice parame- ters were also calculated by the Rietveld refinement programs GSAS [78] and DBW32S [101 102]
4 Methodology
When instrumental and specimen contributions to the observed line profile must be modeled sepa- rately adopting a specimen function is a critical step Yau and Howard [103104] used Cauchy and Enzo et al [105] pseudo-Voigt functions Benedetti Fagherazzi Enzo and Battagliarin [106] showed that modeling the specimen function with the pseudo-Voigt function gives results comparable to those of the Stokes deconvolution method when combined with the Warren-Averbach analysis of Fourier coefficients De Keijser Mittemeijer and Rozendaal [107] analytically derived domain sizes and root-mean-square strains for small averaging distance L in the case of the Voigt and related func- tions
The aim here is to study more thoroughly the consequences of assumed Voigt specimen function on the size-strain analysis of the Fourier coeffi- cients of the broadened peaks It is shown that some experimentally observed interrelations between derived parameters (particularly volume-weighted and surface-weighted domain sizes) and their be- havior (the hook effect and dependence of mean- square strains on the averaging distance) can be explained by this simple assumption Moreover the discrepancy between the integral-breadth methods and Warren-Averbach analysis results from differ- ent approximations for the strain broadening and the background experimental errors
41 Separation of Size and Strain Broadenings
The normalized Fourier transform of a Voigt function is easily computable [46]
^ =exD[-2laquo^e^-7m^^fi^l fan ^bdquo-exp|^ ^ cr(2e) ^ a^(2e) T ^^^^
It is convenient to express Fourier coefficients in terms of distance L by immediately making the ap- proximation A (26) = Ascos do
AL) = exp[-2L^-7rL^pl] (32)
330
Volume 98 Number 3 May-June 1993
Journal of Research of the National Institute of Standards and Technology
Equation (32) is a good approximation even for large specimen broadening Even for a profile span of A (29) = 80deg the error made by replacing this in- terval by an adequate A(sin9 ) range is 2 How- ever strictly speaking the profile will be asym- metrical in reciprocal space and Fourier-interval limits will not correspond to the 29i and Idz peak- cutoff values in real space It is important to keep Fourier interval limits identical for all multiple-or- der reflections otherwise serious errors in the sub- sequent analysis will occur [108] If higher accuracy for a considerable broadening is desired profile fit- ting can be accomplished In terms of the recipro- cal-space variable s instead of in a real 29 space
Assuming that only the Cauchy function deter- mines domain size [4(L) = exp(-L(Z))s)] and only the Gauss function gives root-mean-square strain (RMSS) [^deg(L) = exp(-27r=L2(e)d^)] Eq (32) leads to the Warren-Averbach [Eq (20)] for the separation of size and strain contribution [62] Experience shows that Cauchy and Gauss functions can not satisfactory model specimen broadening Balzar and Ledbetter [64] postulate that the speci- men function includes contributions of size and strain effects both approximated with the Voigt functions Because the convolution of two Voigt functions is also a Voigt function Cauchy and Gauss integral breadths of the specimen profile are easily separable
3c=i3sc + 3DC (33)
(34)
Langford [26] separated the contributions from size and strain broadening in a similar way (See Eqs (27) and (28)) Note however that Eqs (33) and (34) do not define size and strain angular or- der-dependence
Because Fourier coefficients are a product of a size and a distortion coefficient from Eqs (32) (33) and (34) we can obtain the separation of size and strain contributions to the pure specimen broadening
^S(L) = exp(-2Li3sc-TrL^3io) (35)
Adeg(L) = eM-2LpDc-TrL^Phc) (36)
Wang Lee and Lee [109] modeled the distortion coefficient and Selivanov and Smislov [110] mod- eled the size coefficient in the same way
To obtain size and distortion coefficients at least two reflections from the same crystallographic- plane family must be available
42 Size Coefficient
Surface-weighted domain size is calculated from the size coefficients following Eq (21) From Eq (35) we obtain
lt^gts = 1
2i3sc (37)
Therefore surface-weighted domain size depends only on the Cauchy part of the size-integral breadth
The second derivative of the size coefficients is proportional to the surface-weighted column-length distribution function Eq (22) The volume- weighted column-length distribution function fol- lows similarly [111]
p(L)ocL^j^ (38)
By differentiating Eq (35) twice we obtain
^^4^ = [(2^L^ic + 2^sc)^- dL
2TrplcAL) (39)
Because the column-length distribution function should always be positive [59] the Cauchy part must dominate Inspection of Eq (39) shows that for small L we must require
(40)
Otherwise the hook effect will occur in the plot of size coefficientsI (L) versus L that is the plot will be concave downward for small L (Fig 6) The hook effect is usually attributed to experimental errors connected with the truncation of the line profiles and consequently overestimation of background [59] This is a widely encountered prob- lem in the Fourier analysis of line broadening It results in overestimation of effective domain sizes and underestimation of the RMSS [36] Some authors [106] claim that the preset specimen- broadening function eliminates the hook effect However Eq (39) shows that effectively too high
331
Volume 98 Number 3 May-June 1993
Journal of Research of the National Institute of Standards and Technology
08-
04-
mdash^ 1 J 1 x
^~ ( ^ ^ i I
1 t 1 11
jl u
V 1 iJ
J
c^
100 200
Fig 6 (upper) The hook effect of the size coefficients A ^ (full line) at small L (lower) it causes negative values (set to zero) of the column-length distribution functions
background causes underestimation of the Cauchy content of the Voigt function because the long tails are truncated prematurely It has to be men- tioned that Wilkens [112] proposed tilted small-an- gle boundaries to be the source of the hook effect Liu and Wang [113] defined a minimum particle size present in a specimen depending on the size of the hook effect Figure 6 shows that negative values of the column-length distribution functions (set to zero) do not affect the shape but shift the entire distribution toward larger L values
Note also that the surface-weighted column- length distribution function ps(L) will usually have a maximum at L = 0 but for the particular ratio of integral breadths determined by Eq (40) it can be zero The volume-weighted column-length distribu- tion function7v(L) will always have a maximum for LsO
If the column-length distribution functions are known it is possible to evaluate mean values of respective distributions
lt^kv =
00
J ^ _0
(L)dL
raquosv(L)dL (41)
Integrals of this type can be evaluated analytically [114]
OQ
J cexp( - to^ - a )dc = i^y^ ^ of
hd^^^^fe)]- (^2)
Surface-weighted domain size (D)s must be equal to the value obtained from Eq (37) The volume- weighted domain size follows
ltD)v = ^^erfc(A) = js (43)
Using Eqs (37) and (43) we can evaluate the ratio of domain sizes
i^ = 7r lt^gts
= 2vn-^exp(A2)erfc(^) (44)
Theoretically k can change from zero to infinity However the minimum value of k is determined by Eq (40)
1V2 ltk lt laquogt (45)
Hence the ratio of domain sizes can change in a limited range (see also Fig 7)
131laquo V2^ erfc (^ ) s ^ lt 2 (46)
10^ 10^ 10- 10deg 10 10^ 10-
Fig 7 The ratio of volume-weighted and surface-weighted domain sizes as a function of the characteristic ratio of Cauchy and Gauss integral breadths k
332
Volume 98 Number 3 May-June 1993
Journal of Research of the National Institute of Standards and Technology
It may be noted that most experiments give the ratio D)vD)s in this range (see for instance re- view by Klug and Alexander [24]) When k goes to infinity the size broadening is given only by the Cauchy component and (JD)V=2(D)S This is a case of pure Cauchy size broadening described by Haider and Wagner [62] and de Keijser Mittemei- jer and Rozendaal [107] It is possible to imagine a more complicated column-length distribution func- tion [27] than Eq (39) which would allow even larger differences between surface-weighted and volume-weighted domain sizes However we are not aware of any study reporting a difference larger than 100
43 Distortion Coefficient
In Sec 212 it was shown that the distortion co- efficient can be approximated by the exponential
Adeg(L) = exp(-ITTVLeL))) (47)
Comparing with Eq (36) we can write
Therefore mean-square strains (MSS) decrease linearly with averaging distance L This behavior is usually observed in the Warren-Averbach analysis Rothman and Cohen [115] showed that such be- havior would be expected of strains around disloca- tions Adler and Houska [116] Houska and Smith [117] and Rao and Houska [118] demonstrated for a number of materials that MSS can be repre- sented by a sum of two terms given by Cauchy and Gauss strain-broadened profiles
However for i3Dc=0 the MSS are independent ofL
(^2)12 ^ ^Dc(2g) cotg = ^ 2V2 V2TT
(49)
where the upper limit of strain e is defined as 7j4 (see Sec 212) This is a limiting case of pure- Gauss strain broadening described by de Keijser Mittemeijer and Rozendaal [107]
44 Discussion
To calculate domain sizes and strain it is neces- sary to define size and distortion integral-breadths angular order-dependence From Eq (43) It fol- lows that the domain size D )v is always indepen- dent of the order of reflection
)3sc = const JSSG = const
However from Eq (48) we find
^^ = const ^^ = const
(50)
(51)
An important consequence is that apparent strain TJ will be independent of angle of reflection only in the case of pure-Gauss strain broadening because 3DC and JSDG depend differently on the dif- fraction angle If we compare Eq (51) with the multiple-line Voigt-function analysis [26] given by Eqs (27) and (28) it is evident that they disagree Therefore recombination of constituent integral breadths 3DC and 3DO to Voigt strain-broadened in- tegral breadth Pdeg and the subsequent application of Eq (49) to calculate strain [26 119] will concur with the Fourier methods if strain broadening is entirely Gaussian and for the asymptotic value of MSS ((e^( 00))) However neither volume-weighted domain sizes D)y will agree although they are de- fined identically in both approaches because size- broadened and strain-broadened integral breadths are dependent variables
If at least two orders of reflection ( and +1) of the same plane (hkl) are available using Eqs (50) and (51) we can solve Eqs (33) and (34)
(52)
^^deg sl + l)-sil) ^^^^
^^=sHl + l)-sl) [fc( + l)-3c()3 (54)
^^=sl + l)-sl) [^(^ + ^)-^(0]- (55)
If we substitute these expressions into Eqs (35) and (36) we see that this approach leads exactly to the Warren-Averbach Eq (20) for two orders of reflections This is expected because the distortion coefficient is approximated with the exponential (47)] Delhez de Keijser and Mittemeijer [23] ar- gued that instead of Eq (20) the following rela- tion would be more accurate
A(L)=AXL) (1 -27r^(e^(L))LVd (56)
333
Volume 98 Number 3 May-June 1993
Journal of Research of the National Institute of Standards and Technology
These two approximations differ with fourth-order terms in the power-series expansion In terms of this approach Eq (48) has to be rewritten
2r ^^ l-exp(-2LI3DC-TTL^0DG) (57)
This means that even if the strain-broadened pro- file is given entirely by the Gauss function the MSS depend on distance L (see Fig 8) In this ap- proximation no simple relation for the distortion integral-breadths angular order-dependence exists For not so large L however Eq (51) holds and approximations from Eqs (20) and (56) do not dif- fer much (see Fig 8)
1500 Warren- Averbach approximation ^
Delhez de Kcijscr and ^^^ Minemeijer approximation ^y^
^ 1000 A
500
mdashI
1 1
Oc 300 600 IL k^) X 10^
90
o ^ 60 A
30
1
J Warren- Averbach approximation
Delhez de Keijser and Minemeijer approximation
0 0 150 300
1L (A-1 ) X 10^
Fig 8 Mean-square strains pound^(L)) for two approximations of the distortion coefficient (upper) Voigt strain broadening (lower) pure-Gauss strain broadening
Generally it was shown that in the size-broad- ened profile the Cauchy part must dominate No similar requirement for the strain-broadened pro- file exists However experience favors the assump- tion that it has to be more of Gauss-type The Warren-Averbach approach is exact if strain broad- ening is purely Gaussian so Eqs (20) and (48) are
better approximations as strain profile is closer to the Gauss function In any case both approaches given by Eqs (20) and (56) are good up to the third power in strain and the Warren-Averbach relation [Eq (20)] does not assume that MSS are independent of distance L [27] it also represents a harmonic approximation
If at least two orders of reflection from the same plane (hkl) are available we can use Eqs (52) (53) (54) and (55) to calculate size-related and strain-related integral breadths Subsequent appli- cation of Eqs (37) (43) and (48) gives directly domain sizes (D) and (D)v and mean-square strains (e^(L)) This approach is more straightfor- ward and much simpler than the original Warren- Averbach analysis Great care should be given to the possible systematic errors The easiest way to observe the hook effect is to plot column-length distribution functions as a function of averaging distance L If they show negative values for small L (see Fig 6) all derived parameters will be in error This is because (i) only the positive values of the column-length distribution functions are numeri- cally integrated or (ii) the intercept on the L-axis of the linear portion of the A^ vs L curve is taken (see Fig 4) always larger values of domain sizes will be obtained than by the application of Eqs (37) and (43) Therefore we conclude that the dis- crepancy between integral-breadth and Fourier methods is always present by the appearance of the hook effect in the A^ vs L curve An analogous discrepancy exists between integral-breadth and variance methods [119] In such cases correction methods for truncation can be applied [35 119 120] but the best procedure is to repeat the pat- tern fitting with the correct background
In the Fourier analysis it is usually observed that the mean-square strains diverge as the averaging distance L approaches zero This also follows from Eqs (48) and (57) However because the MSS de- pendence on distance L is not defined in Warren- Averbach analysis it was suggested [27 107 121] that local strain can be obtained by taking the sec- ond derivative of the distortion coefficient or by a Taylor-series expansion of local strain Therefore we obtain from Eq (36)
i^m-M^-^) (58)
It is evident that this relation is wrong It holds only for a special case of pure-Gauss strain-broad- ened profile when the MSS are equal for any L Otherwise if the Cauchy function contributes to
334
Volume 98 Number 3 May-June 1993
Journal of Research of the National Institute of Standards and Technology
strain broadening all derivatives of strain in L = 0 are infinite and local strain can not be defined If the main origin of strains is dislocations [115] strains are defined after some distance from the dislocation (cutoff radius) to be finite Averaging strains over a region smaller than the Burgers vector is probably not justified For instance Eq (48) gives even for a small averaging distance L = 1 A and considerable strain broadening (J3DG(20) = 3DC(20) = 1O) root-mean-square strain eL = 1A))^ laquo02 that is about the elastic limit
45 Random Errors of Derived Parameters
Errors in size and strain analysis of broadened peaks are relatively difficult to evaluate Following Langford [26] sources of the systematic errors in- clude choice of standard specimen background and type of analytical function used to describe the line profiles The first two errors should be mini- mized in the experimental procedure Errors caused by inadequate choice of specimen function would systematically affect all derived results but they can not be evaluated Random errors caused by counting statistics have been computed by Wilson [122 123 124] and applied to the Stokes deconvolution method by Delhez de Keijser and Mittemeijer [23] as well as by Langford [26] and de Keijser et al [76] using single-line Voigt-func- tion analysis Nevertheless the approximate error magnitude can be calculated from estimated stan- dard deviations (esd) of the parameters refined in the fitting procedure In the program SHADOW the weighted least-squares error is minimized
7wp mdash RES
Here
)=1
RES = 2 vfi [ (obs) - (cal)]
(59)
(60)
and weights are the reciprocal variances of the ob- servations
H = l(obs) (61)
Each line profile has four parameters varied inde- pendently position intensity and Cauchy and Gauss integral breadths of the Voigt profile In least-squares refinement esds are computed as
^^ bu RES (62) m mdashm
Here ba are diagonal elements of the inverse matrix of the equation coefficients m is the number of observations and m is the number of refined parameters The main source of errors is integral breadths Errors in peak position peak intensity and background are much smaller and can be ne- glected in this simple approach For two indepen- dent variables )3G and Pc covariance vanishes and from Eqs (37) and (38) for the two orders of re- flection and +1 it follows that
RD =
si+i)m)RHMi))+si)m+i)i^(3c(+D)
(63)
ReL)r) =
pHDRHPcG)) + m + miPcJl + D) 2[3c(+1) - i8c()3+TTL [m+1) - mw
-n-LmiDRHihd))+m+mWcH+i))i ^ 2[)3c(+1) - iSc()+TTLim+1) - mw
(65)
Here Rx) are relative standard deviations The error in D would be complicated to evaluate but because 131D)s^(Igt)vlt2(pound))s Eq (63) gives a good estimation for the error in (Z))v as well Alter- natively to see how errors depend on the Fourier coefficients errors can be estimated from the Warren-Averbach relationship [Eq (20)] (86) From Eq (32) it follows that
RA (L)) = ATr^Lpos)R^2d)) +
4Lph(s)RPci2e)) (66)
Errors in root-mean-square strains and domain sizes are
i^((e^(L ))bulllaquo) =
RHA(Ll))+RHA(Ll + l)) (67)
ALl + l)
335
Volume 98 Number 3 May-June 1993
Journal of Research of the National Institute of Standards and Technology
^^laquo^))=(T^)
s(l + 1)RHA (Ll)) +SV)RHA (Ll + D) lsl + l)-sl)f (68)
Here (D) is approximately defined with A^(L) = l-L(D)j Errors in Fourier coefficients increase with L while factors in Eqs (67) and (68) lower the errors for large L In general errors of domain sizes and strains are of the same order of magnitude as errors of integral breadths [86]
5 Application 51 Correction for Instrumental Broadening
Before specimen broadening is analyzed instru- mental broadening must be determined This is ac- complished by carefully measuring diffraction peaks of some well-annealed defect-free speci- men It is then assumed that its broadening may be attributed only to the instrument The usual proce- dure is to anneal the specimen However in some instances that is not possible because either the material undergoes an irreversible phase transition on annealing or the number of defects can not be successfully decreased by annealing Another pos- sibility is to measure the whole diffraction pattern of the material showing the minimal line broaden- ing and then to synthesize the instrumental profile at the needed diffraction angle This approach re- quires the modeling of the angle dependence of the instrumental (standard) parameters Cagliotti Pao- letti and Ricci [125] proposed the following func- tion to describe the variation of the full width at the half maximum of profile with the diffraction angle
F9miA^(2e) = Utan^9 + Vtand + W (69)
Although this function was derived for neutron dif- fraction it was confirmed to work well also in x-ray diffraction case [126 127] A more appropriate function for the x-ray angle-dispersive powder dif- fractometer based on theoretically predicted er- rors of some instrumental parameters [128] may be the following [129]
FWHNf (2 e) = W+Vsin^l 6 +
UtanH + UcotH (70)
This function may better model the increased axial divergency at low angles and correct for the speci- men transparency [129] However contrary to the requirement on the specimen function most im- portant for the instrumental function is to correctly describe the angular variation of parameters re- gardless of its theoretical foundation
When specimen broadening is modeled with a Voigt function the simplest way to correct for the instrumental broadening is by fitting the line pro- files with the Voigt function too Cauchy and Gauss integral breadths of the specimen-broad- ened profile are then easily computable by Eqs (7) and (8) However because the instrumental broad- ening is asymmetric [24] modeling with the sym- metric Voigt function can cause a fictitious error distribution resulting in errors of strain up to 35 [76] Another approach is to model the instrumen- tal-broadening angle dependence by fitting the profile shapes of a standard specimen with some asymmetrical function split-Pearson-VII [95] or pseudo-Voigt convoluted with the exponential function [105] The instrumental function can then be synthesized at any desired angle of diffraction and convoluted with the assumed specimen func- tion to match the observed profile by means of Eq (2)
In the program SHADOW instrumental para- meters are determined by fitting the split-Pearson VII function (see Fig 9) to line profiles of a standard specimen
iix)=m- 2 m
with
c =-
mc^f
mm) mv-rim-12)
(71)
(72)
Here m = 1 or m = ltraquo yields a Cauchy or Gauss function respectively Refined full widths at half maximum (FWHM) and shape factors m for both low-angle and high-angle sides of the profiles are fitted with second-order polynomials To fit the FWHM we used Eq (69) and for the shape fac- tors
m(2e) = U(20f + V(2e) + W (73)
The resulting coefficients U V W U V and W permit synthesis of the asymmetrical instrumental line profile at any desired angle
336
Volume 98 Number 3 May-June 1993
Journal of Research of the National Institute of Standards and Technology
2 0(deg)
le
Fig 9 A split-Pearson VII profile The two half profiles have same peak position and intensity Adapted from Howard and Preston [4]
The basic requirement on the standard specimen is however to show as small a line broadening as possible To minimize physical contributions to the Une broadening of the standard specimen a few moments were emphasized as follows Because dif- fraction-line width depends strongly on degree of annealing it is preferable to use some reference powder-diffraction standard Furthermore asym- metry in the peak profiles is introduced by axial divergence of the beam flat specimen surface and specimen transparency [24] Choosing a standard specimen with low absorption coefficient would cause transparency effects to dominate If the stud- ied specimen has a large absorption coefficient (compared to the standard) this might produce a fictitious size contribution and errors in micro- strains All of the specimens studied have absorp- tion coefficients exceeding 1000 cm^ so a NIST standard reference material 660 LaBe was chosen to model the instrumental broadening (p = 1098 cm) According to Fawcett et al [130] LaBe showed the narrowest lines of all studied com- pounds Furthermore LaB6_has a primitive cubic structure (space group Pm3m) resulting in rela- tively large number of peaks equally distributed over 26 This allows for better characterization and lower errors of FWHMs and shape factors of split- Pearson VII functions (Fig 10)
52 Applicability of the Method
To study the applicability of method described in Sec 4 we first studied simple cubic-structure mate- rials such as silver and tungsten Tungsten has very narrow line profiles allowing us to obtain the up- per limit of domain sizes that can be studied Silver is easily deformed which provides a possibility to apply the method to broad line profiles To test the
009
-a
OH
006
003
1 1 m low-angle side n m high-angle side
bullz w 2 o OH
X
tancopy
Fig 10 Refined FWHMs and shape factors (exponents) m for low-angle and high-angle sides of LaBe line profiles Second- order polynomials were fitted through points
case of relatively complicated patterns and weak line broadening the method was also applied to Lai85Sroi5Cu04 and La2Cu04 powders In this sec- tion only the mechanical aspects of the line broad- ening are discussed Discussion about the origins of broadening of superconductors can be found in Sec 6
521 Silver and Tungsten Powders Figure 11 shows observed and refined peaks of tungsten un- treated and silver ground powders In Table 2 are listed results of fitted pure-specimen Voigt profiles for silver and tungsten specimens Table 3 and Fig 12 give results of the line-broadening analysis Untreated tungsten powder shows relatively weak broadening Instrumental profile FWHMs at angle positions of (110) and (220) tungsten lines are 0059deg and 0081deg respectively close to values mea- sured for tungsten 0065deg and 0100deg Results in Table 3 reveal that small broadening is likely caused by domain sizes because microstrains have negligible value This pushes the limit for measur- able domain sizes probably up to 4500-5000 A However one must be aware that weak specimen broadening implies higher uncertainty of all derived parameters Moreover the choice of the instrumental standard becomes more crucial
Both silver and tungsten line profiles become more Cauchy-like after grinding which probably increases dislocation density in the crystallites This is consistent with the presumption that small crystallites and incoherently diffracting domains separated by dislocations within grains affect the tails of the diffraction-line profiles [60115] Figure 13 illustrates the dependence of MSS on the recip- rocal of the averaging distance L
337
Volume 98 Number 3 May-June 1993
Journal of Research of the National Institute of Standards and Technology
C8
z
7- ^95
29 (deg) 405
bullJf^r-
z S 08
Ez U o u OS
a
04 bull
o Es
4P
2000 z^fA
4000
B
z u f- z
425 435 445 29 (deg)
455
yr 600 SOO
L(A)
Fig 11 Observed points (pluses) refined pattern (full line) and difference pattern (below) (110) W untreated (upper) (200) Ag ground (lower)
Fig 12 Fourier coefficients for the first- (pluses) and second- order (crosses) reflection and size coefficients (circles) [111] Ag untreated (upper) [100] Ag ground (lower)
Table 2 Parameters of the pure-specimen Voigt function as obtained from profile-fitting procedure for tungsten and silver powders
Specimen hkl 2ft(deg) 3c(deg) 3G(deg) FWHM(deg) Rwp()
W untreated 110 220
4028 8705
00065(7) 00301(6)
0020(2) ltio-
0021 0019
90 44
W ground 110 220
4029 8705
0100(2) 0222(3)
0038(4) 0069(6)
0080 0166
90 42
Ag untreated 111 222 200 400
3806 8151 4425 9786
0056(1) 0105(4) 0118(2) 0274(21)
ltio- 00008(21)
ltio-^ ltio-5
0036 0067 0075 0175
105 97
105 122
Ag ground 111 222 200 400
3807 8151 4424 9783
0175(3) 0410(26) 0365(10) 1079(82)
0038(12) ltio-
0076(29) ltio-
0121 0261 0250 0687
99 145 99
145
338
Volume 98 Number 3 May-June 1993
Journal of Research of the National Institute of Standards and Technology
Table 3 Microstructural parameters for tungsten and silver powders
Specimen Direction (poundgt)raquo( A) (2))v(A) ltpound^(fl3))laquo (^laquoD)v2)gtw
W untreated [110] 3200(200) 3500(200) 000038 000008(2)
W ground [110] 620(20) 1030(30) 00023 000054(2)
Ag untreated [111] [100]
1000(20) 510(20)
2000(20) 1030(20)
00010 00022
000024(1) 000047(5)
Ag ground [111] [100]
380(20) 210(10)
650(20) 350(20)
00047 00100
000095(7) 000180(14)
100 -_ - [100) Ag ground ^ ^~ mdash C1111 Ag ground ^bull
y y
o y ^ 50 A y
y y
y
0
y - y ^--
c ) 50 100 150
lLfAjxlO^
Fig 13 Mean-square strains (E^) as a function of VL
Errors in integral breadths allow estimation of errors in strain and size parameters (Sec 45) but in some cases the refinement algorithm gives unre- liable errors of integral breadths When a particu- lar parameter is close to the limiting value (for instance 10^ degrees has been put as the mini- mum value for integral breadths) errors become large However in Eqs (63) (65) (66) (67) and (68) only the product of integral breadth and ac- companying error is significant which is roughly equal for Cauchy and Gauss parts Errors of do- main sizes and strains are of the same order of magnitude as errors of integral breadths
The possible source of systematic error is poten- tial inadequacy of Voigt function to accurately de- scribe specimen broadening This effect can not be evaluated analytically but it would affect all derived parameters especially the column-length distribution functions The logical relationship be- tween values of domain sizes (see Table 3) for dif- ferent degrees of broadening indicates that possible systematic errors can not be large
Equation (41) allows computation of volume- weighted and surface-weighted average domain sizes if respective column-length distribution func- tions can be obtained Figure 14 gives surface- weighted and volume-weighted average column- length distribution functions following Eqs (39) and (38) Width of the distribution function deter- mines the relative difference between (D) and (pound))v The broader the distribution the larger the differences because small crystallites contribute more to the surface-weighted average That is much more evident comparing the surface- weighted column-length distribution with the vol- ume-weighted If they have similar shape and maximum position as in Fig 15 differences are small Conversely if the surface-weighted distribu- tion function has a sharp maximum toward smaller sizes differences are larger (see Fig 14) The dif- ference between (poundgt)s and (D)v and the actual mean dimension of the crystallites in a particular direction also depends strongly on the average shape of the crystallites [52 131 132]
If experimental profiles are deconvoluted by the Stokes method even for considerable specimen broadening size coefficients A ^ usually oscillate at larger L values [59 106] preventing computation of the column-length distribution function Few techniques were used to deal with this problem successive convolution unfolding method [32 133] smoothing and iterative methods [134 135 136 137] Figures 14 and 15 show very smooth column- length distribution functions However they follow from size coefficients ^4^ that depend on the accu- racy of the approximation for the distortion coeffi- cient given by Eq (47) Equation (47) is exact if the strain distribution is Gaussian but in general holds only for small harmonic numbers n if strain broadening is not negligible
339
Volume 98 Number 3 May-June 1993
Journal of Research of the National Institute of Standards and Technology
500 1000 L(A)
Fig 14 Surface-weighted and volume-weighted column-length distribution functions normalized on unit area [111] Ag un- treated (upper) [100] Ag ground (lower)
Fig 15 Surface-weighted and volume-weighted column-length distribution functions for [010] La2Cu04 normalized on unit area
522 La2-xSrtCu04 Powders To test the applicability of the discussed method to more com- plicated patterns two compounds with lower crystallographic symmetry were studied Lai85Sroi5Cii04 has a tetragonal K2NiF4-type struc- ture space group lAlmmm La2Cu04 is orthorhom-
bic at room temperature Both compounds show slight line broadening and relatively highly overlap- ping peaks (see Fig 16) which makes it very diffi- cult if not impossible to perform a Stokes analysis
25
-25
26 (deg)
yNraquo-
Fig 16 Observed points (pluses) refined pattern (full line) convoluted profiles (dashed line) and difference plot (below) for part of La2Cu04 pattern
Tables 4 and 5 list results from the fitting proce- dure and the analysis of specimen-broadened inte- gral breadths There are no qualitative differences in results for tungsten and silver powders How- ever average errors are higher as expected be- cause of overlapping peaks while weighted errors wp are surprisingly smaller This fact illustrates the unreliability of iwp when only a segment of the pat- tern is being refined because it depends on the number of counts accumulated in points as well as on the 28 range of the refinement
Figures 17 and 18 represent Fourier coefficients of Lai85Sroi5Cu04 [110] and La2Cu04 [010] direc- tions In the second plot the A (L )-versus-L plot shows a concave-downward part near L =0 the so- called hook effect It was shown in Sec 42 that the hook effect originates because of underesti- mation of background connected with the trunca- tion of profiles In the profile refinement all peaks separated less than 4deg 20 have been included in the refinement region to avoid possible overlapping of peak tails and specimen profiles have been trun- cated below 01 of the maximum intensity How- ever because the polynomial background was determined prior to profile refinement it may be overestimated for complicated patterns containing many overlapping peaks If background is refined with other profile parameters undesirable correla- tion with integral breadths occurs
340
Volume 98 Number 3 May-June 1993
Journal of Research of the National Institute of Standards and Technology
Table 4 Parameters of the pure-specimen Voigt function as obtained from profile-fitting procedure for La2-^SrCu04 powders
Specimen hid 2Hdeg) Pen PcO FWHM(deg) Rp()
Lai85Sroi5Cu04 004 2695 0046(4) 0024(8) 0042 34 006 4092 0083(5) ltio-= 0053 62 110 3352 0110(5) ltio- 0070 125 220 7046 0171(9) ltio- 0109 43
La2Cu04 004 2713 0061(8) 0045(9) 0067 39 006 4119 0124(7) ltio-^ 0079 77 020 3316 0074(10) 0078(10) 0102 29 040 6957 0210(30) 0026(81) 0135 29 200 3345 0074(8) 0061(10) 0087 69 400 7028 0130(10) 0023(95) 0089 29
Table 5 Microstructural parameters for Laij(5Srai3Cu04 and La2Cu04 powders
Specimen Direction (DUA) Pgt(A) lte^(fl3))laquo lte2((Z)gt2))laquo
Lai83Sro5Cu04
La2Cu04
[001] [110]
[001] [010] [100]
1700(300) 470(20)
1100(100) 680(50) 680(50)
2000(200) 940(20)
1200(100) 760(50) 810(50)
00024 00017
00038 00033 00016
000049(9) 000044(6)
00008(1) 00007(2) 00003(3)
c i ^- raquo sect 08 bulli - U
^0
ti- bull ll bull bullbullo
ffl M P bull- u ^ Di 04 Si - M bulldiamsbullbull a bull-v 3 o ^^=s^
u ^N^Sraquoraquo^
0 ^^^aaaa 1000
L(A) 2000
OQ bullbulldego UM o z a 08
o o bull bull bull
- u u bull raquo UU bull
a diams o bull o u ft 04 bull deg raquo deg - U bull bull deg Oi bullbullgt =3 bull- l o k u
0 bullbullbullraquo aaaMMi
500 1000
L(A)
Fig 17 Fourier coefficients for the first- (pluses) and second- order (crosses) reflection and size coefficients (circles) for [110] Lai^Sroi5Cu04
Fig 18 Fourier coefficients for first- (pluses) and second- order (crosses) reflection and size coefficients (circles) for [010] La2Cu04
341
Volume 98 Number 3 May-June 1993
Journal of Research of the National Institute of Standards and Technology
S3 Comparison with the Integral-Breadth Methods
Knowing the specimen integral breadths simpli- fied methods can be applied In Sec 212 we re- viewed multiple-line and single-line integral- breadth methods We shall compare the simplified multiple-line methods [Eqs (23) (24) and (30)] and the single-line method [76] [Eqs (29) and (30)] with results obtained for silver tungsten and La2-xSrxCu04 powders (Tables 3 and 5) We did not compare with the multiple-line Voigt-function method [26] because it was shown in Sec 44 that it is incompatible with the Warren-Averbach analy- sis In Table 6 integral breadth Pi was computed according to Eq (11) This value was compared with )8A integral breadth computed from Fourier coefficients [58]
i8A=- laquo3 2^(L)
(74)
Results obtained by the Warren-Averbach analysis are significantly smaller for both size and strain Integral-breadth methods give the upper limit for strain so comparison is limited Considering the approximation e = 125e^(L))^ [138] with L=(D)v2 or L=(D)s2 strains resemble more closely than crystallite sizes It must be noted how- ever that this approximation makes sense only in the case of pure-Gauss strain broadening Benedetti et al [106] reported excellent agreement for both size and strain using Warren-Averbach and Cauchy-Gauss [Eq (24)] methods Results from Table 6 on the contrary indicate that the Gauss-Gauss approximation gives values closest to the Warren-Averbach method for crystallite sizes whereas the Cauchy-Gauss and especially the Cauchy-Cauchy approximation tend to give too large values For strain the trend is opposite The Cauchy-Cauchy approximation resembles most
Table 6 Comparison of results obtained with the integral-breadth methods Cauchy-Cauchy (C-C) Cauchy-Gauss (C-G) Gauss- Gauss (G-G) and single-line (S-L) analysis
Specimen hkl PiXKP PAXKP ltigt)v (Z)gt(A) (e^((DV2)gt2 eXlO^ (A-) (A-0 (A) C-C C-G G-G S-L xlO^ C-C C-G G-G S-L
W untreated 110 220
0259 0247
0259 0247
3500 3700 3810 3810 14500 4040
008 -001 -003 -005 024 0
W ground 110 220
125 204
125 205
1030 2240 1450 1220 940 550
054 090 093 105 045 032
Ag untreated 111 2
0600 0901
0600 0900
2000 3340 2390 2190 1670 1110
024 035 039 095 0 0
200 124 124 1030 2270 1470 1230 810 047 082 085 095 0 400 204 204 490 0
Ag ground 111 222
198 352
200 352
650 2080 1240 910 530 280
095 179 182 197 048 0
200 403 406 350 9380 4780 1320 260 180 405 405 408 082 400 803 803 120 0
Lai85Sroi3Cu04 004 006
0657 0881
0650 0880
2000 5230 3290 2660 1970 1140
049 076 078 088 044 0
110 119 119 940 1240 1000 970 840 044 052 064 080 0 220 158 158 630 0
La2Cu4 004 006
0988 132
0998 131
1200 2980 1940 1630 1490 760
08 107 112 127 081 0-
020 143 142 760 1200 910 860 1240 07 079 090 110 114 040 198 200 510 016 200 126 124 810 810 810 810 1250 03 002 011 015 089 400 1S 126 830 014
Not possible to evaluate because of too small Gauss integral breadth
342
Volume 98 Number 3 May-June 1993
Journal of Research of the National Institute of Standards and Technology
closely a Warren-Averbach method These results concur with the Klug and Alexander [24] compari- son of the published size and strain values obtained by Warren-Averbach (Stokes) and integral-breadth methods However for x-ray diffraction the Cauchy-Gauss assumption for the size-strain broadening is theoretically and experimentally more favored thpoundm the other two models The fact that the Gauss-Gauss method for crystallite size and the Cauchy-Cauchy method for strain give more realistic results may mean that the presump- tion that size and strain broadening are exclusively of one type is an oversimplification
The single-line method seems much less reliable If Gaussian breadth is very small no information about strain is obtained Moreover second-order reflections give much lower values of both size and strain than do basic reflections However if multi- ple reflections are not available the single-line method can give satisfactory estimations
54 Reliability of Profile Fitting
The profile fitting of a cluster of even severely overlapping peaks can be accomplished with a low error and excellent fit of total intensity But how reliable is information obtained about separate peaks in the cluster In the fitting procedure it is possible to put constraints on the particular profile parameter to limit intensity position and width of the peak If anisotropic broadening or different phases are present constraints may not be realistic Morever acceptable results can be obtained even using a different number of profiles in refinement [4] Hence the first condition for the successful ap- plication of this method is knowledge of actual phases present in the sample and their crystalline structures
In this regard two powders were measured or- thorhombic Lai94Sroo6Cu04 has a slightly distorted K2NiF4-type structure (space group Bmab a =53510(2) A b =53692 A(2) c = 131931(7) A) and tetragonal Lai76Sro24Cu04 (space group I4mmm a =37711(3) A c = 132580(8) A) Data were collected for each specimen separately and for a specimen obtained by mixing the same pow- ders Because diffracted intensity of each phase was lower for the mixture counting time was pro- portionally increased to obtain roughly the same counting statistics Figure 19 shows two partially separated orthorhombic (020) (200) and (040) (400) peaks overlapped with tetragonal (110) and (220) reflections During the profile fitting of the mixed powders (200) orthorhombic peak tended to disappear on account of neighboring (020) and
(110) reflections Its intensity was constrained to vary in range plusmn 30 of (020) peak intensity which can be justified if the crystallographic structure is known
60
-60
345
345
335 29 (deg)
345
Fig 19 (upper) Lai76Sro24Cu04 (110) peak (middle) Lai94Sroo6Cu04 (020) and (200) peaks (lower) (110) (020) and (200) peaks
Table 7 contains results of fitted specimen-Voigt functions as well as size and strain values obtained by the analysis of broadening Comparing integral breadths of the starting and mixed powders some profiles change from more Cauchy-like to Gauss- like and vice versa This is especially evident for the (400) reflection meaning that accurate deter- mination of the profile tails is indeed affected in the cluster of overlapping peaks However integral breadth does not change significantly so results of
343
Volume 98 Number 3 May-June 1993
Journal of Research of the National Institute of Standards and Technology
Table 7 Comparison between two specimens run separately and mixed togetlier
Specimen hkl 2Hdeg) )3cO PoO DUA) (D)v(A) (e2laquoD)v2))laquoxlO
Lai76Sroj4CuOr 110 3369 0058(6) 0094(7) 780(60) 850(60) 10(1) 220 7073 022(2) 013(2)
LaiMSro(KiCu04 020 3342 0084(9) 055(14) 500(90) 1000(200) 07(1) 040 7012 010(2) 014(1) 200 3353 00216(85) 0061(8) 1100(100) 1200(100) 03(1) 400 7040 0026(11) 0088(8)
Mix 110 3367 0083(21) 0064(14) 800(300) 1200(300) 08(3) Lai76Sro24Cu04 220 7072 019(7) 013(4)
+ 020 3343 0066(35) 0070(23) 800(300) 1000(300) 07(4) Lai94Sroo6Cu04 040 7012 0116(93) 013(5)
200 3354 0024(156) 0071(61) 900(700) 1000(600) 04(12) 400 7041 011(2) 0003(320)
the multiple-line methods are not much influenced On the contrary the single-line method gives quite different results This may support the conclusion of Suortti Ahtee and Unonius [43] that the Voigt function fails to account properly for size and strain broadening simultaneously if only Cauchy integral breadth determines crystallite size
Table 7 shows that the results of Warren- Averbach analysis of starting and mixed powders agree in the range of standard deviations How- ever errors are much larger especially for the hid- den (200)-(400) reflections From Eq (62) it follows that more counts (longer counting times) and more observables (smaller step-size) would lower standard deviations Therefore in the case of highly overlapping patterns to obtain desirable ac- curacy much longer measurements are needed al- though that will not change the fact that higher overlapping implies intrinsically higher errors of all refinable parameters To further minimize possible artifacts of the fitting procedure it is desirable to include in the analysis as many reflections in the same ciystallographic direction as possible
55 Remarks
By modeling the specimen size and strain broad- ening with the simple Voigt function it is possible to obtain domain sizes and strains that agree with experiment and show a logical interrelationship Furthermore the Voigt function shows the correct 1A(26y asymptotic behavior of peak tails as ex- pected from kinematical theory [139] However if the specimen profile is significantly asymmetric (because of twins and extrinsic stacking faults [140 59]) or the ratio FWHM^ is not intermediate to the Cauchy (2Tr) and Gauss (2(ln27r)^) functions then the Voigt function can not be applied [25]
Suortti Ahtee and Unonius [43] found good over- all agreement by fitting the Voigt function to the pure-specimen profiles of a Ni powder deconvo- luted by the instrumental function However more accurate comparison is limited because of unavoid- able deconvolution ripples of specimen profiles Furthermore the Voigt function might not be flex- ible enough to model a wide range of specimen broadening as well as the different causes of broadening Therefore the question whether the Voigt function can satisfactorily describe complex specimen broadening over the whole 20 range in a general case needs further evaluation
This method of Fourier analysis with the as- sumed profile-shape function is most useful in cases when the classical Stokes analysis fails there- fore when peak overlapping occurs and specimen broadening is comparable to instrumental broaden- ing It was shown that for a high degree of peak overlapping the fitting procedure can give unreli- able results of Gauss and Cauchy integral breadths that is the peak can change easily from predomi- nantly Cauchy-like to Gauss-like and contrary This can lead to illogical values of size-integral and strain-integral breadths according to Eqs (52) (53) (54) and (55) and to irregularities in the be- havior of Fourier coefficients for large L Simulta- neously if the size-broadened profile has a large Gauss-function contribution the hook effect will occur However volume-weighted domain sizes D)y and MSS eL)) for small L are much less affected because they rely on both Cauchy and Gauss parts of the broadened profile Any integral- breadth method that attempts to describe the size and strain broadening exclusively by a Cauchy or Gauss function in this case fails completely For specimens with lower crystallographic symmetry
344
Volume 98 Number 3 May-June 1993
Journal of Research of the National Institute of Standards and Technology
when many multiple-order reflections are avail- able but the peaks are overlapped it is therefore desirable to include in the analysis as many reflec- tions as possible to minimize the potential artifacts of the fltting process
6 Analysis of Superconductors 61 (La-M)2Cu04 Superconductors
Bednorz and Miiller [16] found the first high- temperature oxide superconductor in the La-Ba- Cu-O system Soon after substituting Ba with Sr and Ca Kishio et al [17] found superconductivity in two similar compounds Later many compounds with much higher transition temperatures (Tc) were found The (La-M)2Cu04 system remains favorable for study because the cation content responsible for the superconductivity is easier to control and measure than the oxygen stoichiometry Also this system provides a wide range of substitutional cation solubility in which the tetragonal K2NiF4- type structure is maintained Compared with much- studied Y-Ba-Cu-O this structure is simpler because it contains only one copper-ion site and two oxygen-ion sites
The undoped compound La2Cu04 is orthorhom- bic at room temperature It becomes superconduct- ing either with cation substitution on La sites or increased oxygen content to more than four atoms per formula unit Doping with divalent cations in- creases the itinerant hole carriers in the oxygen- derived electron band [141] which probably causes the superconductivity However different dopants influence the transition temperature Tc Although the unit-cell c-parameter simply reflects ionic dopant size [142] the in-plane unit-cell parameter (and accordingly the Cu-0 bond length) correlates with Tc for different dopants and for different dop- ing amounts [142 143]
LaiB5MouCu04 (M = Ba Ca Sr) have a tetrago- nal K2NiF4-type structure space group lAlmmm with four atoms in the asymmetric unit [117] One site is occupied with La partially substituted with dopant ions (Fig 20) La2Cu04 is orthorhombic at room temperature The best way to correlate these two structures is to describe La2Cu04 in space group Bmab the c axis remains the same tetrago- nal [110] and [110] directions become [010] and [100] orthorhombic axes and size of the unit cell is doubled [144]
Figure 21 shows parts of the x-ray diffraction patterns observed and refined of Lai85Moi5Cu04 (M = Sr Ba Ca) and La2Cu04 Refined lattice
parameters are given in Table 8 Table 9 shows resuhs of the line-broadening analysis Relatively
La(BaCaSr)
0(2)
0(1)
Fig 20 Ciystal structure of (La-M)2Cu04 showing one unit cell
300 JUU
(b)
200
100
U 0 M J Js-r-^
30
-30
300
40 41 42 43 44 45 40 41 42 43 44 45 29 (deg) 29 (deg)
mdashA-
gt t 200
Z
F-
- 100
(c)
f V kgt ii I 40 41 42 43 44 45 40 41 42 43 44 45
e (deg) ^^ 26 (deg)
-30 wwX mdash Wlaquo-
Fig 21 Diffraction patterns of LaiH5Moi5Cu04 specimens (a) M=Sr (b) M = Ba (c)M = Ca (d) M = U
345
Volume 98 Number 3 May-June 1993
Journal of Research of the National Institute of Standards and Technology
Table 8 Lattice parameters and T^ at zero resistivity (Ac method at 10 Ma current)
Specimen a (A) bk) c(A) rc(K)
Lairaquo5Sroi5Cu04 377814(7)
Lairaquo3Baoi3Cu04 37846(2)
LaiiijCaoi5Cu04 37863(7)
La2Cu04 53558(2) 54053(2)
231(2) 36
288(4) 28
17(2) 19
1451(8)
Table 9 Results of line-broadening analysis for (La-M)2Cu4 specimens
Specimen hkl PcO PoO (DUk) (Iraquo)(A) lte^((D)2))
Lai(laquoSroj5Cu04 004 006
0046(4) 0083(5)
0024(8) ltio-
1700(300) 2000(200) 000049(9)
110 0110(5) ltio- 470(20) 940(20) 000044(6) 220 0171(9) ltio-
Lai85Baoi3Cu04 004 006
0049(6) 0110(7)
0076(6) 0089(9)
1100(200) 1100(100) 00011(2)
110 0087(4) 000042(6) 560(20) 1110(20) 000024(5) 220 0116(3) ltio-5
Laiji5Caoi5Cu04 004 006
0120(13) 0146(12)
0032(22) 0033(27)
440(70) 780(90) 00007(4)
110 0045(25) 0200(19) 340(30) 360(20) 00013(2) 220 0343(22) ltio-
La2Cu04 004 006
0061(8) 0124(7)
0045(9) ltio-
1100(100) 1200(100) 00008(1)
020 0074(10) 0078(10) 680(50) 760(50) 00007(2) 040 0210(30) 0026(81) 200 0074(8) 0061(10) 680(50) 810(50) 00003(3) 400 0130(10) 0023(95)
weak peak broadening was observed which can not be attributed to the proximity of the phase trans- formation Lai85SroisCu04 is tetragonal down to = 170 K [145] Lai85Baoi5Cu04 to 140 K [146147] and Lai85Caoi5Cu04 to 130 K [148] Another possi- ble reason for peak broadening might be continu- ous compositional variations in dopant content The scanning Auger microprobe analysis of La2-SrtCu04 compounds [149] showed that grain- boundary segregation of Sr is weak and limited to a narrow region near the grain surface In the case of the separation of two phases with different Sr con- tent and similar lattice parameters asymmetry of some reflections would be observed [150] More- over in the case of compositional inhomogeneity microstrains eL)) would be roughly independent of the averaging distance L in the grains [151] therefore distribution of strains would be Gaus- sian For all specimens microstrain behavior is identical it decreases linearly with distance L
Rothman and Cohen [115] showed that such be- havior of microstrains is caused by dislocations that might arise during grinding Assuming the same applied stress microstrain would be approximately inversely proportional to the elastic moduli of these materials If mean microstrain is defined as the arithmetic average of strains for the [001] and [110] directions results agree with values of the Youngs moduli for polycrystalline La2Cu04 Lai85Moi5Cu04 (M = Sr Ba Ca) [152] However other factors may contribute to the microstrain Coordination-6 ionic radii of La^+ Sr Ba^+ Ca^+ are 106 116 136 100 A respectively [153] Substitution of La with ions of different sizes affects the lattice parameter [142] and may cause much larger strains in the [001] direction when some of the ions are replaced with Ba^ than with Sr^ in accord with results in Table 9 Substitution of Ca^^ ions produces an entirely different effect microstrains in the [110] direction are larger This may be explained by
346
Volume 98 Number 3 May-June 1993
Journal of Research of the National Institute of Standards and Technology
comparing effects of substitutional ions on the unit-cell a -parameter The Ba-doped specimen has a larger a-parameter than the Sr-doped but the Ca-doped a-parameter is largest although Ca^^ has the smallest ionic size This should increase the cell distortion in the a-b plane
Table 9 reveals high anisotropy in these materi- als consistent with other physical properties such as thermal expansion [154] and upper critical mag- netic field [155] Differences of domain sizes might arise from a layered structure in the [001] direction and consequently easy incorporation of stacking faults between regularly stacked layers The stack- ing-fault and twin-fault probabilities can be esti- mated from the average surface-weighted domain sizes [59]
^ = TAN + cf1fun(aa) (75) m im - (D)
Here c is a constant for the particular [hkl] direction and fun(a a) a linear combination of stacking-fault probability and twin-fault probability a The exact form of Eq (75) was derived only for the cubic and hexagonal crystal structures On con- dition that the true domain dimension D is isotropic or so large that the second term of Eq (75) dominates a linear function of stacking-fault and twin-fault probability is
fun(aa) = c( 1
) (76) Zgt)J (Dgttrade
Here c denotes a constant that depends only on geometrical factors and is the same for all three doped compounds
Figure 22 shows a possible correlation between Tc and fault-defect probabilities computed from TEM observations of La2-jcSrCu04 revealed that stacking-fault density increased with Sr content up to jc = 015 [156] That study suggests that a shear mechanism forming the fault-boundary dislocations implies oxygen vacancies andor cation deficiency We did not measure oxygen content but neutron- diffraction studies showed that oxygen deficiency starts to appear at much higher Sr content [157] However the increase of fault probability with the simultaneous decrease of microstrain in Fig 22 supports the assumption that defects are intro- duced to accommodate lattice strains [156] A simi- lar increase in Te was found in Y2Ba4Cu802o-laquo thin films [158] Compounds with asymmetric broad- ened and shifted peaks showed higher Tc which
was attributed to stacking faults Although extrinsic stacking faults may cause asymmetric peak broad- ening [140] it is probably caused by twinning Twinning in La-M-Cu-0 materials is less abundant than in Y-Ba-Cu-O compounds but it was ob- served in (La-Sr)2Cu04 monocrystals on (110) planes [159] In the profile-fitting procedure peak asymmetry is incorporated only in the instrumental function therefore we could not model asymmetric peak broadening However any significant asym- metry of the specimen profile would cause an un- even fit of low-angle and high-angle sides of peaks which was not observed This gives much more im- portance to stacking faults in Eq (76)
Fig 22 Arithmetic average of [110] and [001] root-mean- square strains and linear function of stacking-fault and twin- fault probabilities as a function of Tc
In Fig 22 average microstrains defined as the arithmetic average of [001] and [110] directions correlate inversely with Tc However we did not find a correlation of Tc and microstrains in a partic- ular direction [001] microstrains simply reflect dif- ference in size of dopant and host La^ ions (see Table 9)
In La2Cu04 (OkO) reflections are significantly broader than (hOO) This has also been observed in low-temperature orthorhombic Lai85Sroi5Cu04 and Lai85Baoi5Cu04 [160] and explained by either stacking faults or possible lower symmetry Our results reveal that domain sizes (D) have identical values for [010] and [100] directions (Table 9) From Eq (76) it follows that stacking-fault proba- bilities in these directions have the same values However microstrains in the [010] direction are roughly twice as large as in the [100] direction which is responsible for the different broadening In the case of doped La2Cu04 compounds different microstrains might be caused by oxygen
347
Volume 98 Number 3 May-June 1993
Journal of Research of the National Institute of Standards and Technology
vacancies ordered along one direction in the a-b plane similar to effects found in YBa2Cu307-laquo However undoped La2Cu04 is not expected to have significant o^Qgen deficiency Other possibili- ties are lower ciystallographic symmetry andor La vacancies although they were not reported for this system but La deficiency was found in an La2Co04 compound [161]
We can conclude that lattice strains and incoher- ently diffracting domain sizes confirm high an- isotropy in these materials This simple approach however does not allow unambiguous identifica- tion of the strains origin Probably the strains originate from dislocations and from different sizes of host and dopant ions Domain sizes of all com- pounds are larger in the c-direction than in the a-6 plane This indicates existence of stacking faults and twins However because estimated errors are relatively large and only three materials were stud- ied the possible connection between stacking faults and 7c needs further study
62 Bi-Cu-O Superconductors
Among the high-Tc superconductors the Bi- Cu-O compounds appear intriguing especially because their incommensurate structure modula- tion remains incompletely understood [162 163] The crystal structure consists of perovskite-like SrO-(Cu02Ca)mi-Cu02-SrO layers separated by NaCl-like BiO double layers (see Fig 23 [164]) The number m of Cu02 layers alters the supercon- ducting transition temperature Tc (for m = 12 and 3 rclaquo10 90 and 110 K respectively) This two- dimensional layered structure makes these materi- als highly anisotropic and favours the creation of defects
Bulk sintered specimens showed relatively weak peak broadening Moreover the diffraction pat- terns contained many overlapping peaks because the compound crystallizes in an orthorhombic low- symmetry space group A2aa [165] and incommen- surate modulation gives superlattice reflections All patterns revealed a strong [001] texture (Fig 24) making reflections other than (001) difficult to ana- lyze The lattice parameters vary depending on the exact compound stoichiometry and processing his- tory but characteristically they have almost identi- cal a and b parameters and large c parameter fl =54095 A 6=54202 A c =309297 A for Bi2Sr2CaCu208 (Bi-2212 [166] and A =5392 A b =5395 A c =36985 A for (BiPb)2Sr2Ca2Cu30io (BiPb-2223) [165] Thus we treated (hOO) and (0^0) reflections as single peaks Table 10 gives the
results for three specimens Bi-2212 (BiPb)2 (SrMg)2(BaCa)2Cu30io (BiPbMgBa-2223) which were one-phase specimens and BiPb-2223 con- taining approximately equal amounts of 2212 and 2223 phases The in-plane lattice parameters of 2212 and 2223 phases differ little hence only the [00] directions of the mixed-phase specimen were evaluated
b^ (c)
Fig 23 Average crystal structure of Bi2Sr2Cam-iCum04+2m for (a) m = 1 (b) w =2 (c) m =3 [164]
35
-35
42 44 46 48 50 52 54 56 58 60 62 26 (deg)
^ ^^^MK^Aa^Ndllaquop
Fig 24 Part of BiPbMgBa-2223 refined pattern There are 48 fundamental reflections in this region
Interpretation of the results in the case of these complicated compounds must be considered care- fully Microstrains are probably caused by disloca- tion arrays However substitution of different-sized ions and vacancies would also contribute to the strains as would other kinds of disorder especially
348
Volume 98 Number 3 May-June 1993
Journal of Research of the National Institute of Standards and Technology
Table 10 Results of line-btoadening analysis for Bi-Cu-O supreconductors
Specimen Phase hkl (A)
eD)sa)y^
Bi-2212 2212 008 0012
0163(8) 022(3)
001(6) 005(6)
420(80) 00021(6)
020+200 0104(4) ltio-^ 580(30) 00007(1) 040+400 018(2) 00004(6300)
BiPbMgBa-2223 7773 0010 0020
0097(1) 021(2)
00002(1700) 0007(150)
770(60) 00012(1)
020 + 200 012(27) 013(10) 380(430) 00009(71) 040 + 400 015(95) 021(33)
BiPb-73 2212 008 0012
023(2) 025(5)
0002(350) 0001(1000)
220(30) 00013(26)
2223 0010 0020
022(8) 023(99)
0092(67) 018(47)
230(190) 00012(197)
Stacking faults and twins Table 10 shows larger strains in the [001] direction that in the basal plane This can be explained by stacking disorder along the c-axis which was frequently observed in electron-diffraction patterns as streaking [167 168] Easy incorporation of stacking faults is possi- ble because of the two-dimensional weak-bonded layers (BiO double layers are spaced about 3 A apart) The difference in microstrain between in- plane and the c-direction is much smaller for the BiPbMgBa-2223 phase probably because Pb low- ers the faulting by stabilizing the higher-Tc 2223 phase [167] For the BiPb-2223 specimen with two phases there are two possibilities Either the speci- men consists mainly of a mk of two kinds of one- phase grains or both phases occur within the same grains The second possibility was confirmed exper- imentally [169 170] and our results concur be- cause microstrain in the 2212 phase is much smaller than in the one-phase Bi-2212 specimen Processing conditions and cation content probably favour development of the macroscopic inter- growth of both phases within the grains that is microscopic defects grow to sufficiently large re- gions to give a diffraction pattern of another phase with the different number of Cu02 layers As a re- sult strain is relieved and both strains and domain sizes being quite different in one-phase specimens tend to equalize
For the Bi-Cu-O specimens the mean surface- weighted domain sizes are generally smaller than for (La-M)2Cu04 compounds Therefore the com- putation of the stacking- and twin-fault probabili- ties by using Eq (75) may be wrong It would be very instructive to compare the different broaden-
ing of satellite and fundamental reflections which indicates a more pronounced stacking disorder in the modulated structure [171]
In summary we found that for both Bi-2212 and BiPbMgBa-2223 superconductors the c-axis strain exceeds the in-plane strain The BiPb-2223 specimen containing both 2212 and 2223 phases within the single grains shows smaller incoherently diffracting domains and lower c-axis strain than the one-phase specimens This fact may direct us to- ward the mechanism of the second-phase forma- tion in these materials
63 Remarks
It was shown that this particular method of the line-broadening analysis can give information about the size of incoherently diffracting domains and lattice strains in (La-M)2Cu04 and Bi-Clu-O superconductors Moreover results show high an- isotropy of both size and strain parameters as one may expect because of the layered structure of all superconducting cuprates Generally structural line broadening is not large that is a result of rela- tively large domain sizes (200-2000 A) and small strains (002-02) It is interesting to compare these values with the published results for YBa2Cu307-laquo (isotropic strains of 023 [77] and 005-03 [82]) Although the different materi- als were studied they seem too large especially be- cause they are the average of strains in different directions
The main drawback of the line-broadening the- ory is the uncertainty about the origins of the line broadening that is it is difficult to distinguish the main effects responsible for the broadening For
349
Volume 98 Number 3 May-June 1993
Journal of Research of the National Institute of Standards and Technology
the novel superconductors particularly the numer- ous defects (substitutions vacancies stacking faults dislocations and similar) can occur simulta- neously which makes it very difficult to determine their individual contributions Furthermore the crystal structures of most novel superconductors are relatively complicated The average structure has mostly a slightly distorted tetragonal symmetry very similar a and b lattice parameters and a large c parameter but c=36 for YBa2Cu307-laquo for in- stance This results in a large number of overlap- ping peaks and consequently in large errors of all results This showed especially in the case of Bi-Cu-O superconductors (see Table 10) Follow- ing the discussion of reliability of profile fitting in Sec 54 it would be desirable to include more than two reflections in the analysis of broadening but higher-order peaks are usually too weak and over- lapped One way to partially solve this problem would be a whole pattern fitting [172 173] and Rietveld structure refinement [23] in terms of size and strain parameters This requires an accurate preset function to model specimen broadening and precise definition of angular dependence of size and strain parameters The Rietveld programs that model the line broadening in terms of size and strain parameters are based either on the simpli- fied integral-breadth methods [78 95] or on the single-line method [174]
7 Conclusions
A method for analyzing the pure-specimen (structural) broadening of x-ray diffraction line profiles is proposed By modeling the specimen size and strain broadenings with the simple Voigt func- tion it is possible to obtain domain sizes and strains that agree with experiment and show a logi- cal interrelationship Furthermore some common consequences and problems in the Fourier-method analysis follow easily The specimen function is convoluted with the instrumental function to match the observed x-ray diffraction-line profile This avoids the Stokes deconvolution method thus al- lowing analysis of patterns with highly overlapping peaks and weak structural broadening Therefore the method was applied to some novel high-Tc superconductors We reached the following conclu- sions
(i) Surface-weighted domain size depends only on the Cauchy integral breadth of the size-broad- ened profile
(ii) The hook effect occurs when the Cauchy-content of the size-broadened profile is un-
derestimated that is for ^sc(n2)^3sG Usually this happens when the background is estimated too high so the long tails of the Cauchy function are prematurely cut off
(iii) It also follows from conclusion (ii) that the volume-weighted domain size can not be more than twice the surface-weighted domain size (limiting value D)v=2D)i is obtained for the pure-Cauchy size-broadened profile) Minimum value for D)J (D)j should not be less than -131
(iv) If the distortion coefficient is approxi- mated with a harmonic term this leads exactly to the Warren-Averbach method of separation of size and strain broadenings
(v) In that case mean-square strains decrease linearly with the distance L
(vi) It is possible to evaluate local strain ((e^(0))^) only in the case of pure-Gauss strain broadening Then root-mean-square strain is inde- pendent of the distance L and related to the upper limit of strain obtained from the integral breadth of the strain-broadened profile
(vii) If strain broadening is not described exclu- sively with the Gauss function the multiple-line Voigt integral breadth and Warren-Averbach analyses can not give the same results for volume- weighted domain size although D)v is defined identically in both approaches because the appar- ent strain -q = pdeg(29)cot9 is not angular- independent
(viii) Smooth size coefficients give column- length distribution functions without oscillations and make possible a computation of volume- weighted average domain sizes up to ~5000 A
(ix) Comparison with the simplified integral- breadth methods in most cases has shown not large but systematic discrepancy of results indicat- ing that size and strain broadening can not be accu- rately modeled by a single Cauchy or Gauss function Moreover the application of the single- line method is much less reliable and it should not be used where multiple reflections are available
(x) The knowledge of all phases present in the sample and their crystallographic structure is re- quired to successfully fit a cluster of overlapping peaks Although it is very difficult to accurately de- termine the Cauchy-Gauss ratio of an overlapped peak final results of domain size and strain are much less affected Therefore connecting the crys- tallite size exclusively with the Cauchy content and strain with the Gauss content of a specimen profile might be doubtful
(xi) Evaluated errors of domain sizes and strains increase substantially with the degree of
350
Volume 98 Number 3 May-June 1993
Journal of Research of the National Institute of Standards and Technology
peak overlapping Hence for complicated patterns very accurate measurements are necessary and one needs to analyze as many reflections in the same crystallographic direction as possible
(xii) Line-broadening analysis of (La-M)2Cu04 and Bi-Cu-O compounds confirms high anisotropy in these materials
(xiii) Strains in (La-M)2Cu04 probably origi- nate from dislocations and from different sizes of host and dopant ions
(xiv) Stacking-fault probability in (La-M)2Cu04 (M = Ba Ca Sr) increases with increasing Tc whereas the average strain decreases
(xv) In La2Cu04 different broadening of (lOO) and (OfcO) reflections is not caused by stacking faults
(xvi) All Bi-Cu-0 superconductors show larger strain in the c-direction than in the a-b plane which can be explained by stacking disorder along the [001] direction
(xvii) In the specimen with approximately equal amounts of Tl-2212 and TlPb-2223 phases it is likely that a secondary phase develops by the growth of the microscopic faulted regions of the primary phase
Acknowledgments
I am thankful to Dr Harry McHenry for his support and especially to Dr Hassel Ledbetter for his wise guidance and most useful help during my stay at NIST I am also indebted to my home insti- tution the Faculty of Metallurgy of the University of Zagreb for allowing me the leave of absence at NIST
8 References
[1] W Friedrich P Knipping and M v Laue Ann Physik 41 971 (1912)
[2] H M Rietveld Acta Cryst 22 151 (1967) [3] H M Rietveld J Appl Cryst 2 65 (1969) [4] S A Howard and K D Preston in Modern Powder Dif-
fraction Vol 20 The Mineralogical Society of America Washington DC (1989) p 217
[5] D Taupin J Appl Cryst 6 266 (1973) [6] T C Huang and W Parrish Appl Phys Lett 27 123
(1975) [7] M K Wu J R Ashburn C J Torng P H Hor R L
Meng L Gao Z J Hwang Y Q Wang and C W Chu Phys Rev Lett 58 908 (1987)
[8] D Shi MRS Bull 16 37 (1991) [9] D Larbalestier Phys Today 44 74 (1991)
[10] J C Phillips Phys Rev B 4512647 (1992) [11] B Raveau Phys Today 45 53 (1992) [12] A J Millis and K M Rabe Phys Rev B 38 8908 (1988)
[13] F Guinea Europhys Lett 7 549 (1988) [14] C P Dhard and P Singh in Proc Int Symp High-Temp
Supercond Jaipur India Oxford amp IBH Publishing New Delhi (1988) p 271
[15] J D Jorgensen Phys Today 44 34 (1991) [16] J G Bednorz and K A Muller Z Phys B 64 189
(1986) [17] K Kishio K Kitazawa S Kaube I Yasuda N Sugii H
Takagi S Uchida K Fueki and S Tanaka Chem Lett 429 (1987)
[18] J D Jorgensen B Dabrowski S Pei D G Hinks L Soderholm B Morosin J E Venturini and D S Ginley Phys Rev B 38 11337 (1988)
[19] J R Clem Phys Rev B 43 7837 (1991) [20] M Paranthaman M Foldejiki D Balzar H Ledbetter
A J Nelson and A M Hermann submitted to Phys Rev B
[21] A R Stokes Proc Phys Soc Lond 61 382 (1948) [22] B E Warren and B L Averbach J Appl Phys 23 497
(1952) [23] R Delhez Th H de Keijser and E J Mittemeijer in
Accuracy in Powder Diffraction S Block and C R Hub- bard eds Natl Bur Stand (US) Special Publication 567 (1980) p 213
[24] H P Klug and L E Alexander X-ray Diffraction Proce- dures 2nd Edition John Wiley New York (1974) p 661
[25] J I Langford J Appl Ciyst 11 10 (1978) [26] J I Langford in Accuracy in Powder Diffraction S
Block and C R Hubbard eds Natl Bur Stand (US) Special Pubication 567 (1950) p 255
[27] R Delhez Th H de Keijser and E J Mittemeijer Fre- senius Z Anal Chem 312 1 (1982)
[28] A J C Wilson Proc Phys Soc Lond 80 286 (1962) [29] A J C Wilson Proc Phys Soc Lond 81 41 (1963) [30] L P Smith Phys Rev 46 343 (1934) [31] H C Burger and P H van Cittert Z Phys 79 722
(1932) [32] S Ergun J Appl Ciyst 1 19 (1968) [33] R Croche and L Gatineau J Appl Ciyst 10479 (1977) [34] L H Schwarz and J B Cohen Diffraction from Materi-
als Academic Press New York (1977) p 391 [35] R Delhez Th H de Keijser E J Mittemeijer and J I
Langford J Appl Cryst 19 459 (1986) [36] R Delhez Th H de Keijser E J Mittemeijer and J I
Langford Aust J Phys 41 213 (1988) [37] R A Young and D B Wiles J Appl Cryst 15 430
(1982) [38] W Voigt Stizungsber K Bayer Akad Wiss 42 603
(1912) [39] E E Whiting J Quant Spectrosc Radiat Transfer 8
1379 (1968) [40] G K Wertheim M A Butler K W West and D N E
Buchanan Rev Sci Instrum 111369 (1974) [41] M M Hall Jr V G Veeraraghavan H Rubin and P G
Winchell J Appl Cryst 10 66 (1977) [42] A Brown and J W Edmonds Adv X-Ray Anal 23 361
(1980) [43] P Suortti M Ahtee L Unonius J Appl Cryst 12 365
(1979) [44] T Sundius J Raman Spectrosc 1 471 (1973) [45] B H Armstrong J Quant Spectrosc Radiat Transfer 7
61 (1967) [46] J F Kielkopf J Opt Soc Am 63 987 (1973) [47] B P Asthana and W Kiefer Appl Spectr 36 250
(1982)
351
Volume 98 Number 3 May-June 1993
Journal of Research of the National Institute of Standards and Technology
[48] J P M de Vreede S C Mehrotra A Tal and H A Dijkerraan Appl Spectr 36 227 (1982)
[49] F R L Schoening Ada Ciyst 18 975 (1965) [50] P Scherrer Gott Nachr 2 98 (1918) [51] A R Stokes and A J C Wilson Proc Cambridge
Philos Soc 38 313 (1942) [52] A J C Wilson X-Ray Optics 2nd edition Methuen
London (1962) [53] S Leie and T R Anantharaman Proc Indian Acad
Sci Sect A H 261 (1966) [54] D Louer D Weigel and J I Langford J Appl Ciyst
5 353 (1972) [55] A J C Wilson J Appl Ciyst 2 181 (1969) [56] J I Langford and A J C Wilson J Appl Ciyst 11102
(1978) [57] A R Stokes and A J C Wilson Proc Phys Soc Lond
56174 (1944) [58] B E Warren and B L Averbach J Appl Phys 21 595
(1950) [59] B E Warren X-Ray Diffraction Addison-Wesley
Reading Massachusetts (1969) p 264 [60] B E Warren in Progress in Metal Physics Vol 8 Perg-
amon Press London (1959) p 146 [61] F Bertaut C R Acad Sci Paris 228 187 (1949) [62] N C Haider and C N J Wagner Acta Cryst 20 312
(1966) [63] D Balzar and H Ledbetter in Proceedings of the Accu-
racy in Powder Diffraction II Natl Inst Stand Technol (1992) p 37
[64] D Balzar and H Ledbeter J Appl Cryst 26 (1993) in press
[65] J N Eastabrook and A J C Wilson Proc Phys Soc Lond B 65 67 (1952)
[66] R S Smith IBM J Res Develop 4 205 (1960) [67] B Y Pines and A F Sirenko Soviet Physics Ciyst 715
(1962) [68] G B Mitra and N K Misra Acta Ciyst 22 454 (1967) [69] A Gangulee J Appl Ciyst 7 434 (1974) [70] J Mignot D Rondot Acta Met 231321 (1975) [71] J Mignot and D Rondot Acta Ciyst A 33 327 (1977) [72] R K Nandi H K Kuo W Schlosberg G Wissler J B
Cohen and B Crist Jr J Appl Ciyst 17 22 (1984) [73] M Zocchi Acta Ciyst A 36164 (1980) [74] P Ramarao and T R Anantharaman Trans Ind Ins
Metals 18 181 (1965) [75] R K Nandi and S P Sen Gupta J App Cryst 11 6
(1978) [76] Th H de Keijser J I Langford E J Mittemeijer and
B P Vogels J Appl Ciyst IS 308 (1982) [77] A Williams G H Kwei R B Von Dreele A C Lar-
son L D Raistrick and D L Bish Phys Rev B 37 7960 (1988)
[78] A C Larson and R B Von Dreele Los Alamos Na- tional Laboratory Report No LA-UR-86-748 (1988)
[79] J D Jorgensen D H Johnson M H Mueller J G Worlton and R B Von Dreele in Proceedings of the Conference on Diffraction Profile Analysis Cracow Poland (1978) p 20
[80] R B Von Dreele J D Jorgensen and C G Windsor J Appl Ciyst 15 581 (1982)
[81] P Thompson D E Cox and J B Hastings J Appl Ciyst 20 79 (1987)
[82] J P Singh R A Guttschow D S Kupperman J T Dusek and R B Poeppel in High Temperature Super-
conducting Compounds III S Whang A Gupta and E Ceilings eds TMS AIME Warrendale (1991) p 281
[83] M O Eatough D S Glnley and B Morosin Adv X- Ray Anal 33 145 (1990)
[84] E J Peterson P J Kung R E Muenchausen and D M Smith in Proceedings of the 41st Annual Denver Conference on Applications of X-Ray Analysis Colo- rado Springs Colorado (1992) p 74
[85] M Rand J I Langford and J S Abell submitted to J Cryogenics (1992)
[86] D Balzar J Appl Ciyst 25 559 (1992) [87] D Balzar H Ledbetter and A Roshko Physica C 185-
189 871 (1991) [88] D Balzar and H Ledbetter J Mater Sci Lett 111419
(1992) [89] D Balzar H Ledbetter and A Roshko Pow Diffr 8
(1993) in press [90] S Johnson M Gusraan D Rowcliffe T Geballe and J
Sun Adv Ceram Mater 2 337 (1987) [91] H Ledbetter S A Kim R B Goldfarb and K Togano
Phys Rev B 39 9689 (1989) [92] H Friedman Electronics 132 (1945) [93] W Parrish (ed) in Advances in X-Ray Diffractometry
and X-Ray Spectrography Centrex Publishing Company Eindhoven The Netheriands (1962)
[94] W Soller Phys Rev 24158 (1924) [95] S A Howard R L Snyder J Appl Ciyst 22 238
(1989) [96] G H Stout and L H Jensen X-Ray Structure Determi-
nation 2nd edition Wiley New York (1989) p 373 [97] D E Appleman and T Evans Jr Final Report 92-14
US Geological Survey Washington DC (1973) Avail- able as NTIS Document No PB-216188
[98] M U Cohen Rev Sci Instrum 6 68 (1935) [99] M U Cohen Rev Sci Instrum 7 155 (1936) [100] M H Mueller L Heaton and K T Miller Acta Ciyst
13 828 (1960) [101] R A Young P E Mackie and R B Von Dreele J
Appl Ciyst 10 262 (1977) [102] D B Wiles and R A Young J Appl Cryst 14 149
(1981) [103] J K Yau and S A Howard J Appl Ciyst 22 244
(1989) [104] S A Howard J K Yau and H U Anderson J Appl
Phys 65 1492 (1989) [105] S Enzo G Fagherazzi A Benedetti and S Poilizzi J
Appl Ciyst 21 536 (1988) [106] A Benedetti G Fagherazzi S Enzo and M
Battagliarin J Appl Cryst 21 543 (1988) [107] Th H de Keijser E J Mittemeijer and H C F Rozen-
daal J Appl Ciyst 16 309 (1983) [108] Y Zhang J M Stewart C R Hubbard and B Mo-
rosin Adv X-Ray Anal 33 373 (1990) [109] Y Wang S Lee and Y Ue J Appl Ciyst IS 35
(1982) [110] V N Selivanov and E F Smislov Zavod Lab 57 28
(1991) [Ill] A Guinier X-Ray Diffraction W H Freeman San
Francisco (1963) p 139 [112] M Wilkens J Appl Cryst 12119 (1979) [113] D Du and Y Wang Pow Diffr 2180 (1987) [114] A P Prudnikov Yu A Brychkov and O L Marichev
Integrals and Series Vol 1 Gordon and Breach Am- sterdam The Netheriands (1986) p 344
352
Volume 98 Number 3 May-June 1993
Journal of Research of the National Institute of Standards and Technology
[115] R L Rothman and J B Cohen J Appl Phys 42 971 (1971)
[116] T Adier and C R Houska J Appl Phys 50 3282 (1979)
[117] C R Houska and T M Smith J Appl Phys 52 748 (1981)
[118] S Rao and C R Houska Acta Ciyst A 4214 (1986) [119] J I Langford R Delhez Th H de Keijser and E J
Mittemeijer Ausi J Phys 41173 (1988) [120] J I Langfoid J Appl Cryst IS 315 (1982) [121] M J Turunen Th H de Keijser R Delhez and N M
van der Pers J Appl Ciyst 16176 (1983) [122] A J C Wilson Acta Ciyst 23 888 (1967) [123] A J C Wilson Acta Ciyst A 24 478 (1968) [124] A J C Wilson Acta Ciyst A 25 584 (1969) [125] G Gagliotti A Paoletti and F P Ricci Nucl Instrum
3 223 (1958) [126] J I Langford R J Cernik and D Louer J Appl
Ciyst 24 913 (1991) [127] J I Langford in Accuracy in Powder Diffraction II
preprint [128] A J C Wilson Mathematical Theory of X-Ray Powder
Diffractometiy Centrex Eindhoven The Netherlands (1963)
[129] J L Langford Prog Ciyst Growth and Charact 14185 (1987)
[130] T G Fawcett C E Crowder S J Brownell Y Zhang C R Hubbard W Schreiner G P Hamill T C Huang E Sabino J I Langford R Hamilton and D Louer Pow Diffr 3 209 (1988)
[131] W L Smith J Appl Ciyst 9187 (1976) [132] J L Langford and D Louer J Appl Ciyst 15 20
(1982) [133] Fl Popescu and L Benes Acta Ciyst A 33 323 (1977) [134] P PSuse^cu R MSnaila M Popescu and E Jijovici j
Appl Cryst 7 281 (1974) [135] P F Bley Y Calvayrac and M Fayard J Appl Ciyst
7 493 (1974) [136] B Moraweck Ph de Montgolfier and A J Renouprez
J Appl Ciyst 10191 (1977) [137] A Le Bail and D Louer J Appl Cryst 11 50 (1978) [138] D R Buchanan R L McCuUough and R L Miller
Acta Ciyst 20 922 (1966) [139] P Suortti and L D Jennings Acta Cryst A 33 1012
(1977) [140] J B Cohen and C N J Wagner J Appl Phys 33 2073
(1962) [141] A Bianconi J Budnick A M Flank A Fontaine P
Lagarde A Marcelli H Tolentino B Chamberland C Michel B Raveau and G Demazeau Phys Lett A127 285 (1988)
[142] K Fueki K Kitazawa K Kishio T Hasegawa S Uchida H Takagi and S Tanaka in Chemistiy of High- Temperature Superconductors D L Nelson M S Whittingham and T F George eds American Chemi- cal Society (1987) p 38
[143] T Fujita Y Aoki Y Maeno J Sakurai H Fukuba and H Fujii J Appl Phys 26 U68 (1987)
[144] R M Hazen in Physical Properties of High-rc Super- conductors Vol 2 D M Ginsberg ed World Scien- tific Singapore (1990) p 121
[145] J B Torrance A Bezinge A I Nazzal T C Huang S P Parkin D T Keane S J LaPlaca P M Horn and G A Held Phys Rev B 40 8872 (1989)
[146] J D Axe A H Moudden D Hohlwein D E Cox K
M Mohanty A R Moodenbaugh and Y Xu Phys Rev Lett 62 2751 (1989)
[147] T Suzuki and T Fujita Physica C 159 111 (1989) [148] T Fujita and Y Maeno in Superconducting Materials
JJAP Series 1 (1988) p 34 [149] A Roshko and Y-M Chiang J Appl Phys 66 3710
(1989) [150] D E Cox S C Moss R L Meng P H Hor and C W
Chu J Mater Res 31327 (1988) [151] B Crist and J B Cohen J Polym Sci 17 1001 (1979) [152] H Ledbetter S Kim and A Roshko Z Phys B 89275
(1992) [153] R D Shannon and C T Prewitt Acta Ciyst B 25 925
(1969) [154] M Lang H Spille F Steglich Y Hidaka T Murakami
and Y Endoh Physica C 162-1641037 (1989) [155] Y Hidaka and T Murakami Phase trans 15 241
(1989) [156] P L Gai and E M McCarron Science 247 553 (1990) [157] T Kamiyama I Izumi H Asano H Takagi S Uchida
Y Tokura E Takayama-Muromachi M Matsuda K Yamada Y Endoh and Y Hidaka Physica C 172 120 (1990)
[158] A Kapitulnik Physica C 153-155 520 (1988) [159] L A Muradyan V N Molchanov R A Tamazyan and
V I Simonov Physica C 162-164 536 (1989) [160] P Day M Rosseinsky K Prassides W I F David O
Moze and A Soper J Phys C 20 L429 (1987) [161] J T Lewandowski R A Beyerlein J M Longo and R
A McCauley J Amer Ceram Soc 69 699 (1986) [162] R Ramesh G van Tendeloo G Thomas S M Green
Y Mei C Jiang and H L Luo Appl Phys Lett 53 2220 (1988)
[163] J Schneck L Pierre J C Tolddano and C Daguet Phys Rev B 39 9624 (1989)
[164] O Eibl Physica C 168 215 (1990) [165] W Carrilo-Cabrera and W Gopel Physica C 161 373
(1989) [166] P Bordet J J Capponi C Chaillout J Chenavas A
W Hewat E A Hewat J L Hodeau M Marezio J L Tholence and D Tranqui Physica C 156189 (1988)
[167] R Ramesh K Remschnig J M Tarascon and S M Green J Mater Res 6 278 (1991)
[168] Z Hiroi Y Ikeda M Takano and Y Bando J Mater Res 6 435 (1991)
[169] Y Inoue M Hasegawa Y Shichi I Munakata M Ya- manaka S Hiyama and O Nittono J Mater Res 5 737 (1990)
[170] R Ramesh B G Bagley J M Tarascon S M Green M L Rudee and H L Luo J Appl Phys 67 379 (1990)
[171] X B Kan J Kulik P C Chow S C Moss Y F Yan J H Wang and Z X Zhao J Mater Res 5 731 (1990)
[172] G S Pawley J Appl Ciyst 13 630 (1980) [173] H Toraya J Appl Ciyst 19 440 (1986) [174] L Lutterotti and P Scardi J Appl Ciyst 23 246
(1990)
About the author Davor Balzar is with Faculty of Metallurgy of the University of Zagreb Sisak Croatia and was a Guest Researcher at fflST The National Institute of Standards and Technology is an agency of the Technology Administration US Department of Commerce
353
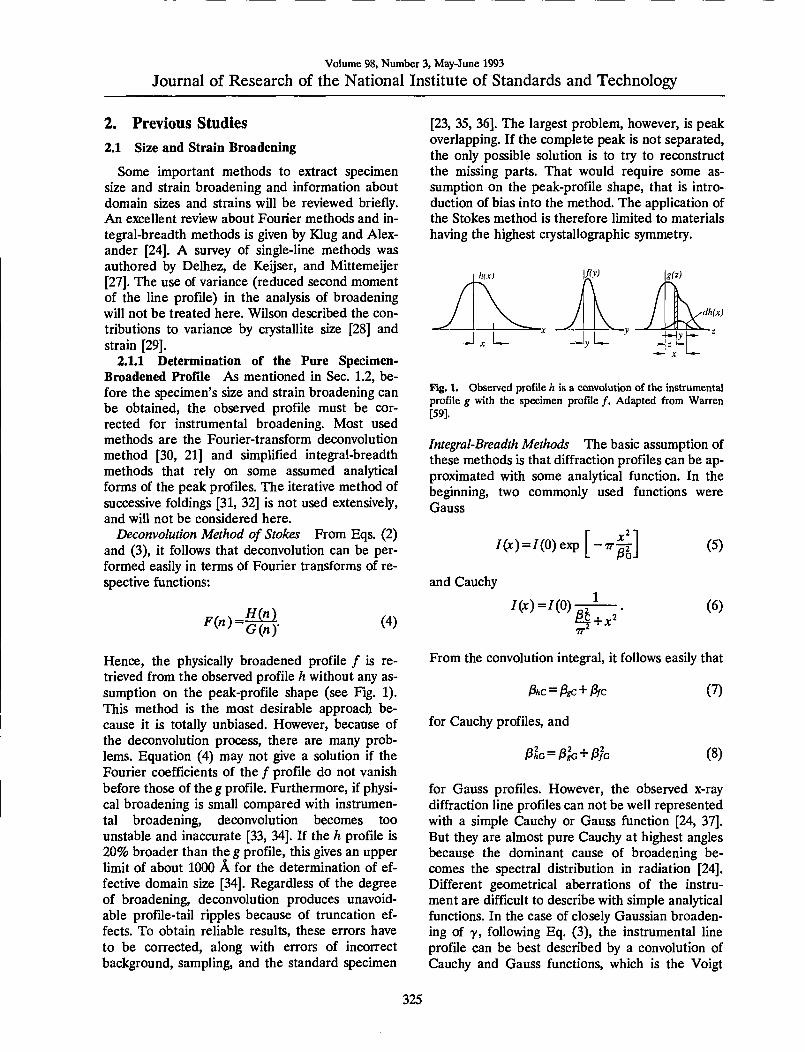
Volume 98 Number 3 May-June 1993
Journal of Research of the National Institute of Standards and Technology
2 Previous Studies 21 Size and Strain Broadening
Some important methods to extract specimen size and strain broadening and information about domain sizes and strains will be reviewed briefly An excellent review about Fourier methods and in- tegral-breadth methods is given by Klug and Alex- ander [24] A survey of single-line methods was authored by Delhez de Keijser and Mittemeijer [27] The use of variance (reduced second moment of the line profile) in the analysis of broadening will not be treated here Wilson described the con- tributions to variance by crystallite size [28] and strain [29]
211 Determination of the Pure Specimen- Broadened Profile As mentioned in Sec 12 be- fore the specimens size and strain broadening can be obtained the observed profile must be cor- rected for instrumental broadening Most used methods are the Fourier-transform deconvolution method [30 21] and simplified integral-breadth methods that rely on some assumed analytical forms of the peak profiles The iterative method of successive foldings [31 32] is not used extensively and will not be considered here
Deconvolution Method of Stokes From Eqs (2) and (3) it follows that deconvolution can be per- formed easily in terms of Fourier transforms of re- spective functions
F(n) = =H(nl G(ny (4)
Hence the physically broadened profile is re- trieved from the observed profile h without any as- sumption on the peak-profile shape (see Fig 1) This method is the most desirable approach be- cause it is totally unbiased However because of the deconvolution process there are many prob- lems Equation (4) may not give a solution if the Fourier coefficients of the profile do not vanish before those of the g profile Furthermore if physi- cal broadening is small compared with instrumen- tal broadening deconvolution becomes too unstable and inaccurate [33 34] If the h profile is 20 broader than the g profile this gives an upper limit of about 1000 A for the determination of ef- fective domain size [34] Regardless of the degree of broadening deconvolution produces unavoid- able profile-tail ripples because of truncation ef- fects To obtain reliable results these errors have to be corrected along with errors of incorrect background sampling and the standard specimen
[23 35 36] The largest problem however is peak overlapping If the complete peak is not separated the only possible solution is to try to reconstruct the missing parts That would require some as- sumption on the peak-profile shape that is intro- duction of bias into the method The application of the Stokes method is therefore limited to materials having the highest crystallographic symmetry
dh(x)
Fig 1 Observed profile n is a convolution of the instrumental profile g with the specimen profile Adapted from Warren [59]
Integral-Breadth Methods The basic assumption of these methods is that diffraction profiles can be ap- proximated with some analytical function In the beginning two commonly used functions were Gauss
(x)=(0)exp[-7|^] (5)
and Cauchy
(gt=) =(0) 4+
(6)
From the convolution integral it follows easily that
Ac = ftc + iE^c (7)
for Cauchy profiles and
l3lG = lih + Ph (8)
for Gauss profiles However the observed x-ray diffraction line profiles can not be well represented with a simple Cauchy or Gauss function [24 37] But they are almost pure Cauchy at highest angles because the dominant cause of broadening be- comes the spectral distribution in radiation [24] Different geometrical aberrations of the instru- ment are difficult to describe with simple analytical functions In the case of closely Gaussian broaden- ing of y following Eq (3) the instrumental line profile can be best described by a convolution of Cauchy and Gauss functions which is the Voigt
325
Volume 98 Number 3 May-June 1993
Journal of Research of the National Institute of Standards and Technology
function Experience shows that the Voigt function [38] (or its approximations pseudo-Voigt [39 40] and Pearson-VII [41 42]) fits very well the ob- served peak profiles [25 43 37] The Voigt func- tion is usually represented following Langford [25]
nx)=m^)Rc[ctn(^ + ik)] (9)
Here the complex error function is defined as
erfi(z) = exp( -z^) [1 - erf( -raquo)] (10)
Its evaluation can be accomplished using Sundius [44] or Armstrong [45] algorithms with eight-digit accuracy Useful information about the Voigt func- tion can be found in papers of Kielkopf [46] As- thana and Kiefer [47] and de Vreede et al [48] Figure 2 presents a Voigt function for different val- ues of Cauchy and Gauss integral breadths
causes diffraction-line broadening
12
Pc=005 pc=005
Pc = 01pc=001
PG=001PC=01
283 26
Fig 2 Voigt functions for different values of Cauchy and Gauss integral breadths Adapted from Howard and Preston [4]
Integral breadth of the Voigt function is expressed through its constituent integral breadths [49]
^ erfc(A) (11)
Here erfc denotes the complementary error func- tion
Because convolution of two Voigt functions is also a Voigt function integral breadths are easily separable conforming to Eqs (7) and (8)
212 Separation of Size and Strain Broadening After removing the instrumental broadening from the observed line profile it is possible to analyze the pure-specimen (physically) broadened line pro- file to consider the origins and amount of broad- ening
In 1918 Scherrer [50] recognized that break- ing the crystal into domains smaller than ~1000 A
ltZ)gtv = KX
3(20) cos9 (12)
The constant K depends on the crystallite shape [515253545556] but generally is close to unity The main characteristic of size broadening is that it is independent of the reflection order that is inde- pendent of diffraction angle
Most of the work on x-ray diffraction line broad- ening was done on metals and alloys It is widely accepted that plastic deformation in metals pro- duces dislocation arrays which divide crystallites into much smaller incoherently scattering domains These dislocations produce strains within the do- mains causing strain broadening It was elaborated in Sec 12 that any lattice imperfection (vacancies interstitials and substitutions) would broaden the diffraction peaks These effects would be inter- preted in the frame of this theory as a strain broad- ening too Stokes and Wilson [57] defined apparent strain as
Tj=3(20)cot0 (13)
Strain broadening is angle dependent Therefore the angle dependence of the line broadening gives a possibility to distinguish between contributions of size and strain However when we speak of size and strain broadening they may include other con- tributions For instance stacking faults and twins will contribute to broadening similar to size effects
Warren-Averbach Method This method was devel- oped originally for plastically deformed metals but since its introduction [58 22] it found successful application to many other materials The method is extensively described in Warrens publications [59 60] Each domain is represented by columns of cells along the 03 direction [61] (see Fig 3) The crystal has orthorhombic axes with the direction 03 normal to the diffracting planes (00) The experi- mentally observable diffraction power may be ex- pressed as a Fourier series
(20)=-^ 2 An expilvina^s) (14)
Here experimentally measurable coefficients Abdquo are
Nbdquo Abdquo =T^ ltexp(2m7Zbdquo)) (15)
326
Volume 98 Number 3 May-June 1993
Journal of Research of the National Institute of Standards and Technology
m 3
^i
m I
Fig 3 Representation of the crystal in terms of columns of cells along the a^ direction [59]
The Abdquo coefficients are the product of two terms The first term depends only on the column length (size coefficient) the second depends only on dis- tortion in domains (distortion coefficient)
An mdashAn An bull
Nbdquo lf = ltexp(2TrZbdquo))
(16)
(17)
It is more convenient to express the distortion coef- ficient in terms of the strain component If L =laquoa3 is the undistorted distance between a pair of cells along direction 03 and distortion changes distance by 4L = a^Zn the component of strain in the as direction (orthogonal to reflecting planes) aver- aged over distance L can be defined as (L) = A(L) L Because oil^d interplanar spacing the distortion coefficient can be rewritten
Ideg(L) = exp(2TrLe(L)d)) (18)
To obtain the strain component it is necessary to approximate the exponential term For not too large L
exp(2mLe(L)d)
laquoexp(-2Tr^L2lte2(L))d^) (19)
This relationship is exact if the distributions of e(L) for all L values follow the Gauss function and is generally true as far as terms in e^(L) because
these distributions are usually sufficiently symmet- rical [57] Now Eq (16) can be approximated as
InA L)=lnAL)- 2TTeL))LW) (20)
Warren and Averbach [22] derived this relation- ship in a similar way It separates size and strain contributions to the broadening and allows for their simultaneous evaluation
If the size coefficients are obtained by applica- tions of Eq (20) it is possible to evaluate the aver- age surface-weighted domain size and the surface-weighted column-length distribution func- tion [59]
idAHL) ^ 1_
Ps(L) dMU) dL^
(21)
(22)
Figure 4 shows how (D) can be obtained from both the size coefficients ^^(L) and the column- length distribution function
Fig 4 Surface-weighted domain size is determined (a) by the intercept of the initial slope on the L-axis (b) as a mean value of the distribution function
Multiple-Line Integral-Breadth Methods To sepa- rate size and strain broadening by using integral breadths it is necessary to define the functional form for each effect In the beginning size and strain contributions were described by Cauchy or Gauss functions Using Eqs (12) and (13) on the s scale and additive relations for the integral breadths following Eqs (7) and (8)
1 j8 =77vr + 2es (Cauchy-Cauchy) (23)
8=T^ + ^y- (Cauchy-Gauss) (24)
327
Volume 98 Number 3 May-June 1993 Journal of Research of the National Institute of Standards and Technology
^^=7^ + 4e^s^ (Gauss-Gauss) (25)
Here e = Tj4raquo4dd is the upper limit for a strain Equation (24) uses the Haider and Wagner [62] parabolic approximation for the integral breadth of the Voigt function expressed by Eq (11)
3 I3) (26)
Experience shows however that neither Cauchy nor Gauss functions can model satisfactorily size or strain broadening in a general case Langford [26] introduced the so-called multiple-line Voigt-func- tion analysis Both size-broadened and strain- broadened profiles are assumed to be Voigt functions Using Eqs (12) and (13) it follows sym- bolically for Cauchy and Gauss parts that
j8c = i3sc+j8Dcs
ph = Plc + plcs^
(27)
(28)
This approach disagrees with the Warren- Averbach analysis that is the two methods give different results (see Sec 44) [63 64]
Single-Line Methods There are cases where only the first order of reflection is available or higher- order reflections are severely suppressed (ex- tremely deformed materials multiphase com- posites catalysts and oriented thin films) Many methods exist to separate size and strain broaden- ing from only one diffraction peak However it was stated in Sec 212 that the different size and strain broadening angle dependence is a basis for their separation hence using only one diffraction line introduces a contradiction Consequently single- line methods should be used only when no other option exists The single-line methods can be di- vided in two main parts Fourier-space and real- space methods Fourier-space methods are based on the Warren-Averbach separation of size and strain broadening following Eq (20) The func- tional form of E^(L)) is assumed either to be con- stant [65666768] or assumed to depend on L as eL))=cL [69707172] Then Eq (20) can be fitted to few points of A(L) for the small averaging distance L to obtain size and strain parameters All Fourier-space methods have the serious prob-
lem that the Fourier coefficients 4 (L) are usually uncertain for small L because of the so-called hook effect [60] (see Sec 42) 2occhi [73] sug- gested that fitting the straight line through the first derivatives of the Fourier coefficients instead of through the coefficients themselves would solve the hook-effect problem
All real-space methods [747576] are based on the assumption that the Cauchy function deter- mines size and that the Gauss function gives strain The most widely used method of de Keijser et al [76] gives size and strain parameters from Cauchy and Gauss parts of the Voigt function respectively
P)v=^
e=^ 2s
(29)
(30)
22 Diffraction-Line-Broadening Analysis of Superconductors
In this field very few studies exist Williams et al [77] reported isotropic strains in YBa2Cu307-laquo powder by the simultaneous Rietveld refinement of pulsed-neutron and x-ray diffraction data Using a GSAS Rietveld refinement program [78] both size and strain broadening were modeled with the Gauss functions for the neutron-diffraction data [79 80] and with the Cauchy functions for the x- ray diffraction data (modified method of Thomp- son Cox and Hastings [81]) Interestingly both the neutron and x-ray data gave identical values for the isotropic strain (023) and no size broaden- ing Singh et al [82] studied internal strains in YBa2Cu307-laquo extruded wires by pulsed-neutron diffraction They separated size and strain parame- ters by means of Eq (25) (Gauss-Gauss approxi- mation) Size broadening was found to be negligible but (isotropic) microstrains range from 005 for the coarse-grained material to 03 for the fine-grained samples Eatough Ginley and Morosin [83] studied Tl2Ba2Ca2Cu30io (Tl-2223) and Tl2Ba2CaCu208 (Tl-2212) superconducting thin films by x-ray diffraction Using the Gauss-Gauss approximafion they found strains of 014-018 in both phases and domain sizes of 1200-1400 A for Tl-2212 but 500 A for Tl-2223
We are aware of only two more unpublished studies [84 85] involving size-strain analysis in high-Tc superconductors The probable reason is that any analysis is very difficult because of weak line broadening and overlapping reflections This
328
Volume 98 Number 3 May-June 1993
Journal of Research of the National Institute of Standards and Technology
precludes application of reliable analysis such as the Stokes deconvolution method with the Warren- Averbach analysis of the broadening Instead sim- ple integral-breadth methods are used which gives generally different results for each approach Moreover for x-ray diffraction broadening appli- cation of the Gauss-Gauss approximation does not have any theoretical merit although reasonable values especially of domain sizes may be obtained [86] We showed [878889] that reliable diffrac- tion-line-broadening analysis of superconductors can be accomplished and valuable information about anisotropic strains and incoherently diffract- ing domain sizes obtained
3 Experiment 31 Materials
The materials used for this study were tungsten and silver commercially available powders with nominal grain sizes 4-12 ijim La2-xSriCu04(jc = 0 006 015 024) powders Lai^Moi5Cu04(M = Ca Ba) powders Bi2Sr2CaCu208 (Bi-2212) sinter (BiPb)2Sr2Ca2Cu30io(BiPb-2223) sinter and (BiPb)2(SrMg)2(BaCa)2Cu30io (BiPbMgBa-2223) sinter
Powders with nominal compositions La2-xSrCuO4(c=0 006 015 024) and Laig5Moi5Cu04(M = Ca Ba) were prepared at the National Institute of Standards and Technology Boulder Colorado by A Roshko using a freeze- drying acetate process [90] Acetates of the various cations were assayed by mass by calcining to the corresponding oxide or carbonate The appropriate masses of the acetates for the desired compositions were dissolved in deionized water The acetate so- lutions were then sprayed through a fine nozzle into liquid nitrogen to preserve the homogeneous cation distributions Frozen particles were trans- ferred to crystallization dishes and dried in a com- mercial freeze dryer to a final temperature of 100 degC After drying the powders except the Lai^Baoi5Cu04 were calcined in alumina (998) crucibles at 675 C for 1 h in a box furnace with the door slightly open to increase ventilation Because BaCOs is difficult to decompose the Laig5Baoi5Cu04 was calcined under a vacuum of 2 Pa at 800 C for 4 h then cooled slowly in flowing oxygen (2degCmin) The calcined powders were oxidized in platinum-lined alumina boats in a tube furnace with flowing oj^gen at 700 degC After 3 h at 700 C the powders were pushed to a cold end of the furnace tube where they cooled quickly (20 Cs) while still in flowing oxygen
The cylindrical specimens (23 mm in diameter and 9 mm thick) of Bi-2212 BiPb-2223 and BiPbMgBa-2223 were prepared at the National Research Institute for Metals Tsukuba Japan by K Togano [91] Starting oxides and carbonates were Pb304 61203 CuO SrCOs MgCOs and BaC03 They were calcinated in air at 800 C for 12 h Powders were then pressed and sintered in 8 oxygen-92 argon mixture at 835 degC for 83 h Specimens were furnace cooled to 750 degC held for 3 h in flowing oxygen and then furnace cooled in ojygen to room temperature
311 Preparation of Specimens for X-ray Diffraction The bulk specimens were surface polished if necessary and mounted in specimen holders Coarse-grained powders of La2-cSrxCu04 (x=Q 006 015 024) and Lai8sMoi5Cu04 (M = Ca Ba) were ground with a mortar and pestle in toluene and passed through a 635-mesh sieve (20-|xm nominal opening size) Silver and tungsten powders were dry ground with a mortar and pestle All powders were mixed with about 30 silicone grease and loaded into rectangular cavities or slur- ried with amyl acetate on a zero-background quartz substrate
32 Measurements
X-ray-diffraction data were collected using a standard two-circle powder goniometer in Bragg- Brentano parafocusing geometry [92 93] (see Fig 5) A flat sample is irradiated at some angle incident to its surface and diffraction occurs only from crystallographic planes parallel to the speci- men surface The goniometer had a vertical 0-26 axis and 22 cm radius CnKa radiation ex- cited at 45 kV and 40 mA was collimated with Seller slits [94] and a 2 mm divergence slit SoUer slits in the diffracted beam 02 mm receiving slit and Ge solid-state detector were used in a step- scanning mode (OOI7IO s for a standard specimen 002deg-005730-80 s for other specimens depending on the amount of broadening)
33 Data Analysis
The diffractometer was controlled by a com- puter and all measurements were stored on hard disc Data were transferred to a personal computer for processing
We used computer programs for most calcula- tions X-ray diffraction patterns were fitted with the program SHADOW [95] This program allows a choice of the fitting function and gives refined positions of the peak maximums intensities and function-dependent parameters It also has the
329
Volume 98 Number 3 May-June 1993
Journal of Research of the National Institute of Standards and Technology
Seller Slits
Source S
Specimen
Fig 5 Optical arrangement of an x-ray diffractometer Adapted from Klug and Alexander [24]
ability to convolute the predefined instrumental profile with the specimen function to match the ob- served pattern Choice of the specimen function in- cludes Gauss and Cauchy functions We added the ability to model the specimen broadening with an exact Voigt function and implemented SHADOW on a personal computer In the fitting procedure for every peak in the pattern the program first gen- erates the instrumental profile at the required dif- fraction angle The instrumental profile is deter- mined from prior measurements on a well-annealed standard specimen (see Sec 51) Then it assumes parameters of the specimen profile For an exact Voigt function parameters are peak position peak intensity and Cauchy and Gauss integral breadths of the Voigt function By convoluting the instru- mental profile with the specimen profile and adding a background the calculated pattern is ob- tained [Eq (2)] Parameters of the specimen profile are varied until the weighted least-squares error of calculated and observed patterns Eq (59) reaches a minimum This process avoids the unstable Stokes deconvolution method It is possible that the refine- ment algorithm is being trapped in a false minimum [96] but it can be corrected by constraining some parameters Refined parameters of the pure-speci- men profile are input for the size-strain analysis of the broadening A program for this analysis was written in Fortran
Lattice parameters of powder specimens were calculated by the program NBSLSQ85 based on the method of Appleman and Evans [97] A pro- gram in Fortran was written to apply corrections to observed peak maximums by using NIST standard reference material 660 LaB6 as an external stan-
dard Lattice parameters of bulk specimens were determined by the Fortran program which uses a modified Cohens method [9899100] to correct for systematic diffractometer errors Lattice parame- ters were also calculated by the Rietveld refinement programs GSAS [78] and DBW32S [101 102]
4 Methodology
When instrumental and specimen contributions to the observed line profile must be modeled sepa- rately adopting a specimen function is a critical step Yau and Howard [103104] used Cauchy and Enzo et al [105] pseudo-Voigt functions Benedetti Fagherazzi Enzo and Battagliarin [106] showed that modeling the specimen function with the pseudo-Voigt function gives results comparable to those of the Stokes deconvolution method when combined with the Warren-Averbach analysis of Fourier coefficients De Keijser Mittemeijer and Rozendaal [107] analytically derived domain sizes and root-mean-square strains for small averaging distance L in the case of the Voigt and related func- tions
The aim here is to study more thoroughly the consequences of assumed Voigt specimen function on the size-strain analysis of the Fourier coeffi- cients of the broadened peaks It is shown that some experimentally observed interrelations between derived parameters (particularly volume-weighted and surface-weighted domain sizes) and their be- havior (the hook effect and dependence of mean- square strains on the averaging distance) can be explained by this simple assumption Moreover the discrepancy between the integral-breadth methods and Warren-Averbach analysis results from differ- ent approximations for the strain broadening and the background experimental errors
41 Separation of Size and Strain Broadenings
The normalized Fourier transform of a Voigt function is easily computable [46]
^ =exD[-2laquo^e^-7m^^fi^l fan ^bdquo-exp|^ ^ cr(2e) ^ a^(2e) T ^^^^
It is convenient to express Fourier coefficients in terms of distance L by immediately making the ap- proximation A (26) = Ascos do
AL) = exp[-2L^-7rL^pl] (32)
330
Volume 98 Number 3 May-June 1993
Journal of Research of the National Institute of Standards and Technology
Equation (32) is a good approximation even for large specimen broadening Even for a profile span of A (29) = 80deg the error made by replacing this in- terval by an adequate A(sin9 ) range is 2 How- ever strictly speaking the profile will be asym- metrical in reciprocal space and Fourier-interval limits will not correspond to the 29i and Idz peak- cutoff values in real space It is important to keep Fourier interval limits identical for all multiple-or- der reflections otherwise serious errors in the sub- sequent analysis will occur [108] If higher accuracy for a considerable broadening is desired profile fit- ting can be accomplished In terms of the recipro- cal-space variable s instead of in a real 29 space
Assuming that only the Cauchy function deter- mines domain size [4(L) = exp(-L(Z))s)] and only the Gauss function gives root-mean-square strain (RMSS) [^deg(L) = exp(-27r=L2(e)d^)] Eq (32) leads to the Warren-Averbach [Eq (20)] for the separation of size and strain contribution [62] Experience shows that Cauchy and Gauss functions can not satisfactory model specimen broadening Balzar and Ledbetter [64] postulate that the speci- men function includes contributions of size and strain effects both approximated with the Voigt functions Because the convolution of two Voigt functions is also a Voigt function Cauchy and Gauss integral breadths of the specimen profile are easily separable
3c=i3sc + 3DC (33)
(34)
Langford [26] separated the contributions from size and strain broadening in a similar way (See Eqs (27) and (28)) Note however that Eqs (33) and (34) do not define size and strain angular or- der-dependence
Because Fourier coefficients are a product of a size and a distortion coefficient from Eqs (32) (33) and (34) we can obtain the separation of size and strain contributions to the pure specimen broadening
^S(L) = exp(-2Li3sc-TrL^3io) (35)
Adeg(L) = eM-2LpDc-TrL^Phc) (36)
Wang Lee and Lee [109] modeled the distortion coefficient and Selivanov and Smislov [110] mod- eled the size coefficient in the same way
To obtain size and distortion coefficients at least two reflections from the same crystallographic- plane family must be available
42 Size Coefficient
Surface-weighted domain size is calculated from the size coefficients following Eq (21) From Eq (35) we obtain
lt^gts = 1
2i3sc (37)
Therefore surface-weighted domain size depends only on the Cauchy part of the size-integral breadth
The second derivative of the size coefficients is proportional to the surface-weighted column-length distribution function Eq (22) The volume- weighted column-length distribution function fol- lows similarly [111]
p(L)ocL^j^ (38)
By differentiating Eq (35) twice we obtain
^^4^ = [(2^L^ic + 2^sc)^- dL
2TrplcAL) (39)
Because the column-length distribution function should always be positive [59] the Cauchy part must dominate Inspection of Eq (39) shows that for small L we must require
(40)
Otherwise the hook effect will occur in the plot of size coefficientsI (L) versus L that is the plot will be concave downward for small L (Fig 6) The hook effect is usually attributed to experimental errors connected with the truncation of the line profiles and consequently overestimation of background [59] This is a widely encountered prob- lem in the Fourier analysis of line broadening It results in overestimation of effective domain sizes and underestimation of the RMSS [36] Some authors [106] claim that the preset specimen- broadening function eliminates the hook effect However Eq (39) shows that effectively too high
331
Volume 98 Number 3 May-June 1993
Journal of Research of the National Institute of Standards and Technology
08-
04-
mdash^ 1 J 1 x
^~ ( ^ ^ i I
1 t 1 11
jl u
V 1 iJ
J
c^
100 200
Fig 6 (upper) The hook effect of the size coefficients A ^ (full line) at small L (lower) it causes negative values (set to zero) of the column-length distribution functions
background causes underestimation of the Cauchy content of the Voigt function because the long tails are truncated prematurely It has to be men- tioned that Wilkens [112] proposed tilted small-an- gle boundaries to be the source of the hook effect Liu and Wang [113] defined a minimum particle size present in a specimen depending on the size of the hook effect Figure 6 shows that negative values of the column-length distribution functions (set to zero) do not affect the shape but shift the entire distribution toward larger L values
Note also that the surface-weighted column- length distribution function ps(L) will usually have a maximum at L = 0 but for the particular ratio of integral breadths determined by Eq (40) it can be zero The volume-weighted column-length distribu- tion function7v(L) will always have a maximum for LsO
If the column-length distribution functions are known it is possible to evaluate mean values of respective distributions
lt^kv =
00
J ^ _0
(L)dL
raquosv(L)dL (41)
Integrals of this type can be evaluated analytically [114]
OQ
J cexp( - to^ - a )dc = i^y^ ^ of
hd^^^^fe)]- (^2)
Surface-weighted domain size (D)s must be equal to the value obtained from Eq (37) The volume- weighted domain size follows
ltD)v = ^^erfc(A) = js (43)
Using Eqs (37) and (43) we can evaluate the ratio of domain sizes
i^ = 7r lt^gts
= 2vn-^exp(A2)erfc(^) (44)
Theoretically k can change from zero to infinity However the minimum value of k is determined by Eq (40)
1V2 ltk lt laquogt (45)
Hence the ratio of domain sizes can change in a limited range (see also Fig 7)
131laquo V2^ erfc (^ ) s ^ lt 2 (46)
10^ 10^ 10- 10deg 10 10^ 10-
Fig 7 The ratio of volume-weighted and surface-weighted domain sizes as a function of the characteristic ratio of Cauchy and Gauss integral breadths k
332
Volume 98 Number 3 May-June 1993
Journal of Research of the National Institute of Standards and Technology
It may be noted that most experiments give the ratio D)vD)s in this range (see for instance re- view by Klug and Alexander [24]) When k goes to infinity the size broadening is given only by the Cauchy component and (JD)V=2(D)S This is a case of pure Cauchy size broadening described by Haider and Wagner [62] and de Keijser Mittemei- jer and Rozendaal [107] It is possible to imagine a more complicated column-length distribution func- tion [27] than Eq (39) which would allow even larger differences between surface-weighted and volume-weighted domain sizes However we are not aware of any study reporting a difference larger than 100
43 Distortion Coefficient
In Sec 212 it was shown that the distortion co- efficient can be approximated by the exponential
Adeg(L) = exp(-ITTVLeL))) (47)
Comparing with Eq (36) we can write
Therefore mean-square strains (MSS) decrease linearly with averaging distance L This behavior is usually observed in the Warren-Averbach analysis Rothman and Cohen [115] showed that such be- havior would be expected of strains around disloca- tions Adler and Houska [116] Houska and Smith [117] and Rao and Houska [118] demonstrated for a number of materials that MSS can be repre- sented by a sum of two terms given by Cauchy and Gauss strain-broadened profiles
However for i3Dc=0 the MSS are independent ofL
(^2)12 ^ ^Dc(2g) cotg = ^ 2V2 V2TT
(49)
where the upper limit of strain e is defined as 7j4 (see Sec 212) This is a limiting case of pure- Gauss strain broadening described by de Keijser Mittemeijer and Rozendaal [107]
44 Discussion
To calculate domain sizes and strain it is neces- sary to define size and distortion integral-breadths angular order-dependence From Eq (43) It fol- lows that the domain size D )v is always indepen- dent of the order of reflection
)3sc = const JSSG = const
However from Eq (48) we find
^^ = const ^^ = const
(50)
(51)
An important consequence is that apparent strain TJ will be independent of angle of reflection only in the case of pure-Gauss strain broadening because 3DC and JSDG depend differently on the dif- fraction angle If we compare Eq (51) with the multiple-line Voigt-function analysis [26] given by Eqs (27) and (28) it is evident that they disagree Therefore recombination of constituent integral breadths 3DC and 3DO to Voigt strain-broadened in- tegral breadth Pdeg and the subsequent application of Eq (49) to calculate strain [26 119] will concur with the Fourier methods if strain broadening is entirely Gaussian and for the asymptotic value of MSS ((e^( 00))) However neither volume-weighted domain sizes D)y will agree although they are de- fined identically in both approaches because size- broadened and strain-broadened integral breadths are dependent variables
If at least two orders of reflection ( and +1) of the same plane (hkl) are available using Eqs (50) and (51) we can solve Eqs (33) and (34)
(52)
^^deg sl + l)-sil) ^^^^
^^=sHl + l)-sl) [fc( + l)-3c()3 (54)
^^=sl + l)-sl) [^(^ + ^)-^(0]- (55)
If we substitute these expressions into Eqs (35) and (36) we see that this approach leads exactly to the Warren-Averbach Eq (20) for two orders of reflections This is expected because the distortion coefficient is approximated with the exponential (47)] Delhez de Keijser and Mittemeijer [23] ar- gued that instead of Eq (20) the following rela- tion would be more accurate
A(L)=AXL) (1 -27r^(e^(L))LVd (56)
333
Volume 98 Number 3 May-June 1993
Journal of Research of the National Institute of Standards and Technology
These two approximations differ with fourth-order terms in the power-series expansion In terms of this approach Eq (48) has to be rewritten
2r ^^ l-exp(-2LI3DC-TTL^0DG) (57)
This means that even if the strain-broadened pro- file is given entirely by the Gauss function the MSS depend on distance L (see Fig 8) In this ap- proximation no simple relation for the distortion integral-breadths angular order-dependence exists For not so large L however Eq (51) holds and approximations from Eqs (20) and (56) do not dif- fer much (see Fig 8)
1500 Warren- Averbach approximation ^
Delhez de Kcijscr and ^^^ Minemeijer approximation ^y^
^ 1000 A
500
mdashI
1 1
Oc 300 600 IL k^) X 10^
90
o ^ 60 A
30
1
J Warren- Averbach approximation
Delhez de Keijser and Minemeijer approximation
0 0 150 300
1L (A-1 ) X 10^
Fig 8 Mean-square strains pound^(L)) for two approximations of the distortion coefficient (upper) Voigt strain broadening (lower) pure-Gauss strain broadening
Generally it was shown that in the size-broad- ened profile the Cauchy part must dominate No similar requirement for the strain-broadened pro- file exists However experience favors the assump- tion that it has to be more of Gauss-type The Warren-Averbach approach is exact if strain broad- ening is purely Gaussian so Eqs (20) and (48) are
better approximations as strain profile is closer to the Gauss function In any case both approaches given by Eqs (20) and (56) are good up to the third power in strain and the Warren-Averbach relation [Eq (20)] does not assume that MSS are independent of distance L [27] it also represents a harmonic approximation
If at least two orders of reflection from the same plane (hkl) are available we can use Eqs (52) (53) (54) and (55) to calculate size-related and strain-related integral breadths Subsequent appli- cation of Eqs (37) (43) and (48) gives directly domain sizes (D) and (D)v and mean-square strains (e^(L)) This approach is more straightfor- ward and much simpler than the original Warren- Averbach analysis Great care should be given to the possible systematic errors The easiest way to observe the hook effect is to plot column-length distribution functions as a function of averaging distance L If they show negative values for small L (see Fig 6) all derived parameters will be in error This is because (i) only the positive values of the column-length distribution functions are numeri- cally integrated or (ii) the intercept on the L-axis of the linear portion of the A^ vs L curve is taken (see Fig 4) always larger values of domain sizes will be obtained than by the application of Eqs (37) and (43) Therefore we conclude that the dis- crepancy between integral-breadth and Fourier methods is always present by the appearance of the hook effect in the A^ vs L curve An analogous discrepancy exists between integral-breadth and variance methods [119] In such cases correction methods for truncation can be applied [35 119 120] but the best procedure is to repeat the pat- tern fitting with the correct background
In the Fourier analysis it is usually observed that the mean-square strains diverge as the averaging distance L approaches zero This also follows from Eqs (48) and (57) However because the MSS de- pendence on distance L is not defined in Warren- Averbach analysis it was suggested [27 107 121] that local strain can be obtained by taking the sec- ond derivative of the distortion coefficient or by a Taylor-series expansion of local strain Therefore we obtain from Eq (36)
i^m-M^-^) (58)
It is evident that this relation is wrong It holds only for a special case of pure-Gauss strain-broad- ened profile when the MSS are equal for any L Otherwise if the Cauchy function contributes to
334
Volume 98 Number 3 May-June 1993
Journal of Research of the National Institute of Standards and Technology
strain broadening all derivatives of strain in L = 0 are infinite and local strain can not be defined If the main origin of strains is dislocations [115] strains are defined after some distance from the dislocation (cutoff radius) to be finite Averaging strains over a region smaller than the Burgers vector is probably not justified For instance Eq (48) gives even for a small averaging distance L = 1 A and considerable strain broadening (J3DG(20) = 3DC(20) = 1O) root-mean-square strain eL = 1A))^ laquo02 that is about the elastic limit
45 Random Errors of Derived Parameters
Errors in size and strain analysis of broadened peaks are relatively difficult to evaluate Following Langford [26] sources of the systematic errors in- clude choice of standard specimen background and type of analytical function used to describe the line profiles The first two errors should be mini- mized in the experimental procedure Errors caused by inadequate choice of specimen function would systematically affect all derived results but they can not be evaluated Random errors caused by counting statistics have been computed by Wilson [122 123 124] and applied to the Stokes deconvolution method by Delhez de Keijser and Mittemeijer [23] as well as by Langford [26] and de Keijser et al [76] using single-line Voigt-func- tion analysis Nevertheless the approximate error magnitude can be calculated from estimated stan- dard deviations (esd) of the parameters refined in the fitting procedure In the program SHADOW the weighted least-squares error is minimized
7wp mdash RES
Here
)=1
RES = 2 vfi [ (obs) - (cal)]
(59)
(60)
and weights are the reciprocal variances of the ob- servations
H = l(obs) (61)
Each line profile has four parameters varied inde- pendently position intensity and Cauchy and Gauss integral breadths of the Voigt profile In least-squares refinement esds are computed as
^^ bu RES (62) m mdashm
Here ba are diagonal elements of the inverse matrix of the equation coefficients m is the number of observations and m is the number of refined parameters The main source of errors is integral breadths Errors in peak position peak intensity and background are much smaller and can be ne- glected in this simple approach For two indepen- dent variables )3G and Pc covariance vanishes and from Eqs (37) and (38) for the two orders of re- flection and +1 it follows that
RD =
si+i)m)RHMi))+si)m+i)i^(3c(+D)
(63)
ReL)r) =
pHDRHPcG)) + m + miPcJl + D) 2[3c(+1) - i8c()3+TTL [m+1) - mw
-n-LmiDRHihd))+m+mWcH+i))i ^ 2[)3c(+1) - iSc()+TTLim+1) - mw
(65)
Here Rx) are relative standard deviations The error in D would be complicated to evaluate but because 131D)s^(Igt)vlt2(pound))s Eq (63) gives a good estimation for the error in (Z))v as well Alter- natively to see how errors depend on the Fourier coefficients errors can be estimated from the Warren-Averbach relationship [Eq (20)] (86) From Eq (32) it follows that
RA (L)) = ATr^Lpos)R^2d)) +
4Lph(s)RPci2e)) (66)
Errors in root-mean-square strains and domain sizes are
i^((e^(L ))bulllaquo) =
RHA(Ll))+RHA(Ll + l)) (67)
ALl + l)
335
Volume 98 Number 3 May-June 1993
Journal of Research of the National Institute of Standards and Technology
^^laquo^))=(T^)
s(l + 1)RHA (Ll)) +SV)RHA (Ll + D) lsl + l)-sl)f (68)
Here (D) is approximately defined with A^(L) = l-L(D)j Errors in Fourier coefficients increase with L while factors in Eqs (67) and (68) lower the errors for large L In general errors of domain sizes and strains are of the same order of magnitude as errors of integral breadths [86]
5 Application 51 Correction for Instrumental Broadening
Before specimen broadening is analyzed instru- mental broadening must be determined This is ac- complished by carefully measuring diffraction peaks of some well-annealed defect-free speci- men It is then assumed that its broadening may be attributed only to the instrument The usual proce- dure is to anneal the specimen However in some instances that is not possible because either the material undergoes an irreversible phase transition on annealing or the number of defects can not be successfully decreased by annealing Another pos- sibility is to measure the whole diffraction pattern of the material showing the minimal line broaden- ing and then to synthesize the instrumental profile at the needed diffraction angle This approach re- quires the modeling of the angle dependence of the instrumental (standard) parameters Cagliotti Pao- letti and Ricci [125] proposed the following func- tion to describe the variation of the full width at the half maximum of profile with the diffraction angle
F9miA^(2e) = Utan^9 + Vtand + W (69)
Although this function was derived for neutron dif- fraction it was confirmed to work well also in x-ray diffraction case [126 127] A more appropriate function for the x-ray angle-dispersive powder dif- fractometer based on theoretically predicted er- rors of some instrumental parameters [128] may be the following [129]
FWHNf (2 e) = W+Vsin^l 6 +
UtanH + UcotH (70)
This function may better model the increased axial divergency at low angles and correct for the speci- men transparency [129] However contrary to the requirement on the specimen function most im- portant for the instrumental function is to correctly describe the angular variation of parameters re- gardless of its theoretical foundation
When specimen broadening is modeled with a Voigt function the simplest way to correct for the instrumental broadening is by fitting the line pro- files with the Voigt function too Cauchy and Gauss integral breadths of the specimen-broad- ened profile are then easily computable by Eqs (7) and (8) However because the instrumental broad- ening is asymmetric [24] modeling with the sym- metric Voigt function can cause a fictitious error distribution resulting in errors of strain up to 35 [76] Another approach is to model the instrumen- tal-broadening angle dependence by fitting the profile shapes of a standard specimen with some asymmetrical function split-Pearson-VII [95] or pseudo-Voigt convoluted with the exponential function [105] The instrumental function can then be synthesized at any desired angle of diffraction and convoluted with the assumed specimen func- tion to match the observed profile by means of Eq (2)
In the program SHADOW instrumental para- meters are determined by fitting the split-Pearson VII function (see Fig 9) to line profiles of a standard specimen
iix)=m- 2 m
with
c =-
mc^f
mm) mv-rim-12)
(71)
(72)
Here m = 1 or m = ltraquo yields a Cauchy or Gauss function respectively Refined full widths at half maximum (FWHM) and shape factors m for both low-angle and high-angle sides of the profiles are fitted with second-order polynomials To fit the FWHM we used Eq (69) and for the shape fac- tors
m(2e) = U(20f + V(2e) + W (73)
The resulting coefficients U V W U V and W permit synthesis of the asymmetrical instrumental line profile at any desired angle
336
Volume 98 Number 3 May-June 1993
Journal of Research of the National Institute of Standards and Technology
2 0(deg)
le
Fig 9 A split-Pearson VII profile The two half profiles have same peak position and intensity Adapted from Howard and Preston [4]
The basic requirement on the standard specimen is however to show as small a line broadening as possible To minimize physical contributions to the Une broadening of the standard specimen a few moments were emphasized as follows Because dif- fraction-line width depends strongly on degree of annealing it is preferable to use some reference powder-diffraction standard Furthermore asym- metry in the peak profiles is introduced by axial divergence of the beam flat specimen surface and specimen transparency [24] Choosing a standard specimen with low absorption coefficient would cause transparency effects to dominate If the stud- ied specimen has a large absorption coefficient (compared to the standard) this might produce a fictitious size contribution and errors in micro- strains All of the specimens studied have absorp- tion coefficients exceeding 1000 cm^ so a NIST standard reference material 660 LaBe was chosen to model the instrumental broadening (p = 1098 cm) According to Fawcett et al [130] LaBe showed the narrowest lines of all studied com- pounds Furthermore LaB6_has a primitive cubic structure (space group Pm3m) resulting in rela- tively large number of peaks equally distributed over 26 This allows for better characterization and lower errors of FWHMs and shape factors of split- Pearson VII functions (Fig 10)
52 Applicability of the Method
To study the applicability of method described in Sec 4 we first studied simple cubic-structure mate- rials such as silver and tungsten Tungsten has very narrow line profiles allowing us to obtain the up- per limit of domain sizes that can be studied Silver is easily deformed which provides a possibility to apply the method to broad line profiles To test the
009
-a
OH
006
003
1 1 m low-angle side n m high-angle side
bullz w 2 o OH
X
tancopy
Fig 10 Refined FWHMs and shape factors (exponents) m for low-angle and high-angle sides of LaBe line profiles Second- order polynomials were fitted through points
case of relatively complicated patterns and weak line broadening the method was also applied to Lai85Sroi5Cu04 and La2Cu04 powders In this sec- tion only the mechanical aspects of the line broad- ening are discussed Discussion about the origins of broadening of superconductors can be found in Sec 6
521 Silver and Tungsten Powders Figure 11 shows observed and refined peaks of tungsten un- treated and silver ground powders In Table 2 are listed results of fitted pure-specimen Voigt profiles for silver and tungsten specimens Table 3 and Fig 12 give results of the line-broadening analysis Untreated tungsten powder shows relatively weak broadening Instrumental profile FWHMs at angle positions of (110) and (220) tungsten lines are 0059deg and 0081deg respectively close to values mea- sured for tungsten 0065deg and 0100deg Results in Table 3 reveal that small broadening is likely caused by domain sizes because microstrains have negligible value This pushes the limit for measur- able domain sizes probably up to 4500-5000 A However one must be aware that weak specimen broadening implies higher uncertainty of all derived parameters Moreover the choice of the instrumental standard becomes more crucial
Both silver and tungsten line profiles become more Cauchy-like after grinding which probably increases dislocation density in the crystallites This is consistent with the presumption that small crystallites and incoherently diffracting domains separated by dislocations within grains affect the tails of the diffraction-line profiles [60115] Figure 13 illustrates the dependence of MSS on the recip- rocal of the averaging distance L
337
Volume 98 Number 3 May-June 1993
Journal of Research of the National Institute of Standards and Technology
C8
z
7- ^95
29 (deg) 405
bullJf^r-
z S 08
Ez U o u OS
a
04 bull
o Es
4P
2000 z^fA
4000
B
z u f- z
425 435 445 29 (deg)
455
yr 600 SOO
L(A)
Fig 11 Observed points (pluses) refined pattern (full line) and difference pattern (below) (110) W untreated (upper) (200) Ag ground (lower)
Fig 12 Fourier coefficients for the first- (pluses) and second- order (crosses) reflection and size coefficients (circles) [111] Ag untreated (upper) [100] Ag ground (lower)
Table 2 Parameters of the pure-specimen Voigt function as obtained from profile-fitting procedure for tungsten and silver powders
Specimen hkl 2ft(deg) 3c(deg) 3G(deg) FWHM(deg) Rwp()
W untreated 110 220
4028 8705
00065(7) 00301(6)
0020(2) ltio-
0021 0019
90 44
W ground 110 220
4029 8705
0100(2) 0222(3)
0038(4) 0069(6)
0080 0166
90 42
Ag untreated 111 222 200 400
3806 8151 4425 9786
0056(1) 0105(4) 0118(2) 0274(21)
ltio- 00008(21)
ltio-^ ltio-5
0036 0067 0075 0175
105 97
105 122
Ag ground 111 222 200 400
3807 8151 4424 9783
0175(3) 0410(26) 0365(10) 1079(82)
0038(12) ltio-
0076(29) ltio-
0121 0261 0250 0687
99 145 99
145
338
Volume 98 Number 3 May-June 1993
Journal of Research of the National Institute of Standards and Technology
Table 3 Microstructural parameters for tungsten and silver powders
Specimen Direction (poundgt)raquo( A) (2))v(A) ltpound^(fl3))laquo (^laquoD)v2)gtw
W untreated [110] 3200(200) 3500(200) 000038 000008(2)
W ground [110] 620(20) 1030(30) 00023 000054(2)
Ag untreated [111] [100]
1000(20) 510(20)
2000(20) 1030(20)
00010 00022
000024(1) 000047(5)
Ag ground [111] [100]
380(20) 210(10)
650(20) 350(20)
00047 00100
000095(7) 000180(14)
100 -_ - [100) Ag ground ^ ^~ mdash C1111 Ag ground ^bull
y y
o y ^ 50 A y
y y
y
0
y - y ^--
c ) 50 100 150
lLfAjxlO^
Fig 13 Mean-square strains (E^) as a function of VL
Errors in integral breadths allow estimation of errors in strain and size parameters (Sec 45) but in some cases the refinement algorithm gives unre- liable errors of integral breadths When a particu- lar parameter is close to the limiting value (for instance 10^ degrees has been put as the mini- mum value for integral breadths) errors become large However in Eqs (63) (65) (66) (67) and (68) only the product of integral breadth and ac- companying error is significant which is roughly equal for Cauchy and Gauss parts Errors of do- main sizes and strains are of the same order of magnitude as errors of integral breadths
The possible source of systematic error is poten- tial inadequacy of Voigt function to accurately de- scribe specimen broadening This effect can not be evaluated analytically but it would affect all derived parameters especially the column-length distribution functions The logical relationship be- tween values of domain sizes (see Table 3) for dif- ferent degrees of broadening indicates that possible systematic errors can not be large
Equation (41) allows computation of volume- weighted and surface-weighted average domain sizes if respective column-length distribution func- tions can be obtained Figure 14 gives surface- weighted and volume-weighted average column- length distribution functions following Eqs (39) and (38) Width of the distribution function deter- mines the relative difference between (D) and (pound))v The broader the distribution the larger the differences because small crystallites contribute more to the surface-weighted average That is much more evident comparing the surface- weighted column-length distribution with the vol- ume-weighted If they have similar shape and maximum position as in Fig 15 differences are small Conversely if the surface-weighted distribu- tion function has a sharp maximum toward smaller sizes differences are larger (see Fig 14) The dif- ference between (poundgt)s and (D)v and the actual mean dimension of the crystallites in a particular direction also depends strongly on the average shape of the crystallites [52 131 132]
If experimental profiles are deconvoluted by the Stokes method even for considerable specimen broadening size coefficients A ^ usually oscillate at larger L values [59 106] preventing computation of the column-length distribution function Few techniques were used to deal with this problem successive convolution unfolding method [32 133] smoothing and iterative methods [134 135 136 137] Figures 14 and 15 show very smooth column- length distribution functions However they follow from size coefficients ^4^ that depend on the accu- racy of the approximation for the distortion coeffi- cient given by Eq (47) Equation (47) is exact if the strain distribution is Gaussian but in general holds only for small harmonic numbers n if strain broadening is not negligible
339
Volume 98 Number 3 May-June 1993
Journal of Research of the National Institute of Standards and Technology
500 1000 L(A)
Fig 14 Surface-weighted and volume-weighted column-length distribution functions normalized on unit area [111] Ag un- treated (upper) [100] Ag ground (lower)
Fig 15 Surface-weighted and volume-weighted column-length distribution functions for [010] La2Cu04 normalized on unit area
522 La2-xSrtCu04 Powders To test the applicability of the discussed method to more com- plicated patterns two compounds with lower crystallographic symmetry were studied Lai85Sroi5Cii04 has a tetragonal K2NiF4-type struc- ture space group lAlmmm La2Cu04 is orthorhom-
bic at room temperature Both compounds show slight line broadening and relatively highly overlap- ping peaks (see Fig 16) which makes it very diffi- cult if not impossible to perform a Stokes analysis
25
-25
26 (deg)
yNraquo-
Fig 16 Observed points (pluses) refined pattern (full line) convoluted profiles (dashed line) and difference plot (below) for part of La2Cu04 pattern
Tables 4 and 5 list results from the fitting proce- dure and the analysis of specimen-broadened inte- gral breadths There are no qualitative differences in results for tungsten and silver powders How- ever average errors are higher as expected be- cause of overlapping peaks while weighted errors wp are surprisingly smaller This fact illustrates the unreliability of iwp when only a segment of the pat- tern is being refined because it depends on the number of counts accumulated in points as well as on the 28 range of the refinement
Figures 17 and 18 represent Fourier coefficients of Lai85Sroi5Cu04 [110] and La2Cu04 [010] direc- tions In the second plot the A (L )-versus-L plot shows a concave-downward part near L =0 the so- called hook effect It was shown in Sec 42 that the hook effect originates because of underesti- mation of background connected with the trunca- tion of profiles In the profile refinement all peaks separated less than 4deg 20 have been included in the refinement region to avoid possible overlapping of peak tails and specimen profiles have been trun- cated below 01 of the maximum intensity How- ever because the polynomial background was determined prior to profile refinement it may be overestimated for complicated patterns containing many overlapping peaks If background is refined with other profile parameters undesirable correla- tion with integral breadths occurs
340
Volume 98 Number 3 May-June 1993
Journal of Research of the National Institute of Standards and Technology
Table 4 Parameters of the pure-specimen Voigt function as obtained from profile-fitting procedure for La2-^SrCu04 powders
Specimen hid 2Hdeg) Pen PcO FWHM(deg) Rp()
Lai85Sroi5Cu04 004 2695 0046(4) 0024(8) 0042 34 006 4092 0083(5) ltio-= 0053 62 110 3352 0110(5) ltio- 0070 125 220 7046 0171(9) ltio- 0109 43
La2Cu04 004 2713 0061(8) 0045(9) 0067 39 006 4119 0124(7) ltio-^ 0079 77 020 3316 0074(10) 0078(10) 0102 29 040 6957 0210(30) 0026(81) 0135 29 200 3345 0074(8) 0061(10) 0087 69 400 7028 0130(10) 0023(95) 0089 29
Table 5 Microstructural parameters for Laij(5Srai3Cu04 and La2Cu04 powders
Specimen Direction (DUA) Pgt(A) lte^(fl3))laquo lte2((Z)gt2))laquo
Lai83Sro5Cu04
La2Cu04
[001] [110]
[001] [010] [100]
1700(300) 470(20)
1100(100) 680(50) 680(50)
2000(200) 940(20)
1200(100) 760(50) 810(50)
00024 00017
00038 00033 00016
000049(9) 000044(6)
00008(1) 00007(2) 00003(3)
c i ^- raquo sect 08 bulli - U
^0
ti- bull ll bull bullbullo
ffl M P bull- u ^ Di 04 Si - M bulldiamsbullbull a bull-v 3 o ^^=s^
u ^N^Sraquoraquo^
0 ^^^aaaa 1000
L(A) 2000
OQ bullbulldego UM o z a 08
o o bull bull bull
- u u bull raquo UU bull
a diams o bull o u ft 04 bull deg raquo deg - U bull bull deg Oi bullbullgt =3 bull- l o k u
0 bullbullbullraquo aaaMMi
500 1000
L(A)
Fig 17 Fourier coefficients for the first- (pluses) and second- order (crosses) reflection and size coefficients (circles) for [110] Lai^Sroi5Cu04
Fig 18 Fourier coefficients for first- (pluses) and second- order (crosses) reflection and size coefficients (circles) for [010] La2Cu04
341
Volume 98 Number 3 May-June 1993
Journal of Research of the National Institute of Standards and Technology
S3 Comparison with the Integral-Breadth Methods
Knowing the specimen integral breadths simpli- fied methods can be applied In Sec 212 we re- viewed multiple-line and single-line integral- breadth methods We shall compare the simplified multiple-line methods [Eqs (23) (24) and (30)] and the single-line method [76] [Eqs (29) and (30)] with results obtained for silver tungsten and La2-xSrxCu04 powders (Tables 3 and 5) We did not compare with the multiple-line Voigt-function method [26] because it was shown in Sec 44 that it is incompatible with the Warren-Averbach analy- sis In Table 6 integral breadth Pi was computed according to Eq (11) This value was compared with )8A integral breadth computed from Fourier coefficients [58]
i8A=- laquo3 2^(L)
(74)
Results obtained by the Warren-Averbach analysis are significantly smaller for both size and strain Integral-breadth methods give the upper limit for strain so comparison is limited Considering the approximation e = 125e^(L))^ [138] with L=(D)v2 or L=(D)s2 strains resemble more closely than crystallite sizes It must be noted how- ever that this approximation makes sense only in the case of pure-Gauss strain broadening Benedetti et al [106] reported excellent agreement for both size and strain using Warren-Averbach and Cauchy-Gauss [Eq (24)] methods Results from Table 6 on the contrary indicate that the Gauss-Gauss approximation gives values closest to the Warren-Averbach method for crystallite sizes whereas the Cauchy-Gauss and especially the Cauchy-Cauchy approximation tend to give too large values For strain the trend is opposite The Cauchy-Cauchy approximation resembles most
Table 6 Comparison of results obtained with the integral-breadth methods Cauchy-Cauchy (C-C) Cauchy-Gauss (C-G) Gauss- Gauss (G-G) and single-line (S-L) analysis
Specimen hkl PiXKP PAXKP ltigt)v (Z)gt(A) (e^((DV2)gt2 eXlO^ (A-) (A-0 (A) C-C C-G G-G S-L xlO^ C-C C-G G-G S-L
W untreated 110 220
0259 0247
0259 0247
3500 3700 3810 3810 14500 4040
008 -001 -003 -005 024 0
W ground 110 220
125 204
125 205
1030 2240 1450 1220 940 550
054 090 093 105 045 032
Ag untreated 111 2
0600 0901
0600 0900
2000 3340 2390 2190 1670 1110
024 035 039 095 0 0
200 124 124 1030 2270 1470 1230 810 047 082 085 095 0 400 204 204 490 0
Ag ground 111 222
198 352
200 352
650 2080 1240 910 530 280
095 179 182 197 048 0
200 403 406 350 9380 4780 1320 260 180 405 405 408 082 400 803 803 120 0
Lai85Sroi3Cu04 004 006
0657 0881
0650 0880
2000 5230 3290 2660 1970 1140
049 076 078 088 044 0
110 119 119 940 1240 1000 970 840 044 052 064 080 0 220 158 158 630 0
La2Cu4 004 006
0988 132
0998 131
1200 2980 1940 1630 1490 760
08 107 112 127 081 0-
020 143 142 760 1200 910 860 1240 07 079 090 110 114 040 198 200 510 016 200 126 124 810 810 810 810 1250 03 002 011 015 089 400 1S 126 830 014
Not possible to evaluate because of too small Gauss integral breadth
342
Volume 98 Number 3 May-June 1993
Journal of Research of the National Institute of Standards and Technology
closely a Warren-Averbach method These results concur with the Klug and Alexander [24] compari- son of the published size and strain values obtained by Warren-Averbach (Stokes) and integral-breadth methods However for x-ray diffraction the Cauchy-Gauss assumption for the size-strain broadening is theoretically and experimentally more favored thpoundm the other two models The fact that the Gauss-Gauss method for crystallite size and the Cauchy-Cauchy method for strain give more realistic results may mean that the presump- tion that size and strain broadening are exclusively of one type is an oversimplification
The single-line method seems much less reliable If Gaussian breadth is very small no information about strain is obtained Moreover second-order reflections give much lower values of both size and strain than do basic reflections However if multi- ple reflections are not available the single-line method can give satisfactory estimations
54 Reliability of Profile Fitting
The profile fitting of a cluster of even severely overlapping peaks can be accomplished with a low error and excellent fit of total intensity But how reliable is information obtained about separate peaks in the cluster In the fitting procedure it is possible to put constraints on the particular profile parameter to limit intensity position and width of the peak If anisotropic broadening or different phases are present constraints may not be realistic Morever acceptable results can be obtained even using a different number of profiles in refinement [4] Hence the first condition for the successful ap- plication of this method is knowledge of actual phases present in the sample and their crystalline structures
In this regard two powders were measured or- thorhombic Lai94Sroo6Cu04 has a slightly distorted K2NiF4-type structure (space group Bmab a =53510(2) A b =53692 A(2) c = 131931(7) A) and tetragonal Lai76Sro24Cu04 (space group I4mmm a =37711(3) A c = 132580(8) A) Data were collected for each specimen separately and for a specimen obtained by mixing the same pow- ders Because diffracted intensity of each phase was lower for the mixture counting time was pro- portionally increased to obtain roughly the same counting statistics Figure 19 shows two partially separated orthorhombic (020) (200) and (040) (400) peaks overlapped with tetragonal (110) and (220) reflections During the profile fitting of the mixed powders (200) orthorhombic peak tended to disappear on account of neighboring (020) and
(110) reflections Its intensity was constrained to vary in range plusmn 30 of (020) peak intensity which can be justified if the crystallographic structure is known
60
-60
345
345
335 29 (deg)
345
Fig 19 (upper) Lai76Sro24Cu04 (110) peak (middle) Lai94Sroo6Cu04 (020) and (200) peaks (lower) (110) (020) and (200) peaks
Table 7 contains results of fitted specimen-Voigt functions as well as size and strain values obtained by the analysis of broadening Comparing integral breadths of the starting and mixed powders some profiles change from more Cauchy-like to Gauss- like and vice versa This is especially evident for the (400) reflection meaning that accurate deter- mination of the profile tails is indeed affected in the cluster of overlapping peaks However integral breadth does not change significantly so results of
343
Volume 98 Number 3 May-June 1993
Journal of Research of the National Institute of Standards and Technology
Table 7 Comparison between two specimens run separately and mixed togetlier
Specimen hkl 2Hdeg) )3cO PoO DUA) (D)v(A) (e2laquoD)v2))laquoxlO
Lai76Sroj4CuOr 110 3369 0058(6) 0094(7) 780(60) 850(60) 10(1) 220 7073 022(2) 013(2)
LaiMSro(KiCu04 020 3342 0084(9) 055(14) 500(90) 1000(200) 07(1) 040 7012 010(2) 014(1) 200 3353 00216(85) 0061(8) 1100(100) 1200(100) 03(1) 400 7040 0026(11) 0088(8)
Mix 110 3367 0083(21) 0064(14) 800(300) 1200(300) 08(3) Lai76Sro24Cu04 220 7072 019(7) 013(4)
+ 020 3343 0066(35) 0070(23) 800(300) 1000(300) 07(4) Lai94Sroo6Cu04 040 7012 0116(93) 013(5)
200 3354 0024(156) 0071(61) 900(700) 1000(600) 04(12) 400 7041 011(2) 0003(320)
the multiple-line methods are not much influenced On the contrary the single-line method gives quite different results This may support the conclusion of Suortti Ahtee and Unonius [43] that the Voigt function fails to account properly for size and strain broadening simultaneously if only Cauchy integral breadth determines crystallite size
Table 7 shows that the results of Warren- Averbach analysis of starting and mixed powders agree in the range of standard deviations How- ever errors are much larger especially for the hid- den (200)-(400) reflections From Eq (62) it follows that more counts (longer counting times) and more observables (smaller step-size) would lower standard deviations Therefore in the case of highly overlapping patterns to obtain desirable ac- curacy much longer measurements are needed al- though that will not change the fact that higher overlapping implies intrinsically higher errors of all refinable parameters To further minimize possible artifacts of the fitting procedure it is desirable to include in the analysis as many reflections in the same ciystallographic direction as possible
55 Remarks
By modeling the specimen size and strain broad- ening with the simple Voigt function it is possible to obtain domain sizes and strains that agree with experiment and show a logical interrelationship Furthermore the Voigt function shows the correct 1A(26y asymptotic behavior of peak tails as ex- pected from kinematical theory [139] However if the specimen profile is significantly asymmetric (because of twins and extrinsic stacking faults [140 59]) or the ratio FWHM^ is not intermediate to the Cauchy (2Tr) and Gauss (2(ln27r)^) functions then the Voigt function can not be applied [25]
Suortti Ahtee and Unonius [43] found good over- all agreement by fitting the Voigt function to the pure-specimen profiles of a Ni powder deconvo- luted by the instrumental function However more accurate comparison is limited because of unavoid- able deconvolution ripples of specimen profiles Furthermore the Voigt function might not be flex- ible enough to model a wide range of specimen broadening as well as the different causes of broadening Therefore the question whether the Voigt function can satisfactorily describe complex specimen broadening over the whole 20 range in a general case needs further evaluation
This method of Fourier analysis with the as- sumed profile-shape function is most useful in cases when the classical Stokes analysis fails there- fore when peak overlapping occurs and specimen broadening is comparable to instrumental broaden- ing It was shown that for a high degree of peak overlapping the fitting procedure can give unreli- able results of Gauss and Cauchy integral breadths that is the peak can change easily from predomi- nantly Cauchy-like to Gauss-like and contrary This can lead to illogical values of size-integral and strain-integral breadths according to Eqs (52) (53) (54) and (55) and to irregularities in the be- havior of Fourier coefficients for large L Simulta- neously if the size-broadened profile has a large Gauss-function contribution the hook effect will occur However volume-weighted domain sizes D)y and MSS eL)) for small L are much less affected because they rely on both Cauchy and Gauss parts of the broadened profile Any integral- breadth method that attempts to describe the size and strain broadening exclusively by a Cauchy or Gauss function in this case fails completely For specimens with lower crystallographic symmetry
344
Volume 98 Number 3 May-June 1993
Journal of Research of the National Institute of Standards and Technology
when many multiple-order reflections are avail- able but the peaks are overlapped it is therefore desirable to include in the analysis as many reflec- tions as possible to minimize the potential artifacts of the fltting process
6 Analysis of Superconductors 61 (La-M)2Cu04 Superconductors
Bednorz and Miiller [16] found the first high- temperature oxide superconductor in the La-Ba- Cu-O system Soon after substituting Ba with Sr and Ca Kishio et al [17] found superconductivity in two similar compounds Later many compounds with much higher transition temperatures (Tc) were found The (La-M)2Cu04 system remains favorable for study because the cation content responsible for the superconductivity is easier to control and measure than the oxygen stoichiometry Also this system provides a wide range of substitutional cation solubility in which the tetragonal K2NiF4- type structure is maintained Compared with much- studied Y-Ba-Cu-O this structure is simpler because it contains only one copper-ion site and two oxygen-ion sites
The undoped compound La2Cu04 is orthorhom- bic at room temperature It becomes superconduct- ing either with cation substitution on La sites or increased oxygen content to more than four atoms per formula unit Doping with divalent cations in- creases the itinerant hole carriers in the oxygen- derived electron band [141] which probably causes the superconductivity However different dopants influence the transition temperature Tc Although the unit-cell c-parameter simply reflects ionic dopant size [142] the in-plane unit-cell parameter (and accordingly the Cu-0 bond length) correlates with Tc for different dopants and for different dop- ing amounts [142 143]
LaiB5MouCu04 (M = Ba Ca Sr) have a tetrago- nal K2NiF4-type structure space group lAlmmm with four atoms in the asymmetric unit [117] One site is occupied with La partially substituted with dopant ions (Fig 20) La2Cu04 is orthorhombic at room temperature The best way to correlate these two structures is to describe La2Cu04 in space group Bmab the c axis remains the same tetrago- nal [110] and [110] directions become [010] and [100] orthorhombic axes and size of the unit cell is doubled [144]
Figure 21 shows parts of the x-ray diffraction patterns observed and refined of Lai85Moi5Cu04 (M = Sr Ba Ca) and La2Cu04 Refined lattice
parameters are given in Table 8 Table 9 shows resuhs of the line-broadening analysis Relatively
La(BaCaSr)
0(2)
0(1)
Fig 20 Ciystal structure of (La-M)2Cu04 showing one unit cell
300 JUU
(b)
200
100
U 0 M J Js-r-^
30
-30
300
40 41 42 43 44 45 40 41 42 43 44 45 29 (deg) 29 (deg)
mdashA-
gt t 200
Z
F-
- 100
(c)
f V kgt ii I 40 41 42 43 44 45 40 41 42 43 44 45
e (deg) ^^ 26 (deg)
-30 wwX mdash Wlaquo-
Fig 21 Diffraction patterns of LaiH5Moi5Cu04 specimens (a) M=Sr (b) M = Ba (c)M = Ca (d) M = U
345
Volume 98 Number 3 May-June 1993
Journal of Research of the National Institute of Standards and Technology
Table 8 Lattice parameters and T^ at zero resistivity (Ac method at 10 Ma current)
Specimen a (A) bk) c(A) rc(K)
Lairaquo5Sroi5Cu04 377814(7)
Lairaquo3Baoi3Cu04 37846(2)
LaiiijCaoi5Cu04 37863(7)
La2Cu04 53558(2) 54053(2)
231(2) 36
288(4) 28
17(2) 19
1451(8)
Table 9 Results of line-broadening analysis for (La-M)2Cu4 specimens
Specimen hkl PcO PoO (DUk) (Iraquo)(A) lte^((D)2))
Lai(laquoSroj5Cu04 004 006
0046(4) 0083(5)
0024(8) ltio-
1700(300) 2000(200) 000049(9)
110 0110(5) ltio- 470(20) 940(20) 000044(6) 220 0171(9) ltio-
Lai85Baoi3Cu04 004 006
0049(6) 0110(7)
0076(6) 0089(9)
1100(200) 1100(100) 00011(2)
110 0087(4) 000042(6) 560(20) 1110(20) 000024(5) 220 0116(3) ltio-5
Laiji5Caoi5Cu04 004 006
0120(13) 0146(12)
0032(22) 0033(27)
440(70) 780(90) 00007(4)
110 0045(25) 0200(19) 340(30) 360(20) 00013(2) 220 0343(22) ltio-
La2Cu04 004 006
0061(8) 0124(7)
0045(9) ltio-
1100(100) 1200(100) 00008(1)
020 0074(10) 0078(10) 680(50) 760(50) 00007(2) 040 0210(30) 0026(81) 200 0074(8) 0061(10) 680(50) 810(50) 00003(3) 400 0130(10) 0023(95)
weak peak broadening was observed which can not be attributed to the proximity of the phase trans- formation Lai85SroisCu04 is tetragonal down to = 170 K [145] Lai85Baoi5Cu04 to 140 K [146147] and Lai85Caoi5Cu04 to 130 K [148] Another possi- ble reason for peak broadening might be continu- ous compositional variations in dopant content The scanning Auger microprobe analysis of La2-SrtCu04 compounds [149] showed that grain- boundary segregation of Sr is weak and limited to a narrow region near the grain surface In the case of the separation of two phases with different Sr con- tent and similar lattice parameters asymmetry of some reflections would be observed [150] More- over in the case of compositional inhomogeneity microstrains eL)) would be roughly independent of the averaging distance L in the grains [151] therefore distribution of strains would be Gaus- sian For all specimens microstrain behavior is identical it decreases linearly with distance L
Rothman and Cohen [115] showed that such be- havior of microstrains is caused by dislocations that might arise during grinding Assuming the same applied stress microstrain would be approximately inversely proportional to the elastic moduli of these materials If mean microstrain is defined as the arithmetic average of strains for the [001] and [110] directions results agree with values of the Youngs moduli for polycrystalline La2Cu04 Lai85Moi5Cu04 (M = Sr Ba Ca) [152] However other factors may contribute to the microstrain Coordination-6 ionic radii of La^+ Sr Ba^+ Ca^+ are 106 116 136 100 A respectively [153] Substitution of La with ions of different sizes affects the lattice parameter [142] and may cause much larger strains in the [001] direction when some of the ions are replaced with Ba^ than with Sr^ in accord with results in Table 9 Substitution of Ca^^ ions produces an entirely different effect microstrains in the [110] direction are larger This may be explained by
346
Volume 98 Number 3 May-June 1993
Journal of Research of the National Institute of Standards and Technology
comparing effects of substitutional ions on the unit-cell a -parameter The Ba-doped specimen has a larger a-parameter than the Sr-doped but the Ca-doped a-parameter is largest although Ca^^ has the smallest ionic size This should increase the cell distortion in the a-b plane
Table 9 reveals high anisotropy in these materi- als consistent with other physical properties such as thermal expansion [154] and upper critical mag- netic field [155] Differences of domain sizes might arise from a layered structure in the [001] direction and consequently easy incorporation of stacking faults between regularly stacked layers The stack- ing-fault and twin-fault probabilities can be esti- mated from the average surface-weighted domain sizes [59]
^ = TAN + cf1fun(aa) (75) m im - (D)
Here c is a constant for the particular [hkl] direction and fun(a a) a linear combination of stacking-fault probability and twin-fault probability a The exact form of Eq (75) was derived only for the cubic and hexagonal crystal structures On con- dition that the true domain dimension D is isotropic or so large that the second term of Eq (75) dominates a linear function of stacking-fault and twin-fault probability is
fun(aa) = c( 1
) (76) Zgt)J (Dgttrade
Here c denotes a constant that depends only on geometrical factors and is the same for all three doped compounds
Figure 22 shows a possible correlation between Tc and fault-defect probabilities computed from TEM observations of La2-jcSrCu04 revealed that stacking-fault density increased with Sr content up to jc = 015 [156] That study suggests that a shear mechanism forming the fault-boundary dislocations implies oxygen vacancies andor cation deficiency We did not measure oxygen content but neutron- diffraction studies showed that oxygen deficiency starts to appear at much higher Sr content [157] However the increase of fault probability with the simultaneous decrease of microstrain in Fig 22 supports the assumption that defects are intro- duced to accommodate lattice strains [156] A simi- lar increase in Te was found in Y2Ba4Cu802o-laquo thin films [158] Compounds with asymmetric broad- ened and shifted peaks showed higher Tc which
was attributed to stacking faults Although extrinsic stacking faults may cause asymmetric peak broad- ening [140] it is probably caused by twinning Twinning in La-M-Cu-0 materials is less abundant than in Y-Ba-Cu-O compounds but it was ob- served in (La-Sr)2Cu04 monocrystals on (110) planes [159] In the profile-fitting procedure peak asymmetry is incorporated only in the instrumental function therefore we could not model asymmetric peak broadening However any significant asym- metry of the specimen profile would cause an un- even fit of low-angle and high-angle sides of peaks which was not observed This gives much more im- portance to stacking faults in Eq (76)
Fig 22 Arithmetic average of [110] and [001] root-mean- square strains and linear function of stacking-fault and twin- fault probabilities as a function of Tc
In Fig 22 average microstrains defined as the arithmetic average of [001] and [110] directions correlate inversely with Tc However we did not find a correlation of Tc and microstrains in a partic- ular direction [001] microstrains simply reflect dif- ference in size of dopant and host La^ ions (see Table 9)
In La2Cu04 (OkO) reflections are significantly broader than (hOO) This has also been observed in low-temperature orthorhombic Lai85Sroi5Cu04 and Lai85Baoi5Cu04 [160] and explained by either stacking faults or possible lower symmetry Our results reveal that domain sizes (D) have identical values for [010] and [100] directions (Table 9) From Eq (76) it follows that stacking-fault proba- bilities in these directions have the same values However microstrains in the [010] direction are roughly twice as large as in the [100] direction which is responsible for the different broadening In the case of doped La2Cu04 compounds different microstrains might be caused by oxygen
347
Volume 98 Number 3 May-June 1993
Journal of Research of the National Institute of Standards and Technology
vacancies ordered along one direction in the a-b plane similar to effects found in YBa2Cu307-laquo However undoped La2Cu04 is not expected to have significant o^Qgen deficiency Other possibili- ties are lower ciystallographic symmetry andor La vacancies although they were not reported for this system but La deficiency was found in an La2Co04 compound [161]
We can conclude that lattice strains and incoher- ently diffracting domain sizes confirm high an- isotropy in these materials This simple approach however does not allow unambiguous identifica- tion of the strains origin Probably the strains originate from dislocations and from different sizes of host and dopant ions Domain sizes of all com- pounds are larger in the c-direction than in the a-6 plane This indicates existence of stacking faults and twins However because estimated errors are relatively large and only three materials were stud- ied the possible connection between stacking faults and 7c needs further study
62 Bi-Cu-O Superconductors
Among the high-Tc superconductors the Bi- Cu-O compounds appear intriguing especially because their incommensurate structure modula- tion remains incompletely understood [162 163] The crystal structure consists of perovskite-like SrO-(Cu02Ca)mi-Cu02-SrO layers separated by NaCl-like BiO double layers (see Fig 23 [164]) The number m of Cu02 layers alters the supercon- ducting transition temperature Tc (for m = 12 and 3 rclaquo10 90 and 110 K respectively) This two- dimensional layered structure makes these materi- als highly anisotropic and favours the creation of defects
Bulk sintered specimens showed relatively weak peak broadening Moreover the diffraction pat- terns contained many overlapping peaks because the compound crystallizes in an orthorhombic low- symmetry space group A2aa [165] and incommen- surate modulation gives superlattice reflections All patterns revealed a strong [001] texture (Fig 24) making reflections other than (001) difficult to ana- lyze The lattice parameters vary depending on the exact compound stoichiometry and processing his- tory but characteristically they have almost identi- cal a and b parameters and large c parameter fl =54095 A 6=54202 A c =309297 A for Bi2Sr2CaCu208 (Bi-2212 [166] and A =5392 A b =5395 A c =36985 A for (BiPb)2Sr2Ca2Cu30io (BiPb-2223) [165] Thus we treated (hOO) and (0^0) reflections as single peaks Table 10 gives the
results for three specimens Bi-2212 (BiPb)2 (SrMg)2(BaCa)2Cu30io (BiPbMgBa-2223) which were one-phase specimens and BiPb-2223 con- taining approximately equal amounts of 2212 and 2223 phases The in-plane lattice parameters of 2212 and 2223 phases differ little hence only the [00] directions of the mixed-phase specimen were evaluated
b^ (c)
Fig 23 Average crystal structure of Bi2Sr2Cam-iCum04+2m for (a) m = 1 (b) w =2 (c) m =3 [164]
35
-35
42 44 46 48 50 52 54 56 58 60 62 26 (deg)
^ ^^^MK^Aa^Ndllaquop
Fig 24 Part of BiPbMgBa-2223 refined pattern There are 48 fundamental reflections in this region
Interpretation of the results in the case of these complicated compounds must be considered care- fully Microstrains are probably caused by disloca- tion arrays However substitution of different-sized ions and vacancies would also contribute to the strains as would other kinds of disorder especially
348
Volume 98 Number 3 May-June 1993
Journal of Research of the National Institute of Standards and Technology
Table 10 Results of line-btoadening analysis for Bi-Cu-O supreconductors
Specimen Phase hkl (A)
eD)sa)y^
Bi-2212 2212 008 0012
0163(8) 022(3)
001(6) 005(6)
420(80) 00021(6)
020+200 0104(4) ltio-^ 580(30) 00007(1) 040+400 018(2) 00004(6300)
BiPbMgBa-2223 7773 0010 0020
0097(1) 021(2)
00002(1700) 0007(150)
770(60) 00012(1)
020 + 200 012(27) 013(10) 380(430) 00009(71) 040 + 400 015(95) 021(33)
BiPb-73 2212 008 0012
023(2) 025(5)
0002(350) 0001(1000)
220(30) 00013(26)
2223 0010 0020
022(8) 023(99)
0092(67) 018(47)
230(190) 00012(197)
Stacking faults and twins Table 10 shows larger strains in the [001] direction that in the basal plane This can be explained by stacking disorder along the c-axis which was frequently observed in electron-diffraction patterns as streaking [167 168] Easy incorporation of stacking faults is possi- ble because of the two-dimensional weak-bonded layers (BiO double layers are spaced about 3 A apart) The difference in microstrain between in- plane and the c-direction is much smaller for the BiPbMgBa-2223 phase probably because Pb low- ers the faulting by stabilizing the higher-Tc 2223 phase [167] For the BiPb-2223 specimen with two phases there are two possibilities Either the speci- men consists mainly of a mk of two kinds of one- phase grains or both phases occur within the same grains The second possibility was confirmed exper- imentally [169 170] and our results concur be- cause microstrain in the 2212 phase is much smaller than in the one-phase Bi-2212 specimen Processing conditions and cation content probably favour development of the macroscopic inter- growth of both phases within the grains that is microscopic defects grow to sufficiently large re- gions to give a diffraction pattern of another phase with the different number of Cu02 layers As a re- sult strain is relieved and both strains and domain sizes being quite different in one-phase specimens tend to equalize
For the Bi-Cu-O specimens the mean surface- weighted domain sizes are generally smaller than for (La-M)2Cu04 compounds Therefore the com- putation of the stacking- and twin-fault probabili- ties by using Eq (75) may be wrong It would be very instructive to compare the different broaden-
ing of satellite and fundamental reflections which indicates a more pronounced stacking disorder in the modulated structure [171]
In summary we found that for both Bi-2212 and BiPbMgBa-2223 superconductors the c-axis strain exceeds the in-plane strain The BiPb-2223 specimen containing both 2212 and 2223 phases within the single grains shows smaller incoherently diffracting domains and lower c-axis strain than the one-phase specimens This fact may direct us to- ward the mechanism of the second-phase forma- tion in these materials
63 Remarks
It was shown that this particular method of the line-broadening analysis can give information about the size of incoherently diffracting domains and lattice strains in (La-M)2Cu04 and Bi-Clu-O superconductors Moreover results show high an- isotropy of both size and strain parameters as one may expect because of the layered structure of all superconducting cuprates Generally structural line broadening is not large that is a result of rela- tively large domain sizes (200-2000 A) and small strains (002-02) It is interesting to compare these values with the published results for YBa2Cu307-laquo (isotropic strains of 023 [77] and 005-03 [82]) Although the different materi- als were studied they seem too large especially be- cause they are the average of strains in different directions
The main drawback of the line-broadening the- ory is the uncertainty about the origins of the line broadening that is it is difficult to distinguish the main effects responsible for the broadening For
349
Volume 98 Number 3 May-June 1993
Journal of Research of the National Institute of Standards and Technology
the novel superconductors particularly the numer- ous defects (substitutions vacancies stacking faults dislocations and similar) can occur simulta- neously which makes it very difficult to determine their individual contributions Furthermore the crystal structures of most novel superconductors are relatively complicated The average structure has mostly a slightly distorted tetragonal symmetry very similar a and b lattice parameters and a large c parameter but c=36 for YBa2Cu307-laquo for in- stance This results in a large number of overlap- ping peaks and consequently in large errors of all results This showed especially in the case of Bi-Cu-O superconductors (see Table 10) Follow- ing the discussion of reliability of profile fitting in Sec 54 it would be desirable to include more than two reflections in the analysis of broadening but higher-order peaks are usually too weak and over- lapped One way to partially solve this problem would be a whole pattern fitting [172 173] and Rietveld structure refinement [23] in terms of size and strain parameters This requires an accurate preset function to model specimen broadening and precise definition of angular dependence of size and strain parameters The Rietveld programs that model the line broadening in terms of size and strain parameters are based either on the simpli- fied integral-breadth methods [78 95] or on the single-line method [174]
7 Conclusions
A method for analyzing the pure-specimen (structural) broadening of x-ray diffraction line profiles is proposed By modeling the specimen size and strain broadenings with the simple Voigt func- tion it is possible to obtain domain sizes and strains that agree with experiment and show a logi- cal interrelationship Furthermore some common consequences and problems in the Fourier-method analysis follow easily The specimen function is convoluted with the instrumental function to match the observed x-ray diffraction-line profile This avoids the Stokes deconvolution method thus al- lowing analysis of patterns with highly overlapping peaks and weak structural broadening Therefore the method was applied to some novel high-Tc superconductors We reached the following conclu- sions
(i) Surface-weighted domain size depends only on the Cauchy integral breadth of the size-broad- ened profile
(ii) The hook effect occurs when the Cauchy-content of the size-broadened profile is un-
derestimated that is for ^sc(n2)^3sG Usually this happens when the background is estimated too high so the long tails of the Cauchy function are prematurely cut off
(iii) It also follows from conclusion (ii) that the volume-weighted domain size can not be more than twice the surface-weighted domain size (limiting value D)v=2D)i is obtained for the pure-Cauchy size-broadened profile) Minimum value for D)J (D)j should not be less than -131
(iv) If the distortion coefficient is approxi- mated with a harmonic term this leads exactly to the Warren-Averbach method of separation of size and strain broadenings
(v) In that case mean-square strains decrease linearly with the distance L
(vi) It is possible to evaluate local strain ((e^(0))^) only in the case of pure-Gauss strain broadening Then root-mean-square strain is inde- pendent of the distance L and related to the upper limit of strain obtained from the integral breadth of the strain-broadened profile
(vii) If strain broadening is not described exclu- sively with the Gauss function the multiple-line Voigt integral breadth and Warren-Averbach analyses can not give the same results for volume- weighted domain size although D)v is defined identically in both approaches because the appar- ent strain -q = pdeg(29)cot9 is not angular- independent
(viii) Smooth size coefficients give column- length distribution functions without oscillations and make possible a computation of volume- weighted average domain sizes up to ~5000 A
(ix) Comparison with the simplified integral- breadth methods in most cases has shown not large but systematic discrepancy of results indicat- ing that size and strain broadening can not be accu- rately modeled by a single Cauchy or Gauss function Moreover the application of the single- line method is much less reliable and it should not be used where multiple reflections are available
(x) The knowledge of all phases present in the sample and their crystallographic structure is re- quired to successfully fit a cluster of overlapping peaks Although it is very difficult to accurately de- termine the Cauchy-Gauss ratio of an overlapped peak final results of domain size and strain are much less affected Therefore connecting the crys- tallite size exclusively with the Cauchy content and strain with the Gauss content of a specimen profile might be doubtful
(xi) Evaluated errors of domain sizes and strains increase substantially with the degree of
350
Volume 98 Number 3 May-June 1993
Journal of Research of the National Institute of Standards and Technology
peak overlapping Hence for complicated patterns very accurate measurements are necessary and one needs to analyze as many reflections in the same crystallographic direction as possible
(xii) Line-broadening analysis of (La-M)2Cu04 and Bi-Cu-O compounds confirms high anisotropy in these materials
(xiii) Strains in (La-M)2Cu04 probably origi- nate from dislocations and from different sizes of host and dopant ions
(xiv) Stacking-fault probability in (La-M)2Cu04 (M = Ba Ca Sr) increases with increasing Tc whereas the average strain decreases
(xv) In La2Cu04 different broadening of (lOO) and (OfcO) reflections is not caused by stacking faults
(xvi) All Bi-Cu-0 superconductors show larger strain in the c-direction than in the a-b plane which can be explained by stacking disorder along the [001] direction
(xvii) In the specimen with approximately equal amounts of Tl-2212 and TlPb-2223 phases it is likely that a secondary phase develops by the growth of the microscopic faulted regions of the primary phase
Acknowledgments
I am thankful to Dr Harry McHenry for his support and especially to Dr Hassel Ledbetter for his wise guidance and most useful help during my stay at NIST I am also indebted to my home insti- tution the Faculty of Metallurgy of the University of Zagreb for allowing me the leave of absence at NIST
8 References
[1] W Friedrich P Knipping and M v Laue Ann Physik 41 971 (1912)
[2] H M Rietveld Acta Cryst 22 151 (1967) [3] H M Rietveld J Appl Cryst 2 65 (1969) [4] S A Howard and K D Preston in Modern Powder Dif-
fraction Vol 20 The Mineralogical Society of America Washington DC (1989) p 217
[5] D Taupin J Appl Cryst 6 266 (1973) [6] T C Huang and W Parrish Appl Phys Lett 27 123
(1975) [7] M K Wu J R Ashburn C J Torng P H Hor R L
Meng L Gao Z J Hwang Y Q Wang and C W Chu Phys Rev Lett 58 908 (1987)
[8] D Shi MRS Bull 16 37 (1991) [9] D Larbalestier Phys Today 44 74 (1991)
[10] J C Phillips Phys Rev B 4512647 (1992) [11] B Raveau Phys Today 45 53 (1992) [12] A J Millis and K M Rabe Phys Rev B 38 8908 (1988)
[13] F Guinea Europhys Lett 7 549 (1988) [14] C P Dhard and P Singh in Proc Int Symp High-Temp
Supercond Jaipur India Oxford amp IBH Publishing New Delhi (1988) p 271
[15] J D Jorgensen Phys Today 44 34 (1991) [16] J G Bednorz and K A Muller Z Phys B 64 189
(1986) [17] K Kishio K Kitazawa S Kaube I Yasuda N Sugii H
Takagi S Uchida K Fueki and S Tanaka Chem Lett 429 (1987)
[18] J D Jorgensen B Dabrowski S Pei D G Hinks L Soderholm B Morosin J E Venturini and D S Ginley Phys Rev B 38 11337 (1988)
[19] J R Clem Phys Rev B 43 7837 (1991) [20] M Paranthaman M Foldejiki D Balzar H Ledbetter
A J Nelson and A M Hermann submitted to Phys Rev B
[21] A R Stokes Proc Phys Soc Lond 61 382 (1948) [22] B E Warren and B L Averbach J Appl Phys 23 497
(1952) [23] R Delhez Th H de Keijser and E J Mittemeijer in
Accuracy in Powder Diffraction S Block and C R Hub- bard eds Natl Bur Stand (US) Special Publication 567 (1980) p 213
[24] H P Klug and L E Alexander X-ray Diffraction Proce- dures 2nd Edition John Wiley New York (1974) p 661
[25] J I Langford J Appl Ciyst 11 10 (1978) [26] J I Langford in Accuracy in Powder Diffraction S
Block and C R Hubbard eds Natl Bur Stand (US) Special Pubication 567 (1950) p 255
[27] R Delhez Th H de Keijser and E J Mittemeijer Fre- senius Z Anal Chem 312 1 (1982)
[28] A J C Wilson Proc Phys Soc Lond 80 286 (1962) [29] A J C Wilson Proc Phys Soc Lond 81 41 (1963) [30] L P Smith Phys Rev 46 343 (1934) [31] H C Burger and P H van Cittert Z Phys 79 722
(1932) [32] S Ergun J Appl Ciyst 1 19 (1968) [33] R Croche and L Gatineau J Appl Ciyst 10479 (1977) [34] L H Schwarz and J B Cohen Diffraction from Materi-
als Academic Press New York (1977) p 391 [35] R Delhez Th H de Keijser E J Mittemeijer and J I
Langford J Appl Cryst 19 459 (1986) [36] R Delhez Th H de Keijser E J Mittemeijer and J I
Langford Aust J Phys 41 213 (1988) [37] R A Young and D B Wiles J Appl Cryst 15 430
(1982) [38] W Voigt Stizungsber K Bayer Akad Wiss 42 603
(1912) [39] E E Whiting J Quant Spectrosc Radiat Transfer 8
1379 (1968) [40] G K Wertheim M A Butler K W West and D N E
Buchanan Rev Sci Instrum 111369 (1974) [41] M M Hall Jr V G Veeraraghavan H Rubin and P G
Winchell J Appl Cryst 10 66 (1977) [42] A Brown and J W Edmonds Adv X-Ray Anal 23 361
(1980) [43] P Suortti M Ahtee L Unonius J Appl Cryst 12 365
(1979) [44] T Sundius J Raman Spectrosc 1 471 (1973) [45] B H Armstrong J Quant Spectrosc Radiat Transfer 7
61 (1967) [46] J F Kielkopf J Opt Soc Am 63 987 (1973) [47] B P Asthana and W Kiefer Appl Spectr 36 250
(1982)
351
Volume 98 Number 3 May-June 1993
Journal of Research of the National Institute of Standards and Technology
[48] J P M de Vreede S C Mehrotra A Tal and H A Dijkerraan Appl Spectr 36 227 (1982)
[49] F R L Schoening Ada Ciyst 18 975 (1965) [50] P Scherrer Gott Nachr 2 98 (1918) [51] A R Stokes and A J C Wilson Proc Cambridge
Philos Soc 38 313 (1942) [52] A J C Wilson X-Ray Optics 2nd edition Methuen
London (1962) [53] S Leie and T R Anantharaman Proc Indian Acad
Sci Sect A H 261 (1966) [54] D Louer D Weigel and J I Langford J Appl Ciyst
5 353 (1972) [55] A J C Wilson J Appl Ciyst 2 181 (1969) [56] J I Langford and A J C Wilson J Appl Ciyst 11102
(1978) [57] A R Stokes and A J C Wilson Proc Phys Soc Lond
56174 (1944) [58] B E Warren and B L Averbach J Appl Phys 21 595
(1950) [59] B E Warren X-Ray Diffraction Addison-Wesley
Reading Massachusetts (1969) p 264 [60] B E Warren in Progress in Metal Physics Vol 8 Perg-
amon Press London (1959) p 146 [61] F Bertaut C R Acad Sci Paris 228 187 (1949) [62] N C Haider and C N J Wagner Acta Cryst 20 312
(1966) [63] D Balzar and H Ledbetter in Proceedings of the Accu-
racy in Powder Diffraction II Natl Inst Stand Technol (1992) p 37
[64] D Balzar and H Ledbeter J Appl Cryst 26 (1993) in press
[65] J N Eastabrook and A J C Wilson Proc Phys Soc Lond B 65 67 (1952)
[66] R S Smith IBM J Res Develop 4 205 (1960) [67] B Y Pines and A F Sirenko Soviet Physics Ciyst 715
(1962) [68] G B Mitra and N K Misra Acta Ciyst 22 454 (1967) [69] A Gangulee J Appl Ciyst 7 434 (1974) [70] J Mignot D Rondot Acta Met 231321 (1975) [71] J Mignot and D Rondot Acta Ciyst A 33 327 (1977) [72] R K Nandi H K Kuo W Schlosberg G Wissler J B
Cohen and B Crist Jr J Appl Ciyst 17 22 (1984) [73] M Zocchi Acta Ciyst A 36164 (1980) [74] P Ramarao and T R Anantharaman Trans Ind Ins
Metals 18 181 (1965) [75] R K Nandi and S P Sen Gupta J App Cryst 11 6
(1978) [76] Th H de Keijser J I Langford E J Mittemeijer and
B P Vogels J Appl Ciyst IS 308 (1982) [77] A Williams G H Kwei R B Von Dreele A C Lar-
son L D Raistrick and D L Bish Phys Rev B 37 7960 (1988)
[78] A C Larson and R B Von Dreele Los Alamos Na- tional Laboratory Report No LA-UR-86-748 (1988)
[79] J D Jorgensen D H Johnson M H Mueller J G Worlton and R B Von Dreele in Proceedings of the Conference on Diffraction Profile Analysis Cracow Poland (1978) p 20
[80] R B Von Dreele J D Jorgensen and C G Windsor J Appl Ciyst 15 581 (1982)
[81] P Thompson D E Cox and J B Hastings J Appl Ciyst 20 79 (1987)
[82] J P Singh R A Guttschow D S Kupperman J T Dusek and R B Poeppel in High Temperature Super-
conducting Compounds III S Whang A Gupta and E Ceilings eds TMS AIME Warrendale (1991) p 281
[83] M O Eatough D S Glnley and B Morosin Adv X- Ray Anal 33 145 (1990)
[84] E J Peterson P J Kung R E Muenchausen and D M Smith in Proceedings of the 41st Annual Denver Conference on Applications of X-Ray Analysis Colo- rado Springs Colorado (1992) p 74
[85] M Rand J I Langford and J S Abell submitted to J Cryogenics (1992)
[86] D Balzar J Appl Ciyst 25 559 (1992) [87] D Balzar H Ledbetter and A Roshko Physica C 185-
189 871 (1991) [88] D Balzar and H Ledbetter J Mater Sci Lett 111419
(1992) [89] D Balzar H Ledbetter and A Roshko Pow Diffr 8
(1993) in press [90] S Johnson M Gusraan D Rowcliffe T Geballe and J
Sun Adv Ceram Mater 2 337 (1987) [91] H Ledbetter S A Kim R B Goldfarb and K Togano
Phys Rev B 39 9689 (1989) [92] H Friedman Electronics 132 (1945) [93] W Parrish (ed) in Advances in X-Ray Diffractometry
and X-Ray Spectrography Centrex Publishing Company Eindhoven The Netheriands (1962)
[94] W Soller Phys Rev 24158 (1924) [95] S A Howard R L Snyder J Appl Ciyst 22 238
(1989) [96] G H Stout and L H Jensen X-Ray Structure Determi-
nation 2nd edition Wiley New York (1989) p 373 [97] D E Appleman and T Evans Jr Final Report 92-14
US Geological Survey Washington DC (1973) Avail- able as NTIS Document No PB-216188
[98] M U Cohen Rev Sci Instrum 6 68 (1935) [99] M U Cohen Rev Sci Instrum 7 155 (1936) [100] M H Mueller L Heaton and K T Miller Acta Ciyst
13 828 (1960) [101] R A Young P E Mackie and R B Von Dreele J
Appl Ciyst 10 262 (1977) [102] D B Wiles and R A Young J Appl Cryst 14 149
(1981) [103] J K Yau and S A Howard J Appl Ciyst 22 244
(1989) [104] S A Howard J K Yau and H U Anderson J Appl
Phys 65 1492 (1989) [105] S Enzo G Fagherazzi A Benedetti and S Poilizzi J
Appl Ciyst 21 536 (1988) [106] A Benedetti G Fagherazzi S Enzo and M
Battagliarin J Appl Cryst 21 543 (1988) [107] Th H de Keijser E J Mittemeijer and H C F Rozen-
daal J Appl Ciyst 16 309 (1983) [108] Y Zhang J M Stewart C R Hubbard and B Mo-
rosin Adv X-Ray Anal 33 373 (1990) [109] Y Wang S Lee and Y Ue J Appl Ciyst IS 35
(1982) [110] V N Selivanov and E F Smislov Zavod Lab 57 28
(1991) [Ill] A Guinier X-Ray Diffraction W H Freeman San
Francisco (1963) p 139 [112] M Wilkens J Appl Cryst 12119 (1979) [113] D Du and Y Wang Pow Diffr 2180 (1987) [114] A P Prudnikov Yu A Brychkov and O L Marichev
Integrals and Series Vol 1 Gordon and Breach Am- sterdam The Netheriands (1986) p 344
352
Volume 98 Number 3 May-June 1993
Journal of Research of the National Institute of Standards and Technology
[115] R L Rothman and J B Cohen J Appl Phys 42 971 (1971)
[116] T Adier and C R Houska J Appl Phys 50 3282 (1979)
[117] C R Houska and T M Smith J Appl Phys 52 748 (1981)
[118] S Rao and C R Houska Acta Ciyst A 4214 (1986) [119] J I Langford R Delhez Th H de Keijser and E J
Mittemeijer Ausi J Phys 41173 (1988) [120] J I Langfoid J Appl Cryst IS 315 (1982) [121] M J Turunen Th H de Keijser R Delhez and N M
van der Pers J Appl Ciyst 16176 (1983) [122] A J C Wilson Acta Ciyst 23 888 (1967) [123] A J C Wilson Acta Ciyst A 24 478 (1968) [124] A J C Wilson Acta Ciyst A 25 584 (1969) [125] G Gagliotti A Paoletti and F P Ricci Nucl Instrum
3 223 (1958) [126] J I Langford R J Cernik and D Louer J Appl
Ciyst 24 913 (1991) [127] J I Langford in Accuracy in Powder Diffraction II
preprint [128] A J C Wilson Mathematical Theory of X-Ray Powder
Diffractometiy Centrex Eindhoven The Netherlands (1963)
[129] J L Langford Prog Ciyst Growth and Charact 14185 (1987)
[130] T G Fawcett C E Crowder S J Brownell Y Zhang C R Hubbard W Schreiner G P Hamill T C Huang E Sabino J I Langford R Hamilton and D Louer Pow Diffr 3 209 (1988)
[131] W L Smith J Appl Ciyst 9187 (1976) [132] J L Langford and D Louer J Appl Ciyst 15 20
(1982) [133] Fl Popescu and L Benes Acta Ciyst A 33 323 (1977) [134] P PSuse^cu R MSnaila M Popescu and E Jijovici j
Appl Cryst 7 281 (1974) [135] P F Bley Y Calvayrac and M Fayard J Appl Ciyst
7 493 (1974) [136] B Moraweck Ph de Montgolfier and A J Renouprez
J Appl Ciyst 10191 (1977) [137] A Le Bail and D Louer J Appl Cryst 11 50 (1978) [138] D R Buchanan R L McCuUough and R L Miller
Acta Ciyst 20 922 (1966) [139] P Suortti and L D Jennings Acta Cryst A 33 1012
(1977) [140] J B Cohen and C N J Wagner J Appl Phys 33 2073
(1962) [141] A Bianconi J Budnick A M Flank A Fontaine P
Lagarde A Marcelli H Tolentino B Chamberland C Michel B Raveau and G Demazeau Phys Lett A127 285 (1988)
[142] K Fueki K Kitazawa K Kishio T Hasegawa S Uchida H Takagi and S Tanaka in Chemistiy of High- Temperature Superconductors D L Nelson M S Whittingham and T F George eds American Chemi- cal Society (1987) p 38
[143] T Fujita Y Aoki Y Maeno J Sakurai H Fukuba and H Fujii J Appl Phys 26 U68 (1987)
[144] R M Hazen in Physical Properties of High-rc Super- conductors Vol 2 D M Ginsberg ed World Scien- tific Singapore (1990) p 121
[145] J B Torrance A Bezinge A I Nazzal T C Huang S P Parkin D T Keane S J LaPlaca P M Horn and G A Held Phys Rev B 40 8872 (1989)
[146] J D Axe A H Moudden D Hohlwein D E Cox K
M Mohanty A R Moodenbaugh and Y Xu Phys Rev Lett 62 2751 (1989)
[147] T Suzuki and T Fujita Physica C 159 111 (1989) [148] T Fujita and Y Maeno in Superconducting Materials
JJAP Series 1 (1988) p 34 [149] A Roshko and Y-M Chiang J Appl Phys 66 3710
(1989) [150] D E Cox S C Moss R L Meng P H Hor and C W
Chu J Mater Res 31327 (1988) [151] B Crist and J B Cohen J Polym Sci 17 1001 (1979) [152] H Ledbetter S Kim and A Roshko Z Phys B 89275
(1992) [153] R D Shannon and C T Prewitt Acta Ciyst B 25 925
(1969) [154] M Lang H Spille F Steglich Y Hidaka T Murakami
and Y Endoh Physica C 162-1641037 (1989) [155] Y Hidaka and T Murakami Phase trans 15 241
(1989) [156] P L Gai and E M McCarron Science 247 553 (1990) [157] T Kamiyama I Izumi H Asano H Takagi S Uchida
Y Tokura E Takayama-Muromachi M Matsuda K Yamada Y Endoh and Y Hidaka Physica C 172 120 (1990)
[158] A Kapitulnik Physica C 153-155 520 (1988) [159] L A Muradyan V N Molchanov R A Tamazyan and
V I Simonov Physica C 162-164 536 (1989) [160] P Day M Rosseinsky K Prassides W I F David O
Moze and A Soper J Phys C 20 L429 (1987) [161] J T Lewandowski R A Beyerlein J M Longo and R
A McCauley J Amer Ceram Soc 69 699 (1986) [162] R Ramesh G van Tendeloo G Thomas S M Green
Y Mei C Jiang and H L Luo Appl Phys Lett 53 2220 (1988)
[163] J Schneck L Pierre J C Tolddano and C Daguet Phys Rev B 39 9624 (1989)
[164] O Eibl Physica C 168 215 (1990) [165] W Carrilo-Cabrera and W Gopel Physica C 161 373
(1989) [166] P Bordet J J Capponi C Chaillout J Chenavas A
W Hewat E A Hewat J L Hodeau M Marezio J L Tholence and D Tranqui Physica C 156189 (1988)
[167] R Ramesh K Remschnig J M Tarascon and S M Green J Mater Res 6 278 (1991)
[168] Z Hiroi Y Ikeda M Takano and Y Bando J Mater Res 6 435 (1991)
[169] Y Inoue M Hasegawa Y Shichi I Munakata M Ya- manaka S Hiyama and O Nittono J Mater Res 5 737 (1990)
[170] R Ramesh B G Bagley J M Tarascon S M Green M L Rudee and H L Luo J Appl Phys 67 379 (1990)
[171] X B Kan J Kulik P C Chow S C Moss Y F Yan J H Wang and Z X Zhao J Mater Res 5 731 (1990)
[172] G S Pawley J Appl Ciyst 13 630 (1980) [173] H Toraya J Appl Ciyst 19 440 (1986) [174] L Lutterotti and P Scardi J Appl Ciyst 23 246
(1990)
About the author Davor Balzar is with Faculty of Metallurgy of the University of Zagreb Sisak Croatia and was a Guest Researcher at fflST The National Institute of Standards and Technology is an agency of the Technology Administration US Department of Commerce
353
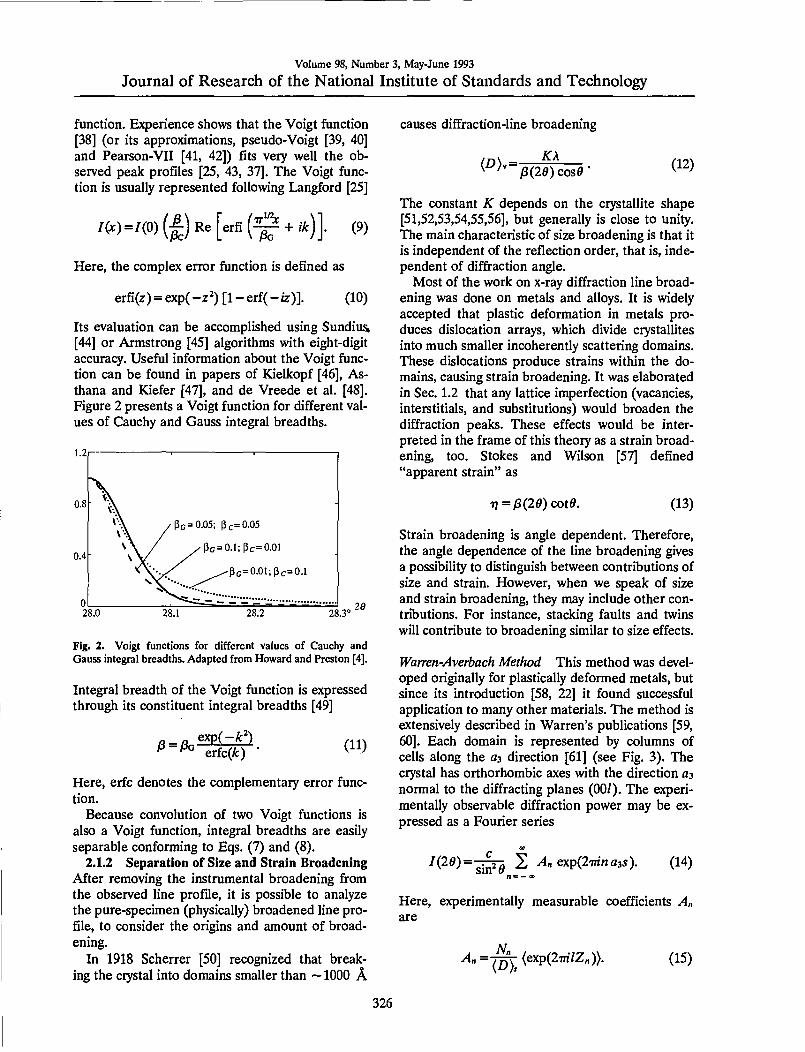
Volume 98 Number 3 May-June 1993
Journal of Research of the National Institute of Standards and Technology
function Experience shows that the Voigt function [38] (or its approximations pseudo-Voigt [39 40] and Pearson-VII [41 42]) fits very well the ob- served peak profiles [25 43 37] The Voigt func- tion is usually represented following Langford [25]
nx)=m^)Rc[ctn(^ + ik)] (9)
Here the complex error function is defined as
erfi(z) = exp( -z^) [1 - erf( -raquo)] (10)
Its evaluation can be accomplished using Sundius [44] or Armstrong [45] algorithms with eight-digit accuracy Useful information about the Voigt func- tion can be found in papers of Kielkopf [46] As- thana and Kiefer [47] and de Vreede et al [48] Figure 2 presents a Voigt function for different val- ues of Cauchy and Gauss integral breadths
causes diffraction-line broadening
12
Pc=005 pc=005
Pc = 01pc=001
PG=001PC=01
283 26
Fig 2 Voigt functions for different values of Cauchy and Gauss integral breadths Adapted from Howard and Preston [4]
Integral breadth of the Voigt function is expressed through its constituent integral breadths [49]
^ erfc(A) (11)
Here erfc denotes the complementary error func- tion
Because convolution of two Voigt functions is also a Voigt function integral breadths are easily separable conforming to Eqs (7) and (8)
212 Separation of Size and Strain Broadening After removing the instrumental broadening from the observed line profile it is possible to analyze the pure-specimen (physically) broadened line pro- file to consider the origins and amount of broad- ening
In 1918 Scherrer [50] recognized that break- ing the crystal into domains smaller than ~1000 A
ltZ)gtv = KX
3(20) cos9 (12)
The constant K depends on the crystallite shape [515253545556] but generally is close to unity The main characteristic of size broadening is that it is independent of the reflection order that is inde- pendent of diffraction angle
Most of the work on x-ray diffraction line broad- ening was done on metals and alloys It is widely accepted that plastic deformation in metals pro- duces dislocation arrays which divide crystallites into much smaller incoherently scattering domains These dislocations produce strains within the do- mains causing strain broadening It was elaborated in Sec 12 that any lattice imperfection (vacancies interstitials and substitutions) would broaden the diffraction peaks These effects would be inter- preted in the frame of this theory as a strain broad- ening too Stokes and Wilson [57] defined apparent strain as
Tj=3(20)cot0 (13)
Strain broadening is angle dependent Therefore the angle dependence of the line broadening gives a possibility to distinguish between contributions of size and strain However when we speak of size and strain broadening they may include other con- tributions For instance stacking faults and twins will contribute to broadening similar to size effects
Warren-Averbach Method This method was devel- oped originally for plastically deformed metals but since its introduction [58 22] it found successful application to many other materials The method is extensively described in Warrens publications [59 60] Each domain is represented by columns of cells along the 03 direction [61] (see Fig 3) The crystal has orthorhombic axes with the direction 03 normal to the diffracting planes (00) The experi- mentally observable diffraction power may be ex- pressed as a Fourier series
(20)=-^ 2 An expilvina^s) (14)
Here experimentally measurable coefficients Abdquo are
Nbdquo Abdquo =T^ ltexp(2m7Zbdquo)) (15)
326
Volume 98 Number 3 May-June 1993
Journal of Research of the National Institute of Standards and Technology
m 3
^i
m I
Fig 3 Representation of the crystal in terms of columns of cells along the a^ direction [59]
The Abdquo coefficients are the product of two terms The first term depends only on the column length (size coefficient) the second depends only on dis- tortion in domains (distortion coefficient)
An mdashAn An bull
Nbdquo lf = ltexp(2TrZbdquo))
(16)
(17)
It is more convenient to express the distortion coef- ficient in terms of the strain component If L =laquoa3 is the undistorted distance between a pair of cells along direction 03 and distortion changes distance by 4L = a^Zn the component of strain in the as direction (orthogonal to reflecting planes) aver- aged over distance L can be defined as (L) = A(L) L Because oil^d interplanar spacing the distortion coefficient can be rewritten
Ideg(L) = exp(2TrLe(L)d)) (18)
To obtain the strain component it is necessary to approximate the exponential term For not too large L
exp(2mLe(L)d)
laquoexp(-2Tr^L2lte2(L))d^) (19)
This relationship is exact if the distributions of e(L) for all L values follow the Gauss function and is generally true as far as terms in e^(L) because
these distributions are usually sufficiently symmet- rical [57] Now Eq (16) can be approximated as
InA L)=lnAL)- 2TTeL))LW) (20)
Warren and Averbach [22] derived this relation- ship in a similar way It separates size and strain contributions to the broadening and allows for their simultaneous evaluation
If the size coefficients are obtained by applica- tions of Eq (20) it is possible to evaluate the aver- age surface-weighted domain size and the surface-weighted column-length distribution func- tion [59]
idAHL) ^ 1_
Ps(L) dMU) dL^
(21)
(22)
Figure 4 shows how (D) can be obtained from both the size coefficients ^^(L) and the column- length distribution function
Fig 4 Surface-weighted domain size is determined (a) by the intercept of the initial slope on the L-axis (b) as a mean value of the distribution function
Multiple-Line Integral-Breadth Methods To sepa- rate size and strain broadening by using integral breadths it is necessary to define the functional form for each effect In the beginning size and strain contributions were described by Cauchy or Gauss functions Using Eqs (12) and (13) on the s scale and additive relations for the integral breadths following Eqs (7) and (8)
1 j8 =77vr + 2es (Cauchy-Cauchy) (23)
8=T^ + ^y- (Cauchy-Gauss) (24)
327
Volume 98 Number 3 May-June 1993 Journal of Research of the National Institute of Standards and Technology
^^=7^ + 4e^s^ (Gauss-Gauss) (25)
Here e = Tj4raquo4dd is the upper limit for a strain Equation (24) uses the Haider and Wagner [62] parabolic approximation for the integral breadth of the Voigt function expressed by Eq (11)
3 I3) (26)
Experience shows however that neither Cauchy nor Gauss functions can model satisfactorily size or strain broadening in a general case Langford [26] introduced the so-called multiple-line Voigt-func- tion analysis Both size-broadened and strain- broadened profiles are assumed to be Voigt functions Using Eqs (12) and (13) it follows sym- bolically for Cauchy and Gauss parts that
j8c = i3sc+j8Dcs
ph = Plc + plcs^
(27)
(28)
This approach disagrees with the Warren- Averbach analysis that is the two methods give different results (see Sec 44) [63 64]
Single-Line Methods There are cases where only the first order of reflection is available or higher- order reflections are severely suppressed (ex- tremely deformed materials multiphase com- posites catalysts and oriented thin films) Many methods exist to separate size and strain broaden- ing from only one diffraction peak However it was stated in Sec 212 that the different size and strain broadening angle dependence is a basis for their separation hence using only one diffraction line introduces a contradiction Consequently single- line methods should be used only when no other option exists The single-line methods can be di- vided in two main parts Fourier-space and real- space methods Fourier-space methods are based on the Warren-Averbach separation of size and strain broadening following Eq (20) The func- tional form of E^(L)) is assumed either to be con- stant [65666768] or assumed to depend on L as eL))=cL [69707172] Then Eq (20) can be fitted to few points of A(L) for the small averaging distance L to obtain size and strain parameters All Fourier-space methods have the serious prob-
lem that the Fourier coefficients 4 (L) are usually uncertain for small L because of the so-called hook effect [60] (see Sec 42) 2occhi [73] sug- gested that fitting the straight line through the first derivatives of the Fourier coefficients instead of through the coefficients themselves would solve the hook-effect problem
All real-space methods [747576] are based on the assumption that the Cauchy function deter- mines size and that the Gauss function gives strain The most widely used method of de Keijser et al [76] gives size and strain parameters from Cauchy and Gauss parts of the Voigt function respectively
P)v=^
e=^ 2s
(29)
(30)
22 Diffraction-Line-Broadening Analysis of Superconductors
In this field very few studies exist Williams et al [77] reported isotropic strains in YBa2Cu307-laquo powder by the simultaneous Rietveld refinement of pulsed-neutron and x-ray diffraction data Using a GSAS Rietveld refinement program [78] both size and strain broadening were modeled with the Gauss functions for the neutron-diffraction data [79 80] and with the Cauchy functions for the x- ray diffraction data (modified method of Thomp- son Cox and Hastings [81]) Interestingly both the neutron and x-ray data gave identical values for the isotropic strain (023) and no size broaden- ing Singh et al [82] studied internal strains in YBa2Cu307-laquo extruded wires by pulsed-neutron diffraction They separated size and strain parame- ters by means of Eq (25) (Gauss-Gauss approxi- mation) Size broadening was found to be negligible but (isotropic) microstrains range from 005 for the coarse-grained material to 03 for the fine-grained samples Eatough Ginley and Morosin [83] studied Tl2Ba2Ca2Cu30io (Tl-2223) and Tl2Ba2CaCu208 (Tl-2212) superconducting thin films by x-ray diffraction Using the Gauss-Gauss approximafion they found strains of 014-018 in both phases and domain sizes of 1200-1400 A for Tl-2212 but 500 A for Tl-2223
We are aware of only two more unpublished studies [84 85] involving size-strain analysis in high-Tc superconductors The probable reason is that any analysis is very difficult because of weak line broadening and overlapping reflections This
328
Volume 98 Number 3 May-June 1993
Journal of Research of the National Institute of Standards and Technology
precludes application of reliable analysis such as the Stokes deconvolution method with the Warren- Averbach analysis of the broadening Instead sim- ple integral-breadth methods are used which gives generally different results for each approach Moreover for x-ray diffraction broadening appli- cation of the Gauss-Gauss approximation does not have any theoretical merit although reasonable values especially of domain sizes may be obtained [86] We showed [878889] that reliable diffrac- tion-line-broadening analysis of superconductors can be accomplished and valuable information about anisotropic strains and incoherently diffract- ing domain sizes obtained
3 Experiment 31 Materials
The materials used for this study were tungsten and silver commercially available powders with nominal grain sizes 4-12 ijim La2-xSriCu04(jc = 0 006 015 024) powders Lai^Moi5Cu04(M = Ca Ba) powders Bi2Sr2CaCu208 (Bi-2212) sinter (BiPb)2Sr2Ca2Cu30io(BiPb-2223) sinter and (BiPb)2(SrMg)2(BaCa)2Cu30io (BiPbMgBa-2223) sinter
Powders with nominal compositions La2-xSrCuO4(c=0 006 015 024) and Laig5Moi5Cu04(M = Ca Ba) were prepared at the National Institute of Standards and Technology Boulder Colorado by A Roshko using a freeze- drying acetate process [90] Acetates of the various cations were assayed by mass by calcining to the corresponding oxide or carbonate The appropriate masses of the acetates for the desired compositions were dissolved in deionized water The acetate so- lutions were then sprayed through a fine nozzle into liquid nitrogen to preserve the homogeneous cation distributions Frozen particles were trans- ferred to crystallization dishes and dried in a com- mercial freeze dryer to a final temperature of 100 degC After drying the powders except the Lai^Baoi5Cu04 were calcined in alumina (998) crucibles at 675 C for 1 h in a box furnace with the door slightly open to increase ventilation Because BaCOs is difficult to decompose the Laig5Baoi5Cu04 was calcined under a vacuum of 2 Pa at 800 C for 4 h then cooled slowly in flowing oxygen (2degCmin) The calcined powders were oxidized in platinum-lined alumina boats in a tube furnace with flowing oj^gen at 700 degC After 3 h at 700 C the powders were pushed to a cold end of the furnace tube where they cooled quickly (20 Cs) while still in flowing oxygen
The cylindrical specimens (23 mm in diameter and 9 mm thick) of Bi-2212 BiPb-2223 and BiPbMgBa-2223 were prepared at the National Research Institute for Metals Tsukuba Japan by K Togano [91] Starting oxides and carbonates were Pb304 61203 CuO SrCOs MgCOs and BaC03 They were calcinated in air at 800 C for 12 h Powders were then pressed and sintered in 8 oxygen-92 argon mixture at 835 degC for 83 h Specimens were furnace cooled to 750 degC held for 3 h in flowing oxygen and then furnace cooled in ojygen to room temperature
311 Preparation of Specimens for X-ray Diffraction The bulk specimens were surface polished if necessary and mounted in specimen holders Coarse-grained powders of La2-cSrxCu04 (x=Q 006 015 024) and Lai8sMoi5Cu04 (M = Ca Ba) were ground with a mortar and pestle in toluene and passed through a 635-mesh sieve (20-|xm nominal opening size) Silver and tungsten powders were dry ground with a mortar and pestle All powders were mixed with about 30 silicone grease and loaded into rectangular cavities or slur- ried with amyl acetate on a zero-background quartz substrate
32 Measurements
X-ray-diffraction data were collected using a standard two-circle powder goniometer in Bragg- Brentano parafocusing geometry [92 93] (see Fig 5) A flat sample is irradiated at some angle incident to its surface and diffraction occurs only from crystallographic planes parallel to the speci- men surface The goniometer had a vertical 0-26 axis and 22 cm radius CnKa radiation ex- cited at 45 kV and 40 mA was collimated with Seller slits [94] and a 2 mm divergence slit SoUer slits in the diffracted beam 02 mm receiving slit and Ge solid-state detector were used in a step- scanning mode (OOI7IO s for a standard specimen 002deg-005730-80 s for other specimens depending on the amount of broadening)
33 Data Analysis
The diffractometer was controlled by a com- puter and all measurements were stored on hard disc Data were transferred to a personal computer for processing
We used computer programs for most calcula- tions X-ray diffraction patterns were fitted with the program SHADOW [95] This program allows a choice of the fitting function and gives refined positions of the peak maximums intensities and function-dependent parameters It also has the
329
Volume 98 Number 3 May-June 1993
Journal of Research of the National Institute of Standards and Technology
Seller Slits
Source S
Specimen
Fig 5 Optical arrangement of an x-ray diffractometer Adapted from Klug and Alexander [24]
ability to convolute the predefined instrumental profile with the specimen function to match the ob- served pattern Choice of the specimen function in- cludes Gauss and Cauchy functions We added the ability to model the specimen broadening with an exact Voigt function and implemented SHADOW on a personal computer In the fitting procedure for every peak in the pattern the program first gen- erates the instrumental profile at the required dif- fraction angle The instrumental profile is deter- mined from prior measurements on a well-annealed standard specimen (see Sec 51) Then it assumes parameters of the specimen profile For an exact Voigt function parameters are peak position peak intensity and Cauchy and Gauss integral breadths of the Voigt function By convoluting the instru- mental profile with the specimen profile and adding a background the calculated pattern is ob- tained [Eq (2)] Parameters of the specimen profile are varied until the weighted least-squares error of calculated and observed patterns Eq (59) reaches a minimum This process avoids the unstable Stokes deconvolution method It is possible that the refine- ment algorithm is being trapped in a false minimum [96] but it can be corrected by constraining some parameters Refined parameters of the pure-speci- men profile are input for the size-strain analysis of the broadening A program for this analysis was written in Fortran
Lattice parameters of powder specimens were calculated by the program NBSLSQ85 based on the method of Appleman and Evans [97] A pro- gram in Fortran was written to apply corrections to observed peak maximums by using NIST standard reference material 660 LaB6 as an external stan-
dard Lattice parameters of bulk specimens were determined by the Fortran program which uses a modified Cohens method [9899100] to correct for systematic diffractometer errors Lattice parame- ters were also calculated by the Rietveld refinement programs GSAS [78] and DBW32S [101 102]
4 Methodology
When instrumental and specimen contributions to the observed line profile must be modeled sepa- rately adopting a specimen function is a critical step Yau and Howard [103104] used Cauchy and Enzo et al [105] pseudo-Voigt functions Benedetti Fagherazzi Enzo and Battagliarin [106] showed that modeling the specimen function with the pseudo-Voigt function gives results comparable to those of the Stokes deconvolution method when combined with the Warren-Averbach analysis of Fourier coefficients De Keijser Mittemeijer and Rozendaal [107] analytically derived domain sizes and root-mean-square strains for small averaging distance L in the case of the Voigt and related func- tions
The aim here is to study more thoroughly the consequences of assumed Voigt specimen function on the size-strain analysis of the Fourier coeffi- cients of the broadened peaks It is shown that some experimentally observed interrelations between derived parameters (particularly volume-weighted and surface-weighted domain sizes) and their be- havior (the hook effect and dependence of mean- square strains on the averaging distance) can be explained by this simple assumption Moreover the discrepancy between the integral-breadth methods and Warren-Averbach analysis results from differ- ent approximations for the strain broadening and the background experimental errors
41 Separation of Size and Strain Broadenings
The normalized Fourier transform of a Voigt function is easily computable [46]
^ =exD[-2laquo^e^-7m^^fi^l fan ^bdquo-exp|^ ^ cr(2e) ^ a^(2e) T ^^^^
It is convenient to express Fourier coefficients in terms of distance L by immediately making the ap- proximation A (26) = Ascos do
AL) = exp[-2L^-7rL^pl] (32)
330
Volume 98 Number 3 May-June 1993
Journal of Research of the National Institute of Standards and Technology
Equation (32) is a good approximation even for large specimen broadening Even for a profile span of A (29) = 80deg the error made by replacing this in- terval by an adequate A(sin9 ) range is 2 How- ever strictly speaking the profile will be asym- metrical in reciprocal space and Fourier-interval limits will not correspond to the 29i and Idz peak- cutoff values in real space It is important to keep Fourier interval limits identical for all multiple-or- der reflections otherwise serious errors in the sub- sequent analysis will occur [108] If higher accuracy for a considerable broadening is desired profile fit- ting can be accomplished In terms of the recipro- cal-space variable s instead of in a real 29 space
Assuming that only the Cauchy function deter- mines domain size [4(L) = exp(-L(Z))s)] and only the Gauss function gives root-mean-square strain (RMSS) [^deg(L) = exp(-27r=L2(e)d^)] Eq (32) leads to the Warren-Averbach [Eq (20)] for the separation of size and strain contribution [62] Experience shows that Cauchy and Gauss functions can not satisfactory model specimen broadening Balzar and Ledbetter [64] postulate that the speci- men function includes contributions of size and strain effects both approximated with the Voigt functions Because the convolution of two Voigt functions is also a Voigt function Cauchy and Gauss integral breadths of the specimen profile are easily separable
3c=i3sc + 3DC (33)
(34)
Langford [26] separated the contributions from size and strain broadening in a similar way (See Eqs (27) and (28)) Note however that Eqs (33) and (34) do not define size and strain angular or- der-dependence
Because Fourier coefficients are a product of a size and a distortion coefficient from Eqs (32) (33) and (34) we can obtain the separation of size and strain contributions to the pure specimen broadening
^S(L) = exp(-2Li3sc-TrL^3io) (35)
Adeg(L) = eM-2LpDc-TrL^Phc) (36)
Wang Lee and Lee [109] modeled the distortion coefficient and Selivanov and Smislov [110] mod- eled the size coefficient in the same way
To obtain size and distortion coefficients at least two reflections from the same crystallographic- plane family must be available
42 Size Coefficient
Surface-weighted domain size is calculated from the size coefficients following Eq (21) From Eq (35) we obtain
lt^gts = 1
2i3sc (37)
Therefore surface-weighted domain size depends only on the Cauchy part of the size-integral breadth
The second derivative of the size coefficients is proportional to the surface-weighted column-length distribution function Eq (22) The volume- weighted column-length distribution function fol- lows similarly [111]
p(L)ocL^j^ (38)
By differentiating Eq (35) twice we obtain
^^4^ = [(2^L^ic + 2^sc)^- dL
2TrplcAL) (39)
Because the column-length distribution function should always be positive [59] the Cauchy part must dominate Inspection of Eq (39) shows that for small L we must require
(40)
Otherwise the hook effect will occur in the plot of size coefficientsI (L) versus L that is the plot will be concave downward for small L (Fig 6) The hook effect is usually attributed to experimental errors connected with the truncation of the line profiles and consequently overestimation of background [59] This is a widely encountered prob- lem in the Fourier analysis of line broadening It results in overestimation of effective domain sizes and underestimation of the RMSS [36] Some authors [106] claim that the preset specimen- broadening function eliminates the hook effect However Eq (39) shows that effectively too high
331
Volume 98 Number 3 May-June 1993
Journal of Research of the National Institute of Standards and Technology
08-
04-
mdash^ 1 J 1 x
^~ ( ^ ^ i I
1 t 1 11
jl u
V 1 iJ
J
c^
100 200
Fig 6 (upper) The hook effect of the size coefficients A ^ (full line) at small L (lower) it causes negative values (set to zero) of the column-length distribution functions
background causes underestimation of the Cauchy content of the Voigt function because the long tails are truncated prematurely It has to be men- tioned that Wilkens [112] proposed tilted small-an- gle boundaries to be the source of the hook effect Liu and Wang [113] defined a minimum particle size present in a specimen depending on the size of the hook effect Figure 6 shows that negative values of the column-length distribution functions (set to zero) do not affect the shape but shift the entire distribution toward larger L values
Note also that the surface-weighted column- length distribution function ps(L) will usually have a maximum at L = 0 but for the particular ratio of integral breadths determined by Eq (40) it can be zero The volume-weighted column-length distribu- tion function7v(L) will always have a maximum for LsO
If the column-length distribution functions are known it is possible to evaluate mean values of respective distributions
lt^kv =
00
J ^ _0
(L)dL
raquosv(L)dL (41)
Integrals of this type can be evaluated analytically [114]
OQ
J cexp( - to^ - a )dc = i^y^ ^ of
hd^^^^fe)]- (^2)
Surface-weighted domain size (D)s must be equal to the value obtained from Eq (37) The volume- weighted domain size follows
ltD)v = ^^erfc(A) = js (43)
Using Eqs (37) and (43) we can evaluate the ratio of domain sizes
i^ = 7r lt^gts
= 2vn-^exp(A2)erfc(^) (44)
Theoretically k can change from zero to infinity However the minimum value of k is determined by Eq (40)
1V2 ltk lt laquogt (45)
Hence the ratio of domain sizes can change in a limited range (see also Fig 7)
131laquo V2^ erfc (^ ) s ^ lt 2 (46)
10^ 10^ 10- 10deg 10 10^ 10-
Fig 7 The ratio of volume-weighted and surface-weighted domain sizes as a function of the characteristic ratio of Cauchy and Gauss integral breadths k
332
Volume 98 Number 3 May-June 1993
Journal of Research of the National Institute of Standards and Technology
It may be noted that most experiments give the ratio D)vD)s in this range (see for instance re- view by Klug and Alexander [24]) When k goes to infinity the size broadening is given only by the Cauchy component and (JD)V=2(D)S This is a case of pure Cauchy size broadening described by Haider and Wagner [62] and de Keijser Mittemei- jer and Rozendaal [107] It is possible to imagine a more complicated column-length distribution func- tion [27] than Eq (39) which would allow even larger differences between surface-weighted and volume-weighted domain sizes However we are not aware of any study reporting a difference larger than 100
43 Distortion Coefficient
In Sec 212 it was shown that the distortion co- efficient can be approximated by the exponential
Adeg(L) = exp(-ITTVLeL))) (47)
Comparing with Eq (36) we can write
Therefore mean-square strains (MSS) decrease linearly with averaging distance L This behavior is usually observed in the Warren-Averbach analysis Rothman and Cohen [115] showed that such be- havior would be expected of strains around disloca- tions Adler and Houska [116] Houska and Smith [117] and Rao and Houska [118] demonstrated for a number of materials that MSS can be repre- sented by a sum of two terms given by Cauchy and Gauss strain-broadened profiles
However for i3Dc=0 the MSS are independent ofL
(^2)12 ^ ^Dc(2g) cotg = ^ 2V2 V2TT
(49)
where the upper limit of strain e is defined as 7j4 (see Sec 212) This is a limiting case of pure- Gauss strain broadening described by de Keijser Mittemeijer and Rozendaal [107]
44 Discussion
To calculate domain sizes and strain it is neces- sary to define size and distortion integral-breadths angular order-dependence From Eq (43) It fol- lows that the domain size D )v is always indepen- dent of the order of reflection
)3sc = const JSSG = const
However from Eq (48) we find
^^ = const ^^ = const
(50)
(51)
An important consequence is that apparent strain TJ will be independent of angle of reflection only in the case of pure-Gauss strain broadening because 3DC and JSDG depend differently on the dif- fraction angle If we compare Eq (51) with the multiple-line Voigt-function analysis [26] given by Eqs (27) and (28) it is evident that they disagree Therefore recombination of constituent integral breadths 3DC and 3DO to Voigt strain-broadened in- tegral breadth Pdeg and the subsequent application of Eq (49) to calculate strain [26 119] will concur with the Fourier methods if strain broadening is entirely Gaussian and for the asymptotic value of MSS ((e^( 00))) However neither volume-weighted domain sizes D)y will agree although they are de- fined identically in both approaches because size- broadened and strain-broadened integral breadths are dependent variables
If at least two orders of reflection ( and +1) of the same plane (hkl) are available using Eqs (50) and (51) we can solve Eqs (33) and (34)
(52)
^^deg sl + l)-sil) ^^^^
^^=sHl + l)-sl) [fc( + l)-3c()3 (54)
^^=sl + l)-sl) [^(^ + ^)-^(0]- (55)
If we substitute these expressions into Eqs (35) and (36) we see that this approach leads exactly to the Warren-Averbach Eq (20) for two orders of reflections This is expected because the distortion coefficient is approximated with the exponential (47)] Delhez de Keijser and Mittemeijer [23] ar- gued that instead of Eq (20) the following rela- tion would be more accurate
A(L)=AXL) (1 -27r^(e^(L))LVd (56)
333
Volume 98 Number 3 May-June 1993
Journal of Research of the National Institute of Standards and Technology
These two approximations differ with fourth-order terms in the power-series expansion In terms of this approach Eq (48) has to be rewritten
2r ^^ l-exp(-2LI3DC-TTL^0DG) (57)
This means that even if the strain-broadened pro- file is given entirely by the Gauss function the MSS depend on distance L (see Fig 8) In this ap- proximation no simple relation for the distortion integral-breadths angular order-dependence exists For not so large L however Eq (51) holds and approximations from Eqs (20) and (56) do not dif- fer much (see Fig 8)
1500 Warren- Averbach approximation ^
Delhez de Kcijscr and ^^^ Minemeijer approximation ^y^
^ 1000 A
500
mdashI
1 1
Oc 300 600 IL k^) X 10^
90
o ^ 60 A
30
1
J Warren- Averbach approximation
Delhez de Keijser and Minemeijer approximation
0 0 150 300
1L (A-1 ) X 10^
Fig 8 Mean-square strains pound^(L)) for two approximations of the distortion coefficient (upper) Voigt strain broadening (lower) pure-Gauss strain broadening
Generally it was shown that in the size-broad- ened profile the Cauchy part must dominate No similar requirement for the strain-broadened pro- file exists However experience favors the assump- tion that it has to be more of Gauss-type The Warren-Averbach approach is exact if strain broad- ening is purely Gaussian so Eqs (20) and (48) are
better approximations as strain profile is closer to the Gauss function In any case both approaches given by Eqs (20) and (56) are good up to the third power in strain and the Warren-Averbach relation [Eq (20)] does not assume that MSS are independent of distance L [27] it also represents a harmonic approximation
If at least two orders of reflection from the same plane (hkl) are available we can use Eqs (52) (53) (54) and (55) to calculate size-related and strain-related integral breadths Subsequent appli- cation of Eqs (37) (43) and (48) gives directly domain sizes (D) and (D)v and mean-square strains (e^(L)) This approach is more straightfor- ward and much simpler than the original Warren- Averbach analysis Great care should be given to the possible systematic errors The easiest way to observe the hook effect is to plot column-length distribution functions as a function of averaging distance L If they show negative values for small L (see Fig 6) all derived parameters will be in error This is because (i) only the positive values of the column-length distribution functions are numeri- cally integrated or (ii) the intercept on the L-axis of the linear portion of the A^ vs L curve is taken (see Fig 4) always larger values of domain sizes will be obtained than by the application of Eqs (37) and (43) Therefore we conclude that the dis- crepancy between integral-breadth and Fourier methods is always present by the appearance of the hook effect in the A^ vs L curve An analogous discrepancy exists between integral-breadth and variance methods [119] In such cases correction methods for truncation can be applied [35 119 120] but the best procedure is to repeat the pat- tern fitting with the correct background
In the Fourier analysis it is usually observed that the mean-square strains diverge as the averaging distance L approaches zero This also follows from Eqs (48) and (57) However because the MSS de- pendence on distance L is not defined in Warren- Averbach analysis it was suggested [27 107 121] that local strain can be obtained by taking the sec- ond derivative of the distortion coefficient or by a Taylor-series expansion of local strain Therefore we obtain from Eq (36)
i^m-M^-^) (58)
It is evident that this relation is wrong It holds only for a special case of pure-Gauss strain-broad- ened profile when the MSS are equal for any L Otherwise if the Cauchy function contributes to
334
Volume 98 Number 3 May-June 1993
Journal of Research of the National Institute of Standards and Technology
strain broadening all derivatives of strain in L = 0 are infinite and local strain can not be defined If the main origin of strains is dislocations [115] strains are defined after some distance from the dislocation (cutoff radius) to be finite Averaging strains over a region smaller than the Burgers vector is probably not justified For instance Eq (48) gives even for a small averaging distance L = 1 A and considerable strain broadening (J3DG(20) = 3DC(20) = 1O) root-mean-square strain eL = 1A))^ laquo02 that is about the elastic limit
45 Random Errors of Derived Parameters
Errors in size and strain analysis of broadened peaks are relatively difficult to evaluate Following Langford [26] sources of the systematic errors in- clude choice of standard specimen background and type of analytical function used to describe the line profiles The first two errors should be mini- mized in the experimental procedure Errors caused by inadequate choice of specimen function would systematically affect all derived results but they can not be evaluated Random errors caused by counting statistics have been computed by Wilson [122 123 124] and applied to the Stokes deconvolution method by Delhez de Keijser and Mittemeijer [23] as well as by Langford [26] and de Keijser et al [76] using single-line Voigt-func- tion analysis Nevertheless the approximate error magnitude can be calculated from estimated stan- dard deviations (esd) of the parameters refined in the fitting procedure In the program SHADOW the weighted least-squares error is minimized
7wp mdash RES
Here
)=1
RES = 2 vfi [ (obs) - (cal)]
(59)
(60)
and weights are the reciprocal variances of the ob- servations
H = l(obs) (61)
Each line profile has four parameters varied inde- pendently position intensity and Cauchy and Gauss integral breadths of the Voigt profile In least-squares refinement esds are computed as
^^ bu RES (62) m mdashm
Here ba are diagonal elements of the inverse matrix of the equation coefficients m is the number of observations and m is the number of refined parameters The main source of errors is integral breadths Errors in peak position peak intensity and background are much smaller and can be ne- glected in this simple approach For two indepen- dent variables )3G and Pc covariance vanishes and from Eqs (37) and (38) for the two orders of re- flection and +1 it follows that
RD =
si+i)m)RHMi))+si)m+i)i^(3c(+D)
(63)
ReL)r) =
pHDRHPcG)) + m + miPcJl + D) 2[3c(+1) - i8c()3+TTL [m+1) - mw
-n-LmiDRHihd))+m+mWcH+i))i ^ 2[)3c(+1) - iSc()+TTLim+1) - mw
(65)
Here Rx) are relative standard deviations The error in D would be complicated to evaluate but because 131D)s^(Igt)vlt2(pound))s Eq (63) gives a good estimation for the error in (Z))v as well Alter- natively to see how errors depend on the Fourier coefficients errors can be estimated from the Warren-Averbach relationship [Eq (20)] (86) From Eq (32) it follows that
RA (L)) = ATr^Lpos)R^2d)) +
4Lph(s)RPci2e)) (66)
Errors in root-mean-square strains and domain sizes are
i^((e^(L ))bulllaquo) =
RHA(Ll))+RHA(Ll + l)) (67)
ALl + l)
335
Volume 98 Number 3 May-June 1993
Journal of Research of the National Institute of Standards and Technology
^^laquo^))=(T^)
s(l + 1)RHA (Ll)) +SV)RHA (Ll + D) lsl + l)-sl)f (68)
Here (D) is approximately defined with A^(L) = l-L(D)j Errors in Fourier coefficients increase with L while factors in Eqs (67) and (68) lower the errors for large L In general errors of domain sizes and strains are of the same order of magnitude as errors of integral breadths [86]
5 Application 51 Correction for Instrumental Broadening
Before specimen broadening is analyzed instru- mental broadening must be determined This is ac- complished by carefully measuring diffraction peaks of some well-annealed defect-free speci- men It is then assumed that its broadening may be attributed only to the instrument The usual proce- dure is to anneal the specimen However in some instances that is not possible because either the material undergoes an irreversible phase transition on annealing or the number of defects can not be successfully decreased by annealing Another pos- sibility is to measure the whole diffraction pattern of the material showing the minimal line broaden- ing and then to synthesize the instrumental profile at the needed diffraction angle This approach re- quires the modeling of the angle dependence of the instrumental (standard) parameters Cagliotti Pao- letti and Ricci [125] proposed the following func- tion to describe the variation of the full width at the half maximum of profile with the diffraction angle
F9miA^(2e) = Utan^9 + Vtand + W (69)
Although this function was derived for neutron dif- fraction it was confirmed to work well also in x-ray diffraction case [126 127] A more appropriate function for the x-ray angle-dispersive powder dif- fractometer based on theoretically predicted er- rors of some instrumental parameters [128] may be the following [129]
FWHNf (2 e) = W+Vsin^l 6 +
UtanH + UcotH (70)
This function may better model the increased axial divergency at low angles and correct for the speci- men transparency [129] However contrary to the requirement on the specimen function most im- portant for the instrumental function is to correctly describe the angular variation of parameters re- gardless of its theoretical foundation
When specimen broadening is modeled with a Voigt function the simplest way to correct for the instrumental broadening is by fitting the line pro- files with the Voigt function too Cauchy and Gauss integral breadths of the specimen-broad- ened profile are then easily computable by Eqs (7) and (8) However because the instrumental broad- ening is asymmetric [24] modeling with the sym- metric Voigt function can cause a fictitious error distribution resulting in errors of strain up to 35 [76] Another approach is to model the instrumen- tal-broadening angle dependence by fitting the profile shapes of a standard specimen with some asymmetrical function split-Pearson-VII [95] or pseudo-Voigt convoluted with the exponential function [105] The instrumental function can then be synthesized at any desired angle of diffraction and convoluted with the assumed specimen func- tion to match the observed profile by means of Eq (2)
In the program SHADOW instrumental para- meters are determined by fitting the split-Pearson VII function (see Fig 9) to line profiles of a standard specimen
iix)=m- 2 m
with
c =-
mc^f
mm) mv-rim-12)
(71)
(72)
Here m = 1 or m = ltraquo yields a Cauchy or Gauss function respectively Refined full widths at half maximum (FWHM) and shape factors m for both low-angle and high-angle sides of the profiles are fitted with second-order polynomials To fit the FWHM we used Eq (69) and for the shape fac- tors
m(2e) = U(20f + V(2e) + W (73)
The resulting coefficients U V W U V and W permit synthesis of the asymmetrical instrumental line profile at any desired angle
336
Volume 98 Number 3 May-June 1993
Journal of Research of the National Institute of Standards and Technology
2 0(deg)
le
Fig 9 A split-Pearson VII profile The two half profiles have same peak position and intensity Adapted from Howard and Preston [4]
The basic requirement on the standard specimen is however to show as small a line broadening as possible To minimize physical contributions to the Une broadening of the standard specimen a few moments were emphasized as follows Because dif- fraction-line width depends strongly on degree of annealing it is preferable to use some reference powder-diffraction standard Furthermore asym- metry in the peak profiles is introduced by axial divergence of the beam flat specimen surface and specimen transparency [24] Choosing a standard specimen with low absorption coefficient would cause transparency effects to dominate If the stud- ied specimen has a large absorption coefficient (compared to the standard) this might produce a fictitious size contribution and errors in micro- strains All of the specimens studied have absorp- tion coefficients exceeding 1000 cm^ so a NIST standard reference material 660 LaBe was chosen to model the instrumental broadening (p = 1098 cm) According to Fawcett et al [130] LaBe showed the narrowest lines of all studied com- pounds Furthermore LaB6_has a primitive cubic structure (space group Pm3m) resulting in rela- tively large number of peaks equally distributed over 26 This allows for better characterization and lower errors of FWHMs and shape factors of split- Pearson VII functions (Fig 10)
52 Applicability of the Method
To study the applicability of method described in Sec 4 we first studied simple cubic-structure mate- rials such as silver and tungsten Tungsten has very narrow line profiles allowing us to obtain the up- per limit of domain sizes that can be studied Silver is easily deformed which provides a possibility to apply the method to broad line profiles To test the
009
-a
OH
006
003
1 1 m low-angle side n m high-angle side
bullz w 2 o OH
X
tancopy
Fig 10 Refined FWHMs and shape factors (exponents) m for low-angle and high-angle sides of LaBe line profiles Second- order polynomials were fitted through points
case of relatively complicated patterns and weak line broadening the method was also applied to Lai85Sroi5Cu04 and La2Cu04 powders In this sec- tion only the mechanical aspects of the line broad- ening are discussed Discussion about the origins of broadening of superconductors can be found in Sec 6
521 Silver and Tungsten Powders Figure 11 shows observed and refined peaks of tungsten un- treated and silver ground powders In Table 2 are listed results of fitted pure-specimen Voigt profiles for silver and tungsten specimens Table 3 and Fig 12 give results of the line-broadening analysis Untreated tungsten powder shows relatively weak broadening Instrumental profile FWHMs at angle positions of (110) and (220) tungsten lines are 0059deg and 0081deg respectively close to values mea- sured for tungsten 0065deg and 0100deg Results in Table 3 reveal that small broadening is likely caused by domain sizes because microstrains have negligible value This pushes the limit for measur- able domain sizes probably up to 4500-5000 A However one must be aware that weak specimen broadening implies higher uncertainty of all derived parameters Moreover the choice of the instrumental standard becomes more crucial
Both silver and tungsten line profiles become more Cauchy-like after grinding which probably increases dislocation density in the crystallites This is consistent with the presumption that small crystallites and incoherently diffracting domains separated by dislocations within grains affect the tails of the diffraction-line profiles [60115] Figure 13 illustrates the dependence of MSS on the recip- rocal of the averaging distance L
337
Volume 98 Number 3 May-June 1993
Journal of Research of the National Institute of Standards and Technology
C8
z
7- ^95
29 (deg) 405
bullJf^r-
z S 08
Ez U o u OS
a
04 bull
o Es
4P
2000 z^fA
4000
B
z u f- z
425 435 445 29 (deg)
455
yr 600 SOO
L(A)
Fig 11 Observed points (pluses) refined pattern (full line) and difference pattern (below) (110) W untreated (upper) (200) Ag ground (lower)
Fig 12 Fourier coefficients for the first- (pluses) and second- order (crosses) reflection and size coefficients (circles) [111] Ag untreated (upper) [100] Ag ground (lower)
Table 2 Parameters of the pure-specimen Voigt function as obtained from profile-fitting procedure for tungsten and silver powders
Specimen hkl 2ft(deg) 3c(deg) 3G(deg) FWHM(deg) Rwp()
W untreated 110 220
4028 8705
00065(7) 00301(6)
0020(2) ltio-
0021 0019
90 44
W ground 110 220
4029 8705
0100(2) 0222(3)
0038(4) 0069(6)
0080 0166
90 42
Ag untreated 111 222 200 400
3806 8151 4425 9786
0056(1) 0105(4) 0118(2) 0274(21)
ltio- 00008(21)
ltio-^ ltio-5
0036 0067 0075 0175
105 97
105 122
Ag ground 111 222 200 400
3807 8151 4424 9783
0175(3) 0410(26) 0365(10) 1079(82)
0038(12) ltio-
0076(29) ltio-
0121 0261 0250 0687
99 145 99
145
338
Volume 98 Number 3 May-June 1993
Journal of Research of the National Institute of Standards and Technology
Table 3 Microstructural parameters for tungsten and silver powders
Specimen Direction (poundgt)raquo( A) (2))v(A) ltpound^(fl3))laquo (^laquoD)v2)gtw
W untreated [110] 3200(200) 3500(200) 000038 000008(2)
W ground [110] 620(20) 1030(30) 00023 000054(2)
Ag untreated [111] [100]
1000(20) 510(20)
2000(20) 1030(20)
00010 00022
000024(1) 000047(5)
Ag ground [111] [100]
380(20) 210(10)
650(20) 350(20)
00047 00100
000095(7) 000180(14)
100 -_ - [100) Ag ground ^ ^~ mdash C1111 Ag ground ^bull
y y
o y ^ 50 A y
y y
y
0
y - y ^--
c ) 50 100 150
lLfAjxlO^
Fig 13 Mean-square strains (E^) as a function of VL
Errors in integral breadths allow estimation of errors in strain and size parameters (Sec 45) but in some cases the refinement algorithm gives unre- liable errors of integral breadths When a particu- lar parameter is close to the limiting value (for instance 10^ degrees has been put as the mini- mum value for integral breadths) errors become large However in Eqs (63) (65) (66) (67) and (68) only the product of integral breadth and ac- companying error is significant which is roughly equal for Cauchy and Gauss parts Errors of do- main sizes and strains are of the same order of magnitude as errors of integral breadths
The possible source of systematic error is poten- tial inadequacy of Voigt function to accurately de- scribe specimen broadening This effect can not be evaluated analytically but it would affect all derived parameters especially the column-length distribution functions The logical relationship be- tween values of domain sizes (see Table 3) for dif- ferent degrees of broadening indicates that possible systematic errors can not be large
Equation (41) allows computation of volume- weighted and surface-weighted average domain sizes if respective column-length distribution func- tions can be obtained Figure 14 gives surface- weighted and volume-weighted average column- length distribution functions following Eqs (39) and (38) Width of the distribution function deter- mines the relative difference between (D) and (pound))v The broader the distribution the larger the differences because small crystallites contribute more to the surface-weighted average That is much more evident comparing the surface- weighted column-length distribution with the vol- ume-weighted If they have similar shape and maximum position as in Fig 15 differences are small Conversely if the surface-weighted distribu- tion function has a sharp maximum toward smaller sizes differences are larger (see Fig 14) The dif- ference between (poundgt)s and (D)v and the actual mean dimension of the crystallites in a particular direction also depends strongly on the average shape of the crystallites [52 131 132]
If experimental profiles are deconvoluted by the Stokes method even for considerable specimen broadening size coefficients A ^ usually oscillate at larger L values [59 106] preventing computation of the column-length distribution function Few techniques were used to deal with this problem successive convolution unfolding method [32 133] smoothing and iterative methods [134 135 136 137] Figures 14 and 15 show very smooth column- length distribution functions However they follow from size coefficients ^4^ that depend on the accu- racy of the approximation for the distortion coeffi- cient given by Eq (47) Equation (47) is exact if the strain distribution is Gaussian but in general holds only for small harmonic numbers n if strain broadening is not negligible
339
Volume 98 Number 3 May-June 1993
Journal of Research of the National Institute of Standards and Technology
500 1000 L(A)
Fig 14 Surface-weighted and volume-weighted column-length distribution functions normalized on unit area [111] Ag un- treated (upper) [100] Ag ground (lower)
Fig 15 Surface-weighted and volume-weighted column-length distribution functions for [010] La2Cu04 normalized on unit area
522 La2-xSrtCu04 Powders To test the applicability of the discussed method to more com- plicated patterns two compounds with lower crystallographic symmetry were studied Lai85Sroi5Cii04 has a tetragonal K2NiF4-type struc- ture space group lAlmmm La2Cu04 is orthorhom-
bic at room temperature Both compounds show slight line broadening and relatively highly overlap- ping peaks (see Fig 16) which makes it very diffi- cult if not impossible to perform a Stokes analysis
25
-25
26 (deg)
yNraquo-
Fig 16 Observed points (pluses) refined pattern (full line) convoluted profiles (dashed line) and difference plot (below) for part of La2Cu04 pattern
Tables 4 and 5 list results from the fitting proce- dure and the analysis of specimen-broadened inte- gral breadths There are no qualitative differences in results for tungsten and silver powders How- ever average errors are higher as expected be- cause of overlapping peaks while weighted errors wp are surprisingly smaller This fact illustrates the unreliability of iwp when only a segment of the pat- tern is being refined because it depends on the number of counts accumulated in points as well as on the 28 range of the refinement
Figures 17 and 18 represent Fourier coefficients of Lai85Sroi5Cu04 [110] and La2Cu04 [010] direc- tions In the second plot the A (L )-versus-L plot shows a concave-downward part near L =0 the so- called hook effect It was shown in Sec 42 that the hook effect originates because of underesti- mation of background connected with the trunca- tion of profiles In the profile refinement all peaks separated less than 4deg 20 have been included in the refinement region to avoid possible overlapping of peak tails and specimen profiles have been trun- cated below 01 of the maximum intensity How- ever because the polynomial background was determined prior to profile refinement it may be overestimated for complicated patterns containing many overlapping peaks If background is refined with other profile parameters undesirable correla- tion with integral breadths occurs
340
Volume 98 Number 3 May-June 1993
Journal of Research of the National Institute of Standards and Technology
Table 4 Parameters of the pure-specimen Voigt function as obtained from profile-fitting procedure for La2-^SrCu04 powders
Specimen hid 2Hdeg) Pen PcO FWHM(deg) Rp()
Lai85Sroi5Cu04 004 2695 0046(4) 0024(8) 0042 34 006 4092 0083(5) ltio-= 0053 62 110 3352 0110(5) ltio- 0070 125 220 7046 0171(9) ltio- 0109 43
La2Cu04 004 2713 0061(8) 0045(9) 0067 39 006 4119 0124(7) ltio-^ 0079 77 020 3316 0074(10) 0078(10) 0102 29 040 6957 0210(30) 0026(81) 0135 29 200 3345 0074(8) 0061(10) 0087 69 400 7028 0130(10) 0023(95) 0089 29
Table 5 Microstructural parameters for Laij(5Srai3Cu04 and La2Cu04 powders
Specimen Direction (DUA) Pgt(A) lte^(fl3))laquo lte2((Z)gt2))laquo
Lai83Sro5Cu04
La2Cu04
[001] [110]
[001] [010] [100]
1700(300) 470(20)
1100(100) 680(50) 680(50)
2000(200) 940(20)
1200(100) 760(50) 810(50)
00024 00017
00038 00033 00016
000049(9) 000044(6)
00008(1) 00007(2) 00003(3)
c i ^- raquo sect 08 bulli - U
^0
ti- bull ll bull bullbullo
ffl M P bull- u ^ Di 04 Si - M bulldiamsbullbull a bull-v 3 o ^^=s^
u ^N^Sraquoraquo^
0 ^^^aaaa 1000
L(A) 2000
OQ bullbulldego UM o z a 08
o o bull bull bull
- u u bull raquo UU bull
a diams o bull o u ft 04 bull deg raquo deg - U bull bull deg Oi bullbullgt =3 bull- l o k u
0 bullbullbullraquo aaaMMi
500 1000
L(A)
Fig 17 Fourier coefficients for the first- (pluses) and second- order (crosses) reflection and size coefficients (circles) for [110] Lai^Sroi5Cu04
Fig 18 Fourier coefficients for first- (pluses) and second- order (crosses) reflection and size coefficients (circles) for [010] La2Cu04
341
Volume 98 Number 3 May-June 1993
Journal of Research of the National Institute of Standards and Technology
S3 Comparison with the Integral-Breadth Methods
Knowing the specimen integral breadths simpli- fied methods can be applied In Sec 212 we re- viewed multiple-line and single-line integral- breadth methods We shall compare the simplified multiple-line methods [Eqs (23) (24) and (30)] and the single-line method [76] [Eqs (29) and (30)] with results obtained for silver tungsten and La2-xSrxCu04 powders (Tables 3 and 5) We did not compare with the multiple-line Voigt-function method [26] because it was shown in Sec 44 that it is incompatible with the Warren-Averbach analy- sis In Table 6 integral breadth Pi was computed according to Eq (11) This value was compared with )8A integral breadth computed from Fourier coefficients [58]
i8A=- laquo3 2^(L)
(74)
Results obtained by the Warren-Averbach analysis are significantly smaller for both size and strain Integral-breadth methods give the upper limit for strain so comparison is limited Considering the approximation e = 125e^(L))^ [138] with L=(D)v2 or L=(D)s2 strains resemble more closely than crystallite sizes It must be noted how- ever that this approximation makes sense only in the case of pure-Gauss strain broadening Benedetti et al [106] reported excellent agreement for both size and strain using Warren-Averbach and Cauchy-Gauss [Eq (24)] methods Results from Table 6 on the contrary indicate that the Gauss-Gauss approximation gives values closest to the Warren-Averbach method for crystallite sizes whereas the Cauchy-Gauss and especially the Cauchy-Cauchy approximation tend to give too large values For strain the trend is opposite The Cauchy-Cauchy approximation resembles most
Table 6 Comparison of results obtained with the integral-breadth methods Cauchy-Cauchy (C-C) Cauchy-Gauss (C-G) Gauss- Gauss (G-G) and single-line (S-L) analysis
Specimen hkl PiXKP PAXKP ltigt)v (Z)gt(A) (e^((DV2)gt2 eXlO^ (A-) (A-0 (A) C-C C-G G-G S-L xlO^ C-C C-G G-G S-L
W untreated 110 220
0259 0247
0259 0247
3500 3700 3810 3810 14500 4040
008 -001 -003 -005 024 0
W ground 110 220
125 204
125 205
1030 2240 1450 1220 940 550
054 090 093 105 045 032
Ag untreated 111 2
0600 0901
0600 0900
2000 3340 2390 2190 1670 1110
024 035 039 095 0 0
200 124 124 1030 2270 1470 1230 810 047 082 085 095 0 400 204 204 490 0
Ag ground 111 222
198 352
200 352
650 2080 1240 910 530 280
095 179 182 197 048 0
200 403 406 350 9380 4780 1320 260 180 405 405 408 082 400 803 803 120 0
Lai85Sroi3Cu04 004 006
0657 0881
0650 0880
2000 5230 3290 2660 1970 1140
049 076 078 088 044 0
110 119 119 940 1240 1000 970 840 044 052 064 080 0 220 158 158 630 0
La2Cu4 004 006
0988 132
0998 131
1200 2980 1940 1630 1490 760
08 107 112 127 081 0-
020 143 142 760 1200 910 860 1240 07 079 090 110 114 040 198 200 510 016 200 126 124 810 810 810 810 1250 03 002 011 015 089 400 1S 126 830 014
Not possible to evaluate because of too small Gauss integral breadth
342
Volume 98 Number 3 May-June 1993
Journal of Research of the National Institute of Standards and Technology
closely a Warren-Averbach method These results concur with the Klug and Alexander [24] compari- son of the published size and strain values obtained by Warren-Averbach (Stokes) and integral-breadth methods However for x-ray diffraction the Cauchy-Gauss assumption for the size-strain broadening is theoretically and experimentally more favored thpoundm the other two models The fact that the Gauss-Gauss method for crystallite size and the Cauchy-Cauchy method for strain give more realistic results may mean that the presump- tion that size and strain broadening are exclusively of one type is an oversimplification
The single-line method seems much less reliable If Gaussian breadth is very small no information about strain is obtained Moreover second-order reflections give much lower values of both size and strain than do basic reflections However if multi- ple reflections are not available the single-line method can give satisfactory estimations
54 Reliability of Profile Fitting
The profile fitting of a cluster of even severely overlapping peaks can be accomplished with a low error and excellent fit of total intensity But how reliable is information obtained about separate peaks in the cluster In the fitting procedure it is possible to put constraints on the particular profile parameter to limit intensity position and width of the peak If anisotropic broadening or different phases are present constraints may not be realistic Morever acceptable results can be obtained even using a different number of profiles in refinement [4] Hence the first condition for the successful ap- plication of this method is knowledge of actual phases present in the sample and their crystalline structures
In this regard two powders were measured or- thorhombic Lai94Sroo6Cu04 has a slightly distorted K2NiF4-type structure (space group Bmab a =53510(2) A b =53692 A(2) c = 131931(7) A) and tetragonal Lai76Sro24Cu04 (space group I4mmm a =37711(3) A c = 132580(8) A) Data were collected for each specimen separately and for a specimen obtained by mixing the same pow- ders Because diffracted intensity of each phase was lower for the mixture counting time was pro- portionally increased to obtain roughly the same counting statistics Figure 19 shows two partially separated orthorhombic (020) (200) and (040) (400) peaks overlapped with tetragonal (110) and (220) reflections During the profile fitting of the mixed powders (200) orthorhombic peak tended to disappear on account of neighboring (020) and
(110) reflections Its intensity was constrained to vary in range plusmn 30 of (020) peak intensity which can be justified if the crystallographic structure is known
60
-60
345
345
335 29 (deg)
345
Fig 19 (upper) Lai76Sro24Cu04 (110) peak (middle) Lai94Sroo6Cu04 (020) and (200) peaks (lower) (110) (020) and (200) peaks
Table 7 contains results of fitted specimen-Voigt functions as well as size and strain values obtained by the analysis of broadening Comparing integral breadths of the starting and mixed powders some profiles change from more Cauchy-like to Gauss- like and vice versa This is especially evident for the (400) reflection meaning that accurate deter- mination of the profile tails is indeed affected in the cluster of overlapping peaks However integral breadth does not change significantly so results of
343
Volume 98 Number 3 May-June 1993
Journal of Research of the National Institute of Standards and Technology
Table 7 Comparison between two specimens run separately and mixed togetlier
Specimen hkl 2Hdeg) )3cO PoO DUA) (D)v(A) (e2laquoD)v2))laquoxlO
Lai76Sroj4CuOr 110 3369 0058(6) 0094(7) 780(60) 850(60) 10(1) 220 7073 022(2) 013(2)
LaiMSro(KiCu04 020 3342 0084(9) 055(14) 500(90) 1000(200) 07(1) 040 7012 010(2) 014(1) 200 3353 00216(85) 0061(8) 1100(100) 1200(100) 03(1) 400 7040 0026(11) 0088(8)
Mix 110 3367 0083(21) 0064(14) 800(300) 1200(300) 08(3) Lai76Sro24Cu04 220 7072 019(7) 013(4)
+ 020 3343 0066(35) 0070(23) 800(300) 1000(300) 07(4) Lai94Sroo6Cu04 040 7012 0116(93) 013(5)
200 3354 0024(156) 0071(61) 900(700) 1000(600) 04(12) 400 7041 011(2) 0003(320)
the multiple-line methods are not much influenced On the contrary the single-line method gives quite different results This may support the conclusion of Suortti Ahtee and Unonius [43] that the Voigt function fails to account properly for size and strain broadening simultaneously if only Cauchy integral breadth determines crystallite size
Table 7 shows that the results of Warren- Averbach analysis of starting and mixed powders agree in the range of standard deviations How- ever errors are much larger especially for the hid- den (200)-(400) reflections From Eq (62) it follows that more counts (longer counting times) and more observables (smaller step-size) would lower standard deviations Therefore in the case of highly overlapping patterns to obtain desirable ac- curacy much longer measurements are needed al- though that will not change the fact that higher overlapping implies intrinsically higher errors of all refinable parameters To further minimize possible artifacts of the fitting procedure it is desirable to include in the analysis as many reflections in the same ciystallographic direction as possible
55 Remarks
By modeling the specimen size and strain broad- ening with the simple Voigt function it is possible to obtain domain sizes and strains that agree with experiment and show a logical interrelationship Furthermore the Voigt function shows the correct 1A(26y asymptotic behavior of peak tails as ex- pected from kinematical theory [139] However if the specimen profile is significantly asymmetric (because of twins and extrinsic stacking faults [140 59]) or the ratio FWHM^ is not intermediate to the Cauchy (2Tr) and Gauss (2(ln27r)^) functions then the Voigt function can not be applied [25]
Suortti Ahtee and Unonius [43] found good over- all agreement by fitting the Voigt function to the pure-specimen profiles of a Ni powder deconvo- luted by the instrumental function However more accurate comparison is limited because of unavoid- able deconvolution ripples of specimen profiles Furthermore the Voigt function might not be flex- ible enough to model a wide range of specimen broadening as well as the different causes of broadening Therefore the question whether the Voigt function can satisfactorily describe complex specimen broadening over the whole 20 range in a general case needs further evaluation
This method of Fourier analysis with the as- sumed profile-shape function is most useful in cases when the classical Stokes analysis fails there- fore when peak overlapping occurs and specimen broadening is comparable to instrumental broaden- ing It was shown that for a high degree of peak overlapping the fitting procedure can give unreli- able results of Gauss and Cauchy integral breadths that is the peak can change easily from predomi- nantly Cauchy-like to Gauss-like and contrary This can lead to illogical values of size-integral and strain-integral breadths according to Eqs (52) (53) (54) and (55) and to irregularities in the be- havior of Fourier coefficients for large L Simulta- neously if the size-broadened profile has a large Gauss-function contribution the hook effect will occur However volume-weighted domain sizes D)y and MSS eL)) for small L are much less affected because they rely on both Cauchy and Gauss parts of the broadened profile Any integral- breadth method that attempts to describe the size and strain broadening exclusively by a Cauchy or Gauss function in this case fails completely For specimens with lower crystallographic symmetry
344
Volume 98 Number 3 May-June 1993
Journal of Research of the National Institute of Standards and Technology
when many multiple-order reflections are avail- able but the peaks are overlapped it is therefore desirable to include in the analysis as many reflec- tions as possible to minimize the potential artifacts of the fltting process
6 Analysis of Superconductors 61 (La-M)2Cu04 Superconductors
Bednorz and Miiller [16] found the first high- temperature oxide superconductor in the La-Ba- Cu-O system Soon after substituting Ba with Sr and Ca Kishio et al [17] found superconductivity in two similar compounds Later many compounds with much higher transition temperatures (Tc) were found The (La-M)2Cu04 system remains favorable for study because the cation content responsible for the superconductivity is easier to control and measure than the oxygen stoichiometry Also this system provides a wide range of substitutional cation solubility in which the tetragonal K2NiF4- type structure is maintained Compared with much- studied Y-Ba-Cu-O this structure is simpler because it contains only one copper-ion site and two oxygen-ion sites
The undoped compound La2Cu04 is orthorhom- bic at room temperature It becomes superconduct- ing either with cation substitution on La sites or increased oxygen content to more than four atoms per formula unit Doping with divalent cations in- creases the itinerant hole carriers in the oxygen- derived electron band [141] which probably causes the superconductivity However different dopants influence the transition temperature Tc Although the unit-cell c-parameter simply reflects ionic dopant size [142] the in-plane unit-cell parameter (and accordingly the Cu-0 bond length) correlates with Tc for different dopants and for different dop- ing amounts [142 143]
LaiB5MouCu04 (M = Ba Ca Sr) have a tetrago- nal K2NiF4-type structure space group lAlmmm with four atoms in the asymmetric unit [117] One site is occupied with La partially substituted with dopant ions (Fig 20) La2Cu04 is orthorhombic at room temperature The best way to correlate these two structures is to describe La2Cu04 in space group Bmab the c axis remains the same tetrago- nal [110] and [110] directions become [010] and [100] orthorhombic axes and size of the unit cell is doubled [144]
Figure 21 shows parts of the x-ray diffraction patterns observed and refined of Lai85Moi5Cu04 (M = Sr Ba Ca) and La2Cu04 Refined lattice
parameters are given in Table 8 Table 9 shows resuhs of the line-broadening analysis Relatively
La(BaCaSr)
0(2)
0(1)
Fig 20 Ciystal structure of (La-M)2Cu04 showing one unit cell
300 JUU
(b)
200
100
U 0 M J Js-r-^
30
-30
300
40 41 42 43 44 45 40 41 42 43 44 45 29 (deg) 29 (deg)
mdashA-
gt t 200
Z
F-
- 100
(c)
f V kgt ii I 40 41 42 43 44 45 40 41 42 43 44 45
e (deg) ^^ 26 (deg)
-30 wwX mdash Wlaquo-
Fig 21 Diffraction patterns of LaiH5Moi5Cu04 specimens (a) M=Sr (b) M = Ba (c)M = Ca (d) M = U
345
Volume 98 Number 3 May-June 1993
Journal of Research of the National Institute of Standards and Technology
Table 8 Lattice parameters and T^ at zero resistivity (Ac method at 10 Ma current)
Specimen a (A) bk) c(A) rc(K)
Lairaquo5Sroi5Cu04 377814(7)
Lairaquo3Baoi3Cu04 37846(2)
LaiiijCaoi5Cu04 37863(7)
La2Cu04 53558(2) 54053(2)
231(2) 36
288(4) 28
17(2) 19
1451(8)
Table 9 Results of line-broadening analysis for (La-M)2Cu4 specimens
Specimen hkl PcO PoO (DUk) (Iraquo)(A) lte^((D)2))
Lai(laquoSroj5Cu04 004 006
0046(4) 0083(5)
0024(8) ltio-
1700(300) 2000(200) 000049(9)
110 0110(5) ltio- 470(20) 940(20) 000044(6) 220 0171(9) ltio-
Lai85Baoi3Cu04 004 006
0049(6) 0110(7)
0076(6) 0089(9)
1100(200) 1100(100) 00011(2)
110 0087(4) 000042(6) 560(20) 1110(20) 000024(5) 220 0116(3) ltio-5
Laiji5Caoi5Cu04 004 006
0120(13) 0146(12)
0032(22) 0033(27)
440(70) 780(90) 00007(4)
110 0045(25) 0200(19) 340(30) 360(20) 00013(2) 220 0343(22) ltio-
La2Cu04 004 006
0061(8) 0124(7)
0045(9) ltio-
1100(100) 1200(100) 00008(1)
020 0074(10) 0078(10) 680(50) 760(50) 00007(2) 040 0210(30) 0026(81) 200 0074(8) 0061(10) 680(50) 810(50) 00003(3) 400 0130(10) 0023(95)
weak peak broadening was observed which can not be attributed to the proximity of the phase trans- formation Lai85SroisCu04 is tetragonal down to = 170 K [145] Lai85Baoi5Cu04 to 140 K [146147] and Lai85Caoi5Cu04 to 130 K [148] Another possi- ble reason for peak broadening might be continu- ous compositional variations in dopant content The scanning Auger microprobe analysis of La2-SrtCu04 compounds [149] showed that grain- boundary segregation of Sr is weak and limited to a narrow region near the grain surface In the case of the separation of two phases with different Sr con- tent and similar lattice parameters asymmetry of some reflections would be observed [150] More- over in the case of compositional inhomogeneity microstrains eL)) would be roughly independent of the averaging distance L in the grains [151] therefore distribution of strains would be Gaus- sian For all specimens microstrain behavior is identical it decreases linearly with distance L
Rothman and Cohen [115] showed that such be- havior of microstrains is caused by dislocations that might arise during grinding Assuming the same applied stress microstrain would be approximately inversely proportional to the elastic moduli of these materials If mean microstrain is defined as the arithmetic average of strains for the [001] and [110] directions results agree with values of the Youngs moduli for polycrystalline La2Cu04 Lai85Moi5Cu04 (M = Sr Ba Ca) [152] However other factors may contribute to the microstrain Coordination-6 ionic radii of La^+ Sr Ba^+ Ca^+ are 106 116 136 100 A respectively [153] Substitution of La with ions of different sizes affects the lattice parameter [142] and may cause much larger strains in the [001] direction when some of the ions are replaced with Ba^ than with Sr^ in accord with results in Table 9 Substitution of Ca^^ ions produces an entirely different effect microstrains in the [110] direction are larger This may be explained by
346
Volume 98 Number 3 May-June 1993
Journal of Research of the National Institute of Standards and Technology
comparing effects of substitutional ions on the unit-cell a -parameter The Ba-doped specimen has a larger a-parameter than the Sr-doped but the Ca-doped a-parameter is largest although Ca^^ has the smallest ionic size This should increase the cell distortion in the a-b plane
Table 9 reveals high anisotropy in these materi- als consistent with other physical properties such as thermal expansion [154] and upper critical mag- netic field [155] Differences of domain sizes might arise from a layered structure in the [001] direction and consequently easy incorporation of stacking faults between regularly stacked layers The stack- ing-fault and twin-fault probabilities can be esti- mated from the average surface-weighted domain sizes [59]
^ = TAN + cf1fun(aa) (75) m im - (D)
Here c is a constant for the particular [hkl] direction and fun(a a) a linear combination of stacking-fault probability and twin-fault probability a The exact form of Eq (75) was derived only for the cubic and hexagonal crystal structures On con- dition that the true domain dimension D is isotropic or so large that the second term of Eq (75) dominates a linear function of stacking-fault and twin-fault probability is
fun(aa) = c( 1
) (76) Zgt)J (Dgttrade
Here c denotes a constant that depends only on geometrical factors and is the same for all three doped compounds
Figure 22 shows a possible correlation between Tc and fault-defect probabilities computed from TEM observations of La2-jcSrCu04 revealed that stacking-fault density increased with Sr content up to jc = 015 [156] That study suggests that a shear mechanism forming the fault-boundary dislocations implies oxygen vacancies andor cation deficiency We did not measure oxygen content but neutron- diffraction studies showed that oxygen deficiency starts to appear at much higher Sr content [157] However the increase of fault probability with the simultaneous decrease of microstrain in Fig 22 supports the assumption that defects are intro- duced to accommodate lattice strains [156] A simi- lar increase in Te was found in Y2Ba4Cu802o-laquo thin films [158] Compounds with asymmetric broad- ened and shifted peaks showed higher Tc which
was attributed to stacking faults Although extrinsic stacking faults may cause asymmetric peak broad- ening [140] it is probably caused by twinning Twinning in La-M-Cu-0 materials is less abundant than in Y-Ba-Cu-O compounds but it was ob- served in (La-Sr)2Cu04 monocrystals on (110) planes [159] In the profile-fitting procedure peak asymmetry is incorporated only in the instrumental function therefore we could not model asymmetric peak broadening However any significant asym- metry of the specimen profile would cause an un- even fit of low-angle and high-angle sides of peaks which was not observed This gives much more im- portance to stacking faults in Eq (76)
Fig 22 Arithmetic average of [110] and [001] root-mean- square strains and linear function of stacking-fault and twin- fault probabilities as a function of Tc
In Fig 22 average microstrains defined as the arithmetic average of [001] and [110] directions correlate inversely with Tc However we did not find a correlation of Tc and microstrains in a partic- ular direction [001] microstrains simply reflect dif- ference in size of dopant and host La^ ions (see Table 9)
In La2Cu04 (OkO) reflections are significantly broader than (hOO) This has also been observed in low-temperature orthorhombic Lai85Sroi5Cu04 and Lai85Baoi5Cu04 [160] and explained by either stacking faults or possible lower symmetry Our results reveal that domain sizes (D) have identical values for [010] and [100] directions (Table 9) From Eq (76) it follows that stacking-fault proba- bilities in these directions have the same values However microstrains in the [010] direction are roughly twice as large as in the [100] direction which is responsible for the different broadening In the case of doped La2Cu04 compounds different microstrains might be caused by oxygen
347
Volume 98 Number 3 May-June 1993
Journal of Research of the National Institute of Standards and Technology
vacancies ordered along one direction in the a-b plane similar to effects found in YBa2Cu307-laquo However undoped La2Cu04 is not expected to have significant o^Qgen deficiency Other possibili- ties are lower ciystallographic symmetry andor La vacancies although they were not reported for this system but La deficiency was found in an La2Co04 compound [161]
We can conclude that lattice strains and incoher- ently diffracting domain sizes confirm high an- isotropy in these materials This simple approach however does not allow unambiguous identifica- tion of the strains origin Probably the strains originate from dislocations and from different sizes of host and dopant ions Domain sizes of all com- pounds are larger in the c-direction than in the a-6 plane This indicates existence of stacking faults and twins However because estimated errors are relatively large and only three materials were stud- ied the possible connection between stacking faults and 7c needs further study
62 Bi-Cu-O Superconductors
Among the high-Tc superconductors the Bi- Cu-O compounds appear intriguing especially because their incommensurate structure modula- tion remains incompletely understood [162 163] The crystal structure consists of perovskite-like SrO-(Cu02Ca)mi-Cu02-SrO layers separated by NaCl-like BiO double layers (see Fig 23 [164]) The number m of Cu02 layers alters the supercon- ducting transition temperature Tc (for m = 12 and 3 rclaquo10 90 and 110 K respectively) This two- dimensional layered structure makes these materi- als highly anisotropic and favours the creation of defects
Bulk sintered specimens showed relatively weak peak broadening Moreover the diffraction pat- terns contained many overlapping peaks because the compound crystallizes in an orthorhombic low- symmetry space group A2aa [165] and incommen- surate modulation gives superlattice reflections All patterns revealed a strong [001] texture (Fig 24) making reflections other than (001) difficult to ana- lyze The lattice parameters vary depending on the exact compound stoichiometry and processing his- tory but characteristically they have almost identi- cal a and b parameters and large c parameter fl =54095 A 6=54202 A c =309297 A for Bi2Sr2CaCu208 (Bi-2212 [166] and A =5392 A b =5395 A c =36985 A for (BiPb)2Sr2Ca2Cu30io (BiPb-2223) [165] Thus we treated (hOO) and (0^0) reflections as single peaks Table 10 gives the
results for three specimens Bi-2212 (BiPb)2 (SrMg)2(BaCa)2Cu30io (BiPbMgBa-2223) which were one-phase specimens and BiPb-2223 con- taining approximately equal amounts of 2212 and 2223 phases The in-plane lattice parameters of 2212 and 2223 phases differ little hence only the [00] directions of the mixed-phase specimen were evaluated
b^ (c)
Fig 23 Average crystal structure of Bi2Sr2Cam-iCum04+2m for (a) m = 1 (b) w =2 (c) m =3 [164]
35
-35
42 44 46 48 50 52 54 56 58 60 62 26 (deg)
^ ^^^MK^Aa^Ndllaquop
Fig 24 Part of BiPbMgBa-2223 refined pattern There are 48 fundamental reflections in this region
Interpretation of the results in the case of these complicated compounds must be considered care- fully Microstrains are probably caused by disloca- tion arrays However substitution of different-sized ions and vacancies would also contribute to the strains as would other kinds of disorder especially
348
Volume 98 Number 3 May-June 1993
Journal of Research of the National Institute of Standards and Technology
Table 10 Results of line-btoadening analysis for Bi-Cu-O supreconductors
Specimen Phase hkl (A)
eD)sa)y^
Bi-2212 2212 008 0012
0163(8) 022(3)
001(6) 005(6)
420(80) 00021(6)
020+200 0104(4) ltio-^ 580(30) 00007(1) 040+400 018(2) 00004(6300)
BiPbMgBa-2223 7773 0010 0020
0097(1) 021(2)
00002(1700) 0007(150)
770(60) 00012(1)
020 + 200 012(27) 013(10) 380(430) 00009(71) 040 + 400 015(95) 021(33)
BiPb-73 2212 008 0012
023(2) 025(5)
0002(350) 0001(1000)
220(30) 00013(26)
2223 0010 0020
022(8) 023(99)
0092(67) 018(47)
230(190) 00012(197)
Stacking faults and twins Table 10 shows larger strains in the [001] direction that in the basal plane This can be explained by stacking disorder along the c-axis which was frequently observed in electron-diffraction patterns as streaking [167 168] Easy incorporation of stacking faults is possi- ble because of the two-dimensional weak-bonded layers (BiO double layers are spaced about 3 A apart) The difference in microstrain between in- plane and the c-direction is much smaller for the BiPbMgBa-2223 phase probably because Pb low- ers the faulting by stabilizing the higher-Tc 2223 phase [167] For the BiPb-2223 specimen with two phases there are two possibilities Either the speci- men consists mainly of a mk of two kinds of one- phase grains or both phases occur within the same grains The second possibility was confirmed exper- imentally [169 170] and our results concur be- cause microstrain in the 2212 phase is much smaller than in the one-phase Bi-2212 specimen Processing conditions and cation content probably favour development of the macroscopic inter- growth of both phases within the grains that is microscopic defects grow to sufficiently large re- gions to give a diffraction pattern of another phase with the different number of Cu02 layers As a re- sult strain is relieved and both strains and domain sizes being quite different in one-phase specimens tend to equalize
For the Bi-Cu-O specimens the mean surface- weighted domain sizes are generally smaller than for (La-M)2Cu04 compounds Therefore the com- putation of the stacking- and twin-fault probabili- ties by using Eq (75) may be wrong It would be very instructive to compare the different broaden-
ing of satellite and fundamental reflections which indicates a more pronounced stacking disorder in the modulated structure [171]
In summary we found that for both Bi-2212 and BiPbMgBa-2223 superconductors the c-axis strain exceeds the in-plane strain The BiPb-2223 specimen containing both 2212 and 2223 phases within the single grains shows smaller incoherently diffracting domains and lower c-axis strain than the one-phase specimens This fact may direct us to- ward the mechanism of the second-phase forma- tion in these materials
63 Remarks
It was shown that this particular method of the line-broadening analysis can give information about the size of incoherently diffracting domains and lattice strains in (La-M)2Cu04 and Bi-Clu-O superconductors Moreover results show high an- isotropy of both size and strain parameters as one may expect because of the layered structure of all superconducting cuprates Generally structural line broadening is not large that is a result of rela- tively large domain sizes (200-2000 A) and small strains (002-02) It is interesting to compare these values with the published results for YBa2Cu307-laquo (isotropic strains of 023 [77] and 005-03 [82]) Although the different materi- als were studied they seem too large especially be- cause they are the average of strains in different directions
The main drawback of the line-broadening the- ory is the uncertainty about the origins of the line broadening that is it is difficult to distinguish the main effects responsible for the broadening For
349
Volume 98 Number 3 May-June 1993
Journal of Research of the National Institute of Standards and Technology
the novel superconductors particularly the numer- ous defects (substitutions vacancies stacking faults dislocations and similar) can occur simulta- neously which makes it very difficult to determine their individual contributions Furthermore the crystal structures of most novel superconductors are relatively complicated The average structure has mostly a slightly distorted tetragonal symmetry very similar a and b lattice parameters and a large c parameter but c=36 for YBa2Cu307-laquo for in- stance This results in a large number of overlap- ping peaks and consequently in large errors of all results This showed especially in the case of Bi-Cu-O superconductors (see Table 10) Follow- ing the discussion of reliability of profile fitting in Sec 54 it would be desirable to include more than two reflections in the analysis of broadening but higher-order peaks are usually too weak and over- lapped One way to partially solve this problem would be a whole pattern fitting [172 173] and Rietveld structure refinement [23] in terms of size and strain parameters This requires an accurate preset function to model specimen broadening and precise definition of angular dependence of size and strain parameters The Rietveld programs that model the line broadening in terms of size and strain parameters are based either on the simpli- fied integral-breadth methods [78 95] or on the single-line method [174]
7 Conclusions
A method for analyzing the pure-specimen (structural) broadening of x-ray diffraction line profiles is proposed By modeling the specimen size and strain broadenings with the simple Voigt func- tion it is possible to obtain domain sizes and strains that agree with experiment and show a logi- cal interrelationship Furthermore some common consequences and problems in the Fourier-method analysis follow easily The specimen function is convoluted with the instrumental function to match the observed x-ray diffraction-line profile This avoids the Stokes deconvolution method thus al- lowing analysis of patterns with highly overlapping peaks and weak structural broadening Therefore the method was applied to some novel high-Tc superconductors We reached the following conclu- sions
(i) Surface-weighted domain size depends only on the Cauchy integral breadth of the size-broad- ened profile
(ii) The hook effect occurs when the Cauchy-content of the size-broadened profile is un-
derestimated that is for ^sc(n2)^3sG Usually this happens when the background is estimated too high so the long tails of the Cauchy function are prematurely cut off
(iii) It also follows from conclusion (ii) that the volume-weighted domain size can not be more than twice the surface-weighted domain size (limiting value D)v=2D)i is obtained for the pure-Cauchy size-broadened profile) Minimum value for D)J (D)j should not be less than -131
(iv) If the distortion coefficient is approxi- mated with a harmonic term this leads exactly to the Warren-Averbach method of separation of size and strain broadenings
(v) In that case mean-square strains decrease linearly with the distance L
(vi) It is possible to evaluate local strain ((e^(0))^) only in the case of pure-Gauss strain broadening Then root-mean-square strain is inde- pendent of the distance L and related to the upper limit of strain obtained from the integral breadth of the strain-broadened profile
(vii) If strain broadening is not described exclu- sively with the Gauss function the multiple-line Voigt integral breadth and Warren-Averbach analyses can not give the same results for volume- weighted domain size although D)v is defined identically in both approaches because the appar- ent strain -q = pdeg(29)cot9 is not angular- independent
(viii) Smooth size coefficients give column- length distribution functions without oscillations and make possible a computation of volume- weighted average domain sizes up to ~5000 A
(ix) Comparison with the simplified integral- breadth methods in most cases has shown not large but systematic discrepancy of results indicat- ing that size and strain broadening can not be accu- rately modeled by a single Cauchy or Gauss function Moreover the application of the single- line method is much less reliable and it should not be used where multiple reflections are available
(x) The knowledge of all phases present in the sample and their crystallographic structure is re- quired to successfully fit a cluster of overlapping peaks Although it is very difficult to accurately de- termine the Cauchy-Gauss ratio of an overlapped peak final results of domain size and strain are much less affected Therefore connecting the crys- tallite size exclusively with the Cauchy content and strain with the Gauss content of a specimen profile might be doubtful
(xi) Evaluated errors of domain sizes and strains increase substantially with the degree of
350
Volume 98 Number 3 May-June 1993
Journal of Research of the National Institute of Standards and Technology
peak overlapping Hence for complicated patterns very accurate measurements are necessary and one needs to analyze as many reflections in the same crystallographic direction as possible
(xii) Line-broadening analysis of (La-M)2Cu04 and Bi-Cu-O compounds confirms high anisotropy in these materials
(xiii) Strains in (La-M)2Cu04 probably origi- nate from dislocations and from different sizes of host and dopant ions
(xiv) Stacking-fault probability in (La-M)2Cu04 (M = Ba Ca Sr) increases with increasing Tc whereas the average strain decreases
(xv) In La2Cu04 different broadening of (lOO) and (OfcO) reflections is not caused by stacking faults
(xvi) All Bi-Cu-0 superconductors show larger strain in the c-direction than in the a-b plane which can be explained by stacking disorder along the [001] direction
(xvii) In the specimen with approximately equal amounts of Tl-2212 and TlPb-2223 phases it is likely that a secondary phase develops by the growth of the microscopic faulted regions of the primary phase
Acknowledgments
I am thankful to Dr Harry McHenry for his support and especially to Dr Hassel Ledbetter for his wise guidance and most useful help during my stay at NIST I am also indebted to my home insti- tution the Faculty of Metallurgy of the University of Zagreb for allowing me the leave of absence at NIST
8 References
[1] W Friedrich P Knipping and M v Laue Ann Physik 41 971 (1912)
[2] H M Rietveld Acta Cryst 22 151 (1967) [3] H M Rietveld J Appl Cryst 2 65 (1969) [4] S A Howard and K D Preston in Modern Powder Dif-
fraction Vol 20 The Mineralogical Society of America Washington DC (1989) p 217
[5] D Taupin J Appl Cryst 6 266 (1973) [6] T C Huang and W Parrish Appl Phys Lett 27 123
(1975) [7] M K Wu J R Ashburn C J Torng P H Hor R L
Meng L Gao Z J Hwang Y Q Wang and C W Chu Phys Rev Lett 58 908 (1987)
[8] D Shi MRS Bull 16 37 (1991) [9] D Larbalestier Phys Today 44 74 (1991)
[10] J C Phillips Phys Rev B 4512647 (1992) [11] B Raveau Phys Today 45 53 (1992) [12] A J Millis and K M Rabe Phys Rev B 38 8908 (1988)
[13] F Guinea Europhys Lett 7 549 (1988) [14] C P Dhard and P Singh in Proc Int Symp High-Temp
Supercond Jaipur India Oxford amp IBH Publishing New Delhi (1988) p 271
[15] J D Jorgensen Phys Today 44 34 (1991) [16] J G Bednorz and K A Muller Z Phys B 64 189
(1986) [17] K Kishio K Kitazawa S Kaube I Yasuda N Sugii H
Takagi S Uchida K Fueki and S Tanaka Chem Lett 429 (1987)
[18] J D Jorgensen B Dabrowski S Pei D G Hinks L Soderholm B Morosin J E Venturini and D S Ginley Phys Rev B 38 11337 (1988)
[19] J R Clem Phys Rev B 43 7837 (1991) [20] M Paranthaman M Foldejiki D Balzar H Ledbetter
A J Nelson and A M Hermann submitted to Phys Rev B
[21] A R Stokes Proc Phys Soc Lond 61 382 (1948) [22] B E Warren and B L Averbach J Appl Phys 23 497
(1952) [23] R Delhez Th H de Keijser and E J Mittemeijer in
Accuracy in Powder Diffraction S Block and C R Hub- bard eds Natl Bur Stand (US) Special Publication 567 (1980) p 213
[24] H P Klug and L E Alexander X-ray Diffraction Proce- dures 2nd Edition John Wiley New York (1974) p 661
[25] J I Langford J Appl Ciyst 11 10 (1978) [26] J I Langford in Accuracy in Powder Diffraction S
Block and C R Hubbard eds Natl Bur Stand (US) Special Pubication 567 (1950) p 255
[27] R Delhez Th H de Keijser and E J Mittemeijer Fre- senius Z Anal Chem 312 1 (1982)
[28] A J C Wilson Proc Phys Soc Lond 80 286 (1962) [29] A J C Wilson Proc Phys Soc Lond 81 41 (1963) [30] L P Smith Phys Rev 46 343 (1934) [31] H C Burger and P H van Cittert Z Phys 79 722
(1932) [32] S Ergun J Appl Ciyst 1 19 (1968) [33] R Croche and L Gatineau J Appl Ciyst 10479 (1977) [34] L H Schwarz and J B Cohen Diffraction from Materi-
als Academic Press New York (1977) p 391 [35] R Delhez Th H de Keijser E J Mittemeijer and J I
Langford J Appl Cryst 19 459 (1986) [36] R Delhez Th H de Keijser E J Mittemeijer and J I
Langford Aust J Phys 41 213 (1988) [37] R A Young and D B Wiles J Appl Cryst 15 430
(1982) [38] W Voigt Stizungsber K Bayer Akad Wiss 42 603
(1912) [39] E E Whiting J Quant Spectrosc Radiat Transfer 8
1379 (1968) [40] G K Wertheim M A Butler K W West and D N E
Buchanan Rev Sci Instrum 111369 (1974) [41] M M Hall Jr V G Veeraraghavan H Rubin and P G
Winchell J Appl Cryst 10 66 (1977) [42] A Brown and J W Edmonds Adv X-Ray Anal 23 361
(1980) [43] P Suortti M Ahtee L Unonius J Appl Cryst 12 365
(1979) [44] T Sundius J Raman Spectrosc 1 471 (1973) [45] B H Armstrong J Quant Spectrosc Radiat Transfer 7
61 (1967) [46] J F Kielkopf J Opt Soc Am 63 987 (1973) [47] B P Asthana and W Kiefer Appl Spectr 36 250
(1982)
351
Volume 98 Number 3 May-June 1993
Journal of Research of the National Institute of Standards and Technology
[48] J P M de Vreede S C Mehrotra A Tal and H A Dijkerraan Appl Spectr 36 227 (1982)
[49] F R L Schoening Ada Ciyst 18 975 (1965) [50] P Scherrer Gott Nachr 2 98 (1918) [51] A R Stokes and A J C Wilson Proc Cambridge
Philos Soc 38 313 (1942) [52] A J C Wilson X-Ray Optics 2nd edition Methuen
London (1962) [53] S Leie and T R Anantharaman Proc Indian Acad
Sci Sect A H 261 (1966) [54] D Louer D Weigel and J I Langford J Appl Ciyst
5 353 (1972) [55] A J C Wilson J Appl Ciyst 2 181 (1969) [56] J I Langford and A J C Wilson J Appl Ciyst 11102
(1978) [57] A R Stokes and A J C Wilson Proc Phys Soc Lond
56174 (1944) [58] B E Warren and B L Averbach J Appl Phys 21 595
(1950) [59] B E Warren X-Ray Diffraction Addison-Wesley
Reading Massachusetts (1969) p 264 [60] B E Warren in Progress in Metal Physics Vol 8 Perg-
amon Press London (1959) p 146 [61] F Bertaut C R Acad Sci Paris 228 187 (1949) [62] N C Haider and C N J Wagner Acta Cryst 20 312
(1966) [63] D Balzar and H Ledbetter in Proceedings of the Accu-
racy in Powder Diffraction II Natl Inst Stand Technol (1992) p 37
[64] D Balzar and H Ledbeter J Appl Cryst 26 (1993) in press
[65] J N Eastabrook and A J C Wilson Proc Phys Soc Lond B 65 67 (1952)
[66] R S Smith IBM J Res Develop 4 205 (1960) [67] B Y Pines and A F Sirenko Soviet Physics Ciyst 715
(1962) [68] G B Mitra and N K Misra Acta Ciyst 22 454 (1967) [69] A Gangulee J Appl Ciyst 7 434 (1974) [70] J Mignot D Rondot Acta Met 231321 (1975) [71] J Mignot and D Rondot Acta Ciyst A 33 327 (1977) [72] R K Nandi H K Kuo W Schlosberg G Wissler J B
Cohen and B Crist Jr J Appl Ciyst 17 22 (1984) [73] M Zocchi Acta Ciyst A 36164 (1980) [74] P Ramarao and T R Anantharaman Trans Ind Ins
Metals 18 181 (1965) [75] R K Nandi and S P Sen Gupta J App Cryst 11 6
(1978) [76] Th H de Keijser J I Langford E J Mittemeijer and
B P Vogels J Appl Ciyst IS 308 (1982) [77] A Williams G H Kwei R B Von Dreele A C Lar-
son L D Raistrick and D L Bish Phys Rev B 37 7960 (1988)
[78] A C Larson and R B Von Dreele Los Alamos Na- tional Laboratory Report No LA-UR-86-748 (1988)
[79] J D Jorgensen D H Johnson M H Mueller J G Worlton and R B Von Dreele in Proceedings of the Conference on Diffraction Profile Analysis Cracow Poland (1978) p 20
[80] R B Von Dreele J D Jorgensen and C G Windsor J Appl Ciyst 15 581 (1982)
[81] P Thompson D E Cox and J B Hastings J Appl Ciyst 20 79 (1987)
[82] J P Singh R A Guttschow D S Kupperman J T Dusek and R B Poeppel in High Temperature Super-
conducting Compounds III S Whang A Gupta and E Ceilings eds TMS AIME Warrendale (1991) p 281
[83] M O Eatough D S Glnley and B Morosin Adv X- Ray Anal 33 145 (1990)
[84] E J Peterson P J Kung R E Muenchausen and D M Smith in Proceedings of the 41st Annual Denver Conference on Applications of X-Ray Analysis Colo- rado Springs Colorado (1992) p 74
[85] M Rand J I Langford and J S Abell submitted to J Cryogenics (1992)
[86] D Balzar J Appl Ciyst 25 559 (1992) [87] D Balzar H Ledbetter and A Roshko Physica C 185-
189 871 (1991) [88] D Balzar and H Ledbetter J Mater Sci Lett 111419
(1992) [89] D Balzar H Ledbetter and A Roshko Pow Diffr 8
(1993) in press [90] S Johnson M Gusraan D Rowcliffe T Geballe and J
Sun Adv Ceram Mater 2 337 (1987) [91] H Ledbetter S A Kim R B Goldfarb and K Togano
Phys Rev B 39 9689 (1989) [92] H Friedman Electronics 132 (1945) [93] W Parrish (ed) in Advances in X-Ray Diffractometry
and X-Ray Spectrography Centrex Publishing Company Eindhoven The Netheriands (1962)
[94] W Soller Phys Rev 24158 (1924) [95] S A Howard R L Snyder J Appl Ciyst 22 238
(1989) [96] G H Stout and L H Jensen X-Ray Structure Determi-
nation 2nd edition Wiley New York (1989) p 373 [97] D E Appleman and T Evans Jr Final Report 92-14
US Geological Survey Washington DC (1973) Avail- able as NTIS Document No PB-216188
[98] M U Cohen Rev Sci Instrum 6 68 (1935) [99] M U Cohen Rev Sci Instrum 7 155 (1936) [100] M H Mueller L Heaton and K T Miller Acta Ciyst
13 828 (1960) [101] R A Young P E Mackie and R B Von Dreele J
Appl Ciyst 10 262 (1977) [102] D B Wiles and R A Young J Appl Cryst 14 149
(1981) [103] J K Yau and S A Howard J Appl Ciyst 22 244
(1989) [104] S A Howard J K Yau and H U Anderson J Appl
Phys 65 1492 (1989) [105] S Enzo G Fagherazzi A Benedetti and S Poilizzi J
Appl Ciyst 21 536 (1988) [106] A Benedetti G Fagherazzi S Enzo and M
Battagliarin J Appl Cryst 21 543 (1988) [107] Th H de Keijser E J Mittemeijer and H C F Rozen-
daal J Appl Ciyst 16 309 (1983) [108] Y Zhang J M Stewart C R Hubbard and B Mo-
rosin Adv X-Ray Anal 33 373 (1990) [109] Y Wang S Lee and Y Ue J Appl Ciyst IS 35
(1982) [110] V N Selivanov and E F Smislov Zavod Lab 57 28
(1991) [Ill] A Guinier X-Ray Diffraction W H Freeman San
Francisco (1963) p 139 [112] M Wilkens J Appl Cryst 12119 (1979) [113] D Du and Y Wang Pow Diffr 2180 (1987) [114] A P Prudnikov Yu A Brychkov and O L Marichev
Integrals and Series Vol 1 Gordon and Breach Am- sterdam The Netheriands (1986) p 344
352
Volume 98 Number 3 May-June 1993
Journal of Research of the National Institute of Standards and Technology
[115] R L Rothman and J B Cohen J Appl Phys 42 971 (1971)
[116] T Adier and C R Houska J Appl Phys 50 3282 (1979)
[117] C R Houska and T M Smith J Appl Phys 52 748 (1981)
[118] S Rao and C R Houska Acta Ciyst A 4214 (1986) [119] J I Langford R Delhez Th H de Keijser and E J
Mittemeijer Ausi J Phys 41173 (1988) [120] J I Langfoid J Appl Cryst IS 315 (1982) [121] M J Turunen Th H de Keijser R Delhez and N M
van der Pers J Appl Ciyst 16176 (1983) [122] A J C Wilson Acta Ciyst 23 888 (1967) [123] A J C Wilson Acta Ciyst A 24 478 (1968) [124] A J C Wilson Acta Ciyst A 25 584 (1969) [125] G Gagliotti A Paoletti and F P Ricci Nucl Instrum
3 223 (1958) [126] J I Langford R J Cernik and D Louer J Appl
Ciyst 24 913 (1991) [127] J I Langford in Accuracy in Powder Diffraction II
preprint [128] A J C Wilson Mathematical Theory of X-Ray Powder
Diffractometiy Centrex Eindhoven The Netherlands (1963)
[129] J L Langford Prog Ciyst Growth and Charact 14185 (1987)
[130] T G Fawcett C E Crowder S J Brownell Y Zhang C R Hubbard W Schreiner G P Hamill T C Huang E Sabino J I Langford R Hamilton and D Louer Pow Diffr 3 209 (1988)
[131] W L Smith J Appl Ciyst 9187 (1976) [132] J L Langford and D Louer J Appl Ciyst 15 20
(1982) [133] Fl Popescu and L Benes Acta Ciyst A 33 323 (1977) [134] P PSuse^cu R MSnaila M Popescu and E Jijovici j
Appl Cryst 7 281 (1974) [135] P F Bley Y Calvayrac and M Fayard J Appl Ciyst
7 493 (1974) [136] B Moraweck Ph de Montgolfier and A J Renouprez
J Appl Ciyst 10191 (1977) [137] A Le Bail and D Louer J Appl Cryst 11 50 (1978) [138] D R Buchanan R L McCuUough and R L Miller
Acta Ciyst 20 922 (1966) [139] P Suortti and L D Jennings Acta Cryst A 33 1012
(1977) [140] J B Cohen and C N J Wagner J Appl Phys 33 2073
(1962) [141] A Bianconi J Budnick A M Flank A Fontaine P
Lagarde A Marcelli H Tolentino B Chamberland C Michel B Raveau and G Demazeau Phys Lett A127 285 (1988)
[142] K Fueki K Kitazawa K Kishio T Hasegawa S Uchida H Takagi and S Tanaka in Chemistiy of High- Temperature Superconductors D L Nelson M S Whittingham and T F George eds American Chemi- cal Society (1987) p 38
[143] T Fujita Y Aoki Y Maeno J Sakurai H Fukuba and H Fujii J Appl Phys 26 U68 (1987)
[144] R M Hazen in Physical Properties of High-rc Super- conductors Vol 2 D M Ginsberg ed World Scien- tific Singapore (1990) p 121
[145] J B Torrance A Bezinge A I Nazzal T C Huang S P Parkin D T Keane S J LaPlaca P M Horn and G A Held Phys Rev B 40 8872 (1989)
[146] J D Axe A H Moudden D Hohlwein D E Cox K
M Mohanty A R Moodenbaugh and Y Xu Phys Rev Lett 62 2751 (1989)
[147] T Suzuki and T Fujita Physica C 159 111 (1989) [148] T Fujita and Y Maeno in Superconducting Materials
JJAP Series 1 (1988) p 34 [149] A Roshko and Y-M Chiang J Appl Phys 66 3710
(1989) [150] D E Cox S C Moss R L Meng P H Hor and C W
Chu J Mater Res 31327 (1988) [151] B Crist and J B Cohen J Polym Sci 17 1001 (1979) [152] H Ledbetter S Kim and A Roshko Z Phys B 89275
(1992) [153] R D Shannon and C T Prewitt Acta Ciyst B 25 925
(1969) [154] M Lang H Spille F Steglich Y Hidaka T Murakami
and Y Endoh Physica C 162-1641037 (1989) [155] Y Hidaka and T Murakami Phase trans 15 241
(1989) [156] P L Gai and E M McCarron Science 247 553 (1990) [157] T Kamiyama I Izumi H Asano H Takagi S Uchida
Y Tokura E Takayama-Muromachi M Matsuda K Yamada Y Endoh and Y Hidaka Physica C 172 120 (1990)
[158] A Kapitulnik Physica C 153-155 520 (1988) [159] L A Muradyan V N Molchanov R A Tamazyan and
V I Simonov Physica C 162-164 536 (1989) [160] P Day M Rosseinsky K Prassides W I F David O
Moze and A Soper J Phys C 20 L429 (1987) [161] J T Lewandowski R A Beyerlein J M Longo and R
A McCauley J Amer Ceram Soc 69 699 (1986) [162] R Ramesh G van Tendeloo G Thomas S M Green
Y Mei C Jiang and H L Luo Appl Phys Lett 53 2220 (1988)
[163] J Schneck L Pierre J C Tolddano and C Daguet Phys Rev B 39 9624 (1989)
[164] O Eibl Physica C 168 215 (1990) [165] W Carrilo-Cabrera and W Gopel Physica C 161 373
(1989) [166] P Bordet J J Capponi C Chaillout J Chenavas A
W Hewat E A Hewat J L Hodeau M Marezio J L Tholence and D Tranqui Physica C 156189 (1988)
[167] R Ramesh K Remschnig J M Tarascon and S M Green J Mater Res 6 278 (1991)
[168] Z Hiroi Y Ikeda M Takano and Y Bando J Mater Res 6 435 (1991)
[169] Y Inoue M Hasegawa Y Shichi I Munakata M Ya- manaka S Hiyama and O Nittono J Mater Res 5 737 (1990)
[170] R Ramesh B G Bagley J M Tarascon S M Green M L Rudee and H L Luo J Appl Phys 67 379 (1990)
[171] X B Kan J Kulik P C Chow S C Moss Y F Yan J H Wang and Z X Zhao J Mater Res 5 731 (1990)
[172] G S Pawley J Appl Ciyst 13 630 (1980) [173] H Toraya J Appl Ciyst 19 440 (1986) [174] L Lutterotti and P Scardi J Appl Ciyst 23 246
(1990)
About the author Davor Balzar is with Faculty of Metallurgy of the University of Zagreb Sisak Croatia and was a Guest Researcher at fflST The National Institute of Standards and Technology is an agency of the Technology Administration US Department of Commerce
353
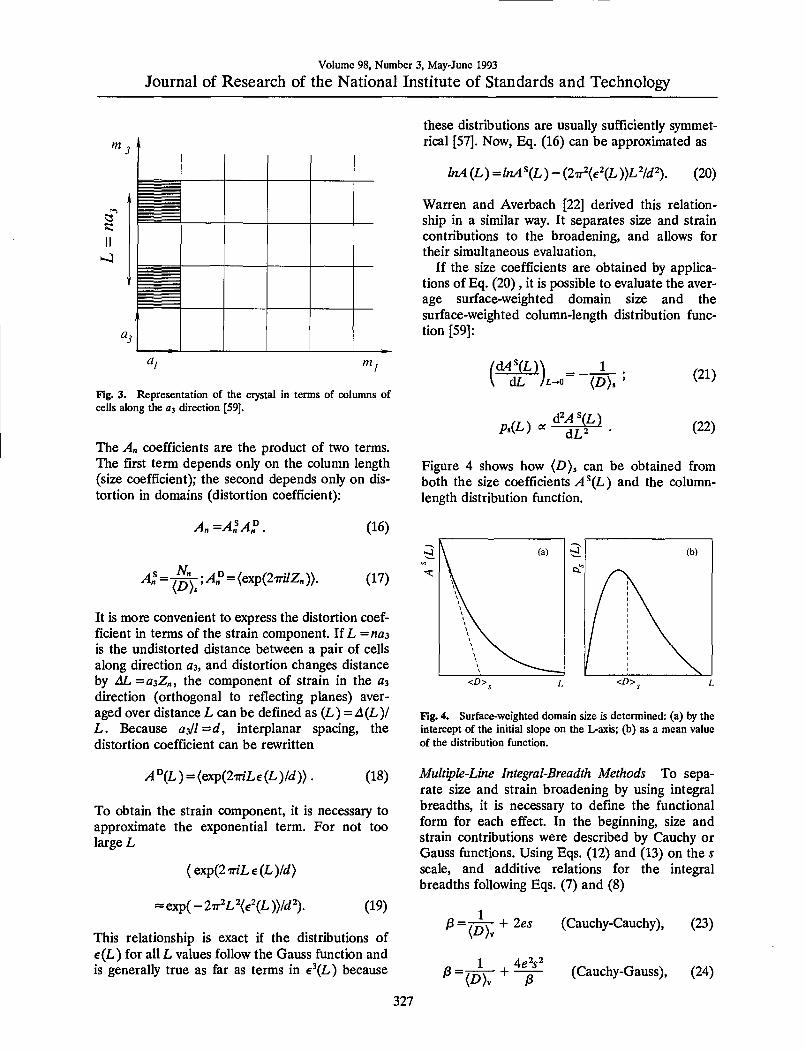
Volume 98 Number 3 May-June 1993
Journal of Research of the National Institute of Standards and Technology
m 3
^i
m I
Fig 3 Representation of the crystal in terms of columns of cells along the a^ direction [59]
The Abdquo coefficients are the product of two terms The first term depends only on the column length (size coefficient) the second depends only on dis- tortion in domains (distortion coefficient)
An mdashAn An bull
Nbdquo lf = ltexp(2TrZbdquo))
(16)
(17)
It is more convenient to express the distortion coef- ficient in terms of the strain component If L =laquoa3 is the undistorted distance between a pair of cells along direction 03 and distortion changes distance by 4L = a^Zn the component of strain in the as direction (orthogonal to reflecting planes) aver- aged over distance L can be defined as (L) = A(L) L Because oil^d interplanar spacing the distortion coefficient can be rewritten
Ideg(L) = exp(2TrLe(L)d)) (18)
To obtain the strain component it is necessary to approximate the exponential term For not too large L
exp(2mLe(L)d)
laquoexp(-2Tr^L2lte2(L))d^) (19)
This relationship is exact if the distributions of e(L) for all L values follow the Gauss function and is generally true as far as terms in e^(L) because
these distributions are usually sufficiently symmet- rical [57] Now Eq (16) can be approximated as
InA L)=lnAL)- 2TTeL))LW) (20)
Warren and Averbach [22] derived this relation- ship in a similar way It separates size and strain contributions to the broadening and allows for their simultaneous evaluation
If the size coefficients are obtained by applica- tions of Eq (20) it is possible to evaluate the aver- age surface-weighted domain size and the surface-weighted column-length distribution func- tion [59]
idAHL) ^ 1_
Ps(L) dMU) dL^
(21)
(22)
Figure 4 shows how (D) can be obtained from both the size coefficients ^^(L) and the column- length distribution function
Fig 4 Surface-weighted domain size is determined (a) by the intercept of the initial slope on the L-axis (b) as a mean value of the distribution function
Multiple-Line Integral-Breadth Methods To sepa- rate size and strain broadening by using integral breadths it is necessary to define the functional form for each effect In the beginning size and strain contributions were described by Cauchy or Gauss functions Using Eqs (12) and (13) on the s scale and additive relations for the integral breadths following Eqs (7) and (8)
1 j8 =77vr + 2es (Cauchy-Cauchy) (23)
8=T^ + ^y- (Cauchy-Gauss) (24)
327
Volume 98 Number 3 May-June 1993 Journal of Research of the National Institute of Standards and Technology
^^=7^ + 4e^s^ (Gauss-Gauss) (25)
Here e = Tj4raquo4dd is the upper limit for a strain Equation (24) uses the Haider and Wagner [62] parabolic approximation for the integral breadth of the Voigt function expressed by Eq (11)
3 I3) (26)
Experience shows however that neither Cauchy nor Gauss functions can model satisfactorily size or strain broadening in a general case Langford [26] introduced the so-called multiple-line Voigt-func- tion analysis Both size-broadened and strain- broadened profiles are assumed to be Voigt functions Using Eqs (12) and (13) it follows sym- bolically for Cauchy and Gauss parts that
j8c = i3sc+j8Dcs
ph = Plc + plcs^
(27)
(28)
This approach disagrees with the Warren- Averbach analysis that is the two methods give different results (see Sec 44) [63 64]
Single-Line Methods There are cases where only the first order of reflection is available or higher- order reflections are severely suppressed (ex- tremely deformed materials multiphase com- posites catalysts and oriented thin films) Many methods exist to separate size and strain broaden- ing from only one diffraction peak However it was stated in Sec 212 that the different size and strain broadening angle dependence is a basis for their separation hence using only one diffraction line introduces a contradiction Consequently single- line methods should be used only when no other option exists The single-line methods can be di- vided in two main parts Fourier-space and real- space methods Fourier-space methods are based on the Warren-Averbach separation of size and strain broadening following Eq (20) The func- tional form of E^(L)) is assumed either to be con- stant [65666768] or assumed to depend on L as eL))=cL [69707172] Then Eq (20) can be fitted to few points of A(L) for the small averaging distance L to obtain size and strain parameters All Fourier-space methods have the serious prob-
lem that the Fourier coefficients 4 (L) are usually uncertain for small L because of the so-called hook effect [60] (see Sec 42) 2occhi [73] sug- gested that fitting the straight line through the first derivatives of the Fourier coefficients instead of through the coefficients themselves would solve the hook-effect problem
All real-space methods [747576] are based on the assumption that the Cauchy function deter- mines size and that the Gauss function gives strain The most widely used method of de Keijser et al [76] gives size and strain parameters from Cauchy and Gauss parts of the Voigt function respectively
P)v=^
e=^ 2s
(29)
(30)
22 Diffraction-Line-Broadening Analysis of Superconductors
In this field very few studies exist Williams et al [77] reported isotropic strains in YBa2Cu307-laquo powder by the simultaneous Rietveld refinement of pulsed-neutron and x-ray diffraction data Using a GSAS Rietveld refinement program [78] both size and strain broadening were modeled with the Gauss functions for the neutron-diffraction data [79 80] and with the Cauchy functions for the x- ray diffraction data (modified method of Thomp- son Cox and Hastings [81]) Interestingly both the neutron and x-ray data gave identical values for the isotropic strain (023) and no size broaden- ing Singh et al [82] studied internal strains in YBa2Cu307-laquo extruded wires by pulsed-neutron diffraction They separated size and strain parame- ters by means of Eq (25) (Gauss-Gauss approxi- mation) Size broadening was found to be negligible but (isotropic) microstrains range from 005 for the coarse-grained material to 03 for the fine-grained samples Eatough Ginley and Morosin [83] studied Tl2Ba2Ca2Cu30io (Tl-2223) and Tl2Ba2CaCu208 (Tl-2212) superconducting thin films by x-ray diffraction Using the Gauss-Gauss approximafion they found strains of 014-018 in both phases and domain sizes of 1200-1400 A for Tl-2212 but 500 A for Tl-2223
We are aware of only two more unpublished studies [84 85] involving size-strain analysis in high-Tc superconductors The probable reason is that any analysis is very difficult because of weak line broadening and overlapping reflections This
328
Volume 98 Number 3 May-June 1993
Journal of Research of the National Institute of Standards and Technology
precludes application of reliable analysis such as the Stokes deconvolution method with the Warren- Averbach analysis of the broadening Instead sim- ple integral-breadth methods are used which gives generally different results for each approach Moreover for x-ray diffraction broadening appli- cation of the Gauss-Gauss approximation does not have any theoretical merit although reasonable values especially of domain sizes may be obtained [86] We showed [878889] that reliable diffrac- tion-line-broadening analysis of superconductors can be accomplished and valuable information about anisotropic strains and incoherently diffract- ing domain sizes obtained
3 Experiment 31 Materials
The materials used for this study were tungsten and silver commercially available powders with nominal grain sizes 4-12 ijim La2-xSriCu04(jc = 0 006 015 024) powders Lai^Moi5Cu04(M = Ca Ba) powders Bi2Sr2CaCu208 (Bi-2212) sinter (BiPb)2Sr2Ca2Cu30io(BiPb-2223) sinter and (BiPb)2(SrMg)2(BaCa)2Cu30io (BiPbMgBa-2223) sinter
Powders with nominal compositions La2-xSrCuO4(c=0 006 015 024) and Laig5Moi5Cu04(M = Ca Ba) were prepared at the National Institute of Standards and Technology Boulder Colorado by A Roshko using a freeze- drying acetate process [90] Acetates of the various cations were assayed by mass by calcining to the corresponding oxide or carbonate The appropriate masses of the acetates for the desired compositions were dissolved in deionized water The acetate so- lutions were then sprayed through a fine nozzle into liquid nitrogen to preserve the homogeneous cation distributions Frozen particles were trans- ferred to crystallization dishes and dried in a com- mercial freeze dryer to a final temperature of 100 degC After drying the powders except the Lai^Baoi5Cu04 were calcined in alumina (998) crucibles at 675 C for 1 h in a box furnace with the door slightly open to increase ventilation Because BaCOs is difficult to decompose the Laig5Baoi5Cu04 was calcined under a vacuum of 2 Pa at 800 C for 4 h then cooled slowly in flowing oxygen (2degCmin) The calcined powders were oxidized in platinum-lined alumina boats in a tube furnace with flowing oj^gen at 700 degC After 3 h at 700 C the powders were pushed to a cold end of the furnace tube where they cooled quickly (20 Cs) while still in flowing oxygen
The cylindrical specimens (23 mm in diameter and 9 mm thick) of Bi-2212 BiPb-2223 and BiPbMgBa-2223 were prepared at the National Research Institute for Metals Tsukuba Japan by K Togano [91] Starting oxides and carbonates were Pb304 61203 CuO SrCOs MgCOs and BaC03 They were calcinated in air at 800 C for 12 h Powders were then pressed and sintered in 8 oxygen-92 argon mixture at 835 degC for 83 h Specimens were furnace cooled to 750 degC held for 3 h in flowing oxygen and then furnace cooled in ojygen to room temperature
311 Preparation of Specimens for X-ray Diffraction The bulk specimens were surface polished if necessary and mounted in specimen holders Coarse-grained powders of La2-cSrxCu04 (x=Q 006 015 024) and Lai8sMoi5Cu04 (M = Ca Ba) were ground with a mortar and pestle in toluene and passed through a 635-mesh sieve (20-|xm nominal opening size) Silver and tungsten powders were dry ground with a mortar and pestle All powders were mixed with about 30 silicone grease and loaded into rectangular cavities or slur- ried with amyl acetate on a zero-background quartz substrate
32 Measurements
X-ray-diffraction data were collected using a standard two-circle powder goniometer in Bragg- Brentano parafocusing geometry [92 93] (see Fig 5) A flat sample is irradiated at some angle incident to its surface and diffraction occurs only from crystallographic planes parallel to the speci- men surface The goniometer had a vertical 0-26 axis and 22 cm radius CnKa radiation ex- cited at 45 kV and 40 mA was collimated with Seller slits [94] and a 2 mm divergence slit SoUer slits in the diffracted beam 02 mm receiving slit and Ge solid-state detector were used in a step- scanning mode (OOI7IO s for a standard specimen 002deg-005730-80 s for other specimens depending on the amount of broadening)
33 Data Analysis
The diffractometer was controlled by a com- puter and all measurements were stored on hard disc Data were transferred to a personal computer for processing
We used computer programs for most calcula- tions X-ray diffraction patterns were fitted with the program SHADOW [95] This program allows a choice of the fitting function and gives refined positions of the peak maximums intensities and function-dependent parameters It also has the
329
Volume 98 Number 3 May-June 1993
Journal of Research of the National Institute of Standards and Technology
Seller Slits
Source S
Specimen
Fig 5 Optical arrangement of an x-ray diffractometer Adapted from Klug and Alexander [24]
ability to convolute the predefined instrumental profile with the specimen function to match the ob- served pattern Choice of the specimen function in- cludes Gauss and Cauchy functions We added the ability to model the specimen broadening with an exact Voigt function and implemented SHADOW on a personal computer In the fitting procedure for every peak in the pattern the program first gen- erates the instrumental profile at the required dif- fraction angle The instrumental profile is deter- mined from prior measurements on a well-annealed standard specimen (see Sec 51) Then it assumes parameters of the specimen profile For an exact Voigt function parameters are peak position peak intensity and Cauchy and Gauss integral breadths of the Voigt function By convoluting the instru- mental profile with the specimen profile and adding a background the calculated pattern is ob- tained [Eq (2)] Parameters of the specimen profile are varied until the weighted least-squares error of calculated and observed patterns Eq (59) reaches a minimum This process avoids the unstable Stokes deconvolution method It is possible that the refine- ment algorithm is being trapped in a false minimum [96] but it can be corrected by constraining some parameters Refined parameters of the pure-speci- men profile are input for the size-strain analysis of the broadening A program for this analysis was written in Fortran
Lattice parameters of powder specimens were calculated by the program NBSLSQ85 based on the method of Appleman and Evans [97] A pro- gram in Fortran was written to apply corrections to observed peak maximums by using NIST standard reference material 660 LaB6 as an external stan-
dard Lattice parameters of bulk specimens were determined by the Fortran program which uses a modified Cohens method [9899100] to correct for systematic diffractometer errors Lattice parame- ters were also calculated by the Rietveld refinement programs GSAS [78] and DBW32S [101 102]
4 Methodology
When instrumental and specimen contributions to the observed line profile must be modeled sepa- rately adopting a specimen function is a critical step Yau and Howard [103104] used Cauchy and Enzo et al [105] pseudo-Voigt functions Benedetti Fagherazzi Enzo and Battagliarin [106] showed that modeling the specimen function with the pseudo-Voigt function gives results comparable to those of the Stokes deconvolution method when combined with the Warren-Averbach analysis of Fourier coefficients De Keijser Mittemeijer and Rozendaal [107] analytically derived domain sizes and root-mean-square strains for small averaging distance L in the case of the Voigt and related func- tions
The aim here is to study more thoroughly the consequences of assumed Voigt specimen function on the size-strain analysis of the Fourier coeffi- cients of the broadened peaks It is shown that some experimentally observed interrelations between derived parameters (particularly volume-weighted and surface-weighted domain sizes) and their be- havior (the hook effect and dependence of mean- square strains on the averaging distance) can be explained by this simple assumption Moreover the discrepancy between the integral-breadth methods and Warren-Averbach analysis results from differ- ent approximations for the strain broadening and the background experimental errors
41 Separation of Size and Strain Broadenings
The normalized Fourier transform of a Voigt function is easily computable [46]
^ =exD[-2laquo^e^-7m^^fi^l fan ^bdquo-exp|^ ^ cr(2e) ^ a^(2e) T ^^^^
It is convenient to express Fourier coefficients in terms of distance L by immediately making the ap- proximation A (26) = Ascos do
AL) = exp[-2L^-7rL^pl] (32)
330
Volume 98 Number 3 May-June 1993
Journal of Research of the National Institute of Standards and Technology
Equation (32) is a good approximation even for large specimen broadening Even for a profile span of A (29) = 80deg the error made by replacing this in- terval by an adequate A(sin9 ) range is 2 How- ever strictly speaking the profile will be asym- metrical in reciprocal space and Fourier-interval limits will not correspond to the 29i and Idz peak- cutoff values in real space It is important to keep Fourier interval limits identical for all multiple-or- der reflections otherwise serious errors in the sub- sequent analysis will occur [108] If higher accuracy for a considerable broadening is desired profile fit- ting can be accomplished In terms of the recipro- cal-space variable s instead of in a real 29 space
Assuming that only the Cauchy function deter- mines domain size [4(L) = exp(-L(Z))s)] and only the Gauss function gives root-mean-square strain (RMSS) [^deg(L) = exp(-27r=L2(e)d^)] Eq (32) leads to the Warren-Averbach [Eq (20)] for the separation of size and strain contribution [62] Experience shows that Cauchy and Gauss functions can not satisfactory model specimen broadening Balzar and Ledbetter [64] postulate that the speci- men function includes contributions of size and strain effects both approximated with the Voigt functions Because the convolution of two Voigt functions is also a Voigt function Cauchy and Gauss integral breadths of the specimen profile are easily separable
3c=i3sc + 3DC (33)
(34)
Langford [26] separated the contributions from size and strain broadening in a similar way (See Eqs (27) and (28)) Note however that Eqs (33) and (34) do not define size and strain angular or- der-dependence
Because Fourier coefficients are a product of a size and a distortion coefficient from Eqs (32) (33) and (34) we can obtain the separation of size and strain contributions to the pure specimen broadening
^S(L) = exp(-2Li3sc-TrL^3io) (35)
Adeg(L) = eM-2LpDc-TrL^Phc) (36)
Wang Lee and Lee [109] modeled the distortion coefficient and Selivanov and Smislov [110] mod- eled the size coefficient in the same way
To obtain size and distortion coefficients at least two reflections from the same crystallographic- plane family must be available
42 Size Coefficient
Surface-weighted domain size is calculated from the size coefficients following Eq (21) From Eq (35) we obtain
lt^gts = 1
2i3sc (37)
Therefore surface-weighted domain size depends only on the Cauchy part of the size-integral breadth
The second derivative of the size coefficients is proportional to the surface-weighted column-length distribution function Eq (22) The volume- weighted column-length distribution function fol- lows similarly [111]
p(L)ocL^j^ (38)
By differentiating Eq (35) twice we obtain
^^4^ = [(2^L^ic + 2^sc)^- dL
2TrplcAL) (39)
Because the column-length distribution function should always be positive [59] the Cauchy part must dominate Inspection of Eq (39) shows that for small L we must require
(40)
Otherwise the hook effect will occur in the plot of size coefficientsI (L) versus L that is the plot will be concave downward for small L (Fig 6) The hook effect is usually attributed to experimental errors connected with the truncation of the line profiles and consequently overestimation of background [59] This is a widely encountered prob- lem in the Fourier analysis of line broadening It results in overestimation of effective domain sizes and underestimation of the RMSS [36] Some authors [106] claim that the preset specimen- broadening function eliminates the hook effect However Eq (39) shows that effectively too high
331
Volume 98 Number 3 May-June 1993
Journal of Research of the National Institute of Standards and Technology
08-
04-
mdash^ 1 J 1 x
^~ ( ^ ^ i I
1 t 1 11
jl u
V 1 iJ
J
c^
100 200
Fig 6 (upper) The hook effect of the size coefficients A ^ (full line) at small L (lower) it causes negative values (set to zero) of the column-length distribution functions
background causes underestimation of the Cauchy content of the Voigt function because the long tails are truncated prematurely It has to be men- tioned that Wilkens [112] proposed tilted small-an- gle boundaries to be the source of the hook effect Liu and Wang [113] defined a minimum particle size present in a specimen depending on the size of the hook effect Figure 6 shows that negative values of the column-length distribution functions (set to zero) do not affect the shape but shift the entire distribution toward larger L values
Note also that the surface-weighted column- length distribution function ps(L) will usually have a maximum at L = 0 but for the particular ratio of integral breadths determined by Eq (40) it can be zero The volume-weighted column-length distribu- tion function7v(L) will always have a maximum for LsO
If the column-length distribution functions are known it is possible to evaluate mean values of respective distributions
lt^kv =
00
J ^ _0
(L)dL
raquosv(L)dL (41)
Integrals of this type can be evaluated analytically [114]
OQ
J cexp( - to^ - a )dc = i^y^ ^ of
hd^^^^fe)]- (^2)
Surface-weighted domain size (D)s must be equal to the value obtained from Eq (37) The volume- weighted domain size follows
ltD)v = ^^erfc(A) = js (43)
Using Eqs (37) and (43) we can evaluate the ratio of domain sizes
i^ = 7r lt^gts
= 2vn-^exp(A2)erfc(^) (44)
Theoretically k can change from zero to infinity However the minimum value of k is determined by Eq (40)
1V2 ltk lt laquogt (45)
Hence the ratio of domain sizes can change in a limited range (see also Fig 7)
131laquo V2^ erfc (^ ) s ^ lt 2 (46)
10^ 10^ 10- 10deg 10 10^ 10-
Fig 7 The ratio of volume-weighted and surface-weighted domain sizes as a function of the characteristic ratio of Cauchy and Gauss integral breadths k
332
Volume 98 Number 3 May-June 1993
Journal of Research of the National Institute of Standards and Technology
It may be noted that most experiments give the ratio D)vD)s in this range (see for instance re- view by Klug and Alexander [24]) When k goes to infinity the size broadening is given only by the Cauchy component and (JD)V=2(D)S This is a case of pure Cauchy size broadening described by Haider and Wagner [62] and de Keijser Mittemei- jer and Rozendaal [107] It is possible to imagine a more complicated column-length distribution func- tion [27] than Eq (39) which would allow even larger differences between surface-weighted and volume-weighted domain sizes However we are not aware of any study reporting a difference larger than 100
43 Distortion Coefficient
In Sec 212 it was shown that the distortion co- efficient can be approximated by the exponential
Adeg(L) = exp(-ITTVLeL))) (47)
Comparing with Eq (36) we can write
Therefore mean-square strains (MSS) decrease linearly with averaging distance L This behavior is usually observed in the Warren-Averbach analysis Rothman and Cohen [115] showed that such be- havior would be expected of strains around disloca- tions Adler and Houska [116] Houska and Smith [117] and Rao and Houska [118] demonstrated for a number of materials that MSS can be repre- sented by a sum of two terms given by Cauchy and Gauss strain-broadened profiles
However for i3Dc=0 the MSS are independent ofL
(^2)12 ^ ^Dc(2g) cotg = ^ 2V2 V2TT
(49)
where the upper limit of strain e is defined as 7j4 (see Sec 212) This is a limiting case of pure- Gauss strain broadening described by de Keijser Mittemeijer and Rozendaal [107]
44 Discussion
To calculate domain sizes and strain it is neces- sary to define size and distortion integral-breadths angular order-dependence From Eq (43) It fol- lows that the domain size D )v is always indepen- dent of the order of reflection
)3sc = const JSSG = const
However from Eq (48) we find
^^ = const ^^ = const
(50)
(51)
An important consequence is that apparent strain TJ will be independent of angle of reflection only in the case of pure-Gauss strain broadening because 3DC and JSDG depend differently on the dif- fraction angle If we compare Eq (51) with the multiple-line Voigt-function analysis [26] given by Eqs (27) and (28) it is evident that they disagree Therefore recombination of constituent integral breadths 3DC and 3DO to Voigt strain-broadened in- tegral breadth Pdeg and the subsequent application of Eq (49) to calculate strain [26 119] will concur with the Fourier methods if strain broadening is entirely Gaussian and for the asymptotic value of MSS ((e^( 00))) However neither volume-weighted domain sizes D)y will agree although they are de- fined identically in both approaches because size- broadened and strain-broadened integral breadths are dependent variables
If at least two orders of reflection ( and +1) of the same plane (hkl) are available using Eqs (50) and (51) we can solve Eqs (33) and (34)
(52)
^^deg sl + l)-sil) ^^^^
^^=sHl + l)-sl) [fc( + l)-3c()3 (54)
^^=sl + l)-sl) [^(^ + ^)-^(0]- (55)
If we substitute these expressions into Eqs (35) and (36) we see that this approach leads exactly to the Warren-Averbach Eq (20) for two orders of reflections This is expected because the distortion coefficient is approximated with the exponential (47)] Delhez de Keijser and Mittemeijer [23] ar- gued that instead of Eq (20) the following rela- tion would be more accurate
A(L)=AXL) (1 -27r^(e^(L))LVd (56)
333
Volume 98 Number 3 May-June 1993
Journal of Research of the National Institute of Standards and Technology
These two approximations differ with fourth-order terms in the power-series expansion In terms of this approach Eq (48) has to be rewritten
2r ^^ l-exp(-2LI3DC-TTL^0DG) (57)
This means that even if the strain-broadened pro- file is given entirely by the Gauss function the MSS depend on distance L (see Fig 8) In this ap- proximation no simple relation for the distortion integral-breadths angular order-dependence exists For not so large L however Eq (51) holds and approximations from Eqs (20) and (56) do not dif- fer much (see Fig 8)
1500 Warren- Averbach approximation ^
Delhez de Kcijscr and ^^^ Minemeijer approximation ^y^
^ 1000 A
500
mdashI
1 1
Oc 300 600 IL k^) X 10^
90
o ^ 60 A
30
1
J Warren- Averbach approximation
Delhez de Keijser and Minemeijer approximation
0 0 150 300
1L (A-1 ) X 10^
Fig 8 Mean-square strains pound^(L)) for two approximations of the distortion coefficient (upper) Voigt strain broadening (lower) pure-Gauss strain broadening
Generally it was shown that in the size-broad- ened profile the Cauchy part must dominate No similar requirement for the strain-broadened pro- file exists However experience favors the assump- tion that it has to be more of Gauss-type The Warren-Averbach approach is exact if strain broad- ening is purely Gaussian so Eqs (20) and (48) are
better approximations as strain profile is closer to the Gauss function In any case both approaches given by Eqs (20) and (56) are good up to the third power in strain and the Warren-Averbach relation [Eq (20)] does not assume that MSS are independent of distance L [27] it also represents a harmonic approximation
If at least two orders of reflection from the same plane (hkl) are available we can use Eqs (52) (53) (54) and (55) to calculate size-related and strain-related integral breadths Subsequent appli- cation of Eqs (37) (43) and (48) gives directly domain sizes (D) and (D)v and mean-square strains (e^(L)) This approach is more straightfor- ward and much simpler than the original Warren- Averbach analysis Great care should be given to the possible systematic errors The easiest way to observe the hook effect is to plot column-length distribution functions as a function of averaging distance L If they show negative values for small L (see Fig 6) all derived parameters will be in error This is because (i) only the positive values of the column-length distribution functions are numeri- cally integrated or (ii) the intercept on the L-axis of the linear portion of the A^ vs L curve is taken (see Fig 4) always larger values of domain sizes will be obtained than by the application of Eqs (37) and (43) Therefore we conclude that the dis- crepancy between integral-breadth and Fourier methods is always present by the appearance of the hook effect in the A^ vs L curve An analogous discrepancy exists between integral-breadth and variance methods [119] In such cases correction methods for truncation can be applied [35 119 120] but the best procedure is to repeat the pat- tern fitting with the correct background
In the Fourier analysis it is usually observed that the mean-square strains diverge as the averaging distance L approaches zero This also follows from Eqs (48) and (57) However because the MSS de- pendence on distance L is not defined in Warren- Averbach analysis it was suggested [27 107 121] that local strain can be obtained by taking the sec- ond derivative of the distortion coefficient or by a Taylor-series expansion of local strain Therefore we obtain from Eq (36)
i^m-M^-^) (58)
It is evident that this relation is wrong It holds only for a special case of pure-Gauss strain-broad- ened profile when the MSS are equal for any L Otherwise if the Cauchy function contributes to
334
Volume 98 Number 3 May-June 1993
Journal of Research of the National Institute of Standards and Technology
strain broadening all derivatives of strain in L = 0 are infinite and local strain can not be defined If the main origin of strains is dislocations [115] strains are defined after some distance from the dislocation (cutoff radius) to be finite Averaging strains over a region smaller than the Burgers vector is probably not justified For instance Eq (48) gives even for a small averaging distance L = 1 A and considerable strain broadening (J3DG(20) = 3DC(20) = 1O) root-mean-square strain eL = 1A))^ laquo02 that is about the elastic limit
45 Random Errors of Derived Parameters
Errors in size and strain analysis of broadened peaks are relatively difficult to evaluate Following Langford [26] sources of the systematic errors in- clude choice of standard specimen background and type of analytical function used to describe the line profiles The first two errors should be mini- mized in the experimental procedure Errors caused by inadequate choice of specimen function would systematically affect all derived results but they can not be evaluated Random errors caused by counting statistics have been computed by Wilson [122 123 124] and applied to the Stokes deconvolution method by Delhez de Keijser and Mittemeijer [23] as well as by Langford [26] and de Keijser et al [76] using single-line Voigt-func- tion analysis Nevertheless the approximate error magnitude can be calculated from estimated stan- dard deviations (esd) of the parameters refined in the fitting procedure In the program SHADOW the weighted least-squares error is minimized
7wp mdash RES
Here
)=1
RES = 2 vfi [ (obs) - (cal)]
(59)
(60)
and weights are the reciprocal variances of the ob- servations
H = l(obs) (61)
Each line profile has four parameters varied inde- pendently position intensity and Cauchy and Gauss integral breadths of the Voigt profile In least-squares refinement esds are computed as
^^ bu RES (62) m mdashm
Here ba are diagonal elements of the inverse matrix of the equation coefficients m is the number of observations and m is the number of refined parameters The main source of errors is integral breadths Errors in peak position peak intensity and background are much smaller and can be ne- glected in this simple approach For two indepen- dent variables )3G and Pc covariance vanishes and from Eqs (37) and (38) for the two orders of re- flection and +1 it follows that
RD =
si+i)m)RHMi))+si)m+i)i^(3c(+D)
(63)
ReL)r) =
pHDRHPcG)) + m + miPcJl + D) 2[3c(+1) - i8c()3+TTL [m+1) - mw
-n-LmiDRHihd))+m+mWcH+i))i ^ 2[)3c(+1) - iSc()+TTLim+1) - mw
(65)
Here Rx) are relative standard deviations The error in D would be complicated to evaluate but because 131D)s^(Igt)vlt2(pound))s Eq (63) gives a good estimation for the error in (Z))v as well Alter- natively to see how errors depend on the Fourier coefficients errors can be estimated from the Warren-Averbach relationship [Eq (20)] (86) From Eq (32) it follows that
RA (L)) = ATr^Lpos)R^2d)) +
4Lph(s)RPci2e)) (66)
Errors in root-mean-square strains and domain sizes are
i^((e^(L ))bulllaquo) =
RHA(Ll))+RHA(Ll + l)) (67)
ALl + l)
335
Volume 98 Number 3 May-June 1993
Journal of Research of the National Institute of Standards and Technology
^^laquo^))=(T^)
s(l + 1)RHA (Ll)) +SV)RHA (Ll + D) lsl + l)-sl)f (68)
Here (D) is approximately defined with A^(L) = l-L(D)j Errors in Fourier coefficients increase with L while factors in Eqs (67) and (68) lower the errors for large L In general errors of domain sizes and strains are of the same order of magnitude as errors of integral breadths [86]
5 Application 51 Correction for Instrumental Broadening
Before specimen broadening is analyzed instru- mental broadening must be determined This is ac- complished by carefully measuring diffraction peaks of some well-annealed defect-free speci- men It is then assumed that its broadening may be attributed only to the instrument The usual proce- dure is to anneal the specimen However in some instances that is not possible because either the material undergoes an irreversible phase transition on annealing or the number of defects can not be successfully decreased by annealing Another pos- sibility is to measure the whole diffraction pattern of the material showing the minimal line broaden- ing and then to synthesize the instrumental profile at the needed diffraction angle This approach re- quires the modeling of the angle dependence of the instrumental (standard) parameters Cagliotti Pao- letti and Ricci [125] proposed the following func- tion to describe the variation of the full width at the half maximum of profile with the diffraction angle
F9miA^(2e) = Utan^9 + Vtand + W (69)
Although this function was derived for neutron dif- fraction it was confirmed to work well also in x-ray diffraction case [126 127] A more appropriate function for the x-ray angle-dispersive powder dif- fractometer based on theoretically predicted er- rors of some instrumental parameters [128] may be the following [129]
FWHNf (2 e) = W+Vsin^l 6 +
UtanH + UcotH (70)
This function may better model the increased axial divergency at low angles and correct for the speci- men transparency [129] However contrary to the requirement on the specimen function most im- portant for the instrumental function is to correctly describe the angular variation of parameters re- gardless of its theoretical foundation
When specimen broadening is modeled with a Voigt function the simplest way to correct for the instrumental broadening is by fitting the line pro- files with the Voigt function too Cauchy and Gauss integral breadths of the specimen-broad- ened profile are then easily computable by Eqs (7) and (8) However because the instrumental broad- ening is asymmetric [24] modeling with the sym- metric Voigt function can cause a fictitious error distribution resulting in errors of strain up to 35 [76] Another approach is to model the instrumen- tal-broadening angle dependence by fitting the profile shapes of a standard specimen with some asymmetrical function split-Pearson-VII [95] or pseudo-Voigt convoluted with the exponential function [105] The instrumental function can then be synthesized at any desired angle of diffraction and convoluted with the assumed specimen func- tion to match the observed profile by means of Eq (2)
In the program SHADOW instrumental para- meters are determined by fitting the split-Pearson VII function (see Fig 9) to line profiles of a standard specimen
iix)=m- 2 m
with
c =-
mc^f
mm) mv-rim-12)
(71)
(72)
Here m = 1 or m = ltraquo yields a Cauchy or Gauss function respectively Refined full widths at half maximum (FWHM) and shape factors m for both low-angle and high-angle sides of the profiles are fitted with second-order polynomials To fit the FWHM we used Eq (69) and for the shape fac- tors
m(2e) = U(20f + V(2e) + W (73)
The resulting coefficients U V W U V and W permit synthesis of the asymmetrical instrumental line profile at any desired angle
336
Volume 98 Number 3 May-June 1993
Journal of Research of the National Institute of Standards and Technology
2 0(deg)
le
Fig 9 A split-Pearson VII profile The two half profiles have same peak position and intensity Adapted from Howard and Preston [4]
The basic requirement on the standard specimen is however to show as small a line broadening as possible To minimize physical contributions to the Une broadening of the standard specimen a few moments were emphasized as follows Because dif- fraction-line width depends strongly on degree of annealing it is preferable to use some reference powder-diffraction standard Furthermore asym- metry in the peak profiles is introduced by axial divergence of the beam flat specimen surface and specimen transparency [24] Choosing a standard specimen with low absorption coefficient would cause transparency effects to dominate If the stud- ied specimen has a large absorption coefficient (compared to the standard) this might produce a fictitious size contribution and errors in micro- strains All of the specimens studied have absorp- tion coefficients exceeding 1000 cm^ so a NIST standard reference material 660 LaBe was chosen to model the instrumental broadening (p = 1098 cm) According to Fawcett et al [130] LaBe showed the narrowest lines of all studied com- pounds Furthermore LaB6_has a primitive cubic structure (space group Pm3m) resulting in rela- tively large number of peaks equally distributed over 26 This allows for better characterization and lower errors of FWHMs and shape factors of split- Pearson VII functions (Fig 10)
52 Applicability of the Method
To study the applicability of method described in Sec 4 we first studied simple cubic-structure mate- rials such as silver and tungsten Tungsten has very narrow line profiles allowing us to obtain the up- per limit of domain sizes that can be studied Silver is easily deformed which provides a possibility to apply the method to broad line profiles To test the
009
-a
OH
006
003
1 1 m low-angle side n m high-angle side
bullz w 2 o OH
X
tancopy
Fig 10 Refined FWHMs and shape factors (exponents) m for low-angle and high-angle sides of LaBe line profiles Second- order polynomials were fitted through points
case of relatively complicated patterns and weak line broadening the method was also applied to Lai85Sroi5Cu04 and La2Cu04 powders In this sec- tion only the mechanical aspects of the line broad- ening are discussed Discussion about the origins of broadening of superconductors can be found in Sec 6
521 Silver and Tungsten Powders Figure 11 shows observed and refined peaks of tungsten un- treated and silver ground powders In Table 2 are listed results of fitted pure-specimen Voigt profiles for silver and tungsten specimens Table 3 and Fig 12 give results of the line-broadening analysis Untreated tungsten powder shows relatively weak broadening Instrumental profile FWHMs at angle positions of (110) and (220) tungsten lines are 0059deg and 0081deg respectively close to values mea- sured for tungsten 0065deg and 0100deg Results in Table 3 reveal that small broadening is likely caused by domain sizes because microstrains have negligible value This pushes the limit for measur- able domain sizes probably up to 4500-5000 A However one must be aware that weak specimen broadening implies higher uncertainty of all derived parameters Moreover the choice of the instrumental standard becomes more crucial
Both silver and tungsten line profiles become more Cauchy-like after grinding which probably increases dislocation density in the crystallites This is consistent with the presumption that small crystallites and incoherently diffracting domains separated by dislocations within grains affect the tails of the diffraction-line profiles [60115] Figure 13 illustrates the dependence of MSS on the recip- rocal of the averaging distance L
337
Volume 98 Number 3 May-June 1993
Journal of Research of the National Institute of Standards and Technology
C8
z
7- ^95
29 (deg) 405
bullJf^r-
z S 08
Ez U o u OS
a
04 bull
o Es
4P
2000 z^fA
4000
B
z u f- z
425 435 445 29 (deg)
455
yr 600 SOO
L(A)
Fig 11 Observed points (pluses) refined pattern (full line) and difference pattern (below) (110) W untreated (upper) (200) Ag ground (lower)
Fig 12 Fourier coefficients for the first- (pluses) and second- order (crosses) reflection and size coefficients (circles) [111] Ag untreated (upper) [100] Ag ground (lower)
Table 2 Parameters of the pure-specimen Voigt function as obtained from profile-fitting procedure for tungsten and silver powders
Specimen hkl 2ft(deg) 3c(deg) 3G(deg) FWHM(deg) Rwp()
W untreated 110 220
4028 8705
00065(7) 00301(6)
0020(2) ltio-
0021 0019
90 44
W ground 110 220
4029 8705
0100(2) 0222(3)
0038(4) 0069(6)
0080 0166
90 42
Ag untreated 111 222 200 400
3806 8151 4425 9786
0056(1) 0105(4) 0118(2) 0274(21)
ltio- 00008(21)
ltio-^ ltio-5
0036 0067 0075 0175
105 97
105 122
Ag ground 111 222 200 400
3807 8151 4424 9783
0175(3) 0410(26) 0365(10) 1079(82)
0038(12) ltio-
0076(29) ltio-
0121 0261 0250 0687
99 145 99
145
338
Volume 98 Number 3 May-June 1993
Journal of Research of the National Institute of Standards and Technology
Table 3 Microstructural parameters for tungsten and silver powders
Specimen Direction (poundgt)raquo( A) (2))v(A) ltpound^(fl3))laquo (^laquoD)v2)gtw
W untreated [110] 3200(200) 3500(200) 000038 000008(2)
W ground [110] 620(20) 1030(30) 00023 000054(2)
Ag untreated [111] [100]
1000(20) 510(20)
2000(20) 1030(20)
00010 00022
000024(1) 000047(5)
Ag ground [111] [100]
380(20) 210(10)
650(20) 350(20)
00047 00100
000095(7) 000180(14)
100 -_ - [100) Ag ground ^ ^~ mdash C1111 Ag ground ^bull
y y
o y ^ 50 A y
y y
y
0
y - y ^--
c ) 50 100 150
lLfAjxlO^
Fig 13 Mean-square strains (E^) as a function of VL
Errors in integral breadths allow estimation of errors in strain and size parameters (Sec 45) but in some cases the refinement algorithm gives unre- liable errors of integral breadths When a particu- lar parameter is close to the limiting value (for instance 10^ degrees has been put as the mini- mum value for integral breadths) errors become large However in Eqs (63) (65) (66) (67) and (68) only the product of integral breadth and ac- companying error is significant which is roughly equal for Cauchy and Gauss parts Errors of do- main sizes and strains are of the same order of magnitude as errors of integral breadths
The possible source of systematic error is poten- tial inadequacy of Voigt function to accurately de- scribe specimen broadening This effect can not be evaluated analytically but it would affect all derived parameters especially the column-length distribution functions The logical relationship be- tween values of domain sizes (see Table 3) for dif- ferent degrees of broadening indicates that possible systematic errors can not be large
Equation (41) allows computation of volume- weighted and surface-weighted average domain sizes if respective column-length distribution func- tions can be obtained Figure 14 gives surface- weighted and volume-weighted average column- length distribution functions following Eqs (39) and (38) Width of the distribution function deter- mines the relative difference between (D) and (pound))v The broader the distribution the larger the differences because small crystallites contribute more to the surface-weighted average That is much more evident comparing the surface- weighted column-length distribution with the vol- ume-weighted If they have similar shape and maximum position as in Fig 15 differences are small Conversely if the surface-weighted distribu- tion function has a sharp maximum toward smaller sizes differences are larger (see Fig 14) The dif- ference between (poundgt)s and (D)v and the actual mean dimension of the crystallites in a particular direction also depends strongly on the average shape of the crystallites [52 131 132]
If experimental profiles are deconvoluted by the Stokes method even for considerable specimen broadening size coefficients A ^ usually oscillate at larger L values [59 106] preventing computation of the column-length distribution function Few techniques were used to deal with this problem successive convolution unfolding method [32 133] smoothing and iterative methods [134 135 136 137] Figures 14 and 15 show very smooth column- length distribution functions However they follow from size coefficients ^4^ that depend on the accu- racy of the approximation for the distortion coeffi- cient given by Eq (47) Equation (47) is exact if the strain distribution is Gaussian but in general holds only for small harmonic numbers n if strain broadening is not negligible
339
Volume 98 Number 3 May-June 1993
Journal of Research of the National Institute of Standards and Technology
500 1000 L(A)
Fig 14 Surface-weighted and volume-weighted column-length distribution functions normalized on unit area [111] Ag un- treated (upper) [100] Ag ground (lower)
Fig 15 Surface-weighted and volume-weighted column-length distribution functions for [010] La2Cu04 normalized on unit area
522 La2-xSrtCu04 Powders To test the applicability of the discussed method to more com- plicated patterns two compounds with lower crystallographic symmetry were studied Lai85Sroi5Cii04 has a tetragonal K2NiF4-type struc- ture space group lAlmmm La2Cu04 is orthorhom-
bic at room temperature Both compounds show slight line broadening and relatively highly overlap- ping peaks (see Fig 16) which makes it very diffi- cult if not impossible to perform a Stokes analysis
25
-25
26 (deg)
yNraquo-
Fig 16 Observed points (pluses) refined pattern (full line) convoluted profiles (dashed line) and difference plot (below) for part of La2Cu04 pattern
Tables 4 and 5 list results from the fitting proce- dure and the analysis of specimen-broadened inte- gral breadths There are no qualitative differences in results for tungsten and silver powders How- ever average errors are higher as expected be- cause of overlapping peaks while weighted errors wp are surprisingly smaller This fact illustrates the unreliability of iwp when only a segment of the pat- tern is being refined because it depends on the number of counts accumulated in points as well as on the 28 range of the refinement
Figures 17 and 18 represent Fourier coefficients of Lai85Sroi5Cu04 [110] and La2Cu04 [010] direc- tions In the second plot the A (L )-versus-L plot shows a concave-downward part near L =0 the so- called hook effect It was shown in Sec 42 that the hook effect originates because of underesti- mation of background connected with the trunca- tion of profiles In the profile refinement all peaks separated less than 4deg 20 have been included in the refinement region to avoid possible overlapping of peak tails and specimen profiles have been trun- cated below 01 of the maximum intensity How- ever because the polynomial background was determined prior to profile refinement it may be overestimated for complicated patterns containing many overlapping peaks If background is refined with other profile parameters undesirable correla- tion with integral breadths occurs
340
Volume 98 Number 3 May-June 1993
Journal of Research of the National Institute of Standards and Technology
Table 4 Parameters of the pure-specimen Voigt function as obtained from profile-fitting procedure for La2-^SrCu04 powders
Specimen hid 2Hdeg) Pen PcO FWHM(deg) Rp()
Lai85Sroi5Cu04 004 2695 0046(4) 0024(8) 0042 34 006 4092 0083(5) ltio-= 0053 62 110 3352 0110(5) ltio- 0070 125 220 7046 0171(9) ltio- 0109 43
La2Cu04 004 2713 0061(8) 0045(9) 0067 39 006 4119 0124(7) ltio-^ 0079 77 020 3316 0074(10) 0078(10) 0102 29 040 6957 0210(30) 0026(81) 0135 29 200 3345 0074(8) 0061(10) 0087 69 400 7028 0130(10) 0023(95) 0089 29
Table 5 Microstructural parameters for Laij(5Srai3Cu04 and La2Cu04 powders
Specimen Direction (DUA) Pgt(A) lte^(fl3))laquo lte2((Z)gt2))laquo
Lai83Sro5Cu04
La2Cu04
[001] [110]
[001] [010] [100]
1700(300) 470(20)
1100(100) 680(50) 680(50)
2000(200) 940(20)
1200(100) 760(50) 810(50)
00024 00017
00038 00033 00016
000049(9) 000044(6)
00008(1) 00007(2) 00003(3)
c i ^- raquo sect 08 bulli - U
^0
ti- bull ll bull bullbullo
ffl M P bull- u ^ Di 04 Si - M bulldiamsbullbull a bull-v 3 o ^^=s^
u ^N^Sraquoraquo^
0 ^^^aaaa 1000
L(A) 2000
OQ bullbulldego UM o z a 08
o o bull bull bull
- u u bull raquo UU bull
a diams o bull o u ft 04 bull deg raquo deg - U bull bull deg Oi bullbullgt =3 bull- l o k u
0 bullbullbullraquo aaaMMi
500 1000
L(A)
Fig 17 Fourier coefficients for the first- (pluses) and second- order (crosses) reflection and size coefficients (circles) for [110] Lai^Sroi5Cu04
Fig 18 Fourier coefficients for first- (pluses) and second- order (crosses) reflection and size coefficients (circles) for [010] La2Cu04
341
Volume 98 Number 3 May-June 1993
Journal of Research of the National Institute of Standards and Technology
S3 Comparison with the Integral-Breadth Methods
Knowing the specimen integral breadths simpli- fied methods can be applied In Sec 212 we re- viewed multiple-line and single-line integral- breadth methods We shall compare the simplified multiple-line methods [Eqs (23) (24) and (30)] and the single-line method [76] [Eqs (29) and (30)] with results obtained for silver tungsten and La2-xSrxCu04 powders (Tables 3 and 5) We did not compare with the multiple-line Voigt-function method [26] because it was shown in Sec 44 that it is incompatible with the Warren-Averbach analy- sis In Table 6 integral breadth Pi was computed according to Eq (11) This value was compared with )8A integral breadth computed from Fourier coefficients [58]
i8A=- laquo3 2^(L)
(74)
Results obtained by the Warren-Averbach analysis are significantly smaller for both size and strain Integral-breadth methods give the upper limit for strain so comparison is limited Considering the approximation e = 125e^(L))^ [138] with L=(D)v2 or L=(D)s2 strains resemble more closely than crystallite sizes It must be noted how- ever that this approximation makes sense only in the case of pure-Gauss strain broadening Benedetti et al [106] reported excellent agreement for both size and strain using Warren-Averbach and Cauchy-Gauss [Eq (24)] methods Results from Table 6 on the contrary indicate that the Gauss-Gauss approximation gives values closest to the Warren-Averbach method for crystallite sizes whereas the Cauchy-Gauss and especially the Cauchy-Cauchy approximation tend to give too large values For strain the trend is opposite The Cauchy-Cauchy approximation resembles most
Table 6 Comparison of results obtained with the integral-breadth methods Cauchy-Cauchy (C-C) Cauchy-Gauss (C-G) Gauss- Gauss (G-G) and single-line (S-L) analysis
Specimen hkl PiXKP PAXKP ltigt)v (Z)gt(A) (e^((DV2)gt2 eXlO^ (A-) (A-0 (A) C-C C-G G-G S-L xlO^ C-C C-G G-G S-L
W untreated 110 220
0259 0247
0259 0247
3500 3700 3810 3810 14500 4040
008 -001 -003 -005 024 0
W ground 110 220
125 204
125 205
1030 2240 1450 1220 940 550
054 090 093 105 045 032
Ag untreated 111 2
0600 0901
0600 0900
2000 3340 2390 2190 1670 1110
024 035 039 095 0 0
200 124 124 1030 2270 1470 1230 810 047 082 085 095 0 400 204 204 490 0
Ag ground 111 222
198 352
200 352
650 2080 1240 910 530 280
095 179 182 197 048 0
200 403 406 350 9380 4780 1320 260 180 405 405 408 082 400 803 803 120 0
Lai85Sroi3Cu04 004 006
0657 0881
0650 0880
2000 5230 3290 2660 1970 1140
049 076 078 088 044 0
110 119 119 940 1240 1000 970 840 044 052 064 080 0 220 158 158 630 0
La2Cu4 004 006
0988 132
0998 131
1200 2980 1940 1630 1490 760
08 107 112 127 081 0-
020 143 142 760 1200 910 860 1240 07 079 090 110 114 040 198 200 510 016 200 126 124 810 810 810 810 1250 03 002 011 015 089 400 1S 126 830 014
Not possible to evaluate because of too small Gauss integral breadth
342
Volume 98 Number 3 May-June 1993
Journal of Research of the National Institute of Standards and Technology
closely a Warren-Averbach method These results concur with the Klug and Alexander [24] compari- son of the published size and strain values obtained by Warren-Averbach (Stokes) and integral-breadth methods However for x-ray diffraction the Cauchy-Gauss assumption for the size-strain broadening is theoretically and experimentally more favored thpoundm the other two models The fact that the Gauss-Gauss method for crystallite size and the Cauchy-Cauchy method for strain give more realistic results may mean that the presump- tion that size and strain broadening are exclusively of one type is an oversimplification
The single-line method seems much less reliable If Gaussian breadth is very small no information about strain is obtained Moreover second-order reflections give much lower values of both size and strain than do basic reflections However if multi- ple reflections are not available the single-line method can give satisfactory estimations
54 Reliability of Profile Fitting
The profile fitting of a cluster of even severely overlapping peaks can be accomplished with a low error and excellent fit of total intensity But how reliable is information obtained about separate peaks in the cluster In the fitting procedure it is possible to put constraints on the particular profile parameter to limit intensity position and width of the peak If anisotropic broadening or different phases are present constraints may not be realistic Morever acceptable results can be obtained even using a different number of profiles in refinement [4] Hence the first condition for the successful ap- plication of this method is knowledge of actual phases present in the sample and their crystalline structures
In this regard two powders were measured or- thorhombic Lai94Sroo6Cu04 has a slightly distorted K2NiF4-type structure (space group Bmab a =53510(2) A b =53692 A(2) c = 131931(7) A) and tetragonal Lai76Sro24Cu04 (space group I4mmm a =37711(3) A c = 132580(8) A) Data were collected for each specimen separately and for a specimen obtained by mixing the same pow- ders Because diffracted intensity of each phase was lower for the mixture counting time was pro- portionally increased to obtain roughly the same counting statistics Figure 19 shows two partially separated orthorhombic (020) (200) and (040) (400) peaks overlapped with tetragonal (110) and (220) reflections During the profile fitting of the mixed powders (200) orthorhombic peak tended to disappear on account of neighboring (020) and
(110) reflections Its intensity was constrained to vary in range plusmn 30 of (020) peak intensity which can be justified if the crystallographic structure is known
60
-60
345
345
335 29 (deg)
345
Fig 19 (upper) Lai76Sro24Cu04 (110) peak (middle) Lai94Sroo6Cu04 (020) and (200) peaks (lower) (110) (020) and (200) peaks
Table 7 contains results of fitted specimen-Voigt functions as well as size and strain values obtained by the analysis of broadening Comparing integral breadths of the starting and mixed powders some profiles change from more Cauchy-like to Gauss- like and vice versa This is especially evident for the (400) reflection meaning that accurate deter- mination of the profile tails is indeed affected in the cluster of overlapping peaks However integral breadth does not change significantly so results of
343
Volume 98 Number 3 May-June 1993
Journal of Research of the National Institute of Standards and Technology
Table 7 Comparison between two specimens run separately and mixed togetlier
Specimen hkl 2Hdeg) )3cO PoO DUA) (D)v(A) (e2laquoD)v2))laquoxlO
Lai76Sroj4CuOr 110 3369 0058(6) 0094(7) 780(60) 850(60) 10(1) 220 7073 022(2) 013(2)
LaiMSro(KiCu04 020 3342 0084(9) 055(14) 500(90) 1000(200) 07(1) 040 7012 010(2) 014(1) 200 3353 00216(85) 0061(8) 1100(100) 1200(100) 03(1) 400 7040 0026(11) 0088(8)
Mix 110 3367 0083(21) 0064(14) 800(300) 1200(300) 08(3) Lai76Sro24Cu04 220 7072 019(7) 013(4)
+ 020 3343 0066(35) 0070(23) 800(300) 1000(300) 07(4) Lai94Sroo6Cu04 040 7012 0116(93) 013(5)
200 3354 0024(156) 0071(61) 900(700) 1000(600) 04(12) 400 7041 011(2) 0003(320)
the multiple-line methods are not much influenced On the contrary the single-line method gives quite different results This may support the conclusion of Suortti Ahtee and Unonius [43] that the Voigt function fails to account properly for size and strain broadening simultaneously if only Cauchy integral breadth determines crystallite size
Table 7 shows that the results of Warren- Averbach analysis of starting and mixed powders agree in the range of standard deviations How- ever errors are much larger especially for the hid- den (200)-(400) reflections From Eq (62) it follows that more counts (longer counting times) and more observables (smaller step-size) would lower standard deviations Therefore in the case of highly overlapping patterns to obtain desirable ac- curacy much longer measurements are needed al- though that will not change the fact that higher overlapping implies intrinsically higher errors of all refinable parameters To further minimize possible artifacts of the fitting procedure it is desirable to include in the analysis as many reflections in the same ciystallographic direction as possible
55 Remarks
By modeling the specimen size and strain broad- ening with the simple Voigt function it is possible to obtain domain sizes and strains that agree with experiment and show a logical interrelationship Furthermore the Voigt function shows the correct 1A(26y asymptotic behavior of peak tails as ex- pected from kinematical theory [139] However if the specimen profile is significantly asymmetric (because of twins and extrinsic stacking faults [140 59]) or the ratio FWHM^ is not intermediate to the Cauchy (2Tr) and Gauss (2(ln27r)^) functions then the Voigt function can not be applied [25]
Suortti Ahtee and Unonius [43] found good over- all agreement by fitting the Voigt function to the pure-specimen profiles of a Ni powder deconvo- luted by the instrumental function However more accurate comparison is limited because of unavoid- able deconvolution ripples of specimen profiles Furthermore the Voigt function might not be flex- ible enough to model a wide range of specimen broadening as well as the different causes of broadening Therefore the question whether the Voigt function can satisfactorily describe complex specimen broadening over the whole 20 range in a general case needs further evaluation
This method of Fourier analysis with the as- sumed profile-shape function is most useful in cases when the classical Stokes analysis fails there- fore when peak overlapping occurs and specimen broadening is comparable to instrumental broaden- ing It was shown that for a high degree of peak overlapping the fitting procedure can give unreli- able results of Gauss and Cauchy integral breadths that is the peak can change easily from predomi- nantly Cauchy-like to Gauss-like and contrary This can lead to illogical values of size-integral and strain-integral breadths according to Eqs (52) (53) (54) and (55) and to irregularities in the be- havior of Fourier coefficients for large L Simulta- neously if the size-broadened profile has a large Gauss-function contribution the hook effect will occur However volume-weighted domain sizes D)y and MSS eL)) for small L are much less affected because they rely on both Cauchy and Gauss parts of the broadened profile Any integral- breadth method that attempts to describe the size and strain broadening exclusively by a Cauchy or Gauss function in this case fails completely For specimens with lower crystallographic symmetry
344
Volume 98 Number 3 May-June 1993
Journal of Research of the National Institute of Standards and Technology
when many multiple-order reflections are avail- able but the peaks are overlapped it is therefore desirable to include in the analysis as many reflec- tions as possible to minimize the potential artifacts of the fltting process
6 Analysis of Superconductors 61 (La-M)2Cu04 Superconductors
Bednorz and Miiller [16] found the first high- temperature oxide superconductor in the La-Ba- Cu-O system Soon after substituting Ba with Sr and Ca Kishio et al [17] found superconductivity in two similar compounds Later many compounds with much higher transition temperatures (Tc) were found The (La-M)2Cu04 system remains favorable for study because the cation content responsible for the superconductivity is easier to control and measure than the oxygen stoichiometry Also this system provides a wide range of substitutional cation solubility in which the tetragonal K2NiF4- type structure is maintained Compared with much- studied Y-Ba-Cu-O this structure is simpler because it contains only one copper-ion site and two oxygen-ion sites
The undoped compound La2Cu04 is orthorhom- bic at room temperature It becomes superconduct- ing either with cation substitution on La sites or increased oxygen content to more than four atoms per formula unit Doping with divalent cations in- creases the itinerant hole carriers in the oxygen- derived electron band [141] which probably causes the superconductivity However different dopants influence the transition temperature Tc Although the unit-cell c-parameter simply reflects ionic dopant size [142] the in-plane unit-cell parameter (and accordingly the Cu-0 bond length) correlates with Tc for different dopants and for different dop- ing amounts [142 143]
LaiB5MouCu04 (M = Ba Ca Sr) have a tetrago- nal K2NiF4-type structure space group lAlmmm with four atoms in the asymmetric unit [117] One site is occupied with La partially substituted with dopant ions (Fig 20) La2Cu04 is orthorhombic at room temperature The best way to correlate these two structures is to describe La2Cu04 in space group Bmab the c axis remains the same tetrago- nal [110] and [110] directions become [010] and [100] orthorhombic axes and size of the unit cell is doubled [144]
Figure 21 shows parts of the x-ray diffraction patterns observed and refined of Lai85Moi5Cu04 (M = Sr Ba Ca) and La2Cu04 Refined lattice
parameters are given in Table 8 Table 9 shows resuhs of the line-broadening analysis Relatively
La(BaCaSr)
0(2)
0(1)
Fig 20 Ciystal structure of (La-M)2Cu04 showing one unit cell
300 JUU
(b)
200
100
U 0 M J Js-r-^
30
-30
300
40 41 42 43 44 45 40 41 42 43 44 45 29 (deg) 29 (deg)
mdashA-
gt t 200
Z
F-
- 100
(c)
f V kgt ii I 40 41 42 43 44 45 40 41 42 43 44 45
e (deg) ^^ 26 (deg)
-30 wwX mdash Wlaquo-
Fig 21 Diffraction patterns of LaiH5Moi5Cu04 specimens (a) M=Sr (b) M = Ba (c)M = Ca (d) M = U
345
Volume 98 Number 3 May-June 1993
Journal of Research of the National Institute of Standards and Technology
Table 8 Lattice parameters and T^ at zero resistivity (Ac method at 10 Ma current)
Specimen a (A) bk) c(A) rc(K)
Lairaquo5Sroi5Cu04 377814(7)
Lairaquo3Baoi3Cu04 37846(2)
LaiiijCaoi5Cu04 37863(7)
La2Cu04 53558(2) 54053(2)
231(2) 36
288(4) 28
17(2) 19
1451(8)
Table 9 Results of line-broadening analysis for (La-M)2Cu4 specimens
Specimen hkl PcO PoO (DUk) (Iraquo)(A) lte^((D)2))
Lai(laquoSroj5Cu04 004 006
0046(4) 0083(5)
0024(8) ltio-
1700(300) 2000(200) 000049(9)
110 0110(5) ltio- 470(20) 940(20) 000044(6) 220 0171(9) ltio-
Lai85Baoi3Cu04 004 006
0049(6) 0110(7)
0076(6) 0089(9)
1100(200) 1100(100) 00011(2)
110 0087(4) 000042(6) 560(20) 1110(20) 000024(5) 220 0116(3) ltio-5
Laiji5Caoi5Cu04 004 006
0120(13) 0146(12)
0032(22) 0033(27)
440(70) 780(90) 00007(4)
110 0045(25) 0200(19) 340(30) 360(20) 00013(2) 220 0343(22) ltio-
La2Cu04 004 006
0061(8) 0124(7)
0045(9) ltio-
1100(100) 1200(100) 00008(1)
020 0074(10) 0078(10) 680(50) 760(50) 00007(2) 040 0210(30) 0026(81) 200 0074(8) 0061(10) 680(50) 810(50) 00003(3) 400 0130(10) 0023(95)
weak peak broadening was observed which can not be attributed to the proximity of the phase trans- formation Lai85SroisCu04 is tetragonal down to = 170 K [145] Lai85Baoi5Cu04 to 140 K [146147] and Lai85Caoi5Cu04 to 130 K [148] Another possi- ble reason for peak broadening might be continu- ous compositional variations in dopant content The scanning Auger microprobe analysis of La2-SrtCu04 compounds [149] showed that grain- boundary segregation of Sr is weak and limited to a narrow region near the grain surface In the case of the separation of two phases with different Sr con- tent and similar lattice parameters asymmetry of some reflections would be observed [150] More- over in the case of compositional inhomogeneity microstrains eL)) would be roughly independent of the averaging distance L in the grains [151] therefore distribution of strains would be Gaus- sian For all specimens microstrain behavior is identical it decreases linearly with distance L
Rothman and Cohen [115] showed that such be- havior of microstrains is caused by dislocations that might arise during grinding Assuming the same applied stress microstrain would be approximately inversely proportional to the elastic moduli of these materials If mean microstrain is defined as the arithmetic average of strains for the [001] and [110] directions results agree with values of the Youngs moduli for polycrystalline La2Cu04 Lai85Moi5Cu04 (M = Sr Ba Ca) [152] However other factors may contribute to the microstrain Coordination-6 ionic radii of La^+ Sr Ba^+ Ca^+ are 106 116 136 100 A respectively [153] Substitution of La with ions of different sizes affects the lattice parameter [142] and may cause much larger strains in the [001] direction when some of the ions are replaced with Ba^ than with Sr^ in accord with results in Table 9 Substitution of Ca^^ ions produces an entirely different effect microstrains in the [110] direction are larger This may be explained by
346
Volume 98 Number 3 May-June 1993
Journal of Research of the National Institute of Standards and Technology
comparing effects of substitutional ions on the unit-cell a -parameter The Ba-doped specimen has a larger a-parameter than the Sr-doped but the Ca-doped a-parameter is largest although Ca^^ has the smallest ionic size This should increase the cell distortion in the a-b plane
Table 9 reveals high anisotropy in these materi- als consistent with other physical properties such as thermal expansion [154] and upper critical mag- netic field [155] Differences of domain sizes might arise from a layered structure in the [001] direction and consequently easy incorporation of stacking faults between regularly stacked layers The stack- ing-fault and twin-fault probabilities can be esti- mated from the average surface-weighted domain sizes [59]
^ = TAN + cf1fun(aa) (75) m im - (D)
Here c is a constant for the particular [hkl] direction and fun(a a) a linear combination of stacking-fault probability and twin-fault probability a The exact form of Eq (75) was derived only for the cubic and hexagonal crystal structures On con- dition that the true domain dimension D is isotropic or so large that the second term of Eq (75) dominates a linear function of stacking-fault and twin-fault probability is
fun(aa) = c( 1
) (76) Zgt)J (Dgttrade
Here c denotes a constant that depends only on geometrical factors and is the same for all three doped compounds
Figure 22 shows a possible correlation between Tc and fault-defect probabilities computed from TEM observations of La2-jcSrCu04 revealed that stacking-fault density increased with Sr content up to jc = 015 [156] That study suggests that a shear mechanism forming the fault-boundary dislocations implies oxygen vacancies andor cation deficiency We did not measure oxygen content but neutron- diffraction studies showed that oxygen deficiency starts to appear at much higher Sr content [157] However the increase of fault probability with the simultaneous decrease of microstrain in Fig 22 supports the assumption that defects are intro- duced to accommodate lattice strains [156] A simi- lar increase in Te was found in Y2Ba4Cu802o-laquo thin films [158] Compounds with asymmetric broad- ened and shifted peaks showed higher Tc which
was attributed to stacking faults Although extrinsic stacking faults may cause asymmetric peak broad- ening [140] it is probably caused by twinning Twinning in La-M-Cu-0 materials is less abundant than in Y-Ba-Cu-O compounds but it was ob- served in (La-Sr)2Cu04 monocrystals on (110) planes [159] In the profile-fitting procedure peak asymmetry is incorporated only in the instrumental function therefore we could not model asymmetric peak broadening However any significant asym- metry of the specimen profile would cause an un- even fit of low-angle and high-angle sides of peaks which was not observed This gives much more im- portance to stacking faults in Eq (76)
Fig 22 Arithmetic average of [110] and [001] root-mean- square strains and linear function of stacking-fault and twin- fault probabilities as a function of Tc
In Fig 22 average microstrains defined as the arithmetic average of [001] and [110] directions correlate inversely with Tc However we did not find a correlation of Tc and microstrains in a partic- ular direction [001] microstrains simply reflect dif- ference in size of dopant and host La^ ions (see Table 9)
In La2Cu04 (OkO) reflections are significantly broader than (hOO) This has also been observed in low-temperature orthorhombic Lai85Sroi5Cu04 and Lai85Baoi5Cu04 [160] and explained by either stacking faults or possible lower symmetry Our results reveal that domain sizes (D) have identical values for [010] and [100] directions (Table 9) From Eq (76) it follows that stacking-fault proba- bilities in these directions have the same values However microstrains in the [010] direction are roughly twice as large as in the [100] direction which is responsible for the different broadening In the case of doped La2Cu04 compounds different microstrains might be caused by oxygen
347
Volume 98 Number 3 May-June 1993
Journal of Research of the National Institute of Standards and Technology
vacancies ordered along one direction in the a-b plane similar to effects found in YBa2Cu307-laquo However undoped La2Cu04 is not expected to have significant o^Qgen deficiency Other possibili- ties are lower ciystallographic symmetry andor La vacancies although they were not reported for this system but La deficiency was found in an La2Co04 compound [161]
We can conclude that lattice strains and incoher- ently diffracting domain sizes confirm high an- isotropy in these materials This simple approach however does not allow unambiguous identifica- tion of the strains origin Probably the strains originate from dislocations and from different sizes of host and dopant ions Domain sizes of all com- pounds are larger in the c-direction than in the a-6 plane This indicates existence of stacking faults and twins However because estimated errors are relatively large and only three materials were stud- ied the possible connection between stacking faults and 7c needs further study
62 Bi-Cu-O Superconductors
Among the high-Tc superconductors the Bi- Cu-O compounds appear intriguing especially because their incommensurate structure modula- tion remains incompletely understood [162 163] The crystal structure consists of perovskite-like SrO-(Cu02Ca)mi-Cu02-SrO layers separated by NaCl-like BiO double layers (see Fig 23 [164]) The number m of Cu02 layers alters the supercon- ducting transition temperature Tc (for m = 12 and 3 rclaquo10 90 and 110 K respectively) This two- dimensional layered structure makes these materi- als highly anisotropic and favours the creation of defects
Bulk sintered specimens showed relatively weak peak broadening Moreover the diffraction pat- terns contained many overlapping peaks because the compound crystallizes in an orthorhombic low- symmetry space group A2aa [165] and incommen- surate modulation gives superlattice reflections All patterns revealed a strong [001] texture (Fig 24) making reflections other than (001) difficult to ana- lyze The lattice parameters vary depending on the exact compound stoichiometry and processing his- tory but characteristically they have almost identi- cal a and b parameters and large c parameter fl =54095 A 6=54202 A c =309297 A for Bi2Sr2CaCu208 (Bi-2212 [166] and A =5392 A b =5395 A c =36985 A for (BiPb)2Sr2Ca2Cu30io (BiPb-2223) [165] Thus we treated (hOO) and (0^0) reflections as single peaks Table 10 gives the
results for three specimens Bi-2212 (BiPb)2 (SrMg)2(BaCa)2Cu30io (BiPbMgBa-2223) which were one-phase specimens and BiPb-2223 con- taining approximately equal amounts of 2212 and 2223 phases The in-plane lattice parameters of 2212 and 2223 phases differ little hence only the [00] directions of the mixed-phase specimen were evaluated
b^ (c)
Fig 23 Average crystal structure of Bi2Sr2Cam-iCum04+2m for (a) m = 1 (b) w =2 (c) m =3 [164]
35
-35
42 44 46 48 50 52 54 56 58 60 62 26 (deg)
^ ^^^MK^Aa^Ndllaquop
Fig 24 Part of BiPbMgBa-2223 refined pattern There are 48 fundamental reflections in this region
Interpretation of the results in the case of these complicated compounds must be considered care- fully Microstrains are probably caused by disloca- tion arrays However substitution of different-sized ions and vacancies would also contribute to the strains as would other kinds of disorder especially
348
Volume 98 Number 3 May-June 1993
Journal of Research of the National Institute of Standards and Technology
Table 10 Results of line-btoadening analysis for Bi-Cu-O supreconductors
Specimen Phase hkl (A)
eD)sa)y^
Bi-2212 2212 008 0012
0163(8) 022(3)
001(6) 005(6)
420(80) 00021(6)
020+200 0104(4) ltio-^ 580(30) 00007(1) 040+400 018(2) 00004(6300)
BiPbMgBa-2223 7773 0010 0020
0097(1) 021(2)
00002(1700) 0007(150)
770(60) 00012(1)
020 + 200 012(27) 013(10) 380(430) 00009(71) 040 + 400 015(95) 021(33)
BiPb-73 2212 008 0012
023(2) 025(5)
0002(350) 0001(1000)
220(30) 00013(26)
2223 0010 0020
022(8) 023(99)
0092(67) 018(47)
230(190) 00012(197)
Stacking faults and twins Table 10 shows larger strains in the [001] direction that in the basal plane This can be explained by stacking disorder along the c-axis which was frequently observed in electron-diffraction patterns as streaking [167 168] Easy incorporation of stacking faults is possi- ble because of the two-dimensional weak-bonded layers (BiO double layers are spaced about 3 A apart) The difference in microstrain between in- plane and the c-direction is much smaller for the BiPbMgBa-2223 phase probably because Pb low- ers the faulting by stabilizing the higher-Tc 2223 phase [167] For the BiPb-2223 specimen with two phases there are two possibilities Either the speci- men consists mainly of a mk of two kinds of one- phase grains or both phases occur within the same grains The second possibility was confirmed exper- imentally [169 170] and our results concur be- cause microstrain in the 2212 phase is much smaller than in the one-phase Bi-2212 specimen Processing conditions and cation content probably favour development of the macroscopic inter- growth of both phases within the grains that is microscopic defects grow to sufficiently large re- gions to give a diffraction pattern of another phase with the different number of Cu02 layers As a re- sult strain is relieved and both strains and domain sizes being quite different in one-phase specimens tend to equalize
For the Bi-Cu-O specimens the mean surface- weighted domain sizes are generally smaller than for (La-M)2Cu04 compounds Therefore the com- putation of the stacking- and twin-fault probabili- ties by using Eq (75) may be wrong It would be very instructive to compare the different broaden-
ing of satellite and fundamental reflections which indicates a more pronounced stacking disorder in the modulated structure [171]
In summary we found that for both Bi-2212 and BiPbMgBa-2223 superconductors the c-axis strain exceeds the in-plane strain The BiPb-2223 specimen containing both 2212 and 2223 phases within the single grains shows smaller incoherently diffracting domains and lower c-axis strain than the one-phase specimens This fact may direct us to- ward the mechanism of the second-phase forma- tion in these materials
63 Remarks
It was shown that this particular method of the line-broadening analysis can give information about the size of incoherently diffracting domains and lattice strains in (La-M)2Cu04 and Bi-Clu-O superconductors Moreover results show high an- isotropy of both size and strain parameters as one may expect because of the layered structure of all superconducting cuprates Generally structural line broadening is not large that is a result of rela- tively large domain sizes (200-2000 A) and small strains (002-02) It is interesting to compare these values with the published results for YBa2Cu307-laquo (isotropic strains of 023 [77] and 005-03 [82]) Although the different materi- als were studied they seem too large especially be- cause they are the average of strains in different directions
The main drawback of the line-broadening the- ory is the uncertainty about the origins of the line broadening that is it is difficult to distinguish the main effects responsible for the broadening For
349
Volume 98 Number 3 May-June 1993
Journal of Research of the National Institute of Standards and Technology
the novel superconductors particularly the numer- ous defects (substitutions vacancies stacking faults dislocations and similar) can occur simulta- neously which makes it very difficult to determine their individual contributions Furthermore the crystal structures of most novel superconductors are relatively complicated The average structure has mostly a slightly distorted tetragonal symmetry very similar a and b lattice parameters and a large c parameter but c=36 for YBa2Cu307-laquo for in- stance This results in a large number of overlap- ping peaks and consequently in large errors of all results This showed especially in the case of Bi-Cu-O superconductors (see Table 10) Follow- ing the discussion of reliability of profile fitting in Sec 54 it would be desirable to include more than two reflections in the analysis of broadening but higher-order peaks are usually too weak and over- lapped One way to partially solve this problem would be a whole pattern fitting [172 173] and Rietveld structure refinement [23] in terms of size and strain parameters This requires an accurate preset function to model specimen broadening and precise definition of angular dependence of size and strain parameters The Rietveld programs that model the line broadening in terms of size and strain parameters are based either on the simpli- fied integral-breadth methods [78 95] or on the single-line method [174]
7 Conclusions
A method for analyzing the pure-specimen (structural) broadening of x-ray diffraction line profiles is proposed By modeling the specimen size and strain broadenings with the simple Voigt func- tion it is possible to obtain domain sizes and strains that agree with experiment and show a logi- cal interrelationship Furthermore some common consequences and problems in the Fourier-method analysis follow easily The specimen function is convoluted with the instrumental function to match the observed x-ray diffraction-line profile This avoids the Stokes deconvolution method thus al- lowing analysis of patterns with highly overlapping peaks and weak structural broadening Therefore the method was applied to some novel high-Tc superconductors We reached the following conclu- sions
(i) Surface-weighted domain size depends only on the Cauchy integral breadth of the size-broad- ened profile
(ii) The hook effect occurs when the Cauchy-content of the size-broadened profile is un-
derestimated that is for ^sc(n2)^3sG Usually this happens when the background is estimated too high so the long tails of the Cauchy function are prematurely cut off
(iii) It also follows from conclusion (ii) that the volume-weighted domain size can not be more than twice the surface-weighted domain size (limiting value D)v=2D)i is obtained for the pure-Cauchy size-broadened profile) Minimum value for D)J (D)j should not be less than -131
(iv) If the distortion coefficient is approxi- mated with a harmonic term this leads exactly to the Warren-Averbach method of separation of size and strain broadenings
(v) In that case mean-square strains decrease linearly with the distance L
(vi) It is possible to evaluate local strain ((e^(0))^) only in the case of pure-Gauss strain broadening Then root-mean-square strain is inde- pendent of the distance L and related to the upper limit of strain obtained from the integral breadth of the strain-broadened profile
(vii) If strain broadening is not described exclu- sively with the Gauss function the multiple-line Voigt integral breadth and Warren-Averbach analyses can not give the same results for volume- weighted domain size although D)v is defined identically in both approaches because the appar- ent strain -q = pdeg(29)cot9 is not angular- independent
(viii) Smooth size coefficients give column- length distribution functions without oscillations and make possible a computation of volume- weighted average domain sizes up to ~5000 A
(ix) Comparison with the simplified integral- breadth methods in most cases has shown not large but systematic discrepancy of results indicat- ing that size and strain broadening can not be accu- rately modeled by a single Cauchy or Gauss function Moreover the application of the single- line method is much less reliable and it should not be used where multiple reflections are available
(x) The knowledge of all phases present in the sample and their crystallographic structure is re- quired to successfully fit a cluster of overlapping peaks Although it is very difficult to accurately de- termine the Cauchy-Gauss ratio of an overlapped peak final results of domain size and strain are much less affected Therefore connecting the crys- tallite size exclusively with the Cauchy content and strain with the Gauss content of a specimen profile might be doubtful
(xi) Evaluated errors of domain sizes and strains increase substantially with the degree of
350
Volume 98 Number 3 May-June 1993
Journal of Research of the National Institute of Standards and Technology
peak overlapping Hence for complicated patterns very accurate measurements are necessary and one needs to analyze as many reflections in the same crystallographic direction as possible
(xii) Line-broadening analysis of (La-M)2Cu04 and Bi-Cu-O compounds confirms high anisotropy in these materials
(xiii) Strains in (La-M)2Cu04 probably origi- nate from dislocations and from different sizes of host and dopant ions
(xiv) Stacking-fault probability in (La-M)2Cu04 (M = Ba Ca Sr) increases with increasing Tc whereas the average strain decreases
(xv) In La2Cu04 different broadening of (lOO) and (OfcO) reflections is not caused by stacking faults
(xvi) All Bi-Cu-0 superconductors show larger strain in the c-direction than in the a-b plane which can be explained by stacking disorder along the [001] direction
(xvii) In the specimen with approximately equal amounts of Tl-2212 and TlPb-2223 phases it is likely that a secondary phase develops by the growth of the microscopic faulted regions of the primary phase
Acknowledgments
I am thankful to Dr Harry McHenry for his support and especially to Dr Hassel Ledbetter for his wise guidance and most useful help during my stay at NIST I am also indebted to my home insti- tution the Faculty of Metallurgy of the University of Zagreb for allowing me the leave of absence at NIST
8 References
[1] W Friedrich P Knipping and M v Laue Ann Physik 41 971 (1912)
[2] H M Rietveld Acta Cryst 22 151 (1967) [3] H M Rietveld J Appl Cryst 2 65 (1969) [4] S A Howard and K D Preston in Modern Powder Dif-
fraction Vol 20 The Mineralogical Society of America Washington DC (1989) p 217
[5] D Taupin J Appl Cryst 6 266 (1973) [6] T C Huang and W Parrish Appl Phys Lett 27 123
(1975) [7] M K Wu J R Ashburn C J Torng P H Hor R L
Meng L Gao Z J Hwang Y Q Wang and C W Chu Phys Rev Lett 58 908 (1987)
[8] D Shi MRS Bull 16 37 (1991) [9] D Larbalestier Phys Today 44 74 (1991)
[10] J C Phillips Phys Rev B 4512647 (1992) [11] B Raveau Phys Today 45 53 (1992) [12] A J Millis and K M Rabe Phys Rev B 38 8908 (1988)
[13] F Guinea Europhys Lett 7 549 (1988) [14] C P Dhard and P Singh in Proc Int Symp High-Temp
Supercond Jaipur India Oxford amp IBH Publishing New Delhi (1988) p 271
[15] J D Jorgensen Phys Today 44 34 (1991) [16] J G Bednorz and K A Muller Z Phys B 64 189
(1986) [17] K Kishio K Kitazawa S Kaube I Yasuda N Sugii H
Takagi S Uchida K Fueki and S Tanaka Chem Lett 429 (1987)
[18] J D Jorgensen B Dabrowski S Pei D G Hinks L Soderholm B Morosin J E Venturini and D S Ginley Phys Rev B 38 11337 (1988)
[19] J R Clem Phys Rev B 43 7837 (1991) [20] M Paranthaman M Foldejiki D Balzar H Ledbetter
A J Nelson and A M Hermann submitted to Phys Rev B
[21] A R Stokes Proc Phys Soc Lond 61 382 (1948) [22] B E Warren and B L Averbach J Appl Phys 23 497
(1952) [23] R Delhez Th H de Keijser and E J Mittemeijer in
Accuracy in Powder Diffraction S Block and C R Hub- bard eds Natl Bur Stand (US) Special Publication 567 (1980) p 213
[24] H P Klug and L E Alexander X-ray Diffraction Proce- dures 2nd Edition John Wiley New York (1974) p 661
[25] J I Langford J Appl Ciyst 11 10 (1978) [26] J I Langford in Accuracy in Powder Diffraction S
Block and C R Hubbard eds Natl Bur Stand (US) Special Pubication 567 (1950) p 255
[27] R Delhez Th H de Keijser and E J Mittemeijer Fre- senius Z Anal Chem 312 1 (1982)
[28] A J C Wilson Proc Phys Soc Lond 80 286 (1962) [29] A J C Wilson Proc Phys Soc Lond 81 41 (1963) [30] L P Smith Phys Rev 46 343 (1934) [31] H C Burger and P H van Cittert Z Phys 79 722
(1932) [32] S Ergun J Appl Ciyst 1 19 (1968) [33] R Croche and L Gatineau J Appl Ciyst 10479 (1977) [34] L H Schwarz and J B Cohen Diffraction from Materi-
als Academic Press New York (1977) p 391 [35] R Delhez Th H de Keijser E J Mittemeijer and J I
Langford J Appl Cryst 19 459 (1986) [36] R Delhez Th H de Keijser E J Mittemeijer and J I
Langford Aust J Phys 41 213 (1988) [37] R A Young and D B Wiles J Appl Cryst 15 430
(1982) [38] W Voigt Stizungsber K Bayer Akad Wiss 42 603
(1912) [39] E E Whiting J Quant Spectrosc Radiat Transfer 8
1379 (1968) [40] G K Wertheim M A Butler K W West and D N E
Buchanan Rev Sci Instrum 111369 (1974) [41] M M Hall Jr V G Veeraraghavan H Rubin and P G
Winchell J Appl Cryst 10 66 (1977) [42] A Brown and J W Edmonds Adv X-Ray Anal 23 361
(1980) [43] P Suortti M Ahtee L Unonius J Appl Cryst 12 365
(1979) [44] T Sundius J Raman Spectrosc 1 471 (1973) [45] B H Armstrong J Quant Spectrosc Radiat Transfer 7
61 (1967) [46] J F Kielkopf J Opt Soc Am 63 987 (1973) [47] B P Asthana and W Kiefer Appl Spectr 36 250
(1982)
351
Volume 98 Number 3 May-June 1993
Journal of Research of the National Institute of Standards and Technology
[48] J P M de Vreede S C Mehrotra A Tal and H A Dijkerraan Appl Spectr 36 227 (1982)
[49] F R L Schoening Ada Ciyst 18 975 (1965) [50] P Scherrer Gott Nachr 2 98 (1918) [51] A R Stokes and A J C Wilson Proc Cambridge
Philos Soc 38 313 (1942) [52] A J C Wilson X-Ray Optics 2nd edition Methuen
London (1962) [53] S Leie and T R Anantharaman Proc Indian Acad
Sci Sect A H 261 (1966) [54] D Louer D Weigel and J I Langford J Appl Ciyst
5 353 (1972) [55] A J C Wilson J Appl Ciyst 2 181 (1969) [56] J I Langford and A J C Wilson J Appl Ciyst 11102
(1978) [57] A R Stokes and A J C Wilson Proc Phys Soc Lond
56174 (1944) [58] B E Warren and B L Averbach J Appl Phys 21 595
(1950) [59] B E Warren X-Ray Diffraction Addison-Wesley
Reading Massachusetts (1969) p 264 [60] B E Warren in Progress in Metal Physics Vol 8 Perg-
amon Press London (1959) p 146 [61] F Bertaut C R Acad Sci Paris 228 187 (1949) [62] N C Haider and C N J Wagner Acta Cryst 20 312
(1966) [63] D Balzar and H Ledbetter in Proceedings of the Accu-
racy in Powder Diffraction II Natl Inst Stand Technol (1992) p 37
[64] D Balzar and H Ledbeter J Appl Cryst 26 (1993) in press
[65] J N Eastabrook and A J C Wilson Proc Phys Soc Lond B 65 67 (1952)
[66] R S Smith IBM J Res Develop 4 205 (1960) [67] B Y Pines and A F Sirenko Soviet Physics Ciyst 715
(1962) [68] G B Mitra and N K Misra Acta Ciyst 22 454 (1967) [69] A Gangulee J Appl Ciyst 7 434 (1974) [70] J Mignot D Rondot Acta Met 231321 (1975) [71] J Mignot and D Rondot Acta Ciyst A 33 327 (1977) [72] R K Nandi H K Kuo W Schlosberg G Wissler J B
Cohen and B Crist Jr J Appl Ciyst 17 22 (1984) [73] M Zocchi Acta Ciyst A 36164 (1980) [74] P Ramarao and T R Anantharaman Trans Ind Ins
Metals 18 181 (1965) [75] R K Nandi and S P Sen Gupta J App Cryst 11 6
(1978) [76] Th H de Keijser J I Langford E J Mittemeijer and
B P Vogels J Appl Ciyst IS 308 (1982) [77] A Williams G H Kwei R B Von Dreele A C Lar-
son L D Raistrick and D L Bish Phys Rev B 37 7960 (1988)
[78] A C Larson and R B Von Dreele Los Alamos Na- tional Laboratory Report No LA-UR-86-748 (1988)
[79] J D Jorgensen D H Johnson M H Mueller J G Worlton and R B Von Dreele in Proceedings of the Conference on Diffraction Profile Analysis Cracow Poland (1978) p 20
[80] R B Von Dreele J D Jorgensen and C G Windsor J Appl Ciyst 15 581 (1982)
[81] P Thompson D E Cox and J B Hastings J Appl Ciyst 20 79 (1987)
[82] J P Singh R A Guttschow D S Kupperman J T Dusek and R B Poeppel in High Temperature Super-
conducting Compounds III S Whang A Gupta and E Ceilings eds TMS AIME Warrendale (1991) p 281
[83] M O Eatough D S Glnley and B Morosin Adv X- Ray Anal 33 145 (1990)
[84] E J Peterson P J Kung R E Muenchausen and D M Smith in Proceedings of the 41st Annual Denver Conference on Applications of X-Ray Analysis Colo- rado Springs Colorado (1992) p 74
[85] M Rand J I Langford and J S Abell submitted to J Cryogenics (1992)
[86] D Balzar J Appl Ciyst 25 559 (1992) [87] D Balzar H Ledbetter and A Roshko Physica C 185-
189 871 (1991) [88] D Balzar and H Ledbetter J Mater Sci Lett 111419
(1992) [89] D Balzar H Ledbetter and A Roshko Pow Diffr 8
(1993) in press [90] S Johnson M Gusraan D Rowcliffe T Geballe and J
Sun Adv Ceram Mater 2 337 (1987) [91] H Ledbetter S A Kim R B Goldfarb and K Togano
Phys Rev B 39 9689 (1989) [92] H Friedman Electronics 132 (1945) [93] W Parrish (ed) in Advances in X-Ray Diffractometry
and X-Ray Spectrography Centrex Publishing Company Eindhoven The Netheriands (1962)
[94] W Soller Phys Rev 24158 (1924) [95] S A Howard R L Snyder J Appl Ciyst 22 238
(1989) [96] G H Stout and L H Jensen X-Ray Structure Determi-
nation 2nd edition Wiley New York (1989) p 373 [97] D E Appleman and T Evans Jr Final Report 92-14
US Geological Survey Washington DC (1973) Avail- able as NTIS Document No PB-216188
[98] M U Cohen Rev Sci Instrum 6 68 (1935) [99] M U Cohen Rev Sci Instrum 7 155 (1936) [100] M H Mueller L Heaton and K T Miller Acta Ciyst
13 828 (1960) [101] R A Young P E Mackie and R B Von Dreele J
Appl Ciyst 10 262 (1977) [102] D B Wiles and R A Young J Appl Cryst 14 149
(1981) [103] J K Yau and S A Howard J Appl Ciyst 22 244
(1989) [104] S A Howard J K Yau and H U Anderson J Appl
Phys 65 1492 (1989) [105] S Enzo G Fagherazzi A Benedetti and S Poilizzi J
Appl Ciyst 21 536 (1988) [106] A Benedetti G Fagherazzi S Enzo and M
Battagliarin J Appl Cryst 21 543 (1988) [107] Th H de Keijser E J Mittemeijer and H C F Rozen-
daal J Appl Ciyst 16 309 (1983) [108] Y Zhang J M Stewart C R Hubbard and B Mo-
rosin Adv X-Ray Anal 33 373 (1990) [109] Y Wang S Lee and Y Ue J Appl Ciyst IS 35
(1982) [110] V N Selivanov and E F Smislov Zavod Lab 57 28
(1991) [Ill] A Guinier X-Ray Diffraction W H Freeman San
Francisco (1963) p 139 [112] M Wilkens J Appl Cryst 12119 (1979) [113] D Du and Y Wang Pow Diffr 2180 (1987) [114] A P Prudnikov Yu A Brychkov and O L Marichev
Integrals and Series Vol 1 Gordon and Breach Am- sterdam The Netheriands (1986) p 344
352
Volume 98 Number 3 May-June 1993
Journal of Research of the National Institute of Standards and Technology
[115] R L Rothman and J B Cohen J Appl Phys 42 971 (1971)
[116] T Adier and C R Houska J Appl Phys 50 3282 (1979)
[117] C R Houska and T M Smith J Appl Phys 52 748 (1981)
[118] S Rao and C R Houska Acta Ciyst A 4214 (1986) [119] J I Langford R Delhez Th H de Keijser and E J
Mittemeijer Ausi J Phys 41173 (1988) [120] J I Langfoid J Appl Cryst IS 315 (1982) [121] M J Turunen Th H de Keijser R Delhez and N M
van der Pers J Appl Ciyst 16176 (1983) [122] A J C Wilson Acta Ciyst 23 888 (1967) [123] A J C Wilson Acta Ciyst A 24 478 (1968) [124] A J C Wilson Acta Ciyst A 25 584 (1969) [125] G Gagliotti A Paoletti and F P Ricci Nucl Instrum
3 223 (1958) [126] J I Langford R J Cernik and D Louer J Appl
Ciyst 24 913 (1991) [127] J I Langford in Accuracy in Powder Diffraction II
preprint [128] A J C Wilson Mathematical Theory of X-Ray Powder
Diffractometiy Centrex Eindhoven The Netherlands (1963)
[129] J L Langford Prog Ciyst Growth and Charact 14185 (1987)
[130] T G Fawcett C E Crowder S J Brownell Y Zhang C R Hubbard W Schreiner G P Hamill T C Huang E Sabino J I Langford R Hamilton and D Louer Pow Diffr 3 209 (1988)
[131] W L Smith J Appl Ciyst 9187 (1976) [132] J L Langford and D Louer J Appl Ciyst 15 20
(1982) [133] Fl Popescu and L Benes Acta Ciyst A 33 323 (1977) [134] P PSuse^cu R MSnaila M Popescu and E Jijovici j
Appl Cryst 7 281 (1974) [135] P F Bley Y Calvayrac and M Fayard J Appl Ciyst
7 493 (1974) [136] B Moraweck Ph de Montgolfier and A J Renouprez
J Appl Ciyst 10191 (1977) [137] A Le Bail and D Louer J Appl Cryst 11 50 (1978) [138] D R Buchanan R L McCuUough and R L Miller
Acta Ciyst 20 922 (1966) [139] P Suortti and L D Jennings Acta Cryst A 33 1012
(1977) [140] J B Cohen and C N J Wagner J Appl Phys 33 2073
(1962) [141] A Bianconi J Budnick A M Flank A Fontaine P
Lagarde A Marcelli H Tolentino B Chamberland C Michel B Raveau and G Demazeau Phys Lett A127 285 (1988)
[142] K Fueki K Kitazawa K Kishio T Hasegawa S Uchida H Takagi and S Tanaka in Chemistiy of High- Temperature Superconductors D L Nelson M S Whittingham and T F George eds American Chemi- cal Society (1987) p 38
[143] T Fujita Y Aoki Y Maeno J Sakurai H Fukuba and H Fujii J Appl Phys 26 U68 (1987)
[144] R M Hazen in Physical Properties of High-rc Super- conductors Vol 2 D M Ginsberg ed World Scien- tific Singapore (1990) p 121
[145] J B Torrance A Bezinge A I Nazzal T C Huang S P Parkin D T Keane S J LaPlaca P M Horn and G A Held Phys Rev B 40 8872 (1989)
[146] J D Axe A H Moudden D Hohlwein D E Cox K
M Mohanty A R Moodenbaugh and Y Xu Phys Rev Lett 62 2751 (1989)
[147] T Suzuki and T Fujita Physica C 159 111 (1989) [148] T Fujita and Y Maeno in Superconducting Materials
JJAP Series 1 (1988) p 34 [149] A Roshko and Y-M Chiang J Appl Phys 66 3710
(1989) [150] D E Cox S C Moss R L Meng P H Hor and C W
Chu J Mater Res 31327 (1988) [151] B Crist and J B Cohen J Polym Sci 17 1001 (1979) [152] H Ledbetter S Kim and A Roshko Z Phys B 89275
(1992) [153] R D Shannon and C T Prewitt Acta Ciyst B 25 925
(1969) [154] M Lang H Spille F Steglich Y Hidaka T Murakami
and Y Endoh Physica C 162-1641037 (1989) [155] Y Hidaka and T Murakami Phase trans 15 241
(1989) [156] P L Gai and E M McCarron Science 247 553 (1990) [157] T Kamiyama I Izumi H Asano H Takagi S Uchida
Y Tokura E Takayama-Muromachi M Matsuda K Yamada Y Endoh and Y Hidaka Physica C 172 120 (1990)
[158] A Kapitulnik Physica C 153-155 520 (1988) [159] L A Muradyan V N Molchanov R A Tamazyan and
V I Simonov Physica C 162-164 536 (1989) [160] P Day M Rosseinsky K Prassides W I F David O
Moze and A Soper J Phys C 20 L429 (1987) [161] J T Lewandowski R A Beyerlein J M Longo and R
A McCauley J Amer Ceram Soc 69 699 (1986) [162] R Ramesh G van Tendeloo G Thomas S M Green
Y Mei C Jiang and H L Luo Appl Phys Lett 53 2220 (1988)
[163] J Schneck L Pierre J C Tolddano and C Daguet Phys Rev B 39 9624 (1989)
[164] O Eibl Physica C 168 215 (1990) [165] W Carrilo-Cabrera and W Gopel Physica C 161 373
(1989) [166] P Bordet J J Capponi C Chaillout J Chenavas A
W Hewat E A Hewat J L Hodeau M Marezio J L Tholence and D Tranqui Physica C 156189 (1988)
[167] R Ramesh K Remschnig J M Tarascon and S M Green J Mater Res 6 278 (1991)
[168] Z Hiroi Y Ikeda M Takano and Y Bando J Mater Res 6 435 (1991)
[169] Y Inoue M Hasegawa Y Shichi I Munakata M Ya- manaka S Hiyama and O Nittono J Mater Res 5 737 (1990)
[170] R Ramesh B G Bagley J M Tarascon S M Green M L Rudee and H L Luo J Appl Phys 67 379 (1990)
[171] X B Kan J Kulik P C Chow S C Moss Y F Yan J H Wang and Z X Zhao J Mater Res 5 731 (1990)
[172] G S Pawley J Appl Ciyst 13 630 (1980) [173] H Toraya J Appl Ciyst 19 440 (1986) [174] L Lutterotti and P Scardi J Appl Ciyst 23 246
(1990)
About the author Davor Balzar is with Faculty of Metallurgy of the University of Zagreb Sisak Croatia and was a Guest Researcher at fflST The National Institute of Standards and Technology is an agency of the Technology Administration US Department of Commerce
353
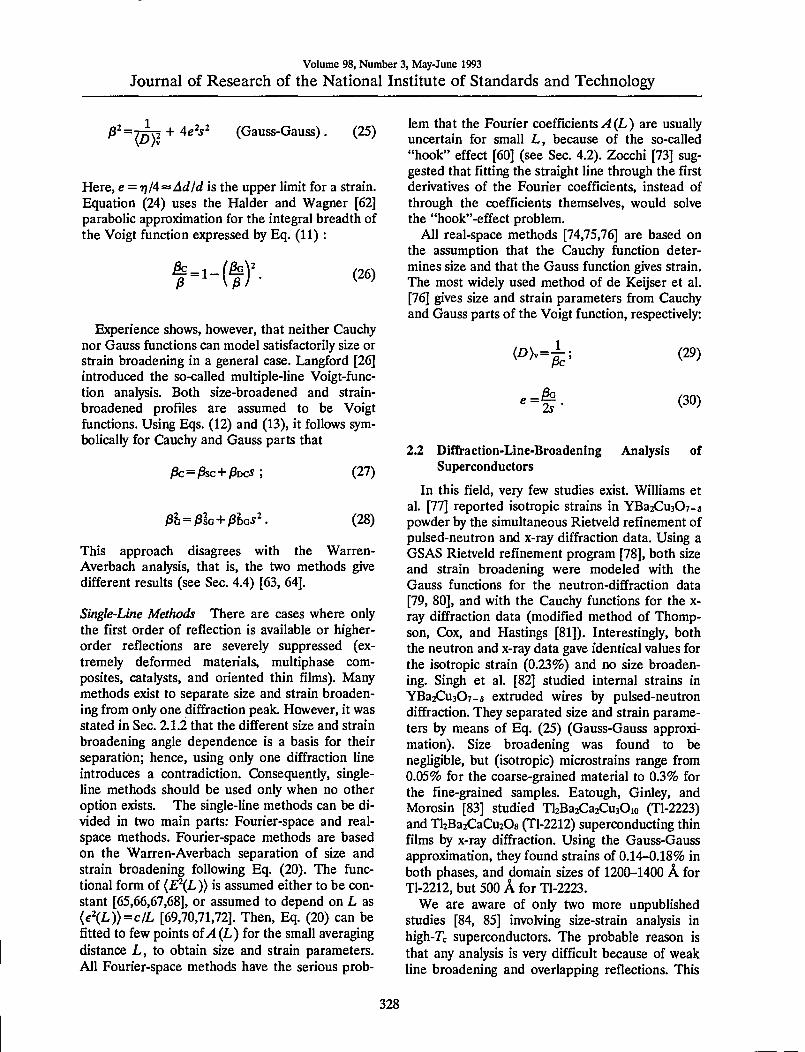
Volume 98 Number 3 May-June 1993
Journal of Research of the National Institute of Standards and Technology
precludes application of reliable analysis such as the Stokes deconvolution method with the Warren- Averbach analysis of the broadening Instead sim- ple integral-breadth methods are used which gives generally different results for each approach Moreover for x-ray diffraction broadening appli- cation of the Gauss-Gauss approximation does not have any theoretical merit although reasonable values especially of domain sizes may be obtained [86] We showed [878889] that reliable diffrac- tion-line-broadening analysis of superconductors can be accomplished and valuable information about anisotropic strains and incoherently diffract- ing domain sizes obtained
3 Experiment 31 Materials
The materials used for this study were tungsten and silver commercially available powders with nominal grain sizes 4-12 ijim La2-xSriCu04(jc = 0 006 015 024) powders Lai^Moi5Cu04(M = Ca Ba) powders Bi2Sr2CaCu208 (Bi-2212) sinter (BiPb)2Sr2Ca2Cu30io(BiPb-2223) sinter and (BiPb)2(SrMg)2(BaCa)2Cu30io (BiPbMgBa-2223) sinter
Powders with nominal compositions La2-xSrCuO4(c=0 006 015 024) and Laig5Moi5Cu04(M = Ca Ba) were prepared at the National Institute of Standards and Technology Boulder Colorado by A Roshko using a freeze- drying acetate process [90] Acetates of the various cations were assayed by mass by calcining to the corresponding oxide or carbonate The appropriate masses of the acetates for the desired compositions were dissolved in deionized water The acetate so- lutions were then sprayed through a fine nozzle into liquid nitrogen to preserve the homogeneous cation distributions Frozen particles were trans- ferred to crystallization dishes and dried in a com- mercial freeze dryer to a final temperature of 100 degC After drying the powders except the Lai^Baoi5Cu04 were calcined in alumina (998) crucibles at 675 C for 1 h in a box furnace with the door slightly open to increase ventilation Because BaCOs is difficult to decompose the Laig5Baoi5Cu04 was calcined under a vacuum of 2 Pa at 800 C for 4 h then cooled slowly in flowing oxygen (2degCmin) The calcined powders were oxidized in platinum-lined alumina boats in a tube furnace with flowing oj^gen at 700 degC After 3 h at 700 C the powders were pushed to a cold end of the furnace tube where they cooled quickly (20 Cs) while still in flowing oxygen
The cylindrical specimens (23 mm in diameter and 9 mm thick) of Bi-2212 BiPb-2223 and BiPbMgBa-2223 were prepared at the National Research Institute for Metals Tsukuba Japan by K Togano [91] Starting oxides and carbonates were Pb304 61203 CuO SrCOs MgCOs and BaC03 They were calcinated in air at 800 C for 12 h Powders were then pressed and sintered in 8 oxygen-92 argon mixture at 835 degC for 83 h Specimens were furnace cooled to 750 degC held for 3 h in flowing oxygen and then furnace cooled in ojygen to room temperature
311 Preparation of Specimens for X-ray Diffraction The bulk specimens were surface polished if necessary and mounted in specimen holders Coarse-grained powders of La2-cSrxCu04 (x=Q 006 015 024) and Lai8sMoi5Cu04 (M = Ca Ba) were ground with a mortar and pestle in toluene and passed through a 635-mesh sieve (20-|xm nominal opening size) Silver and tungsten powders were dry ground with a mortar and pestle All powders were mixed with about 30 silicone grease and loaded into rectangular cavities or slur- ried with amyl acetate on a zero-background quartz substrate
32 Measurements
X-ray-diffraction data were collected using a standard two-circle powder goniometer in Bragg- Brentano parafocusing geometry [92 93] (see Fig 5) A flat sample is irradiated at some angle incident to its surface and diffraction occurs only from crystallographic planes parallel to the speci- men surface The goniometer had a vertical 0-26 axis and 22 cm radius CnKa radiation ex- cited at 45 kV and 40 mA was collimated with Seller slits [94] and a 2 mm divergence slit SoUer slits in the diffracted beam 02 mm receiving slit and Ge solid-state detector were used in a step- scanning mode (OOI7IO s for a standard specimen 002deg-005730-80 s for other specimens depending on the amount of broadening)
33 Data Analysis
The diffractometer was controlled by a com- puter and all measurements were stored on hard disc Data were transferred to a personal computer for processing
We used computer programs for most calcula- tions X-ray diffraction patterns were fitted with the program SHADOW [95] This program allows a choice of the fitting function and gives refined positions of the peak maximums intensities and function-dependent parameters It also has the
329
Volume 98 Number 3 May-June 1993
Journal of Research of the National Institute of Standards and Technology
Seller Slits
Source S
Specimen
Fig 5 Optical arrangement of an x-ray diffractometer Adapted from Klug and Alexander [24]
ability to convolute the predefined instrumental profile with the specimen function to match the ob- served pattern Choice of the specimen function in- cludes Gauss and Cauchy functions We added the ability to model the specimen broadening with an exact Voigt function and implemented SHADOW on a personal computer In the fitting procedure for every peak in the pattern the program first gen- erates the instrumental profile at the required dif- fraction angle The instrumental profile is deter- mined from prior measurements on a well-annealed standard specimen (see Sec 51) Then it assumes parameters of the specimen profile For an exact Voigt function parameters are peak position peak intensity and Cauchy and Gauss integral breadths of the Voigt function By convoluting the instru- mental profile with the specimen profile and adding a background the calculated pattern is ob- tained [Eq (2)] Parameters of the specimen profile are varied until the weighted least-squares error of calculated and observed patterns Eq (59) reaches a minimum This process avoids the unstable Stokes deconvolution method It is possible that the refine- ment algorithm is being trapped in a false minimum [96] but it can be corrected by constraining some parameters Refined parameters of the pure-speci- men profile are input for the size-strain analysis of the broadening A program for this analysis was written in Fortran
Lattice parameters of powder specimens were calculated by the program NBSLSQ85 based on the method of Appleman and Evans [97] A pro- gram in Fortran was written to apply corrections to observed peak maximums by using NIST standard reference material 660 LaB6 as an external stan-
dard Lattice parameters of bulk specimens were determined by the Fortran program which uses a modified Cohens method [9899100] to correct for systematic diffractometer errors Lattice parame- ters were also calculated by the Rietveld refinement programs GSAS [78] and DBW32S [101 102]
4 Methodology
When instrumental and specimen contributions to the observed line profile must be modeled sepa- rately adopting a specimen function is a critical step Yau and Howard [103104] used Cauchy and Enzo et al [105] pseudo-Voigt functions Benedetti Fagherazzi Enzo and Battagliarin [106] showed that modeling the specimen function with the pseudo-Voigt function gives results comparable to those of the Stokes deconvolution method when combined with the Warren-Averbach analysis of Fourier coefficients De Keijser Mittemeijer and Rozendaal [107] analytically derived domain sizes and root-mean-square strains for small averaging distance L in the case of the Voigt and related func- tions
The aim here is to study more thoroughly the consequences of assumed Voigt specimen function on the size-strain analysis of the Fourier coeffi- cients of the broadened peaks It is shown that some experimentally observed interrelations between derived parameters (particularly volume-weighted and surface-weighted domain sizes) and their be- havior (the hook effect and dependence of mean- square strains on the averaging distance) can be explained by this simple assumption Moreover the discrepancy between the integral-breadth methods and Warren-Averbach analysis results from differ- ent approximations for the strain broadening and the background experimental errors
41 Separation of Size and Strain Broadenings
The normalized Fourier transform of a Voigt function is easily computable [46]
^ =exD[-2laquo^e^-7m^^fi^l fan ^bdquo-exp|^ ^ cr(2e) ^ a^(2e) T ^^^^
It is convenient to express Fourier coefficients in terms of distance L by immediately making the ap- proximation A (26) = Ascos do
AL) = exp[-2L^-7rL^pl] (32)
330
Volume 98 Number 3 May-June 1993
Journal of Research of the National Institute of Standards and Technology
Equation (32) is a good approximation even for large specimen broadening Even for a profile span of A (29) = 80deg the error made by replacing this in- terval by an adequate A(sin9 ) range is 2 How- ever strictly speaking the profile will be asym- metrical in reciprocal space and Fourier-interval limits will not correspond to the 29i and Idz peak- cutoff values in real space It is important to keep Fourier interval limits identical for all multiple-or- der reflections otherwise serious errors in the sub- sequent analysis will occur [108] If higher accuracy for a considerable broadening is desired profile fit- ting can be accomplished In terms of the recipro- cal-space variable s instead of in a real 29 space
Assuming that only the Cauchy function deter- mines domain size [4(L) = exp(-L(Z))s)] and only the Gauss function gives root-mean-square strain (RMSS) [^deg(L) = exp(-27r=L2(e)d^)] Eq (32) leads to the Warren-Averbach [Eq (20)] for the separation of size and strain contribution [62] Experience shows that Cauchy and Gauss functions can not satisfactory model specimen broadening Balzar and Ledbetter [64] postulate that the speci- men function includes contributions of size and strain effects both approximated with the Voigt functions Because the convolution of two Voigt functions is also a Voigt function Cauchy and Gauss integral breadths of the specimen profile are easily separable
3c=i3sc + 3DC (33)
(34)
Langford [26] separated the contributions from size and strain broadening in a similar way (See Eqs (27) and (28)) Note however that Eqs (33) and (34) do not define size and strain angular or- der-dependence
Because Fourier coefficients are a product of a size and a distortion coefficient from Eqs (32) (33) and (34) we can obtain the separation of size and strain contributions to the pure specimen broadening
^S(L) = exp(-2Li3sc-TrL^3io) (35)
Adeg(L) = eM-2LpDc-TrL^Phc) (36)
Wang Lee and Lee [109] modeled the distortion coefficient and Selivanov and Smislov [110] mod- eled the size coefficient in the same way
To obtain size and distortion coefficients at least two reflections from the same crystallographic- plane family must be available
42 Size Coefficient
Surface-weighted domain size is calculated from the size coefficients following Eq (21) From Eq (35) we obtain
lt^gts = 1
2i3sc (37)
Therefore surface-weighted domain size depends only on the Cauchy part of the size-integral breadth
The second derivative of the size coefficients is proportional to the surface-weighted column-length distribution function Eq (22) The volume- weighted column-length distribution function fol- lows similarly [111]
p(L)ocL^j^ (38)
By differentiating Eq (35) twice we obtain
^^4^ = [(2^L^ic + 2^sc)^- dL
2TrplcAL) (39)
Because the column-length distribution function should always be positive [59] the Cauchy part must dominate Inspection of Eq (39) shows that for small L we must require
(40)
Otherwise the hook effect will occur in the plot of size coefficientsI (L) versus L that is the plot will be concave downward for small L (Fig 6) The hook effect is usually attributed to experimental errors connected with the truncation of the line profiles and consequently overestimation of background [59] This is a widely encountered prob- lem in the Fourier analysis of line broadening It results in overestimation of effective domain sizes and underestimation of the RMSS [36] Some authors [106] claim that the preset specimen- broadening function eliminates the hook effect However Eq (39) shows that effectively too high
331
Volume 98 Number 3 May-June 1993
Journal of Research of the National Institute of Standards and Technology
08-
04-
mdash^ 1 J 1 x
^~ ( ^ ^ i I
1 t 1 11
jl u
V 1 iJ
J
c^
100 200
Fig 6 (upper) The hook effect of the size coefficients A ^ (full line) at small L (lower) it causes negative values (set to zero) of the column-length distribution functions
background causes underestimation of the Cauchy content of the Voigt function because the long tails are truncated prematurely It has to be men- tioned that Wilkens [112] proposed tilted small-an- gle boundaries to be the source of the hook effect Liu and Wang [113] defined a minimum particle size present in a specimen depending on the size of the hook effect Figure 6 shows that negative values of the column-length distribution functions (set to zero) do not affect the shape but shift the entire distribution toward larger L values
Note also that the surface-weighted column- length distribution function ps(L) will usually have a maximum at L = 0 but for the particular ratio of integral breadths determined by Eq (40) it can be zero The volume-weighted column-length distribu- tion function7v(L) will always have a maximum for LsO
If the column-length distribution functions are known it is possible to evaluate mean values of respective distributions
lt^kv =
00
J ^ _0
(L)dL
raquosv(L)dL (41)
Integrals of this type can be evaluated analytically [114]
OQ
J cexp( - to^ - a )dc = i^y^ ^ of
hd^^^^fe)]- (^2)
Surface-weighted domain size (D)s must be equal to the value obtained from Eq (37) The volume- weighted domain size follows
ltD)v = ^^erfc(A) = js (43)
Using Eqs (37) and (43) we can evaluate the ratio of domain sizes
i^ = 7r lt^gts
= 2vn-^exp(A2)erfc(^) (44)
Theoretically k can change from zero to infinity However the minimum value of k is determined by Eq (40)
1V2 ltk lt laquogt (45)
Hence the ratio of domain sizes can change in a limited range (see also Fig 7)
131laquo V2^ erfc (^ ) s ^ lt 2 (46)
10^ 10^ 10- 10deg 10 10^ 10-
Fig 7 The ratio of volume-weighted and surface-weighted domain sizes as a function of the characteristic ratio of Cauchy and Gauss integral breadths k
332
Volume 98 Number 3 May-June 1993
Journal of Research of the National Institute of Standards and Technology
It may be noted that most experiments give the ratio D)vD)s in this range (see for instance re- view by Klug and Alexander [24]) When k goes to infinity the size broadening is given only by the Cauchy component and (JD)V=2(D)S This is a case of pure Cauchy size broadening described by Haider and Wagner [62] and de Keijser Mittemei- jer and Rozendaal [107] It is possible to imagine a more complicated column-length distribution func- tion [27] than Eq (39) which would allow even larger differences between surface-weighted and volume-weighted domain sizes However we are not aware of any study reporting a difference larger than 100
43 Distortion Coefficient
In Sec 212 it was shown that the distortion co- efficient can be approximated by the exponential
Adeg(L) = exp(-ITTVLeL))) (47)
Comparing with Eq (36) we can write
Therefore mean-square strains (MSS) decrease linearly with averaging distance L This behavior is usually observed in the Warren-Averbach analysis Rothman and Cohen [115] showed that such be- havior would be expected of strains around disloca- tions Adler and Houska [116] Houska and Smith [117] and Rao and Houska [118] demonstrated for a number of materials that MSS can be repre- sented by a sum of two terms given by Cauchy and Gauss strain-broadened profiles
However for i3Dc=0 the MSS are independent ofL
(^2)12 ^ ^Dc(2g) cotg = ^ 2V2 V2TT
(49)
where the upper limit of strain e is defined as 7j4 (see Sec 212) This is a limiting case of pure- Gauss strain broadening described by de Keijser Mittemeijer and Rozendaal [107]
44 Discussion
To calculate domain sizes and strain it is neces- sary to define size and distortion integral-breadths angular order-dependence From Eq (43) It fol- lows that the domain size D )v is always indepen- dent of the order of reflection
)3sc = const JSSG = const
However from Eq (48) we find
^^ = const ^^ = const
(50)
(51)
An important consequence is that apparent strain TJ will be independent of angle of reflection only in the case of pure-Gauss strain broadening because 3DC and JSDG depend differently on the dif- fraction angle If we compare Eq (51) with the multiple-line Voigt-function analysis [26] given by Eqs (27) and (28) it is evident that they disagree Therefore recombination of constituent integral breadths 3DC and 3DO to Voigt strain-broadened in- tegral breadth Pdeg and the subsequent application of Eq (49) to calculate strain [26 119] will concur with the Fourier methods if strain broadening is entirely Gaussian and for the asymptotic value of MSS ((e^( 00))) However neither volume-weighted domain sizes D)y will agree although they are de- fined identically in both approaches because size- broadened and strain-broadened integral breadths are dependent variables
If at least two orders of reflection ( and +1) of the same plane (hkl) are available using Eqs (50) and (51) we can solve Eqs (33) and (34)
(52)
^^deg sl + l)-sil) ^^^^
^^=sHl + l)-sl) [fc( + l)-3c()3 (54)
^^=sl + l)-sl) [^(^ + ^)-^(0]- (55)
If we substitute these expressions into Eqs (35) and (36) we see that this approach leads exactly to the Warren-Averbach Eq (20) for two orders of reflections This is expected because the distortion coefficient is approximated with the exponential (47)] Delhez de Keijser and Mittemeijer [23] ar- gued that instead of Eq (20) the following rela- tion would be more accurate
A(L)=AXL) (1 -27r^(e^(L))LVd (56)
333
Volume 98 Number 3 May-June 1993
Journal of Research of the National Institute of Standards and Technology
These two approximations differ with fourth-order terms in the power-series expansion In terms of this approach Eq (48) has to be rewritten
2r ^^ l-exp(-2LI3DC-TTL^0DG) (57)
This means that even if the strain-broadened pro- file is given entirely by the Gauss function the MSS depend on distance L (see Fig 8) In this ap- proximation no simple relation for the distortion integral-breadths angular order-dependence exists For not so large L however Eq (51) holds and approximations from Eqs (20) and (56) do not dif- fer much (see Fig 8)
1500 Warren- Averbach approximation ^
Delhez de Kcijscr and ^^^ Minemeijer approximation ^y^
^ 1000 A
500
mdashI
1 1
Oc 300 600 IL k^) X 10^
90
o ^ 60 A
30
1
J Warren- Averbach approximation
Delhez de Keijser and Minemeijer approximation
0 0 150 300
1L (A-1 ) X 10^
Fig 8 Mean-square strains pound^(L)) for two approximations of the distortion coefficient (upper) Voigt strain broadening (lower) pure-Gauss strain broadening
Generally it was shown that in the size-broad- ened profile the Cauchy part must dominate No similar requirement for the strain-broadened pro- file exists However experience favors the assump- tion that it has to be more of Gauss-type The Warren-Averbach approach is exact if strain broad- ening is purely Gaussian so Eqs (20) and (48) are
better approximations as strain profile is closer to the Gauss function In any case both approaches given by Eqs (20) and (56) are good up to the third power in strain and the Warren-Averbach relation [Eq (20)] does not assume that MSS are independent of distance L [27] it also represents a harmonic approximation
If at least two orders of reflection from the same plane (hkl) are available we can use Eqs (52) (53) (54) and (55) to calculate size-related and strain-related integral breadths Subsequent appli- cation of Eqs (37) (43) and (48) gives directly domain sizes (D) and (D)v and mean-square strains (e^(L)) This approach is more straightfor- ward and much simpler than the original Warren- Averbach analysis Great care should be given to the possible systematic errors The easiest way to observe the hook effect is to plot column-length distribution functions as a function of averaging distance L If they show negative values for small L (see Fig 6) all derived parameters will be in error This is because (i) only the positive values of the column-length distribution functions are numeri- cally integrated or (ii) the intercept on the L-axis of the linear portion of the A^ vs L curve is taken (see Fig 4) always larger values of domain sizes will be obtained than by the application of Eqs (37) and (43) Therefore we conclude that the dis- crepancy between integral-breadth and Fourier methods is always present by the appearance of the hook effect in the A^ vs L curve An analogous discrepancy exists between integral-breadth and variance methods [119] In such cases correction methods for truncation can be applied [35 119 120] but the best procedure is to repeat the pat- tern fitting with the correct background
In the Fourier analysis it is usually observed that the mean-square strains diverge as the averaging distance L approaches zero This also follows from Eqs (48) and (57) However because the MSS de- pendence on distance L is not defined in Warren- Averbach analysis it was suggested [27 107 121] that local strain can be obtained by taking the sec- ond derivative of the distortion coefficient or by a Taylor-series expansion of local strain Therefore we obtain from Eq (36)
i^m-M^-^) (58)
It is evident that this relation is wrong It holds only for a special case of pure-Gauss strain-broad- ened profile when the MSS are equal for any L Otherwise if the Cauchy function contributes to
334
Volume 98 Number 3 May-June 1993
Journal of Research of the National Institute of Standards and Technology
strain broadening all derivatives of strain in L = 0 are infinite and local strain can not be defined If the main origin of strains is dislocations [115] strains are defined after some distance from the dislocation (cutoff radius) to be finite Averaging strains over a region smaller than the Burgers vector is probably not justified For instance Eq (48) gives even for a small averaging distance L = 1 A and considerable strain broadening (J3DG(20) = 3DC(20) = 1O) root-mean-square strain eL = 1A))^ laquo02 that is about the elastic limit
45 Random Errors of Derived Parameters
Errors in size and strain analysis of broadened peaks are relatively difficult to evaluate Following Langford [26] sources of the systematic errors in- clude choice of standard specimen background and type of analytical function used to describe the line profiles The first two errors should be mini- mized in the experimental procedure Errors caused by inadequate choice of specimen function would systematically affect all derived results but they can not be evaluated Random errors caused by counting statistics have been computed by Wilson [122 123 124] and applied to the Stokes deconvolution method by Delhez de Keijser and Mittemeijer [23] as well as by Langford [26] and de Keijser et al [76] using single-line Voigt-func- tion analysis Nevertheless the approximate error magnitude can be calculated from estimated stan- dard deviations (esd) of the parameters refined in the fitting procedure In the program SHADOW the weighted least-squares error is minimized
7wp mdash RES
Here
)=1
RES = 2 vfi [ (obs) - (cal)]
(59)
(60)
and weights are the reciprocal variances of the ob- servations
H = l(obs) (61)
Each line profile has four parameters varied inde- pendently position intensity and Cauchy and Gauss integral breadths of the Voigt profile In least-squares refinement esds are computed as
^^ bu RES (62) m mdashm
Here ba are diagonal elements of the inverse matrix of the equation coefficients m is the number of observations and m is the number of refined parameters The main source of errors is integral breadths Errors in peak position peak intensity and background are much smaller and can be ne- glected in this simple approach For two indepen- dent variables )3G and Pc covariance vanishes and from Eqs (37) and (38) for the two orders of re- flection and +1 it follows that
RD =
si+i)m)RHMi))+si)m+i)i^(3c(+D)
(63)
ReL)r) =
pHDRHPcG)) + m + miPcJl + D) 2[3c(+1) - i8c()3+TTL [m+1) - mw
-n-LmiDRHihd))+m+mWcH+i))i ^ 2[)3c(+1) - iSc()+TTLim+1) - mw
(65)
Here Rx) are relative standard deviations The error in D would be complicated to evaluate but because 131D)s^(Igt)vlt2(pound))s Eq (63) gives a good estimation for the error in (Z))v as well Alter- natively to see how errors depend on the Fourier coefficients errors can be estimated from the Warren-Averbach relationship [Eq (20)] (86) From Eq (32) it follows that
RA (L)) = ATr^Lpos)R^2d)) +
4Lph(s)RPci2e)) (66)
Errors in root-mean-square strains and domain sizes are
i^((e^(L ))bulllaquo) =
RHA(Ll))+RHA(Ll + l)) (67)
ALl + l)
335
Volume 98 Number 3 May-June 1993
Journal of Research of the National Institute of Standards and Technology
^^laquo^))=(T^)
s(l + 1)RHA (Ll)) +SV)RHA (Ll + D) lsl + l)-sl)f (68)
Here (D) is approximately defined with A^(L) = l-L(D)j Errors in Fourier coefficients increase with L while factors in Eqs (67) and (68) lower the errors for large L In general errors of domain sizes and strains are of the same order of magnitude as errors of integral breadths [86]
5 Application 51 Correction for Instrumental Broadening
Before specimen broadening is analyzed instru- mental broadening must be determined This is ac- complished by carefully measuring diffraction peaks of some well-annealed defect-free speci- men It is then assumed that its broadening may be attributed only to the instrument The usual proce- dure is to anneal the specimen However in some instances that is not possible because either the material undergoes an irreversible phase transition on annealing or the number of defects can not be successfully decreased by annealing Another pos- sibility is to measure the whole diffraction pattern of the material showing the minimal line broaden- ing and then to synthesize the instrumental profile at the needed diffraction angle This approach re- quires the modeling of the angle dependence of the instrumental (standard) parameters Cagliotti Pao- letti and Ricci [125] proposed the following func- tion to describe the variation of the full width at the half maximum of profile with the diffraction angle
F9miA^(2e) = Utan^9 + Vtand + W (69)
Although this function was derived for neutron dif- fraction it was confirmed to work well also in x-ray diffraction case [126 127] A more appropriate function for the x-ray angle-dispersive powder dif- fractometer based on theoretically predicted er- rors of some instrumental parameters [128] may be the following [129]
FWHNf (2 e) = W+Vsin^l 6 +
UtanH + UcotH (70)
This function may better model the increased axial divergency at low angles and correct for the speci- men transparency [129] However contrary to the requirement on the specimen function most im- portant for the instrumental function is to correctly describe the angular variation of parameters re- gardless of its theoretical foundation
When specimen broadening is modeled with a Voigt function the simplest way to correct for the instrumental broadening is by fitting the line pro- files with the Voigt function too Cauchy and Gauss integral breadths of the specimen-broad- ened profile are then easily computable by Eqs (7) and (8) However because the instrumental broad- ening is asymmetric [24] modeling with the sym- metric Voigt function can cause a fictitious error distribution resulting in errors of strain up to 35 [76] Another approach is to model the instrumen- tal-broadening angle dependence by fitting the profile shapes of a standard specimen with some asymmetrical function split-Pearson-VII [95] or pseudo-Voigt convoluted with the exponential function [105] The instrumental function can then be synthesized at any desired angle of diffraction and convoluted with the assumed specimen func- tion to match the observed profile by means of Eq (2)
In the program SHADOW instrumental para- meters are determined by fitting the split-Pearson VII function (see Fig 9) to line profiles of a standard specimen
iix)=m- 2 m
with
c =-
mc^f
mm) mv-rim-12)
(71)
(72)
Here m = 1 or m = ltraquo yields a Cauchy or Gauss function respectively Refined full widths at half maximum (FWHM) and shape factors m for both low-angle and high-angle sides of the profiles are fitted with second-order polynomials To fit the FWHM we used Eq (69) and for the shape fac- tors
m(2e) = U(20f + V(2e) + W (73)
The resulting coefficients U V W U V and W permit synthesis of the asymmetrical instrumental line profile at any desired angle
336
Volume 98 Number 3 May-June 1993
Journal of Research of the National Institute of Standards and Technology
2 0(deg)
le
Fig 9 A split-Pearson VII profile The two half profiles have same peak position and intensity Adapted from Howard and Preston [4]
The basic requirement on the standard specimen is however to show as small a line broadening as possible To minimize physical contributions to the Une broadening of the standard specimen a few moments were emphasized as follows Because dif- fraction-line width depends strongly on degree of annealing it is preferable to use some reference powder-diffraction standard Furthermore asym- metry in the peak profiles is introduced by axial divergence of the beam flat specimen surface and specimen transparency [24] Choosing a standard specimen with low absorption coefficient would cause transparency effects to dominate If the stud- ied specimen has a large absorption coefficient (compared to the standard) this might produce a fictitious size contribution and errors in micro- strains All of the specimens studied have absorp- tion coefficients exceeding 1000 cm^ so a NIST standard reference material 660 LaBe was chosen to model the instrumental broadening (p = 1098 cm) According to Fawcett et al [130] LaBe showed the narrowest lines of all studied com- pounds Furthermore LaB6_has a primitive cubic structure (space group Pm3m) resulting in rela- tively large number of peaks equally distributed over 26 This allows for better characterization and lower errors of FWHMs and shape factors of split- Pearson VII functions (Fig 10)
52 Applicability of the Method
To study the applicability of method described in Sec 4 we first studied simple cubic-structure mate- rials such as silver and tungsten Tungsten has very narrow line profiles allowing us to obtain the up- per limit of domain sizes that can be studied Silver is easily deformed which provides a possibility to apply the method to broad line profiles To test the
009
-a
OH
006
003
1 1 m low-angle side n m high-angle side
bullz w 2 o OH
X
tancopy
Fig 10 Refined FWHMs and shape factors (exponents) m for low-angle and high-angle sides of LaBe line profiles Second- order polynomials were fitted through points
case of relatively complicated patterns and weak line broadening the method was also applied to Lai85Sroi5Cu04 and La2Cu04 powders In this sec- tion only the mechanical aspects of the line broad- ening are discussed Discussion about the origins of broadening of superconductors can be found in Sec 6
521 Silver and Tungsten Powders Figure 11 shows observed and refined peaks of tungsten un- treated and silver ground powders In Table 2 are listed results of fitted pure-specimen Voigt profiles for silver and tungsten specimens Table 3 and Fig 12 give results of the line-broadening analysis Untreated tungsten powder shows relatively weak broadening Instrumental profile FWHMs at angle positions of (110) and (220) tungsten lines are 0059deg and 0081deg respectively close to values mea- sured for tungsten 0065deg and 0100deg Results in Table 3 reveal that small broadening is likely caused by domain sizes because microstrains have negligible value This pushes the limit for measur- able domain sizes probably up to 4500-5000 A However one must be aware that weak specimen broadening implies higher uncertainty of all derived parameters Moreover the choice of the instrumental standard becomes more crucial
Both silver and tungsten line profiles become more Cauchy-like after grinding which probably increases dislocation density in the crystallites This is consistent with the presumption that small crystallites and incoherently diffracting domains separated by dislocations within grains affect the tails of the diffraction-line profiles [60115] Figure 13 illustrates the dependence of MSS on the recip- rocal of the averaging distance L
337
Volume 98 Number 3 May-June 1993
Journal of Research of the National Institute of Standards and Technology
C8
z
7- ^95
29 (deg) 405
bullJf^r-
z S 08
Ez U o u OS
a
04 bull
o Es
4P
2000 z^fA
4000
B
z u f- z
425 435 445 29 (deg)
455
yr 600 SOO
L(A)
Fig 11 Observed points (pluses) refined pattern (full line) and difference pattern (below) (110) W untreated (upper) (200) Ag ground (lower)
Fig 12 Fourier coefficients for the first- (pluses) and second- order (crosses) reflection and size coefficients (circles) [111] Ag untreated (upper) [100] Ag ground (lower)
Table 2 Parameters of the pure-specimen Voigt function as obtained from profile-fitting procedure for tungsten and silver powders
Specimen hkl 2ft(deg) 3c(deg) 3G(deg) FWHM(deg) Rwp()
W untreated 110 220
4028 8705
00065(7) 00301(6)
0020(2) ltio-
0021 0019
90 44
W ground 110 220
4029 8705
0100(2) 0222(3)
0038(4) 0069(6)
0080 0166
90 42
Ag untreated 111 222 200 400
3806 8151 4425 9786
0056(1) 0105(4) 0118(2) 0274(21)
ltio- 00008(21)
ltio-^ ltio-5
0036 0067 0075 0175
105 97
105 122
Ag ground 111 222 200 400
3807 8151 4424 9783
0175(3) 0410(26) 0365(10) 1079(82)
0038(12) ltio-
0076(29) ltio-
0121 0261 0250 0687
99 145 99
145
338
Volume 98 Number 3 May-June 1993
Journal of Research of the National Institute of Standards and Technology
Table 3 Microstructural parameters for tungsten and silver powders
Specimen Direction (poundgt)raquo( A) (2))v(A) ltpound^(fl3))laquo (^laquoD)v2)gtw
W untreated [110] 3200(200) 3500(200) 000038 000008(2)
W ground [110] 620(20) 1030(30) 00023 000054(2)
Ag untreated [111] [100]
1000(20) 510(20)
2000(20) 1030(20)
00010 00022
000024(1) 000047(5)
Ag ground [111] [100]
380(20) 210(10)
650(20) 350(20)
00047 00100
000095(7) 000180(14)
100 -_ - [100) Ag ground ^ ^~ mdash C1111 Ag ground ^bull
y y
o y ^ 50 A y
y y
y
0
y - y ^--
c ) 50 100 150
lLfAjxlO^
Fig 13 Mean-square strains (E^) as a function of VL
Errors in integral breadths allow estimation of errors in strain and size parameters (Sec 45) but in some cases the refinement algorithm gives unre- liable errors of integral breadths When a particu- lar parameter is close to the limiting value (for instance 10^ degrees has been put as the mini- mum value for integral breadths) errors become large However in Eqs (63) (65) (66) (67) and (68) only the product of integral breadth and ac- companying error is significant which is roughly equal for Cauchy and Gauss parts Errors of do- main sizes and strains are of the same order of magnitude as errors of integral breadths
The possible source of systematic error is poten- tial inadequacy of Voigt function to accurately de- scribe specimen broadening This effect can not be evaluated analytically but it would affect all derived parameters especially the column-length distribution functions The logical relationship be- tween values of domain sizes (see Table 3) for dif- ferent degrees of broadening indicates that possible systematic errors can not be large
Equation (41) allows computation of volume- weighted and surface-weighted average domain sizes if respective column-length distribution func- tions can be obtained Figure 14 gives surface- weighted and volume-weighted average column- length distribution functions following Eqs (39) and (38) Width of the distribution function deter- mines the relative difference between (D) and (pound))v The broader the distribution the larger the differences because small crystallites contribute more to the surface-weighted average That is much more evident comparing the surface- weighted column-length distribution with the vol- ume-weighted If they have similar shape and maximum position as in Fig 15 differences are small Conversely if the surface-weighted distribu- tion function has a sharp maximum toward smaller sizes differences are larger (see Fig 14) The dif- ference between (poundgt)s and (D)v and the actual mean dimension of the crystallites in a particular direction also depends strongly on the average shape of the crystallites [52 131 132]
If experimental profiles are deconvoluted by the Stokes method even for considerable specimen broadening size coefficients A ^ usually oscillate at larger L values [59 106] preventing computation of the column-length distribution function Few techniques were used to deal with this problem successive convolution unfolding method [32 133] smoothing and iterative methods [134 135 136 137] Figures 14 and 15 show very smooth column- length distribution functions However they follow from size coefficients ^4^ that depend on the accu- racy of the approximation for the distortion coeffi- cient given by Eq (47) Equation (47) is exact if the strain distribution is Gaussian but in general holds only for small harmonic numbers n if strain broadening is not negligible
339
Volume 98 Number 3 May-June 1993
Journal of Research of the National Institute of Standards and Technology
500 1000 L(A)
Fig 14 Surface-weighted and volume-weighted column-length distribution functions normalized on unit area [111] Ag un- treated (upper) [100] Ag ground (lower)
Fig 15 Surface-weighted and volume-weighted column-length distribution functions for [010] La2Cu04 normalized on unit area
522 La2-xSrtCu04 Powders To test the applicability of the discussed method to more com- plicated patterns two compounds with lower crystallographic symmetry were studied Lai85Sroi5Cii04 has a tetragonal K2NiF4-type struc- ture space group lAlmmm La2Cu04 is orthorhom-
bic at room temperature Both compounds show slight line broadening and relatively highly overlap- ping peaks (see Fig 16) which makes it very diffi- cult if not impossible to perform a Stokes analysis
25
-25
26 (deg)
yNraquo-
Fig 16 Observed points (pluses) refined pattern (full line) convoluted profiles (dashed line) and difference plot (below) for part of La2Cu04 pattern
Tables 4 and 5 list results from the fitting proce- dure and the analysis of specimen-broadened inte- gral breadths There are no qualitative differences in results for tungsten and silver powders How- ever average errors are higher as expected be- cause of overlapping peaks while weighted errors wp are surprisingly smaller This fact illustrates the unreliability of iwp when only a segment of the pat- tern is being refined because it depends on the number of counts accumulated in points as well as on the 28 range of the refinement
Figures 17 and 18 represent Fourier coefficients of Lai85Sroi5Cu04 [110] and La2Cu04 [010] direc- tions In the second plot the A (L )-versus-L plot shows a concave-downward part near L =0 the so- called hook effect It was shown in Sec 42 that the hook effect originates because of underesti- mation of background connected with the trunca- tion of profiles In the profile refinement all peaks separated less than 4deg 20 have been included in the refinement region to avoid possible overlapping of peak tails and specimen profiles have been trun- cated below 01 of the maximum intensity How- ever because the polynomial background was determined prior to profile refinement it may be overestimated for complicated patterns containing many overlapping peaks If background is refined with other profile parameters undesirable correla- tion with integral breadths occurs
340
Volume 98 Number 3 May-June 1993
Journal of Research of the National Institute of Standards and Technology
Table 4 Parameters of the pure-specimen Voigt function as obtained from profile-fitting procedure for La2-^SrCu04 powders
Specimen hid 2Hdeg) Pen PcO FWHM(deg) Rp()
Lai85Sroi5Cu04 004 2695 0046(4) 0024(8) 0042 34 006 4092 0083(5) ltio-= 0053 62 110 3352 0110(5) ltio- 0070 125 220 7046 0171(9) ltio- 0109 43
La2Cu04 004 2713 0061(8) 0045(9) 0067 39 006 4119 0124(7) ltio-^ 0079 77 020 3316 0074(10) 0078(10) 0102 29 040 6957 0210(30) 0026(81) 0135 29 200 3345 0074(8) 0061(10) 0087 69 400 7028 0130(10) 0023(95) 0089 29
Table 5 Microstructural parameters for Laij(5Srai3Cu04 and La2Cu04 powders
Specimen Direction (DUA) Pgt(A) lte^(fl3))laquo lte2((Z)gt2))laquo
Lai83Sro5Cu04
La2Cu04
[001] [110]
[001] [010] [100]
1700(300) 470(20)
1100(100) 680(50) 680(50)
2000(200) 940(20)
1200(100) 760(50) 810(50)
00024 00017
00038 00033 00016
000049(9) 000044(6)
00008(1) 00007(2) 00003(3)
c i ^- raquo sect 08 bulli - U
^0
ti- bull ll bull bullbullo
ffl M P bull- u ^ Di 04 Si - M bulldiamsbullbull a bull-v 3 o ^^=s^
u ^N^Sraquoraquo^
0 ^^^aaaa 1000
L(A) 2000
OQ bullbulldego UM o z a 08
o o bull bull bull
- u u bull raquo UU bull
a diams o bull o u ft 04 bull deg raquo deg - U bull bull deg Oi bullbullgt =3 bull- l o k u
0 bullbullbullraquo aaaMMi
500 1000
L(A)
Fig 17 Fourier coefficients for the first- (pluses) and second- order (crosses) reflection and size coefficients (circles) for [110] Lai^Sroi5Cu04
Fig 18 Fourier coefficients for first- (pluses) and second- order (crosses) reflection and size coefficients (circles) for [010] La2Cu04
341
Volume 98 Number 3 May-June 1993
Journal of Research of the National Institute of Standards and Technology
S3 Comparison with the Integral-Breadth Methods
Knowing the specimen integral breadths simpli- fied methods can be applied In Sec 212 we re- viewed multiple-line and single-line integral- breadth methods We shall compare the simplified multiple-line methods [Eqs (23) (24) and (30)] and the single-line method [76] [Eqs (29) and (30)] with results obtained for silver tungsten and La2-xSrxCu04 powders (Tables 3 and 5) We did not compare with the multiple-line Voigt-function method [26] because it was shown in Sec 44 that it is incompatible with the Warren-Averbach analy- sis In Table 6 integral breadth Pi was computed according to Eq (11) This value was compared with )8A integral breadth computed from Fourier coefficients [58]
i8A=- laquo3 2^(L)
(74)
Results obtained by the Warren-Averbach analysis are significantly smaller for both size and strain Integral-breadth methods give the upper limit for strain so comparison is limited Considering the approximation e = 125e^(L))^ [138] with L=(D)v2 or L=(D)s2 strains resemble more closely than crystallite sizes It must be noted how- ever that this approximation makes sense only in the case of pure-Gauss strain broadening Benedetti et al [106] reported excellent agreement for both size and strain using Warren-Averbach and Cauchy-Gauss [Eq (24)] methods Results from Table 6 on the contrary indicate that the Gauss-Gauss approximation gives values closest to the Warren-Averbach method for crystallite sizes whereas the Cauchy-Gauss and especially the Cauchy-Cauchy approximation tend to give too large values For strain the trend is opposite The Cauchy-Cauchy approximation resembles most
Table 6 Comparison of results obtained with the integral-breadth methods Cauchy-Cauchy (C-C) Cauchy-Gauss (C-G) Gauss- Gauss (G-G) and single-line (S-L) analysis
Specimen hkl PiXKP PAXKP ltigt)v (Z)gt(A) (e^((DV2)gt2 eXlO^ (A-) (A-0 (A) C-C C-G G-G S-L xlO^ C-C C-G G-G S-L
W untreated 110 220
0259 0247
0259 0247
3500 3700 3810 3810 14500 4040
008 -001 -003 -005 024 0
W ground 110 220
125 204
125 205
1030 2240 1450 1220 940 550
054 090 093 105 045 032
Ag untreated 111 2
0600 0901
0600 0900
2000 3340 2390 2190 1670 1110
024 035 039 095 0 0
200 124 124 1030 2270 1470 1230 810 047 082 085 095 0 400 204 204 490 0
Ag ground 111 222
198 352
200 352
650 2080 1240 910 530 280
095 179 182 197 048 0
200 403 406 350 9380 4780 1320 260 180 405 405 408 082 400 803 803 120 0
Lai85Sroi3Cu04 004 006
0657 0881
0650 0880
2000 5230 3290 2660 1970 1140
049 076 078 088 044 0
110 119 119 940 1240 1000 970 840 044 052 064 080 0 220 158 158 630 0
La2Cu4 004 006
0988 132
0998 131
1200 2980 1940 1630 1490 760
08 107 112 127 081 0-
020 143 142 760 1200 910 860 1240 07 079 090 110 114 040 198 200 510 016 200 126 124 810 810 810 810 1250 03 002 011 015 089 400 1S 126 830 014
Not possible to evaluate because of too small Gauss integral breadth
342
Volume 98 Number 3 May-June 1993
Journal of Research of the National Institute of Standards and Technology
closely a Warren-Averbach method These results concur with the Klug and Alexander [24] compari- son of the published size and strain values obtained by Warren-Averbach (Stokes) and integral-breadth methods However for x-ray diffraction the Cauchy-Gauss assumption for the size-strain broadening is theoretically and experimentally more favored thpoundm the other two models The fact that the Gauss-Gauss method for crystallite size and the Cauchy-Cauchy method for strain give more realistic results may mean that the presump- tion that size and strain broadening are exclusively of one type is an oversimplification
The single-line method seems much less reliable If Gaussian breadth is very small no information about strain is obtained Moreover second-order reflections give much lower values of both size and strain than do basic reflections However if multi- ple reflections are not available the single-line method can give satisfactory estimations
54 Reliability of Profile Fitting
The profile fitting of a cluster of even severely overlapping peaks can be accomplished with a low error and excellent fit of total intensity But how reliable is information obtained about separate peaks in the cluster In the fitting procedure it is possible to put constraints on the particular profile parameter to limit intensity position and width of the peak If anisotropic broadening or different phases are present constraints may not be realistic Morever acceptable results can be obtained even using a different number of profiles in refinement [4] Hence the first condition for the successful ap- plication of this method is knowledge of actual phases present in the sample and their crystalline structures
In this regard two powders were measured or- thorhombic Lai94Sroo6Cu04 has a slightly distorted K2NiF4-type structure (space group Bmab a =53510(2) A b =53692 A(2) c = 131931(7) A) and tetragonal Lai76Sro24Cu04 (space group I4mmm a =37711(3) A c = 132580(8) A) Data were collected for each specimen separately and for a specimen obtained by mixing the same pow- ders Because diffracted intensity of each phase was lower for the mixture counting time was pro- portionally increased to obtain roughly the same counting statistics Figure 19 shows two partially separated orthorhombic (020) (200) and (040) (400) peaks overlapped with tetragonal (110) and (220) reflections During the profile fitting of the mixed powders (200) orthorhombic peak tended to disappear on account of neighboring (020) and
(110) reflections Its intensity was constrained to vary in range plusmn 30 of (020) peak intensity which can be justified if the crystallographic structure is known
60
-60
345
345
335 29 (deg)
345
Fig 19 (upper) Lai76Sro24Cu04 (110) peak (middle) Lai94Sroo6Cu04 (020) and (200) peaks (lower) (110) (020) and (200) peaks
Table 7 contains results of fitted specimen-Voigt functions as well as size and strain values obtained by the analysis of broadening Comparing integral breadths of the starting and mixed powders some profiles change from more Cauchy-like to Gauss- like and vice versa This is especially evident for the (400) reflection meaning that accurate deter- mination of the profile tails is indeed affected in the cluster of overlapping peaks However integral breadth does not change significantly so results of
343
Volume 98 Number 3 May-June 1993
Journal of Research of the National Institute of Standards and Technology
Table 7 Comparison between two specimens run separately and mixed togetlier
Specimen hkl 2Hdeg) )3cO PoO DUA) (D)v(A) (e2laquoD)v2))laquoxlO
Lai76Sroj4CuOr 110 3369 0058(6) 0094(7) 780(60) 850(60) 10(1) 220 7073 022(2) 013(2)
LaiMSro(KiCu04 020 3342 0084(9) 055(14) 500(90) 1000(200) 07(1) 040 7012 010(2) 014(1) 200 3353 00216(85) 0061(8) 1100(100) 1200(100) 03(1) 400 7040 0026(11) 0088(8)
Mix 110 3367 0083(21) 0064(14) 800(300) 1200(300) 08(3) Lai76Sro24Cu04 220 7072 019(7) 013(4)
+ 020 3343 0066(35) 0070(23) 800(300) 1000(300) 07(4) Lai94Sroo6Cu04 040 7012 0116(93) 013(5)
200 3354 0024(156) 0071(61) 900(700) 1000(600) 04(12) 400 7041 011(2) 0003(320)
the multiple-line methods are not much influenced On the contrary the single-line method gives quite different results This may support the conclusion of Suortti Ahtee and Unonius [43] that the Voigt function fails to account properly for size and strain broadening simultaneously if only Cauchy integral breadth determines crystallite size
Table 7 shows that the results of Warren- Averbach analysis of starting and mixed powders agree in the range of standard deviations How- ever errors are much larger especially for the hid- den (200)-(400) reflections From Eq (62) it follows that more counts (longer counting times) and more observables (smaller step-size) would lower standard deviations Therefore in the case of highly overlapping patterns to obtain desirable ac- curacy much longer measurements are needed al- though that will not change the fact that higher overlapping implies intrinsically higher errors of all refinable parameters To further minimize possible artifacts of the fitting procedure it is desirable to include in the analysis as many reflections in the same ciystallographic direction as possible
55 Remarks
By modeling the specimen size and strain broad- ening with the simple Voigt function it is possible to obtain domain sizes and strains that agree with experiment and show a logical interrelationship Furthermore the Voigt function shows the correct 1A(26y asymptotic behavior of peak tails as ex- pected from kinematical theory [139] However if the specimen profile is significantly asymmetric (because of twins and extrinsic stacking faults [140 59]) or the ratio FWHM^ is not intermediate to the Cauchy (2Tr) and Gauss (2(ln27r)^) functions then the Voigt function can not be applied [25]
Suortti Ahtee and Unonius [43] found good over- all agreement by fitting the Voigt function to the pure-specimen profiles of a Ni powder deconvo- luted by the instrumental function However more accurate comparison is limited because of unavoid- able deconvolution ripples of specimen profiles Furthermore the Voigt function might not be flex- ible enough to model a wide range of specimen broadening as well as the different causes of broadening Therefore the question whether the Voigt function can satisfactorily describe complex specimen broadening over the whole 20 range in a general case needs further evaluation
This method of Fourier analysis with the as- sumed profile-shape function is most useful in cases when the classical Stokes analysis fails there- fore when peak overlapping occurs and specimen broadening is comparable to instrumental broaden- ing It was shown that for a high degree of peak overlapping the fitting procedure can give unreli- able results of Gauss and Cauchy integral breadths that is the peak can change easily from predomi- nantly Cauchy-like to Gauss-like and contrary This can lead to illogical values of size-integral and strain-integral breadths according to Eqs (52) (53) (54) and (55) and to irregularities in the be- havior of Fourier coefficients for large L Simulta- neously if the size-broadened profile has a large Gauss-function contribution the hook effect will occur However volume-weighted domain sizes D)y and MSS eL)) for small L are much less affected because they rely on both Cauchy and Gauss parts of the broadened profile Any integral- breadth method that attempts to describe the size and strain broadening exclusively by a Cauchy or Gauss function in this case fails completely For specimens with lower crystallographic symmetry
344
Volume 98 Number 3 May-June 1993
Journal of Research of the National Institute of Standards and Technology
when many multiple-order reflections are avail- able but the peaks are overlapped it is therefore desirable to include in the analysis as many reflec- tions as possible to minimize the potential artifacts of the fltting process
6 Analysis of Superconductors 61 (La-M)2Cu04 Superconductors
Bednorz and Miiller [16] found the first high- temperature oxide superconductor in the La-Ba- Cu-O system Soon after substituting Ba with Sr and Ca Kishio et al [17] found superconductivity in two similar compounds Later many compounds with much higher transition temperatures (Tc) were found The (La-M)2Cu04 system remains favorable for study because the cation content responsible for the superconductivity is easier to control and measure than the oxygen stoichiometry Also this system provides a wide range of substitutional cation solubility in which the tetragonal K2NiF4- type structure is maintained Compared with much- studied Y-Ba-Cu-O this structure is simpler because it contains only one copper-ion site and two oxygen-ion sites
The undoped compound La2Cu04 is orthorhom- bic at room temperature It becomes superconduct- ing either with cation substitution on La sites or increased oxygen content to more than four atoms per formula unit Doping with divalent cations in- creases the itinerant hole carriers in the oxygen- derived electron band [141] which probably causes the superconductivity However different dopants influence the transition temperature Tc Although the unit-cell c-parameter simply reflects ionic dopant size [142] the in-plane unit-cell parameter (and accordingly the Cu-0 bond length) correlates with Tc for different dopants and for different dop- ing amounts [142 143]
LaiB5MouCu04 (M = Ba Ca Sr) have a tetrago- nal K2NiF4-type structure space group lAlmmm with four atoms in the asymmetric unit [117] One site is occupied with La partially substituted with dopant ions (Fig 20) La2Cu04 is orthorhombic at room temperature The best way to correlate these two structures is to describe La2Cu04 in space group Bmab the c axis remains the same tetrago- nal [110] and [110] directions become [010] and [100] orthorhombic axes and size of the unit cell is doubled [144]
Figure 21 shows parts of the x-ray diffraction patterns observed and refined of Lai85Moi5Cu04 (M = Sr Ba Ca) and La2Cu04 Refined lattice
parameters are given in Table 8 Table 9 shows resuhs of the line-broadening analysis Relatively
La(BaCaSr)
0(2)
0(1)
Fig 20 Ciystal structure of (La-M)2Cu04 showing one unit cell
300 JUU
(b)
200
100
U 0 M J Js-r-^
30
-30
300
40 41 42 43 44 45 40 41 42 43 44 45 29 (deg) 29 (deg)
mdashA-
gt t 200
Z
F-
- 100
(c)
f V kgt ii I 40 41 42 43 44 45 40 41 42 43 44 45
e (deg) ^^ 26 (deg)
-30 wwX mdash Wlaquo-
Fig 21 Diffraction patterns of LaiH5Moi5Cu04 specimens (a) M=Sr (b) M = Ba (c)M = Ca (d) M = U
345
Volume 98 Number 3 May-June 1993
Journal of Research of the National Institute of Standards and Technology
Table 8 Lattice parameters and T^ at zero resistivity (Ac method at 10 Ma current)
Specimen a (A) bk) c(A) rc(K)
Lairaquo5Sroi5Cu04 377814(7)
Lairaquo3Baoi3Cu04 37846(2)
LaiiijCaoi5Cu04 37863(7)
La2Cu04 53558(2) 54053(2)
231(2) 36
288(4) 28
17(2) 19
1451(8)
Table 9 Results of line-broadening analysis for (La-M)2Cu4 specimens
Specimen hkl PcO PoO (DUk) (Iraquo)(A) lte^((D)2))
Lai(laquoSroj5Cu04 004 006
0046(4) 0083(5)
0024(8) ltio-
1700(300) 2000(200) 000049(9)
110 0110(5) ltio- 470(20) 940(20) 000044(6) 220 0171(9) ltio-
Lai85Baoi3Cu04 004 006
0049(6) 0110(7)
0076(6) 0089(9)
1100(200) 1100(100) 00011(2)
110 0087(4) 000042(6) 560(20) 1110(20) 000024(5) 220 0116(3) ltio-5
Laiji5Caoi5Cu04 004 006
0120(13) 0146(12)
0032(22) 0033(27)
440(70) 780(90) 00007(4)
110 0045(25) 0200(19) 340(30) 360(20) 00013(2) 220 0343(22) ltio-
La2Cu04 004 006
0061(8) 0124(7)
0045(9) ltio-
1100(100) 1200(100) 00008(1)
020 0074(10) 0078(10) 680(50) 760(50) 00007(2) 040 0210(30) 0026(81) 200 0074(8) 0061(10) 680(50) 810(50) 00003(3) 400 0130(10) 0023(95)
weak peak broadening was observed which can not be attributed to the proximity of the phase trans- formation Lai85SroisCu04 is tetragonal down to = 170 K [145] Lai85Baoi5Cu04 to 140 K [146147] and Lai85Caoi5Cu04 to 130 K [148] Another possi- ble reason for peak broadening might be continu- ous compositional variations in dopant content The scanning Auger microprobe analysis of La2-SrtCu04 compounds [149] showed that grain- boundary segregation of Sr is weak and limited to a narrow region near the grain surface In the case of the separation of two phases with different Sr con- tent and similar lattice parameters asymmetry of some reflections would be observed [150] More- over in the case of compositional inhomogeneity microstrains eL)) would be roughly independent of the averaging distance L in the grains [151] therefore distribution of strains would be Gaus- sian For all specimens microstrain behavior is identical it decreases linearly with distance L
Rothman and Cohen [115] showed that such be- havior of microstrains is caused by dislocations that might arise during grinding Assuming the same applied stress microstrain would be approximately inversely proportional to the elastic moduli of these materials If mean microstrain is defined as the arithmetic average of strains for the [001] and [110] directions results agree with values of the Youngs moduli for polycrystalline La2Cu04 Lai85Moi5Cu04 (M = Sr Ba Ca) [152] However other factors may contribute to the microstrain Coordination-6 ionic radii of La^+ Sr Ba^+ Ca^+ are 106 116 136 100 A respectively [153] Substitution of La with ions of different sizes affects the lattice parameter [142] and may cause much larger strains in the [001] direction when some of the ions are replaced with Ba^ than with Sr^ in accord with results in Table 9 Substitution of Ca^^ ions produces an entirely different effect microstrains in the [110] direction are larger This may be explained by
346
Volume 98 Number 3 May-June 1993
Journal of Research of the National Institute of Standards and Technology
comparing effects of substitutional ions on the unit-cell a -parameter The Ba-doped specimen has a larger a-parameter than the Sr-doped but the Ca-doped a-parameter is largest although Ca^^ has the smallest ionic size This should increase the cell distortion in the a-b plane
Table 9 reveals high anisotropy in these materi- als consistent with other physical properties such as thermal expansion [154] and upper critical mag- netic field [155] Differences of domain sizes might arise from a layered structure in the [001] direction and consequently easy incorporation of stacking faults between regularly stacked layers The stack- ing-fault and twin-fault probabilities can be esti- mated from the average surface-weighted domain sizes [59]
^ = TAN + cf1fun(aa) (75) m im - (D)
Here c is a constant for the particular [hkl] direction and fun(a a) a linear combination of stacking-fault probability and twin-fault probability a The exact form of Eq (75) was derived only for the cubic and hexagonal crystal structures On con- dition that the true domain dimension D is isotropic or so large that the second term of Eq (75) dominates a linear function of stacking-fault and twin-fault probability is
fun(aa) = c( 1
) (76) Zgt)J (Dgttrade
Here c denotes a constant that depends only on geometrical factors and is the same for all three doped compounds
Figure 22 shows a possible correlation between Tc and fault-defect probabilities computed from TEM observations of La2-jcSrCu04 revealed that stacking-fault density increased with Sr content up to jc = 015 [156] That study suggests that a shear mechanism forming the fault-boundary dislocations implies oxygen vacancies andor cation deficiency We did not measure oxygen content but neutron- diffraction studies showed that oxygen deficiency starts to appear at much higher Sr content [157] However the increase of fault probability with the simultaneous decrease of microstrain in Fig 22 supports the assumption that defects are intro- duced to accommodate lattice strains [156] A simi- lar increase in Te was found in Y2Ba4Cu802o-laquo thin films [158] Compounds with asymmetric broad- ened and shifted peaks showed higher Tc which
was attributed to stacking faults Although extrinsic stacking faults may cause asymmetric peak broad- ening [140] it is probably caused by twinning Twinning in La-M-Cu-0 materials is less abundant than in Y-Ba-Cu-O compounds but it was ob- served in (La-Sr)2Cu04 monocrystals on (110) planes [159] In the profile-fitting procedure peak asymmetry is incorporated only in the instrumental function therefore we could not model asymmetric peak broadening However any significant asym- metry of the specimen profile would cause an un- even fit of low-angle and high-angle sides of peaks which was not observed This gives much more im- portance to stacking faults in Eq (76)
Fig 22 Arithmetic average of [110] and [001] root-mean- square strains and linear function of stacking-fault and twin- fault probabilities as a function of Tc
In Fig 22 average microstrains defined as the arithmetic average of [001] and [110] directions correlate inversely with Tc However we did not find a correlation of Tc and microstrains in a partic- ular direction [001] microstrains simply reflect dif- ference in size of dopant and host La^ ions (see Table 9)
In La2Cu04 (OkO) reflections are significantly broader than (hOO) This has also been observed in low-temperature orthorhombic Lai85Sroi5Cu04 and Lai85Baoi5Cu04 [160] and explained by either stacking faults or possible lower symmetry Our results reveal that domain sizes (D) have identical values for [010] and [100] directions (Table 9) From Eq (76) it follows that stacking-fault proba- bilities in these directions have the same values However microstrains in the [010] direction are roughly twice as large as in the [100] direction which is responsible for the different broadening In the case of doped La2Cu04 compounds different microstrains might be caused by oxygen
347
Volume 98 Number 3 May-June 1993
Journal of Research of the National Institute of Standards and Technology
vacancies ordered along one direction in the a-b plane similar to effects found in YBa2Cu307-laquo However undoped La2Cu04 is not expected to have significant o^Qgen deficiency Other possibili- ties are lower ciystallographic symmetry andor La vacancies although they were not reported for this system but La deficiency was found in an La2Co04 compound [161]
We can conclude that lattice strains and incoher- ently diffracting domain sizes confirm high an- isotropy in these materials This simple approach however does not allow unambiguous identifica- tion of the strains origin Probably the strains originate from dislocations and from different sizes of host and dopant ions Domain sizes of all com- pounds are larger in the c-direction than in the a-6 plane This indicates existence of stacking faults and twins However because estimated errors are relatively large and only three materials were stud- ied the possible connection between stacking faults and 7c needs further study
62 Bi-Cu-O Superconductors
Among the high-Tc superconductors the Bi- Cu-O compounds appear intriguing especially because their incommensurate structure modula- tion remains incompletely understood [162 163] The crystal structure consists of perovskite-like SrO-(Cu02Ca)mi-Cu02-SrO layers separated by NaCl-like BiO double layers (see Fig 23 [164]) The number m of Cu02 layers alters the supercon- ducting transition temperature Tc (for m = 12 and 3 rclaquo10 90 and 110 K respectively) This two- dimensional layered structure makes these materi- als highly anisotropic and favours the creation of defects
Bulk sintered specimens showed relatively weak peak broadening Moreover the diffraction pat- terns contained many overlapping peaks because the compound crystallizes in an orthorhombic low- symmetry space group A2aa [165] and incommen- surate modulation gives superlattice reflections All patterns revealed a strong [001] texture (Fig 24) making reflections other than (001) difficult to ana- lyze The lattice parameters vary depending on the exact compound stoichiometry and processing his- tory but characteristically they have almost identi- cal a and b parameters and large c parameter fl =54095 A 6=54202 A c =309297 A for Bi2Sr2CaCu208 (Bi-2212 [166] and A =5392 A b =5395 A c =36985 A for (BiPb)2Sr2Ca2Cu30io (BiPb-2223) [165] Thus we treated (hOO) and (0^0) reflections as single peaks Table 10 gives the
results for three specimens Bi-2212 (BiPb)2 (SrMg)2(BaCa)2Cu30io (BiPbMgBa-2223) which were one-phase specimens and BiPb-2223 con- taining approximately equal amounts of 2212 and 2223 phases The in-plane lattice parameters of 2212 and 2223 phases differ little hence only the [00] directions of the mixed-phase specimen were evaluated
b^ (c)
Fig 23 Average crystal structure of Bi2Sr2Cam-iCum04+2m for (a) m = 1 (b) w =2 (c) m =3 [164]
35
-35
42 44 46 48 50 52 54 56 58 60 62 26 (deg)
^ ^^^MK^Aa^Ndllaquop
Fig 24 Part of BiPbMgBa-2223 refined pattern There are 48 fundamental reflections in this region
Interpretation of the results in the case of these complicated compounds must be considered care- fully Microstrains are probably caused by disloca- tion arrays However substitution of different-sized ions and vacancies would also contribute to the strains as would other kinds of disorder especially
348
Volume 98 Number 3 May-June 1993
Journal of Research of the National Institute of Standards and Technology
Table 10 Results of line-btoadening analysis for Bi-Cu-O supreconductors
Specimen Phase hkl (A)
eD)sa)y^
Bi-2212 2212 008 0012
0163(8) 022(3)
001(6) 005(6)
420(80) 00021(6)
020+200 0104(4) ltio-^ 580(30) 00007(1) 040+400 018(2) 00004(6300)
BiPbMgBa-2223 7773 0010 0020
0097(1) 021(2)
00002(1700) 0007(150)
770(60) 00012(1)
020 + 200 012(27) 013(10) 380(430) 00009(71) 040 + 400 015(95) 021(33)
BiPb-73 2212 008 0012
023(2) 025(5)
0002(350) 0001(1000)
220(30) 00013(26)
2223 0010 0020
022(8) 023(99)
0092(67) 018(47)
230(190) 00012(197)
Stacking faults and twins Table 10 shows larger strains in the [001] direction that in the basal plane This can be explained by stacking disorder along the c-axis which was frequently observed in electron-diffraction patterns as streaking [167 168] Easy incorporation of stacking faults is possi- ble because of the two-dimensional weak-bonded layers (BiO double layers are spaced about 3 A apart) The difference in microstrain between in- plane and the c-direction is much smaller for the BiPbMgBa-2223 phase probably because Pb low- ers the faulting by stabilizing the higher-Tc 2223 phase [167] For the BiPb-2223 specimen with two phases there are two possibilities Either the speci- men consists mainly of a mk of two kinds of one- phase grains or both phases occur within the same grains The second possibility was confirmed exper- imentally [169 170] and our results concur be- cause microstrain in the 2212 phase is much smaller than in the one-phase Bi-2212 specimen Processing conditions and cation content probably favour development of the macroscopic inter- growth of both phases within the grains that is microscopic defects grow to sufficiently large re- gions to give a diffraction pattern of another phase with the different number of Cu02 layers As a re- sult strain is relieved and both strains and domain sizes being quite different in one-phase specimens tend to equalize
For the Bi-Cu-O specimens the mean surface- weighted domain sizes are generally smaller than for (La-M)2Cu04 compounds Therefore the com- putation of the stacking- and twin-fault probabili- ties by using Eq (75) may be wrong It would be very instructive to compare the different broaden-
ing of satellite and fundamental reflections which indicates a more pronounced stacking disorder in the modulated structure [171]
In summary we found that for both Bi-2212 and BiPbMgBa-2223 superconductors the c-axis strain exceeds the in-plane strain The BiPb-2223 specimen containing both 2212 and 2223 phases within the single grains shows smaller incoherently diffracting domains and lower c-axis strain than the one-phase specimens This fact may direct us to- ward the mechanism of the second-phase forma- tion in these materials
63 Remarks
It was shown that this particular method of the line-broadening analysis can give information about the size of incoherently diffracting domains and lattice strains in (La-M)2Cu04 and Bi-Clu-O superconductors Moreover results show high an- isotropy of both size and strain parameters as one may expect because of the layered structure of all superconducting cuprates Generally structural line broadening is not large that is a result of rela- tively large domain sizes (200-2000 A) and small strains (002-02) It is interesting to compare these values with the published results for YBa2Cu307-laquo (isotropic strains of 023 [77] and 005-03 [82]) Although the different materi- als were studied they seem too large especially be- cause they are the average of strains in different directions
The main drawback of the line-broadening the- ory is the uncertainty about the origins of the line broadening that is it is difficult to distinguish the main effects responsible for the broadening For
349
Volume 98 Number 3 May-June 1993
Journal of Research of the National Institute of Standards and Technology
the novel superconductors particularly the numer- ous defects (substitutions vacancies stacking faults dislocations and similar) can occur simulta- neously which makes it very difficult to determine their individual contributions Furthermore the crystal structures of most novel superconductors are relatively complicated The average structure has mostly a slightly distorted tetragonal symmetry very similar a and b lattice parameters and a large c parameter but c=36 for YBa2Cu307-laquo for in- stance This results in a large number of overlap- ping peaks and consequently in large errors of all results This showed especially in the case of Bi-Cu-O superconductors (see Table 10) Follow- ing the discussion of reliability of profile fitting in Sec 54 it would be desirable to include more than two reflections in the analysis of broadening but higher-order peaks are usually too weak and over- lapped One way to partially solve this problem would be a whole pattern fitting [172 173] and Rietveld structure refinement [23] in terms of size and strain parameters This requires an accurate preset function to model specimen broadening and precise definition of angular dependence of size and strain parameters The Rietveld programs that model the line broadening in terms of size and strain parameters are based either on the simpli- fied integral-breadth methods [78 95] or on the single-line method [174]
7 Conclusions
A method for analyzing the pure-specimen (structural) broadening of x-ray diffraction line profiles is proposed By modeling the specimen size and strain broadenings with the simple Voigt func- tion it is possible to obtain domain sizes and strains that agree with experiment and show a logi- cal interrelationship Furthermore some common consequences and problems in the Fourier-method analysis follow easily The specimen function is convoluted with the instrumental function to match the observed x-ray diffraction-line profile This avoids the Stokes deconvolution method thus al- lowing analysis of patterns with highly overlapping peaks and weak structural broadening Therefore the method was applied to some novel high-Tc superconductors We reached the following conclu- sions
(i) Surface-weighted domain size depends only on the Cauchy integral breadth of the size-broad- ened profile
(ii) The hook effect occurs when the Cauchy-content of the size-broadened profile is un-
derestimated that is for ^sc(n2)^3sG Usually this happens when the background is estimated too high so the long tails of the Cauchy function are prematurely cut off
(iii) It also follows from conclusion (ii) that the volume-weighted domain size can not be more than twice the surface-weighted domain size (limiting value D)v=2D)i is obtained for the pure-Cauchy size-broadened profile) Minimum value for D)J (D)j should not be less than -131
(iv) If the distortion coefficient is approxi- mated with a harmonic term this leads exactly to the Warren-Averbach method of separation of size and strain broadenings
(v) In that case mean-square strains decrease linearly with the distance L
(vi) It is possible to evaluate local strain ((e^(0))^) only in the case of pure-Gauss strain broadening Then root-mean-square strain is inde- pendent of the distance L and related to the upper limit of strain obtained from the integral breadth of the strain-broadened profile
(vii) If strain broadening is not described exclu- sively with the Gauss function the multiple-line Voigt integral breadth and Warren-Averbach analyses can not give the same results for volume- weighted domain size although D)v is defined identically in both approaches because the appar- ent strain -q = pdeg(29)cot9 is not angular- independent
(viii) Smooth size coefficients give column- length distribution functions without oscillations and make possible a computation of volume- weighted average domain sizes up to ~5000 A
(ix) Comparison with the simplified integral- breadth methods in most cases has shown not large but systematic discrepancy of results indicat- ing that size and strain broadening can not be accu- rately modeled by a single Cauchy or Gauss function Moreover the application of the single- line method is much less reliable and it should not be used where multiple reflections are available
(x) The knowledge of all phases present in the sample and their crystallographic structure is re- quired to successfully fit a cluster of overlapping peaks Although it is very difficult to accurately de- termine the Cauchy-Gauss ratio of an overlapped peak final results of domain size and strain are much less affected Therefore connecting the crys- tallite size exclusively with the Cauchy content and strain with the Gauss content of a specimen profile might be doubtful
(xi) Evaluated errors of domain sizes and strains increase substantially with the degree of
350
Volume 98 Number 3 May-June 1993
Journal of Research of the National Institute of Standards and Technology
peak overlapping Hence for complicated patterns very accurate measurements are necessary and one needs to analyze as many reflections in the same crystallographic direction as possible
(xii) Line-broadening analysis of (La-M)2Cu04 and Bi-Cu-O compounds confirms high anisotropy in these materials
(xiii) Strains in (La-M)2Cu04 probably origi- nate from dislocations and from different sizes of host and dopant ions
(xiv) Stacking-fault probability in (La-M)2Cu04 (M = Ba Ca Sr) increases with increasing Tc whereas the average strain decreases
(xv) In La2Cu04 different broadening of (lOO) and (OfcO) reflections is not caused by stacking faults
(xvi) All Bi-Cu-0 superconductors show larger strain in the c-direction than in the a-b plane which can be explained by stacking disorder along the [001] direction
(xvii) In the specimen with approximately equal amounts of Tl-2212 and TlPb-2223 phases it is likely that a secondary phase develops by the growth of the microscopic faulted regions of the primary phase
Acknowledgments
I am thankful to Dr Harry McHenry for his support and especially to Dr Hassel Ledbetter for his wise guidance and most useful help during my stay at NIST I am also indebted to my home insti- tution the Faculty of Metallurgy of the University of Zagreb for allowing me the leave of absence at NIST
8 References
[1] W Friedrich P Knipping and M v Laue Ann Physik 41 971 (1912)
[2] H M Rietveld Acta Cryst 22 151 (1967) [3] H M Rietveld J Appl Cryst 2 65 (1969) [4] S A Howard and K D Preston in Modern Powder Dif-
fraction Vol 20 The Mineralogical Society of America Washington DC (1989) p 217
[5] D Taupin J Appl Cryst 6 266 (1973) [6] T C Huang and W Parrish Appl Phys Lett 27 123
(1975) [7] M K Wu J R Ashburn C J Torng P H Hor R L
Meng L Gao Z J Hwang Y Q Wang and C W Chu Phys Rev Lett 58 908 (1987)
[8] D Shi MRS Bull 16 37 (1991) [9] D Larbalestier Phys Today 44 74 (1991)
[10] J C Phillips Phys Rev B 4512647 (1992) [11] B Raveau Phys Today 45 53 (1992) [12] A J Millis and K M Rabe Phys Rev B 38 8908 (1988)
[13] F Guinea Europhys Lett 7 549 (1988) [14] C P Dhard and P Singh in Proc Int Symp High-Temp
Supercond Jaipur India Oxford amp IBH Publishing New Delhi (1988) p 271
[15] J D Jorgensen Phys Today 44 34 (1991) [16] J G Bednorz and K A Muller Z Phys B 64 189
(1986) [17] K Kishio K Kitazawa S Kaube I Yasuda N Sugii H
Takagi S Uchida K Fueki and S Tanaka Chem Lett 429 (1987)
[18] J D Jorgensen B Dabrowski S Pei D G Hinks L Soderholm B Morosin J E Venturini and D S Ginley Phys Rev B 38 11337 (1988)
[19] J R Clem Phys Rev B 43 7837 (1991) [20] M Paranthaman M Foldejiki D Balzar H Ledbetter
A J Nelson and A M Hermann submitted to Phys Rev B
[21] A R Stokes Proc Phys Soc Lond 61 382 (1948) [22] B E Warren and B L Averbach J Appl Phys 23 497
(1952) [23] R Delhez Th H de Keijser and E J Mittemeijer in
Accuracy in Powder Diffraction S Block and C R Hub- bard eds Natl Bur Stand (US) Special Publication 567 (1980) p 213
[24] H P Klug and L E Alexander X-ray Diffraction Proce- dures 2nd Edition John Wiley New York (1974) p 661
[25] J I Langford J Appl Ciyst 11 10 (1978) [26] J I Langford in Accuracy in Powder Diffraction S
Block and C R Hubbard eds Natl Bur Stand (US) Special Pubication 567 (1950) p 255
[27] R Delhez Th H de Keijser and E J Mittemeijer Fre- senius Z Anal Chem 312 1 (1982)
[28] A J C Wilson Proc Phys Soc Lond 80 286 (1962) [29] A J C Wilson Proc Phys Soc Lond 81 41 (1963) [30] L P Smith Phys Rev 46 343 (1934) [31] H C Burger and P H van Cittert Z Phys 79 722
(1932) [32] S Ergun J Appl Ciyst 1 19 (1968) [33] R Croche and L Gatineau J Appl Ciyst 10479 (1977) [34] L H Schwarz and J B Cohen Diffraction from Materi-
als Academic Press New York (1977) p 391 [35] R Delhez Th H de Keijser E J Mittemeijer and J I
Langford J Appl Cryst 19 459 (1986) [36] R Delhez Th H de Keijser E J Mittemeijer and J I
Langford Aust J Phys 41 213 (1988) [37] R A Young and D B Wiles J Appl Cryst 15 430
(1982) [38] W Voigt Stizungsber K Bayer Akad Wiss 42 603
(1912) [39] E E Whiting J Quant Spectrosc Radiat Transfer 8
1379 (1968) [40] G K Wertheim M A Butler K W West and D N E
Buchanan Rev Sci Instrum 111369 (1974) [41] M M Hall Jr V G Veeraraghavan H Rubin and P G
Winchell J Appl Cryst 10 66 (1977) [42] A Brown and J W Edmonds Adv X-Ray Anal 23 361
(1980) [43] P Suortti M Ahtee L Unonius J Appl Cryst 12 365
(1979) [44] T Sundius J Raman Spectrosc 1 471 (1973) [45] B H Armstrong J Quant Spectrosc Radiat Transfer 7
61 (1967) [46] J F Kielkopf J Opt Soc Am 63 987 (1973) [47] B P Asthana and W Kiefer Appl Spectr 36 250
(1982)
351
Volume 98 Number 3 May-June 1993
Journal of Research of the National Institute of Standards and Technology
[48] J P M de Vreede S C Mehrotra A Tal and H A Dijkerraan Appl Spectr 36 227 (1982)
[49] F R L Schoening Ada Ciyst 18 975 (1965) [50] P Scherrer Gott Nachr 2 98 (1918) [51] A R Stokes and A J C Wilson Proc Cambridge
Philos Soc 38 313 (1942) [52] A J C Wilson X-Ray Optics 2nd edition Methuen
London (1962) [53] S Leie and T R Anantharaman Proc Indian Acad
Sci Sect A H 261 (1966) [54] D Louer D Weigel and J I Langford J Appl Ciyst
5 353 (1972) [55] A J C Wilson J Appl Ciyst 2 181 (1969) [56] J I Langford and A J C Wilson J Appl Ciyst 11102
(1978) [57] A R Stokes and A J C Wilson Proc Phys Soc Lond
56174 (1944) [58] B E Warren and B L Averbach J Appl Phys 21 595
(1950) [59] B E Warren X-Ray Diffraction Addison-Wesley
Reading Massachusetts (1969) p 264 [60] B E Warren in Progress in Metal Physics Vol 8 Perg-
amon Press London (1959) p 146 [61] F Bertaut C R Acad Sci Paris 228 187 (1949) [62] N C Haider and C N J Wagner Acta Cryst 20 312
(1966) [63] D Balzar and H Ledbetter in Proceedings of the Accu-
racy in Powder Diffraction II Natl Inst Stand Technol (1992) p 37
[64] D Balzar and H Ledbeter J Appl Cryst 26 (1993) in press
[65] J N Eastabrook and A J C Wilson Proc Phys Soc Lond B 65 67 (1952)
[66] R S Smith IBM J Res Develop 4 205 (1960) [67] B Y Pines and A F Sirenko Soviet Physics Ciyst 715
(1962) [68] G B Mitra and N K Misra Acta Ciyst 22 454 (1967) [69] A Gangulee J Appl Ciyst 7 434 (1974) [70] J Mignot D Rondot Acta Met 231321 (1975) [71] J Mignot and D Rondot Acta Ciyst A 33 327 (1977) [72] R K Nandi H K Kuo W Schlosberg G Wissler J B
Cohen and B Crist Jr J Appl Ciyst 17 22 (1984) [73] M Zocchi Acta Ciyst A 36164 (1980) [74] P Ramarao and T R Anantharaman Trans Ind Ins
Metals 18 181 (1965) [75] R K Nandi and S P Sen Gupta J App Cryst 11 6
(1978) [76] Th H de Keijser J I Langford E J Mittemeijer and
B P Vogels J Appl Ciyst IS 308 (1982) [77] A Williams G H Kwei R B Von Dreele A C Lar-
son L D Raistrick and D L Bish Phys Rev B 37 7960 (1988)
[78] A C Larson and R B Von Dreele Los Alamos Na- tional Laboratory Report No LA-UR-86-748 (1988)
[79] J D Jorgensen D H Johnson M H Mueller J G Worlton and R B Von Dreele in Proceedings of the Conference on Diffraction Profile Analysis Cracow Poland (1978) p 20
[80] R B Von Dreele J D Jorgensen and C G Windsor J Appl Ciyst 15 581 (1982)
[81] P Thompson D E Cox and J B Hastings J Appl Ciyst 20 79 (1987)
[82] J P Singh R A Guttschow D S Kupperman J T Dusek and R B Poeppel in High Temperature Super-
conducting Compounds III S Whang A Gupta and E Ceilings eds TMS AIME Warrendale (1991) p 281
[83] M O Eatough D S Glnley and B Morosin Adv X- Ray Anal 33 145 (1990)
[84] E J Peterson P J Kung R E Muenchausen and D M Smith in Proceedings of the 41st Annual Denver Conference on Applications of X-Ray Analysis Colo- rado Springs Colorado (1992) p 74
[85] M Rand J I Langford and J S Abell submitted to J Cryogenics (1992)
[86] D Balzar J Appl Ciyst 25 559 (1992) [87] D Balzar H Ledbetter and A Roshko Physica C 185-
189 871 (1991) [88] D Balzar and H Ledbetter J Mater Sci Lett 111419
(1992) [89] D Balzar H Ledbetter and A Roshko Pow Diffr 8
(1993) in press [90] S Johnson M Gusraan D Rowcliffe T Geballe and J
Sun Adv Ceram Mater 2 337 (1987) [91] H Ledbetter S A Kim R B Goldfarb and K Togano
Phys Rev B 39 9689 (1989) [92] H Friedman Electronics 132 (1945) [93] W Parrish (ed) in Advances in X-Ray Diffractometry
and X-Ray Spectrography Centrex Publishing Company Eindhoven The Netheriands (1962)
[94] W Soller Phys Rev 24158 (1924) [95] S A Howard R L Snyder J Appl Ciyst 22 238
(1989) [96] G H Stout and L H Jensen X-Ray Structure Determi-
nation 2nd edition Wiley New York (1989) p 373 [97] D E Appleman and T Evans Jr Final Report 92-14
US Geological Survey Washington DC (1973) Avail- able as NTIS Document No PB-216188
[98] M U Cohen Rev Sci Instrum 6 68 (1935) [99] M U Cohen Rev Sci Instrum 7 155 (1936) [100] M H Mueller L Heaton and K T Miller Acta Ciyst
13 828 (1960) [101] R A Young P E Mackie and R B Von Dreele J
Appl Ciyst 10 262 (1977) [102] D B Wiles and R A Young J Appl Cryst 14 149
(1981) [103] J K Yau and S A Howard J Appl Ciyst 22 244
(1989) [104] S A Howard J K Yau and H U Anderson J Appl
Phys 65 1492 (1989) [105] S Enzo G Fagherazzi A Benedetti and S Poilizzi J
Appl Ciyst 21 536 (1988) [106] A Benedetti G Fagherazzi S Enzo and M
Battagliarin J Appl Cryst 21 543 (1988) [107] Th H de Keijser E J Mittemeijer and H C F Rozen-
daal J Appl Ciyst 16 309 (1983) [108] Y Zhang J M Stewart C R Hubbard and B Mo-
rosin Adv X-Ray Anal 33 373 (1990) [109] Y Wang S Lee and Y Ue J Appl Ciyst IS 35
(1982) [110] V N Selivanov and E F Smislov Zavod Lab 57 28
(1991) [Ill] A Guinier X-Ray Diffraction W H Freeman San
Francisco (1963) p 139 [112] M Wilkens J Appl Cryst 12119 (1979) [113] D Du and Y Wang Pow Diffr 2180 (1987) [114] A P Prudnikov Yu A Brychkov and O L Marichev
Integrals and Series Vol 1 Gordon and Breach Am- sterdam The Netheriands (1986) p 344
352
Volume 98 Number 3 May-June 1993
Journal of Research of the National Institute of Standards and Technology
[115] R L Rothman and J B Cohen J Appl Phys 42 971 (1971)
[116] T Adier and C R Houska J Appl Phys 50 3282 (1979)
[117] C R Houska and T M Smith J Appl Phys 52 748 (1981)
[118] S Rao and C R Houska Acta Ciyst A 4214 (1986) [119] J I Langford R Delhez Th H de Keijser and E J
Mittemeijer Ausi J Phys 41173 (1988) [120] J I Langfoid J Appl Cryst IS 315 (1982) [121] M J Turunen Th H de Keijser R Delhez and N M
van der Pers J Appl Ciyst 16176 (1983) [122] A J C Wilson Acta Ciyst 23 888 (1967) [123] A J C Wilson Acta Ciyst A 24 478 (1968) [124] A J C Wilson Acta Ciyst A 25 584 (1969) [125] G Gagliotti A Paoletti and F P Ricci Nucl Instrum
3 223 (1958) [126] J I Langford R J Cernik and D Louer J Appl
Ciyst 24 913 (1991) [127] J I Langford in Accuracy in Powder Diffraction II
preprint [128] A J C Wilson Mathematical Theory of X-Ray Powder
Diffractometiy Centrex Eindhoven The Netherlands (1963)
[129] J L Langford Prog Ciyst Growth and Charact 14185 (1987)
[130] T G Fawcett C E Crowder S J Brownell Y Zhang C R Hubbard W Schreiner G P Hamill T C Huang E Sabino J I Langford R Hamilton and D Louer Pow Diffr 3 209 (1988)
[131] W L Smith J Appl Ciyst 9187 (1976) [132] J L Langford and D Louer J Appl Ciyst 15 20
(1982) [133] Fl Popescu and L Benes Acta Ciyst A 33 323 (1977) [134] P PSuse^cu R MSnaila M Popescu and E Jijovici j
Appl Cryst 7 281 (1974) [135] P F Bley Y Calvayrac and M Fayard J Appl Ciyst
7 493 (1974) [136] B Moraweck Ph de Montgolfier and A J Renouprez
J Appl Ciyst 10191 (1977) [137] A Le Bail and D Louer J Appl Cryst 11 50 (1978) [138] D R Buchanan R L McCuUough and R L Miller
Acta Ciyst 20 922 (1966) [139] P Suortti and L D Jennings Acta Cryst A 33 1012
(1977) [140] J B Cohen and C N J Wagner J Appl Phys 33 2073
(1962) [141] A Bianconi J Budnick A M Flank A Fontaine P
Lagarde A Marcelli H Tolentino B Chamberland C Michel B Raveau and G Demazeau Phys Lett A127 285 (1988)
[142] K Fueki K Kitazawa K Kishio T Hasegawa S Uchida H Takagi and S Tanaka in Chemistiy of High- Temperature Superconductors D L Nelson M S Whittingham and T F George eds American Chemi- cal Society (1987) p 38
[143] T Fujita Y Aoki Y Maeno J Sakurai H Fukuba and H Fujii J Appl Phys 26 U68 (1987)
[144] R M Hazen in Physical Properties of High-rc Super- conductors Vol 2 D M Ginsberg ed World Scien- tific Singapore (1990) p 121
[145] J B Torrance A Bezinge A I Nazzal T C Huang S P Parkin D T Keane S J LaPlaca P M Horn and G A Held Phys Rev B 40 8872 (1989)
[146] J D Axe A H Moudden D Hohlwein D E Cox K
M Mohanty A R Moodenbaugh and Y Xu Phys Rev Lett 62 2751 (1989)
[147] T Suzuki and T Fujita Physica C 159 111 (1989) [148] T Fujita and Y Maeno in Superconducting Materials
JJAP Series 1 (1988) p 34 [149] A Roshko and Y-M Chiang J Appl Phys 66 3710
(1989) [150] D E Cox S C Moss R L Meng P H Hor and C W
Chu J Mater Res 31327 (1988) [151] B Crist and J B Cohen J Polym Sci 17 1001 (1979) [152] H Ledbetter S Kim and A Roshko Z Phys B 89275
(1992) [153] R D Shannon and C T Prewitt Acta Ciyst B 25 925
(1969) [154] M Lang H Spille F Steglich Y Hidaka T Murakami
and Y Endoh Physica C 162-1641037 (1989) [155] Y Hidaka and T Murakami Phase trans 15 241
(1989) [156] P L Gai and E M McCarron Science 247 553 (1990) [157] T Kamiyama I Izumi H Asano H Takagi S Uchida
Y Tokura E Takayama-Muromachi M Matsuda K Yamada Y Endoh and Y Hidaka Physica C 172 120 (1990)
[158] A Kapitulnik Physica C 153-155 520 (1988) [159] L A Muradyan V N Molchanov R A Tamazyan and
V I Simonov Physica C 162-164 536 (1989) [160] P Day M Rosseinsky K Prassides W I F David O
Moze and A Soper J Phys C 20 L429 (1987) [161] J T Lewandowski R A Beyerlein J M Longo and R
A McCauley J Amer Ceram Soc 69 699 (1986) [162] R Ramesh G van Tendeloo G Thomas S M Green
Y Mei C Jiang and H L Luo Appl Phys Lett 53 2220 (1988)
[163] J Schneck L Pierre J C Tolddano and C Daguet Phys Rev B 39 9624 (1989)
[164] O Eibl Physica C 168 215 (1990) [165] W Carrilo-Cabrera and W Gopel Physica C 161 373
(1989) [166] P Bordet J J Capponi C Chaillout J Chenavas A
W Hewat E A Hewat J L Hodeau M Marezio J L Tholence and D Tranqui Physica C 156189 (1988)
[167] R Ramesh K Remschnig J M Tarascon and S M Green J Mater Res 6 278 (1991)
[168] Z Hiroi Y Ikeda M Takano and Y Bando J Mater Res 6 435 (1991)
[169] Y Inoue M Hasegawa Y Shichi I Munakata M Ya- manaka S Hiyama and O Nittono J Mater Res 5 737 (1990)
[170] R Ramesh B G Bagley J M Tarascon S M Green M L Rudee and H L Luo J Appl Phys 67 379 (1990)
[171] X B Kan J Kulik P C Chow S C Moss Y F Yan J H Wang and Z X Zhao J Mater Res 5 731 (1990)
[172] G S Pawley J Appl Ciyst 13 630 (1980) [173] H Toraya J Appl Ciyst 19 440 (1986) [174] L Lutterotti and P Scardi J Appl Ciyst 23 246
(1990)
About the author Davor Balzar is with Faculty of Metallurgy of the University of Zagreb Sisak Croatia and was a Guest Researcher at fflST The National Institute of Standards and Technology is an agency of the Technology Administration US Department of Commerce
353
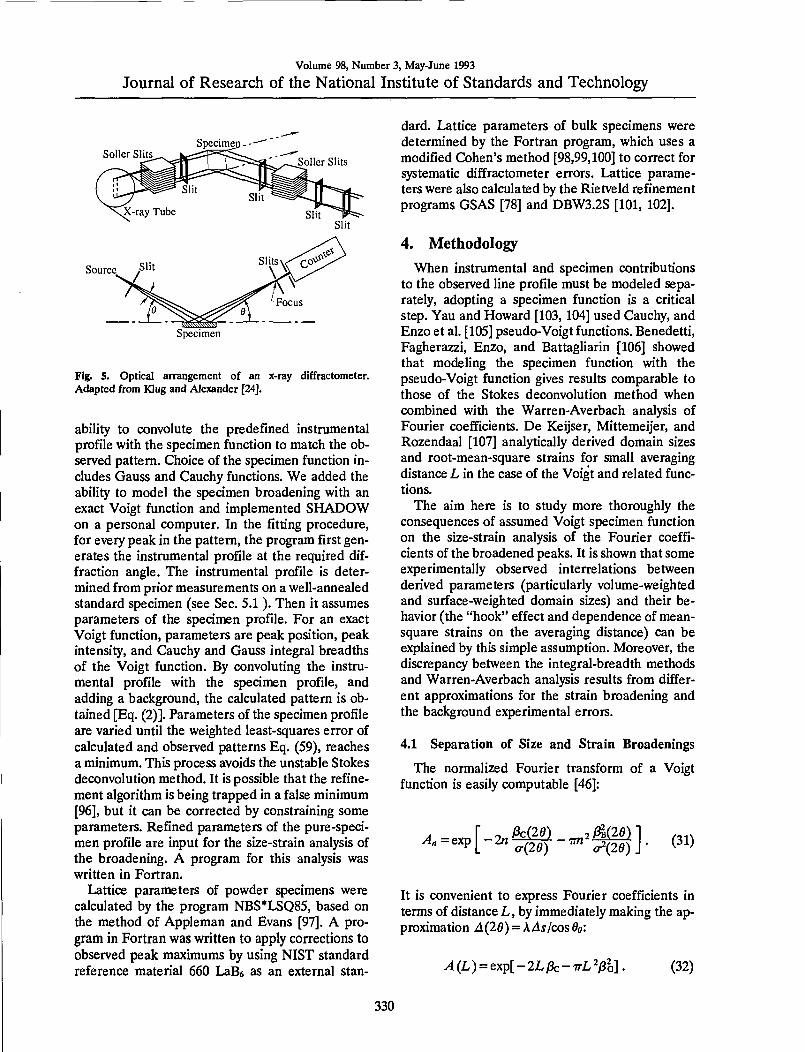
Volume 98 Number 3 May-June 1993
Journal of Research of the National Institute of Standards and Technology
Seller Slits
Source S
Specimen
Fig 5 Optical arrangement of an x-ray diffractometer Adapted from Klug and Alexander [24]
ability to convolute the predefined instrumental profile with the specimen function to match the ob- served pattern Choice of the specimen function in- cludes Gauss and Cauchy functions We added the ability to model the specimen broadening with an exact Voigt function and implemented SHADOW on a personal computer In the fitting procedure for every peak in the pattern the program first gen- erates the instrumental profile at the required dif- fraction angle The instrumental profile is deter- mined from prior measurements on a well-annealed standard specimen (see Sec 51) Then it assumes parameters of the specimen profile For an exact Voigt function parameters are peak position peak intensity and Cauchy and Gauss integral breadths of the Voigt function By convoluting the instru- mental profile with the specimen profile and adding a background the calculated pattern is ob- tained [Eq (2)] Parameters of the specimen profile are varied until the weighted least-squares error of calculated and observed patterns Eq (59) reaches a minimum This process avoids the unstable Stokes deconvolution method It is possible that the refine- ment algorithm is being trapped in a false minimum [96] but it can be corrected by constraining some parameters Refined parameters of the pure-speci- men profile are input for the size-strain analysis of the broadening A program for this analysis was written in Fortran
Lattice parameters of powder specimens were calculated by the program NBSLSQ85 based on the method of Appleman and Evans [97] A pro- gram in Fortran was written to apply corrections to observed peak maximums by using NIST standard reference material 660 LaB6 as an external stan-
dard Lattice parameters of bulk specimens were determined by the Fortran program which uses a modified Cohens method [9899100] to correct for systematic diffractometer errors Lattice parame- ters were also calculated by the Rietveld refinement programs GSAS [78] and DBW32S [101 102]
4 Methodology
When instrumental and specimen contributions to the observed line profile must be modeled sepa- rately adopting a specimen function is a critical step Yau and Howard [103104] used Cauchy and Enzo et al [105] pseudo-Voigt functions Benedetti Fagherazzi Enzo and Battagliarin [106] showed that modeling the specimen function with the pseudo-Voigt function gives results comparable to those of the Stokes deconvolution method when combined with the Warren-Averbach analysis of Fourier coefficients De Keijser Mittemeijer and Rozendaal [107] analytically derived domain sizes and root-mean-square strains for small averaging distance L in the case of the Voigt and related func- tions
The aim here is to study more thoroughly the consequences of assumed Voigt specimen function on the size-strain analysis of the Fourier coeffi- cients of the broadened peaks It is shown that some experimentally observed interrelations between derived parameters (particularly volume-weighted and surface-weighted domain sizes) and their be- havior (the hook effect and dependence of mean- square strains on the averaging distance) can be explained by this simple assumption Moreover the discrepancy between the integral-breadth methods and Warren-Averbach analysis results from differ- ent approximations for the strain broadening and the background experimental errors
41 Separation of Size and Strain Broadenings
The normalized Fourier transform of a Voigt function is easily computable [46]
^ =exD[-2laquo^e^-7m^^fi^l fan ^bdquo-exp|^ ^ cr(2e) ^ a^(2e) T ^^^^
It is convenient to express Fourier coefficients in terms of distance L by immediately making the ap- proximation A (26) = Ascos do
AL) = exp[-2L^-7rL^pl] (32)
330
Volume 98 Number 3 May-June 1993
Journal of Research of the National Institute of Standards and Technology
Equation (32) is a good approximation even for large specimen broadening Even for a profile span of A (29) = 80deg the error made by replacing this in- terval by an adequate A(sin9 ) range is 2 How- ever strictly speaking the profile will be asym- metrical in reciprocal space and Fourier-interval limits will not correspond to the 29i and Idz peak- cutoff values in real space It is important to keep Fourier interval limits identical for all multiple-or- der reflections otherwise serious errors in the sub- sequent analysis will occur [108] If higher accuracy for a considerable broadening is desired profile fit- ting can be accomplished In terms of the recipro- cal-space variable s instead of in a real 29 space
Assuming that only the Cauchy function deter- mines domain size [4(L) = exp(-L(Z))s)] and only the Gauss function gives root-mean-square strain (RMSS) [^deg(L) = exp(-27r=L2(e)d^)] Eq (32) leads to the Warren-Averbach [Eq (20)] for the separation of size and strain contribution [62] Experience shows that Cauchy and Gauss functions can not satisfactory model specimen broadening Balzar and Ledbetter [64] postulate that the speci- men function includes contributions of size and strain effects both approximated with the Voigt functions Because the convolution of two Voigt functions is also a Voigt function Cauchy and Gauss integral breadths of the specimen profile are easily separable
3c=i3sc + 3DC (33)
(34)
Langford [26] separated the contributions from size and strain broadening in a similar way (See Eqs (27) and (28)) Note however that Eqs (33) and (34) do not define size and strain angular or- der-dependence
Because Fourier coefficients are a product of a size and a distortion coefficient from Eqs (32) (33) and (34) we can obtain the separation of size and strain contributions to the pure specimen broadening
^S(L) = exp(-2Li3sc-TrL^3io) (35)
Adeg(L) = eM-2LpDc-TrL^Phc) (36)
Wang Lee and Lee [109] modeled the distortion coefficient and Selivanov and Smislov [110] mod- eled the size coefficient in the same way
To obtain size and distortion coefficients at least two reflections from the same crystallographic- plane family must be available
42 Size Coefficient
Surface-weighted domain size is calculated from the size coefficients following Eq (21) From Eq (35) we obtain
lt^gts = 1
2i3sc (37)
Therefore surface-weighted domain size depends only on the Cauchy part of the size-integral breadth
The second derivative of the size coefficients is proportional to the surface-weighted column-length distribution function Eq (22) The volume- weighted column-length distribution function fol- lows similarly [111]
p(L)ocL^j^ (38)
By differentiating Eq (35) twice we obtain
^^4^ = [(2^L^ic + 2^sc)^- dL
2TrplcAL) (39)
Because the column-length distribution function should always be positive [59] the Cauchy part must dominate Inspection of Eq (39) shows that for small L we must require
(40)
Otherwise the hook effect will occur in the plot of size coefficientsI (L) versus L that is the plot will be concave downward for small L (Fig 6) The hook effect is usually attributed to experimental errors connected with the truncation of the line profiles and consequently overestimation of background [59] This is a widely encountered prob- lem in the Fourier analysis of line broadening It results in overestimation of effective domain sizes and underestimation of the RMSS [36] Some authors [106] claim that the preset specimen- broadening function eliminates the hook effect However Eq (39) shows that effectively too high
331
Volume 98 Number 3 May-June 1993
Journal of Research of the National Institute of Standards and Technology
08-
04-
mdash^ 1 J 1 x
^~ ( ^ ^ i I
1 t 1 11
jl u
V 1 iJ
J
c^
100 200
Fig 6 (upper) The hook effect of the size coefficients A ^ (full line) at small L (lower) it causes negative values (set to zero) of the column-length distribution functions
background causes underestimation of the Cauchy content of the Voigt function because the long tails are truncated prematurely It has to be men- tioned that Wilkens [112] proposed tilted small-an- gle boundaries to be the source of the hook effect Liu and Wang [113] defined a minimum particle size present in a specimen depending on the size of the hook effect Figure 6 shows that negative values of the column-length distribution functions (set to zero) do not affect the shape but shift the entire distribution toward larger L values
Note also that the surface-weighted column- length distribution function ps(L) will usually have a maximum at L = 0 but for the particular ratio of integral breadths determined by Eq (40) it can be zero The volume-weighted column-length distribu- tion function7v(L) will always have a maximum for LsO
If the column-length distribution functions are known it is possible to evaluate mean values of respective distributions
lt^kv =
00
J ^ _0
(L)dL
raquosv(L)dL (41)
Integrals of this type can be evaluated analytically [114]
OQ
J cexp( - to^ - a )dc = i^y^ ^ of
hd^^^^fe)]- (^2)
Surface-weighted domain size (D)s must be equal to the value obtained from Eq (37) The volume- weighted domain size follows
ltD)v = ^^erfc(A) = js (43)
Using Eqs (37) and (43) we can evaluate the ratio of domain sizes
i^ = 7r lt^gts
= 2vn-^exp(A2)erfc(^) (44)
Theoretically k can change from zero to infinity However the minimum value of k is determined by Eq (40)
1V2 ltk lt laquogt (45)
Hence the ratio of domain sizes can change in a limited range (see also Fig 7)
131laquo V2^ erfc (^ ) s ^ lt 2 (46)
10^ 10^ 10- 10deg 10 10^ 10-
Fig 7 The ratio of volume-weighted and surface-weighted domain sizes as a function of the characteristic ratio of Cauchy and Gauss integral breadths k
332
Volume 98 Number 3 May-June 1993
Journal of Research of the National Institute of Standards and Technology
It may be noted that most experiments give the ratio D)vD)s in this range (see for instance re- view by Klug and Alexander [24]) When k goes to infinity the size broadening is given only by the Cauchy component and (JD)V=2(D)S This is a case of pure Cauchy size broadening described by Haider and Wagner [62] and de Keijser Mittemei- jer and Rozendaal [107] It is possible to imagine a more complicated column-length distribution func- tion [27] than Eq (39) which would allow even larger differences between surface-weighted and volume-weighted domain sizes However we are not aware of any study reporting a difference larger than 100
43 Distortion Coefficient
In Sec 212 it was shown that the distortion co- efficient can be approximated by the exponential
Adeg(L) = exp(-ITTVLeL))) (47)
Comparing with Eq (36) we can write
Therefore mean-square strains (MSS) decrease linearly with averaging distance L This behavior is usually observed in the Warren-Averbach analysis Rothman and Cohen [115] showed that such be- havior would be expected of strains around disloca- tions Adler and Houska [116] Houska and Smith [117] and Rao and Houska [118] demonstrated for a number of materials that MSS can be repre- sented by a sum of two terms given by Cauchy and Gauss strain-broadened profiles
However for i3Dc=0 the MSS are independent ofL
(^2)12 ^ ^Dc(2g) cotg = ^ 2V2 V2TT
(49)
where the upper limit of strain e is defined as 7j4 (see Sec 212) This is a limiting case of pure- Gauss strain broadening described by de Keijser Mittemeijer and Rozendaal [107]
44 Discussion
To calculate domain sizes and strain it is neces- sary to define size and distortion integral-breadths angular order-dependence From Eq (43) It fol- lows that the domain size D )v is always indepen- dent of the order of reflection
)3sc = const JSSG = const
However from Eq (48) we find
^^ = const ^^ = const
(50)
(51)
An important consequence is that apparent strain TJ will be independent of angle of reflection only in the case of pure-Gauss strain broadening because 3DC and JSDG depend differently on the dif- fraction angle If we compare Eq (51) with the multiple-line Voigt-function analysis [26] given by Eqs (27) and (28) it is evident that they disagree Therefore recombination of constituent integral breadths 3DC and 3DO to Voigt strain-broadened in- tegral breadth Pdeg and the subsequent application of Eq (49) to calculate strain [26 119] will concur with the Fourier methods if strain broadening is entirely Gaussian and for the asymptotic value of MSS ((e^( 00))) However neither volume-weighted domain sizes D)y will agree although they are de- fined identically in both approaches because size- broadened and strain-broadened integral breadths are dependent variables
If at least two orders of reflection ( and +1) of the same plane (hkl) are available using Eqs (50) and (51) we can solve Eqs (33) and (34)
(52)
^^deg sl + l)-sil) ^^^^
^^=sHl + l)-sl) [fc( + l)-3c()3 (54)
^^=sl + l)-sl) [^(^ + ^)-^(0]- (55)
If we substitute these expressions into Eqs (35) and (36) we see that this approach leads exactly to the Warren-Averbach Eq (20) for two orders of reflections This is expected because the distortion coefficient is approximated with the exponential (47)] Delhez de Keijser and Mittemeijer [23] ar- gued that instead of Eq (20) the following rela- tion would be more accurate
A(L)=AXL) (1 -27r^(e^(L))LVd (56)
333
Volume 98 Number 3 May-June 1993
Journal of Research of the National Institute of Standards and Technology
These two approximations differ with fourth-order terms in the power-series expansion In terms of this approach Eq (48) has to be rewritten
2r ^^ l-exp(-2LI3DC-TTL^0DG) (57)
This means that even if the strain-broadened pro- file is given entirely by the Gauss function the MSS depend on distance L (see Fig 8) In this ap- proximation no simple relation for the distortion integral-breadths angular order-dependence exists For not so large L however Eq (51) holds and approximations from Eqs (20) and (56) do not dif- fer much (see Fig 8)
1500 Warren- Averbach approximation ^
Delhez de Kcijscr and ^^^ Minemeijer approximation ^y^
^ 1000 A
500
mdashI
1 1
Oc 300 600 IL k^) X 10^
90
o ^ 60 A
30
1
J Warren- Averbach approximation
Delhez de Keijser and Minemeijer approximation
0 0 150 300
1L (A-1 ) X 10^
Fig 8 Mean-square strains pound^(L)) for two approximations of the distortion coefficient (upper) Voigt strain broadening (lower) pure-Gauss strain broadening
Generally it was shown that in the size-broad- ened profile the Cauchy part must dominate No similar requirement for the strain-broadened pro- file exists However experience favors the assump- tion that it has to be more of Gauss-type The Warren-Averbach approach is exact if strain broad- ening is purely Gaussian so Eqs (20) and (48) are
better approximations as strain profile is closer to the Gauss function In any case both approaches given by Eqs (20) and (56) are good up to the third power in strain and the Warren-Averbach relation [Eq (20)] does not assume that MSS are independent of distance L [27] it also represents a harmonic approximation
If at least two orders of reflection from the same plane (hkl) are available we can use Eqs (52) (53) (54) and (55) to calculate size-related and strain-related integral breadths Subsequent appli- cation of Eqs (37) (43) and (48) gives directly domain sizes (D) and (D)v and mean-square strains (e^(L)) This approach is more straightfor- ward and much simpler than the original Warren- Averbach analysis Great care should be given to the possible systematic errors The easiest way to observe the hook effect is to plot column-length distribution functions as a function of averaging distance L If they show negative values for small L (see Fig 6) all derived parameters will be in error This is because (i) only the positive values of the column-length distribution functions are numeri- cally integrated or (ii) the intercept on the L-axis of the linear portion of the A^ vs L curve is taken (see Fig 4) always larger values of domain sizes will be obtained than by the application of Eqs (37) and (43) Therefore we conclude that the dis- crepancy between integral-breadth and Fourier methods is always present by the appearance of the hook effect in the A^ vs L curve An analogous discrepancy exists between integral-breadth and variance methods [119] In such cases correction methods for truncation can be applied [35 119 120] but the best procedure is to repeat the pat- tern fitting with the correct background
In the Fourier analysis it is usually observed that the mean-square strains diverge as the averaging distance L approaches zero This also follows from Eqs (48) and (57) However because the MSS de- pendence on distance L is not defined in Warren- Averbach analysis it was suggested [27 107 121] that local strain can be obtained by taking the sec- ond derivative of the distortion coefficient or by a Taylor-series expansion of local strain Therefore we obtain from Eq (36)
i^m-M^-^) (58)
It is evident that this relation is wrong It holds only for a special case of pure-Gauss strain-broad- ened profile when the MSS are equal for any L Otherwise if the Cauchy function contributes to
334
Volume 98 Number 3 May-June 1993
Journal of Research of the National Institute of Standards and Technology
strain broadening all derivatives of strain in L = 0 are infinite and local strain can not be defined If the main origin of strains is dislocations [115] strains are defined after some distance from the dislocation (cutoff radius) to be finite Averaging strains over a region smaller than the Burgers vector is probably not justified For instance Eq (48) gives even for a small averaging distance L = 1 A and considerable strain broadening (J3DG(20) = 3DC(20) = 1O) root-mean-square strain eL = 1A))^ laquo02 that is about the elastic limit
45 Random Errors of Derived Parameters
Errors in size and strain analysis of broadened peaks are relatively difficult to evaluate Following Langford [26] sources of the systematic errors in- clude choice of standard specimen background and type of analytical function used to describe the line profiles The first two errors should be mini- mized in the experimental procedure Errors caused by inadequate choice of specimen function would systematically affect all derived results but they can not be evaluated Random errors caused by counting statistics have been computed by Wilson [122 123 124] and applied to the Stokes deconvolution method by Delhez de Keijser and Mittemeijer [23] as well as by Langford [26] and de Keijser et al [76] using single-line Voigt-func- tion analysis Nevertheless the approximate error magnitude can be calculated from estimated stan- dard deviations (esd) of the parameters refined in the fitting procedure In the program SHADOW the weighted least-squares error is minimized
7wp mdash RES
Here
)=1
RES = 2 vfi [ (obs) - (cal)]
(59)
(60)
and weights are the reciprocal variances of the ob- servations
H = l(obs) (61)
Each line profile has four parameters varied inde- pendently position intensity and Cauchy and Gauss integral breadths of the Voigt profile In least-squares refinement esds are computed as
^^ bu RES (62) m mdashm
Here ba are diagonal elements of the inverse matrix of the equation coefficients m is the number of observations and m is the number of refined parameters The main source of errors is integral breadths Errors in peak position peak intensity and background are much smaller and can be ne- glected in this simple approach For two indepen- dent variables )3G and Pc covariance vanishes and from Eqs (37) and (38) for the two orders of re- flection and +1 it follows that
RD =
si+i)m)RHMi))+si)m+i)i^(3c(+D)
(63)
ReL)r) =
pHDRHPcG)) + m + miPcJl + D) 2[3c(+1) - i8c()3+TTL [m+1) - mw
-n-LmiDRHihd))+m+mWcH+i))i ^ 2[)3c(+1) - iSc()+TTLim+1) - mw
(65)
Here Rx) are relative standard deviations The error in D would be complicated to evaluate but because 131D)s^(Igt)vlt2(pound))s Eq (63) gives a good estimation for the error in (Z))v as well Alter- natively to see how errors depend on the Fourier coefficients errors can be estimated from the Warren-Averbach relationship [Eq (20)] (86) From Eq (32) it follows that
RA (L)) = ATr^Lpos)R^2d)) +
4Lph(s)RPci2e)) (66)
Errors in root-mean-square strains and domain sizes are
i^((e^(L ))bulllaquo) =
RHA(Ll))+RHA(Ll + l)) (67)
ALl + l)
335
Volume 98 Number 3 May-June 1993
Journal of Research of the National Institute of Standards and Technology
^^laquo^))=(T^)
s(l + 1)RHA (Ll)) +SV)RHA (Ll + D) lsl + l)-sl)f (68)
Here (D) is approximately defined with A^(L) = l-L(D)j Errors in Fourier coefficients increase with L while factors in Eqs (67) and (68) lower the errors for large L In general errors of domain sizes and strains are of the same order of magnitude as errors of integral breadths [86]
5 Application 51 Correction for Instrumental Broadening
Before specimen broadening is analyzed instru- mental broadening must be determined This is ac- complished by carefully measuring diffraction peaks of some well-annealed defect-free speci- men It is then assumed that its broadening may be attributed only to the instrument The usual proce- dure is to anneal the specimen However in some instances that is not possible because either the material undergoes an irreversible phase transition on annealing or the number of defects can not be successfully decreased by annealing Another pos- sibility is to measure the whole diffraction pattern of the material showing the minimal line broaden- ing and then to synthesize the instrumental profile at the needed diffraction angle This approach re- quires the modeling of the angle dependence of the instrumental (standard) parameters Cagliotti Pao- letti and Ricci [125] proposed the following func- tion to describe the variation of the full width at the half maximum of profile with the diffraction angle
F9miA^(2e) = Utan^9 + Vtand + W (69)
Although this function was derived for neutron dif- fraction it was confirmed to work well also in x-ray diffraction case [126 127] A more appropriate function for the x-ray angle-dispersive powder dif- fractometer based on theoretically predicted er- rors of some instrumental parameters [128] may be the following [129]
FWHNf (2 e) = W+Vsin^l 6 +
UtanH + UcotH (70)
This function may better model the increased axial divergency at low angles and correct for the speci- men transparency [129] However contrary to the requirement on the specimen function most im- portant for the instrumental function is to correctly describe the angular variation of parameters re- gardless of its theoretical foundation
When specimen broadening is modeled with a Voigt function the simplest way to correct for the instrumental broadening is by fitting the line pro- files with the Voigt function too Cauchy and Gauss integral breadths of the specimen-broad- ened profile are then easily computable by Eqs (7) and (8) However because the instrumental broad- ening is asymmetric [24] modeling with the sym- metric Voigt function can cause a fictitious error distribution resulting in errors of strain up to 35 [76] Another approach is to model the instrumen- tal-broadening angle dependence by fitting the profile shapes of a standard specimen with some asymmetrical function split-Pearson-VII [95] or pseudo-Voigt convoluted with the exponential function [105] The instrumental function can then be synthesized at any desired angle of diffraction and convoluted with the assumed specimen func- tion to match the observed profile by means of Eq (2)
In the program SHADOW instrumental para- meters are determined by fitting the split-Pearson VII function (see Fig 9) to line profiles of a standard specimen
iix)=m- 2 m
with
c =-
mc^f
mm) mv-rim-12)
(71)
(72)
Here m = 1 or m = ltraquo yields a Cauchy or Gauss function respectively Refined full widths at half maximum (FWHM) and shape factors m for both low-angle and high-angle sides of the profiles are fitted with second-order polynomials To fit the FWHM we used Eq (69) and for the shape fac- tors
m(2e) = U(20f + V(2e) + W (73)
The resulting coefficients U V W U V and W permit synthesis of the asymmetrical instrumental line profile at any desired angle
336
Volume 98 Number 3 May-June 1993
Journal of Research of the National Institute of Standards and Technology
2 0(deg)
le
Fig 9 A split-Pearson VII profile The two half profiles have same peak position and intensity Adapted from Howard and Preston [4]
The basic requirement on the standard specimen is however to show as small a line broadening as possible To minimize physical contributions to the Une broadening of the standard specimen a few moments were emphasized as follows Because dif- fraction-line width depends strongly on degree of annealing it is preferable to use some reference powder-diffraction standard Furthermore asym- metry in the peak profiles is introduced by axial divergence of the beam flat specimen surface and specimen transparency [24] Choosing a standard specimen with low absorption coefficient would cause transparency effects to dominate If the stud- ied specimen has a large absorption coefficient (compared to the standard) this might produce a fictitious size contribution and errors in micro- strains All of the specimens studied have absorp- tion coefficients exceeding 1000 cm^ so a NIST standard reference material 660 LaBe was chosen to model the instrumental broadening (p = 1098 cm) According to Fawcett et al [130] LaBe showed the narrowest lines of all studied com- pounds Furthermore LaB6_has a primitive cubic structure (space group Pm3m) resulting in rela- tively large number of peaks equally distributed over 26 This allows for better characterization and lower errors of FWHMs and shape factors of split- Pearson VII functions (Fig 10)
52 Applicability of the Method
To study the applicability of method described in Sec 4 we first studied simple cubic-structure mate- rials such as silver and tungsten Tungsten has very narrow line profiles allowing us to obtain the up- per limit of domain sizes that can be studied Silver is easily deformed which provides a possibility to apply the method to broad line profiles To test the
009
-a
OH
006
003
1 1 m low-angle side n m high-angle side
bullz w 2 o OH
X
tancopy
Fig 10 Refined FWHMs and shape factors (exponents) m for low-angle and high-angle sides of LaBe line profiles Second- order polynomials were fitted through points
case of relatively complicated patterns and weak line broadening the method was also applied to Lai85Sroi5Cu04 and La2Cu04 powders In this sec- tion only the mechanical aspects of the line broad- ening are discussed Discussion about the origins of broadening of superconductors can be found in Sec 6
521 Silver and Tungsten Powders Figure 11 shows observed and refined peaks of tungsten un- treated and silver ground powders In Table 2 are listed results of fitted pure-specimen Voigt profiles for silver and tungsten specimens Table 3 and Fig 12 give results of the line-broadening analysis Untreated tungsten powder shows relatively weak broadening Instrumental profile FWHMs at angle positions of (110) and (220) tungsten lines are 0059deg and 0081deg respectively close to values mea- sured for tungsten 0065deg and 0100deg Results in Table 3 reveal that small broadening is likely caused by domain sizes because microstrains have negligible value This pushes the limit for measur- able domain sizes probably up to 4500-5000 A However one must be aware that weak specimen broadening implies higher uncertainty of all derived parameters Moreover the choice of the instrumental standard becomes more crucial
Both silver and tungsten line profiles become more Cauchy-like after grinding which probably increases dislocation density in the crystallites This is consistent with the presumption that small crystallites and incoherently diffracting domains separated by dislocations within grains affect the tails of the diffraction-line profiles [60115] Figure 13 illustrates the dependence of MSS on the recip- rocal of the averaging distance L
337
Volume 98 Number 3 May-June 1993
Journal of Research of the National Institute of Standards and Technology
C8
z
7- ^95
29 (deg) 405
bullJf^r-
z S 08
Ez U o u OS
a
04 bull
o Es
4P
2000 z^fA
4000
B
z u f- z
425 435 445 29 (deg)
455
yr 600 SOO
L(A)
Fig 11 Observed points (pluses) refined pattern (full line) and difference pattern (below) (110) W untreated (upper) (200) Ag ground (lower)
Fig 12 Fourier coefficients for the first- (pluses) and second- order (crosses) reflection and size coefficients (circles) [111] Ag untreated (upper) [100] Ag ground (lower)
Table 2 Parameters of the pure-specimen Voigt function as obtained from profile-fitting procedure for tungsten and silver powders
Specimen hkl 2ft(deg) 3c(deg) 3G(deg) FWHM(deg) Rwp()
W untreated 110 220
4028 8705
00065(7) 00301(6)
0020(2) ltio-
0021 0019
90 44
W ground 110 220
4029 8705
0100(2) 0222(3)
0038(4) 0069(6)
0080 0166
90 42
Ag untreated 111 222 200 400
3806 8151 4425 9786
0056(1) 0105(4) 0118(2) 0274(21)
ltio- 00008(21)
ltio-^ ltio-5
0036 0067 0075 0175
105 97
105 122
Ag ground 111 222 200 400
3807 8151 4424 9783
0175(3) 0410(26) 0365(10) 1079(82)
0038(12) ltio-
0076(29) ltio-
0121 0261 0250 0687
99 145 99
145
338
Volume 98 Number 3 May-June 1993
Journal of Research of the National Institute of Standards and Technology
Table 3 Microstructural parameters for tungsten and silver powders
Specimen Direction (poundgt)raquo( A) (2))v(A) ltpound^(fl3))laquo (^laquoD)v2)gtw
W untreated [110] 3200(200) 3500(200) 000038 000008(2)
W ground [110] 620(20) 1030(30) 00023 000054(2)
Ag untreated [111] [100]
1000(20) 510(20)
2000(20) 1030(20)
00010 00022
000024(1) 000047(5)
Ag ground [111] [100]
380(20) 210(10)
650(20) 350(20)
00047 00100
000095(7) 000180(14)
100 -_ - [100) Ag ground ^ ^~ mdash C1111 Ag ground ^bull
y y
o y ^ 50 A y
y y
y
0
y - y ^--
c ) 50 100 150
lLfAjxlO^
Fig 13 Mean-square strains (E^) as a function of VL
Errors in integral breadths allow estimation of errors in strain and size parameters (Sec 45) but in some cases the refinement algorithm gives unre- liable errors of integral breadths When a particu- lar parameter is close to the limiting value (for instance 10^ degrees has been put as the mini- mum value for integral breadths) errors become large However in Eqs (63) (65) (66) (67) and (68) only the product of integral breadth and ac- companying error is significant which is roughly equal for Cauchy and Gauss parts Errors of do- main sizes and strains are of the same order of magnitude as errors of integral breadths
The possible source of systematic error is poten- tial inadequacy of Voigt function to accurately de- scribe specimen broadening This effect can not be evaluated analytically but it would affect all derived parameters especially the column-length distribution functions The logical relationship be- tween values of domain sizes (see Table 3) for dif- ferent degrees of broadening indicates that possible systematic errors can not be large
Equation (41) allows computation of volume- weighted and surface-weighted average domain sizes if respective column-length distribution func- tions can be obtained Figure 14 gives surface- weighted and volume-weighted average column- length distribution functions following Eqs (39) and (38) Width of the distribution function deter- mines the relative difference between (D) and (pound))v The broader the distribution the larger the differences because small crystallites contribute more to the surface-weighted average That is much more evident comparing the surface- weighted column-length distribution with the vol- ume-weighted If they have similar shape and maximum position as in Fig 15 differences are small Conversely if the surface-weighted distribu- tion function has a sharp maximum toward smaller sizes differences are larger (see Fig 14) The dif- ference between (poundgt)s and (D)v and the actual mean dimension of the crystallites in a particular direction also depends strongly on the average shape of the crystallites [52 131 132]
If experimental profiles are deconvoluted by the Stokes method even for considerable specimen broadening size coefficients A ^ usually oscillate at larger L values [59 106] preventing computation of the column-length distribution function Few techniques were used to deal with this problem successive convolution unfolding method [32 133] smoothing and iterative methods [134 135 136 137] Figures 14 and 15 show very smooth column- length distribution functions However they follow from size coefficients ^4^ that depend on the accu- racy of the approximation for the distortion coeffi- cient given by Eq (47) Equation (47) is exact if the strain distribution is Gaussian but in general holds only for small harmonic numbers n if strain broadening is not negligible
339
Volume 98 Number 3 May-June 1993
Journal of Research of the National Institute of Standards and Technology
500 1000 L(A)
Fig 14 Surface-weighted and volume-weighted column-length distribution functions normalized on unit area [111] Ag un- treated (upper) [100] Ag ground (lower)
Fig 15 Surface-weighted and volume-weighted column-length distribution functions for [010] La2Cu04 normalized on unit area
522 La2-xSrtCu04 Powders To test the applicability of the discussed method to more com- plicated patterns two compounds with lower crystallographic symmetry were studied Lai85Sroi5Cii04 has a tetragonal K2NiF4-type struc- ture space group lAlmmm La2Cu04 is orthorhom-
bic at room temperature Both compounds show slight line broadening and relatively highly overlap- ping peaks (see Fig 16) which makes it very diffi- cult if not impossible to perform a Stokes analysis
25
-25
26 (deg)
yNraquo-
Fig 16 Observed points (pluses) refined pattern (full line) convoluted profiles (dashed line) and difference plot (below) for part of La2Cu04 pattern
Tables 4 and 5 list results from the fitting proce- dure and the analysis of specimen-broadened inte- gral breadths There are no qualitative differences in results for tungsten and silver powders How- ever average errors are higher as expected be- cause of overlapping peaks while weighted errors wp are surprisingly smaller This fact illustrates the unreliability of iwp when only a segment of the pat- tern is being refined because it depends on the number of counts accumulated in points as well as on the 28 range of the refinement
Figures 17 and 18 represent Fourier coefficients of Lai85Sroi5Cu04 [110] and La2Cu04 [010] direc- tions In the second plot the A (L )-versus-L plot shows a concave-downward part near L =0 the so- called hook effect It was shown in Sec 42 that the hook effect originates because of underesti- mation of background connected with the trunca- tion of profiles In the profile refinement all peaks separated less than 4deg 20 have been included in the refinement region to avoid possible overlapping of peak tails and specimen profiles have been trun- cated below 01 of the maximum intensity How- ever because the polynomial background was determined prior to profile refinement it may be overestimated for complicated patterns containing many overlapping peaks If background is refined with other profile parameters undesirable correla- tion with integral breadths occurs
340
Volume 98 Number 3 May-June 1993
Journal of Research of the National Institute of Standards and Technology
Table 4 Parameters of the pure-specimen Voigt function as obtained from profile-fitting procedure for La2-^SrCu04 powders
Specimen hid 2Hdeg) Pen PcO FWHM(deg) Rp()
Lai85Sroi5Cu04 004 2695 0046(4) 0024(8) 0042 34 006 4092 0083(5) ltio-= 0053 62 110 3352 0110(5) ltio- 0070 125 220 7046 0171(9) ltio- 0109 43
La2Cu04 004 2713 0061(8) 0045(9) 0067 39 006 4119 0124(7) ltio-^ 0079 77 020 3316 0074(10) 0078(10) 0102 29 040 6957 0210(30) 0026(81) 0135 29 200 3345 0074(8) 0061(10) 0087 69 400 7028 0130(10) 0023(95) 0089 29
Table 5 Microstructural parameters for Laij(5Srai3Cu04 and La2Cu04 powders
Specimen Direction (DUA) Pgt(A) lte^(fl3))laquo lte2((Z)gt2))laquo
Lai83Sro5Cu04
La2Cu04
[001] [110]
[001] [010] [100]
1700(300) 470(20)
1100(100) 680(50) 680(50)
2000(200) 940(20)
1200(100) 760(50) 810(50)
00024 00017
00038 00033 00016
000049(9) 000044(6)
00008(1) 00007(2) 00003(3)
c i ^- raquo sect 08 bulli - U
^0
ti- bull ll bull bullbullo
ffl M P bull- u ^ Di 04 Si - M bulldiamsbullbull a bull-v 3 o ^^=s^
u ^N^Sraquoraquo^
0 ^^^aaaa 1000
L(A) 2000
OQ bullbulldego UM o z a 08
o o bull bull bull
- u u bull raquo UU bull
a diams o bull o u ft 04 bull deg raquo deg - U bull bull deg Oi bullbullgt =3 bull- l o k u
0 bullbullbullraquo aaaMMi
500 1000
L(A)
Fig 17 Fourier coefficients for the first- (pluses) and second- order (crosses) reflection and size coefficients (circles) for [110] Lai^Sroi5Cu04
Fig 18 Fourier coefficients for first- (pluses) and second- order (crosses) reflection and size coefficients (circles) for [010] La2Cu04
341
Volume 98 Number 3 May-June 1993
Journal of Research of the National Institute of Standards and Technology
S3 Comparison with the Integral-Breadth Methods
Knowing the specimen integral breadths simpli- fied methods can be applied In Sec 212 we re- viewed multiple-line and single-line integral- breadth methods We shall compare the simplified multiple-line methods [Eqs (23) (24) and (30)] and the single-line method [76] [Eqs (29) and (30)] with results obtained for silver tungsten and La2-xSrxCu04 powders (Tables 3 and 5) We did not compare with the multiple-line Voigt-function method [26] because it was shown in Sec 44 that it is incompatible with the Warren-Averbach analy- sis In Table 6 integral breadth Pi was computed according to Eq (11) This value was compared with )8A integral breadth computed from Fourier coefficients [58]
i8A=- laquo3 2^(L)
(74)
Results obtained by the Warren-Averbach analysis are significantly smaller for both size and strain Integral-breadth methods give the upper limit for strain so comparison is limited Considering the approximation e = 125e^(L))^ [138] with L=(D)v2 or L=(D)s2 strains resemble more closely than crystallite sizes It must be noted how- ever that this approximation makes sense only in the case of pure-Gauss strain broadening Benedetti et al [106] reported excellent agreement for both size and strain using Warren-Averbach and Cauchy-Gauss [Eq (24)] methods Results from Table 6 on the contrary indicate that the Gauss-Gauss approximation gives values closest to the Warren-Averbach method for crystallite sizes whereas the Cauchy-Gauss and especially the Cauchy-Cauchy approximation tend to give too large values For strain the trend is opposite The Cauchy-Cauchy approximation resembles most
Table 6 Comparison of results obtained with the integral-breadth methods Cauchy-Cauchy (C-C) Cauchy-Gauss (C-G) Gauss- Gauss (G-G) and single-line (S-L) analysis
Specimen hkl PiXKP PAXKP ltigt)v (Z)gt(A) (e^((DV2)gt2 eXlO^ (A-) (A-0 (A) C-C C-G G-G S-L xlO^ C-C C-G G-G S-L
W untreated 110 220
0259 0247
0259 0247
3500 3700 3810 3810 14500 4040
008 -001 -003 -005 024 0
W ground 110 220
125 204
125 205
1030 2240 1450 1220 940 550
054 090 093 105 045 032
Ag untreated 111 2
0600 0901
0600 0900
2000 3340 2390 2190 1670 1110
024 035 039 095 0 0
200 124 124 1030 2270 1470 1230 810 047 082 085 095 0 400 204 204 490 0
Ag ground 111 222
198 352
200 352
650 2080 1240 910 530 280
095 179 182 197 048 0
200 403 406 350 9380 4780 1320 260 180 405 405 408 082 400 803 803 120 0
Lai85Sroi3Cu04 004 006
0657 0881
0650 0880
2000 5230 3290 2660 1970 1140
049 076 078 088 044 0
110 119 119 940 1240 1000 970 840 044 052 064 080 0 220 158 158 630 0
La2Cu4 004 006
0988 132
0998 131
1200 2980 1940 1630 1490 760
08 107 112 127 081 0-
020 143 142 760 1200 910 860 1240 07 079 090 110 114 040 198 200 510 016 200 126 124 810 810 810 810 1250 03 002 011 015 089 400 1S 126 830 014
Not possible to evaluate because of too small Gauss integral breadth
342
Volume 98 Number 3 May-June 1993
Journal of Research of the National Institute of Standards and Technology
closely a Warren-Averbach method These results concur with the Klug and Alexander [24] compari- son of the published size and strain values obtained by Warren-Averbach (Stokes) and integral-breadth methods However for x-ray diffraction the Cauchy-Gauss assumption for the size-strain broadening is theoretically and experimentally more favored thpoundm the other two models The fact that the Gauss-Gauss method for crystallite size and the Cauchy-Cauchy method for strain give more realistic results may mean that the presump- tion that size and strain broadening are exclusively of one type is an oversimplification
The single-line method seems much less reliable If Gaussian breadth is very small no information about strain is obtained Moreover second-order reflections give much lower values of both size and strain than do basic reflections However if multi- ple reflections are not available the single-line method can give satisfactory estimations
54 Reliability of Profile Fitting
The profile fitting of a cluster of even severely overlapping peaks can be accomplished with a low error and excellent fit of total intensity But how reliable is information obtained about separate peaks in the cluster In the fitting procedure it is possible to put constraints on the particular profile parameter to limit intensity position and width of the peak If anisotropic broadening or different phases are present constraints may not be realistic Morever acceptable results can be obtained even using a different number of profiles in refinement [4] Hence the first condition for the successful ap- plication of this method is knowledge of actual phases present in the sample and their crystalline structures
In this regard two powders were measured or- thorhombic Lai94Sroo6Cu04 has a slightly distorted K2NiF4-type structure (space group Bmab a =53510(2) A b =53692 A(2) c = 131931(7) A) and tetragonal Lai76Sro24Cu04 (space group I4mmm a =37711(3) A c = 132580(8) A) Data were collected for each specimen separately and for a specimen obtained by mixing the same pow- ders Because diffracted intensity of each phase was lower for the mixture counting time was pro- portionally increased to obtain roughly the same counting statistics Figure 19 shows two partially separated orthorhombic (020) (200) and (040) (400) peaks overlapped with tetragonal (110) and (220) reflections During the profile fitting of the mixed powders (200) orthorhombic peak tended to disappear on account of neighboring (020) and
(110) reflections Its intensity was constrained to vary in range plusmn 30 of (020) peak intensity which can be justified if the crystallographic structure is known
60
-60
345
345
335 29 (deg)
345
Fig 19 (upper) Lai76Sro24Cu04 (110) peak (middle) Lai94Sroo6Cu04 (020) and (200) peaks (lower) (110) (020) and (200) peaks
Table 7 contains results of fitted specimen-Voigt functions as well as size and strain values obtained by the analysis of broadening Comparing integral breadths of the starting and mixed powders some profiles change from more Cauchy-like to Gauss- like and vice versa This is especially evident for the (400) reflection meaning that accurate deter- mination of the profile tails is indeed affected in the cluster of overlapping peaks However integral breadth does not change significantly so results of
343
Volume 98 Number 3 May-June 1993
Journal of Research of the National Institute of Standards and Technology
Table 7 Comparison between two specimens run separately and mixed togetlier
Specimen hkl 2Hdeg) )3cO PoO DUA) (D)v(A) (e2laquoD)v2))laquoxlO
Lai76Sroj4CuOr 110 3369 0058(6) 0094(7) 780(60) 850(60) 10(1) 220 7073 022(2) 013(2)
LaiMSro(KiCu04 020 3342 0084(9) 055(14) 500(90) 1000(200) 07(1) 040 7012 010(2) 014(1) 200 3353 00216(85) 0061(8) 1100(100) 1200(100) 03(1) 400 7040 0026(11) 0088(8)
Mix 110 3367 0083(21) 0064(14) 800(300) 1200(300) 08(3) Lai76Sro24Cu04 220 7072 019(7) 013(4)
+ 020 3343 0066(35) 0070(23) 800(300) 1000(300) 07(4) Lai94Sroo6Cu04 040 7012 0116(93) 013(5)
200 3354 0024(156) 0071(61) 900(700) 1000(600) 04(12) 400 7041 011(2) 0003(320)
the multiple-line methods are not much influenced On the contrary the single-line method gives quite different results This may support the conclusion of Suortti Ahtee and Unonius [43] that the Voigt function fails to account properly for size and strain broadening simultaneously if only Cauchy integral breadth determines crystallite size
Table 7 shows that the results of Warren- Averbach analysis of starting and mixed powders agree in the range of standard deviations How- ever errors are much larger especially for the hid- den (200)-(400) reflections From Eq (62) it follows that more counts (longer counting times) and more observables (smaller step-size) would lower standard deviations Therefore in the case of highly overlapping patterns to obtain desirable ac- curacy much longer measurements are needed al- though that will not change the fact that higher overlapping implies intrinsically higher errors of all refinable parameters To further minimize possible artifacts of the fitting procedure it is desirable to include in the analysis as many reflections in the same ciystallographic direction as possible
55 Remarks
By modeling the specimen size and strain broad- ening with the simple Voigt function it is possible to obtain domain sizes and strains that agree with experiment and show a logical interrelationship Furthermore the Voigt function shows the correct 1A(26y asymptotic behavior of peak tails as ex- pected from kinematical theory [139] However if the specimen profile is significantly asymmetric (because of twins and extrinsic stacking faults [140 59]) or the ratio FWHM^ is not intermediate to the Cauchy (2Tr) and Gauss (2(ln27r)^) functions then the Voigt function can not be applied [25]
Suortti Ahtee and Unonius [43] found good over- all agreement by fitting the Voigt function to the pure-specimen profiles of a Ni powder deconvo- luted by the instrumental function However more accurate comparison is limited because of unavoid- able deconvolution ripples of specimen profiles Furthermore the Voigt function might not be flex- ible enough to model a wide range of specimen broadening as well as the different causes of broadening Therefore the question whether the Voigt function can satisfactorily describe complex specimen broadening over the whole 20 range in a general case needs further evaluation
This method of Fourier analysis with the as- sumed profile-shape function is most useful in cases when the classical Stokes analysis fails there- fore when peak overlapping occurs and specimen broadening is comparable to instrumental broaden- ing It was shown that for a high degree of peak overlapping the fitting procedure can give unreli- able results of Gauss and Cauchy integral breadths that is the peak can change easily from predomi- nantly Cauchy-like to Gauss-like and contrary This can lead to illogical values of size-integral and strain-integral breadths according to Eqs (52) (53) (54) and (55) and to irregularities in the be- havior of Fourier coefficients for large L Simulta- neously if the size-broadened profile has a large Gauss-function contribution the hook effect will occur However volume-weighted domain sizes D)y and MSS eL)) for small L are much less affected because they rely on both Cauchy and Gauss parts of the broadened profile Any integral- breadth method that attempts to describe the size and strain broadening exclusively by a Cauchy or Gauss function in this case fails completely For specimens with lower crystallographic symmetry
344
Volume 98 Number 3 May-June 1993
Journal of Research of the National Institute of Standards and Technology
when many multiple-order reflections are avail- able but the peaks are overlapped it is therefore desirable to include in the analysis as many reflec- tions as possible to minimize the potential artifacts of the fltting process
6 Analysis of Superconductors 61 (La-M)2Cu04 Superconductors
Bednorz and Miiller [16] found the first high- temperature oxide superconductor in the La-Ba- Cu-O system Soon after substituting Ba with Sr and Ca Kishio et al [17] found superconductivity in two similar compounds Later many compounds with much higher transition temperatures (Tc) were found The (La-M)2Cu04 system remains favorable for study because the cation content responsible for the superconductivity is easier to control and measure than the oxygen stoichiometry Also this system provides a wide range of substitutional cation solubility in which the tetragonal K2NiF4- type structure is maintained Compared with much- studied Y-Ba-Cu-O this structure is simpler because it contains only one copper-ion site and two oxygen-ion sites
The undoped compound La2Cu04 is orthorhom- bic at room temperature It becomes superconduct- ing either with cation substitution on La sites or increased oxygen content to more than four atoms per formula unit Doping with divalent cations in- creases the itinerant hole carriers in the oxygen- derived electron band [141] which probably causes the superconductivity However different dopants influence the transition temperature Tc Although the unit-cell c-parameter simply reflects ionic dopant size [142] the in-plane unit-cell parameter (and accordingly the Cu-0 bond length) correlates with Tc for different dopants and for different dop- ing amounts [142 143]
LaiB5MouCu04 (M = Ba Ca Sr) have a tetrago- nal K2NiF4-type structure space group lAlmmm with four atoms in the asymmetric unit [117] One site is occupied with La partially substituted with dopant ions (Fig 20) La2Cu04 is orthorhombic at room temperature The best way to correlate these two structures is to describe La2Cu04 in space group Bmab the c axis remains the same tetrago- nal [110] and [110] directions become [010] and [100] orthorhombic axes and size of the unit cell is doubled [144]
Figure 21 shows parts of the x-ray diffraction patterns observed and refined of Lai85Moi5Cu04 (M = Sr Ba Ca) and La2Cu04 Refined lattice
parameters are given in Table 8 Table 9 shows resuhs of the line-broadening analysis Relatively
La(BaCaSr)
0(2)
0(1)
Fig 20 Ciystal structure of (La-M)2Cu04 showing one unit cell
300 JUU
(b)
200
100
U 0 M J Js-r-^
30
-30
300
40 41 42 43 44 45 40 41 42 43 44 45 29 (deg) 29 (deg)
mdashA-
gt t 200
Z
F-
- 100
(c)
f V kgt ii I 40 41 42 43 44 45 40 41 42 43 44 45
e (deg) ^^ 26 (deg)
-30 wwX mdash Wlaquo-
Fig 21 Diffraction patterns of LaiH5Moi5Cu04 specimens (a) M=Sr (b) M = Ba (c)M = Ca (d) M = U
345
Volume 98 Number 3 May-June 1993
Journal of Research of the National Institute of Standards and Technology
Table 8 Lattice parameters and T^ at zero resistivity (Ac method at 10 Ma current)
Specimen a (A) bk) c(A) rc(K)
Lairaquo5Sroi5Cu04 377814(7)
Lairaquo3Baoi3Cu04 37846(2)
LaiiijCaoi5Cu04 37863(7)
La2Cu04 53558(2) 54053(2)
231(2) 36
288(4) 28
17(2) 19
1451(8)
Table 9 Results of line-broadening analysis for (La-M)2Cu4 specimens
Specimen hkl PcO PoO (DUk) (Iraquo)(A) lte^((D)2))
Lai(laquoSroj5Cu04 004 006
0046(4) 0083(5)
0024(8) ltio-
1700(300) 2000(200) 000049(9)
110 0110(5) ltio- 470(20) 940(20) 000044(6) 220 0171(9) ltio-
Lai85Baoi3Cu04 004 006
0049(6) 0110(7)
0076(6) 0089(9)
1100(200) 1100(100) 00011(2)
110 0087(4) 000042(6) 560(20) 1110(20) 000024(5) 220 0116(3) ltio-5
Laiji5Caoi5Cu04 004 006
0120(13) 0146(12)
0032(22) 0033(27)
440(70) 780(90) 00007(4)
110 0045(25) 0200(19) 340(30) 360(20) 00013(2) 220 0343(22) ltio-
La2Cu04 004 006
0061(8) 0124(7)
0045(9) ltio-
1100(100) 1200(100) 00008(1)
020 0074(10) 0078(10) 680(50) 760(50) 00007(2) 040 0210(30) 0026(81) 200 0074(8) 0061(10) 680(50) 810(50) 00003(3) 400 0130(10) 0023(95)
weak peak broadening was observed which can not be attributed to the proximity of the phase trans- formation Lai85SroisCu04 is tetragonal down to = 170 K [145] Lai85Baoi5Cu04 to 140 K [146147] and Lai85Caoi5Cu04 to 130 K [148] Another possi- ble reason for peak broadening might be continu- ous compositional variations in dopant content The scanning Auger microprobe analysis of La2-SrtCu04 compounds [149] showed that grain- boundary segregation of Sr is weak and limited to a narrow region near the grain surface In the case of the separation of two phases with different Sr con- tent and similar lattice parameters asymmetry of some reflections would be observed [150] More- over in the case of compositional inhomogeneity microstrains eL)) would be roughly independent of the averaging distance L in the grains [151] therefore distribution of strains would be Gaus- sian For all specimens microstrain behavior is identical it decreases linearly with distance L
Rothman and Cohen [115] showed that such be- havior of microstrains is caused by dislocations that might arise during grinding Assuming the same applied stress microstrain would be approximately inversely proportional to the elastic moduli of these materials If mean microstrain is defined as the arithmetic average of strains for the [001] and [110] directions results agree with values of the Youngs moduli for polycrystalline La2Cu04 Lai85Moi5Cu04 (M = Sr Ba Ca) [152] However other factors may contribute to the microstrain Coordination-6 ionic radii of La^+ Sr Ba^+ Ca^+ are 106 116 136 100 A respectively [153] Substitution of La with ions of different sizes affects the lattice parameter [142] and may cause much larger strains in the [001] direction when some of the ions are replaced with Ba^ than with Sr^ in accord with results in Table 9 Substitution of Ca^^ ions produces an entirely different effect microstrains in the [110] direction are larger This may be explained by
346
Volume 98 Number 3 May-June 1993
Journal of Research of the National Institute of Standards and Technology
comparing effects of substitutional ions on the unit-cell a -parameter The Ba-doped specimen has a larger a-parameter than the Sr-doped but the Ca-doped a-parameter is largest although Ca^^ has the smallest ionic size This should increase the cell distortion in the a-b plane
Table 9 reveals high anisotropy in these materi- als consistent with other physical properties such as thermal expansion [154] and upper critical mag- netic field [155] Differences of domain sizes might arise from a layered structure in the [001] direction and consequently easy incorporation of stacking faults between regularly stacked layers The stack- ing-fault and twin-fault probabilities can be esti- mated from the average surface-weighted domain sizes [59]
^ = TAN + cf1fun(aa) (75) m im - (D)
Here c is a constant for the particular [hkl] direction and fun(a a) a linear combination of stacking-fault probability and twin-fault probability a The exact form of Eq (75) was derived only for the cubic and hexagonal crystal structures On con- dition that the true domain dimension D is isotropic or so large that the second term of Eq (75) dominates a linear function of stacking-fault and twin-fault probability is
fun(aa) = c( 1
) (76) Zgt)J (Dgttrade
Here c denotes a constant that depends only on geometrical factors and is the same for all three doped compounds
Figure 22 shows a possible correlation between Tc and fault-defect probabilities computed from TEM observations of La2-jcSrCu04 revealed that stacking-fault density increased with Sr content up to jc = 015 [156] That study suggests that a shear mechanism forming the fault-boundary dislocations implies oxygen vacancies andor cation deficiency We did not measure oxygen content but neutron- diffraction studies showed that oxygen deficiency starts to appear at much higher Sr content [157] However the increase of fault probability with the simultaneous decrease of microstrain in Fig 22 supports the assumption that defects are intro- duced to accommodate lattice strains [156] A simi- lar increase in Te was found in Y2Ba4Cu802o-laquo thin films [158] Compounds with asymmetric broad- ened and shifted peaks showed higher Tc which
was attributed to stacking faults Although extrinsic stacking faults may cause asymmetric peak broad- ening [140] it is probably caused by twinning Twinning in La-M-Cu-0 materials is less abundant than in Y-Ba-Cu-O compounds but it was ob- served in (La-Sr)2Cu04 monocrystals on (110) planes [159] In the profile-fitting procedure peak asymmetry is incorporated only in the instrumental function therefore we could not model asymmetric peak broadening However any significant asym- metry of the specimen profile would cause an un- even fit of low-angle and high-angle sides of peaks which was not observed This gives much more im- portance to stacking faults in Eq (76)
Fig 22 Arithmetic average of [110] and [001] root-mean- square strains and linear function of stacking-fault and twin- fault probabilities as a function of Tc
In Fig 22 average microstrains defined as the arithmetic average of [001] and [110] directions correlate inversely with Tc However we did not find a correlation of Tc and microstrains in a partic- ular direction [001] microstrains simply reflect dif- ference in size of dopant and host La^ ions (see Table 9)
In La2Cu04 (OkO) reflections are significantly broader than (hOO) This has also been observed in low-temperature orthorhombic Lai85Sroi5Cu04 and Lai85Baoi5Cu04 [160] and explained by either stacking faults or possible lower symmetry Our results reveal that domain sizes (D) have identical values for [010] and [100] directions (Table 9) From Eq (76) it follows that stacking-fault proba- bilities in these directions have the same values However microstrains in the [010] direction are roughly twice as large as in the [100] direction which is responsible for the different broadening In the case of doped La2Cu04 compounds different microstrains might be caused by oxygen
347
Volume 98 Number 3 May-June 1993
Journal of Research of the National Institute of Standards and Technology
vacancies ordered along one direction in the a-b plane similar to effects found in YBa2Cu307-laquo However undoped La2Cu04 is not expected to have significant o^Qgen deficiency Other possibili- ties are lower ciystallographic symmetry andor La vacancies although they were not reported for this system but La deficiency was found in an La2Co04 compound [161]
We can conclude that lattice strains and incoher- ently diffracting domain sizes confirm high an- isotropy in these materials This simple approach however does not allow unambiguous identifica- tion of the strains origin Probably the strains originate from dislocations and from different sizes of host and dopant ions Domain sizes of all com- pounds are larger in the c-direction than in the a-6 plane This indicates existence of stacking faults and twins However because estimated errors are relatively large and only three materials were stud- ied the possible connection between stacking faults and 7c needs further study
62 Bi-Cu-O Superconductors
Among the high-Tc superconductors the Bi- Cu-O compounds appear intriguing especially because their incommensurate structure modula- tion remains incompletely understood [162 163] The crystal structure consists of perovskite-like SrO-(Cu02Ca)mi-Cu02-SrO layers separated by NaCl-like BiO double layers (see Fig 23 [164]) The number m of Cu02 layers alters the supercon- ducting transition temperature Tc (for m = 12 and 3 rclaquo10 90 and 110 K respectively) This two- dimensional layered structure makes these materi- als highly anisotropic and favours the creation of defects
Bulk sintered specimens showed relatively weak peak broadening Moreover the diffraction pat- terns contained many overlapping peaks because the compound crystallizes in an orthorhombic low- symmetry space group A2aa [165] and incommen- surate modulation gives superlattice reflections All patterns revealed a strong [001] texture (Fig 24) making reflections other than (001) difficult to ana- lyze The lattice parameters vary depending on the exact compound stoichiometry and processing his- tory but characteristically they have almost identi- cal a and b parameters and large c parameter fl =54095 A 6=54202 A c =309297 A for Bi2Sr2CaCu208 (Bi-2212 [166] and A =5392 A b =5395 A c =36985 A for (BiPb)2Sr2Ca2Cu30io (BiPb-2223) [165] Thus we treated (hOO) and (0^0) reflections as single peaks Table 10 gives the
results for three specimens Bi-2212 (BiPb)2 (SrMg)2(BaCa)2Cu30io (BiPbMgBa-2223) which were one-phase specimens and BiPb-2223 con- taining approximately equal amounts of 2212 and 2223 phases The in-plane lattice parameters of 2212 and 2223 phases differ little hence only the [00] directions of the mixed-phase specimen were evaluated
b^ (c)
Fig 23 Average crystal structure of Bi2Sr2Cam-iCum04+2m for (a) m = 1 (b) w =2 (c) m =3 [164]
35
-35
42 44 46 48 50 52 54 56 58 60 62 26 (deg)
^ ^^^MK^Aa^Ndllaquop
Fig 24 Part of BiPbMgBa-2223 refined pattern There are 48 fundamental reflections in this region
Interpretation of the results in the case of these complicated compounds must be considered care- fully Microstrains are probably caused by disloca- tion arrays However substitution of different-sized ions and vacancies would also contribute to the strains as would other kinds of disorder especially
348
Volume 98 Number 3 May-June 1993
Journal of Research of the National Institute of Standards and Technology
Table 10 Results of line-btoadening analysis for Bi-Cu-O supreconductors
Specimen Phase hkl (A)
eD)sa)y^
Bi-2212 2212 008 0012
0163(8) 022(3)
001(6) 005(6)
420(80) 00021(6)
020+200 0104(4) ltio-^ 580(30) 00007(1) 040+400 018(2) 00004(6300)
BiPbMgBa-2223 7773 0010 0020
0097(1) 021(2)
00002(1700) 0007(150)
770(60) 00012(1)
020 + 200 012(27) 013(10) 380(430) 00009(71) 040 + 400 015(95) 021(33)
BiPb-73 2212 008 0012
023(2) 025(5)
0002(350) 0001(1000)
220(30) 00013(26)
2223 0010 0020
022(8) 023(99)
0092(67) 018(47)
230(190) 00012(197)
Stacking faults and twins Table 10 shows larger strains in the [001] direction that in the basal plane This can be explained by stacking disorder along the c-axis which was frequently observed in electron-diffraction patterns as streaking [167 168] Easy incorporation of stacking faults is possi- ble because of the two-dimensional weak-bonded layers (BiO double layers are spaced about 3 A apart) The difference in microstrain between in- plane and the c-direction is much smaller for the BiPbMgBa-2223 phase probably because Pb low- ers the faulting by stabilizing the higher-Tc 2223 phase [167] For the BiPb-2223 specimen with two phases there are two possibilities Either the speci- men consists mainly of a mk of two kinds of one- phase grains or both phases occur within the same grains The second possibility was confirmed exper- imentally [169 170] and our results concur be- cause microstrain in the 2212 phase is much smaller than in the one-phase Bi-2212 specimen Processing conditions and cation content probably favour development of the macroscopic inter- growth of both phases within the grains that is microscopic defects grow to sufficiently large re- gions to give a diffraction pattern of another phase with the different number of Cu02 layers As a re- sult strain is relieved and both strains and domain sizes being quite different in one-phase specimens tend to equalize
For the Bi-Cu-O specimens the mean surface- weighted domain sizes are generally smaller than for (La-M)2Cu04 compounds Therefore the com- putation of the stacking- and twin-fault probabili- ties by using Eq (75) may be wrong It would be very instructive to compare the different broaden-
ing of satellite and fundamental reflections which indicates a more pronounced stacking disorder in the modulated structure [171]
In summary we found that for both Bi-2212 and BiPbMgBa-2223 superconductors the c-axis strain exceeds the in-plane strain The BiPb-2223 specimen containing both 2212 and 2223 phases within the single grains shows smaller incoherently diffracting domains and lower c-axis strain than the one-phase specimens This fact may direct us to- ward the mechanism of the second-phase forma- tion in these materials
63 Remarks
It was shown that this particular method of the line-broadening analysis can give information about the size of incoherently diffracting domains and lattice strains in (La-M)2Cu04 and Bi-Clu-O superconductors Moreover results show high an- isotropy of both size and strain parameters as one may expect because of the layered structure of all superconducting cuprates Generally structural line broadening is not large that is a result of rela- tively large domain sizes (200-2000 A) and small strains (002-02) It is interesting to compare these values with the published results for YBa2Cu307-laquo (isotropic strains of 023 [77] and 005-03 [82]) Although the different materi- als were studied they seem too large especially be- cause they are the average of strains in different directions
The main drawback of the line-broadening the- ory is the uncertainty about the origins of the line broadening that is it is difficult to distinguish the main effects responsible for the broadening For
349
Volume 98 Number 3 May-June 1993
Journal of Research of the National Institute of Standards and Technology
the novel superconductors particularly the numer- ous defects (substitutions vacancies stacking faults dislocations and similar) can occur simulta- neously which makes it very difficult to determine their individual contributions Furthermore the crystal structures of most novel superconductors are relatively complicated The average structure has mostly a slightly distorted tetragonal symmetry very similar a and b lattice parameters and a large c parameter but c=36 for YBa2Cu307-laquo for in- stance This results in a large number of overlap- ping peaks and consequently in large errors of all results This showed especially in the case of Bi-Cu-O superconductors (see Table 10) Follow- ing the discussion of reliability of profile fitting in Sec 54 it would be desirable to include more than two reflections in the analysis of broadening but higher-order peaks are usually too weak and over- lapped One way to partially solve this problem would be a whole pattern fitting [172 173] and Rietveld structure refinement [23] in terms of size and strain parameters This requires an accurate preset function to model specimen broadening and precise definition of angular dependence of size and strain parameters The Rietveld programs that model the line broadening in terms of size and strain parameters are based either on the simpli- fied integral-breadth methods [78 95] or on the single-line method [174]
7 Conclusions
A method for analyzing the pure-specimen (structural) broadening of x-ray diffraction line profiles is proposed By modeling the specimen size and strain broadenings with the simple Voigt func- tion it is possible to obtain domain sizes and strains that agree with experiment and show a logi- cal interrelationship Furthermore some common consequences and problems in the Fourier-method analysis follow easily The specimen function is convoluted with the instrumental function to match the observed x-ray diffraction-line profile This avoids the Stokes deconvolution method thus al- lowing analysis of patterns with highly overlapping peaks and weak structural broadening Therefore the method was applied to some novel high-Tc superconductors We reached the following conclu- sions
(i) Surface-weighted domain size depends only on the Cauchy integral breadth of the size-broad- ened profile
(ii) The hook effect occurs when the Cauchy-content of the size-broadened profile is un-
derestimated that is for ^sc(n2)^3sG Usually this happens when the background is estimated too high so the long tails of the Cauchy function are prematurely cut off
(iii) It also follows from conclusion (ii) that the volume-weighted domain size can not be more than twice the surface-weighted domain size (limiting value D)v=2D)i is obtained for the pure-Cauchy size-broadened profile) Minimum value for D)J (D)j should not be less than -131
(iv) If the distortion coefficient is approxi- mated with a harmonic term this leads exactly to the Warren-Averbach method of separation of size and strain broadenings
(v) In that case mean-square strains decrease linearly with the distance L
(vi) It is possible to evaluate local strain ((e^(0))^) only in the case of pure-Gauss strain broadening Then root-mean-square strain is inde- pendent of the distance L and related to the upper limit of strain obtained from the integral breadth of the strain-broadened profile
(vii) If strain broadening is not described exclu- sively with the Gauss function the multiple-line Voigt integral breadth and Warren-Averbach analyses can not give the same results for volume- weighted domain size although D)v is defined identically in both approaches because the appar- ent strain -q = pdeg(29)cot9 is not angular- independent
(viii) Smooth size coefficients give column- length distribution functions without oscillations and make possible a computation of volume- weighted average domain sizes up to ~5000 A
(ix) Comparison with the simplified integral- breadth methods in most cases has shown not large but systematic discrepancy of results indicat- ing that size and strain broadening can not be accu- rately modeled by a single Cauchy or Gauss function Moreover the application of the single- line method is much less reliable and it should not be used where multiple reflections are available
(x) The knowledge of all phases present in the sample and their crystallographic structure is re- quired to successfully fit a cluster of overlapping peaks Although it is very difficult to accurately de- termine the Cauchy-Gauss ratio of an overlapped peak final results of domain size and strain are much less affected Therefore connecting the crys- tallite size exclusively with the Cauchy content and strain with the Gauss content of a specimen profile might be doubtful
(xi) Evaluated errors of domain sizes and strains increase substantially with the degree of
350
Volume 98 Number 3 May-June 1993
Journal of Research of the National Institute of Standards and Technology
peak overlapping Hence for complicated patterns very accurate measurements are necessary and one needs to analyze as many reflections in the same crystallographic direction as possible
(xii) Line-broadening analysis of (La-M)2Cu04 and Bi-Cu-O compounds confirms high anisotropy in these materials
(xiii) Strains in (La-M)2Cu04 probably origi- nate from dislocations and from different sizes of host and dopant ions
(xiv) Stacking-fault probability in (La-M)2Cu04 (M = Ba Ca Sr) increases with increasing Tc whereas the average strain decreases
(xv) In La2Cu04 different broadening of (lOO) and (OfcO) reflections is not caused by stacking faults
(xvi) All Bi-Cu-0 superconductors show larger strain in the c-direction than in the a-b plane which can be explained by stacking disorder along the [001] direction
(xvii) In the specimen with approximately equal amounts of Tl-2212 and TlPb-2223 phases it is likely that a secondary phase develops by the growth of the microscopic faulted regions of the primary phase
Acknowledgments
I am thankful to Dr Harry McHenry for his support and especially to Dr Hassel Ledbetter for his wise guidance and most useful help during my stay at NIST I am also indebted to my home insti- tution the Faculty of Metallurgy of the University of Zagreb for allowing me the leave of absence at NIST
8 References
[1] W Friedrich P Knipping and M v Laue Ann Physik 41 971 (1912)
[2] H M Rietveld Acta Cryst 22 151 (1967) [3] H M Rietveld J Appl Cryst 2 65 (1969) [4] S A Howard and K D Preston in Modern Powder Dif-
fraction Vol 20 The Mineralogical Society of America Washington DC (1989) p 217
[5] D Taupin J Appl Cryst 6 266 (1973) [6] T C Huang and W Parrish Appl Phys Lett 27 123
(1975) [7] M K Wu J R Ashburn C J Torng P H Hor R L
Meng L Gao Z J Hwang Y Q Wang and C W Chu Phys Rev Lett 58 908 (1987)
[8] D Shi MRS Bull 16 37 (1991) [9] D Larbalestier Phys Today 44 74 (1991)
[10] J C Phillips Phys Rev B 4512647 (1992) [11] B Raveau Phys Today 45 53 (1992) [12] A J Millis and K M Rabe Phys Rev B 38 8908 (1988)
[13] F Guinea Europhys Lett 7 549 (1988) [14] C P Dhard and P Singh in Proc Int Symp High-Temp
Supercond Jaipur India Oxford amp IBH Publishing New Delhi (1988) p 271
[15] J D Jorgensen Phys Today 44 34 (1991) [16] J G Bednorz and K A Muller Z Phys B 64 189
(1986) [17] K Kishio K Kitazawa S Kaube I Yasuda N Sugii H
Takagi S Uchida K Fueki and S Tanaka Chem Lett 429 (1987)
[18] J D Jorgensen B Dabrowski S Pei D G Hinks L Soderholm B Morosin J E Venturini and D S Ginley Phys Rev B 38 11337 (1988)
[19] J R Clem Phys Rev B 43 7837 (1991) [20] M Paranthaman M Foldejiki D Balzar H Ledbetter
A J Nelson and A M Hermann submitted to Phys Rev B
[21] A R Stokes Proc Phys Soc Lond 61 382 (1948) [22] B E Warren and B L Averbach J Appl Phys 23 497
(1952) [23] R Delhez Th H de Keijser and E J Mittemeijer in
Accuracy in Powder Diffraction S Block and C R Hub- bard eds Natl Bur Stand (US) Special Publication 567 (1980) p 213
[24] H P Klug and L E Alexander X-ray Diffraction Proce- dures 2nd Edition John Wiley New York (1974) p 661
[25] J I Langford J Appl Ciyst 11 10 (1978) [26] J I Langford in Accuracy in Powder Diffraction S
Block and C R Hubbard eds Natl Bur Stand (US) Special Pubication 567 (1950) p 255
[27] R Delhez Th H de Keijser and E J Mittemeijer Fre- senius Z Anal Chem 312 1 (1982)
[28] A J C Wilson Proc Phys Soc Lond 80 286 (1962) [29] A J C Wilson Proc Phys Soc Lond 81 41 (1963) [30] L P Smith Phys Rev 46 343 (1934) [31] H C Burger and P H van Cittert Z Phys 79 722
(1932) [32] S Ergun J Appl Ciyst 1 19 (1968) [33] R Croche and L Gatineau J Appl Ciyst 10479 (1977) [34] L H Schwarz and J B Cohen Diffraction from Materi-
als Academic Press New York (1977) p 391 [35] R Delhez Th H de Keijser E J Mittemeijer and J I
Langford J Appl Cryst 19 459 (1986) [36] R Delhez Th H de Keijser E J Mittemeijer and J I
Langford Aust J Phys 41 213 (1988) [37] R A Young and D B Wiles J Appl Cryst 15 430
(1982) [38] W Voigt Stizungsber K Bayer Akad Wiss 42 603
(1912) [39] E E Whiting J Quant Spectrosc Radiat Transfer 8
1379 (1968) [40] G K Wertheim M A Butler K W West and D N E
Buchanan Rev Sci Instrum 111369 (1974) [41] M M Hall Jr V G Veeraraghavan H Rubin and P G
Winchell J Appl Cryst 10 66 (1977) [42] A Brown and J W Edmonds Adv X-Ray Anal 23 361
(1980) [43] P Suortti M Ahtee L Unonius J Appl Cryst 12 365
(1979) [44] T Sundius J Raman Spectrosc 1 471 (1973) [45] B H Armstrong J Quant Spectrosc Radiat Transfer 7
61 (1967) [46] J F Kielkopf J Opt Soc Am 63 987 (1973) [47] B P Asthana and W Kiefer Appl Spectr 36 250
(1982)
351
Volume 98 Number 3 May-June 1993
Journal of Research of the National Institute of Standards and Technology
[48] J P M de Vreede S C Mehrotra A Tal and H A Dijkerraan Appl Spectr 36 227 (1982)
[49] F R L Schoening Ada Ciyst 18 975 (1965) [50] P Scherrer Gott Nachr 2 98 (1918) [51] A R Stokes and A J C Wilson Proc Cambridge
Philos Soc 38 313 (1942) [52] A J C Wilson X-Ray Optics 2nd edition Methuen
London (1962) [53] S Leie and T R Anantharaman Proc Indian Acad
Sci Sect A H 261 (1966) [54] D Louer D Weigel and J I Langford J Appl Ciyst
5 353 (1972) [55] A J C Wilson J Appl Ciyst 2 181 (1969) [56] J I Langford and A J C Wilson J Appl Ciyst 11102
(1978) [57] A R Stokes and A J C Wilson Proc Phys Soc Lond
56174 (1944) [58] B E Warren and B L Averbach J Appl Phys 21 595
(1950) [59] B E Warren X-Ray Diffraction Addison-Wesley
Reading Massachusetts (1969) p 264 [60] B E Warren in Progress in Metal Physics Vol 8 Perg-
amon Press London (1959) p 146 [61] F Bertaut C R Acad Sci Paris 228 187 (1949) [62] N C Haider and C N J Wagner Acta Cryst 20 312
(1966) [63] D Balzar and H Ledbetter in Proceedings of the Accu-
racy in Powder Diffraction II Natl Inst Stand Technol (1992) p 37
[64] D Balzar and H Ledbeter J Appl Cryst 26 (1993) in press
[65] J N Eastabrook and A J C Wilson Proc Phys Soc Lond B 65 67 (1952)
[66] R S Smith IBM J Res Develop 4 205 (1960) [67] B Y Pines and A F Sirenko Soviet Physics Ciyst 715
(1962) [68] G B Mitra and N K Misra Acta Ciyst 22 454 (1967) [69] A Gangulee J Appl Ciyst 7 434 (1974) [70] J Mignot D Rondot Acta Met 231321 (1975) [71] J Mignot and D Rondot Acta Ciyst A 33 327 (1977) [72] R K Nandi H K Kuo W Schlosberg G Wissler J B
Cohen and B Crist Jr J Appl Ciyst 17 22 (1984) [73] M Zocchi Acta Ciyst A 36164 (1980) [74] P Ramarao and T R Anantharaman Trans Ind Ins
Metals 18 181 (1965) [75] R K Nandi and S P Sen Gupta J App Cryst 11 6
(1978) [76] Th H de Keijser J I Langford E J Mittemeijer and
B P Vogels J Appl Ciyst IS 308 (1982) [77] A Williams G H Kwei R B Von Dreele A C Lar-
son L D Raistrick and D L Bish Phys Rev B 37 7960 (1988)
[78] A C Larson and R B Von Dreele Los Alamos Na- tional Laboratory Report No LA-UR-86-748 (1988)
[79] J D Jorgensen D H Johnson M H Mueller J G Worlton and R B Von Dreele in Proceedings of the Conference on Diffraction Profile Analysis Cracow Poland (1978) p 20
[80] R B Von Dreele J D Jorgensen and C G Windsor J Appl Ciyst 15 581 (1982)
[81] P Thompson D E Cox and J B Hastings J Appl Ciyst 20 79 (1987)
[82] J P Singh R A Guttschow D S Kupperman J T Dusek and R B Poeppel in High Temperature Super-
conducting Compounds III S Whang A Gupta and E Ceilings eds TMS AIME Warrendale (1991) p 281
[83] M O Eatough D S Glnley and B Morosin Adv X- Ray Anal 33 145 (1990)
[84] E J Peterson P J Kung R E Muenchausen and D M Smith in Proceedings of the 41st Annual Denver Conference on Applications of X-Ray Analysis Colo- rado Springs Colorado (1992) p 74
[85] M Rand J I Langford and J S Abell submitted to J Cryogenics (1992)
[86] D Balzar J Appl Ciyst 25 559 (1992) [87] D Balzar H Ledbetter and A Roshko Physica C 185-
189 871 (1991) [88] D Balzar and H Ledbetter J Mater Sci Lett 111419
(1992) [89] D Balzar H Ledbetter and A Roshko Pow Diffr 8
(1993) in press [90] S Johnson M Gusraan D Rowcliffe T Geballe and J
Sun Adv Ceram Mater 2 337 (1987) [91] H Ledbetter S A Kim R B Goldfarb and K Togano
Phys Rev B 39 9689 (1989) [92] H Friedman Electronics 132 (1945) [93] W Parrish (ed) in Advances in X-Ray Diffractometry
and X-Ray Spectrography Centrex Publishing Company Eindhoven The Netheriands (1962)
[94] W Soller Phys Rev 24158 (1924) [95] S A Howard R L Snyder J Appl Ciyst 22 238
(1989) [96] G H Stout and L H Jensen X-Ray Structure Determi-
nation 2nd edition Wiley New York (1989) p 373 [97] D E Appleman and T Evans Jr Final Report 92-14
US Geological Survey Washington DC (1973) Avail- able as NTIS Document No PB-216188
[98] M U Cohen Rev Sci Instrum 6 68 (1935) [99] M U Cohen Rev Sci Instrum 7 155 (1936) [100] M H Mueller L Heaton and K T Miller Acta Ciyst
13 828 (1960) [101] R A Young P E Mackie and R B Von Dreele J
Appl Ciyst 10 262 (1977) [102] D B Wiles and R A Young J Appl Cryst 14 149
(1981) [103] J K Yau and S A Howard J Appl Ciyst 22 244
(1989) [104] S A Howard J K Yau and H U Anderson J Appl
Phys 65 1492 (1989) [105] S Enzo G Fagherazzi A Benedetti and S Poilizzi J
Appl Ciyst 21 536 (1988) [106] A Benedetti G Fagherazzi S Enzo and M
Battagliarin J Appl Cryst 21 543 (1988) [107] Th H de Keijser E J Mittemeijer and H C F Rozen-
daal J Appl Ciyst 16 309 (1983) [108] Y Zhang J M Stewart C R Hubbard and B Mo-
rosin Adv X-Ray Anal 33 373 (1990) [109] Y Wang S Lee and Y Ue J Appl Ciyst IS 35
(1982) [110] V N Selivanov and E F Smislov Zavod Lab 57 28
(1991) [Ill] A Guinier X-Ray Diffraction W H Freeman San
Francisco (1963) p 139 [112] M Wilkens J Appl Cryst 12119 (1979) [113] D Du and Y Wang Pow Diffr 2180 (1987) [114] A P Prudnikov Yu A Brychkov and O L Marichev
Integrals and Series Vol 1 Gordon and Breach Am- sterdam The Netheriands (1986) p 344
352
Volume 98 Number 3 May-June 1993
Journal of Research of the National Institute of Standards and Technology
[115] R L Rothman and J B Cohen J Appl Phys 42 971 (1971)
[116] T Adier and C R Houska J Appl Phys 50 3282 (1979)
[117] C R Houska and T M Smith J Appl Phys 52 748 (1981)
[118] S Rao and C R Houska Acta Ciyst A 4214 (1986) [119] J I Langford R Delhez Th H de Keijser and E J
Mittemeijer Ausi J Phys 41173 (1988) [120] J I Langfoid J Appl Cryst IS 315 (1982) [121] M J Turunen Th H de Keijser R Delhez and N M
van der Pers J Appl Ciyst 16176 (1983) [122] A J C Wilson Acta Ciyst 23 888 (1967) [123] A J C Wilson Acta Ciyst A 24 478 (1968) [124] A J C Wilson Acta Ciyst A 25 584 (1969) [125] G Gagliotti A Paoletti and F P Ricci Nucl Instrum
3 223 (1958) [126] J I Langford R J Cernik and D Louer J Appl
Ciyst 24 913 (1991) [127] J I Langford in Accuracy in Powder Diffraction II
preprint [128] A J C Wilson Mathematical Theory of X-Ray Powder
Diffractometiy Centrex Eindhoven The Netherlands (1963)
[129] J L Langford Prog Ciyst Growth and Charact 14185 (1987)
[130] T G Fawcett C E Crowder S J Brownell Y Zhang C R Hubbard W Schreiner G P Hamill T C Huang E Sabino J I Langford R Hamilton and D Louer Pow Diffr 3 209 (1988)
[131] W L Smith J Appl Ciyst 9187 (1976) [132] J L Langford and D Louer J Appl Ciyst 15 20
(1982) [133] Fl Popescu and L Benes Acta Ciyst A 33 323 (1977) [134] P PSuse^cu R MSnaila M Popescu and E Jijovici j
Appl Cryst 7 281 (1974) [135] P F Bley Y Calvayrac and M Fayard J Appl Ciyst
7 493 (1974) [136] B Moraweck Ph de Montgolfier and A J Renouprez
J Appl Ciyst 10191 (1977) [137] A Le Bail and D Louer J Appl Cryst 11 50 (1978) [138] D R Buchanan R L McCuUough and R L Miller
Acta Ciyst 20 922 (1966) [139] P Suortti and L D Jennings Acta Cryst A 33 1012
(1977) [140] J B Cohen and C N J Wagner J Appl Phys 33 2073
(1962) [141] A Bianconi J Budnick A M Flank A Fontaine P
Lagarde A Marcelli H Tolentino B Chamberland C Michel B Raveau and G Demazeau Phys Lett A127 285 (1988)
[142] K Fueki K Kitazawa K Kishio T Hasegawa S Uchida H Takagi and S Tanaka in Chemistiy of High- Temperature Superconductors D L Nelson M S Whittingham and T F George eds American Chemi- cal Society (1987) p 38
[143] T Fujita Y Aoki Y Maeno J Sakurai H Fukuba and H Fujii J Appl Phys 26 U68 (1987)
[144] R M Hazen in Physical Properties of High-rc Super- conductors Vol 2 D M Ginsberg ed World Scien- tific Singapore (1990) p 121
[145] J B Torrance A Bezinge A I Nazzal T C Huang S P Parkin D T Keane S J LaPlaca P M Horn and G A Held Phys Rev B 40 8872 (1989)
[146] J D Axe A H Moudden D Hohlwein D E Cox K
M Mohanty A R Moodenbaugh and Y Xu Phys Rev Lett 62 2751 (1989)
[147] T Suzuki and T Fujita Physica C 159 111 (1989) [148] T Fujita and Y Maeno in Superconducting Materials
JJAP Series 1 (1988) p 34 [149] A Roshko and Y-M Chiang J Appl Phys 66 3710
(1989) [150] D E Cox S C Moss R L Meng P H Hor and C W
Chu J Mater Res 31327 (1988) [151] B Crist and J B Cohen J Polym Sci 17 1001 (1979) [152] H Ledbetter S Kim and A Roshko Z Phys B 89275
(1992) [153] R D Shannon and C T Prewitt Acta Ciyst B 25 925
(1969) [154] M Lang H Spille F Steglich Y Hidaka T Murakami
and Y Endoh Physica C 162-1641037 (1989) [155] Y Hidaka and T Murakami Phase trans 15 241
(1989) [156] P L Gai and E M McCarron Science 247 553 (1990) [157] T Kamiyama I Izumi H Asano H Takagi S Uchida
Y Tokura E Takayama-Muromachi M Matsuda K Yamada Y Endoh and Y Hidaka Physica C 172 120 (1990)
[158] A Kapitulnik Physica C 153-155 520 (1988) [159] L A Muradyan V N Molchanov R A Tamazyan and
V I Simonov Physica C 162-164 536 (1989) [160] P Day M Rosseinsky K Prassides W I F David O
Moze and A Soper J Phys C 20 L429 (1987) [161] J T Lewandowski R A Beyerlein J M Longo and R
A McCauley J Amer Ceram Soc 69 699 (1986) [162] R Ramesh G van Tendeloo G Thomas S M Green
Y Mei C Jiang and H L Luo Appl Phys Lett 53 2220 (1988)
[163] J Schneck L Pierre J C Tolddano and C Daguet Phys Rev B 39 9624 (1989)
[164] O Eibl Physica C 168 215 (1990) [165] W Carrilo-Cabrera and W Gopel Physica C 161 373
(1989) [166] P Bordet J J Capponi C Chaillout J Chenavas A
W Hewat E A Hewat J L Hodeau M Marezio J L Tholence and D Tranqui Physica C 156189 (1988)
[167] R Ramesh K Remschnig J M Tarascon and S M Green J Mater Res 6 278 (1991)
[168] Z Hiroi Y Ikeda M Takano and Y Bando J Mater Res 6 435 (1991)
[169] Y Inoue M Hasegawa Y Shichi I Munakata M Ya- manaka S Hiyama and O Nittono J Mater Res 5 737 (1990)
[170] R Ramesh B G Bagley J M Tarascon S M Green M L Rudee and H L Luo J Appl Phys 67 379 (1990)
[171] X B Kan J Kulik P C Chow S C Moss Y F Yan J H Wang and Z X Zhao J Mater Res 5 731 (1990)
[172] G S Pawley J Appl Ciyst 13 630 (1980) [173] H Toraya J Appl Ciyst 19 440 (1986) [174] L Lutterotti and P Scardi J Appl Ciyst 23 246
(1990)
About the author Davor Balzar is with Faculty of Metallurgy of the University of Zagreb Sisak Croatia and was a Guest Researcher at fflST The National Institute of Standards and Technology is an agency of the Technology Administration US Department of Commerce
353
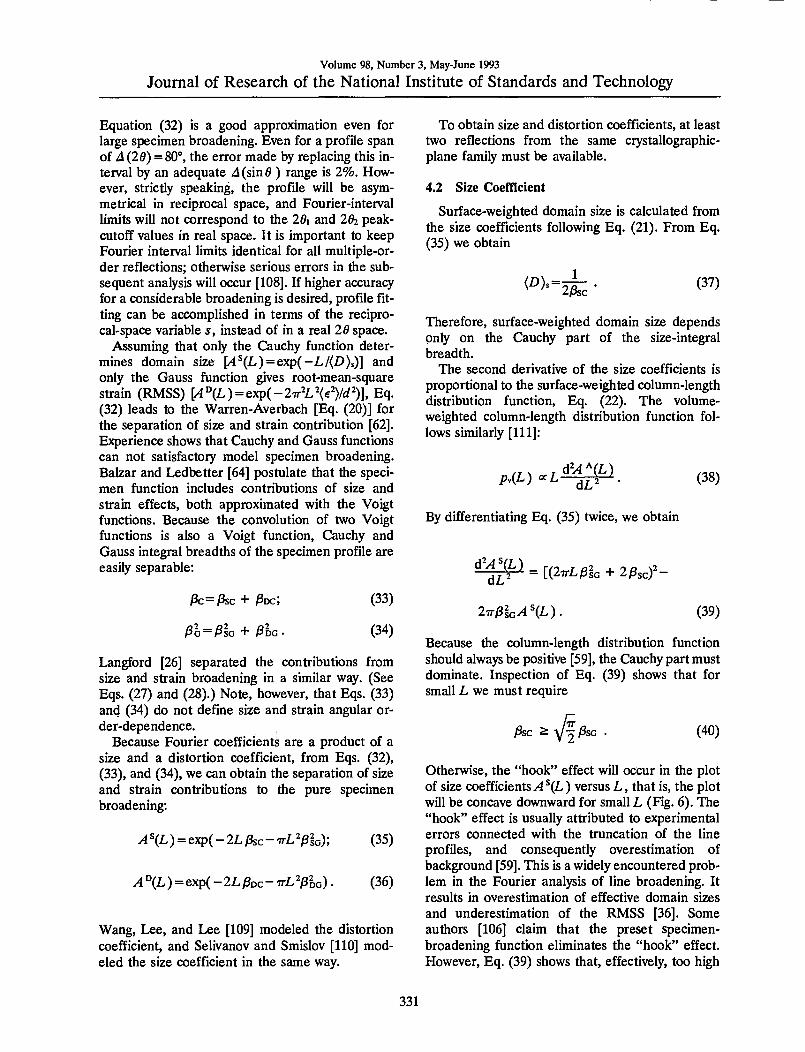
Volume 98 Number 3 May-June 1993
Journal of Research of the National Institute of Standards and Technology
Equation (32) is a good approximation even for large specimen broadening Even for a profile span of A (29) = 80deg the error made by replacing this in- terval by an adequate A(sin9 ) range is 2 How- ever strictly speaking the profile will be asym- metrical in reciprocal space and Fourier-interval limits will not correspond to the 29i and Idz peak- cutoff values in real space It is important to keep Fourier interval limits identical for all multiple-or- der reflections otherwise serious errors in the sub- sequent analysis will occur [108] If higher accuracy for a considerable broadening is desired profile fit- ting can be accomplished In terms of the recipro- cal-space variable s instead of in a real 29 space
Assuming that only the Cauchy function deter- mines domain size [4(L) = exp(-L(Z))s)] and only the Gauss function gives root-mean-square strain (RMSS) [^deg(L) = exp(-27r=L2(e)d^)] Eq (32) leads to the Warren-Averbach [Eq (20)] for the separation of size and strain contribution [62] Experience shows that Cauchy and Gauss functions can not satisfactory model specimen broadening Balzar and Ledbetter [64] postulate that the speci- men function includes contributions of size and strain effects both approximated with the Voigt functions Because the convolution of two Voigt functions is also a Voigt function Cauchy and Gauss integral breadths of the specimen profile are easily separable
3c=i3sc + 3DC (33)
(34)
Langford [26] separated the contributions from size and strain broadening in a similar way (See Eqs (27) and (28)) Note however that Eqs (33) and (34) do not define size and strain angular or- der-dependence
Because Fourier coefficients are a product of a size and a distortion coefficient from Eqs (32) (33) and (34) we can obtain the separation of size and strain contributions to the pure specimen broadening
^S(L) = exp(-2Li3sc-TrL^3io) (35)
Adeg(L) = eM-2LpDc-TrL^Phc) (36)
Wang Lee and Lee [109] modeled the distortion coefficient and Selivanov and Smislov [110] mod- eled the size coefficient in the same way
To obtain size and distortion coefficients at least two reflections from the same crystallographic- plane family must be available
42 Size Coefficient
Surface-weighted domain size is calculated from the size coefficients following Eq (21) From Eq (35) we obtain
lt^gts = 1
2i3sc (37)
Therefore surface-weighted domain size depends only on the Cauchy part of the size-integral breadth
The second derivative of the size coefficients is proportional to the surface-weighted column-length distribution function Eq (22) The volume- weighted column-length distribution function fol- lows similarly [111]
p(L)ocL^j^ (38)
By differentiating Eq (35) twice we obtain
^^4^ = [(2^L^ic + 2^sc)^- dL
2TrplcAL) (39)
Because the column-length distribution function should always be positive [59] the Cauchy part must dominate Inspection of Eq (39) shows that for small L we must require
(40)
Otherwise the hook effect will occur in the plot of size coefficientsI (L) versus L that is the plot will be concave downward for small L (Fig 6) The hook effect is usually attributed to experimental errors connected with the truncation of the line profiles and consequently overestimation of background [59] This is a widely encountered prob- lem in the Fourier analysis of line broadening It results in overestimation of effective domain sizes and underestimation of the RMSS [36] Some authors [106] claim that the preset specimen- broadening function eliminates the hook effect However Eq (39) shows that effectively too high
331
Volume 98 Number 3 May-June 1993
Journal of Research of the National Institute of Standards and Technology
08-
04-
mdash^ 1 J 1 x
^~ ( ^ ^ i I
1 t 1 11
jl u
V 1 iJ
J
c^
100 200
Fig 6 (upper) The hook effect of the size coefficients A ^ (full line) at small L (lower) it causes negative values (set to zero) of the column-length distribution functions
background causes underestimation of the Cauchy content of the Voigt function because the long tails are truncated prematurely It has to be men- tioned that Wilkens [112] proposed tilted small-an- gle boundaries to be the source of the hook effect Liu and Wang [113] defined a minimum particle size present in a specimen depending on the size of the hook effect Figure 6 shows that negative values of the column-length distribution functions (set to zero) do not affect the shape but shift the entire distribution toward larger L values
Note also that the surface-weighted column- length distribution function ps(L) will usually have a maximum at L = 0 but for the particular ratio of integral breadths determined by Eq (40) it can be zero The volume-weighted column-length distribu- tion function7v(L) will always have a maximum for LsO
If the column-length distribution functions are known it is possible to evaluate mean values of respective distributions
lt^kv =
00
J ^ _0
(L)dL
raquosv(L)dL (41)
Integrals of this type can be evaluated analytically [114]
OQ
J cexp( - to^ - a )dc = i^y^ ^ of
hd^^^^fe)]- (^2)
Surface-weighted domain size (D)s must be equal to the value obtained from Eq (37) The volume- weighted domain size follows
ltD)v = ^^erfc(A) = js (43)
Using Eqs (37) and (43) we can evaluate the ratio of domain sizes
i^ = 7r lt^gts
= 2vn-^exp(A2)erfc(^) (44)
Theoretically k can change from zero to infinity However the minimum value of k is determined by Eq (40)
1V2 ltk lt laquogt (45)
Hence the ratio of domain sizes can change in a limited range (see also Fig 7)
131laquo V2^ erfc (^ ) s ^ lt 2 (46)
10^ 10^ 10- 10deg 10 10^ 10-
Fig 7 The ratio of volume-weighted and surface-weighted domain sizes as a function of the characteristic ratio of Cauchy and Gauss integral breadths k
332
Volume 98 Number 3 May-June 1993
Journal of Research of the National Institute of Standards and Technology
It may be noted that most experiments give the ratio D)vD)s in this range (see for instance re- view by Klug and Alexander [24]) When k goes to infinity the size broadening is given only by the Cauchy component and (JD)V=2(D)S This is a case of pure Cauchy size broadening described by Haider and Wagner [62] and de Keijser Mittemei- jer and Rozendaal [107] It is possible to imagine a more complicated column-length distribution func- tion [27] than Eq (39) which would allow even larger differences between surface-weighted and volume-weighted domain sizes However we are not aware of any study reporting a difference larger than 100
43 Distortion Coefficient
In Sec 212 it was shown that the distortion co- efficient can be approximated by the exponential
Adeg(L) = exp(-ITTVLeL))) (47)
Comparing with Eq (36) we can write
Therefore mean-square strains (MSS) decrease linearly with averaging distance L This behavior is usually observed in the Warren-Averbach analysis Rothman and Cohen [115] showed that such be- havior would be expected of strains around disloca- tions Adler and Houska [116] Houska and Smith [117] and Rao and Houska [118] demonstrated for a number of materials that MSS can be repre- sented by a sum of two terms given by Cauchy and Gauss strain-broadened profiles
However for i3Dc=0 the MSS are independent ofL
(^2)12 ^ ^Dc(2g) cotg = ^ 2V2 V2TT
(49)
where the upper limit of strain e is defined as 7j4 (see Sec 212) This is a limiting case of pure- Gauss strain broadening described by de Keijser Mittemeijer and Rozendaal [107]
44 Discussion
To calculate domain sizes and strain it is neces- sary to define size and distortion integral-breadths angular order-dependence From Eq (43) It fol- lows that the domain size D )v is always indepen- dent of the order of reflection
)3sc = const JSSG = const
However from Eq (48) we find
^^ = const ^^ = const
(50)
(51)
An important consequence is that apparent strain TJ will be independent of angle of reflection only in the case of pure-Gauss strain broadening because 3DC and JSDG depend differently on the dif- fraction angle If we compare Eq (51) with the multiple-line Voigt-function analysis [26] given by Eqs (27) and (28) it is evident that they disagree Therefore recombination of constituent integral breadths 3DC and 3DO to Voigt strain-broadened in- tegral breadth Pdeg and the subsequent application of Eq (49) to calculate strain [26 119] will concur with the Fourier methods if strain broadening is entirely Gaussian and for the asymptotic value of MSS ((e^( 00))) However neither volume-weighted domain sizes D)y will agree although they are de- fined identically in both approaches because size- broadened and strain-broadened integral breadths are dependent variables
If at least two orders of reflection ( and +1) of the same plane (hkl) are available using Eqs (50) and (51) we can solve Eqs (33) and (34)
(52)
^^deg sl + l)-sil) ^^^^
^^=sHl + l)-sl) [fc( + l)-3c()3 (54)
^^=sl + l)-sl) [^(^ + ^)-^(0]- (55)
If we substitute these expressions into Eqs (35) and (36) we see that this approach leads exactly to the Warren-Averbach Eq (20) for two orders of reflections This is expected because the distortion coefficient is approximated with the exponential (47)] Delhez de Keijser and Mittemeijer [23] ar- gued that instead of Eq (20) the following rela- tion would be more accurate
A(L)=AXL) (1 -27r^(e^(L))LVd (56)
333
Volume 98 Number 3 May-June 1993
Journal of Research of the National Institute of Standards and Technology
These two approximations differ with fourth-order terms in the power-series expansion In terms of this approach Eq (48) has to be rewritten
2r ^^ l-exp(-2LI3DC-TTL^0DG) (57)
This means that even if the strain-broadened pro- file is given entirely by the Gauss function the MSS depend on distance L (see Fig 8) In this ap- proximation no simple relation for the distortion integral-breadths angular order-dependence exists For not so large L however Eq (51) holds and approximations from Eqs (20) and (56) do not dif- fer much (see Fig 8)
1500 Warren- Averbach approximation ^
Delhez de Kcijscr and ^^^ Minemeijer approximation ^y^
^ 1000 A
500
mdashI
1 1
Oc 300 600 IL k^) X 10^
90
o ^ 60 A
30
1
J Warren- Averbach approximation
Delhez de Keijser and Minemeijer approximation
0 0 150 300
1L (A-1 ) X 10^
Fig 8 Mean-square strains pound^(L)) for two approximations of the distortion coefficient (upper) Voigt strain broadening (lower) pure-Gauss strain broadening
Generally it was shown that in the size-broad- ened profile the Cauchy part must dominate No similar requirement for the strain-broadened pro- file exists However experience favors the assump- tion that it has to be more of Gauss-type The Warren-Averbach approach is exact if strain broad- ening is purely Gaussian so Eqs (20) and (48) are
better approximations as strain profile is closer to the Gauss function In any case both approaches given by Eqs (20) and (56) are good up to the third power in strain and the Warren-Averbach relation [Eq (20)] does not assume that MSS are independent of distance L [27] it also represents a harmonic approximation
If at least two orders of reflection from the same plane (hkl) are available we can use Eqs (52) (53) (54) and (55) to calculate size-related and strain-related integral breadths Subsequent appli- cation of Eqs (37) (43) and (48) gives directly domain sizes (D) and (D)v and mean-square strains (e^(L)) This approach is more straightfor- ward and much simpler than the original Warren- Averbach analysis Great care should be given to the possible systematic errors The easiest way to observe the hook effect is to plot column-length distribution functions as a function of averaging distance L If they show negative values for small L (see Fig 6) all derived parameters will be in error This is because (i) only the positive values of the column-length distribution functions are numeri- cally integrated or (ii) the intercept on the L-axis of the linear portion of the A^ vs L curve is taken (see Fig 4) always larger values of domain sizes will be obtained than by the application of Eqs (37) and (43) Therefore we conclude that the dis- crepancy between integral-breadth and Fourier methods is always present by the appearance of the hook effect in the A^ vs L curve An analogous discrepancy exists between integral-breadth and variance methods [119] In such cases correction methods for truncation can be applied [35 119 120] but the best procedure is to repeat the pat- tern fitting with the correct background
In the Fourier analysis it is usually observed that the mean-square strains diverge as the averaging distance L approaches zero This also follows from Eqs (48) and (57) However because the MSS de- pendence on distance L is not defined in Warren- Averbach analysis it was suggested [27 107 121] that local strain can be obtained by taking the sec- ond derivative of the distortion coefficient or by a Taylor-series expansion of local strain Therefore we obtain from Eq (36)
i^m-M^-^) (58)
It is evident that this relation is wrong It holds only for a special case of pure-Gauss strain-broad- ened profile when the MSS are equal for any L Otherwise if the Cauchy function contributes to
334
Volume 98 Number 3 May-June 1993
Journal of Research of the National Institute of Standards and Technology
strain broadening all derivatives of strain in L = 0 are infinite and local strain can not be defined If the main origin of strains is dislocations [115] strains are defined after some distance from the dislocation (cutoff radius) to be finite Averaging strains over a region smaller than the Burgers vector is probably not justified For instance Eq (48) gives even for a small averaging distance L = 1 A and considerable strain broadening (J3DG(20) = 3DC(20) = 1O) root-mean-square strain eL = 1A))^ laquo02 that is about the elastic limit
45 Random Errors of Derived Parameters
Errors in size and strain analysis of broadened peaks are relatively difficult to evaluate Following Langford [26] sources of the systematic errors in- clude choice of standard specimen background and type of analytical function used to describe the line profiles The first two errors should be mini- mized in the experimental procedure Errors caused by inadequate choice of specimen function would systematically affect all derived results but they can not be evaluated Random errors caused by counting statistics have been computed by Wilson [122 123 124] and applied to the Stokes deconvolution method by Delhez de Keijser and Mittemeijer [23] as well as by Langford [26] and de Keijser et al [76] using single-line Voigt-func- tion analysis Nevertheless the approximate error magnitude can be calculated from estimated stan- dard deviations (esd) of the parameters refined in the fitting procedure In the program SHADOW the weighted least-squares error is minimized
7wp mdash RES
Here
)=1
RES = 2 vfi [ (obs) - (cal)]
(59)
(60)
and weights are the reciprocal variances of the ob- servations
H = l(obs) (61)
Each line profile has four parameters varied inde- pendently position intensity and Cauchy and Gauss integral breadths of the Voigt profile In least-squares refinement esds are computed as
^^ bu RES (62) m mdashm
Here ba are diagonal elements of the inverse matrix of the equation coefficients m is the number of observations and m is the number of refined parameters The main source of errors is integral breadths Errors in peak position peak intensity and background are much smaller and can be ne- glected in this simple approach For two indepen- dent variables )3G and Pc covariance vanishes and from Eqs (37) and (38) for the two orders of re- flection and +1 it follows that
RD =
si+i)m)RHMi))+si)m+i)i^(3c(+D)
(63)
ReL)r) =
pHDRHPcG)) + m + miPcJl + D) 2[3c(+1) - i8c()3+TTL [m+1) - mw
-n-LmiDRHihd))+m+mWcH+i))i ^ 2[)3c(+1) - iSc()+TTLim+1) - mw
(65)
Here Rx) are relative standard deviations The error in D would be complicated to evaluate but because 131D)s^(Igt)vlt2(pound))s Eq (63) gives a good estimation for the error in (Z))v as well Alter- natively to see how errors depend on the Fourier coefficients errors can be estimated from the Warren-Averbach relationship [Eq (20)] (86) From Eq (32) it follows that
RA (L)) = ATr^Lpos)R^2d)) +
4Lph(s)RPci2e)) (66)
Errors in root-mean-square strains and domain sizes are
i^((e^(L ))bulllaquo) =
RHA(Ll))+RHA(Ll + l)) (67)
ALl + l)
335
Volume 98 Number 3 May-June 1993
Journal of Research of the National Institute of Standards and Technology
^^laquo^))=(T^)
s(l + 1)RHA (Ll)) +SV)RHA (Ll + D) lsl + l)-sl)f (68)
Here (D) is approximately defined with A^(L) = l-L(D)j Errors in Fourier coefficients increase with L while factors in Eqs (67) and (68) lower the errors for large L In general errors of domain sizes and strains are of the same order of magnitude as errors of integral breadths [86]
5 Application 51 Correction for Instrumental Broadening
Before specimen broadening is analyzed instru- mental broadening must be determined This is ac- complished by carefully measuring diffraction peaks of some well-annealed defect-free speci- men It is then assumed that its broadening may be attributed only to the instrument The usual proce- dure is to anneal the specimen However in some instances that is not possible because either the material undergoes an irreversible phase transition on annealing or the number of defects can not be successfully decreased by annealing Another pos- sibility is to measure the whole diffraction pattern of the material showing the minimal line broaden- ing and then to synthesize the instrumental profile at the needed diffraction angle This approach re- quires the modeling of the angle dependence of the instrumental (standard) parameters Cagliotti Pao- letti and Ricci [125] proposed the following func- tion to describe the variation of the full width at the half maximum of profile with the diffraction angle
F9miA^(2e) = Utan^9 + Vtand + W (69)
Although this function was derived for neutron dif- fraction it was confirmed to work well also in x-ray diffraction case [126 127] A more appropriate function for the x-ray angle-dispersive powder dif- fractometer based on theoretically predicted er- rors of some instrumental parameters [128] may be the following [129]
FWHNf (2 e) = W+Vsin^l 6 +
UtanH + UcotH (70)
This function may better model the increased axial divergency at low angles and correct for the speci- men transparency [129] However contrary to the requirement on the specimen function most im- portant for the instrumental function is to correctly describe the angular variation of parameters re- gardless of its theoretical foundation
When specimen broadening is modeled with a Voigt function the simplest way to correct for the instrumental broadening is by fitting the line pro- files with the Voigt function too Cauchy and Gauss integral breadths of the specimen-broad- ened profile are then easily computable by Eqs (7) and (8) However because the instrumental broad- ening is asymmetric [24] modeling with the sym- metric Voigt function can cause a fictitious error distribution resulting in errors of strain up to 35 [76] Another approach is to model the instrumen- tal-broadening angle dependence by fitting the profile shapes of a standard specimen with some asymmetrical function split-Pearson-VII [95] or pseudo-Voigt convoluted with the exponential function [105] The instrumental function can then be synthesized at any desired angle of diffraction and convoluted with the assumed specimen func- tion to match the observed profile by means of Eq (2)
In the program SHADOW instrumental para- meters are determined by fitting the split-Pearson VII function (see Fig 9) to line profiles of a standard specimen
iix)=m- 2 m
with
c =-
mc^f
mm) mv-rim-12)
(71)
(72)
Here m = 1 or m = ltraquo yields a Cauchy or Gauss function respectively Refined full widths at half maximum (FWHM) and shape factors m for both low-angle and high-angle sides of the profiles are fitted with second-order polynomials To fit the FWHM we used Eq (69) and for the shape fac- tors
m(2e) = U(20f + V(2e) + W (73)
The resulting coefficients U V W U V and W permit synthesis of the asymmetrical instrumental line profile at any desired angle
336
Volume 98 Number 3 May-June 1993
Journal of Research of the National Institute of Standards and Technology
2 0(deg)
le
Fig 9 A split-Pearson VII profile The two half profiles have same peak position and intensity Adapted from Howard and Preston [4]
The basic requirement on the standard specimen is however to show as small a line broadening as possible To minimize physical contributions to the Une broadening of the standard specimen a few moments were emphasized as follows Because dif- fraction-line width depends strongly on degree of annealing it is preferable to use some reference powder-diffraction standard Furthermore asym- metry in the peak profiles is introduced by axial divergence of the beam flat specimen surface and specimen transparency [24] Choosing a standard specimen with low absorption coefficient would cause transparency effects to dominate If the stud- ied specimen has a large absorption coefficient (compared to the standard) this might produce a fictitious size contribution and errors in micro- strains All of the specimens studied have absorp- tion coefficients exceeding 1000 cm^ so a NIST standard reference material 660 LaBe was chosen to model the instrumental broadening (p = 1098 cm) According to Fawcett et al [130] LaBe showed the narrowest lines of all studied com- pounds Furthermore LaB6_has a primitive cubic structure (space group Pm3m) resulting in rela- tively large number of peaks equally distributed over 26 This allows for better characterization and lower errors of FWHMs and shape factors of split- Pearson VII functions (Fig 10)
52 Applicability of the Method
To study the applicability of method described in Sec 4 we first studied simple cubic-structure mate- rials such as silver and tungsten Tungsten has very narrow line profiles allowing us to obtain the up- per limit of domain sizes that can be studied Silver is easily deformed which provides a possibility to apply the method to broad line profiles To test the
009
-a
OH
006
003
1 1 m low-angle side n m high-angle side
bullz w 2 o OH
X
tancopy
Fig 10 Refined FWHMs and shape factors (exponents) m for low-angle and high-angle sides of LaBe line profiles Second- order polynomials were fitted through points
case of relatively complicated patterns and weak line broadening the method was also applied to Lai85Sroi5Cu04 and La2Cu04 powders In this sec- tion only the mechanical aspects of the line broad- ening are discussed Discussion about the origins of broadening of superconductors can be found in Sec 6
521 Silver and Tungsten Powders Figure 11 shows observed and refined peaks of tungsten un- treated and silver ground powders In Table 2 are listed results of fitted pure-specimen Voigt profiles for silver and tungsten specimens Table 3 and Fig 12 give results of the line-broadening analysis Untreated tungsten powder shows relatively weak broadening Instrumental profile FWHMs at angle positions of (110) and (220) tungsten lines are 0059deg and 0081deg respectively close to values mea- sured for tungsten 0065deg and 0100deg Results in Table 3 reveal that small broadening is likely caused by domain sizes because microstrains have negligible value This pushes the limit for measur- able domain sizes probably up to 4500-5000 A However one must be aware that weak specimen broadening implies higher uncertainty of all derived parameters Moreover the choice of the instrumental standard becomes more crucial
Both silver and tungsten line profiles become more Cauchy-like after grinding which probably increases dislocation density in the crystallites This is consistent with the presumption that small crystallites and incoherently diffracting domains separated by dislocations within grains affect the tails of the diffraction-line profiles [60115] Figure 13 illustrates the dependence of MSS on the recip- rocal of the averaging distance L
337
Volume 98 Number 3 May-June 1993
Journal of Research of the National Institute of Standards and Technology
C8
z
7- ^95
29 (deg) 405
bullJf^r-
z S 08
Ez U o u OS
a
04 bull
o Es
4P
2000 z^fA
4000
B
z u f- z
425 435 445 29 (deg)
455
yr 600 SOO
L(A)
Fig 11 Observed points (pluses) refined pattern (full line) and difference pattern (below) (110) W untreated (upper) (200) Ag ground (lower)
Fig 12 Fourier coefficients for the first- (pluses) and second- order (crosses) reflection and size coefficients (circles) [111] Ag untreated (upper) [100] Ag ground (lower)
Table 2 Parameters of the pure-specimen Voigt function as obtained from profile-fitting procedure for tungsten and silver powders
Specimen hkl 2ft(deg) 3c(deg) 3G(deg) FWHM(deg) Rwp()
W untreated 110 220
4028 8705
00065(7) 00301(6)
0020(2) ltio-
0021 0019
90 44
W ground 110 220
4029 8705
0100(2) 0222(3)
0038(4) 0069(6)
0080 0166
90 42
Ag untreated 111 222 200 400
3806 8151 4425 9786
0056(1) 0105(4) 0118(2) 0274(21)
ltio- 00008(21)
ltio-^ ltio-5
0036 0067 0075 0175
105 97
105 122
Ag ground 111 222 200 400
3807 8151 4424 9783
0175(3) 0410(26) 0365(10) 1079(82)
0038(12) ltio-
0076(29) ltio-
0121 0261 0250 0687
99 145 99
145
338
Volume 98 Number 3 May-June 1993
Journal of Research of the National Institute of Standards and Technology
Table 3 Microstructural parameters for tungsten and silver powders
Specimen Direction (poundgt)raquo( A) (2))v(A) ltpound^(fl3))laquo (^laquoD)v2)gtw
W untreated [110] 3200(200) 3500(200) 000038 000008(2)
W ground [110] 620(20) 1030(30) 00023 000054(2)
Ag untreated [111] [100]
1000(20) 510(20)
2000(20) 1030(20)
00010 00022
000024(1) 000047(5)
Ag ground [111] [100]
380(20) 210(10)
650(20) 350(20)
00047 00100
000095(7) 000180(14)
100 -_ - [100) Ag ground ^ ^~ mdash C1111 Ag ground ^bull
y y
o y ^ 50 A y
y y
y
0
y - y ^--
c ) 50 100 150
lLfAjxlO^
Fig 13 Mean-square strains (E^) as a function of VL
Errors in integral breadths allow estimation of errors in strain and size parameters (Sec 45) but in some cases the refinement algorithm gives unre- liable errors of integral breadths When a particu- lar parameter is close to the limiting value (for instance 10^ degrees has been put as the mini- mum value for integral breadths) errors become large However in Eqs (63) (65) (66) (67) and (68) only the product of integral breadth and ac- companying error is significant which is roughly equal for Cauchy and Gauss parts Errors of do- main sizes and strains are of the same order of magnitude as errors of integral breadths
The possible source of systematic error is poten- tial inadequacy of Voigt function to accurately de- scribe specimen broadening This effect can not be evaluated analytically but it would affect all derived parameters especially the column-length distribution functions The logical relationship be- tween values of domain sizes (see Table 3) for dif- ferent degrees of broadening indicates that possible systematic errors can not be large
Equation (41) allows computation of volume- weighted and surface-weighted average domain sizes if respective column-length distribution func- tions can be obtained Figure 14 gives surface- weighted and volume-weighted average column- length distribution functions following Eqs (39) and (38) Width of the distribution function deter- mines the relative difference between (D) and (pound))v The broader the distribution the larger the differences because small crystallites contribute more to the surface-weighted average That is much more evident comparing the surface- weighted column-length distribution with the vol- ume-weighted If they have similar shape and maximum position as in Fig 15 differences are small Conversely if the surface-weighted distribu- tion function has a sharp maximum toward smaller sizes differences are larger (see Fig 14) The dif- ference between (poundgt)s and (D)v and the actual mean dimension of the crystallites in a particular direction also depends strongly on the average shape of the crystallites [52 131 132]
If experimental profiles are deconvoluted by the Stokes method even for considerable specimen broadening size coefficients A ^ usually oscillate at larger L values [59 106] preventing computation of the column-length distribution function Few techniques were used to deal with this problem successive convolution unfolding method [32 133] smoothing and iterative methods [134 135 136 137] Figures 14 and 15 show very smooth column- length distribution functions However they follow from size coefficients ^4^ that depend on the accu- racy of the approximation for the distortion coeffi- cient given by Eq (47) Equation (47) is exact if the strain distribution is Gaussian but in general holds only for small harmonic numbers n if strain broadening is not negligible
339
Volume 98 Number 3 May-June 1993
Journal of Research of the National Institute of Standards and Technology
500 1000 L(A)
Fig 14 Surface-weighted and volume-weighted column-length distribution functions normalized on unit area [111] Ag un- treated (upper) [100] Ag ground (lower)
Fig 15 Surface-weighted and volume-weighted column-length distribution functions for [010] La2Cu04 normalized on unit area
522 La2-xSrtCu04 Powders To test the applicability of the discussed method to more com- plicated patterns two compounds with lower crystallographic symmetry were studied Lai85Sroi5Cii04 has a tetragonal K2NiF4-type struc- ture space group lAlmmm La2Cu04 is orthorhom-
bic at room temperature Both compounds show slight line broadening and relatively highly overlap- ping peaks (see Fig 16) which makes it very diffi- cult if not impossible to perform a Stokes analysis
25
-25
26 (deg)
yNraquo-
Fig 16 Observed points (pluses) refined pattern (full line) convoluted profiles (dashed line) and difference plot (below) for part of La2Cu04 pattern
Tables 4 and 5 list results from the fitting proce- dure and the analysis of specimen-broadened inte- gral breadths There are no qualitative differences in results for tungsten and silver powders How- ever average errors are higher as expected be- cause of overlapping peaks while weighted errors wp are surprisingly smaller This fact illustrates the unreliability of iwp when only a segment of the pat- tern is being refined because it depends on the number of counts accumulated in points as well as on the 28 range of the refinement
Figures 17 and 18 represent Fourier coefficients of Lai85Sroi5Cu04 [110] and La2Cu04 [010] direc- tions In the second plot the A (L )-versus-L plot shows a concave-downward part near L =0 the so- called hook effect It was shown in Sec 42 that the hook effect originates because of underesti- mation of background connected with the trunca- tion of profiles In the profile refinement all peaks separated less than 4deg 20 have been included in the refinement region to avoid possible overlapping of peak tails and specimen profiles have been trun- cated below 01 of the maximum intensity How- ever because the polynomial background was determined prior to profile refinement it may be overestimated for complicated patterns containing many overlapping peaks If background is refined with other profile parameters undesirable correla- tion with integral breadths occurs
340
Volume 98 Number 3 May-June 1993
Journal of Research of the National Institute of Standards and Technology
Table 4 Parameters of the pure-specimen Voigt function as obtained from profile-fitting procedure for La2-^SrCu04 powders
Specimen hid 2Hdeg) Pen PcO FWHM(deg) Rp()
Lai85Sroi5Cu04 004 2695 0046(4) 0024(8) 0042 34 006 4092 0083(5) ltio-= 0053 62 110 3352 0110(5) ltio- 0070 125 220 7046 0171(9) ltio- 0109 43
La2Cu04 004 2713 0061(8) 0045(9) 0067 39 006 4119 0124(7) ltio-^ 0079 77 020 3316 0074(10) 0078(10) 0102 29 040 6957 0210(30) 0026(81) 0135 29 200 3345 0074(8) 0061(10) 0087 69 400 7028 0130(10) 0023(95) 0089 29
Table 5 Microstructural parameters for Laij(5Srai3Cu04 and La2Cu04 powders
Specimen Direction (DUA) Pgt(A) lte^(fl3))laquo lte2((Z)gt2))laquo
Lai83Sro5Cu04
La2Cu04
[001] [110]
[001] [010] [100]
1700(300) 470(20)
1100(100) 680(50) 680(50)
2000(200) 940(20)
1200(100) 760(50) 810(50)
00024 00017
00038 00033 00016
000049(9) 000044(6)
00008(1) 00007(2) 00003(3)
c i ^- raquo sect 08 bulli - U
^0
ti- bull ll bull bullbullo
ffl M P bull- u ^ Di 04 Si - M bulldiamsbullbull a bull-v 3 o ^^=s^
u ^N^Sraquoraquo^
0 ^^^aaaa 1000
L(A) 2000
OQ bullbulldego UM o z a 08
o o bull bull bull
- u u bull raquo UU bull
a diams o bull o u ft 04 bull deg raquo deg - U bull bull deg Oi bullbullgt =3 bull- l o k u
0 bullbullbullraquo aaaMMi
500 1000
L(A)
Fig 17 Fourier coefficients for the first- (pluses) and second- order (crosses) reflection and size coefficients (circles) for [110] Lai^Sroi5Cu04
Fig 18 Fourier coefficients for first- (pluses) and second- order (crosses) reflection and size coefficients (circles) for [010] La2Cu04
341
Volume 98 Number 3 May-June 1993
Journal of Research of the National Institute of Standards and Technology
S3 Comparison with the Integral-Breadth Methods
Knowing the specimen integral breadths simpli- fied methods can be applied In Sec 212 we re- viewed multiple-line and single-line integral- breadth methods We shall compare the simplified multiple-line methods [Eqs (23) (24) and (30)] and the single-line method [76] [Eqs (29) and (30)] with results obtained for silver tungsten and La2-xSrxCu04 powders (Tables 3 and 5) We did not compare with the multiple-line Voigt-function method [26] because it was shown in Sec 44 that it is incompatible with the Warren-Averbach analy- sis In Table 6 integral breadth Pi was computed according to Eq (11) This value was compared with )8A integral breadth computed from Fourier coefficients [58]
i8A=- laquo3 2^(L)
(74)
Results obtained by the Warren-Averbach analysis are significantly smaller for both size and strain Integral-breadth methods give the upper limit for strain so comparison is limited Considering the approximation e = 125e^(L))^ [138] with L=(D)v2 or L=(D)s2 strains resemble more closely than crystallite sizes It must be noted how- ever that this approximation makes sense only in the case of pure-Gauss strain broadening Benedetti et al [106] reported excellent agreement for both size and strain using Warren-Averbach and Cauchy-Gauss [Eq (24)] methods Results from Table 6 on the contrary indicate that the Gauss-Gauss approximation gives values closest to the Warren-Averbach method for crystallite sizes whereas the Cauchy-Gauss and especially the Cauchy-Cauchy approximation tend to give too large values For strain the trend is opposite The Cauchy-Cauchy approximation resembles most
Table 6 Comparison of results obtained with the integral-breadth methods Cauchy-Cauchy (C-C) Cauchy-Gauss (C-G) Gauss- Gauss (G-G) and single-line (S-L) analysis
Specimen hkl PiXKP PAXKP ltigt)v (Z)gt(A) (e^((DV2)gt2 eXlO^ (A-) (A-0 (A) C-C C-G G-G S-L xlO^ C-C C-G G-G S-L
W untreated 110 220
0259 0247
0259 0247
3500 3700 3810 3810 14500 4040
008 -001 -003 -005 024 0
W ground 110 220
125 204
125 205
1030 2240 1450 1220 940 550
054 090 093 105 045 032
Ag untreated 111 2
0600 0901
0600 0900
2000 3340 2390 2190 1670 1110
024 035 039 095 0 0
200 124 124 1030 2270 1470 1230 810 047 082 085 095 0 400 204 204 490 0
Ag ground 111 222
198 352
200 352
650 2080 1240 910 530 280
095 179 182 197 048 0
200 403 406 350 9380 4780 1320 260 180 405 405 408 082 400 803 803 120 0
Lai85Sroi3Cu04 004 006
0657 0881
0650 0880
2000 5230 3290 2660 1970 1140
049 076 078 088 044 0
110 119 119 940 1240 1000 970 840 044 052 064 080 0 220 158 158 630 0
La2Cu4 004 006
0988 132
0998 131
1200 2980 1940 1630 1490 760
08 107 112 127 081 0-
020 143 142 760 1200 910 860 1240 07 079 090 110 114 040 198 200 510 016 200 126 124 810 810 810 810 1250 03 002 011 015 089 400 1S 126 830 014
Not possible to evaluate because of too small Gauss integral breadth
342
Volume 98 Number 3 May-June 1993
Journal of Research of the National Institute of Standards and Technology
closely a Warren-Averbach method These results concur with the Klug and Alexander [24] compari- son of the published size and strain values obtained by Warren-Averbach (Stokes) and integral-breadth methods However for x-ray diffraction the Cauchy-Gauss assumption for the size-strain broadening is theoretically and experimentally more favored thpoundm the other two models The fact that the Gauss-Gauss method for crystallite size and the Cauchy-Cauchy method for strain give more realistic results may mean that the presump- tion that size and strain broadening are exclusively of one type is an oversimplification
The single-line method seems much less reliable If Gaussian breadth is very small no information about strain is obtained Moreover second-order reflections give much lower values of both size and strain than do basic reflections However if multi- ple reflections are not available the single-line method can give satisfactory estimations
54 Reliability of Profile Fitting
The profile fitting of a cluster of even severely overlapping peaks can be accomplished with a low error and excellent fit of total intensity But how reliable is information obtained about separate peaks in the cluster In the fitting procedure it is possible to put constraints on the particular profile parameter to limit intensity position and width of the peak If anisotropic broadening or different phases are present constraints may not be realistic Morever acceptable results can be obtained even using a different number of profiles in refinement [4] Hence the first condition for the successful ap- plication of this method is knowledge of actual phases present in the sample and their crystalline structures
In this regard two powders were measured or- thorhombic Lai94Sroo6Cu04 has a slightly distorted K2NiF4-type structure (space group Bmab a =53510(2) A b =53692 A(2) c = 131931(7) A) and tetragonal Lai76Sro24Cu04 (space group I4mmm a =37711(3) A c = 132580(8) A) Data were collected for each specimen separately and for a specimen obtained by mixing the same pow- ders Because diffracted intensity of each phase was lower for the mixture counting time was pro- portionally increased to obtain roughly the same counting statistics Figure 19 shows two partially separated orthorhombic (020) (200) and (040) (400) peaks overlapped with tetragonal (110) and (220) reflections During the profile fitting of the mixed powders (200) orthorhombic peak tended to disappear on account of neighboring (020) and
(110) reflections Its intensity was constrained to vary in range plusmn 30 of (020) peak intensity which can be justified if the crystallographic structure is known
60
-60
345
345
335 29 (deg)
345
Fig 19 (upper) Lai76Sro24Cu04 (110) peak (middle) Lai94Sroo6Cu04 (020) and (200) peaks (lower) (110) (020) and (200) peaks
Table 7 contains results of fitted specimen-Voigt functions as well as size and strain values obtained by the analysis of broadening Comparing integral breadths of the starting and mixed powders some profiles change from more Cauchy-like to Gauss- like and vice versa This is especially evident for the (400) reflection meaning that accurate deter- mination of the profile tails is indeed affected in the cluster of overlapping peaks However integral breadth does not change significantly so results of
343
Volume 98 Number 3 May-June 1993
Journal of Research of the National Institute of Standards and Technology
Table 7 Comparison between two specimens run separately and mixed togetlier
Specimen hkl 2Hdeg) )3cO PoO DUA) (D)v(A) (e2laquoD)v2))laquoxlO
Lai76Sroj4CuOr 110 3369 0058(6) 0094(7) 780(60) 850(60) 10(1) 220 7073 022(2) 013(2)
LaiMSro(KiCu04 020 3342 0084(9) 055(14) 500(90) 1000(200) 07(1) 040 7012 010(2) 014(1) 200 3353 00216(85) 0061(8) 1100(100) 1200(100) 03(1) 400 7040 0026(11) 0088(8)
Mix 110 3367 0083(21) 0064(14) 800(300) 1200(300) 08(3) Lai76Sro24Cu04 220 7072 019(7) 013(4)
+ 020 3343 0066(35) 0070(23) 800(300) 1000(300) 07(4) Lai94Sroo6Cu04 040 7012 0116(93) 013(5)
200 3354 0024(156) 0071(61) 900(700) 1000(600) 04(12) 400 7041 011(2) 0003(320)
the multiple-line methods are not much influenced On the contrary the single-line method gives quite different results This may support the conclusion of Suortti Ahtee and Unonius [43] that the Voigt function fails to account properly for size and strain broadening simultaneously if only Cauchy integral breadth determines crystallite size
Table 7 shows that the results of Warren- Averbach analysis of starting and mixed powders agree in the range of standard deviations How- ever errors are much larger especially for the hid- den (200)-(400) reflections From Eq (62) it follows that more counts (longer counting times) and more observables (smaller step-size) would lower standard deviations Therefore in the case of highly overlapping patterns to obtain desirable ac- curacy much longer measurements are needed al- though that will not change the fact that higher overlapping implies intrinsically higher errors of all refinable parameters To further minimize possible artifacts of the fitting procedure it is desirable to include in the analysis as many reflections in the same ciystallographic direction as possible
55 Remarks
By modeling the specimen size and strain broad- ening with the simple Voigt function it is possible to obtain domain sizes and strains that agree with experiment and show a logical interrelationship Furthermore the Voigt function shows the correct 1A(26y asymptotic behavior of peak tails as ex- pected from kinematical theory [139] However if the specimen profile is significantly asymmetric (because of twins and extrinsic stacking faults [140 59]) or the ratio FWHM^ is not intermediate to the Cauchy (2Tr) and Gauss (2(ln27r)^) functions then the Voigt function can not be applied [25]
Suortti Ahtee and Unonius [43] found good over- all agreement by fitting the Voigt function to the pure-specimen profiles of a Ni powder deconvo- luted by the instrumental function However more accurate comparison is limited because of unavoid- able deconvolution ripples of specimen profiles Furthermore the Voigt function might not be flex- ible enough to model a wide range of specimen broadening as well as the different causes of broadening Therefore the question whether the Voigt function can satisfactorily describe complex specimen broadening over the whole 20 range in a general case needs further evaluation
This method of Fourier analysis with the as- sumed profile-shape function is most useful in cases when the classical Stokes analysis fails there- fore when peak overlapping occurs and specimen broadening is comparable to instrumental broaden- ing It was shown that for a high degree of peak overlapping the fitting procedure can give unreli- able results of Gauss and Cauchy integral breadths that is the peak can change easily from predomi- nantly Cauchy-like to Gauss-like and contrary This can lead to illogical values of size-integral and strain-integral breadths according to Eqs (52) (53) (54) and (55) and to irregularities in the be- havior of Fourier coefficients for large L Simulta- neously if the size-broadened profile has a large Gauss-function contribution the hook effect will occur However volume-weighted domain sizes D)y and MSS eL)) for small L are much less affected because they rely on both Cauchy and Gauss parts of the broadened profile Any integral- breadth method that attempts to describe the size and strain broadening exclusively by a Cauchy or Gauss function in this case fails completely For specimens with lower crystallographic symmetry
344
Volume 98 Number 3 May-June 1993
Journal of Research of the National Institute of Standards and Technology
when many multiple-order reflections are avail- able but the peaks are overlapped it is therefore desirable to include in the analysis as many reflec- tions as possible to minimize the potential artifacts of the fltting process
6 Analysis of Superconductors 61 (La-M)2Cu04 Superconductors
Bednorz and Miiller [16] found the first high- temperature oxide superconductor in the La-Ba- Cu-O system Soon after substituting Ba with Sr and Ca Kishio et al [17] found superconductivity in two similar compounds Later many compounds with much higher transition temperatures (Tc) were found The (La-M)2Cu04 system remains favorable for study because the cation content responsible for the superconductivity is easier to control and measure than the oxygen stoichiometry Also this system provides a wide range of substitutional cation solubility in which the tetragonal K2NiF4- type structure is maintained Compared with much- studied Y-Ba-Cu-O this structure is simpler because it contains only one copper-ion site and two oxygen-ion sites
The undoped compound La2Cu04 is orthorhom- bic at room temperature It becomes superconduct- ing either with cation substitution on La sites or increased oxygen content to more than four atoms per formula unit Doping with divalent cations in- creases the itinerant hole carriers in the oxygen- derived electron band [141] which probably causes the superconductivity However different dopants influence the transition temperature Tc Although the unit-cell c-parameter simply reflects ionic dopant size [142] the in-plane unit-cell parameter (and accordingly the Cu-0 bond length) correlates with Tc for different dopants and for different dop- ing amounts [142 143]
LaiB5MouCu04 (M = Ba Ca Sr) have a tetrago- nal K2NiF4-type structure space group lAlmmm with four atoms in the asymmetric unit [117] One site is occupied with La partially substituted with dopant ions (Fig 20) La2Cu04 is orthorhombic at room temperature The best way to correlate these two structures is to describe La2Cu04 in space group Bmab the c axis remains the same tetrago- nal [110] and [110] directions become [010] and [100] orthorhombic axes and size of the unit cell is doubled [144]
Figure 21 shows parts of the x-ray diffraction patterns observed and refined of Lai85Moi5Cu04 (M = Sr Ba Ca) and La2Cu04 Refined lattice
parameters are given in Table 8 Table 9 shows resuhs of the line-broadening analysis Relatively
La(BaCaSr)
0(2)
0(1)
Fig 20 Ciystal structure of (La-M)2Cu04 showing one unit cell
300 JUU
(b)
200
100
U 0 M J Js-r-^
30
-30
300
40 41 42 43 44 45 40 41 42 43 44 45 29 (deg) 29 (deg)
mdashA-
gt t 200
Z
F-
- 100
(c)
f V kgt ii I 40 41 42 43 44 45 40 41 42 43 44 45
e (deg) ^^ 26 (deg)
-30 wwX mdash Wlaquo-
Fig 21 Diffraction patterns of LaiH5Moi5Cu04 specimens (a) M=Sr (b) M = Ba (c)M = Ca (d) M = U
345
Volume 98 Number 3 May-June 1993
Journal of Research of the National Institute of Standards and Technology
Table 8 Lattice parameters and T^ at zero resistivity (Ac method at 10 Ma current)
Specimen a (A) bk) c(A) rc(K)
Lairaquo5Sroi5Cu04 377814(7)
Lairaquo3Baoi3Cu04 37846(2)
LaiiijCaoi5Cu04 37863(7)
La2Cu04 53558(2) 54053(2)
231(2) 36
288(4) 28
17(2) 19
1451(8)
Table 9 Results of line-broadening analysis for (La-M)2Cu4 specimens
Specimen hkl PcO PoO (DUk) (Iraquo)(A) lte^((D)2))
Lai(laquoSroj5Cu04 004 006
0046(4) 0083(5)
0024(8) ltio-
1700(300) 2000(200) 000049(9)
110 0110(5) ltio- 470(20) 940(20) 000044(6) 220 0171(9) ltio-
Lai85Baoi3Cu04 004 006
0049(6) 0110(7)
0076(6) 0089(9)
1100(200) 1100(100) 00011(2)
110 0087(4) 000042(6) 560(20) 1110(20) 000024(5) 220 0116(3) ltio-5
Laiji5Caoi5Cu04 004 006
0120(13) 0146(12)
0032(22) 0033(27)
440(70) 780(90) 00007(4)
110 0045(25) 0200(19) 340(30) 360(20) 00013(2) 220 0343(22) ltio-
La2Cu04 004 006
0061(8) 0124(7)
0045(9) ltio-
1100(100) 1200(100) 00008(1)
020 0074(10) 0078(10) 680(50) 760(50) 00007(2) 040 0210(30) 0026(81) 200 0074(8) 0061(10) 680(50) 810(50) 00003(3) 400 0130(10) 0023(95)
weak peak broadening was observed which can not be attributed to the proximity of the phase trans- formation Lai85SroisCu04 is tetragonal down to = 170 K [145] Lai85Baoi5Cu04 to 140 K [146147] and Lai85Caoi5Cu04 to 130 K [148] Another possi- ble reason for peak broadening might be continu- ous compositional variations in dopant content The scanning Auger microprobe analysis of La2-SrtCu04 compounds [149] showed that grain- boundary segregation of Sr is weak and limited to a narrow region near the grain surface In the case of the separation of two phases with different Sr con- tent and similar lattice parameters asymmetry of some reflections would be observed [150] More- over in the case of compositional inhomogeneity microstrains eL)) would be roughly independent of the averaging distance L in the grains [151] therefore distribution of strains would be Gaus- sian For all specimens microstrain behavior is identical it decreases linearly with distance L
Rothman and Cohen [115] showed that such be- havior of microstrains is caused by dislocations that might arise during grinding Assuming the same applied stress microstrain would be approximately inversely proportional to the elastic moduli of these materials If mean microstrain is defined as the arithmetic average of strains for the [001] and [110] directions results agree with values of the Youngs moduli for polycrystalline La2Cu04 Lai85Moi5Cu04 (M = Sr Ba Ca) [152] However other factors may contribute to the microstrain Coordination-6 ionic radii of La^+ Sr Ba^+ Ca^+ are 106 116 136 100 A respectively [153] Substitution of La with ions of different sizes affects the lattice parameter [142] and may cause much larger strains in the [001] direction when some of the ions are replaced with Ba^ than with Sr^ in accord with results in Table 9 Substitution of Ca^^ ions produces an entirely different effect microstrains in the [110] direction are larger This may be explained by
346
Volume 98 Number 3 May-June 1993
Journal of Research of the National Institute of Standards and Technology
comparing effects of substitutional ions on the unit-cell a -parameter The Ba-doped specimen has a larger a-parameter than the Sr-doped but the Ca-doped a-parameter is largest although Ca^^ has the smallest ionic size This should increase the cell distortion in the a-b plane
Table 9 reveals high anisotropy in these materi- als consistent with other physical properties such as thermal expansion [154] and upper critical mag- netic field [155] Differences of domain sizes might arise from a layered structure in the [001] direction and consequently easy incorporation of stacking faults between regularly stacked layers The stack- ing-fault and twin-fault probabilities can be esti- mated from the average surface-weighted domain sizes [59]
^ = TAN + cf1fun(aa) (75) m im - (D)
Here c is a constant for the particular [hkl] direction and fun(a a) a linear combination of stacking-fault probability and twin-fault probability a The exact form of Eq (75) was derived only for the cubic and hexagonal crystal structures On con- dition that the true domain dimension D is isotropic or so large that the second term of Eq (75) dominates a linear function of stacking-fault and twin-fault probability is
fun(aa) = c( 1
) (76) Zgt)J (Dgttrade
Here c denotes a constant that depends only on geometrical factors and is the same for all three doped compounds
Figure 22 shows a possible correlation between Tc and fault-defect probabilities computed from TEM observations of La2-jcSrCu04 revealed that stacking-fault density increased with Sr content up to jc = 015 [156] That study suggests that a shear mechanism forming the fault-boundary dislocations implies oxygen vacancies andor cation deficiency We did not measure oxygen content but neutron- diffraction studies showed that oxygen deficiency starts to appear at much higher Sr content [157] However the increase of fault probability with the simultaneous decrease of microstrain in Fig 22 supports the assumption that defects are intro- duced to accommodate lattice strains [156] A simi- lar increase in Te was found in Y2Ba4Cu802o-laquo thin films [158] Compounds with asymmetric broad- ened and shifted peaks showed higher Tc which
was attributed to stacking faults Although extrinsic stacking faults may cause asymmetric peak broad- ening [140] it is probably caused by twinning Twinning in La-M-Cu-0 materials is less abundant than in Y-Ba-Cu-O compounds but it was ob- served in (La-Sr)2Cu04 monocrystals on (110) planes [159] In the profile-fitting procedure peak asymmetry is incorporated only in the instrumental function therefore we could not model asymmetric peak broadening However any significant asym- metry of the specimen profile would cause an un- even fit of low-angle and high-angle sides of peaks which was not observed This gives much more im- portance to stacking faults in Eq (76)
Fig 22 Arithmetic average of [110] and [001] root-mean- square strains and linear function of stacking-fault and twin- fault probabilities as a function of Tc
In Fig 22 average microstrains defined as the arithmetic average of [001] and [110] directions correlate inversely with Tc However we did not find a correlation of Tc and microstrains in a partic- ular direction [001] microstrains simply reflect dif- ference in size of dopant and host La^ ions (see Table 9)
In La2Cu04 (OkO) reflections are significantly broader than (hOO) This has also been observed in low-temperature orthorhombic Lai85Sroi5Cu04 and Lai85Baoi5Cu04 [160] and explained by either stacking faults or possible lower symmetry Our results reveal that domain sizes (D) have identical values for [010] and [100] directions (Table 9) From Eq (76) it follows that stacking-fault proba- bilities in these directions have the same values However microstrains in the [010] direction are roughly twice as large as in the [100] direction which is responsible for the different broadening In the case of doped La2Cu04 compounds different microstrains might be caused by oxygen
347
Volume 98 Number 3 May-June 1993
Journal of Research of the National Institute of Standards and Technology
vacancies ordered along one direction in the a-b plane similar to effects found in YBa2Cu307-laquo However undoped La2Cu04 is not expected to have significant o^Qgen deficiency Other possibili- ties are lower ciystallographic symmetry andor La vacancies although they were not reported for this system but La deficiency was found in an La2Co04 compound [161]
We can conclude that lattice strains and incoher- ently diffracting domain sizes confirm high an- isotropy in these materials This simple approach however does not allow unambiguous identifica- tion of the strains origin Probably the strains originate from dislocations and from different sizes of host and dopant ions Domain sizes of all com- pounds are larger in the c-direction than in the a-6 plane This indicates existence of stacking faults and twins However because estimated errors are relatively large and only three materials were stud- ied the possible connection between stacking faults and 7c needs further study
62 Bi-Cu-O Superconductors
Among the high-Tc superconductors the Bi- Cu-O compounds appear intriguing especially because their incommensurate structure modula- tion remains incompletely understood [162 163] The crystal structure consists of perovskite-like SrO-(Cu02Ca)mi-Cu02-SrO layers separated by NaCl-like BiO double layers (see Fig 23 [164]) The number m of Cu02 layers alters the supercon- ducting transition temperature Tc (for m = 12 and 3 rclaquo10 90 and 110 K respectively) This two- dimensional layered structure makes these materi- als highly anisotropic and favours the creation of defects
Bulk sintered specimens showed relatively weak peak broadening Moreover the diffraction pat- terns contained many overlapping peaks because the compound crystallizes in an orthorhombic low- symmetry space group A2aa [165] and incommen- surate modulation gives superlattice reflections All patterns revealed a strong [001] texture (Fig 24) making reflections other than (001) difficult to ana- lyze The lattice parameters vary depending on the exact compound stoichiometry and processing his- tory but characteristically they have almost identi- cal a and b parameters and large c parameter fl =54095 A 6=54202 A c =309297 A for Bi2Sr2CaCu208 (Bi-2212 [166] and A =5392 A b =5395 A c =36985 A for (BiPb)2Sr2Ca2Cu30io (BiPb-2223) [165] Thus we treated (hOO) and (0^0) reflections as single peaks Table 10 gives the
results for three specimens Bi-2212 (BiPb)2 (SrMg)2(BaCa)2Cu30io (BiPbMgBa-2223) which were one-phase specimens and BiPb-2223 con- taining approximately equal amounts of 2212 and 2223 phases The in-plane lattice parameters of 2212 and 2223 phases differ little hence only the [00] directions of the mixed-phase specimen were evaluated
b^ (c)
Fig 23 Average crystal structure of Bi2Sr2Cam-iCum04+2m for (a) m = 1 (b) w =2 (c) m =3 [164]
35
-35
42 44 46 48 50 52 54 56 58 60 62 26 (deg)
^ ^^^MK^Aa^Ndllaquop
Fig 24 Part of BiPbMgBa-2223 refined pattern There are 48 fundamental reflections in this region
Interpretation of the results in the case of these complicated compounds must be considered care- fully Microstrains are probably caused by disloca- tion arrays However substitution of different-sized ions and vacancies would also contribute to the strains as would other kinds of disorder especially
348
Volume 98 Number 3 May-June 1993
Journal of Research of the National Institute of Standards and Technology
Table 10 Results of line-btoadening analysis for Bi-Cu-O supreconductors
Specimen Phase hkl (A)
eD)sa)y^
Bi-2212 2212 008 0012
0163(8) 022(3)
001(6) 005(6)
420(80) 00021(6)
020+200 0104(4) ltio-^ 580(30) 00007(1) 040+400 018(2) 00004(6300)
BiPbMgBa-2223 7773 0010 0020
0097(1) 021(2)
00002(1700) 0007(150)
770(60) 00012(1)
020 + 200 012(27) 013(10) 380(430) 00009(71) 040 + 400 015(95) 021(33)
BiPb-73 2212 008 0012
023(2) 025(5)
0002(350) 0001(1000)
220(30) 00013(26)
2223 0010 0020
022(8) 023(99)
0092(67) 018(47)
230(190) 00012(197)
Stacking faults and twins Table 10 shows larger strains in the [001] direction that in the basal plane This can be explained by stacking disorder along the c-axis which was frequently observed in electron-diffraction patterns as streaking [167 168] Easy incorporation of stacking faults is possi- ble because of the two-dimensional weak-bonded layers (BiO double layers are spaced about 3 A apart) The difference in microstrain between in- plane and the c-direction is much smaller for the BiPbMgBa-2223 phase probably because Pb low- ers the faulting by stabilizing the higher-Tc 2223 phase [167] For the BiPb-2223 specimen with two phases there are two possibilities Either the speci- men consists mainly of a mk of two kinds of one- phase grains or both phases occur within the same grains The second possibility was confirmed exper- imentally [169 170] and our results concur be- cause microstrain in the 2212 phase is much smaller than in the one-phase Bi-2212 specimen Processing conditions and cation content probably favour development of the macroscopic inter- growth of both phases within the grains that is microscopic defects grow to sufficiently large re- gions to give a diffraction pattern of another phase with the different number of Cu02 layers As a re- sult strain is relieved and both strains and domain sizes being quite different in one-phase specimens tend to equalize
For the Bi-Cu-O specimens the mean surface- weighted domain sizes are generally smaller than for (La-M)2Cu04 compounds Therefore the com- putation of the stacking- and twin-fault probabili- ties by using Eq (75) may be wrong It would be very instructive to compare the different broaden-
ing of satellite and fundamental reflections which indicates a more pronounced stacking disorder in the modulated structure [171]
In summary we found that for both Bi-2212 and BiPbMgBa-2223 superconductors the c-axis strain exceeds the in-plane strain The BiPb-2223 specimen containing both 2212 and 2223 phases within the single grains shows smaller incoherently diffracting domains and lower c-axis strain than the one-phase specimens This fact may direct us to- ward the mechanism of the second-phase forma- tion in these materials
63 Remarks
It was shown that this particular method of the line-broadening analysis can give information about the size of incoherently diffracting domains and lattice strains in (La-M)2Cu04 and Bi-Clu-O superconductors Moreover results show high an- isotropy of both size and strain parameters as one may expect because of the layered structure of all superconducting cuprates Generally structural line broadening is not large that is a result of rela- tively large domain sizes (200-2000 A) and small strains (002-02) It is interesting to compare these values with the published results for YBa2Cu307-laquo (isotropic strains of 023 [77] and 005-03 [82]) Although the different materi- als were studied they seem too large especially be- cause they are the average of strains in different directions
The main drawback of the line-broadening the- ory is the uncertainty about the origins of the line broadening that is it is difficult to distinguish the main effects responsible for the broadening For
349
Volume 98 Number 3 May-June 1993
Journal of Research of the National Institute of Standards and Technology
the novel superconductors particularly the numer- ous defects (substitutions vacancies stacking faults dislocations and similar) can occur simulta- neously which makes it very difficult to determine their individual contributions Furthermore the crystal structures of most novel superconductors are relatively complicated The average structure has mostly a slightly distorted tetragonal symmetry very similar a and b lattice parameters and a large c parameter but c=36 for YBa2Cu307-laquo for in- stance This results in a large number of overlap- ping peaks and consequently in large errors of all results This showed especially in the case of Bi-Cu-O superconductors (see Table 10) Follow- ing the discussion of reliability of profile fitting in Sec 54 it would be desirable to include more than two reflections in the analysis of broadening but higher-order peaks are usually too weak and over- lapped One way to partially solve this problem would be a whole pattern fitting [172 173] and Rietveld structure refinement [23] in terms of size and strain parameters This requires an accurate preset function to model specimen broadening and precise definition of angular dependence of size and strain parameters The Rietveld programs that model the line broadening in terms of size and strain parameters are based either on the simpli- fied integral-breadth methods [78 95] or on the single-line method [174]
7 Conclusions
A method for analyzing the pure-specimen (structural) broadening of x-ray diffraction line profiles is proposed By modeling the specimen size and strain broadenings with the simple Voigt func- tion it is possible to obtain domain sizes and strains that agree with experiment and show a logi- cal interrelationship Furthermore some common consequences and problems in the Fourier-method analysis follow easily The specimen function is convoluted with the instrumental function to match the observed x-ray diffraction-line profile This avoids the Stokes deconvolution method thus al- lowing analysis of patterns with highly overlapping peaks and weak structural broadening Therefore the method was applied to some novel high-Tc superconductors We reached the following conclu- sions
(i) Surface-weighted domain size depends only on the Cauchy integral breadth of the size-broad- ened profile
(ii) The hook effect occurs when the Cauchy-content of the size-broadened profile is un-
derestimated that is for ^sc(n2)^3sG Usually this happens when the background is estimated too high so the long tails of the Cauchy function are prematurely cut off
(iii) It also follows from conclusion (ii) that the volume-weighted domain size can not be more than twice the surface-weighted domain size (limiting value D)v=2D)i is obtained for the pure-Cauchy size-broadened profile) Minimum value for D)J (D)j should not be less than -131
(iv) If the distortion coefficient is approxi- mated with a harmonic term this leads exactly to the Warren-Averbach method of separation of size and strain broadenings
(v) In that case mean-square strains decrease linearly with the distance L
(vi) It is possible to evaluate local strain ((e^(0))^) only in the case of pure-Gauss strain broadening Then root-mean-square strain is inde- pendent of the distance L and related to the upper limit of strain obtained from the integral breadth of the strain-broadened profile
(vii) If strain broadening is not described exclu- sively with the Gauss function the multiple-line Voigt integral breadth and Warren-Averbach analyses can not give the same results for volume- weighted domain size although D)v is defined identically in both approaches because the appar- ent strain -q = pdeg(29)cot9 is not angular- independent
(viii) Smooth size coefficients give column- length distribution functions without oscillations and make possible a computation of volume- weighted average domain sizes up to ~5000 A
(ix) Comparison with the simplified integral- breadth methods in most cases has shown not large but systematic discrepancy of results indicat- ing that size and strain broadening can not be accu- rately modeled by a single Cauchy or Gauss function Moreover the application of the single- line method is much less reliable and it should not be used where multiple reflections are available
(x) The knowledge of all phases present in the sample and their crystallographic structure is re- quired to successfully fit a cluster of overlapping peaks Although it is very difficult to accurately de- termine the Cauchy-Gauss ratio of an overlapped peak final results of domain size and strain are much less affected Therefore connecting the crys- tallite size exclusively with the Cauchy content and strain with the Gauss content of a specimen profile might be doubtful
(xi) Evaluated errors of domain sizes and strains increase substantially with the degree of
350
Volume 98 Number 3 May-June 1993
Journal of Research of the National Institute of Standards and Technology
peak overlapping Hence for complicated patterns very accurate measurements are necessary and one needs to analyze as many reflections in the same crystallographic direction as possible
(xii) Line-broadening analysis of (La-M)2Cu04 and Bi-Cu-O compounds confirms high anisotropy in these materials
(xiii) Strains in (La-M)2Cu04 probably origi- nate from dislocations and from different sizes of host and dopant ions
(xiv) Stacking-fault probability in (La-M)2Cu04 (M = Ba Ca Sr) increases with increasing Tc whereas the average strain decreases
(xv) In La2Cu04 different broadening of (lOO) and (OfcO) reflections is not caused by stacking faults
(xvi) All Bi-Cu-0 superconductors show larger strain in the c-direction than in the a-b plane which can be explained by stacking disorder along the [001] direction
(xvii) In the specimen with approximately equal amounts of Tl-2212 and TlPb-2223 phases it is likely that a secondary phase develops by the growth of the microscopic faulted regions of the primary phase
Acknowledgments
I am thankful to Dr Harry McHenry for his support and especially to Dr Hassel Ledbetter for his wise guidance and most useful help during my stay at NIST I am also indebted to my home insti- tution the Faculty of Metallurgy of the University of Zagreb for allowing me the leave of absence at NIST
8 References
[1] W Friedrich P Knipping and M v Laue Ann Physik 41 971 (1912)
[2] H M Rietveld Acta Cryst 22 151 (1967) [3] H M Rietveld J Appl Cryst 2 65 (1969) [4] S A Howard and K D Preston in Modern Powder Dif-
fraction Vol 20 The Mineralogical Society of America Washington DC (1989) p 217
[5] D Taupin J Appl Cryst 6 266 (1973) [6] T C Huang and W Parrish Appl Phys Lett 27 123
(1975) [7] M K Wu J R Ashburn C J Torng P H Hor R L
Meng L Gao Z J Hwang Y Q Wang and C W Chu Phys Rev Lett 58 908 (1987)
[8] D Shi MRS Bull 16 37 (1991) [9] D Larbalestier Phys Today 44 74 (1991)
[10] J C Phillips Phys Rev B 4512647 (1992) [11] B Raveau Phys Today 45 53 (1992) [12] A J Millis and K M Rabe Phys Rev B 38 8908 (1988)
[13] F Guinea Europhys Lett 7 549 (1988) [14] C P Dhard and P Singh in Proc Int Symp High-Temp
Supercond Jaipur India Oxford amp IBH Publishing New Delhi (1988) p 271
[15] J D Jorgensen Phys Today 44 34 (1991) [16] J G Bednorz and K A Muller Z Phys B 64 189
(1986) [17] K Kishio K Kitazawa S Kaube I Yasuda N Sugii H
Takagi S Uchida K Fueki and S Tanaka Chem Lett 429 (1987)
[18] J D Jorgensen B Dabrowski S Pei D G Hinks L Soderholm B Morosin J E Venturini and D S Ginley Phys Rev B 38 11337 (1988)
[19] J R Clem Phys Rev B 43 7837 (1991) [20] M Paranthaman M Foldejiki D Balzar H Ledbetter
A J Nelson and A M Hermann submitted to Phys Rev B
[21] A R Stokes Proc Phys Soc Lond 61 382 (1948) [22] B E Warren and B L Averbach J Appl Phys 23 497
(1952) [23] R Delhez Th H de Keijser and E J Mittemeijer in
Accuracy in Powder Diffraction S Block and C R Hub- bard eds Natl Bur Stand (US) Special Publication 567 (1980) p 213
[24] H P Klug and L E Alexander X-ray Diffraction Proce- dures 2nd Edition John Wiley New York (1974) p 661
[25] J I Langford J Appl Ciyst 11 10 (1978) [26] J I Langford in Accuracy in Powder Diffraction S
Block and C R Hubbard eds Natl Bur Stand (US) Special Pubication 567 (1950) p 255
[27] R Delhez Th H de Keijser and E J Mittemeijer Fre- senius Z Anal Chem 312 1 (1982)
[28] A J C Wilson Proc Phys Soc Lond 80 286 (1962) [29] A J C Wilson Proc Phys Soc Lond 81 41 (1963) [30] L P Smith Phys Rev 46 343 (1934) [31] H C Burger and P H van Cittert Z Phys 79 722
(1932) [32] S Ergun J Appl Ciyst 1 19 (1968) [33] R Croche and L Gatineau J Appl Ciyst 10479 (1977) [34] L H Schwarz and J B Cohen Diffraction from Materi-
als Academic Press New York (1977) p 391 [35] R Delhez Th H de Keijser E J Mittemeijer and J I
Langford J Appl Cryst 19 459 (1986) [36] R Delhez Th H de Keijser E J Mittemeijer and J I
Langford Aust J Phys 41 213 (1988) [37] R A Young and D B Wiles J Appl Cryst 15 430
(1982) [38] W Voigt Stizungsber K Bayer Akad Wiss 42 603
(1912) [39] E E Whiting J Quant Spectrosc Radiat Transfer 8
1379 (1968) [40] G K Wertheim M A Butler K W West and D N E
Buchanan Rev Sci Instrum 111369 (1974) [41] M M Hall Jr V G Veeraraghavan H Rubin and P G
Winchell J Appl Cryst 10 66 (1977) [42] A Brown and J W Edmonds Adv X-Ray Anal 23 361
(1980) [43] P Suortti M Ahtee L Unonius J Appl Cryst 12 365
(1979) [44] T Sundius J Raman Spectrosc 1 471 (1973) [45] B H Armstrong J Quant Spectrosc Radiat Transfer 7
61 (1967) [46] J F Kielkopf J Opt Soc Am 63 987 (1973) [47] B P Asthana and W Kiefer Appl Spectr 36 250
(1982)
351
Volume 98 Number 3 May-June 1993
Journal of Research of the National Institute of Standards and Technology
[48] J P M de Vreede S C Mehrotra A Tal and H A Dijkerraan Appl Spectr 36 227 (1982)
[49] F R L Schoening Ada Ciyst 18 975 (1965) [50] P Scherrer Gott Nachr 2 98 (1918) [51] A R Stokes and A J C Wilson Proc Cambridge
Philos Soc 38 313 (1942) [52] A J C Wilson X-Ray Optics 2nd edition Methuen
London (1962) [53] S Leie and T R Anantharaman Proc Indian Acad
Sci Sect A H 261 (1966) [54] D Louer D Weigel and J I Langford J Appl Ciyst
5 353 (1972) [55] A J C Wilson J Appl Ciyst 2 181 (1969) [56] J I Langford and A J C Wilson J Appl Ciyst 11102
(1978) [57] A R Stokes and A J C Wilson Proc Phys Soc Lond
56174 (1944) [58] B E Warren and B L Averbach J Appl Phys 21 595
(1950) [59] B E Warren X-Ray Diffraction Addison-Wesley
Reading Massachusetts (1969) p 264 [60] B E Warren in Progress in Metal Physics Vol 8 Perg-
amon Press London (1959) p 146 [61] F Bertaut C R Acad Sci Paris 228 187 (1949) [62] N C Haider and C N J Wagner Acta Cryst 20 312
(1966) [63] D Balzar and H Ledbetter in Proceedings of the Accu-
racy in Powder Diffraction II Natl Inst Stand Technol (1992) p 37
[64] D Balzar and H Ledbeter J Appl Cryst 26 (1993) in press
[65] J N Eastabrook and A J C Wilson Proc Phys Soc Lond B 65 67 (1952)
[66] R S Smith IBM J Res Develop 4 205 (1960) [67] B Y Pines and A F Sirenko Soviet Physics Ciyst 715
(1962) [68] G B Mitra and N K Misra Acta Ciyst 22 454 (1967) [69] A Gangulee J Appl Ciyst 7 434 (1974) [70] J Mignot D Rondot Acta Met 231321 (1975) [71] J Mignot and D Rondot Acta Ciyst A 33 327 (1977) [72] R K Nandi H K Kuo W Schlosberg G Wissler J B
Cohen and B Crist Jr J Appl Ciyst 17 22 (1984) [73] M Zocchi Acta Ciyst A 36164 (1980) [74] P Ramarao and T R Anantharaman Trans Ind Ins
Metals 18 181 (1965) [75] R K Nandi and S P Sen Gupta J App Cryst 11 6
(1978) [76] Th H de Keijser J I Langford E J Mittemeijer and
B P Vogels J Appl Ciyst IS 308 (1982) [77] A Williams G H Kwei R B Von Dreele A C Lar-
son L D Raistrick and D L Bish Phys Rev B 37 7960 (1988)
[78] A C Larson and R B Von Dreele Los Alamos Na- tional Laboratory Report No LA-UR-86-748 (1988)
[79] J D Jorgensen D H Johnson M H Mueller J G Worlton and R B Von Dreele in Proceedings of the Conference on Diffraction Profile Analysis Cracow Poland (1978) p 20
[80] R B Von Dreele J D Jorgensen and C G Windsor J Appl Ciyst 15 581 (1982)
[81] P Thompson D E Cox and J B Hastings J Appl Ciyst 20 79 (1987)
[82] J P Singh R A Guttschow D S Kupperman J T Dusek and R B Poeppel in High Temperature Super-
conducting Compounds III S Whang A Gupta and E Ceilings eds TMS AIME Warrendale (1991) p 281
[83] M O Eatough D S Glnley and B Morosin Adv X- Ray Anal 33 145 (1990)
[84] E J Peterson P J Kung R E Muenchausen and D M Smith in Proceedings of the 41st Annual Denver Conference on Applications of X-Ray Analysis Colo- rado Springs Colorado (1992) p 74
[85] M Rand J I Langford and J S Abell submitted to J Cryogenics (1992)
[86] D Balzar J Appl Ciyst 25 559 (1992) [87] D Balzar H Ledbetter and A Roshko Physica C 185-
189 871 (1991) [88] D Balzar and H Ledbetter J Mater Sci Lett 111419
(1992) [89] D Balzar H Ledbetter and A Roshko Pow Diffr 8
(1993) in press [90] S Johnson M Gusraan D Rowcliffe T Geballe and J
Sun Adv Ceram Mater 2 337 (1987) [91] H Ledbetter S A Kim R B Goldfarb and K Togano
Phys Rev B 39 9689 (1989) [92] H Friedman Electronics 132 (1945) [93] W Parrish (ed) in Advances in X-Ray Diffractometry
and X-Ray Spectrography Centrex Publishing Company Eindhoven The Netheriands (1962)
[94] W Soller Phys Rev 24158 (1924) [95] S A Howard R L Snyder J Appl Ciyst 22 238
(1989) [96] G H Stout and L H Jensen X-Ray Structure Determi-
nation 2nd edition Wiley New York (1989) p 373 [97] D E Appleman and T Evans Jr Final Report 92-14
US Geological Survey Washington DC (1973) Avail- able as NTIS Document No PB-216188
[98] M U Cohen Rev Sci Instrum 6 68 (1935) [99] M U Cohen Rev Sci Instrum 7 155 (1936) [100] M H Mueller L Heaton and K T Miller Acta Ciyst
13 828 (1960) [101] R A Young P E Mackie and R B Von Dreele J
Appl Ciyst 10 262 (1977) [102] D B Wiles and R A Young J Appl Cryst 14 149
(1981) [103] J K Yau and S A Howard J Appl Ciyst 22 244
(1989) [104] S A Howard J K Yau and H U Anderson J Appl
Phys 65 1492 (1989) [105] S Enzo G Fagherazzi A Benedetti and S Poilizzi J
Appl Ciyst 21 536 (1988) [106] A Benedetti G Fagherazzi S Enzo and M
Battagliarin J Appl Cryst 21 543 (1988) [107] Th H de Keijser E J Mittemeijer and H C F Rozen-
daal J Appl Ciyst 16 309 (1983) [108] Y Zhang J M Stewart C R Hubbard and B Mo-
rosin Adv X-Ray Anal 33 373 (1990) [109] Y Wang S Lee and Y Ue J Appl Ciyst IS 35
(1982) [110] V N Selivanov and E F Smislov Zavod Lab 57 28
(1991) [Ill] A Guinier X-Ray Diffraction W H Freeman San
Francisco (1963) p 139 [112] M Wilkens J Appl Cryst 12119 (1979) [113] D Du and Y Wang Pow Diffr 2180 (1987) [114] A P Prudnikov Yu A Brychkov and O L Marichev
Integrals and Series Vol 1 Gordon and Breach Am- sterdam The Netheriands (1986) p 344
352
Volume 98 Number 3 May-June 1993
Journal of Research of the National Institute of Standards and Technology
[115] R L Rothman and J B Cohen J Appl Phys 42 971 (1971)
[116] T Adier and C R Houska J Appl Phys 50 3282 (1979)
[117] C R Houska and T M Smith J Appl Phys 52 748 (1981)
[118] S Rao and C R Houska Acta Ciyst A 4214 (1986) [119] J I Langford R Delhez Th H de Keijser and E J
Mittemeijer Ausi J Phys 41173 (1988) [120] J I Langfoid J Appl Cryst IS 315 (1982) [121] M J Turunen Th H de Keijser R Delhez and N M
van der Pers J Appl Ciyst 16176 (1983) [122] A J C Wilson Acta Ciyst 23 888 (1967) [123] A J C Wilson Acta Ciyst A 24 478 (1968) [124] A J C Wilson Acta Ciyst A 25 584 (1969) [125] G Gagliotti A Paoletti and F P Ricci Nucl Instrum
3 223 (1958) [126] J I Langford R J Cernik and D Louer J Appl
Ciyst 24 913 (1991) [127] J I Langford in Accuracy in Powder Diffraction II
preprint [128] A J C Wilson Mathematical Theory of X-Ray Powder
Diffractometiy Centrex Eindhoven The Netherlands (1963)
[129] J L Langford Prog Ciyst Growth and Charact 14185 (1987)
[130] T G Fawcett C E Crowder S J Brownell Y Zhang C R Hubbard W Schreiner G P Hamill T C Huang E Sabino J I Langford R Hamilton and D Louer Pow Diffr 3 209 (1988)
[131] W L Smith J Appl Ciyst 9187 (1976) [132] J L Langford and D Louer J Appl Ciyst 15 20
(1982) [133] Fl Popescu and L Benes Acta Ciyst A 33 323 (1977) [134] P PSuse^cu R MSnaila M Popescu and E Jijovici j
Appl Cryst 7 281 (1974) [135] P F Bley Y Calvayrac and M Fayard J Appl Ciyst
7 493 (1974) [136] B Moraweck Ph de Montgolfier and A J Renouprez
J Appl Ciyst 10191 (1977) [137] A Le Bail and D Louer J Appl Cryst 11 50 (1978) [138] D R Buchanan R L McCuUough and R L Miller
Acta Ciyst 20 922 (1966) [139] P Suortti and L D Jennings Acta Cryst A 33 1012
(1977) [140] J B Cohen and C N J Wagner J Appl Phys 33 2073
(1962) [141] A Bianconi J Budnick A M Flank A Fontaine P
Lagarde A Marcelli H Tolentino B Chamberland C Michel B Raveau and G Demazeau Phys Lett A127 285 (1988)
[142] K Fueki K Kitazawa K Kishio T Hasegawa S Uchida H Takagi and S Tanaka in Chemistiy of High- Temperature Superconductors D L Nelson M S Whittingham and T F George eds American Chemi- cal Society (1987) p 38
[143] T Fujita Y Aoki Y Maeno J Sakurai H Fukuba and H Fujii J Appl Phys 26 U68 (1987)
[144] R M Hazen in Physical Properties of High-rc Super- conductors Vol 2 D M Ginsberg ed World Scien- tific Singapore (1990) p 121
[145] J B Torrance A Bezinge A I Nazzal T C Huang S P Parkin D T Keane S J LaPlaca P M Horn and G A Held Phys Rev B 40 8872 (1989)
[146] J D Axe A H Moudden D Hohlwein D E Cox K
M Mohanty A R Moodenbaugh and Y Xu Phys Rev Lett 62 2751 (1989)
[147] T Suzuki and T Fujita Physica C 159 111 (1989) [148] T Fujita and Y Maeno in Superconducting Materials
JJAP Series 1 (1988) p 34 [149] A Roshko and Y-M Chiang J Appl Phys 66 3710
(1989) [150] D E Cox S C Moss R L Meng P H Hor and C W
Chu J Mater Res 31327 (1988) [151] B Crist and J B Cohen J Polym Sci 17 1001 (1979) [152] H Ledbetter S Kim and A Roshko Z Phys B 89275
(1992) [153] R D Shannon and C T Prewitt Acta Ciyst B 25 925
(1969) [154] M Lang H Spille F Steglich Y Hidaka T Murakami
and Y Endoh Physica C 162-1641037 (1989) [155] Y Hidaka and T Murakami Phase trans 15 241
(1989) [156] P L Gai and E M McCarron Science 247 553 (1990) [157] T Kamiyama I Izumi H Asano H Takagi S Uchida
Y Tokura E Takayama-Muromachi M Matsuda K Yamada Y Endoh and Y Hidaka Physica C 172 120 (1990)
[158] A Kapitulnik Physica C 153-155 520 (1988) [159] L A Muradyan V N Molchanov R A Tamazyan and
V I Simonov Physica C 162-164 536 (1989) [160] P Day M Rosseinsky K Prassides W I F David O
Moze and A Soper J Phys C 20 L429 (1987) [161] J T Lewandowski R A Beyerlein J M Longo and R
A McCauley J Amer Ceram Soc 69 699 (1986) [162] R Ramesh G van Tendeloo G Thomas S M Green
Y Mei C Jiang and H L Luo Appl Phys Lett 53 2220 (1988)
[163] J Schneck L Pierre J C Tolddano and C Daguet Phys Rev B 39 9624 (1989)
[164] O Eibl Physica C 168 215 (1990) [165] W Carrilo-Cabrera and W Gopel Physica C 161 373
(1989) [166] P Bordet J J Capponi C Chaillout J Chenavas A
W Hewat E A Hewat J L Hodeau M Marezio J L Tholence and D Tranqui Physica C 156189 (1988)
[167] R Ramesh K Remschnig J M Tarascon and S M Green J Mater Res 6 278 (1991)
[168] Z Hiroi Y Ikeda M Takano and Y Bando J Mater Res 6 435 (1991)
[169] Y Inoue M Hasegawa Y Shichi I Munakata M Ya- manaka S Hiyama and O Nittono J Mater Res 5 737 (1990)
[170] R Ramesh B G Bagley J M Tarascon S M Green M L Rudee and H L Luo J Appl Phys 67 379 (1990)
[171] X B Kan J Kulik P C Chow S C Moss Y F Yan J H Wang and Z X Zhao J Mater Res 5 731 (1990)
[172] G S Pawley J Appl Ciyst 13 630 (1980) [173] H Toraya J Appl Ciyst 19 440 (1986) [174] L Lutterotti and P Scardi J Appl Ciyst 23 246
(1990)
About the author Davor Balzar is with Faculty of Metallurgy of the University of Zagreb Sisak Croatia and was a Guest Researcher at fflST The National Institute of Standards and Technology is an agency of the Technology Administration US Department of Commerce
353
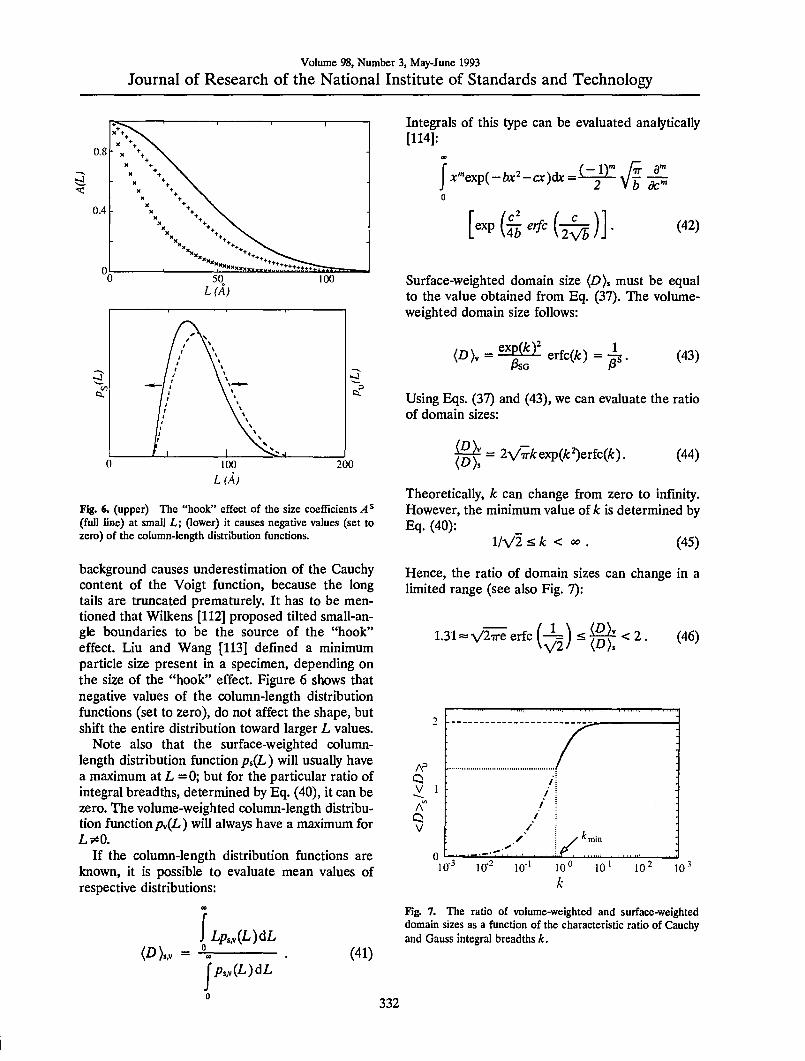
Volume 98 Number 3 May-June 1993
Journal of Research of the National Institute of Standards and Technology
08-
04-
mdash^ 1 J 1 x
^~ ( ^ ^ i I
1 t 1 11
jl u
V 1 iJ
J
c^
100 200
Fig 6 (upper) The hook effect of the size coefficients A ^ (full line) at small L (lower) it causes negative values (set to zero) of the column-length distribution functions
background causes underestimation of the Cauchy content of the Voigt function because the long tails are truncated prematurely It has to be men- tioned that Wilkens [112] proposed tilted small-an- gle boundaries to be the source of the hook effect Liu and Wang [113] defined a minimum particle size present in a specimen depending on the size of the hook effect Figure 6 shows that negative values of the column-length distribution functions (set to zero) do not affect the shape but shift the entire distribution toward larger L values
Note also that the surface-weighted column- length distribution function ps(L) will usually have a maximum at L = 0 but for the particular ratio of integral breadths determined by Eq (40) it can be zero The volume-weighted column-length distribu- tion function7v(L) will always have a maximum for LsO
If the column-length distribution functions are known it is possible to evaluate mean values of respective distributions
lt^kv =
00
J ^ _0
(L)dL
raquosv(L)dL (41)
Integrals of this type can be evaluated analytically [114]
OQ
J cexp( - to^ - a )dc = i^y^ ^ of
hd^^^^fe)]- (^2)
Surface-weighted domain size (D)s must be equal to the value obtained from Eq (37) The volume- weighted domain size follows
ltD)v = ^^erfc(A) = js (43)
Using Eqs (37) and (43) we can evaluate the ratio of domain sizes
i^ = 7r lt^gts
= 2vn-^exp(A2)erfc(^) (44)
Theoretically k can change from zero to infinity However the minimum value of k is determined by Eq (40)
1V2 ltk lt laquogt (45)
Hence the ratio of domain sizes can change in a limited range (see also Fig 7)
131laquo V2^ erfc (^ ) s ^ lt 2 (46)
10^ 10^ 10- 10deg 10 10^ 10-
Fig 7 The ratio of volume-weighted and surface-weighted domain sizes as a function of the characteristic ratio of Cauchy and Gauss integral breadths k
332
Volume 98 Number 3 May-June 1993
Journal of Research of the National Institute of Standards and Technology
It may be noted that most experiments give the ratio D)vD)s in this range (see for instance re- view by Klug and Alexander [24]) When k goes to infinity the size broadening is given only by the Cauchy component and (JD)V=2(D)S This is a case of pure Cauchy size broadening described by Haider and Wagner [62] and de Keijser Mittemei- jer and Rozendaal [107] It is possible to imagine a more complicated column-length distribution func- tion [27] than Eq (39) which would allow even larger differences between surface-weighted and volume-weighted domain sizes However we are not aware of any study reporting a difference larger than 100
43 Distortion Coefficient
In Sec 212 it was shown that the distortion co- efficient can be approximated by the exponential
Adeg(L) = exp(-ITTVLeL))) (47)
Comparing with Eq (36) we can write
Therefore mean-square strains (MSS) decrease linearly with averaging distance L This behavior is usually observed in the Warren-Averbach analysis Rothman and Cohen [115] showed that such be- havior would be expected of strains around disloca- tions Adler and Houska [116] Houska and Smith [117] and Rao and Houska [118] demonstrated for a number of materials that MSS can be repre- sented by a sum of two terms given by Cauchy and Gauss strain-broadened profiles
However for i3Dc=0 the MSS are independent ofL
(^2)12 ^ ^Dc(2g) cotg = ^ 2V2 V2TT
(49)
where the upper limit of strain e is defined as 7j4 (see Sec 212) This is a limiting case of pure- Gauss strain broadening described by de Keijser Mittemeijer and Rozendaal [107]
44 Discussion
To calculate domain sizes and strain it is neces- sary to define size and distortion integral-breadths angular order-dependence From Eq (43) It fol- lows that the domain size D )v is always indepen- dent of the order of reflection
)3sc = const JSSG = const
However from Eq (48) we find
^^ = const ^^ = const
(50)
(51)
An important consequence is that apparent strain TJ will be independent of angle of reflection only in the case of pure-Gauss strain broadening because 3DC and JSDG depend differently on the dif- fraction angle If we compare Eq (51) with the multiple-line Voigt-function analysis [26] given by Eqs (27) and (28) it is evident that they disagree Therefore recombination of constituent integral breadths 3DC and 3DO to Voigt strain-broadened in- tegral breadth Pdeg and the subsequent application of Eq (49) to calculate strain [26 119] will concur with the Fourier methods if strain broadening is entirely Gaussian and for the asymptotic value of MSS ((e^( 00))) However neither volume-weighted domain sizes D)y will agree although they are de- fined identically in both approaches because size- broadened and strain-broadened integral breadths are dependent variables
If at least two orders of reflection ( and +1) of the same plane (hkl) are available using Eqs (50) and (51) we can solve Eqs (33) and (34)
(52)
^^deg sl + l)-sil) ^^^^
^^=sHl + l)-sl) [fc( + l)-3c()3 (54)
^^=sl + l)-sl) [^(^ + ^)-^(0]- (55)
If we substitute these expressions into Eqs (35) and (36) we see that this approach leads exactly to the Warren-Averbach Eq (20) for two orders of reflections This is expected because the distortion coefficient is approximated with the exponential (47)] Delhez de Keijser and Mittemeijer [23] ar- gued that instead of Eq (20) the following rela- tion would be more accurate
A(L)=AXL) (1 -27r^(e^(L))LVd (56)
333
Volume 98 Number 3 May-June 1993
Journal of Research of the National Institute of Standards and Technology
These two approximations differ with fourth-order terms in the power-series expansion In terms of this approach Eq (48) has to be rewritten
2r ^^ l-exp(-2LI3DC-TTL^0DG) (57)
This means that even if the strain-broadened pro- file is given entirely by the Gauss function the MSS depend on distance L (see Fig 8) In this ap- proximation no simple relation for the distortion integral-breadths angular order-dependence exists For not so large L however Eq (51) holds and approximations from Eqs (20) and (56) do not dif- fer much (see Fig 8)
1500 Warren- Averbach approximation ^
Delhez de Kcijscr and ^^^ Minemeijer approximation ^y^
^ 1000 A
500
mdashI
1 1
Oc 300 600 IL k^) X 10^
90
o ^ 60 A
30
1
J Warren- Averbach approximation
Delhez de Keijser and Minemeijer approximation
0 0 150 300
1L (A-1 ) X 10^
Fig 8 Mean-square strains pound^(L)) for two approximations of the distortion coefficient (upper) Voigt strain broadening (lower) pure-Gauss strain broadening
Generally it was shown that in the size-broad- ened profile the Cauchy part must dominate No similar requirement for the strain-broadened pro- file exists However experience favors the assump- tion that it has to be more of Gauss-type The Warren-Averbach approach is exact if strain broad- ening is purely Gaussian so Eqs (20) and (48) are
better approximations as strain profile is closer to the Gauss function In any case both approaches given by Eqs (20) and (56) are good up to the third power in strain and the Warren-Averbach relation [Eq (20)] does not assume that MSS are independent of distance L [27] it also represents a harmonic approximation
If at least two orders of reflection from the same plane (hkl) are available we can use Eqs (52) (53) (54) and (55) to calculate size-related and strain-related integral breadths Subsequent appli- cation of Eqs (37) (43) and (48) gives directly domain sizes (D) and (D)v and mean-square strains (e^(L)) This approach is more straightfor- ward and much simpler than the original Warren- Averbach analysis Great care should be given to the possible systematic errors The easiest way to observe the hook effect is to plot column-length distribution functions as a function of averaging distance L If they show negative values for small L (see Fig 6) all derived parameters will be in error This is because (i) only the positive values of the column-length distribution functions are numeri- cally integrated or (ii) the intercept on the L-axis of the linear portion of the A^ vs L curve is taken (see Fig 4) always larger values of domain sizes will be obtained than by the application of Eqs (37) and (43) Therefore we conclude that the dis- crepancy between integral-breadth and Fourier methods is always present by the appearance of the hook effect in the A^ vs L curve An analogous discrepancy exists between integral-breadth and variance methods [119] In such cases correction methods for truncation can be applied [35 119 120] but the best procedure is to repeat the pat- tern fitting with the correct background
In the Fourier analysis it is usually observed that the mean-square strains diverge as the averaging distance L approaches zero This also follows from Eqs (48) and (57) However because the MSS de- pendence on distance L is not defined in Warren- Averbach analysis it was suggested [27 107 121] that local strain can be obtained by taking the sec- ond derivative of the distortion coefficient or by a Taylor-series expansion of local strain Therefore we obtain from Eq (36)
i^m-M^-^) (58)
It is evident that this relation is wrong It holds only for a special case of pure-Gauss strain-broad- ened profile when the MSS are equal for any L Otherwise if the Cauchy function contributes to
334
Volume 98 Number 3 May-June 1993
Journal of Research of the National Institute of Standards and Technology
strain broadening all derivatives of strain in L = 0 are infinite and local strain can not be defined If the main origin of strains is dislocations [115] strains are defined after some distance from the dislocation (cutoff radius) to be finite Averaging strains over a region smaller than the Burgers vector is probably not justified For instance Eq (48) gives even for a small averaging distance L = 1 A and considerable strain broadening (J3DG(20) = 3DC(20) = 1O) root-mean-square strain eL = 1A))^ laquo02 that is about the elastic limit
45 Random Errors of Derived Parameters
Errors in size and strain analysis of broadened peaks are relatively difficult to evaluate Following Langford [26] sources of the systematic errors in- clude choice of standard specimen background and type of analytical function used to describe the line profiles The first two errors should be mini- mized in the experimental procedure Errors caused by inadequate choice of specimen function would systematically affect all derived results but they can not be evaluated Random errors caused by counting statistics have been computed by Wilson [122 123 124] and applied to the Stokes deconvolution method by Delhez de Keijser and Mittemeijer [23] as well as by Langford [26] and de Keijser et al [76] using single-line Voigt-func- tion analysis Nevertheless the approximate error magnitude can be calculated from estimated stan- dard deviations (esd) of the parameters refined in the fitting procedure In the program SHADOW the weighted least-squares error is minimized
7wp mdash RES
Here
)=1
RES = 2 vfi [ (obs) - (cal)]
(59)
(60)
and weights are the reciprocal variances of the ob- servations
H = l(obs) (61)
Each line profile has four parameters varied inde- pendently position intensity and Cauchy and Gauss integral breadths of the Voigt profile In least-squares refinement esds are computed as
^^ bu RES (62) m mdashm
Here ba are diagonal elements of the inverse matrix of the equation coefficients m is the number of observations and m is the number of refined parameters The main source of errors is integral breadths Errors in peak position peak intensity and background are much smaller and can be ne- glected in this simple approach For two indepen- dent variables )3G and Pc covariance vanishes and from Eqs (37) and (38) for the two orders of re- flection and +1 it follows that
RD =
si+i)m)RHMi))+si)m+i)i^(3c(+D)
(63)
ReL)r) =
pHDRHPcG)) + m + miPcJl + D) 2[3c(+1) - i8c()3+TTL [m+1) - mw
-n-LmiDRHihd))+m+mWcH+i))i ^ 2[)3c(+1) - iSc()+TTLim+1) - mw
(65)
Here Rx) are relative standard deviations The error in D would be complicated to evaluate but because 131D)s^(Igt)vlt2(pound))s Eq (63) gives a good estimation for the error in (Z))v as well Alter- natively to see how errors depend on the Fourier coefficients errors can be estimated from the Warren-Averbach relationship [Eq (20)] (86) From Eq (32) it follows that
RA (L)) = ATr^Lpos)R^2d)) +
4Lph(s)RPci2e)) (66)
Errors in root-mean-square strains and domain sizes are
i^((e^(L ))bulllaquo) =
RHA(Ll))+RHA(Ll + l)) (67)
ALl + l)
335
Volume 98 Number 3 May-June 1993
Journal of Research of the National Institute of Standards and Technology
^^laquo^))=(T^)
s(l + 1)RHA (Ll)) +SV)RHA (Ll + D) lsl + l)-sl)f (68)
Here (D) is approximately defined with A^(L) = l-L(D)j Errors in Fourier coefficients increase with L while factors in Eqs (67) and (68) lower the errors for large L In general errors of domain sizes and strains are of the same order of magnitude as errors of integral breadths [86]
5 Application 51 Correction for Instrumental Broadening
Before specimen broadening is analyzed instru- mental broadening must be determined This is ac- complished by carefully measuring diffraction peaks of some well-annealed defect-free speci- men It is then assumed that its broadening may be attributed only to the instrument The usual proce- dure is to anneal the specimen However in some instances that is not possible because either the material undergoes an irreversible phase transition on annealing or the number of defects can not be successfully decreased by annealing Another pos- sibility is to measure the whole diffraction pattern of the material showing the minimal line broaden- ing and then to synthesize the instrumental profile at the needed diffraction angle This approach re- quires the modeling of the angle dependence of the instrumental (standard) parameters Cagliotti Pao- letti and Ricci [125] proposed the following func- tion to describe the variation of the full width at the half maximum of profile with the diffraction angle
F9miA^(2e) = Utan^9 + Vtand + W (69)
Although this function was derived for neutron dif- fraction it was confirmed to work well also in x-ray diffraction case [126 127] A more appropriate function for the x-ray angle-dispersive powder dif- fractometer based on theoretically predicted er- rors of some instrumental parameters [128] may be the following [129]
FWHNf (2 e) = W+Vsin^l 6 +
UtanH + UcotH (70)
This function may better model the increased axial divergency at low angles and correct for the speci- men transparency [129] However contrary to the requirement on the specimen function most im- portant for the instrumental function is to correctly describe the angular variation of parameters re- gardless of its theoretical foundation
When specimen broadening is modeled with a Voigt function the simplest way to correct for the instrumental broadening is by fitting the line pro- files with the Voigt function too Cauchy and Gauss integral breadths of the specimen-broad- ened profile are then easily computable by Eqs (7) and (8) However because the instrumental broad- ening is asymmetric [24] modeling with the sym- metric Voigt function can cause a fictitious error distribution resulting in errors of strain up to 35 [76] Another approach is to model the instrumen- tal-broadening angle dependence by fitting the profile shapes of a standard specimen with some asymmetrical function split-Pearson-VII [95] or pseudo-Voigt convoluted with the exponential function [105] The instrumental function can then be synthesized at any desired angle of diffraction and convoluted with the assumed specimen func- tion to match the observed profile by means of Eq (2)
In the program SHADOW instrumental para- meters are determined by fitting the split-Pearson VII function (see Fig 9) to line profiles of a standard specimen
iix)=m- 2 m
with
c =-
mc^f
mm) mv-rim-12)
(71)
(72)
Here m = 1 or m = ltraquo yields a Cauchy or Gauss function respectively Refined full widths at half maximum (FWHM) and shape factors m for both low-angle and high-angle sides of the profiles are fitted with second-order polynomials To fit the FWHM we used Eq (69) and for the shape fac- tors
m(2e) = U(20f + V(2e) + W (73)
The resulting coefficients U V W U V and W permit synthesis of the asymmetrical instrumental line profile at any desired angle
336
Volume 98 Number 3 May-June 1993
Journal of Research of the National Institute of Standards and Technology
2 0(deg)
le
Fig 9 A split-Pearson VII profile The two half profiles have same peak position and intensity Adapted from Howard and Preston [4]
The basic requirement on the standard specimen is however to show as small a line broadening as possible To minimize physical contributions to the Une broadening of the standard specimen a few moments were emphasized as follows Because dif- fraction-line width depends strongly on degree of annealing it is preferable to use some reference powder-diffraction standard Furthermore asym- metry in the peak profiles is introduced by axial divergence of the beam flat specimen surface and specimen transparency [24] Choosing a standard specimen with low absorption coefficient would cause transparency effects to dominate If the stud- ied specimen has a large absorption coefficient (compared to the standard) this might produce a fictitious size contribution and errors in micro- strains All of the specimens studied have absorp- tion coefficients exceeding 1000 cm^ so a NIST standard reference material 660 LaBe was chosen to model the instrumental broadening (p = 1098 cm) According to Fawcett et al [130] LaBe showed the narrowest lines of all studied com- pounds Furthermore LaB6_has a primitive cubic structure (space group Pm3m) resulting in rela- tively large number of peaks equally distributed over 26 This allows for better characterization and lower errors of FWHMs and shape factors of split- Pearson VII functions (Fig 10)
52 Applicability of the Method
To study the applicability of method described in Sec 4 we first studied simple cubic-structure mate- rials such as silver and tungsten Tungsten has very narrow line profiles allowing us to obtain the up- per limit of domain sizes that can be studied Silver is easily deformed which provides a possibility to apply the method to broad line profiles To test the
009
-a
OH
006
003
1 1 m low-angle side n m high-angle side
bullz w 2 o OH
X
tancopy
Fig 10 Refined FWHMs and shape factors (exponents) m for low-angle and high-angle sides of LaBe line profiles Second- order polynomials were fitted through points
case of relatively complicated patterns and weak line broadening the method was also applied to Lai85Sroi5Cu04 and La2Cu04 powders In this sec- tion only the mechanical aspects of the line broad- ening are discussed Discussion about the origins of broadening of superconductors can be found in Sec 6
521 Silver and Tungsten Powders Figure 11 shows observed and refined peaks of tungsten un- treated and silver ground powders In Table 2 are listed results of fitted pure-specimen Voigt profiles for silver and tungsten specimens Table 3 and Fig 12 give results of the line-broadening analysis Untreated tungsten powder shows relatively weak broadening Instrumental profile FWHMs at angle positions of (110) and (220) tungsten lines are 0059deg and 0081deg respectively close to values mea- sured for tungsten 0065deg and 0100deg Results in Table 3 reveal that small broadening is likely caused by domain sizes because microstrains have negligible value This pushes the limit for measur- able domain sizes probably up to 4500-5000 A However one must be aware that weak specimen broadening implies higher uncertainty of all derived parameters Moreover the choice of the instrumental standard becomes more crucial
Both silver and tungsten line profiles become more Cauchy-like after grinding which probably increases dislocation density in the crystallites This is consistent with the presumption that small crystallites and incoherently diffracting domains separated by dislocations within grains affect the tails of the diffraction-line profiles [60115] Figure 13 illustrates the dependence of MSS on the recip- rocal of the averaging distance L
337
Volume 98 Number 3 May-June 1993
Journal of Research of the National Institute of Standards and Technology
C8
z
7- ^95
29 (deg) 405
bullJf^r-
z S 08
Ez U o u OS
a
04 bull
o Es
4P
2000 z^fA
4000
B
z u f- z
425 435 445 29 (deg)
455
yr 600 SOO
L(A)
Fig 11 Observed points (pluses) refined pattern (full line) and difference pattern (below) (110) W untreated (upper) (200) Ag ground (lower)
Fig 12 Fourier coefficients for the first- (pluses) and second- order (crosses) reflection and size coefficients (circles) [111] Ag untreated (upper) [100] Ag ground (lower)
Table 2 Parameters of the pure-specimen Voigt function as obtained from profile-fitting procedure for tungsten and silver powders
Specimen hkl 2ft(deg) 3c(deg) 3G(deg) FWHM(deg) Rwp()
W untreated 110 220
4028 8705
00065(7) 00301(6)
0020(2) ltio-
0021 0019
90 44
W ground 110 220
4029 8705
0100(2) 0222(3)
0038(4) 0069(6)
0080 0166
90 42
Ag untreated 111 222 200 400
3806 8151 4425 9786
0056(1) 0105(4) 0118(2) 0274(21)
ltio- 00008(21)
ltio-^ ltio-5
0036 0067 0075 0175
105 97
105 122
Ag ground 111 222 200 400
3807 8151 4424 9783
0175(3) 0410(26) 0365(10) 1079(82)
0038(12) ltio-
0076(29) ltio-
0121 0261 0250 0687
99 145 99
145
338
Volume 98 Number 3 May-June 1993
Journal of Research of the National Institute of Standards and Technology
Table 3 Microstructural parameters for tungsten and silver powders
Specimen Direction (poundgt)raquo( A) (2))v(A) ltpound^(fl3))laquo (^laquoD)v2)gtw
W untreated [110] 3200(200) 3500(200) 000038 000008(2)
W ground [110] 620(20) 1030(30) 00023 000054(2)
Ag untreated [111] [100]
1000(20) 510(20)
2000(20) 1030(20)
00010 00022
000024(1) 000047(5)
Ag ground [111] [100]
380(20) 210(10)
650(20) 350(20)
00047 00100
000095(7) 000180(14)
100 -_ - [100) Ag ground ^ ^~ mdash C1111 Ag ground ^bull
y y
o y ^ 50 A y
y y
y
0
y - y ^--
c ) 50 100 150
lLfAjxlO^
Fig 13 Mean-square strains (E^) as a function of VL
Errors in integral breadths allow estimation of errors in strain and size parameters (Sec 45) but in some cases the refinement algorithm gives unre- liable errors of integral breadths When a particu- lar parameter is close to the limiting value (for instance 10^ degrees has been put as the mini- mum value for integral breadths) errors become large However in Eqs (63) (65) (66) (67) and (68) only the product of integral breadth and ac- companying error is significant which is roughly equal for Cauchy and Gauss parts Errors of do- main sizes and strains are of the same order of magnitude as errors of integral breadths
The possible source of systematic error is poten- tial inadequacy of Voigt function to accurately de- scribe specimen broadening This effect can not be evaluated analytically but it would affect all derived parameters especially the column-length distribution functions The logical relationship be- tween values of domain sizes (see Table 3) for dif- ferent degrees of broadening indicates that possible systematic errors can not be large
Equation (41) allows computation of volume- weighted and surface-weighted average domain sizes if respective column-length distribution func- tions can be obtained Figure 14 gives surface- weighted and volume-weighted average column- length distribution functions following Eqs (39) and (38) Width of the distribution function deter- mines the relative difference between (D) and (pound))v The broader the distribution the larger the differences because small crystallites contribute more to the surface-weighted average That is much more evident comparing the surface- weighted column-length distribution with the vol- ume-weighted If they have similar shape and maximum position as in Fig 15 differences are small Conversely if the surface-weighted distribu- tion function has a sharp maximum toward smaller sizes differences are larger (see Fig 14) The dif- ference between (poundgt)s and (D)v and the actual mean dimension of the crystallites in a particular direction also depends strongly on the average shape of the crystallites [52 131 132]
If experimental profiles are deconvoluted by the Stokes method even for considerable specimen broadening size coefficients A ^ usually oscillate at larger L values [59 106] preventing computation of the column-length distribution function Few techniques were used to deal with this problem successive convolution unfolding method [32 133] smoothing and iterative methods [134 135 136 137] Figures 14 and 15 show very smooth column- length distribution functions However they follow from size coefficients ^4^ that depend on the accu- racy of the approximation for the distortion coeffi- cient given by Eq (47) Equation (47) is exact if the strain distribution is Gaussian but in general holds only for small harmonic numbers n if strain broadening is not negligible
339
Volume 98 Number 3 May-June 1993
Journal of Research of the National Institute of Standards and Technology
500 1000 L(A)
Fig 14 Surface-weighted and volume-weighted column-length distribution functions normalized on unit area [111] Ag un- treated (upper) [100] Ag ground (lower)
Fig 15 Surface-weighted and volume-weighted column-length distribution functions for [010] La2Cu04 normalized on unit area
522 La2-xSrtCu04 Powders To test the applicability of the discussed method to more com- plicated patterns two compounds with lower crystallographic symmetry were studied Lai85Sroi5Cii04 has a tetragonal K2NiF4-type struc- ture space group lAlmmm La2Cu04 is orthorhom-
bic at room temperature Both compounds show slight line broadening and relatively highly overlap- ping peaks (see Fig 16) which makes it very diffi- cult if not impossible to perform a Stokes analysis
25
-25
26 (deg)
yNraquo-
Fig 16 Observed points (pluses) refined pattern (full line) convoluted profiles (dashed line) and difference plot (below) for part of La2Cu04 pattern
Tables 4 and 5 list results from the fitting proce- dure and the analysis of specimen-broadened inte- gral breadths There are no qualitative differences in results for tungsten and silver powders How- ever average errors are higher as expected be- cause of overlapping peaks while weighted errors wp are surprisingly smaller This fact illustrates the unreliability of iwp when only a segment of the pat- tern is being refined because it depends on the number of counts accumulated in points as well as on the 28 range of the refinement
Figures 17 and 18 represent Fourier coefficients of Lai85Sroi5Cu04 [110] and La2Cu04 [010] direc- tions In the second plot the A (L )-versus-L plot shows a concave-downward part near L =0 the so- called hook effect It was shown in Sec 42 that the hook effect originates because of underesti- mation of background connected with the trunca- tion of profiles In the profile refinement all peaks separated less than 4deg 20 have been included in the refinement region to avoid possible overlapping of peak tails and specimen profiles have been trun- cated below 01 of the maximum intensity How- ever because the polynomial background was determined prior to profile refinement it may be overestimated for complicated patterns containing many overlapping peaks If background is refined with other profile parameters undesirable correla- tion with integral breadths occurs
340
Volume 98 Number 3 May-June 1993
Journal of Research of the National Institute of Standards and Technology
Table 4 Parameters of the pure-specimen Voigt function as obtained from profile-fitting procedure for La2-^SrCu04 powders
Specimen hid 2Hdeg) Pen PcO FWHM(deg) Rp()
Lai85Sroi5Cu04 004 2695 0046(4) 0024(8) 0042 34 006 4092 0083(5) ltio-= 0053 62 110 3352 0110(5) ltio- 0070 125 220 7046 0171(9) ltio- 0109 43
La2Cu04 004 2713 0061(8) 0045(9) 0067 39 006 4119 0124(7) ltio-^ 0079 77 020 3316 0074(10) 0078(10) 0102 29 040 6957 0210(30) 0026(81) 0135 29 200 3345 0074(8) 0061(10) 0087 69 400 7028 0130(10) 0023(95) 0089 29
Table 5 Microstructural parameters for Laij(5Srai3Cu04 and La2Cu04 powders
Specimen Direction (DUA) Pgt(A) lte^(fl3))laquo lte2((Z)gt2))laquo
Lai83Sro5Cu04
La2Cu04
[001] [110]
[001] [010] [100]
1700(300) 470(20)
1100(100) 680(50) 680(50)
2000(200) 940(20)
1200(100) 760(50) 810(50)
00024 00017
00038 00033 00016
000049(9) 000044(6)
00008(1) 00007(2) 00003(3)
c i ^- raquo sect 08 bulli - U
^0
ti- bull ll bull bullbullo
ffl M P bull- u ^ Di 04 Si - M bulldiamsbullbull a bull-v 3 o ^^=s^
u ^N^Sraquoraquo^
0 ^^^aaaa 1000
L(A) 2000
OQ bullbulldego UM o z a 08
o o bull bull bull
- u u bull raquo UU bull
a diams o bull o u ft 04 bull deg raquo deg - U bull bull deg Oi bullbullgt =3 bull- l o k u
0 bullbullbullraquo aaaMMi
500 1000
L(A)
Fig 17 Fourier coefficients for the first- (pluses) and second- order (crosses) reflection and size coefficients (circles) for [110] Lai^Sroi5Cu04
Fig 18 Fourier coefficients for first- (pluses) and second- order (crosses) reflection and size coefficients (circles) for [010] La2Cu04
341
Volume 98 Number 3 May-June 1993
Journal of Research of the National Institute of Standards and Technology
S3 Comparison with the Integral-Breadth Methods
Knowing the specimen integral breadths simpli- fied methods can be applied In Sec 212 we re- viewed multiple-line and single-line integral- breadth methods We shall compare the simplified multiple-line methods [Eqs (23) (24) and (30)] and the single-line method [76] [Eqs (29) and (30)] with results obtained for silver tungsten and La2-xSrxCu04 powders (Tables 3 and 5) We did not compare with the multiple-line Voigt-function method [26] because it was shown in Sec 44 that it is incompatible with the Warren-Averbach analy- sis In Table 6 integral breadth Pi was computed according to Eq (11) This value was compared with )8A integral breadth computed from Fourier coefficients [58]
i8A=- laquo3 2^(L)
(74)
Results obtained by the Warren-Averbach analysis are significantly smaller for both size and strain Integral-breadth methods give the upper limit for strain so comparison is limited Considering the approximation e = 125e^(L))^ [138] with L=(D)v2 or L=(D)s2 strains resemble more closely than crystallite sizes It must be noted how- ever that this approximation makes sense only in the case of pure-Gauss strain broadening Benedetti et al [106] reported excellent agreement for both size and strain using Warren-Averbach and Cauchy-Gauss [Eq (24)] methods Results from Table 6 on the contrary indicate that the Gauss-Gauss approximation gives values closest to the Warren-Averbach method for crystallite sizes whereas the Cauchy-Gauss and especially the Cauchy-Cauchy approximation tend to give too large values For strain the trend is opposite The Cauchy-Cauchy approximation resembles most
Table 6 Comparison of results obtained with the integral-breadth methods Cauchy-Cauchy (C-C) Cauchy-Gauss (C-G) Gauss- Gauss (G-G) and single-line (S-L) analysis
Specimen hkl PiXKP PAXKP ltigt)v (Z)gt(A) (e^((DV2)gt2 eXlO^ (A-) (A-0 (A) C-C C-G G-G S-L xlO^ C-C C-G G-G S-L
W untreated 110 220
0259 0247
0259 0247
3500 3700 3810 3810 14500 4040
008 -001 -003 -005 024 0
W ground 110 220
125 204
125 205
1030 2240 1450 1220 940 550
054 090 093 105 045 032
Ag untreated 111 2
0600 0901
0600 0900
2000 3340 2390 2190 1670 1110
024 035 039 095 0 0
200 124 124 1030 2270 1470 1230 810 047 082 085 095 0 400 204 204 490 0
Ag ground 111 222
198 352
200 352
650 2080 1240 910 530 280
095 179 182 197 048 0
200 403 406 350 9380 4780 1320 260 180 405 405 408 082 400 803 803 120 0
Lai85Sroi3Cu04 004 006
0657 0881
0650 0880
2000 5230 3290 2660 1970 1140
049 076 078 088 044 0
110 119 119 940 1240 1000 970 840 044 052 064 080 0 220 158 158 630 0
La2Cu4 004 006
0988 132
0998 131
1200 2980 1940 1630 1490 760
08 107 112 127 081 0-
020 143 142 760 1200 910 860 1240 07 079 090 110 114 040 198 200 510 016 200 126 124 810 810 810 810 1250 03 002 011 015 089 400 1S 126 830 014
Not possible to evaluate because of too small Gauss integral breadth
342
Volume 98 Number 3 May-June 1993
Journal of Research of the National Institute of Standards and Technology
closely a Warren-Averbach method These results concur with the Klug and Alexander [24] compari- son of the published size and strain values obtained by Warren-Averbach (Stokes) and integral-breadth methods However for x-ray diffraction the Cauchy-Gauss assumption for the size-strain broadening is theoretically and experimentally more favored thpoundm the other two models The fact that the Gauss-Gauss method for crystallite size and the Cauchy-Cauchy method for strain give more realistic results may mean that the presump- tion that size and strain broadening are exclusively of one type is an oversimplification
The single-line method seems much less reliable If Gaussian breadth is very small no information about strain is obtained Moreover second-order reflections give much lower values of both size and strain than do basic reflections However if multi- ple reflections are not available the single-line method can give satisfactory estimations
54 Reliability of Profile Fitting
The profile fitting of a cluster of even severely overlapping peaks can be accomplished with a low error and excellent fit of total intensity But how reliable is information obtained about separate peaks in the cluster In the fitting procedure it is possible to put constraints on the particular profile parameter to limit intensity position and width of the peak If anisotropic broadening or different phases are present constraints may not be realistic Morever acceptable results can be obtained even using a different number of profiles in refinement [4] Hence the first condition for the successful ap- plication of this method is knowledge of actual phases present in the sample and their crystalline structures
In this regard two powders were measured or- thorhombic Lai94Sroo6Cu04 has a slightly distorted K2NiF4-type structure (space group Bmab a =53510(2) A b =53692 A(2) c = 131931(7) A) and tetragonal Lai76Sro24Cu04 (space group I4mmm a =37711(3) A c = 132580(8) A) Data were collected for each specimen separately and for a specimen obtained by mixing the same pow- ders Because diffracted intensity of each phase was lower for the mixture counting time was pro- portionally increased to obtain roughly the same counting statistics Figure 19 shows two partially separated orthorhombic (020) (200) and (040) (400) peaks overlapped with tetragonal (110) and (220) reflections During the profile fitting of the mixed powders (200) orthorhombic peak tended to disappear on account of neighboring (020) and
(110) reflections Its intensity was constrained to vary in range plusmn 30 of (020) peak intensity which can be justified if the crystallographic structure is known
60
-60
345
345
335 29 (deg)
345
Fig 19 (upper) Lai76Sro24Cu04 (110) peak (middle) Lai94Sroo6Cu04 (020) and (200) peaks (lower) (110) (020) and (200) peaks
Table 7 contains results of fitted specimen-Voigt functions as well as size and strain values obtained by the analysis of broadening Comparing integral breadths of the starting and mixed powders some profiles change from more Cauchy-like to Gauss- like and vice versa This is especially evident for the (400) reflection meaning that accurate deter- mination of the profile tails is indeed affected in the cluster of overlapping peaks However integral breadth does not change significantly so results of
343
Volume 98 Number 3 May-June 1993
Journal of Research of the National Institute of Standards and Technology
Table 7 Comparison between two specimens run separately and mixed togetlier
Specimen hkl 2Hdeg) )3cO PoO DUA) (D)v(A) (e2laquoD)v2))laquoxlO
Lai76Sroj4CuOr 110 3369 0058(6) 0094(7) 780(60) 850(60) 10(1) 220 7073 022(2) 013(2)
LaiMSro(KiCu04 020 3342 0084(9) 055(14) 500(90) 1000(200) 07(1) 040 7012 010(2) 014(1) 200 3353 00216(85) 0061(8) 1100(100) 1200(100) 03(1) 400 7040 0026(11) 0088(8)
Mix 110 3367 0083(21) 0064(14) 800(300) 1200(300) 08(3) Lai76Sro24Cu04 220 7072 019(7) 013(4)
+ 020 3343 0066(35) 0070(23) 800(300) 1000(300) 07(4) Lai94Sroo6Cu04 040 7012 0116(93) 013(5)
200 3354 0024(156) 0071(61) 900(700) 1000(600) 04(12) 400 7041 011(2) 0003(320)
the multiple-line methods are not much influenced On the contrary the single-line method gives quite different results This may support the conclusion of Suortti Ahtee and Unonius [43] that the Voigt function fails to account properly for size and strain broadening simultaneously if only Cauchy integral breadth determines crystallite size
Table 7 shows that the results of Warren- Averbach analysis of starting and mixed powders agree in the range of standard deviations How- ever errors are much larger especially for the hid- den (200)-(400) reflections From Eq (62) it follows that more counts (longer counting times) and more observables (smaller step-size) would lower standard deviations Therefore in the case of highly overlapping patterns to obtain desirable ac- curacy much longer measurements are needed al- though that will not change the fact that higher overlapping implies intrinsically higher errors of all refinable parameters To further minimize possible artifacts of the fitting procedure it is desirable to include in the analysis as many reflections in the same ciystallographic direction as possible
55 Remarks
By modeling the specimen size and strain broad- ening with the simple Voigt function it is possible to obtain domain sizes and strains that agree with experiment and show a logical interrelationship Furthermore the Voigt function shows the correct 1A(26y asymptotic behavior of peak tails as ex- pected from kinematical theory [139] However if the specimen profile is significantly asymmetric (because of twins and extrinsic stacking faults [140 59]) or the ratio FWHM^ is not intermediate to the Cauchy (2Tr) and Gauss (2(ln27r)^) functions then the Voigt function can not be applied [25]
Suortti Ahtee and Unonius [43] found good over- all agreement by fitting the Voigt function to the pure-specimen profiles of a Ni powder deconvo- luted by the instrumental function However more accurate comparison is limited because of unavoid- able deconvolution ripples of specimen profiles Furthermore the Voigt function might not be flex- ible enough to model a wide range of specimen broadening as well as the different causes of broadening Therefore the question whether the Voigt function can satisfactorily describe complex specimen broadening over the whole 20 range in a general case needs further evaluation
This method of Fourier analysis with the as- sumed profile-shape function is most useful in cases when the classical Stokes analysis fails there- fore when peak overlapping occurs and specimen broadening is comparable to instrumental broaden- ing It was shown that for a high degree of peak overlapping the fitting procedure can give unreli- able results of Gauss and Cauchy integral breadths that is the peak can change easily from predomi- nantly Cauchy-like to Gauss-like and contrary This can lead to illogical values of size-integral and strain-integral breadths according to Eqs (52) (53) (54) and (55) and to irregularities in the be- havior of Fourier coefficients for large L Simulta- neously if the size-broadened profile has a large Gauss-function contribution the hook effect will occur However volume-weighted domain sizes D)y and MSS eL)) for small L are much less affected because they rely on both Cauchy and Gauss parts of the broadened profile Any integral- breadth method that attempts to describe the size and strain broadening exclusively by a Cauchy or Gauss function in this case fails completely For specimens with lower crystallographic symmetry
344
Volume 98 Number 3 May-June 1993
Journal of Research of the National Institute of Standards and Technology
when many multiple-order reflections are avail- able but the peaks are overlapped it is therefore desirable to include in the analysis as many reflec- tions as possible to minimize the potential artifacts of the fltting process
6 Analysis of Superconductors 61 (La-M)2Cu04 Superconductors
Bednorz and Miiller [16] found the first high- temperature oxide superconductor in the La-Ba- Cu-O system Soon after substituting Ba with Sr and Ca Kishio et al [17] found superconductivity in two similar compounds Later many compounds with much higher transition temperatures (Tc) were found The (La-M)2Cu04 system remains favorable for study because the cation content responsible for the superconductivity is easier to control and measure than the oxygen stoichiometry Also this system provides a wide range of substitutional cation solubility in which the tetragonal K2NiF4- type structure is maintained Compared with much- studied Y-Ba-Cu-O this structure is simpler because it contains only one copper-ion site and two oxygen-ion sites
The undoped compound La2Cu04 is orthorhom- bic at room temperature It becomes superconduct- ing either with cation substitution on La sites or increased oxygen content to more than four atoms per formula unit Doping with divalent cations in- creases the itinerant hole carriers in the oxygen- derived electron band [141] which probably causes the superconductivity However different dopants influence the transition temperature Tc Although the unit-cell c-parameter simply reflects ionic dopant size [142] the in-plane unit-cell parameter (and accordingly the Cu-0 bond length) correlates with Tc for different dopants and for different dop- ing amounts [142 143]
LaiB5MouCu04 (M = Ba Ca Sr) have a tetrago- nal K2NiF4-type structure space group lAlmmm with four atoms in the asymmetric unit [117] One site is occupied with La partially substituted with dopant ions (Fig 20) La2Cu04 is orthorhombic at room temperature The best way to correlate these two structures is to describe La2Cu04 in space group Bmab the c axis remains the same tetrago- nal [110] and [110] directions become [010] and [100] orthorhombic axes and size of the unit cell is doubled [144]
Figure 21 shows parts of the x-ray diffraction patterns observed and refined of Lai85Moi5Cu04 (M = Sr Ba Ca) and La2Cu04 Refined lattice
parameters are given in Table 8 Table 9 shows resuhs of the line-broadening analysis Relatively
La(BaCaSr)
0(2)
0(1)
Fig 20 Ciystal structure of (La-M)2Cu04 showing one unit cell
300 JUU
(b)
200
100
U 0 M J Js-r-^
30
-30
300
40 41 42 43 44 45 40 41 42 43 44 45 29 (deg) 29 (deg)
mdashA-
gt t 200
Z
F-
- 100
(c)
f V kgt ii I 40 41 42 43 44 45 40 41 42 43 44 45
e (deg) ^^ 26 (deg)
-30 wwX mdash Wlaquo-
Fig 21 Diffraction patterns of LaiH5Moi5Cu04 specimens (a) M=Sr (b) M = Ba (c)M = Ca (d) M = U
345
Volume 98 Number 3 May-June 1993
Journal of Research of the National Institute of Standards and Technology
Table 8 Lattice parameters and T^ at zero resistivity (Ac method at 10 Ma current)
Specimen a (A) bk) c(A) rc(K)
Lairaquo5Sroi5Cu04 377814(7)
Lairaquo3Baoi3Cu04 37846(2)
LaiiijCaoi5Cu04 37863(7)
La2Cu04 53558(2) 54053(2)
231(2) 36
288(4) 28
17(2) 19
1451(8)
Table 9 Results of line-broadening analysis for (La-M)2Cu4 specimens
Specimen hkl PcO PoO (DUk) (Iraquo)(A) lte^((D)2))
Lai(laquoSroj5Cu04 004 006
0046(4) 0083(5)
0024(8) ltio-
1700(300) 2000(200) 000049(9)
110 0110(5) ltio- 470(20) 940(20) 000044(6) 220 0171(9) ltio-
Lai85Baoi3Cu04 004 006
0049(6) 0110(7)
0076(6) 0089(9)
1100(200) 1100(100) 00011(2)
110 0087(4) 000042(6) 560(20) 1110(20) 000024(5) 220 0116(3) ltio-5
Laiji5Caoi5Cu04 004 006
0120(13) 0146(12)
0032(22) 0033(27)
440(70) 780(90) 00007(4)
110 0045(25) 0200(19) 340(30) 360(20) 00013(2) 220 0343(22) ltio-
La2Cu04 004 006
0061(8) 0124(7)
0045(9) ltio-
1100(100) 1200(100) 00008(1)
020 0074(10) 0078(10) 680(50) 760(50) 00007(2) 040 0210(30) 0026(81) 200 0074(8) 0061(10) 680(50) 810(50) 00003(3) 400 0130(10) 0023(95)
weak peak broadening was observed which can not be attributed to the proximity of the phase trans- formation Lai85SroisCu04 is tetragonal down to = 170 K [145] Lai85Baoi5Cu04 to 140 K [146147] and Lai85Caoi5Cu04 to 130 K [148] Another possi- ble reason for peak broadening might be continu- ous compositional variations in dopant content The scanning Auger microprobe analysis of La2-SrtCu04 compounds [149] showed that grain- boundary segregation of Sr is weak and limited to a narrow region near the grain surface In the case of the separation of two phases with different Sr con- tent and similar lattice parameters asymmetry of some reflections would be observed [150] More- over in the case of compositional inhomogeneity microstrains eL)) would be roughly independent of the averaging distance L in the grains [151] therefore distribution of strains would be Gaus- sian For all specimens microstrain behavior is identical it decreases linearly with distance L
Rothman and Cohen [115] showed that such be- havior of microstrains is caused by dislocations that might arise during grinding Assuming the same applied stress microstrain would be approximately inversely proportional to the elastic moduli of these materials If mean microstrain is defined as the arithmetic average of strains for the [001] and [110] directions results agree with values of the Youngs moduli for polycrystalline La2Cu04 Lai85Moi5Cu04 (M = Sr Ba Ca) [152] However other factors may contribute to the microstrain Coordination-6 ionic radii of La^+ Sr Ba^+ Ca^+ are 106 116 136 100 A respectively [153] Substitution of La with ions of different sizes affects the lattice parameter [142] and may cause much larger strains in the [001] direction when some of the ions are replaced with Ba^ than with Sr^ in accord with results in Table 9 Substitution of Ca^^ ions produces an entirely different effect microstrains in the [110] direction are larger This may be explained by
346
Volume 98 Number 3 May-June 1993
Journal of Research of the National Institute of Standards and Technology
comparing effects of substitutional ions on the unit-cell a -parameter The Ba-doped specimen has a larger a-parameter than the Sr-doped but the Ca-doped a-parameter is largest although Ca^^ has the smallest ionic size This should increase the cell distortion in the a-b plane
Table 9 reveals high anisotropy in these materi- als consistent with other physical properties such as thermal expansion [154] and upper critical mag- netic field [155] Differences of domain sizes might arise from a layered structure in the [001] direction and consequently easy incorporation of stacking faults between regularly stacked layers The stack- ing-fault and twin-fault probabilities can be esti- mated from the average surface-weighted domain sizes [59]
^ = TAN + cf1fun(aa) (75) m im - (D)
Here c is a constant for the particular [hkl] direction and fun(a a) a linear combination of stacking-fault probability and twin-fault probability a The exact form of Eq (75) was derived only for the cubic and hexagonal crystal structures On con- dition that the true domain dimension D is isotropic or so large that the second term of Eq (75) dominates a linear function of stacking-fault and twin-fault probability is
fun(aa) = c( 1
) (76) Zgt)J (Dgttrade
Here c denotes a constant that depends only on geometrical factors and is the same for all three doped compounds
Figure 22 shows a possible correlation between Tc and fault-defect probabilities computed from TEM observations of La2-jcSrCu04 revealed that stacking-fault density increased with Sr content up to jc = 015 [156] That study suggests that a shear mechanism forming the fault-boundary dislocations implies oxygen vacancies andor cation deficiency We did not measure oxygen content but neutron- diffraction studies showed that oxygen deficiency starts to appear at much higher Sr content [157] However the increase of fault probability with the simultaneous decrease of microstrain in Fig 22 supports the assumption that defects are intro- duced to accommodate lattice strains [156] A simi- lar increase in Te was found in Y2Ba4Cu802o-laquo thin films [158] Compounds with asymmetric broad- ened and shifted peaks showed higher Tc which
was attributed to stacking faults Although extrinsic stacking faults may cause asymmetric peak broad- ening [140] it is probably caused by twinning Twinning in La-M-Cu-0 materials is less abundant than in Y-Ba-Cu-O compounds but it was ob- served in (La-Sr)2Cu04 monocrystals on (110) planes [159] In the profile-fitting procedure peak asymmetry is incorporated only in the instrumental function therefore we could not model asymmetric peak broadening However any significant asym- metry of the specimen profile would cause an un- even fit of low-angle and high-angle sides of peaks which was not observed This gives much more im- portance to stacking faults in Eq (76)
Fig 22 Arithmetic average of [110] and [001] root-mean- square strains and linear function of stacking-fault and twin- fault probabilities as a function of Tc
In Fig 22 average microstrains defined as the arithmetic average of [001] and [110] directions correlate inversely with Tc However we did not find a correlation of Tc and microstrains in a partic- ular direction [001] microstrains simply reflect dif- ference in size of dopant and host La^ ions (see Table 9)
In La2Cu04 (OkO) reflections are significantly broader than (hOO) This has also been observed in low-temperature orthorhombic Lai85Sroi5Cu04 and Lai85Baoi5Cu04 [160] and explained by either stacking faults or possible lower symmetry Our results reveal that domain sizes (D) have identical values for [010] and [100] directions (Table 9) From Eq (76) it follows that stacking-fault proba- bilities in these directions have the same values However microstrains in the [010] direction are roughly twice as large as in the [100] direction which is responsible for the different broadening In the case of doped La2Cu04 compounds different microstrains might be caused by oxygen
347
Volume 98 Number 3 May-June 1993
Journal of Research of the National Institute of Standards and Technology
vacancies ordered along one direction in the a-b plane similar to effects found in YBa2Cu307-laquo However undoped La2Cu04 is not expected to have significant o^Qgen deficiency Other possibili- ties are lower ciystallographic symmetry andor La vacancies although they were not reported for this system but La deficiency was found in an La2Co04 compound [161]
We can conclude that lattice strains and incoher- ently diffracting domain sizes confirm high an- isotropy in these materials This simple approach however does not allow unambiguous identifica- tion of the strains origin Probably the strains originate from dislocations and from different sizes of host and dopant ions Domain sizes of all com- pounds are larger in the c-direction than in the a-6 plane This indicates existence of stacking faults and twins However because estimated errors are relatively large and only three materials were stud- ied the possible connection between stacking faults and 7c needs further study
62 Bi-Cu-O Superconductors
Among the high-Tc superconductors the Bi- Cu-O compounds appear intriguing especially because their incommensurate structure modula- tion remains incompletely understood [162 163] The crystal structure consists of perovskite-like SrO-(Cu02Ca)mi-Cu02-SrO layers separated by NaCl-like BiO double layers (see Fig 23 [164]) The number m of Cu02 layers alters the supercon- ducting transition temperature Tc (for m = 12 and 3 rclaquo10 90 and 110 K respectively) This two- dimensional layered structure makes these materi- als highly anisotropic and favours the creation of defects
Bulk sintered specimens showed relatively weak peak broadening Moreover the diffraction pat- terns contained many overlapping peaks because the compound crystallizes in an orthorhombic low- symmetry space group A2aa [165] and incommen- surate modulation gives superlattice reflections All patterns revealed a strong [001] texture (Fig 24) making reflections other than (001) difficult to ana- lyze The lattice parameters vary depending on the exact compound stoichiometry and processing his- tory but characteristically they have almost identi- cal a and b parameters and large c parameter fl =54095 A 6=54202 A c =309297 A for Bi2Sr2CaCu208 (Bi-2212 [166] and A =5392 A b =5395 A c =36985 A for (BiPb)2Sr2Ca2Cu30io (BiPb-2223) [165] Thus we treated (hOO) and (0^0) reflections as single peaks Table 10 gives the
results for three specimens Bi-2212 (BiPb)2 (SrMg)2(BaCa)2Cu30io (BiPbMgBa-2223) which were one-phase specimens and BiPb-2223 con- taining approximately equal amounts of 2212 and 2223 phases The in-plane lattice parameters of 2212 and 2223 phases differ little hence only the [00] directions of the mixed-phase specimen were evaluated
b^ (c)
Fig 23 Average crystal structure of Bi2Sr2Cam-iCum04+2m for (a) m = 1 (b) w =2 (c) m =3 [164]
35
-35
42 44 46 48 50 52 54 56 58 60 62 26 (deg)
^ ^^^MK^Aa^Ndllaquop
Fig 24 Part of BiPbMgBa-2223 refined pattern There are 48 fundamental reflections in this region
Interpretation of the results in the case of these complicated compounds must be considered care- fully Microstrains are probably caused by disloca- tion arrays However substitution of different-sized ions and vacancies would also contribute to the strains as would other kinds of disorder especially
348
Volume 98 Number 3 May-June 1993
Journal of Research of the National Institute of Standards and Technology
Table 10 Results of line-btoadening analysis for Bi-Cu-O supreconductors
Specimen Phase hkl (A)
eD)sa)y^
Bi-2212 2212 008 0012
0163(8) 022(3)
001(6) 005(6)
420(80) 00021(6)
020+200 0104(4) ltio-^ 580(30) 00007(1) 040+400 018(2) 00004(6300)
BiPbMgBa-2223 7773 0010 0020
0097(1) 021(2)
00002(1700) 0007(150)
770(60) 00012(1)
020 + 200 012(27) 013(10) 380(430) 00009(71) 040 + 400 015(95) 021(33)
BiPb-73 2212 008 0012
023(2) 025(5)
0002(350) 0001(1000)
220(30) 00013(26)
2223 0010 0020
022(8) 023(99)
0092(67) 018(47)
230(190) 00012(197)
Stacking faults and twins Table 10 shows larger strains in the [001] direction that in the basal plane This can be explained by stacking disorder along the c-axis which was frequently observed in electron-diffraction patterns as streaking [167 168] Easy incorporation of stacking faults is possi- ble because of the two-dimensional weak-bonded layers (BiO double layers are spaced about 3 A apart) The difference in microstrain between in- plane and the c-direction is much smaller for the BiPbMgBa-2223 phase probably because Pb low- ers the faulting by stabilizing the higher-Tc 2223 phase [167] For the BiPb-2223 specimen with two phases there are two possibilities Either the speci- men consists mainly of a mk of two kinds of one- phase grains or both phases occur within the same grains The second possibility was confirmed exper- imentally [169 170] and our results concur be- cause microstrain in the 2212 phase is much smaller than in the one-phase Bi-2212 specimen Processing conditions and cation content probably favour development of the macroscopic inter- growth of both phases within the grains that is microscopic defects grow to sufficiently large re- gions to give a diffraction pattern of another phase with the different number of Cu02 layers As a re- sult strain is relieved and both strains and domain sizes being quite different in one-phase specimens tend to equalize
For the Bi-Cu-O specimens the mean surface- weighted domain sizes are generally smaller than for (La-M)2Cu04 compounds Therefore the com- putation of the stacking- and twin-fault probabili- ties by using Eq (75) may be wrong It would be very instructive to compare the different broaden-
ing of satellite and fundamental reflections which indicates a more pronounced stacking disorder in the modulated structure [171]
In summary we found that for both Bi-2212 and BiPbMgBa-2223 superconductors the c-axis strain exceeds the in-plane strain The BiPb-2223 specimen containing both 2212 and 2223 phases within the single grains shows smaller incoherently diffracting domains and lower c-axis strain than the one-phase specimens This fact may direct us to- ward the mechanism of the second-phase forma- tion in these materials
63 Remarks
It was shown that this particular method of the line-broadening analysis can give information about the size of incoherently diffracting domains and lattice strains in (La-M)2Cu04 and Bi-Clu-O superconductors Moreover results show high an- isotropy of both size and strain parameters as one may expect because of the layered structure of all superconducting cuprates Generally structural line broadening is not large that is a result of rela- tively large domain sizes (200-2000 A) and small strains (002-02) It is interesting to compare these values with the published results for YBa2Cu307-laquo (isotropic strains of 023 [77] and 005-03 [82]) Although the different materi- als were studied they seem too large especially be- cause they are the average of strains in different directions
The main drawback of the line-broadening the- ory is the uncertainty about the origins of the line broadening that is it is difficult to distinguish the main effects responsible for the broadening For
349
Volume 98 Number 3 May-June 1993
Journal of Research of the National Institute of Standards and Technology
the novel superconductors particularly the numer- ous defects (substitutions vacancies stacking faults dislocations and similar) can occur simulta- neously which makes it very difficult to determine their individual contributions Furthermore the crystal structures of most novel superconductors are relatively complicated The average structure has mostly a slightly distorted tetragonal symmetry very similar a and b lattice parameters and a large c parameter but c=36 for YBa2Cu307-laquo for in- stance This results in a large number of overlap- ping peaks and consequently in large errors of all results This showed especially in the case of Bi-Cu-O superconductors (see Table 10) Follow- ing the discussion of reliability of profile fitting in Sec 54 it would be desirable to include more than two reflections in the analysis of broadening but higher-order peaks are usually too weak and over- lapped One way to partially solve this problem would be a whole pattern fitting [172 173] and Rietveld structure refinement [23] in terms of size and strain parameters This requires an accurate preset function to model specimen broadening and precise definition of angular dependence of size and strain parameters The Rietveld programs that model the line broadening in terms of size and strain parameters are based either on the simpli- fied integral-breadth methods [78 95] or on the single-line method [174]
7 Conclusions
A method for analyzing the pure-specimen (structural) broadening of x-ray diffraction line profiles is proposed By modeling the specimen size and strain broadenings with the simple Voigt func- tion it is possible to obtain domain sizes and strains that agree with experiment and show a logi- cal interrelationship Furthermore some common consequences and problems in the Fourier-method analysis follow easily The specimen function is convoluted with the instrumental function to match the observed x-ray diffraction-line profile This avoids the Stokes deconvolution method thus al- lowing analysis of patterns with highly overlapping peaks and weak structural broadening Therefore the method was applied to some novel high-Tc superconductors We reached the following conclu- sions
(i) Surface-weighted domain size depends only on the Cauchy integral breadth of the size-broad- ened profile
(ii) The hook effect occurs when the Cauchy-content of the size-broadened profile is un-
derestimated that is for ^sc(n2)^3sG Usually this happens when the background is estimated too high so the long tails of the Cauchy function are prematurely cut off
(iii) It also follows from conclusion (ii) that the volume-weighted domain size can not be more than twice the surface-weighted domain size (limiting value D)v=2D)i is obtained for the pure-Cauchy size-broadened profile) Minimum value for D)J (D)j should not be less than -131
(iv) If the distortion coefficient is approxi- mated with a harmonic term this leads exactly to the Warren-Averbach method of separation of size and strain broadenings
(v) In that case mean-square strains decrease linearly with the distance L
(vi) It is possible to evaluate local strain ((e^(0))^) only in the case of pure-Gauss strain broadening Then root-mean-square strain is inde- pendent of the distance L and related to the upper limit of strain obtained from the integral breadth of the strain-broadened profile
(vii) If strain broadening is not described exclu- sively with the Gauss function the multiple-line Voigt integral breadth and Warren-Averbach analyses can not give the same results for volume- weighted domain size although D)v is defined identically in both approaches because the appar- ent strain -q = pdeg(29)cot9 is not angular- independent
(viii) Smooth size coefficients give column- length distribution functions without oscillations and make possible a computation of volume- weighted average domain sizes up to ~5000 A
(ix) Comparison with the simplified integral- breadth methods in most cases has shown not large but systematic discrepancy of results indicat- ing that size and strain broadening can not be accu- rately modeled by a single Cauchy or Gauss function Moreover the application of the single- line method is much less reliable and it should not be used where multiple reflections are available
(x) The knowledge of all phases present in the sample and their crystallographic structure is re- quired to successfully fit a cluster of overlapping peaks Although it is very difficult to accurately de- termine the Cauchy-Gauss ratio of an overlapped peak final results of domain size and strain are much less affected Therefore connecting the crys- tallite size exclusively with the Cauchy content and strain with the Gauss content of a specimen profile might be doubtful
(xi) Evaluated errors of domain sizes and strains increase substantially with the degree of
350
Volume 98 Number 3 May-June 1993
Journal of Research of the National Institute of Standards and Technology
peak overlapping Hence for complicated patterns very accurate measurements are necessary and one needs to analyze as many reflections in the same crystallographic direction as possible
(xii) Line-broadening analysis of (La-M)2Cu04 and Bi-Cu-O compounds confirms high anisotropy in these materials
(xiii) Strains in (La-M)2Cu04 probably origi- nate from dislocations and from different sizes of host and dopant ions
(xiv) Stacking-fault probability in (La-M)2Cu04 (M = Ba Ca Sr) increases with increasing Tc whereas the average strain decreases
(xv) In La2Cu04 different broadening of (lOO) and (OfcO) reflections is not caused by stacking faults
(xvi) All Bi-Cu-0 superconductors show larger strain in the c-direction than in the a-b plane which can be explained by stacking disorder along the [001] direction
(xvii) In the specimen with approximately equal amounts of Tl-2212 and TlPb-2223 phases it is likely that a secondary phase develops by the growth of the microscopic faulted regions of the primary phase
Acknowledgments
I am thankful to Dr Harry McHenry for his support and especially to Dr Hassel Ledbetter for his wise guidance and most useful help during my stay at NIST I am also indebted to my home insti- tution the Faculty of Metallurgy of the University of Zagreb for allowing me the leave of absence at NIST
8 References
[1] W Friedrich P Knipping and M v Laue Ann Physik 41 971 (1912)
[2] H M Rietveld Acta Cryst 22 151 (1967) [3] H M Rietveld J Appl Cryst 2 65 (1969) [4] S A Howard and K D Preston in Modern Powder Dif-
fraction Vol 20 The Mineralogical Society of America Washington DC (1989) p 217
[5] D Taupin J Appl Cryst 6 266 (1973) [6] T C Huang and W Parrish Appl Phys Lett 27 123
(1975) [7] M K Wu J R Ashburn C J Torng P H Hor R L
Meng L Gao Z J Hwang Y Q Wang and C W Chu Phys Rev Lett 58 908 (1987)
[8] D Shi MRS Bull 16 37 (1991) [9] D Larbalestier Phys Today 44 74 (1991)
[10] J C Phillips Phys Rev B 4512647 (1992) [11] B Raveau Phys Today 45 53 (1992) [12] A J Millis and K M Rabe Phys Rev B 38 8908 (1988)
[13] F Guinea Europhys Lett 7 549 (1988) [14] C P Dhard and P Singh in Proc Int Symp High-Temp
Supercond Jaipur India Oxford amp IBH Publishing New Delhi (1988) p 271
[15] J D Jorgensen Phys Today 44 34 (1991) [16] J G Bednorz and K A Muller Z Phys B 64 189
(1986) [17] K Kishio K Kitazawa S Kaube I Yasuda N Sugii H
Takagi S Uchida K Fueki and S Tanaka Chem Lett 429 (1987)
[18] J D Jorgensen B Dabrowski S Pei D G Hinks L Soderholm B Morosin J E Venturini and D S Ginley Phys Rev B 38 11337 (1988)
[19] J R Clem Phys Rev B 43 7837 (1991) [20] M Paranthaman M Foldejiki D Balzar H Ledbetter
A J Nelson and A M Hermann submitted to Phys Rev B
[21] A R Stokes Proc Phys Soc Lond 61 382 (1948) [22] B E Warren and B L Averbach J Appl Phys 23 497
(1952) [23] R Delhez Th H de Keijser and E J Mittemeijer in
Accuracy in Powder Diffraction S Block and C R Hub- bard eds Natl Bur Stand (US) Special Publication 567 (1980) p 213
[24] H P Klug and L E Alexander X-ray Diffraction Proce- dures 2nd Edition John Wiley New York (1974) p 661
[25] J I Langford J Appl Ciyst 11 10 (1978) [26] J I Langford in Accuracy in Powder Diffraction S
Block and C R Hubbard eds Natl Bur Stand (US) Special Pubication 567 (1950) p 255
[27] R Delhez Th H de Keijser and E J Mittemeijer Fre- senius Z Anal Chem 312 1 (1982)
[28] A J C Wilson Proc Phys Soc Lond 80 286 (1962) [29] A J C Wilson Proc Phys Soc Lond 81 41 (1963) [30] L P Smith Phys Rev 46 343 (1934) [31] H C Burger and P H van Cittert Z Phys 79 722
(1932) [32] S Ergun J Appl Ciyst 1 19 (1968) [33] R Croche and L Gatineau J Appl Ciyst 10479 (1977) [34] L H Schwarz and J B Cohen Diffraction from Materi-
als Academic Press New York (1977) p 391 [35] R Delhez Th H de Keijser E J Mittemeijer and J I
Langford J Appl Cryst 19 459 (1986) [36] R Delhez Th H de Keijser E J Mittemeijer and J I
Langford Aust J Phys 41 213 (1988) [37] R A Young and D B Wiles J Appl Cryst 15 430
(1982) [38] W Voigt Stizungsber K Bayer Akad Wiss 42 603
(1912) [39] E E Whiting J Quant Spectrosc Radiat Transfer 8
1379 (1968) [40] G K Wertheim M A Butler K W West and D N E
Buchanan Rev Sci Instrum 111369 (1974) [41] M M Hall Jr V G Veeraraghavan H Rubin and P G
Winchell J Appl Cryst 10 66 (1977) [42] A Brown and J W Edmonds Adv X-Ray Anal 23 361
(1980) [43] P Suortti M Ahtee L Unonius J Appl Cryst 12 365
(1979) [44] T Sundius J Raman Spectrosc 1 471 (1973) [45] B H Armstrong J Quant Spectrosc Radiat Transfer 7
61 (1967) [46] J F Kielkopf J Opt Soc Am 63 987 (1973) [47] B P Asthana and W Kiefer Appl Spectr 36 250
(1982)
351
Volume 98 Number 3 May-June 1993
Journal of Research of the National Institute of Standards and Technology
[48] J P M de Vreede S C Mehrotra A Tal and H A Dijkerraan Appl Spectr 36 227 (1982)
[49] F R L Schoening Ada Ciyst 18 975 (1965) [50] P Scherrer Gott Nachr 2 98 (1918) [51] A R Stokes and A J C Wilson Proc Cambridge
Philos Soc 38 313 (1942) [52] A J C Wilson X-Ray Optics 2nd edition Methuen
London (1962) [53] S Leie and T R Anantharaman Proc Indian Acad
Sci Sect A H 261 (1966) [54] D Louer D Weigel and J I Langford J Appl Ciyst
5 353 (1972) [55] A J C Wilson J Appl Ciyst 2 181 (1969) [56] J I Langford and A J C Wilson J Appl Ciyst 11102
(1978) [57] A R Stokes and A J C Wilson Proc Phys Soc Lond
56174 (1944) [58] B E Warren and B L Averbach J Appl Phys 21 595
(1950) [59] B E Warren X-Ray Diffraction Addison-Wesley
Reading Massachusetts (1969) p 264 [60] B E Warren in Progress in Metal Physics Vol 8 Perg-
amon Press London (1959) p 146 [61] F Bertaut C R Acad Sci Paris 228 187 (1949) [62] N C Haider and C N J Wagner Acta Cryst 20 312
(1966) [63] D Balzar and H Ledbetter in Proceedings of the Accu-
racy in Powder Diffraction II Natl Inst Stand Technol (1992) p 37
[64] D Balzar and H Ledbeter J Appl Cryst 26 (1993) in press
[65] J N Eastabrook and A J C Wilson Proc Phys Soc Lond B 65 67 (1952)
[66] R S Smith IBM J Res Develop 4 205 (1960) [67] B Y Pines and A F Sirenko Soviet Physics Ciyst 715
(1962) [68] G B Mitra and N K Misra Acta Ciyst 22 454 (1967) [69] A Gangulee J Appl Ciyst 7 434 (1974) [70] J Mignot D Rondot Acta Met 231321 (1975) [71] J Mignot and D Rondot Acta Ciyst A 33 327 (1977) [72] R K Nandi H K Kuo W Schlosberg G Wissler J B
Cohen and B Crist Jr J Appl Ciyst 17 22 (1984) [73] M Zocchi Acta Ciyst A 36164 (1980) [74] P Ramarao and T R Anantharaman Trans Ind Ins
Metals 18 181 (1965) [75] R K Nandi and S P Sen Gupta J App Cryst 11 6
(1978) [76] Th H de Keijser J I Langford E J Mittemeijer and
B P Vogels J Appl Ciyst IS 308 (1982) [77] A Williams G H Kwei R B Von Dreele A C Lar-
son L D Raistrick and D L Bish Phys Rev B 37 7960 (1988)
[78] A C Larson and R B Von Dreele Los Alamos Na- tional Laboratory Report No LA-UR-86-748 (1988)
[79] J D Jorgensen D H Johnson M H Mueller J G Worlton and R B Von Dreele in Proceedings of the Conference on Diffraction Profile Analysis Cracow Poland (1978) p 20
[80] R B Von Dreele J D Jorgensen and C G Windsor J Appl Ciyst 15 581 (1982)
[81] P Thompson D E Cox and J B Hastings J Appl Ciyst 20 79 (1987)
[82] J P Singh R A Guttschow D S Kupperman J T Dusek and R B Poeppel in High Temperature Super-
conducting Compounds III S Whang A Gupta and E Ceilings eds TMS AIME Warrendale (1991) p 281
[83] M O Eatough D S Glnley and B Morosin Adv X- Ray Anal 33 145 (1990)
[84] E J Peterson P J Kung R E Muenchausen and D M Smith in Proceedings of the 41st Annual Denver Conference on Applications of X-Ray Analysis Colo- rado Springs Colorado (1992) p 74
[85] M Rand J I Langford and J S Abell submitted to J Cryogenics (1992)
[86] D Balzar J Appl Ciyst 25 559 (1992) [87] D Balzar H Ledbetter and A Roshko Physica C 185-
189 871 (1991) [88] D Balzar and H Ledbetter J Mater Sci Lett 111419
(1992) [89] D Balzar H Ledbetter and A Roshko Pow Diffr 8
(1993) in press [90] S Johnson M Gusraan D Rowcliffe T Geballe and J
Sun Adv Ceram Mater 2 337 (1987) [91] H Ledbetter S A Kim R B Goldfarb and K Togano
Phys Rev B 39 9689 (1989) [92] H Friedman Electronics 132 (1945) [93] W Parrish (ed) in Advances in X-Ray Diffractometry
and X-Ray Spectrography Centrex Publishing Company Eindhoven The Netheriands (1962)
[94] W Soller Phys Rev 24158 (1924) [95] S A Howard R L Snyder J Appl Ciyst 22 238
(1989) [96] G H Stout and L H Jensen X-Ray Structure Determi-
nation 2nd edition Wiley New York (1989) p 373 [97] D E Appleman and T Evans Jr Final Report 92-14
US Geological Survey Washington DC (1973) Avail- able as NTIS Document No PB-216188
[98] M U Cohen Rev Sci Instrum 6 68 (1935) [99] M U Cohen Rev Sci Instrum 7 155 (1936) [100] M H Mueller L Heaton and K T Miller Acta Ciyst
13 828 (1960) [101] R A Young P E Mackie and R B Von Dreele J
Appl Ciyst 10 262 (1977) [102] D B Wiles and R A Young J Appl Cryst 14 149
(1981) [103] J K Yau and S A Howard J Appl Ciyst 22 244
(1989) [104] S A Howard J K Yau and H U Anderson J Appl
Phys 65 1492 (1989) [105] S Enzo G Fagherazzi A Benedetti and S Poilizzi J
Appl Ciyst 21 536 (1988) [106] A Benedetti G Fagherazzi S Enzo and M
Battagliarin J Appl Cryst 21 543 (1988) [107] Th H de Keijser E J Mittemeijer and H C F Rozen-
daal J Appl Ciyst 16 309 (1983) [108] Y Zhang J M Stewart C R Hubbard and B Mo-
rosin Adv X-Ray Anal 33 373 (1990) [109] Y Wang S Lee and Y Ue J Appl Ciyst IS 35
(1982) [110] V N Selivanov and E F Smislov Zavod Lab 57 28
(1991) [Ill] A Guinier X-Ray Diffraction W H Freeman San
Francisco (1963) p 139 [112] M Wilkens J Appl Cryst 12119 (1979) [113] D Du and Y Wang Pow Diffr 2180 (1987) [114] A P Prudnikov Yu A Brychkov and O L Marichev
Integrals and Series Vol 1 Gordon and Breach Am- sterdam The Netheriands (1986) p 344
352
Volume 98 Number 3 May-June 1993
Journal of Research of the National Institute of Standards and Technology
[115] R L Rothman and J B Cohen J Appl Phys 42 971 (1971)
[116] T Adier and C R Houska J Appl Phys 50 3282 (1979)
[117] C R Houska and T M Smith J Appl Phys 52 748 (1981)
[118] S Rao and C R Houska Acta Ciyst A 4214 (1986) [119] J I Langford R Delhez Th H de Keijser and E J
Mittemeijer Ausi J Phys 41173 (1988) [120] J I Langfoid J Appl Cryst IS 315 (1982) [121] M J Turunen Th H de Keijser R Delhez and N M
van der Pers J Appl Ciyst 16176 (1983) [122] A J C Wilson Acta Ciyst 23 888 (1967) [123] A J C Wilson Acta Ciyst A 24 478 (1968) [124] A J C Wilson Acta Ciyst A 25 584 (1969) [125] G Gagliotti A Paoletti and F P Ricci Nucl Instrum
3 223 (1958) [126] J I Langford R J Cernik and D Louer J Appl
Ciyst 24 913 (1991) [127] J I Langford in Accuracy in Powder Diffraction II
preprint [128] A J C Wilson Mathematical Theory of X-Ray Powder
Diffractometiy Centrex Eindhoven The Netherlands (1963)
[129] J L Langford Prog Ciyst Growth and Charact 14185 (1987)
[130] T G Fawcett C E Crowder S J Brownell Y Zhang C R Hubbard W Schreiner G P Hamill T C Huang E Sabino J I Langford R Hamilton and D Louer Pow Diffr 3 209 (1988)
[131] W L Smith J Appl Ciyst 9187 (1976) [132] J L Langford and D Louer J Appl Ciyst 15 20
(1982) [133] Fl Popescu and L Benes Acta Ciyst A 33 323 (1977) [134] P PSuse^cu R MSnaila M Popescu and E Jijovici j
Appl Cryst 7 281 (1974) [135] P F Bley Y Calvayrac and M Fayard J Appl Ciyst
7 493 (1974) [136] B Moraweck Ph de Montgolfier and A J Renouprez
J Appl Ciyst 10191 (1977) [137] A Le Bail and D Louer J Appl Cryst 11 50 (1978) [138] D R Buchanan R L McCuUough and R L Miller
Acta Ciyst 20 922 (1966) [139] P Suortti and L D Jennings Acta Cryst A 33 1012
(1977) [140] J B Cohen and C N J Wagner J Appl Phys 33 2073
(1962) [141] A Bianconi J Budnick A M Flank A Fontaine P
Lagarde A Marcelli H Tolentino B Chamberland C Michel B Raveau and G Demazeau Phys Lett A127 285 (1988)
[142] K Fueki K Kitazawa K Kishio T Hasegawa S Uchida H Takagi and S Tanaka in Chemistiy of High- Temperature Superconductors D L Nelson M S Whittingham and T F George eds American Chemi- cal Society (1987) p 38
[143] T Fujita Y Aoki Y Maeno J Sakurai H Fukuba and H Fujii J Appl Phys 26 U68 (1987)
[144] R M Hazen in Physical Properties of High-rc Super- conductors Vol 2 D M Ginsberg ed World Scien- tific Singapore (1990) p 121
[145] J B Torrance A Bezinge A I Nazzal T C Huang S P Parkin D T Keane S J LaPlaca P M Horn and G A Held Phys Rev B 40 8872 (1989)
[146] J D Axe A H Moudden D Hohlwein D E Cox K
M Mohanty A R Moodenbaugh and Y Xu Phys Rev Lett 62 2751 (1989)
[147] T Suzuki and T Fujita Physica C 159 111 (1989) [148] T Fujita and Y Maeno in Superconducting Materials
JJAP Series 1 (1988) p 34 [149] A Roshko and Y-M Chiang J Appl Phys 66 3710
(1989) [150] D E Cox S C Moss R L Meng P H Hor and C W
Chu J Mater Res 31327 (1988) [151] B Crist and J B Cohen J Polym Sci 17 1001 (1979) [152] H Ledbetter S Kim and A Roshko Z Phys B 89275
(1992) [153] R D Shannon and C T Prewitt Acta Ciyst B 25 925
(1969) [154] M Lang H Spille F Steglich Y Hidaka T Murakami
and Y Endoh Physica C 162-1641037 (1989) [155] Y Hidaka and T Murakami Phase trans 15 241
(1989) [156] P L Gai and E M McCarron Science 247 553 (1990) [157] T Kamiyama I Izumi H Asano H Takagi S Uchida
Y Tokura E Takayama-Muromachi M Matsuda K Yamada Y Endoh and Y Hidaka Physica C 172 120 (1990)
[158] A Kapitulnik Physica C 153-155 520 (1988) [159] L A Muradyan V N Molchanov R A Tamazyan and
V I Simonov Physica C 162-164 536 (1989) [160] P Day M Rosseinsky K Prassides W I F David O
Moze and A Soper J Phys C 20 L429 (1987) [161] J T Lewandowski R A Beyerlein J M Longo and R
A McCauley J Amer Ceram Soc 69 699 (1986) [162] R Ramesh G van Tendeloo G Thomas S M Green
Y Mei C Jiang and H L Luo Appl Phys Lett 53 2220 (1988)
[163] J Schneck L Pierre J C Tolddano and C Daguet Phys Rev B 39 9624 (1989)
[164] O Eibl Physica C 168 215 (1990) [165] W Carrilo-Cabrera and W Gopel Physica C 161 373
(1989) [166] P Bordet J J Capponi C Chaillout J Chenavas A
W Hewat E A Hewat J L Hodeau M Marezio J L Tholence and D Tranqui Physica C 156189 (1988)
[167] R Ramesh K Remschnig J M Tarascon and S M Green J Mater Res 6 278 (1991)
[168] Z Hiroi Y Ikeda M Takano and Y Bando J Mater Res 6 435 (1991)
[169] Y Inoue M Hasegawa Y Shichi I Munakata M Ya- manaka S Hiyama and O Nittono J Mater Res 5 737 (1990)
[170] R Ramesh B G Bagley J M Tarascon S M Green M L Rudee and H L Luo J Appl Phys 67 379 (1990)
[171] X B Kan J Kulik P C Chow S C Moss Y F Yan J H Wang and Z X Zhao J Mater Res 5 731 (1990)
[172] G S Pawley J Appl Ciyst 13 630 (1980) [173] H Toraya J Appl Ciyst 19 440 (1986) [174] L Lutterotti and P Scardi J Appl Ciyst 23 246
(1990)
About the author Davor Balzar is with Faculty of Metallurgy of the University of Zagreb Sisak Croatia and was a Guest Researcher at fflST The National Institute of Standards and Technology is an agency of the Technology Administration US Department of Commerce
353
Volume 98 Number 3 May-June 1993
Journal of Research of the National Institute of Standards and Technology
It may be noted that most experiments give the ratio D)vD)s in this range (see for instance re- view by Klug and Alexander [24]) When k goes to infinity the size broadening is given only by the Cauchy component and (JD)V=2(D)S This is a case of pure Cauchy size broadening described by Haider and Wagner [62] and de Keijser Mittemei- jer and Rozendaal [107] It is possible to imagine a more complicated column-length distribution func- tion [27] than Eq (39) which would allow even larger differences between surface-weighted and volume-weighted domain sizes However we are not aware of any study reporting a difference larger than 100
43 Distortion Coefficient
In Sec 212 it was shown that the distortion co- efficient can be approximated by the exponential
Adeg(L) = exp(-ITTVLeL))) (47)
Comparing with Eq (36) we can write
Therefore mean-square strains (MSS) decrease linearly with averaging distance L This behavior is usually observed in the Warren-Averbach analysis Rothman and Cohen [115] showed that such be- havior would be expected of strains around disloca- tions Adler and Houska [116] Houska and Smith [117] and Rao and Houska [118] demonstrated for a number of materials that MSS can be repre- sented by a sum of two terms given by Cauchy and Gauss strain-broadened profiles
However for i3Dc=0 the MSS are independent ofL
(^2)12 ^ ^Dc(2g) cotg = ^ 2V2 V2TT
(49)
where the upper limit of strain e is defined as 7j4 (see Sec 212) This is a limiting case of pure- Gauss strain broadening described by de Keijser Mittemeijer and Rozendaal [107]
44 Discussion
To calculate domain sizes and strain it is neces- sary to define size and distortion integral-breadths angular order-dependence From Eq (43) It fol- lows that the domain size D )v is always indepen- dent of the order of reflection
)3sc = const JSSG = const
However from Eq (48) we find
^^ = const ^^ = const
(50)
(51)
An important consequence is that apparent strain TJ will be independent of angle of reflection only in the case of pure-Gauss strain broadening because 3DC and JSDG depend differently on the dif- fraction angle If we compare Eq (51) with the multiple-line Voigt-function analysis [26] given by Eqs (27) and (28) it is evident that they disagree Therefore recombination of constituent integral breadths 3DC and 3DO to Voigt strain-broadened in- tegral breadth Pdeg and the subsequent application of Eq (49) to calculate strain [26 119] will concur with the Fourier methods if strain broadening is entirely Gaussian and for the asymptotic value of MSS ((e^( 00))) However neither volume-weighted domain sizes D)y will agree although they are de- fined identically in both approaches because size- broadened and strain-broadened integral breadths are dependent variables
If at least two orders of reflection ( and +1) of the same plane (hkl) are available using Eqs (50) and (51) we can solve Eqs (33) and (34)
(52)
^^deg sl + l)-sil) ^^^^
^^=sHl + l)-sl) [fc( + l)-3c()3 (54)
^^=sl + l)-sl) [^(^ + ^)-^(0]- (55)
If we substitute these expressions into Eqs (35) and (36) we see that this approach leads exactly to the Warren-Averbach Eq (20) for two orders of reflections This is expected because the distortion coefficient is approximated with the exponential (47)] Delhez de Keijser and Mittemeijer [23] ar- gued that instead of Eq (20) the following rela- tion would be more accurate
A(L)=AXL) (1 -27r^(e^(L))LVd (56)
333
Volume 98 Number 3 May-June 1993
Journal of Research of the National Institute of Standards and Technology
These two approximations differ with fourth-order terms in the power-series expansion In terms of this approach Eq (48) has to be rewritten
2r ^^ l-exp(-2LI3DC-TTL^0DG) (57)
This means that even if the strain-broadened pro- file is given entirely by the Gauss function the MSS depend on distance L (see Fig 8) In this ap- proximation no simple relation for the distortion integral-breadths angular order-dependence exists For not so large L however Eq (51) holds and approximations from Eqs (20) and (56) do not dif- fer much (see Fig 8)
1500 Warren- Averbach approximation ^
Delhez de Kcijscr and ^^^ Minemeijer approximation ^y^
^ 1000 A
500
mdashI
1 1
Oc 300 600 IL k^) X 10^
90
o ^ 60 A
30
1
J Warren- Averbach approximation
Delhez de Keijser and Minemeijer approximation
0 0 150 300
1L (A-1 ) X 10^
Fig 8 Mean-square strains pound^(L)) for two approximations of the distortion coefficient (upper) Voigt strain broadening (lower) pure-Gauss strain broadening
Generally it was shown that in the size-broad- ened profile the Cauchy part must dominate No similar requirement for the strain-broadened pro- file exists However experience favors the assump- tion that it has to be more of Gauss-type The Warren-Averbach approach is exact if strain broad- ening is purely Gaussian so Eqs (20) and (48) are
better approximations as strain profile is closer to the Gauss function In any case both approaches given by Eqs (20) and (56) are good up to the third power in strain and the Warren-Averbach relation [Eq (20)] does not assume that MSS are independent of distance L [27] it also represents a harmonic approximation
If at least two orders of reflection from the same plane (hkl) are available we can use Eqs (52) (53) (54) and (55) to calculate size-related and strain-related integral breadths Subsequent appli- cation of Eqs (37) (43) and (48) gives directly domain sizes (D) and (D)v and mean-square strains (e^(L)) This approach is more straightfor- ward and much simpler than the original Warren- Averbach analysis Great care should be given to the possible systematic errors The easiest way to observe the hook effect is to plot column-length distribution functions as a function of averaging distance L If they show negative values for small L (see Fig 6) all derived parameters will be in error This is because (i) only the positive values of the column-length distribution functions are numeri- cally integrated or (ii) the intercept on the L-axis of the linear portion of the A^ vs L curve is taken (see Fig 4) always larger values of domain sizes will be obtained than by the application of Eqs (37) and (43) Therefore we conclude that the dis- crepancy between integral-breadth and Fourier methods is always present by the appearance of the hook effect in the A^ vs L curve An analogous discrepancy exists between integral-breadth and variance methods [119] In such cases correction methods for truncation can be applied [35 119 120] but the best procedure is to repeat the pat- tern fitting with the correct background
In the Fourier analysis it is usually observed that the mean-square strains diverge as the averaging distance L approaches zero This also follows from Eqs (48) and (57) However because the MSS de- pendence on distance L is not defined in Warren- Averbach analysis it was suggested [27 107 121] that local strain can be obtained by taking the sec- ond derivative of the distortion coefficient or by a Taylor-series expansion of local strain Therefore we obtain from Eq (36)
i^m-M^-^) (58)
It is evident that this relation is wrong It holds only for a special case of pure-Gauss strain-broad- ened profile when the MSS are equal for any L Otherwise if the Cauchy function contributes to
334
Volume 98 Number 3 May-June 1993
Journal of Research of the National Institute of Standards and Technology
strain broadening all derivatives of strain in L = 0 are infinite and local strain can not be defined If the main origin of strains is dislocations [115] strains are defined after some distance from the dislocation (cutoff radius) to be finite Averaging strains over a region smaller than the Burgers vector is probably not justified For instance Eq (48) gives even for a small averaging distance L = 1 A and considerable strain broadening (J3DG(20) = 3DC(20) = 1O) root-mean-square strain eL = 1A))^ laquo02 that is about the elastic limit
45 Random Errors of Derived Parameters
Errors in size and strain analysis of broadened peaks are relatively difficult to evaluate Following Langford [26] sources of the systematic errors in- clude choice of standard specimen background and type of analytical function used to describe the line profiles The first two errors should be mini- mized in the experimental procedure Errors caused by inadequate choice of specimen function would systematically affect all derived results but they can not be evaluated Random errors caused by counting statistics have been computed by Wilson [122 123 124] and applied to the Stokes deconvolution method by Delhez de Keijser and Mittemeijer [23] as well as by Langford [26] and de Keijser et al [76] using single-line Voigt-func- tion analysis Nevertheless the approximate error magnitude can be calculated from estimated stan- dard deviations (esd) of the parameters refined in the fitting procedure In the program SHADOW the weighted least-squares error is minimized
7wp mdash RES
Here
)=1
RES = 2 vfi [ (obs) - (cal)]
(59)
(60)
and weights are the reciprocal variances of the ob- servations
H = l(obs) (61)
Each line profile has four parameters varied inde- pendently position intensity and Cauchy and Gauss integral breadths of the Voigt profile In least-squares refinement esds are computed as
^^ bu RES (62) m mdashm
Here ba are diagonal elements of the inverse matrix of the equation coefficients m is the number of observations and m is the number of refined parameters The main source of errors is integral breadths Errors in peak position peak intensity and background are much smaller and can be ne- glected in this simple approach For two indepen- dent variables )3G and Pc covariance vanishes and from Eqs (37) and (38) for the two orders of re- flection and +1 it follows that
RD =
si+i)m)RHMi))+si)m+i)i^(3c(+D)
(63)
ReL)r) =
pHDRHPcG)) + m + miPcJl + D) 2[3c(+1) - i8c()3+TTL [m+1) - mw
-n-LmiDRHihd))+m+mWcH+i))i ^ 2[)3c(+1) - iSc()+TTLim+1) - mw
(65)
Here Rx) are relative standard deviations The error in D would be complicated to evaluate but because 131D)s^(Igt)vlt2(pound))s Eq (63) gives a good estimation for the error in (Z))v as well Alter- natively to see how errors depend on the Fourier coefficients errors can be estimated from the Warren-Averbach relationship [Eq (20)] (86) From Eq (32) it follows that
RA (L)) = ATr^Lpos)R^2d)) +
4Lph(s)RPci2e)) (66)
Errors in root-mean-square strains and domain sizes are
i^((e^(L ))bulllaquo) =
RHA(Ll))+RHA(Ll + l)) (67)
ALl + l)
335
Volume 98 Number 3 May-June 1993
Journal of Research of the National Institute of Standards and Technology
^^laquo^))=(T^)
s(l + 1)RHA (Ll)) +SV)RHA (Ll + D) lsl + l)-sl)f (68)
Here (D) is approximately defined with A^(L) = l-L(D)j Errors in Fourier coefficients increase with L while factors in Eqs (67) and (68) lower the errors for large L In general errors of domain sizes and strains are of the same order of magnitude as errors of integral breadths [86]
5 Application 51 Correction for Instrumental Broadening
Before specimen broadening is analyzed instru- mental broadening must be determined This is ac- complished by carefully measuring diffraction peaks of some well-annealed defect-free speci- men It is then assumed that its broadening may be attributed only to the instrument The usual proce- dure is to anneal the specimen However in some instances that is not possible because either the material undergoes an irreversible phase transition on annealing or the number of defects can not be successfully decreased by annealing Another pos- sibility is to measure the whole diffraction pattern of the material showing the minimal line broaden- ing and then to synthesize the instrumental profile at the needed diffraction angle This approach re- quires the modeling of the angle dependence of the instrumental (standard) parameters Cagliotti Pao- letti and Ricci [125] proposed the following func- tion to describe the variation of the full width at the half maximum of profile with the diffraction angle
F9miA^(2e) = Utan^9 + Vtand + W (69)
Although this function was derived for neutron dif- fraction it was confirmed to work well also in x-ray diffraction case [126 127] A more appropriate function for the x-ray angle-dispersive powder dif- fractometer based on theoretically predicted er- rors of some instrumental parameters [128] may be the following [129]
FWHNf (2 e) = W+Vsin^l 6 +
UtanH + UcotH (70)
This function may better model the increased axial divergency at low angles and correct for the speci- men transparency [129] However contrary to the requirement on the specimen function most im- portant for the instrumental function is to correctly describe the angular variation of parameters re- gardless of its theoretical foundation
When specimen broadening is modeled with a Voigt function the simplest way to correct for the instrumental broadening is by fitting the line pro- files with the Voigt function too Cauchy and Gauss integral breadths of the specimen-broad- ened profile are then easily computable by Eqs (7) and (8) However because the instrumental broad- ening is asymmetric [24] modeling with the sym- metric Voigt function can cause a fictitious error distribution resulting in errors of strain up to 35 [76] Another approach is to model the instrumen- tal-broadening angle dependence by fitting the profile shapes of a standard specimen with some asymmetrical function split-Pearson-VII [95] or pseudo-Voigt convoluted with the exponential function [105] The instrumental function can then be synthesized at any desired angle of diffraction and convoluted with the assumed specimen func- tion to match the observed profile by means of Eq (2)
In the program SHADOW instrumental para- meters are determined by fitting the split-Pearson VII function (see Fig 9) to line profiles of a standard specimen
iix)=m- 2 m
with
c =-
mc^f
mm) mv-rim-12)
(71)
(72)
Here m = 1 or m = ltraquo yields a Cauchy or Gauss function respectively Refined full widths at half maximum (FWHM) and shape factors m for both low-angle and high-angle sides of the profiles are fitted with second-order polynomials To fit the FWHM we used Eq (69) and for the shape fac- tors
m(2e) = U(20f + V(2e) + W (73)
The resulting coefficients U V W U V and W permit synthesis of the asymmetrical instrumental line profile at any desired angle
336
Volume 98 Number 3 May-June 1993
Journal of Research of the National Institute of Standards and Technology
2 0(deg)
le
Fig 9 A split-Pearson VII profile The two half profiles have same peak position and intensity Adapted from Howard and Preston [4]
The basic requirement on the standard specimen is however to show as small a line broadening as possible To minimize physical contributions to the Une broadening of the standard specimen a few moments were emphasized as follows Because dif- fraction-line width depends strongly on degree of annealing it is preferable to use some reference powder-diffraction standard Furthermore asym- metry in the peak profiles is introduced by axial divergence of the beam flat specimen surface and specimen transparency [24] Choosing a standard specimen with low absorption coefficient would cause transparency effects to dominate If the stud- ied specimen has a large absorption coefficient (compared to the standard) this might produce a fictitious size contribution and errors in micro- strains All of the specimens studied have absorp- tion coefficients exceeding 1000 cm^ so a NIST standard reference material 660 LaBe was chosen to model the instrumental broadening (p = 1098 cm) According to Fawcett et al [130] LaBe showed the narrowest lines of all studied com- pounds Furthermore LaB6_has a primitive cubic structure (space group Pm3m) resulting in rela- tively large number of peaks equally distributed over 26 This allows for better characterization and lower errors of FWHMs and shape factors of split- Pearson VII functions (Fig 10)
52 Applicability of the Method
To study the applicability of method described in Sec 4 we first studied simple cubic-structure mate- rials such as silver and tungsten Tungsten has very narrow line profiles allowing us to obtain the up- per limit of domain sizes that can be studied Silver is easily deformed which provides a possibility to apply the method to broad line profiles To test the
009
-a
OH
006
003
1 1 m low-angle side n m high-angle side
bullz w 2 o OH
X
tancopy
Fig 10 Refined FWHMs and shape factors (exponents) m for low-angle and high-angle sides of LaBe line profiles Second- order polynomials were fitted through points
case of relatively complicated patterns and weak line broadening the method was also applied to Lai85Sroi5Cu04 and La2Cu04 powders In this sec- tion only the mechanical aspects of the line broad- ening are discussed Discussion about the origins of broadening of superconductors can be found in Sec 6
521 Silver and Tungsten Powders Figure 11 shows observed and refined peaks of tungsten un- treated and silver ground powders In Table 2 are listed results of fitted pure-specimen Voigt profiles for silver and tungsten specimens Table 3 and Fig 12 give results of the line-broadening analysis Untreated tungsten powder shows relatively weak broadening Instrumental profile FWHMs at angle positions of (110) and (220) tungsten lines are 0059deg and 0081deg respectively close to values mea- sured for tungsten 0065deg and 0100deg Results in Table 3 reveal that small broadening is likely caused by domain sizes because microstrains have negligible value This pushes the limit for measur- able domain sizes probably up to 4500-5000 A However one must be aware that weak specimen broadening implies higher uncertainty of all derived parameters Moreover the choice of the instrumental standard becomes more crucial
Both silver and tungsten line profiles become more Cauchy-like after grinding which probably increases dislocation density in the crystallites This is consistent with the presumption that small crystallites and incoherently diffracting domains separated by dislocations within grains affect the tails of the diffraction-line profiles [60115] Figure 13 illustrates the dependence of MSS on the recip- rocal of the averaging distance L
337
Volume 98 Number 3 May-June 1993
Journal of Research of the National Institute of Standards and Technology
C8
z
7- ^95
29 (deg) 405
bullJf^r-
z S 08
Ez U o u OS
a
04 bull
o Es
4P
2000 z^fA
4000
B
z u f- z
425 435 445 29 (deg)
455
yr 600 SOO
L(A)
Fig 11 Observed points (pluses) refined pattern (full line) and difference pattern (below) (110) W untreated (upper) (200) Ag ground (lower)
Fig 12 Fourier coefficients for the first- (pluses) and second- order (crosses) reflection and size coefficients (circles) [111] Ag untreated (upper) [100] Ag ground (lower)
Table 2 Parameters of the pure-specimen Voigt function as obtained from profile-fitting procedure for tungsten and silver powders
Specimen hkl 2ft(deg) 3c(deg) 3G(deg) FWHM(deg) Rwp()
W untreated 110 220
4028 8705
00065(7) 00301(6)
0020(2) ltio-
0021 0019
90 44
W ground 110 220
4029 8705
0100(2) 0222(3)
0038(4) 0069(6)
0080 0166
90 42
Ag untreated 111 222 200 400
3806 8151 4425 9786
0056(1) 0105(4) 0118(2) 0274(21)
ltio- 00008(21)
ltio-^ ltio-5
0036 0067 0075 0175
105 97
105 122
Ag ground 111 222 200 400
3807 8151 4424 9783
0175(3) 0410(26) 0365(10) 1079(82)
0038(12) ltio-
0076(29) ltio-
0121 0261 0250 0687
99 145 99
145
338
Volume 98 Number 3 May-June 1993
Journal of Research of the National Institute of Standards and Technology
Table 3 Microstructural parameters for tungsten and silver powders
Specimen Direction (poundgt)raquo( A) (2))v(A) ltpound^(fl3))laquo (^laquoD)v2)gtw
W untreated [110] 3200(200) 3500(200) 000038 000008(2)
W ground [110] 620(20) 1030(30) 00023 000054(2)
Ag untreated [111] [100]
1000(20) 510(20)
2000(20) 1030(20)
00010 00022
000024(1) 000047(5)
Ag ground [111] [100]
380(20) 210(10)
650(20) 350(20)
00047 00100
000095(7) 000180(14)
100 -_ - [100) Ag ground ^ ^~ mdash C1111 Ag ground ^bull
y y
o y ^ 50 A y
y y
y
0
y - y ^--
c ) 50 100 150
lLfAjxlO^
Fig 13 Mean-square strains (E^) as a function of VL
Errors in integral breadths allow estimation of errors in strain and size parameters (Sec 45) but in some cases the refinement algorithm gives unre- liable errors of integral breadths When a particu- lar parameter is close to the limiting value (for instance 10^ degrees has been put as the mini- mum value for integral breadths) errors become large However in Eqs (63) (65) (66) (67) and (68) only the product of integral breadth and ac- companying error is significant which is roughly equal for Cauchy and Gauss parts Errors of do- main sizes and strains are of the same order of magnitude as errors of integral breadths
The possible source of systematic error is poten- tial inadequacy of Voigt function to accurately de- scribe specimen broadening This effect can not be evaluated analytically but it would affect all derived parameters especially the column-length distribution functions The logical relationship be- tween values of domain sizes (see Table 3) for dif- ferent degrees of broadening indicates that possible systematic errors can not be large
Equation (41) allows computation of volume- weighted and surface-weighted average domain sizes if respective column-length distribution func- tions can be obtained Figure 14 gives surface- weighted and volume-weighted average column- length distribution functions following Eqs (39) and (38) Width of the distribution function deter- mines the relative difference between (D) and (pound))v The broader the distribution the larger the differences because small crystallites contribute more to the surface-weighted average That is much more evident comparing the surface- weighted column-length distribution with the vol- ume-weighted If they have similar shape and maximum position as in Fig 15 differences are small Conversely if the surface-weighted distribu- tion function has a sharp maximum toward smaller sizes differences are larger (see Fig 14) The dif- ference between (poundgt)s and (D)v and the actual mean dimension of the crystallites in a particular direction also depends strongly on the average shape of the crystallites [52 131 132]
If experimental profiles are deconvoluted by the Stokes method even for considerable specimen broadening size coefficients A ^ usually oscillate at larger L values [59 106] preventing computation of the column-length distribution function Few techniques were used to deal with this problem successive convolution unfolding method [32 133] smoothing and iterative methods [134 135 136 137] Figures 14 and 15 show very smooth column- length distribution functions However they follow from size coefficients ^4^ that depend on the accu- racy of the approximation for the distortion coeffi- cient given by Eq (47) Equation (47) is exact if the strain distribution is Gaussian but in general holds only for small harmonic numbers n if strain broadening is not negligible
339
Volume 98 Number 3 May-June 1993
Journal of Research of the National Institute of Standards and Technology
500 1000 L(A)
Fig 14 Surface-weighted and volume-weighted column-length distribution functions normalized on unit area [111] Ag un- treated (upper) [100] Ag ground (lower)
Fig 15 Surface-weighted and volume-weighted column-length distribution functions for [010] La2Cu04 normalized on unit area
522 La2-xSrtCu04 Powders To test the applicability of the discussed method to more com- plicated patterns two compounds with lower crystallographic symmetry were studied Lai85Sroi5Cii04 has a tetragonal K2NiF4-type struc- ture space group lAlmmm La2Cu04 is orthorhom-
bic at room temperature Both compounds show slight line broadening and relatively highly overlap- ping peaks (see Fig 16) which makes it very diffi- cult if not impossible to perform a Stokes analysis
25
-25
26 (deg)
yNraquo-
Fig 16 Observed points (pluses) refined pattern (full line) convoluted profiles (dashed line) and difference plot (below) for part of La2Cu04 pattern
Tables 4 and 5 list results from the fitting proce- dure and the analysis of specimen-broadened inte- gral breadths There are no qualitative differences in results for tungsten and silver powders How- ever average errors are higher as expected be- cause of overlapping peaks while weighted errors wp are surprisingly smaller This fact illustrates the unreliability of iwp when only a segment of the pat- tern is being refined because it depends on the number of counts accumulated in points as well as on the 28 range of the refinement
Figures 17 and 18 represent Fourier coefficients of Lai85Sroi5Cu04 [110] and La2Cu04 [010] direc- tions In the second plot the A (L )-versus-L plot shows a concave-downward part near L =0 the so- called hook effect It was shown in Sec 42 that the hook effect originates because of underesti- mation of background connected with the trunca- tion of profiles In the profile refinement all peaks separated less than 4deg 20 have been included in the refinement region to avoid possible overlapping of peak tails and specimen profiles have been trun- cated below 01 of the maximum intensity How- ever because the polynomial background was determined prior to profile refinement it may be overestimated for complicated patterns containing many overlapping peaks If background is refined with other profile parameters undesirable correla- tion with integral breadths occurs
340
Volume 98 Number 3 May-June 1993
Journal of Research of the National Institute of Standards and Technology
Table 4 Parameters of the pure-specimen Voigt function as obtained from profile-fitting procedure for La2-^SrCu04 powders
Specimen hid 2Hdeg) Pen PcO FWHM(deg) Rp()
Lai85Sroi5Cu04 004 2695 0046(4) 0024(8) 0042 34 006 4092 0083(5) ltio-= 0053 62 110 3352 0110(5) ltio- 0070 125 220 7046 0171(9) ltio- 0109 43
La2Cu04 004 2713 0061(8) 0045(9) 0067 39 006 4119 0124(7) ltio-^ 0079 77 020 3316 0074(10) 0078(10) 0102 29 040 6957 0210(30) 0026(81) 0135 29 200 3345 0074(8) 0061(10) 0087 69 400 7028 0130(10) 0023(95) 0089 29
Table 5 Microstructural parameters for Laij(5Srai3Cu04 and La2Cu04 powders
Specimen Direction (DUA) Pgt(A) lte^(fl3))laquo lte2((Z)gt2))laquo
Lai83Sro5Cu04
La2Cu04
[001] [110]
[001] [010] [100]
1700(300) 470(20)
1100(100) 680(50) 680(50)
2000(200) 940(20)
1200(100) 760(50) 810(50)
00024 00017
00038 00033 00016
000049(9) 000044(6)
00008(1) 00007(2) 00003(3)
c i ^- raquo sect 08 bulli - U
^0
ti- bull ll bull bullbullo
ffl M P bull- u ^ Di 04 Si - M bulldiamsbullbull a bull-v 3 o ^^=s^
u ^N^Sraquoraquo^
0 ^^^aaaa 1000
L(A) 2000
OQ bullbulldego UM o z a 08
o o bull bull bull
- u u bull raquo UU bull
a diams o bull o u ft 04 bull deg raquo deg - U bull bull deg Oi bullbullgt =3 bull- l o k u
0 bullbullbullraquo aaaMMi
500 1000
L(A)
Fig 17 Fourier coefficients for the first- (pluses) and second- order (crosses) reflection and size coefficients (circles) for [110] Lai^Sroi5Cu04
Fig 18 Fourier coefficients for first- (pluses) and second- order (crosses) reflection and size coefficients (circles) for [010] La2Cu04
341
Volume 98 Number 3 May-June 1993
Journal of Research of the National Institute of Standards and Technology
S3 Comparison with the Integral-Breadth Methods
Knowing the specimen integral breadths simpli- fied methods can be applied In Sec 212 we re- viewed multiple-line and single-line integral- breadth methods We shall compare the simplified multiple-line methods [Eqs (23) (24) and (30)] and the single-line method [76] [Eqs (29) and (30)] with results obtained for silver tungsten and La2-xSrxCu04 powders (Tables 3 and 5) We did not compare with the multiple-line Voigt-function method [26] because it was shown in Sec 44 that it is incompatible with the Warren-Averbach analy- sis In Table 6 integral breadth Pi was computed according to Eq (11) This value was compared with )8A integral breadth computed from Fourier coefficients [58]
i8A=- laquo3 2^(L)
(74)
Results obtained by the Warren-Averbach analysis are significantly smaller for both size and strain Integral-breadth methods give the upper limit for strain so comparison is limited Considering the approximation e = 125e^(L))^ [138] with L=(D)v2 or L=(D)s2 strains resemble more closely than crystallite sizes It must be noted how- ever that this approximation makes sense only in the case of pure-Gauss strain broadening Benedetti et al [106] reported excellent agreement for both size and strain using Warren-Averbach and Cauchy-Gauss [Eq (24)] methods Results from Table 6 on the contrary indicate that the Gauss-Gauss approximation gives values closest to the Warren-Averbach method for crystallite sizes whereas the Cauchy-Gauss and especially the Cauchy-Cauchy approximation tend to give too large values For strain the trend is opposite The Cauchy-Cauchy approximation resembles most
Table 6 Comparison of results obtained with the integral-breadth methods Cauchy-Cauchy (C-C) Cauchy-Gauss (C-G) Gauss- Gauss (G-G) and single-line (S-L) analysis
Specimen hkl PiXKP PAXKP ltigt)v (Z)gt(A) (e^((DV2)gt2 eXlO^ (A-) (A-0 (A) C-C C-G G-G S-L xlO^ C-C C-G G-G S-L
W untreated 110 220
0259 0247
0259 0247
3500 3700 3810 3810 14500 4040
008 -001 -003 -005 024 0
W ground 110 220
125 204
125 205
1030 2240 1450 1220 940 550
054 090 093 105 045 032
Ag untreated 111 2
0600 0901
0600 0900
2000 3340 2390 2190 1670 1110
024 035 039 095 0 0
200 124 124 1030 2270 1470 1230 810 047 082 085 095 0 400 204 204 490 0
Ag ground 111 222
198 352
200 352
650 2080 1240 910 530 280
095 179 182 197 048 0
200 403 406 350 9380 4780 1320 260 180 405 405 408 082 400 803 803 120 0
Lai85Sroi3Cu04 004 006
0657 0881
0650 0880
2000 5230 3290 2660 1970 1140
049 076 078 088 044 0
110 119 119 940 1240 1000 970 840 044 052 064 080 0 220 158 158 630 0
La2Cu4 004 006
0988 132
0998 131
1200 2980 1940 1630 1490 760
08 107 112 127 081 0-
020 143 142 760 1200 910 860 1240 07 079 090 110 114 040 198 200 510 016 200 126 124 810 810 810 810 1250 03 002 011 015 089 400 1S 126 830 014
Not possible to evaluate because of too small Gauss integral breadth
342
Volume 98 Number 3 May-June 1993
Journal of Research of the National Institute of Standards and Technology
closely a Warren-Averbach method These results concur with the Klug and Alexander [24] compari- son of the published size and strain values obtained by Warren-Averbach (Stokes) and integral-breadth methods However for x-ray diffraction the Cauchy-Gauss assumption for the size-strain broadening is theoretically and experimentally more favored thpoundm the other two models The fact that the Gauss-Gauss method for crystallite size and the Cauchy-Cauchy method for strain give more realistic results may mean that the presump- tion that size and strain broadening are exclusively of one type is an oversimplification
The single-line method seems much less reliable If Gaussian breadth is very small no information about strain is obtained Moreover second-order reflections give much lower values of both size and strain than do basic reflections However if multi- ple reflections are not available the single-line method can give satisfactory estimations
54 Reliability of Profile Fitting
The profile fitting of a cluster of even severely overlapping peaks can be accomplished with a low error and excellent fit of total intensity But how reliable is information obtained about separate peaks in the cluster In the fitting procedure it is possible to put constraints on the particular profile parameter to limit intensity position and width of the peak If anisotropic broadening or different phases are present constraints may not be realistic Morever acceptable results can be obtained even using a different number of profiles in refinement [4] Hence the first condition for the successful ap- plication of this method is knowledge of actual phases present in the sample and their crystalline structures
In this regard two powders were measured or- thorhombic Lai94Sroo6Cu04 has a slightly distorted K2NiF4-type structure (space group Bmab a =53510(2) A b =53692 A(2) c = 131931(7) A) and tetragonal Lai76Sro24Cu04 (space group I4mmm a =37711(3) A c = 132580(8) A) Data were collected for each specimen separately and for a specimen obtained by mixing the same pow- ders Because diffracted intensity of each phase was lower for the mixture counting time was pro- portionally increased to obtain roughly the same counting statistics Figure 19 shows two partially separated orthorhombic (020) (200) and (040) (400) peaks overlapped with tetragonal (110) and (220) reflections During the profile fitting of the mixed powders (200) orthorhombic peak tended to disappear on account of neighboring (020) and
(110) reflections Its intensity was constrained to vary in range plusmn 30 of (020) peak intensity which can be justified if the crystallographic structure is known
60
-60
345
345
335 29 (deg)
345
Fig 19 (upper) Lai76Sro24Cu04 (110) peak (middle) Lai94Sroo6Cu04 (020) and (200) peaks (lower) (110) (020) and (200) peaks
Table 7 contains results of fitted specimen-Voigt functions as well as size and strain values obtained by the analysis of broadening Comparing integral breadths of the starting and mixed powders some profiles change from more Cauchy-like to Gauss- like and vice versa This is especially evident for the (400) reflection meaning that accurate deter- mination of the profile tails is indeed affected in the cluster of overlapping peaks However integral breadth does not change significantly so results of
343
Volume 98 Number 3 May-June 1993
Journal of Research of the National Institute of Standards and Technology
Table 7 Comparison between two specimens run separately and mixed togetlier
Specimen hkl 2Hdeg) )3cO PoO DUA) (D)v(A) (e2laquoD)v2))laquoxlO
Lai76Sroj4CuOr 110 3369 0058(6) 0094(7) 780(60) 850(60) 10(1) 220 7073 022(2) 013(2)
LaiMSro(KiCu04 020 3342 0084(9) 055(14) 500(90) 1000(200) 07(1) 040 7012 010(2) 014(1) 200 3353 00216(85) 0061(8) 1100(100) 1200(100) 03(1) 400 7040 0026(11) 0088(8)
Mix 110 3367 0083(21) 0064(14) 800(300) 1200(300) 08(3) Lai76Sro24Cu04 220 7072 019(7) 013(4)
+ 020 3343 0066(35) 0070(23) 800(300) 1000(300) 07(4) Lai94Sroo6Cu04 040 7012 0116(93) 013(5)
200 3354 0024(156) 0071(61) 900(700) 1000(600) 04(12) 400 7041 011(2) 0003(320)
the multiple-line methods are not much influenced On the contrary the single-line method gives quite different results This may support the conclusion of Suortti Ahtee and Unonius [43] that the Voigt function fails to account properly for size and strain broadening simultaneously if only Cauchy integral breadth determines crystallite size
Table 7 shows that the results of Warren- Averbach analysis of starting and mixed powders agree in the range of standard deviations How- ever errors are much larger especially for the hid- den (200)-(400) reflections From Eq (62) it follows that more counts (longer counting times) and more observables (smaller step-size) would lower standard deviations Therefore in the case of highly overlapping patterns to obtain desirable ac- curacy much longer measurements are needed al- though that will not change the fact that higher overlapping implies intrinsically higher errors of all refinable parameters To further minimize possible artifacts of the fitting procedure it is desirable to include in the analysis as many reflections in the same ciystallographic direction as possible
55 Remarks
By modeling the specimen size and strain broad- ening with the simple Voigt function it is possible to obtain domain sizes and strains that agree with experiment and show a logical interrelationship Furthermore the Voigt function shows the correct 1A(26y asymptotic behavior of peak tails as ex- pected from kinematical theory [139] However if the specimen profile is significantly asymmetric (because of twins and extrinsic stacking faults [140 59]) or the ratio FWHM^ is not intermediate to the Cauchy (2Tr) and Gauss (2(ln27r)^) functions then the Voigt function can not be applied [25]
Suortti Ahtee and Unonius [43] found good over- all agreement by fitting the Voigt function to the pure-specimen profiles of a Ni powder deconvo- luted by the instrumental function However more accurate comparison is limited because of unavoid- able deconvolution ripples of specimen profiles Furthermore the Voigt function might not be flex- ible enough to model a wide range of specimen broadening as well as the different causes of broadening Therefore the question whether the Voigt function can satisfactorily describe complex specimen broadening over the whole 20 range in a general case needs further evaluation
This method of Fourier analysis with the as- sumed profile-shape function is most useful in cases when the classical Stokes analysis fails there- fore when peak overlapping occurs and specimen broadening is comparable to instrumental broaden- ing It was shown that for a high degree of peak overlapping the fitting procedure can give unreli- able results of Gauss and Cauchy integral breadths that is the peak can change easily from predomi- nantly Cauchy-like to Gauss-like and contrary This can lead to illogical values of size-integral and strain-integral breadths according to Eqs (52) (53) (54) and (55) and to irregularities in the be- havior of Fourier coefficients for large L Simulta- neously if the size-broadened profile has a large Gauss-function contribution the hook effect will occur However volume-weighted domain sizes D)y and MSS eL)) for small L are much less affected because they rely on both Cauchy and Gauss parts of the broadened profile Any integral- breadth method that attempts to describe the size and strain broadening exclusively by a Cauchy or Gauss function in this case fails completely For specimens with lower crystallographic symmetry
344
Volume 98 Number 3 May-June 1993
Journal of Research of the National Institute of Standards and Technology
when many multiple-order reflections are avail- able but the peaks are overlapped it is therefore desirable to include in the analysis as many reflec- tions as possible to minimize the potential artifacts of the fltting process
6 Analysis of Superconductors 61 (La-M)2Cu04 Superconductors
Bednorz and Miiller [16] found the first high- temperature oxide superconductor in the La-Ba- Cu-O system Soon after substituting Ba with Sr and Ca Kishio et al [17] found superconductivity in two similar compounds Later many compounds with much higher transition temperatures (Tc) were found The (La-M)2Cu04 system remains favorable for study because the cation content responsible for the superconductivity is easier to control and measure than the oxygen stoichiometry Also this system provides a wide range of substitutional cation solubility in which the tetragonal K2NiF4- type structure is maintained Compared with much- studied Y-Ba-Cu-O this structure is simpler because it contains only one copper-ion site and two oxygen-ion sites
The undoped compound La2Cu04 is orthorhom- bic at room temperature It becomes superconduct- ing either with cation substitution on La sites or increased oxygen content to more than four atoms per formula unit Doping with divalent cations in- creases the itinerant hole carriers in the oxygen- derived electron band [141] which probably causes the superconductivity However different dopants influence the transition temperature Tc Although the unit-cell c-parameter simply reflects ionic dopant size [142] the in-plane unit-cell parameter (and accordingly the Cu-0 bond length) correlates with Tc for different dopants and for different dop- ing amounts [142 143]
LaiB5MouCu04 (M = Ba Ca Sr) have a tetrago- nal K2NiF4-type structure space group lAlmmm with four atoms in the asymmetric unit [117] One site is occupied with La partially substituted with dopant ions (Fig 20) La2Cu04 is orthorhombic at room temperature The best way to correlate these two structures is to describe La2Cu04 in space group Bmab the c axis remains the same tetrago- nal [110] and [110] directions become [010] and [100] orthorhombic axes and size of the unit cell is doubled [144]
Figure 21 shows parts of the x-ray diffraction patterns observed and refined of Lai85Moi5Cu04 (M = Sr Ba Ca) and La2Cu04 Refined lattice
parameters are given in Table 8 Table 9 shows resuhs of the line-broadening analysis Relatively
La(BaCaSr)
0(2)
0(1)
Fig 20 Ciystal structure of (La-M)2Cu04 showing one unit cell
300 JUU
(b)
200
100
U 0 M J Js-r-^
30
-30
300
40 41 42 43 44 45 40 41 42 43 44 45 29 (deg) 29 (deg)
mdashA-
gt t 200
Z
F-
- 100
(c)
f V kgt ii I 40 41 42 43 44 45 40 41 42 43 44 45
e (deg) ^^ 26 (deg)
-30 wwX mdash Wlaquo-
Fig 21 Diffraction patterns of LaiH5Moi5Cu04 specimens (a) M=Sr (b) M = Ba (c)M = Ca (d) M = U
345
Volume 98 Number 3 May-June 1993
Journal of Research of the National Institute of Standards and Technology
Table 8 Lattice parameters and T^ at zero resistivity (Ac method at 10 Ma current)
Specimen a (A) bk) c(A) rc(K)
Lairaquo5Sroi5Cu04 377814(7)
Lairaquo3Baoi3Cu04 37846(2)
LaiiijCaoi5Cu04 37863(7)
La2Cu04 53558(2) 54053(2)
231(2) 36
288(4) 28
17(2) 19
1451(8)
Table 9 Results of line-broadening analysis for (La-M)2Cu4 specimens
Specimen hkl PcO PoO (DUk) (Iraquo)(A) lte^((D)2))
Lai(laquoSroj5Cu04 004 006
0046(4) 0083(5)
0024(8) ltio-
1700(300) 2000(200) 000049(9)
110 0110(5) ltio- 470(20) 940(20) 000044(6) 220 0171(9) ltio-
Lai85Baoi3Cu04 004 006
0049(6) 0110(7)
0076(6) 0089(9)
1100(200) 1100(100) 00011(2)
110 0087(4) 000042(6) 560(20) 1110(20) 000024(5) 220 0116(3) ltio-5
Laiji5Caoi5Cu04 004 006
0120(13) 0146(12)
0032(22) 0033(27)
440(70) 780(90) 00007(4)
110 0045(25) 0200(19) 340(30) 360(20) 00013(2) 220 0343(22) ltio-
La2Cu04 004 006
0061(8) 0124(7)
0045(9) ltio-
1100(100) 1200(100) 00008(1)
020 0074(10) 0078(10) 680(50) 760(50) 00007(2) 040 0210(30) 0026(81) 200 0074(8) 0061(10) 680(50) 810(50) 00003(3) 400 0130(10) 0023(95)
weak peak broadening was observed which can not be attributed to the proximity of the phase trans- formation Lai85SroisCu04 is tetragonal down to = 170 K [145] Lai85Baoi5Cu04 to 140 K [146147] and Lai85Caoi5Cu04 to 130 K [148] Another possi- ble reason for peak broadening might be continu- ous compositional variations in dopant content The scanning Auger microprobe analysis of La2-SrtCu04 compounds [149] showed that grain- boundary segregation of Sr is weak and limited to a narrow region near the grain surface In the case of the separation of two phases with different Sr con- tent and similar lattice parameters asymmetry of some reflections would be observed [150] More- over in the case of compositional inhomogeneity microstrains eL)) would be roughly independent of the averaging distance L in the grains [151] therefore distribution of strains would be Gaus- sian For all specimens microstrain behavior is identical it decreases linearly with distance L
Rothman and Cohen [115] showed that such be- havior of microstrains is caused by dislocations that might arise during grinding Assuming the same applied stress microstrain would be approximately inversely proportional to the elastic moduli of these materials If mean microstrain is defined as the arithmetic average of strains for the [001] and [110] directions results agree with values of the Youngs moduli for polycrystalline La2Cu04 Lai85Moi5Cu04 (M = Sr Ba Ca) [152] However other factors may contribute to the microstrain Coordination-6 ionic radii of La^+ Sr Ba^+ Ca^+ are 106 116 136 100 A respectively [153] Substitution of La with ions of different sizes affects the lattice parameter [142] and may cause much larger strains in the [001] direction when some of the ions are replaced with Ba^ than with Sr^ in accord with results in Table 9 Substitution of Ca^^ ions produces an entirely different effect microstrains in the [110] direction are larger This may be explained by
346
Volume 98 Number 3 May-June 1993
Journal of Research of the National Institute of Standards and Technology
comparing effects of substitutional ions on the unit-cell a -parameter The Ba-doped specimen has a larger a-parameter than the Sr-doped but the Ca-doped a-parameter is largest although Ca^^ has the smallest ionic size This should increase the cell distortion in the a-b plane
Table 9 reveals high anisotropy in these materi- als consistent with other physical properties such as thermal expansion [154] and upper critical mag- netic field [155] Differences of domain sizes might arise from a layered structure in the [001] direction and consequently easy incorporation of stacking faults between regularly stacked layers The stack- ing-fault and twin-fault probabilities can be esti- mated from the average surface-weighted domain sizes [59]
^ = TAN + cf1fun(aa) (75) m im - (D)
Here c is a constant for the particular [hkl] direction and fun(a a) a linear combination of stacking-fault probability and twin-fault probability a The exact form of Eq (75) was derived only for the cubic and hexagonal crystal structures On con- dition that the true domain dimension D is isotropic or so large that the second term of Eq (75) dominates a linear function of stacking-fault and twin-fault probability is
fun(aa) = c( 1
) (76) Zgt)J (Dgttrade
Here c denotes a constant that depends only on geometrical factors and is the same for all three doped compounds
Figure 22 shows a possible correlation between Tc and fault-defect probabilities computed from TEM observations of La2-jcSrCu04 revealed that stacking-fault density increased with Sr content up to jc = 015 [156] That study suggests that a shear mechanism forming the fault-boundary dislocations implies oxygen vacancies andor cation deficiency We did not measure oxygen content but neutron- diffraction studies showed that oxygen deficiency starts to appear at much higher Sr content [157] However the increase of fault probability with the simultaneous decrease of microstrain in Fig 22 supports the assumption that defects are intro- duced to accommodate lattice strains [156] A simi- lar increase in Te was found in Y2Ba4Cu802o-laquo thin films [158] Compounds with asymmetric broad- ened and shifted peaks showed higher Tc which
was attributed to stacking faults Although extrinsic stacking faults may cause asymmetric peak broad- ening [140] it is probably caused by twinning Twinning in La-M-Cu-0 materials is less abundant than in Y-Ba-Cu-O compounds but it was ob- served in (La-Sr)2Cu04 monocrystals on (110) planes [159] In the profile-fitting procedure peak asymmetry is incorporated only in the instrumental function therefore we could not model asymmetric peak broadening However any significant asym- metry of the specimen profile would cause an un- even fit of low-angle and high-angle sides of peaks which was not observed This gives much more im- portance to stacking faults in Eq (76)
Fig 22 Arithmetic average of [110] and [001] root-mean- square strains and linear function of stacking-fault and twin- fault probabilities as a function of Tc
In Fig 22 average microstrains defined as the arithmetic average of [001] and [110] directions correlate inversely with Tc However we did not find a correlation of Tc and microstrains in a partic- ular direction [001] microstrains simply reflect dif- ference in size of dopant and host La^ ions (see Table 9)
In La2Cu04 (OkO) reflections are significantly broader than (hOO) This has also been observed in low-temperature orthorhombic Lai85Sroi5Cu04 and Lai85Baoi5Cu04 [160] and explained by either stacking faults or possible lower symmetry Our results reveal that domain sizes (D) have identical values for [010] and [100] directions (Table 9) From Eq (76) it follows that stacking-fault proba- bilities in these directions have the same values However microstrains in the [010] direction are roughly twice as large as in the [100] direction which is responsible for the different broadening In the case of doped La2Cu04 compounds different microstrains might be caused by oxygen
347
Volume 98 Number 3 May-June 1993
Journal of Research of the National Institute of Standards and Technology
vacancies ordered along one direction in the a-b plane similar to effects found in YBa2Cu307-laquo However undoped La2Cu04 is not expected to have significant o^Qgen deficiency Other possibili- ties are lower ciystallographic symmetry andor La vacancies although they were not reported for this system but La deficiency was found in an La2Co04 compound [161]
We can conclude that lattice strains and incoher- ently diffracting domain sizes confirm high an- isotropy in these materials This simple approach however does not allow unambiguous identifica- tion of the strains origin Probably the strains originate from dislocations and from different sizes of host and dopant ions Domain sizes of all com- pounds are larger in the c-direction than in the a-6 plane This indicates existence of stacking faults and twins However because estimated errors are relatively large and only three materials were stud- ied the possible connection between stacking faults and 7c needs further study
62 Bi-Cu-O Superconductors
Among the high-Tc superconductors the Bi- Cu-O compounds appear intriguing especially because their incommensurate structure modula- tion remains incompletely understood [162 163] The crystal structure consists of perovskite-like SrO-(Cu02Ca)mi-Cu02-SrO layers separated by NaCl-like BiO double layers (see Fig 23 [164]) The number m of Cu02 layers alters the supercon- ducting transition temperature Tc (for m = 12 and 3 rclaquo10 90 and 110 K respectively) This two- dimensional layered structure makes these materi- als highly anisotropic and favours the creation of defects
Bulk sintered specimens showed relatively weak peak broadening Moreover the diffraction pat- terns contained many overlapping peaks because the compound crystallizes in an orthorhombic low- symmetry space group A2aa [165] and incommen- surate modulation gives superlattice reflections All patterns revealed a strong [001] texture (Fig 24) making reflections other than (001) difficult to ana- lyze The lattice parameters vary depending on the exact compound stoichiometry and processing his- tory but characteristically they have almost identi- cal a and b parameters and large c parameter fl =54095 A 6=54202 A c =309297 A for Bi2Sr2CaCu208 (Bi-2212 [166] and A =5392 A b =5395 A c =36985 A for (BiPb)2Sr2Ca2Cu30io (BiPb-2223) [165] Thus we treated (hOO) and (0^0) reflections as single peaks Table 10 gives the
results for three specimens Bi-2212 (BiPb)2 (SrMg)2(BaCa)2Cu30io (BiPbMgBa-2223) which were one-phase specimens and BiPb-2223 con- taining approximately equal amounts of 2212 and 2223 phases The in-plane lattice parameters of 2212 and 2223 phases differ little hence only the [00] directions of the mixed-phase specimen were evaluated
b^ (c)
Fig 23 Average crystal structure of Bi2Sr2Cam-iCum04+2m for (a) m = 1 (b) w =2 (c) m =3 [164]
35
-35
42 44 46 48 50 52 54 56 58 60 62 26 (deg)
^ ^^^MK^Aa^Ndllaquop
Fig 24 Part of BiPbMgBa-2223 refined pattern There are 48 fundamental reflections in this region
Interpretation of the results in the case of these complicated compounds must be considered care- fully Microstrains are probably caused by disloca- tion arrays However substitution of different-sized ions and vacancies would also contribute to the strains as would other kinds of disorder especially
348
Volume 98 Number 3 May-June 1993
Journal of Research of the National Institute of Standards and Technology
Table 10 Results of line-btoadening analysis for Bi-Cu-O supreconductors
Specimen Phase hkl (A)
eD)sa)y^
Bi-2212 2212 008 0012
0163(8) 022(3)
001(6) 005(6)
420(80) 00021(6)
020+200 0104(4) ltio-^ 580(30) 00007(1) 040+400 018(2) 00004(6300)
BiPbMgBa-2223 7773 0010 0020
0097(1) 021(2)
00002(1700) 0007(150)
770(60) 00012(1)
020 + 200 012(27) 013(10) 380(430) 00009(71) 040 + 400 015(95) 021(33)
BiPb-73 2212 008 0012
023(2) 025(5)
0002(350) 0001(1000)
220(30) 00013(26)
2223 0010 0020
022(8) 023(99)
0092(67) 018(47)
230(190) 00012(197)
Stacking faults and twins Table 10 shows larger strains in the [001] direction that in the basal plane This can be explained by stacking disorder along the c-axis which was frequently observed in electron-diffraction patterns as streaking [167 168] Easy incorporation of stacking faults is possi- ble because of the two-dimensional weak-bonded layers (BiO double layers are spaced about 3 A apart) The difference in microstrain between in- plane and the c-direction is much smaller for the BiPbMgBa-2223 phase probably because Pb low- ers the faulting by stabilizing the higher-Tc 2223 phase [167] For the BiPb-2223 specimen with two phases there are two possibilities Either the speci- men consists mainly of a mk of two kinds of one- phase grains or both phases occur within the same grains The second possibility was confirmed exper- imentally [169 170] and our results concur be- cause microstrain in the 2212 phase is much smaller than in the one-phase Bi-2212 specimen Processing conditions and cation content probably favour development of the macroscopic inter- growth of both phases within the grains that is microscopic defects grow to sufficiently large re- gions to give a diffraction pattern of another phase with the different number of Cu02 layers As a re- sult strain is relieved and both strains and domain sizes being quite different in one-phase specimens tend to equalize
For the Bi-Cu-O specimens the mean surface- weighted domain sizes are generally smaller than for (La-M)2Cu04 compounds Therefore the com- putation of the stacking- and twin-fault probabili- ties by using Eq (75) may be wrong It would be very instructive to compare the different broaden-
ing of satellite and fundamental reflections which indicates a more pronounced stacking disorder in the modulated structure [171]
In summary we found that for both Bi-2212 and BiPbMgBa-2223 superconductors the c-axis strain exceeds the in-plane strain The BiPb-2223 specimen containing both 2212 and 2223 phases within the single grains shows smaller incoherently diffracting domains and lower c-axis strain than the one-phase specimens This fact may direct us to- ward the mechanism of the second-phase forma- tion in these materials
63 Remarks
It was shown that this particular method of the line-broadening analysis can give information about the size of incoherently diffracting domains and lattice strains in (La-M)2Cu04 and Bi-Clu-O superconductors Moreover results show high an- isotropy of both size and strain parameters as one may expect because of the layered structure of all superconducting cuprates Generally structural line broadening is not large that is a result of rela- tively large domain sizes (200-2000 A) and small strains (002-02) It is interesting to compare these values with the published results for YBa2Cu307-laquo (isotropic strains of 023 [77] and 005-03 [82]) Although the different materi- als were studied they seem too large especially be- cause they are the average of strains in different directions
The main drawback of the line-broadening the- ory is the uncertainty about the origins of the line broadening that is it is difficult to distinguish the main effects responsible for the broadening For
349
Volume 98 Number 3 May-June 1993
Journal of Research of the National Institute of Standards and Technology
the novel superconductors particularly the numer- ous defects (substitutions vacancies stacking faults dislocations and similar) can occur simulta- neously which makes it very difficult to determine their individual contributions Furthermore the crystal structures of most novel superconductors are relatively complicated The average structure has mostly a slightly distorted tetragonal symmetry very similar a and b lattice parameters and a large c parameter but c=36 for YBa2Cu307-laquo for in- stance This results in a large number of overlap- ping peaks and consequently in large errors of all results This showed especially in the case of Bi-Cu-O superconductors (see Table 10) Follow- ing the discussion of reliability of profile fitting in Sec 54 it would be desirable to include more than two reflections in the analysis of broadening but higher-order peaks are usually too weak and over- lapped One way to partially solve this problem would be a whole pattern fitting [172 173] and Rietveld structure refinement [23] in terms of size and strain parameters This requires an accurate preset function to model specimen broadening and precise definition of angular dependence of size and strain parameters The Rietveld programs that model the line broadening in terms of size and strain parameters are based either on the simpli- fied integral-breadth methods [78 95] or on the single-line method [174]
7 Conclusions
A method for analyzing the pure-specimen (structural) broadening of x-ray diffraction line profiles is proposed By modeling the specimen size and strain broadenings with the simple Voigt func- tion it is possible to obtain domain sizes and strains that agree with experiment and show a logi- cal interrelationship Furthermore some common consequences and problems in the Fourier-method analysis follow easily The specimen function is convoluted with the instrumental function to match the observed x-ray diffraction-line profile This avoids the Stokes deconvolution method thus al- lowing analysis of patterns with highly overlapping peaks and weak structural broadening Therefore the method was applied to some novel high-Tc superconductors We reached the following conclu- sions
(i) Surface-weighted domain size depends only on the Cauchy integral breadth of the size-broad- ened profile
(ii) The hook effect occurs when the Cauchy-content of the size-broadened profile is un-
derestimated that is for ^sc(n2)^3sG Usually this happens when the background is estimated too high so the long tails of the Cauchy function are prematurely cut off
(iii) It also follows from conclusion (ii) that the volume-weighted domain size can not be more than twice the surface-weighted domain size (limiting value D)v=2D)i is obtained for the pure-Cauchy size-broadened profile) Minimum value for D)J (D)j should not be less than -131
(iv) If the distortion coefficient is approxi- mated with a harmonic term this leads exactly to the Warren-Averbach method of separation of size and strain broadenings
(v) In that case mean-square strains decrease linearly with the distance L
(vi) It is possible to evaluate local strain ((e^(0))^) only in the case of pure-Gauss strain broadening Then root-mean-square strain is inde- pendent of the distance L and related to the upper limit of strain obtained from the integral breadth of the strain-broadened profile
(vii) If strain broadening is not described exclu- sively with the Gauss function the multiple-line Voigt integral breadth and Warren-Averbach analyses can not give the same results for volume- weighted domain size although D)v is defined identically in both approaches because the appar- ent strain -q = pdeg(29)cot9 is not angular- independent
(viii) Smooth size coefficients give column- length distribution functions without oscillations and make possible a computation of volume- weighted average domain sizes up to ~5000 A
(ix) Comparison with the simplified integral- breadth methods in most cases has shown not large but systematic discrepancy of results indicat- ing that size and strain broadening can not be accu- rately modeled by a single Cauchy or Gauss function Moreover the application of the single- line method is much less reliable and it should not be used where multiple reflections are available
(x) The knowledge of all phases present in the sample and their crystallographic structure is re- quired to successfully fit a cluster of overlapping peaks Although it is very difficult to accurately de- termine the Cauchy-Gauss ratio of an overlapped peak final results of domain size and strain are much less affected Therefore connecting the crys- tallite size exclusively with the Cauchy content and strain with the Gauss content of a specimen profile might be doubtful
(xi) Evaluated errors of domain sizes and strains increase substantially with the degree of
350
Volume 98 Number 3 May-June 1993
Journal of Research of the National Institute of Standards and Technology
peak overlapping Hence for complicated patterns very accurate measurements are necessary and one needs to analyze as many reflections in the same crystallographic direction as possible
(xii) Line-broadening analysis of (La-M)2Cu04 and Bi-Cu-O compounds confirms high anisotropy in these materials
(xiii) Strains in (La-M)2Cu04 probably origi- nate from dislocations and from different sizes of host and dopant ions
(xiv) Stacking-fault probability in (La-M)2Cu04 (M = Ba Ca Sr) increases with increasing Tc whereas the average strain decreases
(xv) In La2Cu04 different broadening of (lOO) and (OfcO) reflections is not caused by stacking faults
(xvi) All Bi-Cu-0 superconductors show larger strain in the c-direction than in the a-b plane which can be explained by stacking disorder along the [001] direction
(xvii) In the specimen with approximately equal amounts of Tl-2212 and TlPb-2223 phases it is likely that a secondary phase develops by the growth of the microscopic faulted regions of the primary phase
Acknowledgments
I am thankful to Dr Harry McHenry for his support and especially to Dr Hassel Ledbetter for his wise guidance and most useful help during my stay at NIST I am also indebted to my home insti- tution the Faculty of Metallurgy of the University of Zagreb for allowing me the leave of absence at NIST
8 References
[1] W Friedrich P Knipping and M v Laue Ann Physik 41 971 (1912)
[2] H M Rietveld Acta Cryst 22 151 (1967) [3] H M Rietveld J Appl Cryst 2 65 (1969) [4] S A Howard and K D Preston in Modern Powder Dif-
fraction Vol 20 The Mineralogical Society of America Washington DC (1989) p 217
[5] D Taupin J Appl Cryst 6 266 (1973) [6] T C Huang and W Parrish Appl Phys Lett 27 123
(1975) [7] M K Wu J R Ashburn C J Torng P H Hor R L
Meng L Gao Z J Hwang Y Q Wang and C W Chu Phys Rev Lett 58 908 (1987)
[8] D Shi MRS Bull 16 37 (1991) [9] D Larbalestier Phys Today 44 74 (1991)
[10] J C Phillips Phys Rev B 4512647 (1992) [11] B Raveau Phys Today 45 53 (1992) [12] A J Millis and K M Rabe Phys Rev B 38 8908 (1988)
[13] F Guinea Europhys Lett 7 549 (1988) [14] C P Dhard and P Singh in Proc Int Symp High-Temp
Supercond Jaipur India Oxford amp IBH Publishing New Delhi (1988) p 271
[15] J D Jorgensen Phys Today 44 34 (1991) [16] J G Bednorz and K A Muller Z Phys B 64 189
(1986) [17] K Kishio K Kitazawa S Kaube I Yasuda N Sugii H
Takagi S Uchida K Fueki and S Tanaka Chem Lett 429 (1987)
[18] J D Jorgensen B Dabrowski S Pei D G Hinks L Soderholm B Morosin J E Venturini and D S Ginley Phys Rev B 38 11337 (1988)
[19] J R Clem Phys Rev B 43 7837 (1991) [20] M Paranthaman M Foldejiki D Balzar H Ledbetter
A J Nelson and A M Hermann submitted to Phys Rev B
[21] A R Stokes Proc Phys Soc Lond 61 382 (1948) [22] B E Warren and B L Averbach J Appl Phys 23 497
(1952) [23] R Delhez Th H de Keijser and E J Mittemeijer in
Accuracy in Powder Diffraction S Block and C R Hub- bard eds Natl Bur Stand (US) Special Publication 567 (1980) p 213
[24] H P Klug and L E Alexander X-ray Diffraction Proce- dures 2nd Edition John Wiley New York (1974) p 661
[25] J I Langford J Appl Ciyst 11 10 (1978) [26] J I Langford in Accuracy in Powder Diffraction S
Block and C R Hubbard eds Natl Bur Stand (US) Special Pubication 567 (1950) p 255
[27] R Delhez Th H de Keijser and E J Mittemeijer Fre- senius Z Anal Chem 312 1 (1982)
[28] A J C Wilson Proc Phys Soc Lond 80 286 (1962) [29] A J C Wilson Proc Phys Soc Lond 81 41 (1963) [30] L P Smith Phys Rev 46 343 (1934) [31] H C Burger and P H van Cittert Z Phys 79 722
(1932) [32] S Ergun J Appl Ciyst 1 19 (1968) [33] R Croche and L Gatineau J Appl Ciyst 10479 (1977) [34] L H Schwarz and J B Cohen Diffraction from Materi-
als Academic Press New York (1977) p 391 [35] R Delhez Th H de Keijser E J Mittemeijer and J I
Langford J Appl Cryst 19 459 (1986) [36] R Delhez Th H de Keijser E J Mittemeijer and J I
Langford Aust J Phys 41 213 (1988) [37] R A Young and D B Wiles J Appl Cryst 15 430
(1982) [38] W Voigt Stizungsber K Bayer Akad Wiss 42 603
(1912) [39] E E Whiting J Quant Spectrosc Radiat Transfer 8
1379 (1968) [40] G K Wertheim M A Butler K W West and D N E
Buchanan Rev Sci Instrum 111369 (1974) [41] M M Hall Jr V G Veeraraghavan H Rubin and P G
Winchell J Appl Cryst 10 66 (1977) [42] A Brown and J W Edmonds Adv X-Ray Anal 23 361
(1980) [43] P Suortti M Ahtee L Unonius J Appl Cryst 12 365
(1979) [44] T Sundius J Raman Spectrosc 1 471 (1973) [45] B H Armstrong J Quant Spectrosc Radiat Transfer 7
61 (1967) [46] J F Kielkopf J Opt Soc Am 63 987 (1973) [47] B P Asthana and W Kiefer Appl Spectr 36 250
(1982)
351
Volume 98 Number 3 May-June 1993
Journal of Research of the National Institute of Standards and Technology
[48] J P M de Vreede S C Mehrotra A Tal and H A Dijkerraan Appl Spectr 36 227 (1982)
[49] F R L Schoening Ada Ciyst 18 975 (1965) [50] P Scherrer Gott Nachr 2 98 (1918) [51] A R Stokes and A J C Wilson Proc Cambridge
Philos Soc 38 313 (1942) [52] A J C Wilson X-Ray Optics 2nd edition Methuen
London (1962) [53] S Leie and T R Anantharaman Proc Indian Acad
Sci Sect A H 261 (1966) [54] D Louer D Weigel and J I Langford J Appl Ciyst
5 353 (1972) [55] A J C Wilson J Appl Ciyst 2 181 (1969) [56] J I Langford and A J C Wilson J Appl Ciyst 11102
(1978) [57] A R Stokes and A J C Wilson Proc Phys Soc Lond
56174 (1944) [58] B E Warren and B L Averbach J Appl Phys 21 595
(1950) [59] B E Warren X-Ray Diffraction Addison-Wesley
Reading Massachusetts (1969) p 264 [60] B E Warren in Progress in Metal Physics Vol 8 Perg-
amon Press London (1959) p 146 [61] F Bertaut C R Acad Sci Paris 228 187 (1949) [62] N C Haider and C N J Wagner Acta Cryst 20 312
(1966) [63] D Balzar and H Ledbetter in Proceedings of the Accu-
racy in Powder Diffraction II Natl Inst Stand Technol (1992) p 37
[64] D Balzar and H Ledbeter J Appl Cryst 26 (1993) in press
[65] J N Eastabrook and A J C Wilson Proc Phys Soc Lond B 65 67 (1952)
[66] R S Smith IBM J Res Develop 4 205 (1960) [67] B Y Pines and A F Sirenko Soviet Physics Ciyst 715
(1962) [68] G B Mitra and N K Misra Acta Ciyst 22 454 (1967) [69] A Gangulee J Appl Ciyst 7 434 (1974) [70] J Mignot D Rondot Acta Met 231321 (1975) [71] J Mignot and D Rondot Acta Ciyst A 33 327 (1977) [72] R K Nandi H K Kuo W Schlosberg G Wissler J B
Cohen and B Crist Jr J Appl Ciyst 17 22 (1984) [73] M Zocchi Acta Ciyst A 36164 (1980) [74] P Ramarao and T R Anantharaman Trans Ind Ins
Metals 18 181 (1965) [75] R K Nandi and S P Sen Gupta J App Cryst 11 6
(1978) [76] Th H de Keijser J I Langford E J Mittemeijer and
B P Vogels J Appl Ciyst IS 308 (1982) [77] A Williams G H Kwei R B Von Dreele A C Lar-
son L D Raistrick and D L Bish Phys Rev B 37 7960 (1988)
[78] A C Larson and R B Von Dreele Los Alamos Na- tional Laboratory Report No LA-UR-86-748 (1988)
[79] J D Jorgensen D H Johnson M H Mueller J G Worlton and R B Von Dreele in Proceedings of the Conference on Diffraction Profile Analysis Cracow Poland (1978) p 20
[80] R B Von Dreele J D Jorgensen and C G Windsor J Appl Ciyst 15 581 (1982)
[81] P Thompson D E Cox and J B Hastings J Appl Ciyst 20 79 (1987)
[82] J P Singh R A Guttschow D S Kupperman J T Dusek and R B Poeppel in High Temperature Super-
conducting Compounds III S Whang A Gupta and E Ceilings eds TMS AIME Warrendale (1991) p 281
[83] M O Eatough D S Glnley and B Morosin Adv X- Ray Anal 33 145 (1990)
[84] E J Peterson P J Kung R E Muenchausen and D M Smith in Proceedings of the 41st Annual Denver Conference on Applications of X-Ray Analysis Colo- rado Springs Colorado (1992) p 74
[85] M Rand J I Langford and J S Abell submitted to J Cryogenics (1992)
[86] D Balzar J Appl Ciyst 25 559 (1992) [87] D Balzar H Ledbetter and A Roshko Physica C 185-
189 871 (1991) [88] D Balzar and H Ledbetter J Mater Sci Lett 111419
(1992) [89] D Balzar H Ledbetter and A Roshko Pow Diffr 8
(1993) in press [90] S Johnson M Gusraan D Rowcliffe T Geballe and J
Sun Adv Ceram Mater 2 337 (1987) [91] H Ledbetter S A Kim R B Goldfarb and K Togano
Phys Rev B 39 9689 (1989) [92] H Friedman Electronics 132 (1945) [93] W Parrish (ed) in Advances in X-Ray Diffractometry
and X-Ray Spectrography Centrex Publishing Company Eindhoven The Netheriands (1962)
[94] W Soller Phys Rev 24158 (1924) [95] S A Howard R L Snyder J Appl Ciyst 22 238
(1989) [96] G H Stout and L H Jensen X-Ray Structure Determi-
nation 2nd edition Wiley New York (1989) p 373 [97] D E Appleman and T Evans Jr Final Report 92-14
US Geological Survey Washington DC (1973) Avail- able as NTIS Document No PB-216188
[98] M U Cohen Rev Sci Instrum 6 68 (1935) [99] M U Cohen Rev Sci Instrum 7 155 (1936) [100] M H Mueller L Heaton and K T Miller Acta Ciyst
13 828 (1960) [101] R A Young P E Mackie and R B Von Dreele J
Appl Ciyst 10 262 (1977) [102] D B Wiles and R A Young J Appl Cryst 14 149
(1981) [103] J K Yau and S A Howard J Appl Ciyst 22 244
(1989) [104] S A Howard J K Yau and H U Anderson J Appl
Phys 65 1492 (1989) [105] S Enzo G Fagherazzi A Benedetti and S Poilizzi J
Appl Ciyst 21 536 (1988) [106] A Benedetti G Fagherazzi S Enzo and M
Battagliarin J Appl Cryst 21 543 (1988) [107] Th H de Keijser E J Mittemeijer and H C F Rozen-
daal J Appl Ciyst 16 309 (1983) [108] Y Zhang J M Stewart C R Hubbard and B Mo-
rosin Adv X-Ray Anal 33 373 (1990) [109] Y Wang S Lee and Y Ue J Appl Ciyst IS 35
(1982) [110] V N Selivanov and E F Smislov Zavod Lab 57 28
(1991) [Ill] A Guinier X-Ray Diffraction W H Freeman San
Francisco (1963) p 139 [112] M Wilkens J Appl Cryst 12119 (1979) [113] D Du and Y Wang Pow Diffr 2180 (1987) [114] A P Prudnikov Yu A Brychkov and O L Marichev
Integrals and Series Vol 1 Gordon and Breach Am- sterdam The Netheriands (1986) p 344
352
Volume 98 Number 3 May-June 1993
Journal of Research of the National Institute of Standards and Technology
[115] R L Rothman and J B Cohen J Appl Phys 42 971 (1971)
[116] T Adier and C R Houska J Appl Phys 50 3282 (1979)
[117] C R Houska and T M Smith J Appl Phys 52 748 (1981)
[118] S Rao and C R Houska Acta Ciyst A 4214 (1986) [119] J I Langford R Delhez Th H de Keijser and E J
Mittemeijer Ausi J Phys 41173 (1988) [120] J I Langfoid J Appl Cryst IS 315 (1982) [121] M J Turunen Th H de Keijser R Delhez and N M
van der Pers J Appl Ciyst 16176 (1983) [122] A J C Wilson Acta Ciyst 23 888 (1967) [123] A J C Wilson Acta Ciyst A 24 478 (1968) [124] A J C Wilson Acta Ciyst A 25 584 (1969) [125] G Gagliotti A Paoletti and F P Ricci Nucl Instrum
3 223 (1958) [126] J I Langford R J Cernik and D Louer J Appl
Ciyst 24 913 (1991) [127] J I Langford in Accuracy in Powder Diffraction II
preprint [128] A J C Wilson Mathematical Theory of X-Ray Powder
Diffractometiy Centrex Eindhoven The Netherlands (1963)
[129] J L Langford Prog Ciyst Growth and Charact 14185 (1987)
[130] T G Fawcett C E Crowder S J Brownell Y Zhang C R Hubbard W Schreiner G P Hamill T C Huang E Sabino J I Langford R Hamilton and D Louer Pow Diffr 3 209 (1988)
[131] W L Smith J Appl Ciyst 9187 (1976) [132] J L Langford and D Louer J Appl Ciyst 15 20
(1982) [133] Fl Popescu and L Benes Acta Ciyst A 33 323 (1977) [134] P PSuse^cu R MSnaila M Popescu and E Jijovici j
Appl Cryst 7 281 (1974) [135] P F Bley Y Calvayrac and M Fayard J Appl Ciyst
7 493 (1974) [136] B Moraweck Ph de Montgolfier and A J Renouprez
J Appl Ciyst 10191 (1977) [137] A Le Bail and D Louer J Appl Cryst 11 50 (1978) [138] D R Buchanan R L McCuUough and R L Miller
Acta Ciyst 20 922 (1966) [139] P Suortti and L D Jennings Acta Cryst A 33 1012
(1977) [140] J B Cohen and C N J Wagner J Appl Phys 33 2073
(1962) [141] A Bianconi J Budnick A M Flank A Fontaine P
Lagarde A Marcelli H Tolentino B Chamberland C Michel B Raveau and G Demazeau Phys Lett A127 285 (1988)
[142] K Fueki K Kitazawa K Kishio T Hasegawa S Uchida H Takagi and S Tanaka in Chemistiy of High- Temperature Superconductors D L Nelson M S Whittingham and T F George eds American Chemi- cal Society (1987) p 38
[143] T Fujita Y Aoki Y Maeno J Sakurai H Fukuba and H Fujii J Appl Phys 26 U68 (1987)
[144] R M Hazen in Physical Properties of High-rc Super- conductors Vol 2 D M Ginsberg ed World Scien- tific Singapore (1990) p 121
[145] J B Torrance A Bezinge A I Nazzal T C Huang S P Parkin D T Keane S J LaPlaca P M Horn and G A Held Phys Rev B 40 8872 (1989)
[146] J D Axe A H Moudden D Hohlwein D E Cox K
M Mohanty A R Moodenbaugh and Y Xu Phys Rev Lett 62 2751 (1989)
[147] T Suzuki and T Fujita Physica C 159 111 (1989) [148] T Fujita and Y Maeno in Superconducting Materials
JJAP Series 1 (1988) p 34 [149] A Roshko and Y-M Chiang J Appl Phys 66 3710
(1989) [150] D E Cox S C Moss R L Meng P H Hor and C W
Chu J Mater Res 31327 (1988) [151] B Crist and J B Cohen J Polym Sci 17 1001 (1979) [152] H Ledbetter S Kim and A Roshko Z Phys B 89275
(1992) [153] R D Shannon and C T Prewitt Acta Ciyst B 25 925
(1969) [154] M Lang H Spille F Steglich Y Hidaka T Murakami
and Y Endoh Physica C 162-1641037 (1989) [155] Y Hidaka and T Murakami Phase trans 15 241
(1989) [156] P L Gai and E M McCarron Science 247 553 (1990) [157] T Kamiyama I Izumi H Asano H Takagi S Uchida
Y Tokura E Takayama-Muromachi M Matsuda K Yamada Y Endoh and Y Hidaka Physica C 172 120 (1990)
[158] A Kapitulnik Physica C 153-155 520 (1988) [159] L A Muradyan V N Molchanov R A Tamazyan and
V I Simonov Physica C 162-164 536 (1989) [160] P Day M Rosseinsky K Prassides W I F David O
Moze and A Soper J Phys C 20 L429 (1987) [161] J T Lewandowski R A Beyerlein J M Longo and R
A McCauley J Amer Ceram Soc 69 699 (1986) [162] R Ramesh G van Tendeloo G Thomas S M Green
Y Mei C Jiang and H L Luo Appl Phys Lett 53 2220 (1988)
[163] J Schneck L Pierre J C Tolddano and C Daguet Phys Rev B 39 9624 (1989)
[164] O Eibl Physica C 168 215 (1990) [165] W Carrilo-Cabrera and W Gopel Physica C 161 373
(1989) [166] P Bordet J J Capponi C Chaillout J Chenavas A
W Hewat E A Hewat J L Hodeau M Marezio J L Tholence and D Tranqui Physica C 156189 (1988)
[167] R Ramesh K Remschnig J M Tarascon and S M Green J Mater Res 6 278 (1991)
[168] Z Hiroi Y Ikeda M Takano and Y Bando J Mater Res 6 435 (1991)
[169] Y Inoue M Hasegawa Y Shichi I Munakata M Ya- manaka S Hiyama and O Nittono J Mater Res 5 737 (1990)
[170] R Ramesh B G Bagley J M Tarascon S M Green M L Rudee and H L Luo J Appl Phys 67 379 (1990)
[171] X B Kan J Kulik P C Chow S C Moss Y F Yan J H Wang and Z X Zhao J Mater Res 5 731 (1990)
[172] G S Pawley J Appl Ciyst 13 630 (1980) [173] H Toraya J Appl Ciyst 19 440 (1986) [174] L Lutterotti and P Scardi J Appl Ciyst 23 246
(1990)
About the author Davor Balzar is with Faculty of Metallurgy of the University of Zagreb Sisak Croatia and was a Guest Researcher at fflST The National Institute of Standards and Technology is an agency of the Technology Administration US Department of Commerce
353
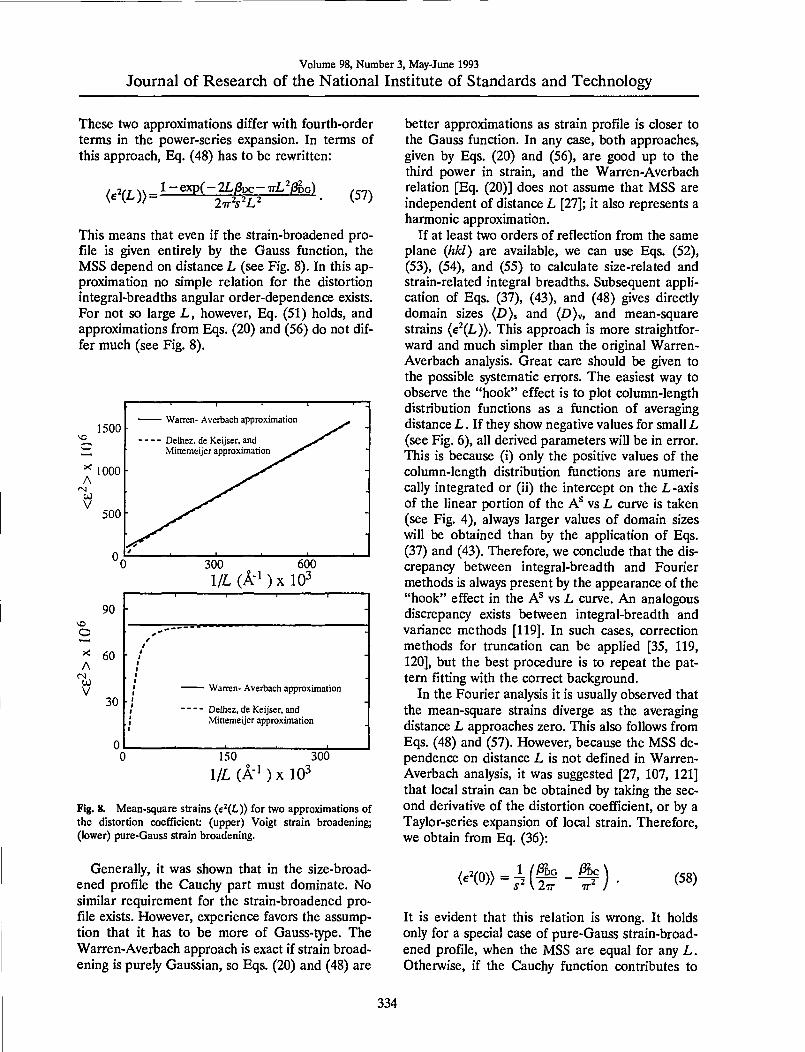
Volume 98 Number 3 May-June 1993
Journal of Research of the National Institute of Standards and Technology
These two approximations differ with fourth-order terms in the power-series expansion In terms of this approach Eq (48) has to be rewritten
2r ^^ l-exp(-2LI3DC-TTL^0DG) (57)
This means that even if the strain-broadened pro- file is given entirely by the Gauss function the MSS depend on distance L (see Fig 8) In this ap- proximation no simple relation for the distortion integral-breadths angular order-dependence exists For not so large L however Eq (51) holds and approximations from Eqs (20) and (56) do not dif- fer much (see Fig 8)
1500 Warren- Averbach approximation ^
Delhez de Kcijscr and ^^^ Minemeijer approximation ^y^
^ 1000 A
500
mdashI
1 1
Oc 300 600 IL k^) X 10^
90
o ^ 60 A
30
1
J Warren- Averbach approximation
Delhez de Keijser and Minemeijer approximation
0 0 150 300
1L (A-1 ) X 10^
Fig 8 Mean-square strains pound^(L)) for two approximations of the distortion coefficient (upper) Voigt strain broadening (lower) pure-Gauss strain broadening
Generally it was shown that in the size-broad- ened profile the Cauchy part must dominate No similar requirement for the strain-broadened pro- file exists However experience favors the assump- tion that it has to be more of Gauss-type The Warren-Averbach approach is exact if strain broad- ening is purely Gaussian so Eqs (20) and (48) are
better approximations as strain profile is closer to the Gauss function In any case both approaches given by Eqs (20) and (56) are good up to the third power in strain and the Warren-Averbach relation [Eq (20)] does not assume that MSS are independent of distance L [27] it also represents a harmonic approximation
If at least two orders of reflection from the same plane (hkl) are available we can use Eqs (52) (53) (54) and (55) to calculate size-related and strain-related integral breadths Subsequent appli- cation of Eqs (37) (43) and (48) gives directly domain sizes (D) and (D)v and mean-square strains (e^(L)) This approach is more straightfor- ward and much simpler than the original Warren- Averbach analysis Great care should be given to the possible systematic errors The easiest way to observe the hook effect is to plot column-length distribution functions as a function of averaging distance L If they show negative values for small L (see Fig 6) all derived parameters will be in error This is because (i) only the positive values of the column-length distribution functions are numeri- cally integrated or (ii) the intercept on the L-axis of the linear portion of the A^ vs L curve is taken (see Fig 4) always larger values of domain sizes will be obtained than by the application of Eqs (37) and (43) Therefore we conclude that the dis- crepancy between integral-breadth and Fourier methods is always present by the appearance of the hook effect in the A^ vs L curve An analogous discrepancy exists between integral-breadth and variance methods [119] In such cases correction methods for truncation can be applied [35 119 120] but the best procedure is to repeat the pat- tern fitting with the correct background
In the Fourier analysis it is usually observed that the mean-square strains diverge as the averaging distance L approaches zero This also follows from Eqs (48) and (57) However because the MSS de- pendence on distance L is not defined in Warren- Averbach analysis it was suggested [27 107 121] that local strain can be obtained by taking the sec- ond derivative of the distortion coefficient or by a Taylor-series expansion of local strain Therefore we obtain from Eq (36)
i^m-M^-^) (58)
It is evident that this relation is wrong It holds only for a special case of pure-Gauss strain-broad- ened profile when the MSS are equal for any L Otherwise if the Cauchy function contributes to
334
Volume 98 Number 3 May-June 1993
Journal of Research of the National Institute of Standards and Technology
strain broadening all derivatives of strain in L = 0 are infinite and local strain can not be defined If the main origin of strains is dislocations [115] strains are defined after some distance from the dislocation (cutoff radius) to be finite Averaging strains over a region smaller than the Burgers vector is probably not justified For instance Eq (48) gives even for a small averaging distance L = 1 A and considerable strain broadening (J3DG(20) = 3DC(20) = 1O) root-mean-square strain eL = 1A))^ laquo02 that is about the elastic limit
45 Random Errors of Derived Parameters
Errors in size and strain analysis of broadened peaks are relatively difficult to evaluate Following Langford [26] sources of the systematic errors in- clude choice of standard specimen background and type of analytical function used to describe the line profiles The first two errors should be mini- mized in the experimental procedure Errors caused by inadequate choice of specimen function would systematically affect all derived results but they can not be evaluated Random errors caused by counting statistics have been computed by Wilson [122 123 124] and applied to the Stokes deconvolution method by Delhez de Keijser and Mittemeijer [23] as well as by Langford [26] and de Keijser et al [76] using single-line Voigt-func- tion analysis Nevertheless the approximate error magnitude can be calculated from estimated stan- dard deviations (esd) of the parameters refined in the fitting procedure In the program SHADOW the weighted least-squares error is minimized
7wp mdash RES
Here
)=1
RES = 2 vfi [ (obs) - (cal)]
(59)
(60)
and weights are the reciprocal variances of the ob- servations
H = l(obs) (61)
Each line profile has four parameters varied inde- pendently position intensity and Cauchy and Gauss integral breadths of the Voigt profile In least-squares refinement esds are computed as
^^ bu RES (62) m mdashm
Here ba are diagonal elements of the inverse matrix of the equation coefficients m is the number of observations and m is the number of refined parameters The main source of errors is integral breadths Errors in peak position peak intensity and background are much smaller and can be ne- glected in this simple approach For two indepen- dent variables )3G and Pc covariance vanishes and from Eqs (37) and (38) for the two orders of re- flection and +1 it follows that
RD =
si+i)m)RHMi))+si)m+i)i^(3c(+D)
(63)
ReL)r) =
pHDRHPcG)) + m + miPcJl + D) 2[3c(+1) - i8c()3+TTL [m+1) - mw
-n-LmiDRHihd))+m+mWcH+i))i ^ 2[)3c(+1) - iSc()+TTLim+1) - mw
(65)
Here Rx) are relative standard deviations The error in D would be complicated to evaluate but because 131D)s^(Igt)vlt2(pound))s Eq (63) gives a good estimation for the error in (Z))v as well Alter- natively to see how errors depend on the Fourier coefficients errors can be estimated from the Warren-Averbach relationship [Eq (20)] (86) From Eq (32) it follows that
RA (L)) = ATr^Lpos)R^2d)) +
4Lph(s)RPci2e)) (66)
Errors in root-mean-square strains and domain sizes are
i^((e^(L ))bulllaquo) =
RHA(Ll))+RHA(Ll + l)) (67)
ALl + l)
335
Volume 98 Number 3 May-June 1993
Journal of Research of the National Institute of Standards and Technology
^^laquo^))=(T^)
s(l + 1)RHA (Ll)) +SV)RHA (Ll + D) lsl + l)-sl)f (68)
Here (D) is approximately defined with A^(L) = l-L(D)j Errors in Fourier coefficients increase with L while factors in Eqs (67) and (68) lower the errors for large L In general errors of domain sizes and strains are of the same order of magnitude as errors of integral breadths [86]
5 Application 51 Correction for Instrumental Broadening
Before specimen broadening is analyzed instru- mental broadening must be determined This is ac- complished by carefully measuring diffraction peaks of some well-annealed defect-free speci- men It is then assumed that its broadening may be attributed only to the instrument The usual proce- dure is to anneal the specimen However in some instances that is not possible because either the material undergoes an irreversible phase transition on annealing or the number of defects can not be successfully decreased by annealing Another pos- sibility is to measure the whole diffraction pattern of the material showing the minimal line broaden- ing and then to synthesize the instrumental profile at the needed diffraction angle This approach re- quires the modeling of the angle dependence of the instrumental (standard) parameters Cagliotti Pao- letti and Ricci [125] proposed the following func- tion to describe the variation of the full width at the half maximum of profile with the diffraction angle
F9miA^(2e) = Utan^9 + Vtand + W (69)
Although this function was derived for neutron dif- fraction it was confirmed to work well also in x-ray diffraction case [126 127] A more appropriate function for the x-ray angle-dispersive powder dif- fractometer based on theoretically predicted er- rors of some instrumental parameters [128] may be the following [129]
FWHNf (2 e) = W+Vsin^l 6 +
UtanH + UcotH (70)
This function may better model the increased axial divergency at low angles and correct for the speci- men transparency [129] However contrary to the requirement on the specimen function most im- portant for the instrumental function is to correctly describe the angular variation of parameters re- gardless of its theoretical foundation
When specimen broadening is modeled with a Voigt function the simplest way to correct for the instrumental broadening is by fitting the line pro- files with the Voigt function too Cauchy and Gauss integral breadths of the specimen-broad- ened profile are then easily computable by Eqs (7) and (8) However because the instrumental broad- ening is asymmetric [24] modeling with the sym- metric Voigt function can cause a fictitious error distribution resulting in errors of strain up to 35 [76] Another approach is to model the instrumen- tal-broadening angle dependence by fitting the profile shapes of a standard specimen with some asymmetrical function split-Pearson-VII [95] or pseudo-Voigt convoluted with the exponential function [105] The instrumental function can then be synthesized at any desired angle of diffraction and convoluted with the assumed specimen func- tion to match the observed profile by means of Eq (2)
In the program SHADOW instrumental para- meters are determined by fitting the split-Pearson VII function (see Fig 9) to line profiles of a standard specimen
iix)=m- 2 m
with
c =-
mc^f
mm) mv-rim-12)
(71)
(72)
Here m = 1 or m = ltraquo yields a Cauchy or Gauss function respectively Refined full widths at half maximum (FWHM) and shape factors m for both low-angle and high-angle sides of the profiles are fitted with second-order polynomials To fit the FWHM we used Eq (69) and for the shape fac- tors
m(2e) = U(20f + V(2e) + W (73)
The resulting coefficients U V W U V and W permit synthesis of the asymmetrical instrumental line profile at any desired angle
336
Volume 98 Number 3 May-June 1993
Journal of Research of the National Institute of Standards and Technology
2 0(deg)
le
Fig 9 A split-Pearson VII profile The two half profiles have same peak position and intensity Adapted from Howard and Preston [4]
The basic requirement on the standard specimen is however to show as small a line broadening as possible To minimize physical contributions to the Une broadening of the standard specimen a few moments were emphasized as follows Because dif- fraction-line width depends strongly on degree of annealing it is preferable to use some reference powder-diffraction standard Furthermore asym- metry in the peak profiles is introduced by axial divergence of the beam flat specimen surface and specimen transparency [24] Choosing a standard specimen with low absorption coefficient would cause transparency effects to dominate If the stud- ied specimen has a large absorption coefficient (compared to the standard) this might produce a fictitious size contribution and errors in micro- strains All of the specimens studied have absorp- tion coefficients exceeding 1000 cm^ so a NIST standard reference material 660 LaBe was chosen to model the instrumental broadening (p = 1098 cm) According to Fawcett et al [130] LaBe showed the narrowest lines of all studied com- pounds Furthermore LaB6_has a primitive cubic structure (space group Pm3m) resulting in rela- tively large number of peaks equally distributed over 26 This allows for better characterization and lower errors of FWHMs and shape factors of split- Pearson VII functions (Fig 10)
52 Applicability of the Method
To study the applicability of method described in Sec 4 we first studied simple cubic-structure mate- rials such as silver and tungsten Tungsten has very narrow line profiles allowing us to obtain the up- per limit of domain sizes that can be studied Silver is easily deformed which provides a possibility to apply the method to broad line profiles To test the
009
-a
OH
006
003
1 1 m low-angle side n m high-angle side
bullz w 2 o OH
X
tancopy
Fig 10 Refined FWHMs and shape factors (exponents) m for low-angle and high-angle sides of LaBe line profiles Second- order polynomials were fitted through points
case of relatively complicated patterns and weak line broadening the method was also applied to Lai85Sroi5Cu04 and La2Cu04 powders In this sec- tion only the mechanical aspects of the line broad- ening are discussed Discussion about the origins of broadening of superconductors can be found in Sec 6
521 Silver and Tungsten Powders Figure 11 shows observed and refined peaks of tungsten un- treated and silver ground powders In Table 2 are listed results of fitted pure-specimen Voigt profiles for silver and tungsten specimens Table 3 and Fig 12 give results of the line-broadening analysis Untreated tungsten powder shows relatively weak broadening Instrumental profile FWHMs at angle positions of (110) and (220) tungsten lines are 0059deg and 0081deg respectively close to values mea- sured for tungsten 0065deg and 0100deg Results in Table 3 reveal that small broadening is likely caused by domain sizes because microstrains have negligible value This pushes the limit for measur- able domain sizes probably up to 4500-5000 A However one must be aware that weak specimen broadening implies higher uncertainty of all derived parameters Moreover the choice of the instrumental standard becomes more crucial
Both silver and tungsten line profiles become more Cauchy-like after grinding which probably increases dislocation density in the crystallites This is consistent with the presumption that small crystallites and incoherently diffracting domains separated by dislocations within grains affect the tails of the diffraction-line profiles [60115] Figure 13 illustrates the dependence of MSS on the recip- rocal of the averaging distance L
337
Volume 98 Number 3 May-June 1993
Journal of Research of the National Institute of Standards and Technology
C8
z
7- ^95
29 (deg) 405
bullJf^r-
z S 08
Ez U o u OS
a
04 bull
o Es
4P
2000 z^fA
4000
B
z u f- z
425 435 445 29 (deg)
455
yr 600 SOO
L(A)
Fig 11 Observed points (pluses) refined pattern (full line) and difference pattern (below) (110) W untreated (upper) (200) Ag ground (lower)
Fig 12 Fourier coefficients for the first- (pluses) and second- order (crosses) reflection and size coefficients (circles) [111] Ag untreated (upper) [100] Ag ground (lower)
Table 2 Parameters of the pure-specimen Voigt function as obtained from profile-fitting procedure for tungsten and silver powders
Specimen hkl 2ft(deg) 3c(deg) 3G(deg) FWHM(deg) Rwp()
W untreated 110 220
4028 8705
00065(7) 00301(6)
0020(2) ltio-
0021 0019
90 44
W ground 110 220
4029 8705
0100(2) 0222(3)
0038(4) 0069(6)
0080 0166
90 42
Ag untreated 111 222 200 400
3806 8151 4425 9786
0056(1) 0105(4) 0118(2) 0274(21)
ltio- 00008(21)
ltio-^ ltio-5
0036 0067 0075 0175
105 97
105 122
Ag ground 111 222 200 400
3807 8151 4424 9783
0175(3) 0410(26) 0365(10) 1079(82)
0038(12) ltio-
0076(29) ltio-
0121 0261 0250 0687
99 145 99
145
338
Volume 98 Number 3 May-June 1993
Journal of Research of the National Institute of Standards and Technology
Table 3 Microstructural parameters for tungsten and silver powders
Specimen Direction (poundgt)raquo( A) (2))v(A) ltpound^(fl3))laquo (^laquoD)v2)gtw
W untreated [110] 3200(200) 3500(200) 000038 000008(2)
W ground [110] 620(20) 1030(30) 00023 000054(2)
Ag untreated [111] [100]
1000(20) 510(20)
2000(20) 1030(20)
00010 00022
000024(1) 000047(5)
Ag ground [111] [100]
380(20) 210(10)
650(20) 350(20)
00047 00100
000095(7) 000180(14)
100 -_ - [100) Ag ground ^ ^~ mdash C1111 Ag ground ^bull
y y
o y ^ 50 A y
y y
y
0
y - y ^--
c ) 50 100 150
lLfAjxlO^
Fig 13 Mean-square strains (E^) as a function of VL
Errors in integral breadths allow estimation of errors in strain and size parameters (Sec 45) but in some cases the refinement algorithm gives unre- liable errors of integral breadths When a particu- lar parameter is close to the limiting value (for instance 10^ degrees has been put as the mini- mum value for integral breadths) errors become large However in Eqs (63) (65) (66) (67) and (68) only the product of integral breadth and ac- companying error is significant which is roughly equal for Cauchy and Gauss parts Errors of do- main sizes and strains are of the same order of magnitude as errors of integral breadths
The possible source of systematic error is poten- tial inadequacy of Voigt function to accurately de- scribe specimen broadening This effect can not be evaluated analytically but it would affect all derived parameters especially the column-length distribution functions The logical relationship be- tween values of domain sizes (see Table 3) for dif- ferent degrees of broadening indicates that possible systematic errors can not be large
Equation (41) allows computation of volume- weighted and surface-weighted average domain sizes if respective column-length distribution func- tions can be obtained Figure 14 gives surface- weighted and volume-weighted average column- length distribution functions following Eqs (39) and (38) Width of the distribution function deter- mines the relative difference between (D) and (pound))v The broader the distribution the larger the differences because small crystallites contribute more to the surface-weighted average That is much more evident comparing the surface- weighted column-length distribution with the vol- ume-weighted If they have similar shape and maximum position as in Fig 15 differences are small Conversely if the surface-weighted distribu- tion function has a sharp maximum toward smaller sizes differences are larger (see Fig 14) The dif- ference between (poundgt)s and (D)v and the actual mean dimension of the crystallites in a particular direction also depends strongly on the average shape of the crystallites [52 131 132]
If experimental profiles are deconvoluted by the Stokes method even for considerable specimen broadening size coefficients A ^ usually oscillate at larger L values [59 106] preventing computation of the column-length distribution function Few techniques were used to deal with this problem successive convolution unfolding method [32 133] smoothing and iterative methods [134 135 136 137] Figures 14 and 15 show very smooth column- length distribution functions However they follow from size coefficients ^4^ that depend on the accu- racy of the approximation for the distortion coeffi- cient given by Eq (47) Equation (47) is exact if the strain distribution is Gaussian but in general holds only for small harmonic numbers n if strain broadening is not negligible
339
Volume 98 Number 3 May-June 1993
Journal of Research of the National Institute of Standards and Technology
500 1000 L(A)
Fig 14 Surface-weighted and volume-weighted column-length distribution functions normalized on unit area [111] Ag un- treated (upper) [100] Ag ground (lower)
Fig 15 Surface-weighted and volume-weighted column-length distribution functions for [010] La2Cu04 normalized on unit area
522 La2-xSrtCu04 Powders To test the applicability of the discussed method to more com- plicated patterns two compounds with lower crystallographic symmetry were studied Lai85Sroi5Cii04 has a tetragonal K2NiF4-type struc- ture space group lAlmmm La2Cu04 is orthorhom-
bic at room temperature Both compounds show slight line broadening and relatively highly overlap- ping peaks (see Fig 16) which makes it very diffi- cult if not impossible to perform a Stokes analysis
25
-25
26 (deg)
yNraquo-
Fig 16 Observed points (pluses) refined pattern (full line) convoluted profiles (dashed line) and difference plot (below) for part of La2Cu04 pattern
Tables 4 and 5 list results from the fitting proce- dure and the analysis of specimen-broadened inte- gral breadths There are no qualitative differences in results for tungsten and silver powders How- ever average errors are higher as expected be- cause of overlapping peaks while weighted errors wp are surprisingly smaller This fact illustrates the unreliability of iwp when only a segment of the pat- tern is being refined because it depends on the number of counts accumulated in points as well as on the 28 range of the refinement
Figures 17 and 18 represent Fourier coefficients of Lai85Sroi5Cu04 [110] and La2Cu04 [010] direc- tions In the second plot the A (L )-versus-L plot shows a concave-downward part near L =0 the so- called hook effect It was shown in Sec 42 that the hook effect originates because of underesti- mation of background connected with the trunca- tion of profiles In the profile refinement all peaks separated less than 4deg 20 have been included in the refinement region to avoid possible overlapping of peak tails and specimen profiles have been trun- cated below 01 of the maximum intensity How- ever because the polynomial background was determined prior to profile refinement it may be overestimated for complicated patterns containing many overlapping peaks If background is refined with other profile parameters undesirable correla- tion with integral breadths occurs
340
Volume 98 Number 3 May-June 1993
Journal of Research of the National Institute of Standards and Technology
Table 4 Parameters of the pure-specimen Voigt function as obtained from profile-fitting procedure for La2-^SrCu04 powders
Specimen hid 2Hdeg) Pen PcO FWHM(deg) Rp()
Lai85Sroi5Cu04 004 2695 0046(4) 0024(8) 0042 34 006 4092 0083(5) ltio-= 0053 62 110 3352 0110(5) ltio- 0070 125 220 7046 0171(9) ltio- 0109 43
La2Cu04 004 2713 0061(8) 0045(9) 0067 39 006 4119 0124(7) ltio-^ 0079 77 020 3316 0074(10) 0078(10) 0102 29 040 6957 0210(30) 0026(81) 0135 29 200 3345 0074(8) 0061(10) 0087 69 400 7028 0130(10) 0023(95) 0089 29
Table 5 Microstructural parameters for Laij(5Srai3Cu04 and La2Cu04 powders
Specimen Direction (DUA) Pgt(A) lte^(fl3))laquo lte2((Z)gt2))laquo
Lai83Sro5Cu04
La2Cu04
[001] [110]
[001] [010] [100]
1700(300) 470(20)
1100(100) 680(50) 680(50)
2000(200) 940(20)
1200(100) 760(50) 810(50)
00024 00017
00038 00033 00016
000049(9) 000044(6)
00008(1) 00007(2) 00003(3)
c i ^- raquo sect 08 bulli - U
^0
ti- bull ll bull bullbullo
ffl M P bull- u ^ Di 04 Si - M bulldiamsbullbull a bull-v 3 o ^^=s^
u ^N^Sraquoraquo^
0 ^^^aaaa 1000
L(A) 2000
OQ bullbulldego UM o z a 08
o o bull bull bull
- u u bull raquo UU bull
a diams o bull o u ft 04 bull deg raquo deg - U bull bull deg Oi bullbullgt =3 bull- l o k u
0 bullbullbullraquo aaaMMi
500 1000
L(A)
Fig 17 Fourier coefficients for the first- (pluses) and second- order (crosses) reflection and size coefficients (circles) for [110] Lai^Sroi5Cu04
Fig 18 Fourier coefficients for first- (pluses) and second- order (crosses) reflection and size coefficients (circles) for [010] La2Cu04
341
Volume 98 Number 3 May-June 1993
Journal of Research of the National Institute of Standards and Technology
S3 Comparison with the Integral-Breadth Methods
Knowing the specimen integral breadths simpli- fied methods can be applied In Sec 212 we re- viewed multiple-line and single-line integral- breadth methods We shall compare the simplified multiple-line methods [Eqs (23) (24) and (30)] and the single-line method [76] [Eqs (29) and (30)] with results obtained for silver tungsten and La2-xSrxCu04 powders (Tables 3 and 5) We did not compare with the multiple-line Voigt-function method [26] because it was shown in Sec 44 that it is incompatible with the Warren-Averbach analy- sis In Table 6 integral breadth Pi was computed according to Eq (11) This value was compared with )8A integral breadth computed from Fourier coefficients [58]
i8A=- laquo3 2^(L)
(74)
Results obtained by the Warren-Averbach analysis are significantly smaller for both size and strain Integral-breadth methods give the upper limit for strain so comparison is limited Considering the approximation e = 125e^(L))^ [138] with L=(D)v2 or L=(D)s2 strains resemble more closely than crystallite sizes It must be noted how- ever that this approximation makes sense only in the case of pure-Gauss strain broadening Benedetti et al [106] reported excellent agreement for both size and strain using Warren-Averbach and Cauchy-Gauss [Eq (24)] methods Results from Table 6 on the contrary indicate that the Gauss-Gauss approximation gives values closest to the Warren-Averbach method for crystallite sizes whereas the Cauchy-Gauss and especially the Cauchy-Cauchy approximation tend to give too large values For strain the trend is opposite The Cauchy-Cauchy approximation resembles most
Table 6 Comparison of results obtained with the integral-breadth methods Cauchy-Cauchy (C-C) Cauchy-Gauss (C-G) Gauss- Gauss (G-G) and single-line (S-L) analysis
Specimen hkl PiXKP PAXKP ltigt)v (Z)gt(A) (e^((DV2)gt2 eXlO^ (A-) (A-0 (A) C-C C-G G-G S-L xlO^ C-C C-G G-G S-L
W untreated 110 220
0259 0247
0259 0247
3500 3700 3810 3810 14500 4040
008 -001 -003 -005 024 0
W ground 110 220
125 204
125 205
1030 2240 1450 1220 940 550
054 090 093 105 045 032
Ag untreated 111 2
0600 0901
0600 0900
2000 3340 2390 2190 1670 1110
024 035 039 095 0 0
200 124 124 1030 2270 1470 1230 810 047 082 085 095 0 400 204 204 490 0
Ag ground 111 222
198 352
200 352
650 2080 1240 910 530 280
095 179 182 197 048 0
200 403 406 350 9380 4780 1320 260 180 405 405 408 082 400 803 803 120 0
Lai85Sroi3Cu04 004 006
0657 0881
0650 0880
2000 5230 3290 2660 1970 1140
049 076 078 088 044 0
110 119 119 940 1240 1000 970 840 044 052 064 080 0 220 158 158 630 0
La2Cu4 004 006
0988 132
0998 131
1200 2980 1940 1630 1490 760
08 107 112 127 081 0-
020 143 142 760 1200 910 860 1240 07 079 090 110 114 040 198 200 510 016 200 126 124 810 810 810 810 1250 03 002 011 015 089 400 1S 126 830 014
Not possible to evaluate because of too small Gauss integral breadth
342
Volume 98 Number 3 May-June 1993
Journal of Research of the National Institute of Standards and Technology
closely a Warren-Averbach method These results concur with the Klug and Alexander [24] compari- son of the published size and strain values obtained by Warren-Averbach (Stokes) and integral-breadth methods However for x-ray diffraction the Cauchy-Gauss assumption for the size-strain broadening is theoretically and experimentally more favored thpoundm the other two models The fact that the Gauss-Gauss method for crystallite size and the Cauchy-Cauchy method for strain give more realistic results may mean that the presump- tion that size and strain broadening are exclusively of one type is an oversimplification
The single-line method seems much less reliable If Gaussian breadth is very small no information about strain is obtained Moreover second-order reflections give much lower values of both size and strain than do basic reflections However if multi- ple reflections are not available the single-line method can give satisfactory estimations
54 Reliability of Profile Fitting
The profile fitting of a cluster of even severely overlapping peaks can be accomplished with a low error and excellent fit of total intensity But how reliable is information obtained about separate peaks in the cluster In the fitting procedure it is possible to put constraints on the particular profile parameter to limit intensity position and width of the peak If anisotropic broadening or different phases are present constraints may not be realistic Morever acceptable results can be obtained even using a different number of profiles in refinement [4] Hence the first condition for the successful ap- plication of this method is knowledge of actual phases present in the sample and their crystalline structures
In this regard two powders were measured or- thorhombic Lai94Sroo6Cu04 has a slightly distorted K2NiF4-type structure (space group Bmab a =53510(2) A b =53692 A(2) c = 131931(7) A) and tetragonal Lai76Sro24Cu04 (space group I4mmm a =37711(3) A c = 132580(8) A) Data were collected for each specimen separately and for a specimen obtained by mixing the same pow- ders Because diffracted intensity of each phase was lower for the mixture counting time was pro- portionally increased to obtain roughly the same counting statistics Figure 19 shows two partially separated orthorhombic (020) (200) and (040) (400) peaks overlapped with tetragonal (110) and (220) reflections During the profile fitting of the mixed powders (200) orthorhombic peak tended to disappear on account of neighboring (020) and
(110) reflections Its intensity was constrained to vary in range plusmn 30 of (020) peak intensity which can be justified if the crystallographic structure is known
60
-60
345
345
335 29 (deg)
345
Fig 19 (upper) Lai76Sro24Cu04 (110) peak (middle) Lai94Sroo6Cu04 (020) and (200) peaks (lower) (110) (020) and (200) peaks
Table 7 contains results of fitted specimen-Voigt functions as well as size and strain values obtained by the analysis of broadening Comparing integral breadths of the starting and mixed powders some profiles change from more Cauchy-like to Gauss- like and vice versa This is especially evident for the (400) reflection meaning that accurate deter- mination of the profile tails is indeed affected in the cluster of overlapping peaks However integral breadth does not change significantly so results of
343
Volume 98 Number 3 May-June 1993
Journal of Research of the National Institute of Standards and Technology
Table 7 Comparison between two specimens run separately and mixed togetlier
Specimen hkl 2Hdeg) )3cO PoO DUA) (D)v(A) (e2laquoD)v2))laquoxlO
Lai76Sroj4CuOr 110 3369 0058(6) 0094(7) 780(60) 850(60) 10(1) 220 7073 022(2) 013(2)
LaiMSro(KiCu04 020 3342 0084(9) 055(14) 500(90) 1000(200) 07(1) 040 7012 010(2) 014(1) 200 3353 00216(85) 0061(8) 1100(100) 1200(100) 03(1) 400 7040 0026(11) 0088(8)
Mix 110 3367 0083(21) 0064(14) 800(300) 1200(300) 08(3) Lai76Sro24Cu04 220 7072 019(7) 013(4)
+ 020 3343 0066(35) 0070(23) 800(300) 1000(300) 07(4) Lai94Sroo6Cu04 040 7012 0116(93) 013(5)
200 3354 0024(156) 0071(61) 900(700) 1000(600) 04(12) 400 7041 011(2) 0003(320)
the multiple-line methods are not much influenced On the contrary the single-line method gives quite different results This may support the conclusion of Suortti Ahtee and Unonius [43] that the Voigt function fails to account properly for size and strain broadening simultaneously if only Cauchy integral breadth determines crystallite size
Table 7 shows that the results of Warren- Averbach analysis of starting and mixed powders agree in the range of standard deviations How- ever errors are much larger especially for the hid- den (200)-(400) reflections From Eq (62) it follows that more counts (longer counting times) and more observables (smaller step-size) would lower standard deviations Therefore in the case of highly overlapping patterns to obtain desirable ac- curacy much longer measurements are needed al- though that will not change the fact that higher overlapping implies intrinsically higher errors of all refinable parameters To further minimize possible artifacts of the fitting procedure it is desirable to include in the analysis as many reflections in the same ciystallographic direction as possible
55 Remarks
By modeling the specimen size and strain broad- ening with the simple Voigt function it is possible to obtain domain sizes and strains that agree with experiment and show a logical interrelationship Furthermore the Voigt function shows the correct 1A(26y asymptotic behavior of peak tails as ex- pected from kinematical theory [139] However if the specimen profile is significantly asymmetric (because of twins and extrinsic stacking faults [140 59]) or the ratio FWHM^ is not intermediate to the Cauchy (2Tr) and Gauss (2(ln27r)^) functions then the Voigt function can not be applied [25]
Suortti Ahtee and Unonius [43] found good over- all agreement by fitting the Voigt function to the pure-specimen profiles of a Ni powder deconvo- luted by the instrumental function However more accurate comparison is limited because of unavoid- able deconvolution ripples of specimen profiles Furthermore the Voigt function might not be flex- ible enough to model a wide range of specimen broadening as well as the different causes of broadening Therefore the question whether the Voigt function can satisfactorily describe complex specimen broadening over the whole 20 range in a general case needs further evaluation
This method of Fourier analysis with the as- sumed profile-shape function is most useful in cases when the classical Stokes analysis fails there- fore when peak overlapping occurs and specimen broadening is comparable to instrumental broaden- ing It was shown that for a high degree of peak overlapping the fitting procedure can give unreli- able results of Gauss and Cauchy integral breadths that is the peak can change easily from predomi- nantly Cauchy-like to Gauss-like and contrary This can lead to illogical values of size-integral and strain-integral breadths according to Eqs (52) (53) (54) and (55) and to irregularities in the be- havior of Fourier coefficients for large L Simulta- neously if the size-broadened profile has a large Gauss-function contribution the hook effect will occur However volume-weighted domain sizes D)y and MSS eL)) for small L are much less affected because they rely on both Cauchy and Gauss parts of the broadened profile Any integral- breadth method that attempts to describe the size and strain broadening exclusively by a Cauchy or Gauss function in this case fails completely For specimens with lower crystallographic symmetry
344
Volume 98 Number 3 May-June 1993
Journal of Research of the National Institute of Standards and Technology
when many multiple-order reflections are avail- able but the peaks are overlapped it is therefore desirable to include in the analysis as many reflec- tions as possible to minimize the potential artifacts of the fltting process
6 Analysis of Superconductors 61 (La-M)2Cu04 Superconductors
Bednorz and Miiller [16] found the first high- temperature oxide superconductor in the La-Ba- Cu-O system Soon after substituting Ba with Sr and Ca Kishio et al [17] found superconductivity in two similar compounds Later many compounds with much higher transition temperatures (Tc) were found The (La-M)2Cu04 system remains favorable for study because the cation content responsible for the superconductivity is easier to control and measure than the oxygen stoichiometry Also this system provides a wide range of substitutional cation solubility in which the tetragonal K2NiF4- type structure is maintained Compared with much- studied Y-Ba-Cu-O this structure is simpler because it contains only one copper-ion site and two oxygen-ion sites
The undoped compound La2Cu04 is orthorhom- bic at room temperature It becomes superconduct- ing either with cation substitution on La sites or increased oxygen content to more than four atoms per formula unit Doping with divalent cations in- creases the itinerant hole carriers in the oxygen- derived electron band [141] which probably causes the superconductivity However different dopants influence the transition temperature Tc Although the unit-cell c-parameter simply reflects ionic dopant size [142] the in-plane unit-cell parameter (and accordingly the Cu-0 bond length) correlates with Tc for different dopants and for different dop- ing amounts [142 143]
LaiB5MouCu04 (M = Ba Ca Sr) have a tetrago- nal K2NiF4-type structure space group lAlmmm with four atoms in the asymmetric unit [117] One site is occupied with La partially substituted with dopant ions (Fig 20) La2Cu04 is orthorhombic at room temperature The best way to correlate these two structures is to describe La2Cu04 in space group Bmab the c axis remains the same tetrago- nal [110] and [110] directions become [010] and [100] orthorhombic axes and size of the unit cell is doubled [144]
Figure 21 shows parts of the x-ray diffraction patterns observed and refined of Lai85Moi5Cu04 (M = Sr Ba Ca) and La2Cu04 Refined lattice
parameters are given in Table 8 Table 9 shows resuhs of the line-broadening analysis Relatively
La(BaCaSr)
0(2)
0(1)
Fig 20 Ciystal structure of (La-M)2Cu04 showing one unit cell
300 JUU
(b)
200
100
U 0 M J Js-r-^
30
-30
300
40 41 42 43 44 45 40 41 42 43 44 45 29 (deg) 29 (deg)
mdashA-
gt t 200
Z
F-
- 100
(c)
f V kgt ii I 40 41 42 43 44 45 40 41 42 43 44 45
e (deg) ^^ 26 (deg)
-30 wwX mdash Wlaquo-
Fig 21 Diffraction patterns of LaiH5Moi5Cu04 specimens (a) M=Sr (b) M = Ba (c)M = Ca (d) M = U
345
Volume 98 Number 3 May-June 1993
Journal of Research of the National Institute of Standards and Technology
Table 8 Lattice parameters and T^ at zero resistivity (Ac method at 10 Ma current)
Specimen a (A) bk) c(A) rc(K)
Lairaquo5Sroi5Cu04 377814(7)
Lairaquo3Baoi3Cu04 37846(2)
LaiiijCaoi5Cu04 37863(7)
La2Cu04 53558(2) 54053(2)
231(2) 36
288(4) 28
17(2) 19
1451(8)
Table 9 Results of line-broadening analysis for (La-M)2Cu4 specimens
Specimen hkl PcO PoO (DUk) (Iraquo)(A) lte^((D)2))
Lai(laquoSroj5Cu04 004 006
0046(4) 0083(5)
0024(8) ltio-
1700(300) 2000(200) 000049(9)
110 0110(5) ltio- 470(20) 940(20) 000044(6) 220 0171(9) ltio-
Lai85Baoi3Cu04 004 006
0049(6) 0110(7)
0076(6) 0089(9)
1100(200) 1100(100) 00011(2)
110 0087(4) 000042(6) 560(20) 1110(20) 000024(5) 220 0116(3) ltio-5
Laiji5Caoi5Cu04 004 006
0120(13) 0146(12)
0032(22) 0033(27)
440(70) 780(90) 00007(4)
110 0045(25) 0200(19) 340(30) 360(20) 00013(2) 220 0343(22) ltio-
La2Cu04 004 006
0061(8) 0124(7)
0045(9) ltio-
1100(100) 1200(100) 00008(1)
020 0074(10) 0078(10) 680(50) 760(50) 00007(2) 040 0210(30) 0026(81) 200 0074(8) 0061(10) 680(50) 810(50) 00003(3) 400 0130(10) 0023(95)
weak peak broadening was observed which can not be attributed to the proximity of the phase trans- formation Lai85SroisCu04 is tetragonal down to = 170 K [145] Lai85Baoi5Cu04 to 140 K [146147] and Lai85Caoi5Cu04 to 130 K [148] Another possi- ble reason for peak broadening might be continu- ous compositional variations in dopant content The scanning Auger microprobe analysis of La2-SrtCu04 compounds [149] showed that grain- boundary segregation of Sr is weak and limited to a narrow region near the grain surface In the case of the separation of two phases with different Sr con- tent and similar lattice parameters asymmetry of some reflections would be observed [150] More- over in the case of compositional inhomogeneity microstrains eL)) would be roughly independent of the averaging distance L in the grains [151] therefore distribution of strains would be Gaus- sian For all specimens microstrain behavior is identical it decreases linearly with distance L
Rothman and Cohen [115] showed that such be- havior of microstrains is caused by dislocations that might arise during grinding Assuming the same applied stress microstrain would be approximately inversely proportional to the elastic moduli of these materials If mean microstrain is defined as the arithmetic average of strains for the [001] and [110] directions results agree with values of the Youngs moduli for polycrystalline La2Cu04 Lai85Moi5Cu04 (M = Sr Ba Ca) [152] However other factors may contribute to the microstrain Coordination-6 ionic radii of La^+ Sr Ba^+ Ca^+ are 106 116 136 100 A respectively [153] Substitution of La with ions of different sizes affects the lattice parameter [142] and may cause much larger strains in the [001] direction when some of the ions are replaced with Ba^ than with Sr^ in accord with results in Table 9 Substitution of Ca^^ ions produces an entirely different effect microstrains in the [110] direction are larger This may be explained by
346
Volume 98 Number 3 May-June 1993
Journal of Research of the National Institute of Standards and Technology
comparing effects of substitutional ions on the unit-cell a -parameter The Ba-doped specimen has a larger a-parameter than the Sr-doped but the Ca-doped a-parameter is largest although Ca^^ has the smallest ionic size This should increase the cell distortion in the a-b plane
Table 9 reveals high anisotropy in these materi- als consistent with other physical properties such as thermal expansion [154] and upper critical mag- netic field [155] Differences of domain sizes might arise from a layered structure in the [001] direction and consequently easy incorporation of stacking faults between regularly stacked layers The stack- ing-fault and twin-fault probabilities can be esti- mated from the average surface-weighted domain sizes [59]
^ = TAN + cf1fun(aa) (75) m im - (D)
Here c is a constant for the particular [hkl] direction and fun(a a) a linear combination of stacking-fault probability and twin-fault probability a The exact form of Eq (75) was derived only for the cubic and hexagonal crystal structures On con- dition that the true domain dimension D is isotropic or so large that the second term of Eq (75) dominates a linear function of stacking-fault and twin-fault probability is
fun(aa) = c( 1
) (76) Zgt)J (Dgttrade
Here c denotes a constant that depends only on geometrical factors and is the same for all three doped compounds
Figure 22 shows a possible correlation between Tc and fault-defect probabilities computed from TEM observations of La2-jcSrCu04 revealed that stacking-fault density increased with Sr content up to jc = 015 [156] That study suggests that a shear mechanism forming the fault-boundary dislocations implies oxygen vacancies andor cation deficiency We did not measure oxygen content but neutron- diffraction studies showed that oxygen deficiency starts to appear at much higher Sr content [157] However the increase of fault probability with the simultaneous decrease of microstrain in Fig 22 supports the assumption that defects are intro- duced to accommodate lattice strains [156] A simi- lar increase in Te was found in Y2Ba4Cu802o-laquo thin films [158] Compounds with asymmetric broad- ened and shifted peaks showed higher Tc which
was attributed to stacking faults Although extrinsic stacking faults may cause asymmetric peak broad- ening [140] it is probably caused by twinning Twinning in La-M-Cu-0 materials is less abundant than in Y-Ba-Cu-O compounds but it was ob- served in (La-Sr)2Cu04 monocrystals on (110) planes [159] In the profile-fitting procedure peak asymmetry is incorporated only in the instrumental function therefore we could not model asymmetric peak broadening However any significant asym- metry of the specimen profile would cause an un- even fit of low-angle and high-angle sides of peaks which was not observed This gives much more im- portance to stacking faults in Eq (76)
Fig 22 Arithmetic average of [110] and [001] root-mean- square strains and linear function of stacking-fault and twin- fault probabilities as a function of Tc
In Fig 22 average microstrains defined as the arithmetic average of [001] and [110] directions correlate inversely with Tc However we did not find a correlation of Tc and microstrains in a partic- ular direction [001] microstrains simply reflect dif- ference in size of dopant and host La^ ions (see Table 9)
In La2Cu04 (OkO) reflections are significantly broader than (hOO) This has also been observed in low-temperature orthorhombic Lai85Sroi5Cu04 and Lai85Baoi5Cu04 [160] and explained by either stacking faults or possible lower symmetry Our results reveal that domain sizes (D) have identical values for [010] and [100] directions (Table 9) From Eq (76) it follows that stacking-fault proba- bilities in these directions have the same values However microstrains in the [010] direction are roughly twice as large as in the [100] direction which is responsible for the different broadening In the case of doped La2Cu04 compounds different microstrains might be caused by oxygen
347
Volume 98 Number 3 May-June 1993
Journal of Research of the National Institute of Standards and Technology
vacancies ordered along one direction in the a-b plane similar to effects found in YBa2Cu307-laquo However undoped La2Cu04 is not expected to have significant o^Qgen deficiency Other possibili- ties are lower ciystallographic symmetry andor La vacancies although they were not reported for this system but La deficiency was found in an La2Co04 compound [161]
We can conclude that lattice strains and incoher- ently diffracting domain sizes confirm high an- isotropy in these materials This simple approach however does not allow unambiguous identifica- tion of the strains origin Probably the strains originate from dislocations and from different sizes of host and dopant ions Domain sizes of all com- pounds are larger in the c-direction than in the a-6 plane This indicates existence of stacking faults and twins However because estimated errors are relatively large and only three materials were stud- ied the possible connection between stacking faults and 7c needs further study
62 Bi-Cu-O Superconductors
Among the high-Tc superconductors the Bi- Cu-O compounds appear intriguing especially because their incommensurate structure modula- tion remains incompletely understood [162 163] The crystal structure consists of perovskite-like SrO-(Cu02Ca)mi-Cu02-SrO layers separated by NaCl-like BiO double layers (see Fig 23 [164]) The number m of Cu02 layers alters the supercon- ducting transition temperature Tc (for m = 12 and 3 rclaquo10 90 and 110 K respectively) This two- dimensional layered structure makes these materi- als highly anisotropic and favours the creation of defects
Bulk sintered specimens showed relatively weak peak broadening Moreover the diffraction pat- terns contained many overlapping peaks because the compound crystallizes in an orthorhombic low- symmetry space group A2aa [165] and incommen- surate modulation gives superlattice reflections All patterns revealed a strong [001] texture (Fig 24) making reflections other than (001) difficult to ana- lyze The lattice parameters vary depending on the exact compound stoichiometry and processing his- tory but characteristically they have almost identi- cal a and b parameters and large c parameter fl =54095 A 6=54202 A c =309297 A for Bi2Sr2CaCu208 (Bi-2212 [166] and A =5392 A b =5395 A c =36985 A for (BiPb)2Sr2Ca2Cu30io (BiPb-2223) [165] Thus we treated (hOO) and (0^0) reflections as single peaks Table 10 gives the
results for three specimens Bi-2212 (BiPb)2 (SrMg)2(BaCa)2Cu30io (BiPbMgBa-2223) which were one-phase specimens and BiPb-2223 con- taining approximately equal amounts of 2212 and 2223 phases The in-plane lattice parameters of 2212 and 2223 phases differ little hence only the [00] directions of the mixed-phase specimen were evaluated
b^ (c)
Fig 23 Average crystal structure of Bi2Sr2Cam-iCum04+2m for (a) m = 1 (b) w =2 (c) m =3 [164]
35
-35
42 44 46 48 50 52 54 56 58 60 62 26 (deg)
^ ^^^MK^Aa^Ndllaquop
Fig 24 Part of BiPbMgBa-2223 refined pattern There are 48 fundamental reflections in this region
Interpretation of the results in the case of these complicated compounds must be considered care- fully Microstrains are probably caused by disloca- tion arrays However substitution of different-sized ions and vacancies would also contribute to the strains as would other kinds of disorder especially
348
Volume 98 Number 3 May-June 1993
Journal of Research of the National Institute of Standards and Technology
Table 10 Results of line-btoadening analysis for Bi-Cu-O supreconductors
Specimen Phase hkl (A)
eD)sa)y^
Bi-2212 2212 008 0012
0163(8) 022(3)
001(6) 005(6)
420(80) 00021(6)
020+200 0104(4) ltio-^ 580(30) 00007(1) 040+400 018(2) 00004(6300)
BiPbMgBa-2223 7773 0010 0020
0097(1) 021(2)
00002(1700) 0007(150)
770(60) 00012(1)
020 + 200 012(27) 013(10) 380(430) 00009(71) 040 + 400 015(95) 021(33)
BiPb-73 2212 008 0012
023(2) 025(5)
0002(350) 0001(1000)
220(30) 00013(26)
2223 0010 0020
022(8) 023(99)
0092(67) 018(47)
230(190) 00012(197)
Stacking faults and twins Table 10 shows larger strains in the [001] direction that in the basal plane This can be explained by stacking disorder along the c-axis which was frequently observed in electron-diffraction patterns as streaking [167 168] Easy incorporation of stacking faults is possi- ble because of the two-dimensional weak-bonded layers (BiO double layers are spaced about 3 A apart) The difference in microstrain between in- plane and the c-direction is much smaller for the BiPbMgBa-2223 phase probably because Pb low- ers the faulting by stabilizing the higher-Tc 2223 phase [167] For the BiPb-2223 specimen with two phases there are two possibilities Either the speci- men consists mainly of a mk of two kinds of one- phase grains or both phases occur within the same grains The second possibility was confirmed exper- imentally [169 170] and our results concur be- cause microstrain in the 2212 phase is much smaller than in the one-phase Bi-2212 specimen Processing conditions and cation content probably favour development of the macroscopic inter- growth of both phases within the grains that is microscopic defects grow to sufficiently large re- gions to give a diffraction pattern of another phase with the different number of Cu02 layers As a re- sult strain is relieved and both strains and domain sizes being quite different in one-phase specimens tend to equalize
For the Bi-Cu-O specimens the mean surface- weighted domain sizes are generally smaller than for (La-M)2Cu04 compounds Therefore the com- putation of the stacking- and twin-fault probabili- ties by using Eq (75) may be wrong It would be very instructive to compare the different broaden-
ing of satellite and fundamental reflections which indicates a more pronounced stacking disorder in the modulated structure [171]
In summary we found that for both Bi-2212 and BiPbMgBa-2223 superconductors the c-axis strain exceeds the in-plane strain The BiPb-2223 specimen containing both 2212 and 2223 phases within the single grains shows smaller incoherently diffracting domains and lower c-axis strain than the one-phase specimens This fact may direct us to- ward the mechanism of the second-phase forma- tion in these materials
63 Remarks
It was shown that this particular method of the line-broadening analysis can give information about the size of incoherently diffracting domains and lattice strains in (La-M)2Cu04 and Bi-Clu-O superconductors Moreover results show high an- isotropy of both size and strain parameters as one may expect because of the layered structure of all superconducting cuprates Generally structural line broadening is not large that is a result of rela- tively large domain sizes (200-2000 A) and small strains (002-02) It is interesting to compare these values with the published results for YBa2Cu307-laquo (isotropic strains of 023 [77] and 005-03 [82]) Although the different materi- als were studied they seem too large especially be- cause they are the average of strains in different directions
The main drawback of the line-broadening the- ory is the uncertainty about the origins of the line broadening that is it is difficult to distinguish the main effects responsible for the broadening For
349
Volume 98 Number 3 May-June 1993
Journal of Research of the National Institute of Standards and Technology
the novel superconductors particularly the numer- ous defects (substitutions vacancies stacking faults dislocations and similar) can occur simulta- neously which makes it very difficult to determine their individual contributions Furthermore the crystal structures of most novel superconductors are relatively complicated The average structure has mostly a slightly distorted tetragonal symmetry very similar a and b lattice parameters and a large c parameter but c=36 for YBa2Cu307-laquo for in- stance This results in a large number of overlap- ping peaks and consequently in large errors of all results This showed especially in the case of Bi-Cu-O superconductors (see Table 10) Follow- ing the discussion of reliability of profile fitting in Sec 54 it would be desirable to include more than two reflections in the analysis of broadening but higher-order peaks are usually too weak and over- lapped One way to partially solve this problem would be a whole pattern fitting [172 173] and Rietveld structure refinement [23] in terms of size and strain parameters This requires an accurate preset function to model specimen broadening and precise definition of angular dependence of size and strain parameters The Rietveld programs that model the line broadening in terms of size and strain parameters are based either on the simpli- fied integral-breadth methods [78 95] or on the single-line method [174]
7 Conclusions
A method for analyzing the pure-specimen (structural) broadening of x-ray diffraction line profiles is proposed By modeling the specimen size and strain broadenings with the simple Voigt func- tion it is possible to obtain domain sizes and strains that agree with experiment and show a logi- cal interrelationship Furthermore some common consequences and problems in the Fourier-method analysis follow easily The specimen function is convoluted with the instrumental function to match the observed x-ray diffraction-line profile This avoids the Stokes deconvolution method thus al- lowing analysis of patterns with highly overlapping peaks and weak structural broadening Therefore the method was applied to some novel high-Tc superconductors We reached the following conclu- sions
(i) Surface-weighted domain size depends only on the Cauchy integral breadth of the size-broad- ened profile
(ii) The hook effect occurs when the Cauchy-content of the size-broadened profile is un-
derestimated that is for ^sc(n2)^3sG Usually this happens when the background is estimated too high so the long tails of the Cauchy function are prematurely cut off
(iii) It also follows from conclusion (ii) that the volume-weighted domain size can not be more than twice the surface-weighted domain size (limiting value D)v=2D)i is obtained for the pure-Cauchy size-broadened profile) Minimum value for D)J (D)j should not be less than -131
(iv) If the distortion coefficient is approxi- mated with a harmonic term this leads exactly to the Warren-Averbach method of separation of size and strain broadenings
(v) In that case mean-square strains decrease linearly with the distance L
(vi) It is possible to evaluate local strain ((e^(0))^) only in the case of pure-Gauss strain broadening Then root-mean-square strain is inde- pendent of the distance L and related to the upper limit of strain obtained from the integral breadth of the strain-broadened profile
(vii) If strain broadening is not described exclu- sively with the Gauss function the multiple-line Voigt integral breadth and Warren-Averbach analyses can not give the same results for volume- weighted domain size although D)v is defined identically in both approaches because the appar- ent strain -q = pdeg(29)cot9 is not angular- independent
(viii) Smooth size coefficients give column- length distribution functions without oscillations and make possible a computation of volume- weighted average domain sizes up to ~5000 A
(ix) Comparison with the simplified integral- breadth methods in most cases has shown not large but systematic discrepancy of results indicat- ing that size and strain broadening can not be accu- rately modeled by a single Cauchy or Gauss function Moreover the application of the single- line method is much less reliable and it should not be used where multiple reflections are available
(x) The knowledge of all phases present in the sample and their crystallographic structure is re- quired to successfully fit a cluster of overlapping peaks Although it is very difficult to accurately de- termine the Cauchy-Gauss ratio of an overlapped peak final results of domain size and strain are much less affected Therefore connecting the crys- tallite size exclusively with the Cauchy content and strain with the Gauss content of a specimen profile might be doubtful
(xi) Evaluated errors of domain sizes and strains increase substantially with the degree of
350
Volume 98 Number 3 May-June 1993
Journal of Research of the National Institute of Standards and Technology
peak overlapping Hence for complicated patterns very accurate measurements are necessary and one needs to analyze as many reflections in the same crystallographic direction as possible
(xii) Line-broadening analysis of (La-M)2Cu04 and Bi-Cu-O compounds confirms high anisotropy in these materials
(xiii) Strains in (La-M)2Cu04 probably origi- nate from dislocations and from different sizes of host and dopant ions
(xiv) Stacking-fault probability in (La-M)2Cu04 (M = Ba Ca Sr) increases with increasing Tc whereas the average strain decreases
(xv) In La2Cu04 different broadening of (lOO) and (OfcO) reflections is not caused by stacking faults
(xvi) All Bi-Cu-0 superconductors show larger strain in the c-direction than in the a-b plane which can be explained by stacking disorder along the [001] direction
(xvii) In the specimen with approximately equal amounts of Tl-2212 and TlPb-2223 phases it is likely that a secondary phase develops by the growth of the microscopic faulted regions of the primary phase
Acknowledgments
I am thankful to Dr Harry McHenry for his support and especially to Dr Hassel Ledbetter for his wise guidance and most useful help during my stay at NIST I am also indebted to my home insti- tution the Faculty of Metallurgy of the University of Zagreb for allowing me the leave of absence at NIST
8 References
[1] W Friedrich P Knipping and M v Laue Ann Physik 41 971 (1912)
[2] H M Rietveld Acta Cryst 22 151 (1967) [3] H M Rietveld J Appl Cryst 2 65 (1969) [4] S A Howard and K D Preston in Modern Powder Dif-
fraction Vol 20 The Mineralogical Society of America Washington DC (1989) p 217
[5] D Taupin J Appl Cryst 6 266 (1973) [6] T C Huang and W Parrish Appl Phys Lett 27 123
(1975) [7] M K Wu J R Ashburn C J Torng P H Hor R L
Meng L Gao Z J Hwang Y Q Wang and C W Chu Phys Rev Lett 58 908 (1987)
[8] D Shi MRS Bull 16 37 (1991) [9] D Larbalestier Phys Today 44 74 (1991)
[10] J C Phillips Phys Rev B 4512647 (1992) [11] B Raveau Phys Today 45 53 (1992) [12] A J Millis and K M Rabe Phys Rev B 38 8908 (1988)
[13] F Guinea Europhys Lett 7 549 (1988) [14] C P Dhard and P Singh in Proc Int Symp High-Temp
Supercond Jaipur India Oxford amp IBH Publishing New Delhi (1988) p 271
[15] J D Jorgensen Phys Today 44 34 (1991) [16] J G Bednorz and K A Muller Z Phys B 64 189
(1986) [17] K Kishio K Kitazawa S Kaube I Yasuda N Sugii H
Takagi S Uchida K Fueki and S Tanaka Chem Lett 429 (1987)
[18] J D Jorgensen B Dabrowski S Pei D G Hinks L Soderholm B Morosin J E Venturini and D S Ginley Phys Rev B 38 11337 (1988)
[19] J R Clem Phys Rev B 43 7837 (1991) [20] M Paranthaman M Foldejiki D Balzar H Ledbetter
A J Nelson and A M Hermann submitted to Phys Rev B
[21] A R Stokes Proc Phys Soc Lond 61 382 (1948) [22] B E Warren and B L Averbach J Appl Phys 23 497
(1952) [23] R Delhez Th H de Keijser and E J Mittemeijer in
Accuracy in Powder Diffraction S Block and C R Hub- bard eds Natl Bur Stand (US) Special Publication 567 (1980) p 213
[24] H P Klug and L E Alexander X-ray Diffraction Proce- dures 2nd Edition John Wiley New York (1974) p 661
[25] J I Langford J Appl Ciyst 11 10 (1978) [26] J I Langford in Accuracy in Powder Diffraction S
Block and C R Hubbard eds Natl Bur Stand (US) Special Pubication 567 (1950) p 255
[27] R Delhez Th H de Keijser and E J Mittemeijer Fre- senius Z Anal Chem 312 1 (1982)
[28] A J C Wilson Proc Phys Soc Lond 80 286 (1962) [29] A J C Wilson Proc Phys Soc Lond 81 41 (1963) [30] L P Smith Phys Rev 46 343 (1934) [31] H C Burger and P H van Cittert Z Phys 79 722
(1932) [32] S Ergun J Appl Ciyst 1 19 (1968) [33] R Croche and L Gatineau J Appl Ciyst 10479 (1977) [34] L H Schwarz and J B Cohen Diffraction from Materi-
als Academic Press New York (1977) p 391 [35] R Delhez Th H de Keijser E J Mittemeijer and J I
Langford J Appl Cryst 19 459 (1986) [36] R Delhez Th H de Keijser E J Mittemeijer and J I
Langford Aust J Phys 41 213 (1988) [37] R A Young and D B Wiles J Appl Cryst 15 430
(1982) [38] W Voigt Stizungsber K Bayer Akad Wiss 42 603
(1912) [39] E E Whiting J Quant Spectrosc Radiat Transfer 8
1379 (1968) [40] G K Wertheim M A Butler K W West and D N E
Buchanan Rev Sci Instrum 111369 (1974) [41] M M Hall Jr V G Veeraraghavan H Rubin and P G
Winchell J Appl Cryst 10 66 (1977) [42] A Brown and J W Edmonds Adv X-Ray Anal 23 361
(1980) [43] P Suortti M Ahtee L Unonius J Appl Cryst 12 365
(1979) [44] T Sundius J Raman Spectrosc 1 471 (1973) [45] B H Armstrong J Quant Spectrosc Radiat Transfer 7
61 (1967) [46] J F Kielkopf J Opt Soc Am 63 987 (1973) [47] B P Asthana and W Kiefer Appl Spectr 36 250
(1982)
351
Volume 98 Number 3 May-June 1993
Journal of Research of the National Institute of Standards and Technology
[48] J P M de Vreede S C Mehrotra A Tal and H A Dijkerraan Appl Spectr 36 227 (1982)
[49] F R L Schoening Ada Ciyst 18 975 (1965) [50] P Scherrer Gott Nachr 2 98 (1918) [51] A R Stokes and A J C Wilson Proc Cambridge
Philos Soc 38 313 (1942) [52] A J C Wilson X-Ray Optics 2nd edition Methuen
London (1962) [53] S Leie and T R Anantharaman Proc Indian Acad
Sci Sect A H 261 (1966) [54] D Louer D Weigel and J I Langford J Appl Ciyst
5 353 (1972) [55] A J C Wilson J Appl Ciyst 2 181 (1969) [56] J I Langford and A J C Wilson J Appl Ciyst 11102
(1978) [57] A R Stokes and A J C Wilson Proc Phys Soc Lond
56174 (1944) [58] B E Warren and B L Averbach J Appl Phys 21 595
(1950) [59] B E Warren X-Ray Diffraction Addison-Wesley
Reading Massachusetts (1969) p 264 [60] B E Warren in Progress in Metal Physics Vol 8 Perg-
amon Press London (1959) p 146 [61] F Bertaut C R Acad Sci Paris 228 187 (1949) [62] N C Haider and C N J Wagner Acta Cryst 20 312
(1966) [63] D Balzar and H Ledbetter in Proceedings of the Accu-
racy in Powder Diffraction II Natl Inst Stand Technol (1992) p 37
[64] D Balzar and H Ledbeter J Appl Cryst 26 (1993) in press
[65] J N Eastabrook and A J C Wilson Proc Phys Soc Lond B 65 67 (1952)
[66] R S Smith IBM J Res Develop 4 205 (1960) [67] B Y Pines and A F Sirenko Soviet Physics Ciyst 715
(1962) [68] G B Mitra and N K Misra Acta Ciyst 22 454 (1967) [69] A Gangulee J Appl Ciyst 7 434 (1974) [70] J Mignot D Rondot Acta Met 231321 (1975) [71] J Mignot and D Rondot Acta Ciyst A 33 327 (1977) [72] R K Nandi H K Kuo W Schlosberg G Wissler J B
Cohen and B Crist Jr J Appl Ciyst 17 22 (1984) [73] M Zocchi Acta Ciyst A 36164 (1980) [74] P Ramarao and T R Anantharaman Trans Ind Ins
Metals 18 181 (1965) [75] R K Nandi and S P Sen Gupta J App Cryst 11 6
(1978) [76] Th H de Keijser J I Langford E J Mittemeijer and
B P Vogels J Appl Ciyst IS 308 (1982) [77] A Williams G H Kwei R B Von Dreele A C Lar-
son L D Raistrick and D L Bish Phys Rev B 37 7960 (1988)
[78] A C Larson and R B Von Dreele Los Alamos Na- tional Laboratory Report No LA-UR-86-748 (1988)
[79] J D Jorgensen D H Johnson M H Mueller J G Worlton and R B Von Dreele in Proceedings of the Conference on Diffraction Profile Analysis Cracow Poland (1978) p 20
[80] R B Von Dreele J D Jorgensen and C G Windsor J Appl Ciyst 15 581 (1982)
[81] P Thompson D E Cox and J B Hastings J Appl Ciyst 20 79 (1987)
[82] J P Singh R A Guttschow D S Kupperman J T Dusek and R B Poeppel in High Temperature Super-
conducting Compounds III S Whang A Gupta and E Ceilings eds TMS AIME Warrendale (1991) p 281
[83] M O Eatough D S Glnley and B Morosin Adv X- Ray Anal 33 145 (1990)
[84] E J Peterson P J Kung R E Muenchausen and D M Smith in Proceedings of the 41st Annual Denver Conference on Applications of X-Ray Analysis Colo- rado Springs Colorado (1992) p 74
[85] M Rand J I Langford and J S Abell submitted to J Cryogenics (1992)
[86] D Balzar J Appl Ciyst 25 559 (1992) [87] D Balzar H Ledbetter and A Roshko Physica C 185-
189 871 (1991) [88] D Balzar and H Ledbetter J Mater Sci Lett 111419
(1992) [89] D Balzar H Ledbetter and A Roshko Pow Diffr 8
(1993) in press [90] S Johnson M Gusraan D Rowcliffe T Geballe and J
Sun Adv Ceram Mater 2 337 (1987) [91] H Ledbetter S A Kim R B Goldfarb and K Togano
Phys Rev B 39 9689 (1989) [92] H Friedman Electronics 132 (1945) [93] W Parrish (ed) in Advances in X-Ray Diffractometry
and X-Ray Spectrography Centrex Publishing Company Eindhoven The Netheriands (1962)
[94] W Soller Phys Rev 24158 (1924) [95] S A Howard R L Snyder J Appl Ciyst 22 238
(1989) [96] G H Stout and L H Jensen X-Ray Structure Determi-
nation 2nd edition Wiley New York (1989) p 373 [97] D E Appleman and T Evans Jr Final Report 92-14
US Geological Survey Washington DC (1973) Avail- able as NTIS Document No PB-216188
[98] M U Cohen Rev Sci Instrum 6 68 (1935) [99] M U Cohen Rev Sci Instrum 7 155 (1936) [100] M H Mueller L Heaton and K T Miller Acta Ciyst
13 828 (1960) [101] R A Young P E Mackie and R B Von Dreele J
Appl Ciyst 10 262 (1977) [102] D B Wiles and R A Young J Appl Cryst 14 149
(1981) [103] J K Yau and S A Howard J Appl Ciyst 22 244
(1989) [104] S A Howard J K Yau and H U Anderson J Appl
Phys 65 1492 (1989) [105] S Enzo G Fagherazzi A Benedetti and S Poilizzi J
Appl Ciyst 21 536 (1988) [106] A Benedetti G Fagherazzi S Enzo and M
Battagliarin J Appl Cryst 21 543 (1988) [107] Th H de Keijser E J Mittemeijer and H C F Rozen-
daal J Appl Ciyst 16 309 (1983) [108] Y Zhang J M Stewart C R Hubbard and B Mo-
rosin Adv X-Ray Anal 33 373 (1990) [109] Y Wang S Lee and Y Ue J Appl Ciyst IS 35
(1982) [110] V N Selivanov and E F Smislov Zavod Lab 57 28
(1991) [Ill] A Guinier X-Ray Diffraction W H Freeman San
Francisco (1963) p 139 [112] M Wilkens J Appl Cryst 12119 (1979) [113] D Du and Y Wang Pow Diffr 2180 (1987) [114] A P Prudnikov Yu A Brychkov and O L Marichev
Integrals and Series Vol 1 Gordon and Breach Am- sterdam The Netheriands (1986) p 344
352
Volume 98 Number 3 May-June 1993
Journal of Research of the National Institute of Standards and Technology
[115] R L Rothman and J B Cohen J Appl Phys 42 971 (1971)
[116] T Adier and C R Houska J Appl Phys 50 3282 (1979)
[117] C R Houska and T M Smith J Appl Phys 52 748 (1981)
[118] S Rao and C R Houska Acta Ciyst A 4214 (1986) [119] J I Langford R Delhez Th H de Keijser and E J
Mittemeijer Ausi J Phys 41173 (1988) [120] J I Langfoid J Appl Cryst IS 315 (1982) [121] M J Turunen Th H de Keijser R Delhez and N M
van der Pers J Appl Ciyst 16176 (1983) [122] A J C Wilson Acta Ciyst 23 888 (1967) [123] A J C Wilson Acta Ciyst A 24 478 (1968) [124] A J C Wilson Acta Ciyst A 25 584 (1969) [125] G Gagliotti A Paoletti and F P Ricci Nucl Instrum
3 223 (1958) [126] J I Langford R J Cernik and D Louer J Appl
Ciyst 24 913 (1991) [127] J I Langford in Accuracy in Powder Diffraction II
preprint [128] A J C Wilson Mathematical Theory of X-Ray Powder
Diffractometiy Centrex Eindhoven The Netherlands (1963)
[129] J L Langford Prog Ciyst Growth and Charact 14185 (1987)
[130] T G Fawcett C E Crowder S J Brownell Y Zhang C R Hubbard W Schreiner G P Hamill T C Huang E Sabino J I Langford R Hamilton and D Louer Pow Diffr 3 209 (1988)
[131] W L Smith J Appl Ciyst 9187 (1976) [132] J L Langford and D Louer J Appl Ciyst 15 20
(1982) [133] Fl Popescu and L Benes Acta Ciyst A 33 323 (1977) [134] P PSuse^cu R MSnaila M Popescu and E Jijovici j
Appl Cryst 7 281 (1974) [135] P F Bley Y Calvayrac and M Fayard J Appl Ciyst
7 493 (1974) [136] B Moraweck Ph de Montgolfier and A J Renouprez
J Appl Ciyst 10191 (1977) [137] A Le Bail and D Louer J Appl Cryst 11 50 (1978) [138] D R Buchanan R L McCuUough and R L Miller
Acta Ciyst 20 922 (1966) [139] P Suortti and L D Jennings Acta Cryst A 33 1012
(1977) [140] J B Cohen and C N J Wagner J Appl Phys 33 2073
(1962) [141] A Bianconi J Budnick A M Flank A Fontaine P
Lagarde A Marcelli H Tolentino B Chamberland C Michel B Raveau and G Demazeau Phys Lett A127 285 (1988)
[142] K Fueki K Kitazawa K Kishio T Hasegawa S Uchida H Takagi and S Tanaka in Chemistiy of High- Temperature Superconductors D L Nelson M S Whittingham and T F George eds American Chemi- cal Society (1987) p 38
[143] T Fujita Y Aoki Y Maeno J Sakurai H Fukuba and H Fujii J Appl Phys 26 U68 (1987)
[144] R M Hazen in Physical Properties of High-rc Super- conductors Vol 2 D M Ginsberg ed World Scien- tific Singapore (1990) p 121
[145] J B Torrance A Bezinge A I Nazzal T C Huang S P Parkin D T Keane S J LaPlaca P M Horn and G A Held Phys Rev B 40 8872 (1989)
[146] J D Axe A H Moudden D Hohlwein D E Cox K
M Mohanty A R Moodenbaugh and Y Xu Phys Rev Lett 62 2751 (1989)
[147] T Suzuki and T Fujita Physica C 159 111 (1989) [148] T Fujita and Y Maeno in Superconducting Materials
JJAP Series 1 (1988) p 34 [149] A Roshko and Y-M Chiang J Appl Phys 66 3710
(1989) [150] D E Cox S C Moss R L Meng P H Hor and C W
Chu J Mater Res 31327 (1988) [151] B Crist and J B Cohen J Polym Sci 17 1001 (1979) [152] H Ledbetter S Kim and A Roshko Z Phys B 89275
(1992) [153] R D Shannon and C T Prewitt Acta Ciyst B 25 925
(1969) [154] M Lang H Spille F Steglich Y Hidaka T Murakami
and Y Endoh Physica C 162-1641037 (1989) [155] Y Hidaka and T Murakami Phase trans 15 241
(1989) [156] P L Gai and E M McCarron Science 247 553 (1990) [157] T Kamiyama I Izumi H Asano H Takagi S Uchida
Y Tokura E Takayama-Muromachi M Matsuda K Yamada Y Endoh and Y Hidaka Physica C 172 120 (1990)
[158] A Kapitulnik Physica C 153-155 520 (1988) [159] L A Muradyan V N Molchanov R A Tamazyan and
V I Simonov Physica C 162-164 536 (1989) [160] P Day M Rosseinsky K Prassides W I F David O
Moze and A Soper J Phys C 20 L429 (1987) [161] J T Lewandowski R A Beyerlein J M Longo and R
A McCauley J Amer Ceram Soc 69 699 (1986) [162] R Ramesh G van Tendeloo G Thomas S M Green
Y Mei C Jiang and H L Luo Appl Phys Lett 53 2220 (1988)
[163] J Schneck L Pierre J C Tolddano and C Daguet Phys Rev B 39 9624 (1989)
[164] O Eibl Physica C 168 215 (1990) [165] W Carrilo-Cabrera and W Gopel Physica C 161 373
(1989) [166] P Bordet J J Capponi C Chaillout J Chenavas A
W Hewat E A Hewat J L Hodeau M Marezio J L Tholence and D Tranqui Physica C 156189 (1988)
[167] R Ramesh K Remschnig J M Tarascon and S M Green J Mater Res 6 278 (1991)
[168] Z Hiroi Y Ikeda M Takano and Y Bando J Mater Res 6 435 (1991)
[169] Y Inoue M Hasegawa Y Shichi I Munakata M Ya- manaka S Hiyama and O Nittono J Mater Res 5 737 (1990)
[170] R Ramesh B G Bagley J M Tarascon S M Green M L Rudee and H L Luo J Appl Phys 67 379 (1990)
[171] X B Kan J Kulik P C Chow S C Moss Y F Yan J H Wang and Z X Zhao J Mater Res 5 731 (1990)
[172] G S Pawley J Appl Ciyst 13 630 (1980) [173] H Toraya J Appl Ciyst 19 440 (1986) [174] L Lutterotti and P Scardi J Appl Ciyst 23 246
(1990)
About the author Davor Balzar is with Faculty of Metallurgy of the University of Zagreb Sisak Croatia and was a Guest Researcher at fflST The National Institute of Standards and Technology is an agency of the Technology Administration US Department of Commerce
353
Volume 98 Number 3 May-June 1993
Journal of Research of the National Institute of Standards and Technology
strain broadening all derivatives of strain in L = 0 are infinite and local strain can not be defined If the main origin of strains is dislocations [115] strains are defined after some distance from the dislocation (cutoff radius) to be finite Averaging strains over a region smaller than the Burgers vector is probably not justified For instance Eq (48) gives even for a small averaging distance L = 1 A and considerable strain broadening (J3DG(20) = 3DC(20) = 1O) root-mean-square strain eL = 1A))^ laquo02 that is about the elastic limit
45 Random Errors of Derived Parameters
Errors in size and strain analysis of broadened peaks are relatively difficult to evaluate Following Langford [26] sources of the systematic errors in- clude choice of standard specimen background and type of analytical function used to describe the line profiles The first two errors should be mini- mized in the experimental procedure Errors caused by inadequate choice of specimen function would systematically affect all derived results but they can not be evaluated Random errors caused by counting statistics have been computed by Wilson [122 123 124] and applied to the Stokes deconvolution method by Delhez de Keijser and Mittemeijer [23] as well as by Langford [26] and de Keijser et al [76] using single-line Voigt-func- tion analysis Nevertheless the approximate error magnitude can be calculated from estimated stan- dard deviations (esd) of the parameters refined in the fitting procedure In the program SHADOW the weighted least-squares error is minimized
7wp mdash RES
Here
)=1
RES = 2 vfi [ (obs) - (cal)]
(59)
(60)
and weights are the reciprocal variances of the ob- servations
H = l(obs) (61)
Each line profile has four parameters varied inde- pendently position intensity and Cauchy and Gauss integral breadths of the Voigt profile In least-squares refinement esds are computed as
^^ bu RES (62) m mdashm
Here ba are diagonal elements of the inverse matrix of the equation coefficients m is the number of observations and m is the number of refined parameters The main source of errors is integral breadths Errors in peak position peak intensity and background are much smaller and can be ne- glected in this simple approach For two indepen- dent variables )3G and Pc covariance vanishes and from Eqs (37) and (38) for the two orders of re- flection and +1 it follows that
RD =
si+i)m)RHMi))+si)m+i)i^(3c(+D)
(63)
ReL)r) =
pHDRHPcG)) + m + miPcJl + D) 2[3c(+1) - i8c()3+TTL [m+1) - mw
-n-LmiDRHihd))+m+mWcH+i))i ^ 2[)3c(+1) - iSc()+TTLim+1) - mw
(65)
Here Rx) are relative standard deviations The error in D would be complicated to evaluate but because 131D)s^(Igt)vlt2(pound))s Eq (63) gives a good estimation for the error in (Z))v as well Alter- natively to see how errors depend on the Fourier coefficients errors can be estimated from the Warren-Averbach relationship [Eq (20)] (86) From Eq (32) it follows that
RA (L)) = ATr^Lpos)R^2d)) +
4Lph(s)RPci2e)) (66)
Errors in root-mean-square strains and domain sizes are
i^((e^(L ))bulllaquo) =
RHA(Ll))+RHA(Ll + l)) (67)
ALl + l)
335
Volume 98 Number 3 May-June 1993
Journal of Research of the National Institute of Standards and Technology
^^laquo^))=(T^)
s(l + 1)RHA (Ll)) +SV)RHA (Ll + D) lsl + l)-sl)f (68)
Here (D) is approximately defined with A^(L) = l-L(D)j Errors in Fourier coefficients increase with L while factors in Eqs (67) and (68) lower the errors for large L In general errors of domain sizes and strains are of the same order of magnitude as errors of integral breadths [86]
5 Application 51 Correction for Instrumental Broadening
Before specimen broadening is analyzed instru- mental broadening must be determined This is ac- complished by carefully measuring diffraction peaks of some well-annealed defect-free speci- men It is then assumed that its broadening may be attributed only to the instrument The usual proce- dure is to anneal the specimen However in some instances that is not possible because either the material undergoes an irreversible phase transition on annealing or the number of defects can not be successfully decreased by annealing Another pos- sibility is to measure the whole diffraction pattern of the material showing the minimal line broaden- ing and then to synthesize the instrumental profile at the needed diffraction angle This approach re- quires the modeling of the angle dependence of the instrumental (standard) parameters Cagliotti Pao- letti and Ricci [125] proposed the following func- tion to describe the variation of the full width at the half maximum of profile with the diffraction angle
F9miA^(2e) = Utan^9 + Vtand + W (69)
Although this function was derived for neutron dif- fraction it was confirmed to work well also in x-ray diffraction case [126 127] A more appropriate function for the x-ray angle-dispersive powder dif- fractometer based on theoretically predicted er- rors of some instrumental parameters [128] may be the following [129]
FWHNf (2 e) = W+Vsin^l 6 +
UtanH + UcotH (70)
This function may better model the increased axial divergency at low angles and correct for the speci- men transparency [129] However contrary to the requirement on the specimen function most im- portant for the instrumental function is to correctly describe the angular variation of parameters re- gardless of its theoretical foundation
When specimen broadening is modeled with a Voigt function the simplest way to correct for the instrumental broadening is by fitting the line pro- files with the Voigt function too Cauchy and Gauss integral breadths of the specimen-broad- ened profile are then easily computable by Eqs (7) and (8) However because the instrumental broad- ening is asymmetric [24] modeling with the sym- metric Voigt function can cause a fictitious error distribution resulting in errors of strain up to 35 [76] Another approach is to model the instrumen- tal-broadening angle dependence by fitting the profile shapes of a standard specimen with some asymmetrical function split-Pearson-VII [95] or pseudo-Voigt convoluted with the exponential function [105] The instrumental function can then be synthesized at any desired angle of diffraction and convoluted with the assumed specimen func- tion to match the observed profile by means of Eq (2)
In the program SHADOW instrumental para- meters are determined by fitting the split-Pearson VII function (see Fig 9) to line profiles of a standard specimen
iix)=m- 2 m
with
c =-
mc^f
mm) mv-rim-12)
(71)
(72)
Here m = 1 or m = ltraquo yields a Cauchy or Gauss function respectively Refined full widths at half maximum (FWHM) and shape factors m for both low-angle and high-angle sides of the profiles are fitted with second-order polynomials To fit the FWHM we used Eq (69) and for the shape fac- tors
m(2e) = U(20f + V(2e) + W (73)
The resulting coefficients U V W U V and W permit synthesis of the asymmetrical instrumental line profile at any desired angle
336
Volume 98 Number 3 May-June 1993
Journal of Research of the National Institute of Standards and Technology
2 0(deg)
le
Fig 9 A split-Pearson VII profile The two half profiles have same peak position and intensity Adapted from Howard and Preston [4]
The basic requirement on the standard specimen is however to show as small a line broadening as possible To minimize physical contributions to the Une broadening of the standard specimen a few moments were emphasized as follows Because dif- fraction-line width depends strongly on degree of annealing it is preferable to use some reference powder-diffraction standard Furthermore asym- metry in the peak profiles is introduced by axial divergence of the beam flat specimen surface and specimen transparency [24] Choosing a standard specimen with low absorption coefficient would cause transparency effects to dominate If the stud- ied specimen has a large absorption coefficient (compared to the standard) this might produce a fictitious size contribution and errors in micro- strains All of the specimens studied have absorp- tion coefficients exceeding 1000 cm^ so a NIST standard reference material 660 LaBe was chosen to model the instrumental broadening (p = 1098 cm) According to Fawcett et al [130] LaBe showed the narrowest lines of all studied com- pounds Furthermore LaB6_has a primitive cubic structure (space group Pm3m) resulting in rela- tively large number of peaks equally distributed over 26 This allows for better characterization and lower errors of FWHMs and shape factors of split- Pearson VII functions (Fig 10)
52 Applicability of the Method
To study the applicability of method described in Sec 4 we first studied simple cubic-structure mate- rials such as silver and tungsten Tungsten has very narrow line profiles allowing us to obtain the up- per limit of domain sizes that can be studied Silver is easily deformed which provides a possibility to apply the method to broad line profiles To test the
009
-a
OH
006
003
1 1 m low-angle side n m high-angle side
bullz w 2 o OH
X
tancopy
Fig 10 Refined FWHMs and shape factors (exponents) m for low-angle and high-angle sides of LaBe line profiles Second- order polynomials were fitted through points
case of relatively complicated patterns and weak line broadening the method was also applied to Lai85Sroi5Cu04 and La2Cu04 powders In this sec- tion only the mechanical aspects of the line broad- ening are discussed Discussion about the origins of broadening of superconductors can be found in Sec 6
521 Silver and Tungsten Powders Figure 11 shows observed and refined peaks of tungsten un- treated and silver ground powders In Table 2 are listed results of fitted pure-specimen Voigt profiles for silver and tungsten specimens Table 3 and Fig 12 give results of the line-broadening analysis Untreated tungsten powder shows relatively weak broadening Instrumental profile FWHMs at angle positions of (110) and (220) tungsten lines are 0059deg and 0081deg respectively close to values mea- sured for tungsten 0065deg and 0100deg Results in Table 3 reveal that small broadening is likely caused by domain sizes because microstrains have negligible value This pushes the limit for measur- able domain sizes probably up to 4500-5000 A However one must be aware that weak specimen broadening implies higher uncertainty of all derived parameters Moreover the choice of the instrumental standard becomes more crucial
Both silver and tungsten line profiles become more Cauchy-like after grinding which probably increases dislocation density in the crystallites This is consistent with the presumption that small crystallites and incoherently diffracting domains separated by dislocations within grains affect the tails of the diffraction-line profiles [60115] Figure 13 illustrates the dependence of MSS on the recip- rocal of the averaging distance L
337
Volume 98 Number 3 May-June 1993
Journal of Research of the National Institute of Standards and Technology
C8
z
7- ^95
29 (deg) 405
bullJf^r-
z S 08
Ez U o u OS
a
04 bull
o Es
4P
2000 z^fA
4000
B
z u f- z
425 435 445 29 (deg)
455
yr 600 SOO
L(A)
Fig 11 Observed points (pluses) refined pattern (full line) and difference pattern (below) (110) W untreated (upper) (200) Ag ground (lower)
Fig 12 Fourier coefficients for the first- (pluses) and second- order (crosses) reflection and size coefficients (circles) [111] Ag untreated (upper) [100] Ag ground (lower)
Table 2 Parameters of the pure-specimen Voigt function as obtained from profile-fitting procedure for tungsten and silver powders
Specimen hkl 2ft(deg) 3c(deg) 3G(deg) FWHM(deg) Rwp()
W untreated 110 220
4028 8705
00065(7) 00301(6)
0020(2) ltio-
0021 0019
90 44
W ground 110 220
4029 8705
0100(2) 0222(3)
0038(4) 0069(6)
0080 0166
90 42
Ag untreated 111 222 200 400
3806 8151 4425 9786
0056(1) 0105(4) 0118(2) 0274(21)
ltio- 00008(21)
ltio-^ ltio-5
0036 0067 0075 0175
105 97
105 122
Ag ground 111 222 200 400
3807 8151 4424 9783
0175(3) 0410(26) 0365(10) 1079(82)
0038(12) ltio-
0076(29) ltio-
0121 0261 0250 0687
99 145 99
145
338
Volume 98 Number 3 May-June 1993
Journal of Research of the National Institute of Standards and Technology
Table 3 Microstructural parameters for tungsten and silver powders
Specimen Direction (poundgt)raquo( A) (2))v(A) ltpound^(fl3))laquo (^laquoD)v2)gtw
W untreated [110] 3200(200) 3500(200) 000038 000008(2)
W ground [110] 620(20) 1030(30) 00023 000054(2)
Ag untreated [111] [100]
1000(20) 510(20)
2000(20) 1030(20)
00010 00022
000024(1) 000047(5)
Ag ground [111] [100]
380(20) 210(10)
650(20) 350(20)
00047 00100
000095(7) 000180(14)
100 -_ - [100) Ag ground ^ ^~ mdash C1111 Ag ground ^bull
y y
o y ^ 50 A y
y y
y
0
y - y ^--
c ) 50 100 150
lLfAjxlO^
Fig 13 Mean-square strains (E^) as a function of VL
Errors in integral breadths allow estimation of errors in strain and size parameters (Sec 45) but in some cases the refinement algorithm gives unre- liable errors of integral breadths When a particu- lar parameter is close to the limiting value (for instance 10^ degrees has been put as the mini- mum value for integral breadths) errors become large However in Eqs (63) (65) (66) (67) and (68) only the product of integral breadth and ac- companying error is significant which is roughly equal for Cauchy and Gauss parts Errors of do- main sizes and strains are of the same order of magnitude as errors of integral breadths
The possible source of systematic error is poten- tial inadequacy of Voigt function to accurately de- scribe specimen broadening This effect can not be evaluated analytically but it would affect all derived parameters especially the column-length distribution functions The logical relationship be- tween values of domain sizes (see Table 3) for dif- ferent degrees of broadening indicates that possible systematic errors can not be large
Equation (41) allows computation of volume- weighted and surface-weighted average domain sizes if respective column-length distribution func- tions can be obtained Figure 14 gives surface- weighted and volume-weighted average column- length distribution functions following Eqs (39) and (38) Width of the distribution function deter- mines the relative difference between (D) and (pound))v The broader the distribution the larger the differences because small crystallites contribute more to the surface-weighted average That is much more evident comparing the surface- weighted column-length distribution with the vol- ume-weighted If they have similar shape and maximum position as in Fig 15 differences are small Conversely if the surface-weighted distribu- tion function has a sharp maximum toward smaller sizes differences are larger (see Fig 14) The dif- ference between (poundgt)s and (D)v and the actual mean dimension of the crystallites in a particular direction also depends strongly on the average shape of the crystallites [52 131 132]
If experimental profiles are deconvoluted by the Stokes method even for considerable specimen broadening size coefficients A ^ usually oscillate at larger L values [59 106] preventing computation of the column-length distribution function Few techniques were used to deal with this problem successive convolution unfolding method [32 133] smoothing and iterative methods [134 135 136 137] Figures 14 and 15 show very smooth column- length distribution functions However they follow from size coefficients ^4^ that depend on the accu- racy of the approximation for the distortion coeffi- cient given by Eq (47) Equation (47) is exact if the strain distribution is Gaussian but in general holds only for small harmonic numbers n if strain broadening is not negligible
339
Volume 98 Number 3 May-June 1993
Journal of Research of the National Institute of Standards and Technology
500 1000 L(A)
Fig 14 Surface-weighted and volume-weighted column-length distribution functions normalized on unit area [111] Ag un- treated (upper) [100] Ag ground (lower)
Fig 15 Surface-weighted and volume-weighted column-length distribution functions for [010] La2Cu04 normalized on unit area
522 La2-xSrtCu04 Powders To test the applicability of the discussed method to more com- plicated patterns two compounds with lower crystallographic symmetry were studied Lai85Sroi5Cii04 has a tetragonal K2NiF4-type struc- ture space group lAlmmm La2Cu04 is orthorhom-
bic at room temperature Both compounds show slight line broadening and relatively highly overlap- ping peaks (see Fig 16) which makes it very diffi- cult if not impossible to perform a Stokes analysis
25
-25
26 (deg)
yNraquo-
Fig 16 Observed points (pluses) refined pattern (full line) convoluted profiles (dashed line) and difference plot (below) for part of La2Cu04 pattern
Tables 4 and 5 list results from the fitting proce- dure and the analysis of specimen-broadened inte- gral breadths There are no qualitative differences in results for tungsten and silver powders How- ever average errors are higher as expected be- cause of overlapping peaks while weighted errors wp are surprisingly smaller This fact illustrates the unreliability of iwp when only a segment of the pat- tern is being refined because it depends on the number of counts accumulated in points as well as on the 28 range of the refinement
Figures 17 and 18 represent Fourier coefficients of Lai85Sroi5Cu04 [110] and La2Cu04 [010] direc- tions In the second plot the A (L )-versus-L plot shows a concave-downward part near L =0 the so- called hook effect It was shown in Sec 42 that the hook effect originates because of underesti- mation of background connected with the trunca- tion of profiles In the profile refinement all peaks separated less than 4deg 20 have been included in the refinement region to avoid possible overlapping of peak tails and specimen profiles have been trun- cated below 01 of the maximum intensity How- ever because the polynomial background was determined prior to profile refinement it may be overestimated for complicated patterns containing many overlapping peaks If background is refined with other profile parameters undesirable correla- tion with integral breadths occurs
340
Volume 98 Number 3 May-June 1993
Journal of Research of the National Institute of Standards and Technology
Table 4 Parameters of the pure-specimen Voigt function as obtained from profile-fitting procedure for La2-^SrCu04 powders
Specimen hid 2Hdeg) Pen PcO FWHM(deg) Rp()
Lai85Sroi5Cu04 004 2695 0046(4) 0024(8) 0042 34 006 4092 0083(5) ltio-= 0053 62 110 3352 0110(5) ltio- 0070 125 220 7046 0171(9) ltio- 0109 43
La2Cu04 004 2713 0061(8) 0045(9) 0067 39 006 4119 0124(7) ltio-^ 0079 77 020 3316 0074(10) 0078(10) 0102 29 040 6957 0210(30) 0026(81) 0135 29 200 3345 0074(8) 0061(10) 0087 69 400 7028 0130(10) 0023(95) 0089 29
Table 5 Microstructural parameters for Laij(5Srai3Cu04 and La2Cu04 powders
Specimen Direction (DUA) Pgt(A) lte^(fl3))laquo lte2((Z)gt2))laquo
Lai83Sro5Cu04
La2Cu04
[001] [110]
[001] [010] [100]
1700(300) 470(20)
1100(100) 680(50) 680(50)
2000(200) 940(20)
1200(100) 760(50) 810(50)
00024 00017
00038 00033 00016
000049(9) 000044(6)
00008(1) 00007(2) 00003(3)
c i ^- raquo sect 08 bulli - U
^0
ti- bull ll bull bullbullo
ffl M P bull- u ^ Di 04 Si - M bulldiamsbullbull a bull-v 3 o ^^=s^
u ^N^Sraquoraquo^
0 ^^^aaaa 1000
L(A) 2000
OQ bullbulldego UM o z a 08
o o bull bull bull
- u u bull raquo UU bull
a diams o bull o u ft 04 bull deg raquo deg - U bull bull deg Oi bullbullgt =3 bull- l o k u
0 bullbullbullraquo aaaMMi
500 1000
L(A)
Fig 17 Fourier coefficients for the first- (pluses) and second- order (crosses) reflection and size coefficients (circles) for [110] Lai^Sroi5Cu04
Fig 18 Fourier coefficients for first- (pluses) and second- order (crosses) reflection and size coefficients (circles) for [010] La2Cu04
341
Volume 98 Number 3 May-June 1993
Journal of Research of the National Institute of Standards and Technology
S3 Comparison with the Integral-Breadth Methods
Knowing the specimen integral breadths simpli- fied methods can be applied In Sec 212 we re- viewed multiple-line and single-line integral- breadth methods We shall compare the simplified multiple-line methods [Eqs (23) (24) and (30)] and the single-line method [76] [Eqs (29) and (30)] with results obtained for silver tungsten and La2-xSrxCu04 powders (Tables 3 and 5) We did not compare with the multiple-line Voigt-function method [26] because it was shown in Sec 44 that it is incompatible with the Warren-Averbach analy- sis In Table 6 integral breadth Pi was computed according to Eq (11) This value was compared with )8A integral breadth computed from Fourier coefficients [58]
i8A=- laquo3 2^(L)
(74)
Results obtained by the Warren-Averbach analysis are significantly smaller for both size and strain Integral-breadth methods give the upper limit for strain so comparison is limited Considering the approximation e = 125e^(L))^ [138] with L=(D)v2 or L=(D)s2 strains resemble more closely than crystallite sizes It must be noted how- ever that this approximation makes sense only in the case of pure-Gauss strain broadening Benedetti et al [106] reported excellent agreement for both size and strain using Warren-Averbach and Cauchy-Gauss [Eq (24)] methods Results from Table 6 on the contrary indicate that the Gauss-Gauss approximation gives values closest to the Warren-Averbach method for crystallite sizes whereas the Cauchy-Gauss and especially the Cauchy-Cauchy approximation tend to give too large values For strain the trend is opposite The Cauchy-Cauchy approximation resembles most
Table 6 Comparison of results obtained with the integral-breadth methods Cauchy-Cauchy (C-C) Cauchy-Gauss (C-G) Gauss- Gauss (G-G) and single-line (S-L) analysis
Specimen hkl PiXKP PAXKP ltigt)v (Z)gt(A) (e^((DV2)gt2 eXlO^ (A-) (A-0 (A) C-C C-G G-G S-L xlO^ C-C C-G G-G S-L
W untreated 110 220
0259 0247
0259 0247
3500 3700 3810 3810 14500 4040
008 -001 -003 -005 024 0
W ground 110 220
125 204
125 205
1030 2240 1450 1220 940 550
054 090 093 105 045 032
Ag untreated 111 2
0600 0901
0600 0900
2000 3340 2390 2190 1670 1110
024 035 039 095 0 0
200 124 124 1030 2270 1470 1230 810 047 082 085 095 0 400 204 204 490 0
Ag ground 111 222
198 352
200 352
650 2080 1240 910 530 280
095 179 182 197 048 0
200 403 406 350 9380 4780 1320 260 180 405 405 408 082 400 803 803 120 0
Lai85Sroi3Cu04 004 006
0657 0881
0650 0880
2000 5230 3290 2660 1970 1140
049 076 078 088 044 0
110 119 119 940 1240 1000 970 840 044 052 064 080 0 220 158 158 630 0
La2Cu4 004 006
0988 132
0998 131
1200 2980 1940 1630 1490 760
08 107 112 127 081 0-
020 143 142 760 1200 910 860 1240 07 079 090 110 114 040 198 200 510 016 200 126 124 810 810 810 810 1250 03 002 011 015 089 400 1S 126 830 014
Not possible to evaluate because of too small Gauss integral breadth
342
Volume 98 Number 3 May-June 1993
Journal of Research of the National Institute of Standards and Technology
closely a Warren-Averbach method These results concur with the Klug and Alexander [24] compari- son of the published size and strain values obtained by Warren-Averbach (Stokes) and integral-breadth methods However for x-ray diffraction the Cauchy-Gauss assumption for the size-strain broadening is theoretically and experimentally more favored thpoundm the other two models The fact that the Gauss-Gauss method for crystallite size and the Cauchy-Cauchy method for strain give more realistic results may mean that the presump- tion that size and strain broadening are exclusively of one type is an oversimplification
The single-line method seems much less reliable If Gaussian breadth is very small no information about strain is obtained Moreover second-order reflections give much lower values of both size and strain than do basic reflections However if multi- ple reflections are not available the single-line method can give satisfactory estimations
54 Reliability of Profile Fitting
The profile fitting of a cluster of even severely overlapping peaks can be accomplished with a low error and excellent fit of total intensity But how reliable is information obtained about separate peaks in the cluster In the fitting procedure it is possible to put constraints on the particular profile parameter to limit intensity position and width of the peak If anisotropic broadening or different phases are present constraints may not be realistic Morever acceptable results can be obtained even using a different number of profiles in refinement [4] Hence the first condition for the successful ap- plication of this method is knowledge of actual phases present in the sample and their crystalline structures
In this regard two powders were measured or- thorhombic Lai94Sroo6Cu04 has a slightly distorted K2NiF4-type structure (space group Bmab a =53510(2) A b =53692 A(2) c = 131931(7) A) and tetragonal Lai76Sro24Cu04 (space group I4mmm a =37711(3) A c = 132580(8) A) Data were collected for each specimen separately and for a specimen obtained by mixing the same pow- ders Because diffracted intensity of each phase was lower for the mixture counting time was pro- portionally increased to obtain roughly the same counting statistics Figure 19 shows two partially separated orthorhombic (020) (200) and (040) (400) peaks overlapped with tetragonal (110) and (220) reflections During the profile fitting of the mixed powders (200) orthorhombic peak tended to disappear on account of neighboring (020) and
(110) reflections Its intensity was constrained to vary in range plusmn 30 of (020) peak intensity which can be justified if the crystallographic structure is known
60
-60
345
345
335 29 (deg)
345
Fig 19 (upper) Lai76Sro24Cu04 (110) peak (middle) Lai94Sroo6Cu04 (020) and (200) peaks (lower) (110) (020) and (200) peaks
Table 7 contains results of fitted specimen-Voigt functions as well as size and strain values obtained by the analysis of broadening Comparing integral breadths of the starting and mixed powders some profiles change from more Cauchy-like to Gauss- like and vice versa This is especially evident for the (400) reflection meaning that accurate deter- mination of the profile tails is indeed affected in the cluster of overlapping peaks However integral breadth does not change significantly so results of
343
Volume 98 Number 3 May-June 1993
Journal of Research of the National Institute of Standards and Technology
Table 7 Comparison between two specimens run separately and mixed togetlier
Specimen hkl 2Hdeg) )3cO PoO DUA) (D)v(A) (e2laquoD)v2))laquoxlO
Lai76Sroj4CuOr 110 3369 0058(6) 0094(7) 780(60) 850(60) 10(1) 220 7073 022(2) 013(2)
LaiMSro(KiCu04 020 3342 0084(9) 055(14) 500(90) 1000(200) 07(1) 040 7012 010(2) 014(1) 200 3353 00216(85) 0061(8) 1100(100) 1200(100) 03(1) 400 7040 0026(11) 0088(8)
Mix 110 3367 0083(21) 0064(14) 800(300) 1200(300) 08(3) Lai76Sro24Cu04 220 7072 019(7) 013(4)
+ 020 3343 0066(35) 0070(23) 800(300) 1000(300) 07(4) Lai94Sroo6Cu04 040 7012 0116(93) 013(5)
200 3354 0024(156) 0071(61) 900(700) 1000(600) 04(12) 400 7041 011(2) 0003(320)
the multiple-line methods are not much influenced On the contrary the single-line method gives quite different results This may support the conclusion of Suortti Ahtee and Unonius [43] that the Voigt function fails to account properly for size and strain broadening simultaneously if only Cauchy integral breadth determines crystallite size
Table 7 shows that the results of Warren- Averbach analysis of starting and mixed powders agree in the range of standard deviations How- ever errors are much larger especially for the hid- den (200)-(400) reflections From Eq (62) it follows that more counts (longer counting times) and more observables (smaller step-size) would lower standard deviations Therefore in the case of highly overlapping patterns to obtain desirable ac- curacy much longer measurements are needed al- though that will not change the fact that higher overlapping implies intrinsically higher errors of all refinable parameters To further minimize possible artifacts of the fitting procedure it is desirable to include in the analysis as many reflections in the same ciystallographic direction as possible
55 Remarks
By modeling the specimen size and strain broad- ening with the simple Voigt function it is possible to obtain domain sizes and strains that agree with experiment and show a logical interrelationship Furthermore the Voigt function shows the correct 1A(26y asymptotic behavior of peak tails as ex- pected from kinematical theory [139] However if the specimen profile is significantly asymmetric (because of twins and extrinsic stacking faults [140 59]) or the ratio FWHM^ is not intermediate to the Cauchy (2Tr) and Gauss (2(ln27r)^) functions then the Voigt function can not be applied [25]
Suortti Ahtee and Unonius [43] found good over- all agreement by fitting the Voigt function to the pure-specimen profiles of a Ni powder deconvo- luted by the instrumental function However more accurate comparison is limited because of unavoid- able deconvolution ripples of specimen profiles Furthermore the Voigt function might not be flex- ible enough to model a wide range of specimen broadening as well as the different causes of broadening Therefore the question whether the Voigt function can satisfactorily describe complex specimen broadening over the whole 20 range in a general case needs further evaluation
This method of Fourier analysis with the as- sumed profile-shape function is most useful in cases when the classical Stokes analysis fails there- fore when peak overlapping occurs and specimen broadening is comparable to instrumental broaden- ing It was shown that for a high degree of peak overlapping the fitting procedure can give unreli- able results of Gauss and Cauchy integral breadths that is the peak can change easily from predomi- nantly Cauchy-like to Gauss-like and contrary This can lead to illogical values of size-integral and strain-integral breadths according to Eqs (52) (53) (54) and (55) and to irregularities in the be- havior of Fourier coefficients for large L Simulta- neously if the size-broadened profile has a large Gauss-function contribution the hook effect will occur However volume-weighted domain sizes D)y and MSS eL)) for small L are much less affected because they rely on both Cauchy and Gauss parts of the broadened profile Any integral- breadth method that attempts to describe the size and strain broadening exclusively by a Cauchy or Gauss function in this case fails completely For specimens with lower crystallographic symmetry
344
Volume 98 Number 3 May-June 1993
Journal of Research of the National Institute of Standards and Technology
when many multiple-order reflections are avail- able but the peaks are overlapped it is therefore desirable to include in the analysis as many reflec- tions as possible to minimize the potential artifacts of the fltting process
6 Analysis of Superconductors 61 (La-M)2Cu04 Superconductors
Bednorz and Miiller [16] found the first high- temperature oxide superconductor in the La-Ba- Cu-O system Soon after substituting Ba with Sr and Ca Kishio et al [17] found superconductivity in two similar compounds Later many compounds with much higher transition temperatures (Tc) were found The (La-M)2Cu04 system remains favorable for study because the cation content responsible for the superconductivity is easier to control and measure than the oxygen stoichiometry Also this system provides a wide range of substitutional cation solubility in which the tetragonal K2NiF4- type structure is maintained Compared with much- studied Y-Ba-Cu-O this structure is simpler because it contains only one copper-ion site and two oxygen-ion sites
The undoped compound La2Cu04 is orthorhom- bic at room temperature It becomes superconduct- ing either with cation substitution on La sites or increased oxygen content to more than four atoms per formula unit Doping with divalent cations in- creases the itinerant hole carriers in the oxygen- derived electron band [141] which probably causes the superconductivity However different dopants influence the transition temperature Tc Although the unit-cell c-parameter simply reflects ionic dopant size [142] the in-plane unit-cell parameter (and accordingly the Cu-0 bond length) correlates with Tc for different dopants and for different dop- ing amounts [142 143]
LaiB5MouCu04 (M = Ba Ca Sr) have a tetrago- nal K2NiF4-type structure space group lAlmmm with four atoms in the asymmetric unit [117] One site is occupied with La partially substituted with dopant ions (Fig 20) La2Cu04 is orthorhombic at room temperature The best way to correlate these two structures is to describe La2Cu04 in space group Bmab the c axis remains the same tetrago- nal [110] and [110] directions become [010] and [100] orthorhombic axes and size of the unit cell is doubled [144]
Figure 21 shows parts of the x-ray diffraction patterns observed and refined of Lai85Moi5Cu04 (M = Sr Ba Ca) and La2Cu04 Refined lattice
parameters are given in Table 8 Table 9 shows resuhs of the line-broadening analysis Relatively
La(BaCaSr)
0(2)
0(1)
Fig 20 Ciystal structure of (La-M)2Cu04 showing one unit cell
300 JUU
(b)
200
100
U 0 M J Js-r-^
30
-30
300
40 41 42 43 44 45 40 41 42 43 44 45 29 (deg) 29 (deg)
mdashA-
gt t 200
Z
F-
- 100
(c)
f V kgt ii I 40 41 42 43 44 45 40 41 42 43 44 45
e (deg) ^^ 26 (deg)
-30 wwX mdash Wlaquo-
Fig 21 Diffraction patterns of LaiH5Moi5Cu04 specimens (a) M=Sr (b) M = Ba (c)M = Ca (d) M = U
345
Volume 98 Number 3 May-June 1993
Journal of Research of the National Institute of Standards and Technology
Table 8 Lattice parameters and T^ at zero resistivity (Ac method at 10 Ma current)
Specimen a (A) bk) c(A) rc(K)
Lairaquo5Sroi5Cu04 377814(7)
Lairaquo3Baoi3Cu04 37846(2)
LaiiijCaoi5Cu04 37863(7)
La2Cu04 53558(2) 54053(2)
231(2) 36
288(4) 28
17(2) 19
1451(8)
Table 9 Results of line-broadening analysis for (La-M)2Cu4 specimens
Specimen hkl PcO PoO (DUk) (Iraquo)(A) lte^((D)2))
Lai(laquoSroj5Cu04 004 006
0046(4) 0083(5)
0024(8) ltio-
1700(300) 2000(200) 000049(9)
110 0110(5) ltio- 470(20) 940(20) 000044(6) 220 0171(9) ltio-
Lai85Baoi3Cu04 004 006
0049(6) 0110(7)
0076(6) 0089(9)
1100(200) 1100(100) 00011(2)
110 0087(4) 000042(6) 560(20) 1110(20) 000024(5) 220 0116(3) ltio-5
Laiji5Caoi5Cu04 004 006
0120(13) 0146(12)
0032(22) 0033(27)
440(70) 780(90) 00007(4)
110 0045(25) 0200(19) 340(30) 360(20) 00013(2) 220 0343(22) ltio-
La2Cu04 004 006
0061(8) 0124(7)
0045(9) ltio-
1100(100) 1200(100) 00008(1)
020 0074(10) 0078(10) 680(50) 760(50) 00007(2) 040 0210(30) 0026(81) 200 0074(8) 0061(10) 680(50) 810(50) 00003(3) 400 0130(10) 0023(95)
weak peak broadening was observed which can not be attributed to the proximity of the phase trans- formation Lai85SroisCu04 is tetragonal down to = 170 K [145] Lai85Baoi5Cu04 to 140 K [146147] and Lai85Caoi5Cu04 to 130 K [148] Another possi- ble reason for peak broadening might be continu- ous compositional variations in dopant content The scanning Auger microprobe analysis of La2-SrtCu04 compounds [149] showed that grain- boundary segregation of Sr is weak and limited to a narrow region near the grain surface In the case of the separation of two phases with different Sr con- tent and similar lattice parameters asymmetry of some reflections would be observed [150] More- over in the case of compositional inhomogeneity microstrains eL)) would be roughly independent of the averaging distance L in the grains [151] therefore distribution of strains would be Gaus- sian For all specimens microstrain behavior is identical it decreases linearly with distance L
Rothman and Cohen [115] showed that such be- havior of microstrains is caused by dislocations that might arise during grinding Assuming the same applied stress microstrain would be approximately inversely proportional to the elastic moduli of these materials If mean microstrain is defined as the arithmetic average of strains for the [001] and [110] directions results agree with values of the Youngs moduli for polycrystalline La2Cu04 Lai85Moi5Cu04 (M = Sr Ba Ca) [152] However other factors may contribute to the microstrain Coordination-6 ionic radii of La^+ Sr Ba^+ Ca^+ are 106 116 136 100 A respectively [153] Substitution of La with ions of different sizes affects the lattice parameter [142] and may cause much larger strains in the [001] direction when some of the ions are replaced with Ba^ than with Sr^ in accord with results in Table 9 Substitution of Ca^^ ions produces an entirely different effect microstrains in the [110] direction are larger This may be explained by
346
Volume 98 Number 3 May-June 1993
Journal of Research of the National Institute of Standards and Technology
comparing effects of substitutional ions on the unit-cell a -parameter The Ba-doped specimen has a larger a-parameter than the Sr-doped but the Ca-doped a-parameter is largest although Ca^^ has the smallest ionic size This should increase the cell distortion in the a-b plane
Table 9 reveals high anisotropy in these materi- als consistent with other physical properties such as thermal expansion [154] and upper critical mag- netic field [155] Differences of domain sizes might arise from a layered structure in the [001] direction and consequently easy incorporation of stacking faults between regularly stacked layers The stack- ing-fault and twin-fault probabilities can be esti- mated from the average surface-weighted domain sizes [59]
^ = TAN + cf1fun(aa) (75) m im - (D)
Here c is a constant for the particular [hkl] direction and fun(a a) a linear combination of stacking-fault probability and twin-fault probability a The exact form of Eq (75) was derived only for the cubic and hexagonal crystal structures On con- dition that the true domain dimension D is isotropic or so large that the second term of Eq (75) dominates a linear function of stacking-fault and twin-fault probability is
fun(aa) = c( 1
) (76) Zgt)J (Dgttrade
Here c denotes a constant that depends only on geometrical factors and is the same for all three doped compounds
Figure 22 shows a possible correlation between Tc and fault-defect probabilities computed from TEM observations of La2-jcSrCu04 revealed that stacking-fault density increased with Sr content up to jc = 015 [156] That study suggests that a shear mechanism forming the fault-boundary dislocations implies oxygen vacancies andor cation deficiency We did not measure oxygen content but neutron- diffraction studies showed that oxygen deficiency starts to appear at much higher Sr content [157] However the increase of fault probability with the simultaneous decrease of microstrain in Fig 22 supports the assumption that defects are intro- duced to accommodate lattice strains [156] A simi- lar increase in Te was found in Y2Ba4Cu802o-laquo thin films [158] Compounds with asymmetric broad- ened and shifted peaks showed higher Tc which
was attributed to stacking faults Although extrinsic stacking faults may cause asymmetric peak broad- ening [140] it is probably caused by twinning Twinning in La-M-Cu-0 materials is less abundant than in Y-Ba-Cu-O compounds but it was ob- served in (La-Sr)2Cu04 monocrystals on (110) planes [159] In the profile-fitting procedure peak asymmetry is incorporated only in the instrumental function therefore we could not model asymmetric peak broadening However any significant asym- metry of the specimen profile would cause an un- even fit of low-angle and high-angle sides of peaks which was not observed This gives much more im- portance to stacking faults in Eq (76)
Fig 22 Arithmetic average of [110] and [001] root-mean- square strains and linear function of stacking-fault and twin- fault probabilities as a function of Tc
In Fig 22 average microstrains defined as the arithmetic average of [001] and [110] directions correlate inversely with Tc However we did not find a correlation of Tc and microstrains in a partic- ular direction [001] microstrains simply reflect dif- ference in size of dopant and host La^ ions (see Table 9)
In La2Cu04 (OkO) reflections are significantly broader than (hOO) This has also been observed in low-temperature orthorhombic Lai85Sroi5Cu04 and Lai85Baoi5Cu04 [160] and explained by either stacking faults or possible lower symmetry Our results reveal that domain sizes (D) have identical values for [010] and [100] directions (Table 9) From Eq (76) it follows that stacking-fault proba- bilities in these directions have the same values However microstrains in the [010] direction are roughly twice as large as in the [100] direction which is responsible for the different broadening In the case of doped La2Cu04 compounds different microstrains might be caused by oxygen
347
Volume 98 Number 3 May-June 1993
Journal of Research of the National Institute of Standards and Technology
vacancies ordered along one direction in the a-b plane similar to effects found in YBa2Cu307-laquo However undoped La2Cu04 is not expected to have significant o^Qgen deficiency Other possibili- ties are lower ciystallographic symmetry andor La vacancies although they were not reported for this system but La deficiency was found in an La2Co04 compound [161]
We can conclude that lattice strains and incoher- ently diffracting domain sizes confirm high an- isotropy in these materials This simple approach however does not allow unambiguous identifica- tion of the strains origin Probably the strains originate from dislocations and from different sizes of host and dopant ions Domain sizes of all com- pounds are larger in the c-direction than in the a-6 plane This indicates existence of stacking faults and twins However because estimated errors are relatively large and only three materials were stud- ied the possible connection between stacking faults and 7c needs further study
62 Bi-Cu-O Superconductors
Among the high-Tc superconductors the Bi- Cu-O compounds appear intriguing especially because their incommensurate structure modula- tion remains incompletely understood [162 163] The crystal structure consists of perovskite-like SrO-(Cu02Ca)mi-Cu02-SrO layers separated by NaCl-like BiO double layers (see Fig 23 [164]) The number m of Cu02 layers alters the supercon- ducting transition temperature Tc (for m = 12 and 3 rclaquo10 90 and 110 K respectively) This two- dimensional layered structure makes these materi- als highly anisotropic and favours the creation of defects
Bulk sintered specimens showed relatively weak peak broadening Moreover the diffraction pat- terns contained many overlapping peaks because the compound crystallizes in an orthorhombic low- symmetry space group A2aa [165] and incommen- surate modulation gives superlattice reflections All patterns revealed a strong [001] texture (Fig 24) making reflections other than (001) difficult to ana- lyze The lattice parameters vary depending on the exact compound stoichiometry and processing his- tory but characteristically they have almost identi- cal a and b parameters and large c parameter fl =54095 A 6=54202 A c =309297 A for Bi2Sr2CaCu208 (Bi-2212 [166] and A =5392 A b =5395 A c =36985 A for (BiPb)2Sr2Ca2Cu30io (BiPb-2223) [165] Thus we treated (hOO) and (0^0) reflections as single peaks Table 10 gives the
results for three specimens Bi-2212 (BiPb)2 (SrMg)2(BaCa)2Cu30io (BiPbMgBa-2223) which were one-phase specimens and BiPb-2223 con- taining approximately equal amounts of 2212 and 2223 phases The in-plane lattice parameters of 2212 and 2223 phases differ little hence only the [00] directions of the mixed-phase specimen were evaluated
b^ (c)
Fig 23 Average crystal structure of Bi2Sr2Cam-iCum04+2m for (a) m = 1 (b) w =2 (c) m =3 [164]
35
-35
42 44 46 48 50 52 54 56 58 60 62 26 (deg)
^ ^^^MK^Aa^Ndllaquop
Fig 24 Part of BiPbMgBa-2223 refined pattern There are 48 fundamental reflections in this region
Interpretation of the results in the case of these complicated compounds must be considered care- fully Microstrains are probably caused by disloca- tion arrays However substitution of different-sized ions and vacancies would also contribute to the strains as would other kinds of disorder especially
348
Volume 98 Number 3 May-June 1993
Journal of Research of the National Institute of Standards and Technology
Table 10 Results of line-btoadening analysis for Bi-Cu-O supreconductors
Specimen Phase hkl (A)
eD)sa)y^
Bi-2212 2212 008 0012
0163(8) 022(3)
001(6) 005(6)
420(80) 00021(6)
020+200 0104(4) ltio-^ 580(30) 00007(1) 040+400 018(2) 00004(6300)
BiPbMgBa-2223 7773 0010 0020
0097(1) 021(2)
00002(1700) 0007(150)
770(60) 00012(1)
020 + 200 012(27) 013(10) 380(430) 00009(71) 040 + 400 015(95) 021(33)
BiPb-73 2212 008 0012
023(2) 025(5)
0002(350) 0001(1000)
220(30) 00013(26)
2223 0010 0020
022(8) 023(99)
0092(67) 018(47)
230(190) 00012(197)
Stacking faults and twins Table 10 shows larger strains in the [001] direction that in the basal plane This can be explained by stacking disorder along the c-axis which was frequently observed in electron-diffraction patterns as streaking [167 168] Easy incorporation of stacking faults is possi- ble because of the two-dimensional weak-bonded layers (BiO double layers are spaced about 3 A apart) The difference in microstrain between in- plane and the c-direction is much smaller for the BiPbMgBa-2223 phase probably because Pb low- ers the faulting by stabilizing the higher-Tc 2223 phase [167] For the BiPb-2223 specimen with two phases there are two possibilities Either the speci- men consists mainly of a mk of two kinds of one- phase grains or both phases occur within the same grains The second possibility was confirmed exper- imentally [169 170] and our results concur be- cause microstrain in the 2212 phase is much smaller than in the one-phase Bi-2212 specimen Processing conditions and cation content probably favour development of the macroscopic inter- growth of both phases within the grains that is microscopic defects grow to sufficiently large re- gions to give a diffraction pattern of another phase with the different number of Cu02 layers As a re- sult strain is relieved and both strains and domain sizes being quite different in one-phase specimens tend to equalize
For the Bi-Cu-O specimens the mean surface- weighted domain sizes are generally smaller than for (La-M)2Cu04 compounds Therefore the com- putation of the stacking- and twin-fault probabili- ties by using Eq (75) may be wrong It would be very instructive to compare the different broaden-
ing of satellite and fundamental reflections which indicates a more pronounced stacking disorder in the modulated structure [171]
In summary we found that for both Bi-2212 and BiPbMgBa-2223 superconductors the c-axis strain exceeds the in-plane strain The BiPb-2223 specimen containing both 2212 and 2223 phases within the single grains shows smaller incoherently diffracting domains and lower c-axis strain than the one-phase specimens This fact may direct us to- ward the mechanism of the second-phase forma- tion in these materials
63 Remarks
It was shown that this particular method of the line-broadening analysis can give information about the size of incoherently diffracting domains and lattice strains in (La-M)2Cu04 and Bi-Clu-O superconductors Moreover results show high an- isotropy of both size and strain parameters as one may expect because of the layered structure of all superconducting cuprates Generally structural line broadening is not large that is a result of rela- tively large domain sizes (200-2000 A) and small strains (002-02) It is interesting to compare these values with the published results for YBa2Cu307-laquo (isotropic strains of 023 [77] and 005-03 [82]) Although the different materi- als were studied they seem too large especially be- cause they are the average of strains in different directions
The main drawback of the line-broadening the- ory is the uncertainty about the origins of the line broadening that is it is difficult to distinguish the main effects responsible for the broadening For
349
Volume 98 Number 3 May-June 1993
Journal of Research of the National Institute of Standards and Technology
the novel superconductors particularly the numer- ous defects (substitutions vacancies stacking faults dislocations and similar) can occur simulta- neously which makes it very difficult to determine their individual contributions Furthermore the crystal structures of most novel superconductors are relatively complicated The average structure has mostly a slightly distorted tetragonal symmetry very similar a and b lattice parameters and a large c parameter but c=36 for YBa2Cu307-laquo for in- stance This results in a large number of overlap- ping peaks and consequently in large errors of all results This showed especially in the case of Bi-Cu-O superconductors (see Table 10) Follow- ing the discussion of reliability of profile fitting in Sec 54 it would be desirable to include more than two reflections in the analysis of broadening but higher-order peaks are usually too weak and over- lapped One way to partially solve this problem would be a whole pattern fitting [172 173] and Rietveld structure refinement [23] in terms of size and strain parameters This requires an accurate preset function to model specimen broadening and precise definition of angular dependence of size and strain parameters The Rietveld programs that model the line broadening in terms of size and strain parameters are based either on the simpli- fied integral-breadth methods [78 95] or on the single-line method [174]
7 Conclusions
A method for analyzing the pure-specimen (structural) broadening of x-ray diffraction line profiles is proposed By modeling the specimen size and strain broadenings with the simple Voigt func- tion it is possible to obtain domain sizes and strains that agree with experiment and show a logi- cal interrelationship Furthermore some common consequences and problems in the Fourier-method analysis follow easily The specimen function is convoluted with the instrumental function to match the observed x-ray diffraction-line profile This avoids the Stokes deconvolution method thus al- lowing analysis of patterns with highly overlapping peaks and weak structural broadening Therefore the method was applied to some novel high-Tc superconductors We reached the following conclu- sions
(i) Surface-weighted domain size depends only on the Cauchy integral breadth of the size-broad- ened profile
(ii) The hook effect occurs when the Cauchy-content of the size-broadened profile is un-
derestimated that is for ^sc(n2)^3sG Usually this happens when the background is estimated too high so the long tails of the Cauchy function are prematurely cut off
(iii) It also follows from conclusion (ii) that the volume-weighted domain size can not be more than twice the surface-weighted domain size (limiting value D)v=2D)i is obtained for the pure-Cauchy size-broadened profile) Minimum value for D)J (D)j should not be less than -131
(iv) If the distortion coefficient is approxi- mated with a harmonic term this leads exactly to the Warren-Averbach method of separation of size and strain broadenings
(v) In that case mean-square strains decrease linearly with the distance L
(vi) It is possible to evaluate local strain ((e^(0))^) only in the case of pure-Gauss strain broadening Then root-mean-square strain is inde- pendent of the distance L and related to the upper limit of strain obtained from the integral breadth of the strain-broadened profile
(vii) If strain broadening is not described exclu- sively with the Gauss function the multiple-line Voigt integral breadth and Warren-Averbach analyses can not give the same results for volume- weighted domain size although D)v is defined identically in both approaches because the appar- ent strain -q = pdeg(29)cot9 is not angular- independent
(viii) Smooth size coefficients give column- length distribution functions without oscillations and make possible a computation of volume- weighted average domain sizes up to ~5000 A
(ix) Comparison with the simplified integral- breadth methods in most cases has shown not large but systematic discrepancy of results indicat- ing that size and strain broadening can not be accu- rately modeled by a single Cauchy or Gauss function Moreover the application of the single- line method is much less reliable and it should not be used where multiple reflections are available
(x) The knowledge of all phases present in the sample and their crystallographic structure is re- quired to successfully fit a cluster of overlapping peaks Although it is very difficult to accurately de- termine the Cauchy-Gauss ratio of an overlapped peak final results of domain size and strain are much less affected Therefore connecting the crys- tallite size exclusively with the Cauchy content and strain with the Gauss content of a specimen profile might be doubtful
(xi) Evaluated errors of domain sizes and strains increase substantially with the degree of
350
Volume 98 Number 3 May-June 1993
Journal of Research of the National Institute of Standards and Technology
peak overlapping Hence for complicated patterns very accurate measurements are necessary and one needs to analyze as many reflections in the same crystallographic direction as possible
(xii) Line-broadening analysis of (La-M)2Cu04 and Bi-Cu-O compounds confirms high anisotropy in these materials
(xiii) Strains in (La-M)2Cu04 probably origi- nate from dislocations and from different sizes of host and dopant ions
(xiv) Stacking-fault probability in (La-M)2Cu04 (M = Ba Ca Sr) increases with increasing Tc whereas the average strain decreases
(xv) In La2Cu04 different broadening of (lOO) and (OfcO) reflections is not caused by stacking faults
(xvi) All Bi-Cu-0 superconductors show larger strain in the c-direction than in the a-b plane which can be explained by stacking disorder along the [001] direction
(xvii) In the specimen with approximately equal amounts of Tl-2212 and TlPb-2223 phases it is likely that a secondary phase develops by the growth of the microscopic faulted regions of the primary phase
Acknowledgments
I am thankful to Dr Harry McHenry for his support and especially to Dr Hassel Ledbetter for his wise guidance and most useful help during my stay at NIST I am also indebted to my home insti- tution the Faculty of Metallurgy of the University of Zagreb for allowing me the leave of absence at NIST
8 References
[1] W Friedrich P Knipping and M v Laue Ann Physik 41 971 (1912)
[2] H M Rietveld Acta Cryst 22 151 (1967) [3] H M Rietveld J Appl Cryst 2 65 (1969) [4] S A Howard and K D Preston in Modern Powder Dif-
fraction Vol 20 The Mineralogical Society of America Washington DC (1989) p 217
[5] D Taupin J Appl Cryst 6 266 (1973) [6] T C Huang and W Parrish Appl Phys Lett 27 123
(1975) [7] M K Wu J R Ashburn C J Torng P H Hor R L
Meng L Gao Z J Hwang Y Q Wang and C W Chu Phys Rev Lett 58 908 (1987)
[8] D Shi MRS Bull 16 37 (1991) [9] D Larbalestier Phys Today 44 74 (1991)
[10] J C Phillips Phys Rev B 4512647 (1992) [11] B Raveau Phys Today 45 53 (1992) [12] A J Millis and K M Rabe Phys Rev B 38 8908 (1988)
[13] F Guinea Europhys Lett 7 549 (1988) [14] C P Dhard and P Singh in Proc Int Symp High-Temp
Supercond Jaipur India Oxford amp IBH Publishing New Delhi (1988) p 271
[15] J D Jorgensen Phys Today 44 34 (1991) [16] J G Bednorz and K A Muller Z Phys B 64 189
(1986) [17] K Kishio K Kitazawa S Kaube I Yasuda N Sugii H
Takagi S Uchida K Fueki and S Tanaka Chem Lett 429 (1987)
[18] J D Jorgensen B Dabrowski S Pei D G Hinks L Soderholm B Morosin J E Venturini and D S Ginley Phys Rev B 38 11337 (1988)
[19] J R Clem Phys Rev B 43 7837 (1991) [20] M Paranthaman M Foldejiki D Balzar H Ledbetter
A J Nelson and A M Hermann submitted to Phys Rev B
[21] A R Stokes Proc Phys Soc Lond 61 382 (1948) [22] B E Warren and B L Averbach J Appl Phys 23 497
(1952) [23] R Delhez Th H de Keijser and E J Mittemeijer in
Accuracy in Powder Diffraction S Block and C R Hub- bard eds Natl Bur Stand (US) Special Publication 567 (1980) p 213
[24] H P Klug and L E Alexander X-ray Diffraction Proce- dures 2nd Edition John Wiley New York (1974) p 661
[25] J I Langford J Appl Ciyst 11 10 (1978) [26] J I Langford in Accuracy in Powder Diffraction S
Block and C R Hubbard eds Natl Bur Stand (US) Special Pubication 567 (1950) p 255
[27] R Delhez Th H de Keijser and E J Mittemeijer Fre- senius Z Anal Chem 312 1 (1982)
[28] A J C Wilson Proc Phys Soc Lond 80 286 (1962) [29] A J C Wilson Proc Phys Soc Lond 81 41 (1963) [30] L P Smith Phys Rev 46 343 (1934) [31] H C Burger and P H van Cittert Z Phys 79 722
(1932) [32] S Ergun J Appl Ciyst 1 19 (1968) [33] R Croche and L Gatineau J Appl Ciyst 10479 (1977) [34] L H Schwarz and J B Cohen Diffraction from Materi-
als Academic Press New York (1977) p 391 [35] R Delhez Th H de Keijser E J Mittemeijer and J I
Langford J Appl Cryst 19 459 (1986) [36] R Delhez Th H de Keijser E J Mittemeijer and J I
Langford Aust J Phys 41 213 (1988) [37] R A Young and D B Wiles J Appl Cryst 15 430
(1982) [38] W Voigt Stizungsber K Bayer Akad Wiss 42 603
(1912) [39] E E Whiting J Quant Spectrosc Radiat Transfer 8
1379 (1968) [40] G K Wertheim M A Butler K W West and D N E
Buchanan Rev Sci Instrum 111369 (1974) [41] M M Hall Jr V G Veeraraghavan H Rubin and P G
Winchell J Appl Cryst 10 66 (1977) [42] A Brown and J W Edmonds Adv X-Ray Anal 23 361
(1980) [43] P Suortti M Ahtee L Unonius J Appl Cryst 12 365
(1979) [44] T Sundius J Raman Spectrosc 1 471 (1973) [45] B H Armstrong J Quant Spectrosc Radiat Transfer 7
61 (1967) [46] J F Kielkopf J Opt Soc Am 63 987 (1973) [47] B P Asthana and W Kiefer Appl Spectr 36 250
(1982)
351
Volume 98 Number 3 May-June 1993
Journal of Research of the National Institute of Standards and Technology
[48] J P M de Vreede S C Mehrotra A Tal and H A Dijkerraan Appl Spectr 36 227 (1982)
[49] F R L Schoening Ada Ciyst 18 975 (1965) [50] P Scherrer Gott Nachr 2 98 (1918) [51] A R Stokes and A J C Wilson Proc Cambridge
Philos Soc 38 313 (1942) [52] A J C Wilson X-Ray Optics 2nd edition Methuen
London (1962) [53] S Leie and T R Anantharaman Proc Indian Acad
Sci Sect A H 261 (1966) [54] D Louer D Weigel and J I Langford J Appl Ciyst
5 353 (1972) [55] A J C Wilson J Appl Ciyst 2 181 (1969) [56] J I Langford and A J C Wilson J Appl Ciyst 11102
(1978) [57] A R Stokes and A J C Wilson Proc Phys Soc Lond
56174 (1944) [58] B E Warren and B L Averbach J Appl Phys 21 595
(1950) [59] B E Warren X-Ray Diffraction Addison-Wesley
Reading Massachusetts (1969) p 264 [60] B E Warren in Progress in Metal Physics Vol 8 Perg-
amon Press London (1959) p 146 [61] F Bertaut C R Acad Sci Paris 228 187 (1949) [62] N C Haider and C N J Wagner Acta Cryst 20 312
(1966) [63] D Balzar and H Ledbetter in Proceedings of the Accu-
racy in Powder Diffraction II Natl Inst Stand Technol (1992) p 37
[64] D Balzar and H Ledbeter J Appl Cryst 26 (1993) in press
[65] J N Eastabrook and A J C Wilson Proc Phys Soc Lond B 65 67 (1952)
[66] R S Smith IBM J Res Develop 4 205 (1960) [67] B Y Pines and A F Sirenko Soviet Physics Ciyst 715
(1962) [68] G B Mitra and N K Misra Acta Ciyst 22 454 (1967) [69] A Gangulee J Appl Ciyst 7 434 (1974) [70] J Mignot D Rondot Acta Met 231321 (1975) [71] J Mignot and D Rondot Acta Ciyst A 33 327 (1977) [72] R K Nandi H K Kuo W Schlosberg G Wissler J B
Cohen and B Crist Jr J Appl Ciyst 17 22 (1984) [73] M Zocchi Acta Ciyst A 36164 (1980) [74] P Ramarao and T R Anantharaman Trans Ind Ins
Metals 18 181 (1965) [75] R K Nandi and S P Sen Gupta J App Cryst 11 6
(1978) [76] Th H de Keijser J I Langford E J Mittemeijer and
B P Vogels J Appl Ciyst IS 308 (1982) [77] A Williams G H Kwei R B Von Dreele A C Lar-
son L D Raistrick and D L Bish Phys Rev B 37 7960 (1988)
[78] A C Larson and R B Von Dreele Los Alamos Na- tional Laboratory Report No LA-UR-86-748 (1988)
[79] J D Jorgensen D H Johnson M H Mueller J G Worlton and R B Von Dreele in Proceedings of the Conference on Diffraction Profile Analysis Cracow Poland (1978) p 20
[80] R B Von Dreele J D Jorgensen and C G Windsor J Appl Ciyst 15 581 (1982)
[81] P Thompson D E Cox and J B Hastings J Appl Ciyst 20 79 (1987)
[82] J P Singh R A Guttschow D S Kupperman J T Dusek and R B Poeppel in High Temperature Super-
conducting Compounds III S Whang A Gupta and E Ceilings eds TMS AIME Warrendale (1991) p 281
[83] M O Eatough D S Glnley and B Morosin Adv X- Ray Anal 33 145 (1990)
[84] E J Peterson P J Kung R E Muenchausen and D M Smith in Proceedings of the 41st Annual Denver Conference on Applications of X-Ray Analysis Colo- rado Springs Colorado (1992) p 74
[85] M Rand J I Langford and J S Abell submitted to J Cryogenics (1992)
[86] D Balzar J Appl Ciyst 25 559 (1992) [87] D Balzar H Ledbetter and A Roshko Physica C 185-
189 871 (1991) [88] D Balzar and H Ledbetter J Mater Sci Lett 111419
(1992) [89] D Balzar H Ledbetter and A Roshko Pow Diffr 8
(1993) in press [90] S Johnson M Gusraan D Rowcliffe T Geballe and J
Sun Adv Ceram Mater 2 337 (1987) [91] H Ledbetter S A Kim R B Goldfarb and K Togano
Phys Rev B 39 9689 (1989) [92] H Friedman Electronics 132 (1945) [93] W Parrish (ed) in Advances in X-Ray Diffractometry
and X-Ray Spectrography Centrex Publishing Company Eindhoven The Netheriands (1962)
[94] W Soller Phys Rev 24158 (1924) [95] S A Howard R L Snyder J Appl Ciyst 22 238
(1989) [96] G H Stout and L H Jensen X-Ray Structure Determi-
nation 2nd edition Wiley New York (1989) p 373 [97] D E Appleman and T Evans Jr Final Report 92-14
US Geological Survey Washington DC (1973) Avail- able as NTIS Document No PB-216188
[98] M U Cohen Rev Sci Instrum 6 68 (1935) [99] M U Cohen Rev Sci Instrum 7 155 (1936) [100] M H Mueller L Heaton and K T Miller Acta Ciyst
13 828 (1960) [101] R A Young P E Mackie and R B Von Dreele J
Appl Ciyst 10 262 (1977) [102] D B Wiles and R A Young J Appl Cryst 14 149
(1981) [103] J K Yau and S A Howard J Appl Ciyst 22 244
(1989) [104] S A Howard J K Yau and H U Anderson J Appl
Phys 65 1492 (1989) [105] S Enzo G Fagherazzi A Benedetti and S Poilizzi J
Appl Ciyst 21 536 (1988) [106] A Benedetti G Fagherazzi S Enzo and M
Battagliarin J Appl Cryst 21 543 (1988) [107] Th H de Keijser E J Mittemeijer and H C F Rozen-
daal J Appl Ciyst 16 309 (1983) [108] Y Zhang J M Stewart C R Hubbard and B Mo-
rosin Adv X-Ray Anal 33 373 (1990) [109] Y Wang S Lee and Y Ue J Appl Ciyst IS 35
(1982) [110] V N Selivanov and E F Smislov Zavod Lab 57 28
(1991) [Ill] A Guinier X-Ray Diffraction W H Freeman San
Francisco (1963) p 139 [112] M Wilkens J Appl Cryst 12119 (1979) [113] D Du and Y Wang Pow Diffr 2180 (1987) [114] A P Prudnikov Yu A Brychkov and O L Marichev
Integrals and Series Vol 1 Gordon and Breach Am- sterdam The Netheriands (1986) p 344
352
Volume 98 Number 3 May-June 1993
Journal of Research of the National Institute of Standards and Technology
[115] R L Rothman and J B Cohen J Appl Phys 42 971 (1971)
[116] T Adier and C R Houska J Appl Phys 50 3282 (1979)
[117] C R Houska and T M Smith J Appl Phys 52 748 (1981)
[118] S Rao and C R Houska Acta Ciyst A 4214 (1986) [119] J I Langford R Delhez Th H de Keijser and E J
Mittemeijer Ausi J Phys 41173 (1988) [120] J I Langfoid J Appl Cryst IS 315 (1982) [121] M J Turunen Th H de Keijser R Delhez and N M
van der Pers J Appl Ciyst 16176 (1983) [122] A J C Wilson Acta Ciyst 23 888 (1967) [123] A J C Wilson Acta Ciyst A 24 478 (1968) [124] A J C Wilson Acta Ciyst A 25 584 (1969) [125] G Gagliotti A Paoletti and F P Ricci Nucl Instrum
3 223 (1958) [126] J I Langford R J Cernik and D Louer J Appl
Ciyst 24 913 (1991) [127] J I Langford in Accuracy in Powder Diffraction II
preprint [128] A J C Wilson Mathematical Theory of X-Ray Powder
Diffractometiy Centrex Eindhoven The Netherlands (1963)
[129] J L Langford Prog Ciyst Growth and Charact 14185 (1987)
[130] T G Fawcett C E Crowder S J Brownell Y Zhang C R Hubbard W Schreiner G P Hamill T C Huang E Sabino J I Langford R Hamilton and D Louer Pow Diffr 3 209 (1988)
[131] W L Smith J Appl Ciyst 9187 (1976) [132] J L Langford and D Louer J Appl Ciyst 15 20
(1982) [133] Fl Popescu and L Benes Acta Ciyst A 33 323 (1977) [134] P PSuse^cu R MSnaila M Popescu and E Jijovici j
Appl Cryst 7 281 (1974) [135] P F Bley Y Calvayrac and M Fayard J Appl Ciyst
7 493 (1974) [136] B Moraweck Ph de Montgolfier and A J Renouprez
J Appl Ciyst 10191 (1977) [137] A Le Bail and D Louer J Appl Cryst 11 50 (1978) [138] D R Buchanan R L McCuUough and R L Miller
Acta Ciyst 20 922 (1966) [139] P Suortti and L D Jennings Acta Cryst A 33 1012
(1977) [140] J B Cohen and C N J Wagner J Appl Phys 33 2073
(1962) [141] A Bianconi J Budnick A M Flank A Fontaine P
Lagarde A Marcelli H Tolentino B Chamberland C Michel B Raveau and G Demazeau Phys Lett A127 285 (1988)
[142] K Fueki K Kitazawa K Kishio T Hasegawa S Uchida H Takagi and S Tanaka in Chemistiy of High- Temperature Superconductors D L Nelson M S Whittingham and T F George eds American Chemi- cal Society (1987) p 38
[143] T Fujita Y Aoki Y Maeno J Sakurai H Fukuba and H Fujii J Appl Phys 26 U68 (1987)
[144] R M Hazen in Physical Properties of High-rc Super- conductors Vol 2 D M Ginsberg ed World Scien- tific Singapore (1990) p 121
[145] J B Torrance A Bezinge A I Nazzal T C Huang S P Parkin D T Keane S J LaPlaca P M Horn and G A Held Phys Rev B 40 8872 (1989)
[146] J D Axe A H Moudden D Hohlwein D E Cox K
M Mohanty A R Moodenbaugh and Y Xu Phys Rev Lett 62 2751 (1989)
[147] T Suzuki and T Fujita Physica C 159 111 (1989) [148] T Fujita and Y Maeno in Superconducting Materials
JJAP Series 1 (1988) p 34 [149] A Roshko and Y-M Chiang J Appl Phys 66 3710
(1989) [150] D E Cox S C Moss R L Meng P H Hor and C W
Chu J Mater Res 31327 (1988) [151] B Crist and J B Cohen J Polym Sci 17 1001 (1979) [152] H Ledbetter S Kim and A Roshko Z Phys B 89275
(1992) [153] R D Shannon and C T Prewitt Acta Ciyst B 25 925
(1969) [154] M Lang H Spille F Steglich Y Hidaka T Murakami
and Y Endoh Physica C 162-1641037 (1989) [155] Y Hidaka and T Murakami Phase trans 15 241
(1989) [156] P L Gai and E M McCarron Science 247 553 (1990) [157] T Kamiyama I Izumi H Asano H Takagi S Uchida
Y Tokura E Takayama-Muromachi M Matsuda K Yamada Y Endoh and Y Hidaka Physica C 172 120 (1990)
[158] A Kapitulnik Physica C 153-155 520 (1988) [159] L A Muradyan V N Molchanov R A Tamazyan and
V I Simonov Physica C 162-164 536 (1989) [160] P Day M Rosseinsky K Prassides W I F David O
Moze and A Soper J Phys C 20 L429 (1987) [161] J T Lewandowski R A Beyerlein J M Longo and R
A McCauley J Amer Ceram Soc 69 699 (1986) [162] R Ramesh G van Tendeloo G Thomas S M Green
Y Mei C Jiang and H L Luo Appl Phys Lett 53 2220 (1988)
[163] J Schneck L Pierre J C Tolddano and C Daguet Phys Rev B 39 9624 (1989)
[164] O Eibl Physica C 168 215 (1990) [165] W Carrilo-Cabrera and W Gopel Physica C 161 373
(1989) [166] P Bordet J J Capponi C Chaillout J Chenavas A
W Hewat E A Hewat J L Hodeau M Marezio J L Tholence and D Tranqui Physica C 156189 (1988)
[167] R Ramesh K Remschnig J M Tarascon and S M Green J Mater Res 6 278 (1991)
[168] Z Hiroi Y Ikeda M Takano and Y Bando J Mater Res 6 435 (1991)
[169] Y Inoue M Hasegawa Y Shichi I Munakata M Ya- manaka S Hiyama and O Nittono J Mater Res 5 737 (1990)
[170] R Ramesh B G Bagley J M Tarascon S M Green M L Rudee and H L Luo J Appl Phys 67 379 (1990)
[171] X B Kan J Kulik P C Chow S C Moss Y F Yan J H Wang and Z X Zhao J Mater Res 5 731 (1990)
[172] G S Pawley J Appl Ciyst 13 630 (1980) [173] H Toraya J Appl Ciyst 19 440 (1986) [174] L Lutterotti and P Scardi J Appl Ciyst 23 246
(1990)
About the author Davor Balzar is with Faculty of Metallurgy of the University of Zagreb Sisak Croatia and was a Guest Researcher at fflST The National Institute of Standards and Technology is an agency of the Technology Administration US Department of Commerce
353
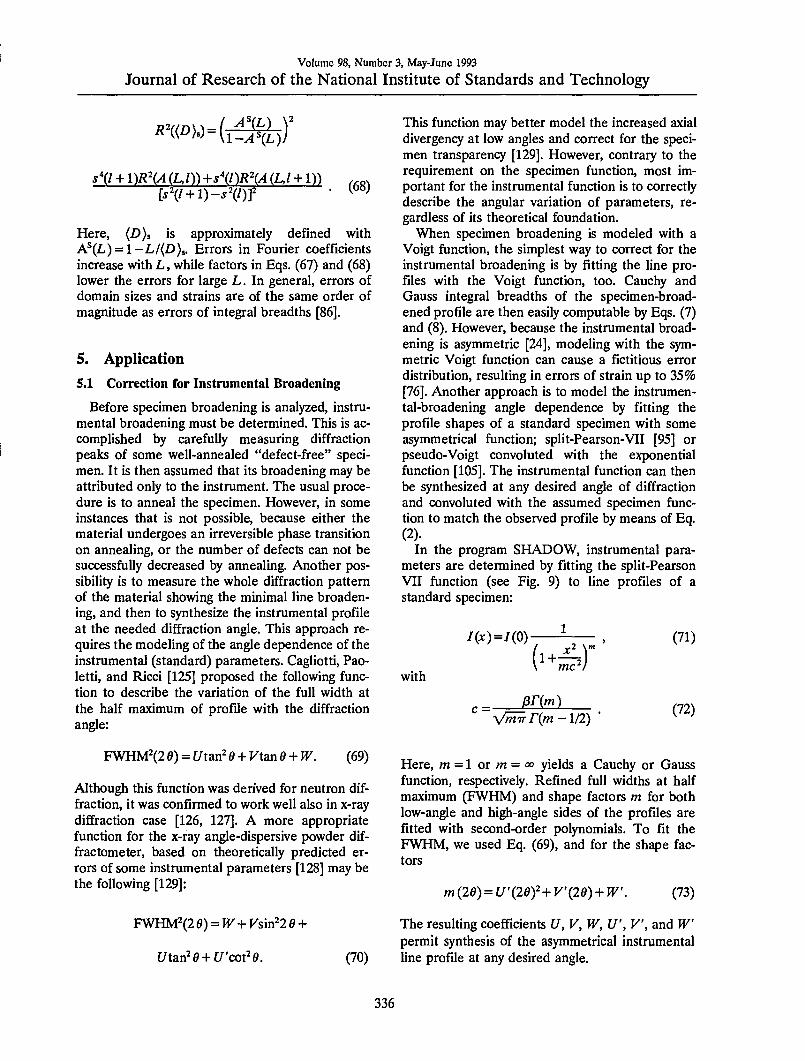
Volume 98 Number 3 May-June 1993
Journal of Research of the National Institute of Standards and Technology
^^laquo^))=(T^)
s(l + 1)RHA (Ll)) +SV)RHA (Ll + D) lsl + l)-sl)f (68)
Here (D) is approximately defined with A^(L) = l-L(D)j Errors in Fourier coefficients increase with L while factors in Eqs (67) and (68) lower the errors for large L In general errors of domain sizes and strains are of the same order of magnitude as errors of integral breadths [86]
5 Application 51 Correction for Instrumental Broadening
Before specimen broadening is analyzed instru- mental broadening must be determined This is ac- complished by carefully measuring diffraction peaks of some well-annealed defect-free speci- men It is then assumed that its broadening may be attributed only to the instrument The usual proce- dure is to anneal the specimen However in some instances that is not possible because either the material undergoes an irreversible phase transition on annealing or the number of defects can not be successfully decreased by annealing Another pos- sibility is to measure the whole diffraction pattern of the material showing the minimal line broaden- ing and then to synthesize the instrumental profile at the needed diffraction angle This approach re- quires the modeling of the angle dependence of the instrumental (standard) parameters Cagliotti Pao- letti and Ricci [125] proposed the following func- tion to describe the variation of the full width at the half maximum of profile with the diffraction angle
F9miA^(2e) = Utan^9 + Vtand + W (69)
Although this function was derived for neutron dif- fraction it was confirmed to work well also in x-ray diffraction case [126 127] A more appropriate function for the x-ray angle-dispersive powder dif- fractometer based on theoretically predicted er- rors of some instrumental parameters [128] may be the following [129]
FWHNf (2 e) = W+Vsin^l 6 +
UtanH + UcotH (70)
This function may better model the increased axial divergency at low angles and correct for the speci- men transparency [129] However contrary to the requirement on the specimen function most im- portant for the instrumental function is to correctly describe the angular variation of parameters re- gardless of its theoretical foundation
When specimen broadening is modeled with a Voigt function the simplest way to correct for the instrumental broadening is by fitting the line pro- files with the Voigt function too Cauchy and Gauss integral breadths of the specimen-broad- ened profile are then easily computable by Eqs (7) and (8) However because the instrumental broad- ening is asymmetric [24] modeling with the sym- metric Voigt function can cause a fictitious error distribution resulting in errors of strain up to 35 [76] Another approach is to model the instrumen- tal-broadening angle dependence by fitting the profile shapes of a standard specimen with some asymmetrical function split-Pearson-VII [95] or pseudo-Voigt convoluted with the exponential function [105] The instrumental function can then be synthesized at any desired angle of diffraction and convoluted with the assumed specimen func- tion to match the observed profile by means of Eq (2)
In the program SHADOW instrumental para- meters are determined by fitting the split-Pearson VII function (see Fig 9) to line profiles of a standard specimen
iix)=m- 2 m
with
c =-
mc^f
mm) mv-rim-12)
(71)
(72)
Here m = 1 or m = ltraquo yields a Cauchy or Gauss function respectively Refined full widths at half maximum (FWHM) and shape factors m for both low-angle and high-angle sides of the profiles are fitted with second-order polynomials To fit the FWHM we used Eq (69) and for the shape fac- tors
m(2e) = U(20f + V(2e) + W (73)
The resulting coefficients U V W U V and W permit synthesis of the asymmetrical instrumental line profile at any desired angle
336
Volume 98 Number 3 May-June 1993
Journal of Research of the National Institute of Standards and Technology
2 0(deg)
le
Fig 9 A split-Pearson VII profile The two half profiles have same peak position and intensity Adapted from Howard and Preston [4]
The basic requirement on the standard specimen is however to show as small a line broadening as possible To minimize physical contributions to the Une broadening of the standard specimen a few moments were emphasized as follows Because dif- fraction-line width depends strongly on degree of annealing it is preferable to use some reference powder-diffraction standard Furthermore asym- metry in the peak profiles is introduced by axial divergence of the beam flat specimen surface and specimen transparency [24] Choosing a standard specimen with low absorption coefficient would cause transparency effects to dominate If the stud- ied specimen has a large absorption coefficient (compared to the standard) this might produce a fictitious size contribution and errors in micro- strains All of the specimens studied have absorp- tion coefficients exceeding 1000 cm^ so a NIST standard reference material 660 LaBe was chosen to model the instrumental broadening (p = 1098 cm) According to Fawcett et al [130] LaBe showed the narrowest lines of all studied com- pounds Furthermore LaB6_has a primitive cubic structure (space group Pm3m) resulting in rela- tively large number of peaks equally distributed over 26 This allows for better characterization and lower errors of FWHMs and shape factors of split- Pearson VII functions (Fig 10)
52 Applicability of the Method
To study the applicability of method described in Sec 4 we first studied simple cubic-structure mate- rials such as silver and tungsten Tungsten has very narrow line profiles allowing us to obtain the up- per limit of domain sizes that can be studied Silver is easily deformed which provides a possibility to apply the method to broad line profiles To test the
009
-a
OH
006
003
1 1 m low-angle side n m high-angle side
bullz w 2 o OH
X
tancopy
Fig 10 Refined FWHMs and shape factors (exponents) m for low-angle and high-angle sides of LaBe line profiles Second- order polynomials were fitted through points
case of relatively complicated patterns and weak line broadening the method was also applied to Lai85Sroi5Cu04 and La2Cu04 powders In this sec- tion only the mechanical aspects of the line broad- ening are discussed Discussion about the origins of broadening of superconductors can be found in Sec 6
521 Silver and Tungsten Powders Figure 11 shows observed and refined peaks of tungsten un- treated and silver ground powders In Table 2 are listed results of fitted pure-specimen Voigt profiles for silver and tungsten specimens Table 3 and Fig 12 give results of the line-broadening analysis Untreated tungsten powder shows relatively weak broadening Instrumental profile FWHMs at angle positions of (110) and (220) tungsten lines are 0059deg and 0081deg respectively close to values mea- sured for tungsten 0065deg and 0100deg Results in Table 3 reveal that small broadening is likely caused by domain sizes because microstrains have negligible value This pushes the limit for measur- able domain sizes probably up to 4500-5000 A However one must be aware that weak specimen broadening implies higher uncertainty of all derived parameters Moreover the choice of the instrumental standard becomes more crucial
Both silver and tungsten line profiles become more Cauchy-like after grinding which probably increases dislocation density in the crystallites This is consistent with the presumption that small crystallites and incoherently diffracting domains separated by dislocations within grains affect the tails of the diffraction-line profiles [60115] Figure 13 illustrates the dependence of MSS on the recip- rocal of the averaging distance L
337
Volume 98 Number 3 May-June 1993
Journal of Research of the National Institute of Standards and Technology
C8
z
7- ^95
29 (deg) 405
bullJf^r-
z S 08
Ez U o u OS
a
04 bull
o Es
4P
2000 z^fA
4000
B
z u f- z
425 435 445 29 (deg)
455
yr 600 SOO
L(A)
Fig 11 Observed points (pluses) refined pattern (full line) and difference pattern (below) (110) W untreated (upper) (200) Ag ground (lower)
Fig 12 Fourier coefficients for the first- (pluses) and second- order (crosses) reflection and size coefficients (circles) [111] Ag untreated (upper) [100] Ag ground (lower)
Table 2 Parameters of the pure-specimen Voigt function as obtained from profile-fitting procedure for tungsten and silver powders
Specimen hkl 2ft(deg) 3c(deg) 3G(deg) FWHM(deg) Rwp()
W untreated 110 220
4028 8705
00065(7) 00301(6)
0020(2) ltio-
0021 0019
90 44
W ground 110 220
4029 8705
0100(2) 0222(3)
0038(4) 0069(6)
0080 0166
90 42
Ag untreated 111 222 200 400
3806 8151 4425 9786
0056(1) 0105(4) 0118(2) 0274(21)
ltio- 00008(21)
ltio-^ ltio-5
0036 0067 0075 0175
105 97
105 122
Ag ground 111 222 200 400
3807 8151 4424 9783
0175(3) 0410(26) 0365(10) 1079(82)
0038(12) ltio-
0076(29) ltio-
0121 0261 0250 0687
99 145 99
145
338
Volume 98 Number 3 May-June 1993
Journal of Research of the National Institute of Standards and Technology
Table 3 Microstructural parameters for tungsten and silver powders
Specimen Direction (poundgt)raquo( A) (2))v(A) ltpound^(fl3))laquo (^laquoD)v2)gtw
W untreated [110] 3200(200) 3500(200) 000038 000008(2)
W ground [110] 620(20) 1030(30) 00023 000054(2)
Ag untreated [111] [100]
1000(20) 510(20)
2000(20) 1030(20)
00010 00022
000024(1) 000047(5)
Ag ground [111] [100]
380(20) 210(10)
650(20) 350(20)
00047 00100
000095(7) 000180(14)
100 -_ - [100) Ag ground ^ ^~ mdash C1111 Ag ground ^bull
y y
o y ^ 50 A y
y y
y
0
y - y ^--
c ) 50 100 150
lLfAjxlO^
Fig 13 Mean-square strains (E^) as a function of VL
Errors in integral breadths allow estimation of errors in strain and size parameters (Sec 45) but in some cases the refinement algorithm gives unre- liable errors of integral breadths When a particu- lar parameter is close to the limiting value (for instance 10^ degrees has been put as the mini- mum value for integral breadths) errors become large However in Eqs (63) (65) (66) (67) and (68) only the product of integral breadth and ac- companying error is significant which is roughly equal for Cauchy and Gauss parts Errors of do- main sizes and strains are of the same order of magnitude as errors of integral breadths
The possible source of systematic error is poten- tial inadequacy of Voigt function to accurately de- scribe specimen broadening This effect can not be evaluated analytically but it would affect all derived parameters especially the column-length distribution functions The logical relationship be- tween values of domain sizes (see Table 3) for dif- ferent degrees of broadening indicates that possible systematic errors can not be large
Equation (41) allows computation of volume- weighted and surface-weighted average domain sizes if respective column-length distribution func- tions can be obtained Figure 14 gives surface- weighted and volume-weighted average column- length distribution functions following Eqs (39) and (38) Width of the distribution function deter- mines the relative difference between (D) and (pound))v The broader the distribution the larger the differences because small crystallites contribute more to the surface-weighted average That is much more evident comparing the surface- weighted column-length distribution with the vol- ume-weighted If they have similar shape and maximum position as in Fig 15 differences are small Conversely if the surface-weighted distribu- tion function has a sharp maximum toward smaller sizes differences are larger (see Fig 14) The dif- ference between (poundgt)s and (D)v and the actual mean dimension of the crystallites in a particular direction also depends strongly on the average shape of the crystallites [52 131 132]
If experimental profiles are deconvoluted by the Stokes method even for considerable specimen broadening size coefficients A ^ usually oscillate at larger L values [59 106] preventing computation of the column-length distribution function Few techniques were used to deal with this problem successive convolution unfolding method [32 133] smoothing and iterative methods [134 135 136 137] Figures 14 and 15 show very smooth column- length distribution functions However they follow from size coefficients ^4^ that depend on the accu- racy of the approximation for the distortion coeffi- cient given by Eq (47) Equation (47) is exact if the strain distribution is Gaussian but in general holds only for small harmonic numbers n if strain broadening is not negligible
339
Volume 98 Number 3 May-June 1993
Journal of Research of the National Institute of Standards and Technology
500 1000 L(A)
Fig 14 Surface-weighted and volume-weighted column-length distribution functions normalized on unit area [111] Ag un- treated (upper) [100] Ag ground (lower)
Fig 15 Surface-weighted and volume-weighted column-length distribution functions for [010] La2Cu04 normalized on unit area
522 La2-xSrtCu04 Powders To test the applicability of the discussed method to more com- plicated patterns two compounds with lower crystallographic symmetry were studied Lai85Sroi5Cii04 has a tetragonal K2NiF4-type struc- ture space group lAlmmm La2Cu04 is orthorhom-
bic at room temperature Both compounds show slight line broadening and relatively highly overlap- ping peaks (see Fig 16) which makes it very diffi- cult if not impossible to perform a Stokes analysis
25
-25
26 (deg)
yNraquo-
Fig 16 Observed points (pluses) refined pattern (full line) convoluted profiles (dashed line) and difference plot (below) for part of La2Cu04 pattern
Tables 4 and 5 list results from the fitting proce- dure and the analysis of specimen-broadened inte- gral breadths There are no qualitative differences in results for tungsten and silver powders How- ever average errors are higher as expected be- cause of overlapping peaks while weighted errors wp are surprisingly smaller This fact illustrates the unreliability of iwp when only a segment of the pat- tern is being refined because it depends on the number of counts accumulated in points as well as on the 28 range of the refinement
Figures 17 and 18 represent Fourier coefficients of Lai85Sroi5Cu04 [110] and La2Cu04 [010] direc- tions In the second plot the A (L )-versus-L plot shows a concave-downward part near L =0 the so- called hook effect It was shown in Sec 42 that the hook effect originates because of underesti- mation of background connected with the trunca- tion of profiles In the profile refinement all peaks separated less than 4deg 20 have been included in the refinement region to avoid possible overlapping of peak tails and specimen profiles have been trun- cated below 01 of the maximum intensity How- ever because the polynomial background was determined prior to profile refinement it may be overestimated for complicated patterns containing many overlapping peaks If background is refined with other profile parameters undesirable correla- tion with integral breadths occurs
340
Volume 98 Number 3 May-June 1993
Journal of Research of the National Institute of Standards and Technology
Table 4 Parameters of the pure-specimen Voigt function as obtained from profile-fitting procedure for La2-^SrCu04 powders
Specimen hid 2Hdeg) Pen PcO FWHM(deg) Rp()
Lai85Sroi5Cu04 004 2695 0046(4) 0024(8) 0042 34 006 4092 0083(5) ltio-= 0053 62 110 3352 0110(5) ltio- 0070 125 220 7046 0171(9) ltio- 0109 43
La2Cu04 004 2713 0061(8) 0045(9) 0067 39 006 4119 0124(7) ltio-^ 0079 77 020 3316 0074(10) 0078(10) 0102 29 040 6957 0210(30) 0026(81) 0135 29 200 3345 0074(8) 0061(10) 0087 69 400 7028 0130(10) 0023(95) 0089 29
Table 5 Microstructural parameters for Laij(5Srai3Cu04 and La2Cu04 powders
Specimen Direction (DUA) Pgt(A) lte^(fl3))laquo lte2((Z)gt2))laquo
Lai83Sro5Cu04
La2Cu04
[001] [110]
[001] [010] [100]
1700(300) 470(20)
1100(100) 680(50) 680(50)
2000(200) 940(20)
1200(100) 760(50) 810(50)
00024 00017
00038 00033 00016
000049(9) 000044(6)
00008(1) 00007(2) 00003(3)
c i ^- raquo sect 08 bulli - U
^0
ti- bull ll bull bullbullo
ffl M P bull- u ^ Di 04 Si - M bulldiamsbullbull a bull-v 3 o ^^=s^
u ^N^Sraquoraquo^
0 ^^^aaaa 1000
L(A) 2000
OQ bullbulldego UM o z a 08
o o bull bull bull
- u u bull raquo UU bull
a diams o bull o u ft 04 bull deg raquo deg - U bull bull deg Oi bullbullgt =3 bull- l o k u
0 bullbullbullraquo aaaMMi
500 1000
L(A)
Fig 17 Fourier coefficients for the first- (pluses) and second- order (crosses) reflection and size coefficients (circles) for [110] Lai^Sroi5Cu04
Fig 18 Fourier coefficients for first- (pluses) and second- order (crosses) reflection and size coefficients (circles) for [010] La2Cu04
341
Volume 98 Number 3 May-June 1993
Journal of Research of the National Institute of Standards and Technology
S3 Comparison with the Integral-Breadth Methods
Knowing the specimen integral breadths simpli- fied methods can be applied In Sec 212 we re- viewed multiple-line and single-line integral- breadth methods We shall compare the simplified multiple-line methods [Eqs (23) (24) and (30)] and the single-line method [76] [Eqs (29) and (30)] with results obtained for silver tungsten and La2-xSrxCu04 powders (Tables 3 and 5) We did not compare with the multiple-line Voigt-function method [26] because it was shown in Sec 44 that it is incompatible with the Warren-Averbach analy- sis In Table 6 integral breadth Pi was computed according to Eq (11) This value was compared with )8A integral breadth computed from Fourier coefficients [58]
i8A=- laquo3 2^(L)
(74)
Results obtained by the Warren-Averbach analysis are significantly smaller for both size and strain Integral-breadth methods give the upper limit for strain so comparison is limited Considering the approximation e = 125e^(L))^ [138] with L=(D)v2 or L=(D)s2 strains resemble more closely than crystallite sizes It must be noted how- ever that this approximation makes sense only in the case of pure-Gauss strain broadening Benedetti et al [106] reported excellent agreement for both size and strain using Warren-Averbach and Cauchy-Gauss [Eq (24)] methods Results from Table 6 on the contrary indicate that the Gauss-Gauss approximation gives values closest to the Warren-Averbach method for crystallite sizes whereas the Cauchy-Gauss and especially the Cauchy-Cauchy approximation tend to give too large values For strain the trend is opposite The Cauchy-Cauchy approximation resembles most
Table 6 Comparison of results obtained with the integral-breadth methods Cauchy-Cauchy (C-C) Cauchy-Gauss (C-G) Gauss- Gauss (G-G) and single-line (S-L) analysis
Specimen hkl PiXKP PAXKP ltigt)v (Z)gt(A) (e^((DV2)gt2 eXlO^ (A-) (A-0 (A) C-C C-G G-G S-L xlO^ C-C C-G G-G S-L
W untreated 110 220
0259 0247
0259 0247
3500 3700 3810 3810 14500 4040
008 -001 -003 -005 024 0
W ground 110 220
125 204
125 205
1030 2240 1450 1220 940 550
054 090 093 105 045 032
Ag untreated 111 2
0600 0901
0600 0900
2000 3340 2390 2190 1670 1110
024 035 039 095 0 0
200 124 124 1030 2270 1470 1230 810 047 082 085 095 0 400 204 204 490 0
Ag ground 111 222
198 352
200 352
650 2080 1240 910 530 280
095 179 182 197 048 0
200 403 406 350 9380 4780 1320 260 180 405 405 408 082 400 803 803 120 0
Lai85Sroi3Cu04 004 006
0657 0881
0650 0880
2000 5230 3290 2660 1970 1140
049 076 078 088 044 0
110 119 119 940 1240 1000 970 840 044 052 064 080 0 220 158 158 630 0
La2Cu4 004 006
0988 132
0998 131
1200 2980 1940 1630 1490 760
08 107 112 127 081 0-
020 143 142 760 1200 910 860 1240 07 079 090 110 114 040 198 200 510 016 200 126 124 810 810 810 810 1250 03 002 011 015 089 400 1S 126 830 014
Not possible to evaluate because of too small Gauss integral breadth
342
Volume 98 Number 3 May-June 1993
Journal of Research of the National Institute of Standards and Technology
closely a Warren-Averbach method These results concur with the Klug and Alexander [24] compari- son of the published size and strain values obtained by Warren-Averbach (Stokes) and integral-breadth methods However for x-ray diffraction the Cauchy-Gauss assumption for the size-strain broadening is theoretically and experimentally more favored thpoundm the other two models The fact that the Gauss-Gauss method for crystallite size and the Cauchy-Cauchy method for strain give more realistic results may mean that the presump- tion that size and strain broadening are exclusively of one type is an oversimplification
The single-line method seems much less reliable If Gaussian breadth is very small no information about strain is obtained Moreover second-order reflections give much lower values of both size and strain than do basic reflections However if multi- ple reflections are not available the single-line method can give satisfactory estimations
54 Reliability of Profile Fitting
The profile fitting of a cluster of even severely overlapping peaks can be accomplished with a low error and excellent fit of total intensity But how reliable is information obtained about separate peaks in the cluster In the fitting procedure it is possible to put constraints on the particular profile parameter to limit intensity position and width of the peak If anisotropic broadening or different phases are present constraints may not be realistic Morever acceptable results can be obtained even using a different number of profiles in refinement [4] Hence the first condition for the successful ap- plication of this method is knowledge of actual phases present in the sample and their crystalline structures
In this regard two powders were measured or- thorhombic Lai94Sroo6Cu04 has a slightly distorted K2NiF4-type structure (space group Bmab a =53510(2) A b =53692 A(2) c = 131931(7) A) and tetragonal Lai76Sro24Cu04 (space group I4mmm a =37711(3) A c = 132580(8) A) Data were collected for each specimen separately and for a specimen obtained by mixing the same pow- ders Because diffracted intensity of each phase was lower for the mixture counting time was pro- portionally increased to obtain roughly the same counting statistics Figure 19 shows two partially separated orthorhombic (020) (200) and (040) (400) peaks overlapped with tetragonal (110) and (220) reflections During the profile fitting of the mixed powders (200) orthorhombic peak tended to disappear on account of neighboring (020) and
(110) reflections Its intensity was constrained to vary in range plusmn 30 of (020) peak intensity which can be justified if the crystallographic structure is known
60
-60
345
345
335 29 (deg)
345
Fig 19 (upper) Lai76Sro24Cu04 (110) peak (middle) Lai94Sroo6Cu04 (020) and (200) peaks (lower) (110) (020) and (200) peaks
Table 7 contains results of fitted specimen-Voigt functions as well as size and strain values obtained by the analysis of broadening Comparing integral breadths of the starting and mixed powders some profiles change from more Cauchy-like to Gauss- like and vice versa This is especially evident for the (400) reflection meaning that accurate deter- mination of the profile tails is indeed affected in the cluster of overlapping peaks However integral breadth does not change significantly so results of
343
Volume 98 Number 3 May-June 1993
Journal of Research of the National Institute of Standards and Technology
Table 7 Comparison between two specimens run separately and mixed togetlier
Specimen hkl 2Hdeg) )3cO PoO DUA) (D)v(A) (e2laquoD)v2))laquoxlO
Lai76Sroj4CuOr 110 3369 0058(6) 0094(7) 780(60) 850(60) 10(1) 220 7073 022(2) 013(2)
LaiMSro(KiCu04 020 3342 0084(9) 055(14) 500(90) 1000(200) 07(1) 040 7012 010(2) 014(1) 200 3353 00216(85) 0061(8) 1100(100) 1200(100) 03(1) 400 7040 0026(11) 0088(8)
Mix 110 3367 0083(21) 0064(14) 800(300) 1200(300) 08(3) Lai76Sro24Cu04 220 7072 019(7) 013(4)
+ 020 3343 0066(35) 0070(23) 800(300) 1000(300) 07(4) Lai94Sroo6Cu04 040 7012 0116(93) 013(5)
200 3354 0024(156) 0071(61) 900(700) 1000(600) 04(12) 400 7041 011(2) 0003(320)
the multiple-line methods are not much influenced On the contrary the single-line method gives quite different results This may support the conclusion of Suortti Ahtee and Unonius [43] that the Voigt function fails to account properly for size and strain broadening simultaneously if only Cauchy integral breadth determines crystallite size
Table 7 shows that the results of Warren- Averbach analysis of starting and mixed powders agree in the range of standard deviations How- ever errors are much larger especially for the hid- den (200)-(400) reflections From Eq (62) it follows that more counts (longer counting times) and more observables (smaller step-size) would lower standard deviations Therefore in the case of highly overlapping patterns to obtain desirable ac- curacy much longer measurements are needed al- though that will not change the fact that higher overlapping implies intrinsically higher errors of all refinable parameters To further minimize possible artifacts of the fitting procedure it is desirable to include in the analysis as many reflections in the same ciystallographic direction as possible
55 Remarks
By modeling the specimen size and strain broad- ening with the simple Voigt function it is possible to obtain domain sizes and strains that agree with experiment and show a logical interrelationship Furthermore the Voigt function shows the correct 1A(26y asymptotic behavior of peak tails as ex- pected from kinematical theory [139] However if the specimen profile is significantly asymmetric (because of twins and extrinsic stacking faults [140 59]) or the ratio FWHM^ is not intermediate to the Cauchy (2Tr) and Gauss (2(ln27r)^) functions then the Voigt function can not be applied [25]
Suortti Ahtee and Unonius [43] found good over- all agreement by fitting the Voigt function to the pure-specimen profiles of a Ni powder deconvo- luted by the instrumental function However more accurate comparison is limited because of unavoid- able deconvolution ripples of specimen profiles Furthermore the Voigt function might not be flex- ible enough to model a wide range of specimen broadening as well as the different causes of broadening Therefore the question whether the Voigt function can satisfactorily describe complex specimen broadening over the whole 20 range in a general case needs further evaluation
This method of Fourier analysis with the as- sumed profile-shape function is most useful in cases when the classical Stokes analysis fails there- fore when peak overlapping occurs and specimen broadening is comparable to instrumental broaden- ing It was shown that for a high degree of peak overlapping the fitting procedure can give unreli- able results of Gauss and Cauchy integral breadths that is the peak can change easily from predomi- nantly Cauchy-like to Gauss-like and contrary This can lead to illogical values of size-integral and strain-integral breadths according to Eqs (52) (53) (54) and (55) and to irregularities in the be- havior of Fourier coefficients for large L Simulta- neously if the size-broadened profile has a large Gauss-function contribution the hook effect will occur However volume-weighted domain sizes D)y and MSS eL)) for small L are much less affected because they rely on both Cauchy and Gauss parts of the broadened profile Any integral- breadth method that attempts to describe the size and strain broadening exclusively by a Cauchy or Gauss function in this case fails completely For specimens with lower crystallographic symmetry
344
Volume 98 Number 3 May-June 1993
Journal of Research of the National Institute of Standards and Technology
when many multiple-order reflections are avail- able but the peaks are overlapped it is therefore desirable to include in the analysis as many reflec- tions as possible to minimize the potential artifacts of the fltting process
6 Analysis of Superconductors 61 (La-M)2Cu04 Superconductors
Bednorz and Miiller [16] found the first high- temperature oxide superconductor in the La-Ba- Cu-O system Soon after substituting Ba with Sr and Ca Kishio et al [17] found superconductivity in two similar compounds Later many compounds with much higher transition temperatures (Tc) were found The (La-M)2Cu04 system remains favorable for study because the cation content responsible for the superconductivity is easier to control and measure than the oxygen stoichiometry Also this system provides a wide range of substitutional cation solubility in which the tetragonal K2NiF4- type structure is maintained Compared with much- studied Y-Ba-Cu-O this structure is simpler because it contains only one copper-ion site and two oxygen-ion sites
The undoped compound La2Cu04 is orthorhom- bic at room temperature It becomes superconduct- ing either with cation substitution on La sites or increased oxygen content to more than four atoms per formula unit Doping with divalent cations in- creases the itinerant hole carriers in the oxygen- derived electron band [141] which probably causes the superconductivity However different dopants influence the transition temperature Tc Although the unit-cell c-parameter simply reflects ionic dopant size [142] the in-plane unit-cell parameter (and accordingly the Cu-0 bond length) correlates with Tc for different dopants and for different dop- ing amounts [142 143]
LaiB5MouCu04 (M = Ba Ca Sr) have a tetrago- nal K2NiF4-type structure space group lAlmmm with four atoms in the asymmetric unit [117] One site is occupied with La partially substituted with dopant ions (Fig 20) La2Cu04 is orthorhombic at room temperature The best way to correlate these two structures is to describe La2Cu04 in space group Bmab the c axis remains the same tetrago- nal [110] and [110] directions become [010] and [100] orthorhombic axes and size of the unit cell is doubled [144]
Figure 21 shows parts of the x-ray diffraction patterns observed and refined of Lai85Moi5Cu04 (M = Sr Ba Ca) and La2Cu04 Refined lattice
parameters are given in Table 8 Table 9 shows resuhs of the line-broadening analysis Relatively
La(BaCaSr)
0(2)
0(1)
Fig 20 Ciystal structure of (La-M)2Cu04 showing one unit cell
300 JUU
(b)
200
100
U 0 M J Js-r-^
30
-30
300
40 41 42 43 44 45 40 41 42 43 44 45 29 (deg) 29 (deg)
mdashA-
gt t 200
Z
F-
- 100
(c)
f V kgt ii I 40 41 42 43 44 45 40 41 42 43 44 45
e (deg) ^^ 26 (deg)
-30 wwX mdash Wlaquo-
Fig 21 Diffraction patterns of LaiH5Moi5Cu04 specimens (a) M=Sr (b) M = Ba (c)M = Ca (d) M = U
345
Volume 98 Number 3 May-June 1993
Journal of Research of the National Institute of Standards and Technology
Table 8 Lattice parameters and T^ at zero resistivity (Ac method at 10 Ma current)
Specimen a (A) bk) c(A) rc(K)
Lairaquo5Sroi5Cu04 377814(7)
Lairaquo3Baoi3Cu04 37846(2)
LaiiijCaoi5Cu04 37863(7)
La2Cu04 53558(2) 54053(2)
231(2) 36
288(4) 28
17(2) 19
1451(8)
Table 9 Results of line-broadening analysis for (La-M)2Cu4 specimens
Specimen hkl PcO PoO (DUk) (Iraquo)(A) lte^((D)2))
Lai(laquoSroj5Cu04 004 006
0046(4) 0083(5)
0024(8) ltio-
1700(300) 2000(200) 000049(9)
110 0110(5) ltio- 470(20) 940(20) 000044(6) 220 0171(9) ltio-
Lai85Baoi3Cu04 004 006
0049(6) 0110(7)
0076(6) 0089(9)
1100(200) 1100(100) 00011(2)
110 0087(4) 000042(6) 560(20) 1110(20) 000024(5) 220 0116(3) ltio-5
Laiji5Caoi5Cu04 004 006
0120(13) 0146(12)
0032(22) 0033(27)
440(70) 780(90) 00007(4)
110 0045(25) 0200(19) 340(30) 360(20) 00013(2) 220 0343(22) ltio-
La2Cu04 004 006
0061(8) 0124(7)
0045(9) ltio-
1100(100) 1200(100) 00008(1)
020 0074(10) 0078(10) 680(50) 760(50) 00007(2) 040 0210(30) 0026(81) 200 0074(8) 0061(10) 680(50) 810(50) 00003(3) 400 0130(10) 0023(95)
weak peak broadening was observed which can not be attributed to the proximity of the phase trans- formation Lai85SroisCu04 is tetragonal down to = 170 K [145] Lai85Baoi5Cu04 to 140 K [146147] and Lai85Caoi5Cu04 to 130 K [148] Another possi- ble reason for peak broadening might be continu- ous compositional variations in dopant content The scanning Auger microprobe analysis of La2-SrtCu04 compounds [149] showed that grain- boundary segregation of Sr is weak and limited to a narrow region near the grain surface In the case of the separation of two phases with different Sr con- tent and similar lattice parameters asymmetry of some reflections would be observed [150] More- over in the case of compositional inhomogeneity microstrains eL)) would be roughly independent of the averaging distance L in the grains [151] therefore distribution of strains would be Gaus- sian For all specimens microstrain behavior is identical it decreases linearly with distance L
Rothman and Cohen [115] showed that such be- havior of microstrains is caused by dislocations that might arise during grinding Assuming the same applied stress microstrain would be approximately inversely proportional to the elastic moduli of these materials If mean microstrain is defined as the arithmetic average of strains for the [001] and [110] directions results agree with values of the Youngs moduli for polycrystalline La2Cu04 Lai85Moi5Cu04 (M = Sr Ba Ca) [152] However other factors may contribute to the microstrain Coordination-6 ionic radii of La^+ Sr Ba^+ Ca^+ are 106 116 136 100 A respectively [153] Substitution of La with ions of different sizes affects the lattice parameter [142] and may cause much larger strains in the [001] direction when some of the ions are replaced with Ba^ than with Sr^ in accord with results in Table 9 Substitution of Ca^^ ions produces an entirely different effect microstrains in the [110] direction are larger This may be explained by
346
Volume 98 Number 3 May-June 1993
Journal of Research of the National Institute of Standards and Technology
comparing effects of substitutional ions on the unit-cell a -parameter The Ba-doped specimen has a larger a-parameter than the Sr-doped but the Ca-doped a-parameter is largest although Ca^^ has the smallest ionic size This should increase the cell distortion in the a-b plane
Table 9 reveals high anisotropy in these materi- als consistent with other physical properties such as thermal expansion [154] and upper critical mag- netic field [155] Differences of domain sizes might arise from a layered structure in the [001] direction and consequently easy incorporation of stacking faults between regularly stacked layers The stack- ing-fault and twin-fault probabilities can be esti- mated from the average surface-weighted domain sizes [59]
^ = TAN + cf1fun(aa) (75) m im - (D)
Here c is a constant for the particular [hkl] direction and fun(a a) a linear combination of stacking-fault probability and twin-fault probability a The exact form of Eq (75) was derived only for the cubic and hexagonal crystal structures On con- dition that the true domain dimension D is isotropic or so large that the second term of Eq (75) dominates a linear function of stacking-fault and twin-fault probability is
fun(aa) = c( 1
) (76) Zgt)J (Dgttrade
Here c denotes a constant that depends only on geometrical factors and is the same for all three doped compounds
Figure 22 shows a possible correlation between Tc and fault-defect probabilities computed from TEM observations of La2-jcSrCu04 revealed that stacking-fault density increased with Sr content up to jc = 015 [156] That study suggests that a shear mechanism forming the fault-boundary dislocations implies oxygen vacancies andor cation deficiency We did not measure oxygen content but neutron- diffraction studies showed that oxygen deficiency starts to appear at much higher Sr content [157] However the increase of fault probability with the simultaneous decrease of microstrain in Fig 22 supports the assumption that defects are intro- duced to accommodate lattice strains [156] A simi- lar increase in Te was found in Y2Ba4Cu802o-laquo thin films [158] Compounds with asymmetric broad- ened and shifted peaks showed higher Tc which
was attributed to stacking faults Although extrinsic stacking faults may cause asymmetric peak broad- ening [140] it is probably caused by twinning Twinning in La-M-Cu-0 materials is less abundant than in Y-Ba-Cu-O compounds but it was ob- served in (La-Sr)2Cu04 monocrystals on (110) planes [159] In the profile-fitting procedure peak asymmetry is incorporated only in the instrumental function therefore we could not model asymmetric peak broadening However any significant asym- metry of the specimen profile would cause an un- even fit of low-angle and high-angle sides of peaks which was not observed This gives much more im- portance to stacking faults in Eq (76)
Fig 22 Arithmetic average of [110] and [001] root-mean- square strains and linear function of stacking-fault and twin- fault probabilities as a function of Tc
In Fig 22 average microstrains defined as the arithmetic average of [001] and [110] directions correlate inversely with Tc However we did not find a correlation of Tc and microstrains in a partic- ular direction [001] microstrains simply reflect dif- ference in size of dopant and host La^ ions (see Table 9)
In La2Cu04 (OkO) reflections are significantly broader than (hOO) This has also been observed in low-temperature orthorhombic Lai85Sroi5Cu04 and Lai85Baoi5Cu04 [160] and explained by either stacking faults or possible lower symmetry Our results reveal that domain sizes (D) have identical values for [010] and [100] directions (Table 9) From Eq (76) it follows that stacking-fault proba- bilities in these directions have the same values However microstrains in the [010] direction are roughly twice as large as in the [100] direction which is responsible for the different broadening In the case of doped La2Cu04 compounds different microstrains might be caused by oxygen
347
Volume 98 Number 3 May-June 1993
Journal of Research of the National Institute of Standards and Technology
vacancies ordered along one direction in the a-b plane similar to effects found in YBa2Cu307-laquo However undoped La2Cu04 is not expected to have significant o^Qgen deficiency Other possibili- ties are lower ciystallographic symmetry andor La vacancies although they were not reported for this system but La deficiency was found in an La2Co04 compound [161]
We can conclude that lattice strains and incoher- ently diffracting domain sizes confirm high an- isotropy in these materials This simple approach however does not allow unambiguous identifica- tion of the strains origin Probably the strains originate from dislocations and from different sizes of host and dopant ions Domain sizes of all com- pounds are larger in the c-direction than in the a-6 plane This indicates existence of stacking faults and twins However because estimated errors are relatively large and only three materials were stud- ied the possible connection between stacking faults and 7c needs further study
62 Bi-Cu-O Superconductors
Among the high-Tc superconductors the Bi- Cu-O compounds appear intriguing especially because their incommensurate structure modula- tion remains incompletely understood [162 163] The crystal structure consists of perovskite-like SrO-(Cu02Ca)mi-Cu02-SrO layers separated by NaCl-like BiO double layers (see Fig 23 [164]) The number m of Cu02 layers alters the supercon- ducting transition temperature Tc (for m = 12 and 3 rclaquo10 90 and 110 K respectively) This two- dimensional layered structure makes these materi- als highly anisotropic and favours the creation of defects
Bulk sintered specimens showed relatively weak peak broadening Moreover the diffraction pat- terns contained many overlapping peaks because the compound crystallizes in an orthorhombic low- symmetry space group A2aa [165] and incommen- surate modulation gives superlattice reflections All patterns revealed a strong [001] texture (Fig 24) making reflections other than (001) difficult to ana- lyze The lattice parameters vary depending on the exact compound stoichiometry and processing his- tory but characteristically they have almost identi- cal a and b parameters and large c parameter fl =54095 A 6=54202 A c =309297 A for Bi2Sr2CaCu208 (Bi-2212 [166] and A =5392 A b =5395 A c =36985 A for (BiPb)2Sr2Ca2Cu30io (BiPb-2223) [165] Thus we treated (hOO) and (0^0) reflections as single peaks Table 10 gives the
results for three specimens Bi-2212 (BiPb)2 (SrMg)2(BaCa)2Cu30io (BiPbMgBa-2223) which were one-phase specimens and BiPb-2223 con- taining approximately equal amounts of 2212 and 2223 phases The in-plane lattice parameters of 2212 and 2223 phases differ little hence only the [00] directions of the mixed-phase specimen were evaluated
b^ (c)
Fig 23 Average crystal structure of Bi2Sr2Cam-iCum04+2m for (a) m = 1 (b) w =2 (c) m =3 [164]
35
-35
42 44 46 48 50 52 54 56 58 60 62 26 (deg)
^ ^^^MK^Aa^Ndllaquop
Fig 24 Part of BiPbMgBa-2223 refined pattern There are 48 fundamental reflections in this region
Interpretation of the results in the case of these complicated compounds must be considered care- fully Microstrains are probably caused by disloca- tion arrays However substitution of different-sized ions and vacancies would also contribute to the strains as would other kinds of disorder especially
348
Volume 98 Number 3 May-June 1993
Journal of Research of the National Institute of Standards and Technology
Table 10 Results of line-btoadening analysis for Bi-Cu-O supreconductors
Specimen Phase hkl (A)
eD)sa)y^
Bi-2212 2212 008 0012
0163(8) 022(3)
001(6) 005(6)
420(80) 00021(6)
020+200 0104(4) ltio-^ 580(30) 00007(1) 040+400 018(2) 00004(6300)
BiPbMgBa-2223 7773 0010 0020
0097(1) 021(2)
00002(1700) 0007(150)
770(60) 00012(1)
020 + 200 012(27) 013(10) 380(430) 00009(71) 040 + 400 015(95) 021(33)
BiPb-73 2212 008 0012
023(2) 025(5)
0002(350) 0001(1000)
220(30) 00013(26)
2223 0010 0020
022(8) 023(99)
0092(67) 018(47)
230(190) 00012(197)
Stacking faults and twins Table 10 shows larger strains in the [001] direction that in the basal plane This can be explained by stacking disorder along the c-axis which was frequently observed in electron-diffraction patterns as streaking [167 168] Easy incorporation of stacking faults is possi- ble because of the two-dimensional weak-bonded layers (BiO double layers are spaced about 3 A apart) The difference in microstrain between in- plane and the c-direction is much smaller for the BiPbMgBa-2223 phase probably because Pb low- ers the faulting by stabilizing the higher-Tc 2223 phase [167] For the BiPb-2223 specimen with two phases there are two possibilities Either the speci- men consists mainly of a mk of two kinds of one- phase grains or both phases occur within the same grains The second possibility was confirmed exper- imentally [169 170] and our results concur be- cause microstrain in the 2212 phase is much smaller than in the one-phase Bi-2212 specimen Processing conditions and cation content probably favour development of the macroscopic inter- growth of both phases within the grains that is microscopic defects grow to sufficiently large re- gions to give a diffraction pattern of another phase with the different number of Cu02 layers As a re- sult strain is relieved and both strains and domain sizes being quite different in one-phase specimens tend to equalize
For the Bi-Cu-O specimens the mean surface- weighted domain sizes are generally smaller than for (La-M)2Cu04 compounds Therefore the com- putation of the stacking- and twin-fault probabili- ties by using Eq (75) may be wrong It would be very instructive to compare the different broaden-
ing of satellite and fundamental reflections which indicates a more pronounced stacking disorder in the modulated structure [171]
In summary we found that for both Bi-2212 and BiPbMgBa-2223 superconductors the c-axis strain exceeds the in-plane strain The BiPb-2223 specimen containing both 2212 and 2223 phases within the single grains shows smaller incoherently diffracting domains and lower c-axis strain than the one-phase specimens This fact may direct us to- ward the mechanism of the second-phase forma- tion in these materials
63 Remarks
It was shown that this particular method of the line-broadening analysis can give information about the size of incoherently diffracting domains and lattice strains in (La-M)2Cu04 and Bi-Clu-O superconductors Moreover results show high an- isotropy of both size and strain parameters as one may expect because of the layered structure of all superconducting cuprates Generally structural line broadening is not large that is a result of rela- tively large domain sizes (200-2000 A) and small strains (002-02) It is interesting to compare these values with the published results for YBa2Cu307-laquo (isotropic strains of 023 [77] and 005-03 [82]) Although the different materi- als were studied they seem too large especially be- cause they are the average of strains in different directions
The main drawback of the line-broadening the- ory is the uncertainty about the origins of the line broadening that is it is difficult to distinguish the main effects responsible for the broadening For
349
Volume 98 Number 3 May-June 1993
Journal of Research of the National Institute of Standards and Technology
the novel superconductors particularly the numer- ous defects (substitutions vacancies stacking faults dislocations and similar) can occur simulta- neously which makes it very difficult to determine their individual contributions Furthermore the crystal structures of most novel superconductors are relatively complicated The average structure has mostly a slightly distorted tetragonal symmetry very similar a and b lattice parameters and a large c parameter but c=36 for YBa2Cu307-laquo for in- stance This results in a large number of overlap- ping peaks and consequently in large errors of all results This showed especially in the case of Bi-Cu-O superconductors (see Table 10) Follow- ing the discussion of reliability of profile fitting in Sec 54 it would be desirable to include more than two reflections in the analysis of broadening but higher-order peaks are usually too weak and over- lapped One way to partially solve this problem would be a whole pattern fitting [172 173] and Rietveld structure refinement [23] in terms of size and strain parameters This requires an accurate preset function to model specimen broadening and precise definition of angular dependence of size and strain parameters The Rietveld programs that model the line broadening in terms of size and strain parameters are based either on the simpli- fied integral-breadth methods [78 95] or on the single-line method [174]
7 Conclusions
A method for analyzing the pure-specimen (structural) broadening of x-ray diffraction line profiles is proposed By modeling the specimen size and strain broadenings with the simple Voigt func- tion it is possible to obtain domain sizes and strains that agree with experiment and show a logi- cal interrelationship Furthermore some common consequences and problems in the Fourier-method analysis follow easily The specimen function is convoluted with the instrumental function to match the observed x-ray diffraction-line profile This avoids the Stokes deconvolution method thus al- lowing analysis of patterns with highly overlapping peaks and weak structural broadening Therefore the method was applied to some novel high-Tc superconductors We reached the following conclu- sions
(i) Surface-weighted domain size depends only on the Cauchy integral breadth of the size-broad- ened profile
(ii) The hook effect occurs when the Cauchy-content of the size-broadened profile is un-
derestimated that is for ^sc(n2)^3sG Usually this happens when the background is estimated too high so the long tails of the Cauchy function are prematurely cut off
(iii) It also follows from conclusion (ii) that the volume-weighted domain size can not be more than twice the surface-weighted domain size (limiting value D)v=2D)i is obtained for the pure-Cauchy size-broadened profile) Minimum value for D)J (D)j should not be less than -131
(iv) If the distortion coefficient is approxi- mated with a harmonic term this leads exactly to the Warren-Averbach method of separation of size and strain broadenings
(v) In that case mean-square strains decrease linearly with the distance L
(vi) It is possible to evaluate local strain ((e^(0))^) only in the case of pure-Gauss strain broadening Then root-mean-square strain is inde- pendent of the distance L and related to the upper limit of strain obtained from the integral breadth of the strain-broadened profile
(vii) If strain broadening is not described exclu- sively with the Gauss function the multiple-line Voigt integral breadth and Warren-Averbach analyses can not give the same results for volume- weighted domain size although D)v is defined identically in both approaches because the appar- ent strain -q = pdeg(29)cot9 is not angular- independent
(viii) Smooth size coefficients give column- length distribution functions without oscillations and make possible a computation of volume- weighted average domain sizes up to ~5000 A
(ix) Comparison with the simplified integral- breadth methods in most cases has shown not large but systematic discrepancy of results indicat- ing that size and strain broadening can not be accu- rately modeled by a single Cauchy or Gauss function Moreover the application of the single- line method is much less reliable and it should not be used where multiple reflections are available
(x) The knowledge of all phases present in the sample and their crystallographic structure is re- quired to successfully fit a cluster of overlapping peaks Although it is very difficult to accurately de- termine the Cauchy-Gauss ratio of an overlapped peak final results of domain size and strain are much less affected Therefore connecting the crys- tallite size exclusively with the Cauchy content and strain with the Gauss content of a specimen profile might be doubtful
(xi) Evaluated errors of domain sizes and strains increase substantially with the degree of
350
Volume 98 Number 3 May-June 1993
Journal of Research of the National Institute of Standards and Technology
peak overlapping Hence for complicated patterns very accurate measurements are necessary and one needs to analyze as many reflections in the same crystallographic direction as possible
(xii) Line-broadening analysis of (La-M)2Cu04 and Bi-Cu-O compounds confirms high anisotropy in these materials
(xiii) Strains in (La-M)2Cu04 probably origi- nate from dislocations and from different sizes of host and dopant ions
(xiv) Stacking-fault probability in (La-M)2Cu04 (M = Ba Ca Sr) increases with increasing Tc whereas the average strain decreases
(xv) In La2Cu04 different broadening of (lOO) and (OfcO) reflections is not caused by stacking faults
(xvi) All Bi-Cu-0 superconductors show larger strain in the c-direction than in the a-b plane which can be explained by stacking disorder along the [001] direction
(xvii) In the specimen with approximately equal amounts of Tl-2212 and TlPb-2223 phases it is likely that a secondary phase develops by the growth of the microscopic faulted regions of the primary phase
Acknowledgments
I am thankful to Dr Harry McHenry for his support and especially to Dr Hassel Ledbetter for his wise guidance and most useful help during my stay at NIST I am also indebted to my home insti- tution the Faculty of Metallurgy of the University of Zagreb for allowing me the leave of absence at NIST
8 References
[1] W Friedrich P Knipping and M v Laue Ann Physik 41 971 (1912)
[2] H M Rietveld Acta Cryst 22 151 (1967) [3] H M Rietveld J Appl Cryst 2 65 (1969) [4] S A Howard and K D Preston in Modern Powder Dif-
fraction Vol 20 The Mineralogical Society of America Washington DC (1989) p 217
[5] D Taupin J Appl Cryst 6 266 (1973) [6] T C Huang and W Parrish Appl Phys Lett 27 123
(1975) [7] M K Wu J R Ashburn C J Torng P H Hor R L
Meng L Gao Z J Hwang Y Q Wang and C W Chu Phys Rev Lett 58 908 (1987)
[8] D Shi MRS Bull 16 37 (1991) [9] D Larbalestier Phys Today 44 74 (1991)
[10] J C Phillips Phys Rev B 4512647 (1992) [11] B Raveau Phys Today 45 53 (1992) [12] A J Millis and K M Rabe Phys Rev B 38 8908 (1988)
[13] F Guinea Europhys Lett 7 549 (1988) [14] C P Dhard and P Singh in Proc Int Symp High-Temp
Supercond Jaipur India Oxford amp IBH Publishing New Delhi (1988) p 271
[15] J D Jorgensen Phys Today 44 34 (1991) [16] J G Bednorz and K A Muller Z Phys B 64 189
(1986) [17] K Kishio K Kitazawa S Kaube I Yasuda N Sugii H
Takagi S Uchida K Fueki and S Tanaka Chem Lett 429 (1987)
[18] J D Jorgensen B Dabrowski S Pei D G Hinks L Soderholm B Morosin J E Venturini and D S Ginley Phys Rev B 38 11337 (1988)
[19] J R Clem Phys Rev B 43 7837 (1991) [20] M Paranthaman M Foldejiki D Balzar H Ledbetter
A J Nelson and A M Hermann submitted to Phys Rev B
[21] A R Stokes Proc Phys Soc Lond 61 382 (1948) [22] B E Warren and B L Averbach J Appl Phys 23 497
(1952) [23] R Delhez Th H de Keijser and E J Mittemeijer in
Accuracy in Powder Diffraction S Block and C R Hub- bard eds Natl Bur Stand (US) Special Publication 567 (1980) p 213
[24] H P Klug and L E Alexander X-ray Diffraction Proce- dures 2nd Edition John Wiley New York (1974) p 661
[25] J I Langford J Appl Ciyst 11 10 (1978) [26] J I Langford in Accuracy in Powder Diffraction S
Block and C R Hubbard eds Natl Bur Stand (US) Special Pubication 567 (1950) p 255
[27] R Delhez Th H de Keijser and E J Mittemeijer Fre- senius Z Anal Chem 312 1 (1982)
[28] A J C Wilson Proc Phys Soc Lond 80 286 (1962) [29] A J C Wilson Proc Phys Soc Lond 81 41 (1963) [30] L P Smith Phys Rev 46 343 (1934) [31] H C Burger and P H van Cittert Z Phys 79 722
(1932) [32] S Ergun J Appl Ciyst 1 19 (1968) [33] R Croche and L Gatineau J Appl Ciyst 10479 (1977) [34] L H Schwarz and J B Cohen Diffraction from Materi-
als Academic Press New York (1977) p 391 [35] R Delhez Th H de Keijser E J Mittemeijer and J I
Langford J Appl Cryst 19 459 (1986) [36] R Delhez Th H de Keijser E J Mittemeijer and J I
Langford Aust J Phys 41 213 (1988) [37] R A Young and D B Wiles J Appl Cryst 15 430
(1982) [38] W Voigt Stizungsber K Bayer Akad Wiss 42 603
(1912) [39] E E Whiting J Quant Spectrosc Radiat Transfer 8
1379 (1968) [40] G K Wertheim M A Butler K W West and D N E
Buchanan Rev Sci Instrum 111369 (1974) [41] M M Hall Jr V G Veeraraghavan H Rubin and P G
Winchell J Appl Cryst 10 66 (1977) [42] A Brown and J W Edmonds Adv X-Ray Anal 23 361
(1980) [43] P Suortti M Ahtee L Unonius J Appl Cryst 12 365
(1979) [44] T Sundius J Raman Spectrosc 1 471 (1973) [45] B H Armstrong J Quant Spectrosc Radiat Transfer 7
61 (1967) [46] J F Kielkopf J Opt Soc Am 63 987 (1973) [47] B P Asthana and W Kiefer Appl Spectr 36 250
(1982)
351
Volume 98 Number 3 May-June 1993
Journal of Research of the National Institute of Standards and Technology
[48] J P M de Vreede S C Mehrotra A Tal and H A Dijkerraan Appl Spectr 36 227 (1982)
[49] F R L Schoening Ada Ciyst 18 975 (1965) [50] P Scherrer Gott Nachr 2 98 (1918) [51] A R Stokes and A J C Wilson Proc Cambridge
Philos Soc 38 313 (1942) [52] A J C Wilson X-Ray Optics 2nd edition Methuen
London (1962) [53] S Leie and T R Anantharaman Proc Indian Acad
Sci Sect A H 261 (1966) [54] D Louer D Weigel and J I Langford J Appl Ciyst
5 353 (1972) [55] A J C Wilson J Appl Ciyst 2 181 (1969) [56] J I Langford and A J C Wilson J Appl Ciyst 11102
(1978) [57] A R Stokes and A J C Wilson Proc Phys Soc Lond
56174 (1944) [58] B E Warren and B L Averbach J Appl Phys 21 595
(1950) [59] B E Warren X-Ray Diffraction Addison-Wesley
Reading Massachusetts (1969) p 264 [60] B E Warren in Progress in Metal Physics Vol 8 Perg-
amon Press London (1959) p 146 [61] F Bertaut C R Acad Sci Paris 228 187 (1949) [62] N C Haider and C N J Wagner Acta Cryst 20 312
(1966) [63] D Balzar and H Ledbetter in Proceedings of the Accu-
racy in Powder Diffraction II Natl Inst Stand Technol (1992) p 37
[64] D Balzar and H Ledbeter J Appl Cryst 26 (1993) in press
[65] J N Eastabrook and A J C Wilson Proc Phys Soc Lond B 65 67 (1952)
[66] R S Smith IBM J Res Develop 4 205 (1960) [67] B Y Pines and A F Sirenko Soviet Physics Ciyst 715
(1962) [68] G B Mitra and N K Misra Acta Ciyst 22 454 (1967) [69] A Gangulee J Appl Ciyst 7 434 (1974) [70] J Mignot D Rondot Acta Met 231321 (1975) [71] J Mignot and D Rondot Acta Ciyst A 33 327 (1977) [72] R K Nandi H K Kuo W Schlosberg G Wissler J B
Cohen and B Crist Jr J Appl Ciyst 17 22 (1984) [73] M Zocchi Acta Ciyst A 36164 (1980) [74] P Ramarao and T R Anantharaman Trans Ind Ins
Metals 18 181 (1965) [75] R K Nandi and S P Sen Gupta J App Cryst 11 6
(1978) [76] Th H de Keijser J I Langford E J Mittemeijer and
B P Vogels J Appl Ciyst IS 308 (1982) [77] A Williams G H Kwei R B Von Dreele A C Lar-
son L D Raistrick and D L Bish Phys Rev B 37 7960 (1988)
[78] A C Larson and R B Von Dreele Los Alamos Na- tional Laboratory Report No LA-UR-86-748 (1988)
[79] J D Jorgensen D H Johnson M H Mueller J G Worlton and R B Von Dreele in Proceedings of the Conference on Diffraction Profile Analysis Cracow Poland (1978) p 20
[80] R B Von Dreele J D Jorgensen and C G Windsor J Appl Ciyst 15 581 (1982)
[81] P Thompson D E Cox and J B Hastings J Appl Ciyst 20 79 (1987)
[82] J P Singh R A Guttschow D S Kupperman J T Dusek and R B Poeppel in High Temperature Super-
conducting Compounds III S Whang A Gupta and E Ceilings eds TMS AIME Warrendale (1991) p 281
[83] M O Eatough D S Glnley and B Morosin Adv X- Ray Anal 33 145 (1990)
[84] E J Peterson P J Kung R E Muenchausen and D M Smith in Proceedings of the 41st Annual Denver Conference on Applications of X-Ray Analysis Colo- rado Springs Colorado (1992) p 74
[85] M Rand J I Langford and J S Abell submitted to J Cryogenics (1992)
[86] D Balzar J Appl Ciyst 25 559 (1992) [87] D Balzar H Ledbetter and A Roshko Physica C 185-
189 871 (1991) [88] D Balzar and H Ledbetter J Mater Sci Lett 111419
(1992) [89] D Balzar H Ledbetter and A Roshko Pow Diffr 8
(1993) in press [90] S Johnson M Gusraan D Rowcliffe T Geballe and J
Sun Adv Ceram Mater 2 337 (1987) [91] H Ledbetter S A Kim R B Goldfarb and K Togano
Phys Rev B 39 9689 (1989) [92] H Friedman Electronics 132 (1945) [93] W Parrish (ed) in Advances in X-Ray Diffractometry
and X-Ray Spectrography Centrex Publishing Company Eindhoven The Netheriands (1962)
[94] W Soller Phys Rev 24158 (1924) [95] S A Howard R L Snyder J Appl Ciyst 22 238
(1989) [96] G H Stout and L H Jensen X-Ray Structure Determi-
nation 2nd edition Wiley New York (1989) p 373 [97] D E Appleman and T Evans Jr Final Report 92-14
US Geological Survey Washington DC (1973) Avail- able as NTIS Document No PB-216188
[98] M U Cohen Rev Sci Instrum 6 68 (1935) [99] M U Cohen Rev Sci Instrum 7 155 (1936) [100] M H Mueller L Heaton and K T Miller Acta Ciyst
13 828 (1960) [101] R A Young P E Mackie and R B Von Dreele J
Appl Ciyst 10 262 (1977) [102] D B Wiles and R A Young J Appl Cryst 14 149
(1981) [103] J K Yau and S A Howard J Appl Ciyst 22 244
(1989) [104] S A Howard J K Yau and H U Anderson J Appl
Phys 65 1492 (1989) [105] S Enzo G Fagherazzi A Benedetti and S Poilizzi J
Appl Ciyst 21 536 (1988) [106] A Benedetti G Fagherazzi S Enzo and M
Battagliarin J Appl Cryst 21 543 (1988) [107] Th H de Keijser E J Mittemeijer and H C F Rozen-
daal J Appl Ciyst 16 309 (1983) [108] Y Zhang J M Stewart C R Hubbard and B Mo-
rosin Adv X-Ray Anal 33 373 (1990) [109] Y Wang S Lee and Y Ue J Appl Ciyst IS 35
(1982) [110] V N Selivanov and E F Smislov Zavod Lab 57 28
(1991) [Ill] A Guinier X-Ray Diffraction W H Freeman San
Francisco (1963) p 139 [112] M Wilkens J Appl Cryst 12119 (1979) [113] D Du and Y Wang Pow Diffr 2180 (1987) [114] A P Prudnikov Yu A Brychkov and O L Marichev
Integrals and Series Vol 1 Gordon and Breach Am- sterdam The Netheriands (1986) p 344
352
Volume 98 Number 3 May-June 1993
Journal of Research of the National Institute of Standards and Technology
[115] R L Rothman and J B Cohen J Appl Phys 42 971 (1971)
[116] T Adier and C R Houska J Appl Phys 50 3282 (1979)
[117] C R Houska and T M Smith J Appl Phys 52 748 (1981)
[118] S Rao and C R Houska Acta Ciyst A 4214 (1986) [119] J I Langford R Delhez Th H de Keijser and E J
Mittemeijer Ausi J Phys 41173 (1988) [120] J I Langfoid J Appl Cryst IS 315 (1982) [121] M J Turunen Th H de Keijser R Delhez and N M
van der Pers J Appl Ciyst 16176 (1983) [122] A J C Wilson Acta Ciyst 23 888 (1967) [123] A J C Wilson Acta Ciyst A 24 478 (1968) [124] A J C Wilson Acta Ciyst A 25 584 (1969) [125] G Gagliotti A Paoletti and F P Ricci Nucl Instrum
3 223 (1958) [126] J I Langford R J Cernik and D Louer J Appl
Ciyst 24 913 (1991) [127] J I Langford in Accuracy in Powder Diffraction II
preprint [128] A J C Wilson Mathematical Theory of X-Ray Powder
Diffractometiy Centrex Eindhoven The Netherlands (1963)
[129] J L Langford Prog Ciyst Growth and Charact 14185 (1987)
[130] T G Fawcett C E Crowder S J Brownell Y Zhang C R Hubbard W Schreiner G P Hamill T C Huang E Sabino J I Langford R Hamilton and D Louer Pow Diffr 3 209 (1988)
[131] W L Smith J Appl Ciyst 9187 (1976) [132] J L Langford and D Louer J Appl Ciyst 15 20
(1982) [133] Fl Popescu and L Benes Acta Ciyst A 33 323 (1977) [134] P PSuse^cu R MSnaila M Popescu and E Jijovici j
Appl Cryst 7 281 (1974) [135] P F Bley Y Calvayrac and M Fayard J Appl Ciyst
7 493 (1974) [136] B Moraweck Ph de Montgolfier and A J Renouprez
J Appl Ciyst 10191 (1977) [137] A Le Bail and D Louer J Appl Cryst 11 50 (1978) [138] D R Buchanan R L McCuUough and R L Miller
Acta Ciyst 20 922 (1966) [139] P Suortti and L D Jennings Acta Cryst A 33 1012
(1977) [140] J B Cohen and C N J Wagner J Appl Phys 33 2073
(1962) [141] A Bianconi J Budnick A M Flank A Fontaine P
Lagarde A Marcelli H Tolentino B Chamberland C Michel B Raveau and G Demazeau Phys Lett A127 285 (1988)
[142] K Fueki K Kitazawa K Kishio T Hasegawa S Uchida H Takagi and S Tanaka in Chemistiy of High- Temperature Superconductors D L Nelson M S Whittingham and T F George eds American Chemi- cal Society (1987) p 38
[143] T Fujita Y Aoki Y Maeno J Sakurai H Fukuba and H Fujii J Appl Phys 26 U68 (1987)
[144] R M Hazen in Physical Properties of High-rc Super- conductors Vol 2 D M Ginsberg ed World Scien- tific Singapore (1990) p 121
[145] J B Torrance A Bezinge A I Nazzal T C Huang S P Parkin D T Keane S J LaPlaca P M Horn and G A Held Phys Rev B 40 8872 (1989)
[146] J D Axe A H Moudden D Hohlwein D E Cox K
M Mohanty A R Moodenbaugh and Y Xu Phys Rev Lett 62 2751 (1989)
[147] T Suzuki and T Fujita Physica C 159 111 (1989) [148] T Fujita and Y Maeno in Superconducting Materials
JJAP Series 1 (1988) p 34 [149] A Roshko and Y-M Chiang J Appl Phys 66 3710
(1989) [150] D E Cox S C Moss R L Meng P H Hor and C W
Chu J Mater Res 31327 (1988) [151] B Crist and J B Cohen J Polym Sci 17 1001 (1979) [152] H Ledbetter S Kim and A Roshko Z Phys B 89275
(1992) [153] R D Shannon and C T Prewitt Acta Ciyst B 25 925
(1969) [154] M Lang H Spille F Steglich Y Hidaka T Murakami
and Y Endoh Physica C 162-1641037 (1989) [155] Y Hidaka and T Murakami Phase trans 15 241
(1989) [156] P L Gai and E M McCarron Science 247 553 (1990) [157] T Kamiyama I Izumi H Asano H Takagi S Uchida
Y Tokura E Takayama-Muromachi M Matsuda K Yamada Y Endoh and Y Hidaka Physica C 172 120 (1990)
[158] A Kapitulnik Physica C 153-155 520 (1988) [159] L A Muradyan V N Molchanov R A Tamazyan and
V I Simonov Physica C 162-164 536 (1989) [160] P Day M Rosseinsky K Prassides W I F David O
Moze and A Soper J Phys C 20 L429 (1987) [161] J T Lewandowski R A Beyerlein J M Longo and R
A McCauley J Amer Ceram Soc 69 699 (1986) [162] R Ramesh G van Tendeloo G Thomas S M Green
Y Mei C Jiang and H L Luo Appl Phys Lett 53 2220 (1988)
[163] J Schneck L Pierre J C Tolddano and C Daguet Phys Rev B 39 9624 (1989)
[164] O Eibl Physica C 168 215 (1990) [165] W Carrilo-Cabrera and W Gopel Physica C 161 373
(1989) [166] P Bordet J J Capponi C Chaillout J Chenavas A
W Hewat E A Hewat J L Hodeau M Marezio J L Tholence and D Tranqui Physica C 156189 (1988)
[167] R Ramesh K Remschnig J M Tarascon and S M Green J Mater Res 6 278 (1991)
[168] Z Hiroi Y Ikeda M Takano and Y Bando J Mater Res 6 435 (1991)
[169] Y Inoue M Hasegawa Y Shichi I Munakata M Ya- manaka S Hiyama and O Nittono J Mater Res 5 737 (1990)
[170] R Ramesh B G Bagley J M Tarascon S M Green M L Rudee and H L Luo J Appl Phys 67 379 (1990)
[171] X B Kan J Kulik P C Chow S C Moss Y F Yan J H Wang and Z X Zhao J Mater Res 5 731 (1990)
[172] G S Pawley J Appl Ciyst 13 630 (1980) [173] H Toraya J Appl Ciyst 19 440 (1986) [174] L Lutterotti and P Scardi J Appl Ciyst 23 246
(1990)
About the author Davor Balzar is with Faculty of Metallurgy of the University of Zagreb Sisak Croatia and was a Guest Researcher at fflST The National Institute of Standards and Technology is an agency of the Technology Administration US Department of Commerce
353
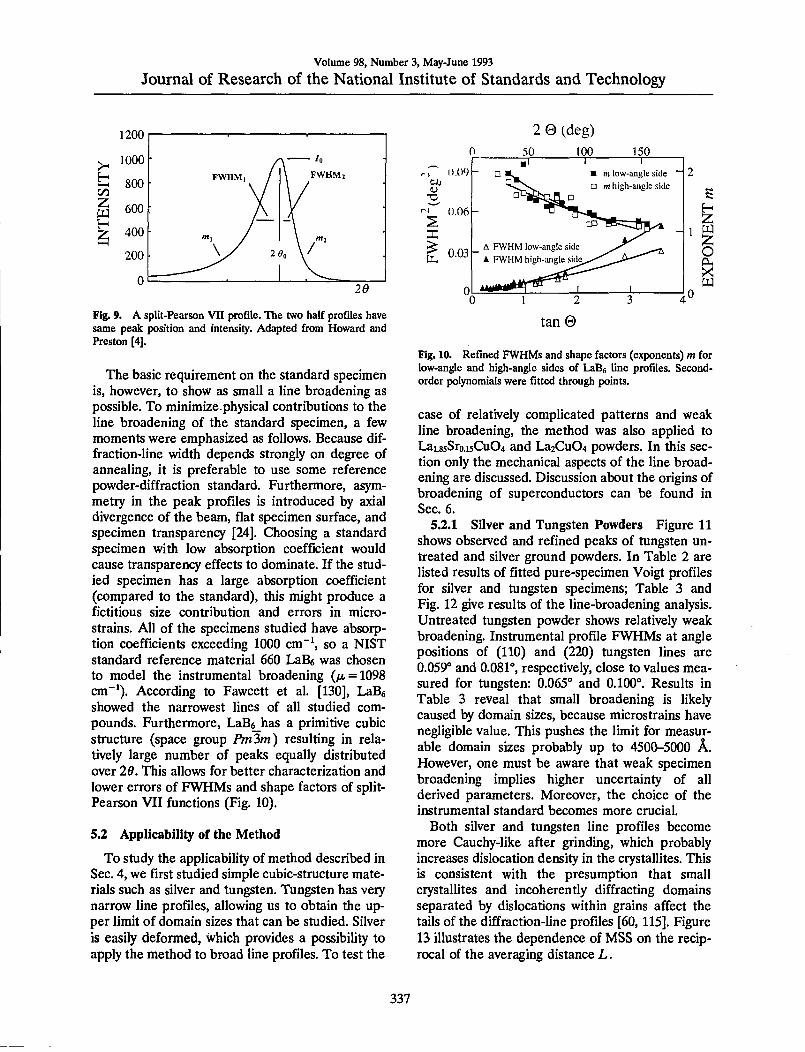
Volume 98 Number 3 May-June 1993
Journal of Research of the National Institute of Standards and Technology
2 0(deg)
le
Fig 9 A split-Pearson VII profile The two half profiles have same peak position and intensity Adapted from Howard and Preston [4]
The basic requirement on the standard specimen is however to show as small a line broadening as possible To minimize physical contributions to the Une broadening of the standard specimen a few moments were emphasized as follows Because dif- fraction-line width depends strongly on degree of annealing it is preferable to use some reference powder-diffraction standard Furthermore asym- metry in the peak profiles is introduced by axial divergence of the beam flat specimen surface and specimen transparency [24] Choosing a standard specimen with low absorption coefficient would cause transparency effects to dominate If the stud- ied specimen has a large absorption coefficient (compared to the standard) this might produce a fictitious size contribution and errors in micro- strains All of the specimens studied have absorp- tion coefficients exceeding 1000 cm^ so a NIST standard reference material 660 LaBe was chosen to model the instrumental broadening (p = 1098 cm) According to Fawcett et al [130] LaBe showed the narrowest lines of all studied com- pounds Furthermore LaB6_has a primitive cubic structure (space group Pm3m) resulting in rela- tively large number of peaks equally distributed over 26 This allows for better characterization and lower errors of FWHMs and shape factors of split- Pearson VII functions (Fig 10)
52 Applicability of the Method
To study the applicability of method described in Sec 4 we first studied simple cubic-structure mate- rials such as silver and tungsten Tungsten has very narrow line profiles allowing us to obtain the up- per limit of domain sizes that can be studied Silver is easily deformed which provides a possibility to apply the method to broad line profiles To test the
009
-a
OH
006
003
1 1 m low-angle side n m high-angle side
bullz w 2 o OH
X
tancopy
Fig 10 Refined FWHMs and shape factors (exponents) m for low-angle and high-angle sides of LaBe line profiles Second- order polynomials were fitted through points
case of relatively complicated patterns and weak line broadening the method was also applied to Lai85Sroi5Cu04 and La2Cu04 powders In this sec- tion only the mechanical aspects of the line broad- ening are discussed Discussion about the origins of broadening of superconductors can be found in Sec 6
521 Silver and Tungsten Powders Figure 11 shows observed and refined peaks of tungsten un- treated and silver ground powders In Table 2 are listed results of fitted pure-specimen Voigt profiles for silver and tungsten specimens Table 3 and Fig 12 give results of the line-broadening analysis Untreated tungsten powder shows relatively weak broadening Instrumental profile FWHMs at angle positions of (110) and (220) tungsten lines are 0059deg and 0081deg respectively close to values mea- sured for tungsten 0065deg and 0100deg Results in Table 3 reveal that small broadening is likely caused by domain sizes because microstrains have negligible value This pushes the limit for measur- able domain sizes probably up to 4500-5000 A However one must be aware that weak specimen broadening implies higher uncertainty of all derived parameters Moreover the choice of the instrumental standard becomes more crucial
Both silver and tungsten line profiles become more Cauchy-like after grinding which probably increases dislocation density in the crystallites This is consistent with the presumption that small crystallites and incoherently diffracting domains separated by dislocations within grains affect the tails of the diffraction-line profiles [60115] Figure 13 illustrates the dependence of MSS on the recip- rocal of the averaging distance L
337
Volume 98 Number 3 May-June 1993
Journal of Research of the National Institute of Standards and Technology
C8
z
7- ^95
29 (deg) 405
bullJf^r-
z S 08
Ez U o u OS
a
04 bull
o Es
4P
2000 z^fA
4000
B
z u f- z
425 435 445 29 (deg)
455
yr 600 SOO
L(A)
Fig 11 Observed points (pluses) refined pattern (full line) and difference pattern (below) (110) W untreated (upper) (200) Ag ground (lower)
Fig 12 Fourier coefficients for the first- (pluses) and second- order (crosses) reflection and size coefficients (circles) [111] Ag untreated (upper) [100] Ag ground (lower)
Table 2 Parameters of the pure-specimen Voigt function as obtained from profile-fitting procedure for tungsten and silver powders
Specimen hkl 2ft(deg) 3c(deg) 3G(deg) FWHM(deg) Rwp()
W untreated 110 220
4028 8705
00065(7) 00301(6)
0020(2) ltio-
0021 0019
90 44
W ground 110 220
4029 8705
0100(2) 0222(3)
0038(4) 0069(6)
0080 0166
90 42
Ag untreated 111 222 200 400
3806 8151 4425 9786
0056(1) 0105(4) 0118(2) 0274(21)
ltio- 00008(21)
ltio-^ ltio-5
0036 0067 0075 0175
105 97
105 122
Ag ground 111 222 200 400
3807 8151 4424 9783
0175(3) 0410(26) 0365(10) 1079(82)
0038(12) ltio-
0076(29) ltio-
0121 0261 0250 0687
99 145 99
145
338
Volume 98 Number 3 May-June 1993
Journal of Research of the National Institute of Standards and Technology
Table 3 Microstructural parameters for tungsten and silver powders
Specimen Direction (poundgt)raquo( A) (2))v(A) ltpound^(fl3))laquo (^laquoD)v2)gtw
W untreated [110] 3200(200) 3500(200) 000038 000008(2)
W ground [110] 620(20) 1030(30) 00023 000054(2)
Ag untreated [111] [100]
1000(20) 510(20)
2000(20) 1030(20)
00010 00022
000024(1) 000047(5)
Ag ground [111] [100]
380(20) 210(10)
650(20) 350(20)
00047 00100
000095(7) 000180(14)
100 -_ - [100) Ag ground ^ ^~ mdash C1111 Ag ground ^bull
y y
o y ^ 50 A y
y y
y
0
y - y ^--
c ) 50 100 150
lLfAjxlO^
Fig 13 Mean-square strains (E^) as a function of VL
Errors in integral breadths allow estimation of errors in strain and size parameters (Sec 45) but in some cases the refinement algorithm gives unre- liable errors of integral breadths When a particu- lar parameter is close to the limiting value (for instance 10^ degrees has been put as the mini- mum value for integral breadths) errors become large However in Eqs (63) (65) (66) (67) and (68) only the product of integral breadth and ac- companying error is significant which is roughly equal for Cauchy and Gauss parts Errors of do- main sizes and strains are of the same order of magnitude as errors of integral breadths
The possible source of systematic error is poten- tial inadequacy of Voigt function to accurately de- scribe specimen broadening This effect can not be evaluated analytically but it would affect all derived parameters especially the column-length distribution functions The logical relationship be- tween values of domain sizes (see Table 3) for dif- ferent degrees of broadening indicates that possible systematic errors can not be large
Equation (41) allows computation of volume- weighted and surface-weighted average domain sizes if respective column-length distribution func- tions can be obtained Figure 14 gives surface- weighted and volume-weighted average column- length distribution functions following Eqs (39) and (38) Width of the distribution function deter- mines the relative difference between (D) and (pound))v The broader the distribution the larger the differences because small crystallites contribute more to the surface-weighted average That is much more evident comparing the surface- weighted column-length distribution with the vol- ume-weighted If they have similar shape and maximum position as in Fig 15 differences are small Conversely if the surface-weighted distribu- tion function has a sharp maximum toward smaller sizes differences are larger (see Fig 14) The dif- ference between (poundgt)s and (D)v and the actual mean dimension of the crystallites in a particular direction also depends strongly on the average shape of the crystallites [52 131 132]
If experimental profiles are deconvoluted by the Stokes method even for considerable specimen broadening size coefficients A ^ usually oscillate at larger L values [59 106] preventing computation of the column-length distribution function Few techniques were used to deal with this problem successive convolution unfolding method [32 133] smoothing and iterative methods [134 135 136 137] Figures 14 and 15 show very smooth column- length distribution functions However they follow from size coefficients ^4^ that depend on the accu- racy of the approximation for the distortion coeffi- cient given by Eq (47) Equation (47) is exact if the strain distribution is Gaussian but in general holds only for small harmonic numbers n if strain broadening is not negligible
339
Volume 98 Number 3 May-June 1993
Journal of Research of the National Institute of Standards and Technology
500 1000 L(A)
Fig 14 Surface-weighted and volume-weighted column-length distribution functions normalized on unit area [111] Ag un- treated (upper) [100] Ag ground (lower)
Fig 15 Surface-weighted and volume-weighted column-length distribution functions for [010] La2Cu04 normalized on unit area
522 La2-xSrtCu04 Powders To test the applicability of the discussed method to more com- plicated patterns two compounds with lower crystallographic symmetry were studied Lai85Sroi5Cii04 has a tetragonal K2NiF4-type struc- ture space group lAlmmm La2Cu04 is orthorhom-
bic at room temperature Both compounds show slight line broadening and relatively highly overlap- ping peaks (see Fig 16) which makes it very diffi- cult if not impossible to perform a Stokes analysis
25
-25
26 (deg)
yNraquo-
Fig 16 Observed points (pluses) refined pattern (full line) convoluted profiles (dashed line) and difference plot (below) for part of La2Cu04 pattern
Tables 4 and 5 list results from the fitting proce- dure and the analysis of specimen-broadened inte- gral breadths There are no qualitative differences in results for tungsten and silver powders How- ever average errors are higher as expected be- cause of overlapping peaks while weighted errors wp are surprisingly smaller This fact illustrates the unreliability of iwp when only a segment of the pat- tern is being refined because it depends on the number of counts accumulated in points as well as on the 28 range of the refinement
Figures 17 and 18 represent Fourier coefficients of Lai85Sroi5Cu04 [110] and La2Cu04 [010] direc- tions In the second plot the A (L )-versus-L plot shows a concave-downward part near L =0 the so- called hook effect It was shown in Sec 42 that the hook effect originates because of underesti- mation of background connected with the trunca- tion of profiles In the profile refinement all peaks separated less than 4deg 20 have been included in the refinement region to avoid possible overlapping of peak tails and specimen profiles have been trun- cated below 01 of the maximum intensity How- ever because the polynomial background was determined prior to profile refinement it may be overestimated for complicated patterns containing many overlapping peaks If background is refined with other profile parameters undesirable correla- tion with integral breadths occurs
340
Volume 98 Number 3 May-June 1993
Journal of Research of the National Institute of Standards and Technology
Table 4 Parameters of the pure-specimen Voigt function as obtained from profile-fitting procedure for La2-^SrCu04 powders
Specimen hid 2Hdeg) Pen PcO FWHM(deg) Rp()
Lai85Sroi5Cu04 004 2695 0046(4) 0024(8) 0042 34 006 4092 0083(5) ltio-= 0053 62 110 3352 0110(5) ltio- 0070 125 220 7046 0171(9) ltio- 0109 43
La2Cu04 004 2713 0061(8) 0045(9) 0067 39 006 4119 0124(7) ltio-^ 0079 77 020 3316 0074(10) 0078(10) 0102 29 040 6957 0210(30) 0026(81) 0135 29 200 3345 0074(8) 0061(10) 0087 69 400 7028 0130(10) 0023(95) 0089 29
Table 5 Microstructural parameters for Laij(5Srai3Cu04 and La2Cu04 powders
Specimen Direction (DUA) Pgt(A) lte^(fl3))laquo lte2((Z)gt2))laquo
Lai83Sro5Cu04
La2Cu04
[001] [110]
[001] [010] [100]
1700(300) 470(20)
1100(100) 680(50) 680(50)
2000(200) 940(20)
1200(100) 760(50) 810(50)
00024 00017
00038 00033 00016
000049(9) 000044(6)
00008(1) 00007(2) 00003(3)
c i ^- raquo sect 08 bulli - U
^0
ti- bull ll bull bullbullo
ffl M P bull- u ^ Di 04 Si - M bulldiamsbullbull a bull-v 3 o ^^=s^
u ^N^Sraquoraquo^
0 ^^^aaaa 1000
L(A) 2000
OQ bullbulldego UM o z a 08
o o bull bull bull
- u u bull raquo UU bull
a diams o bull o u ft 04 bull deg raquo deg - U bull bull deg Oi bullbullgt =3 bull- l o k u
0 bullbullbullraquo aaaMMi
500 1000
L(A)
Fig 17 Fourier coefficients for the first- (pluses) and second- order (crosses) reflection and size coefficients (circles) for [110] Lai^Sroi5Cu04
Fig 18 Fourier coefficients for first- (pluses) and second- order (crosses) reflection and size coefficients (circles) for [010] La2Cu04
341
Volume 98 Number 3 May-June 1993
Journal of Research of the National Institute of Standards and Technology
S3 Comparison with the Integral-Breadth Methods
Knowing the specimen integral breadths simpli- fied methods can be applied In Sec 212 we re- viewed multiple-line and single-line integral- breadth methods We shall compare the simplified multiple-line methods [Eqs (23) (24) and (30)] and the single-line method [76] [Eqs (29) and (30)] with results obtained for silver tungsten and La2-xSrxCu04 powders (Tables 3 and 5) We did not compare with the multiple-line Voigt-function method [26] because it was shown in Sec 44 that it is incompatible with the Warren-Averbach analy- sis In Table 6 integral breadth Pi was computed according to Eq (11) This value was compared with )8A integral breadth computed from Fourier coefficients [58]
i8A=- laquo3 2^(L)
(74)
Results obtained by the Warren-Averbach analysis are significantly smaller for both size and strain Integral-breadth methods give the upper limit for strain so comparison is limited Considering the approximation e = 125e^(L))^ [138] with L=(D)v2 or L=(D)s2 strains resemble more closely than crystallite sizes It must be noted how- ever that this approximation makes sense only in the case of pure-Gauss strain broadening Benedetti et al [106] reported excellent agreement for both size and strain using Warren-Averbach and Cauchy-Gauss [Eq (24)] methods Results from Table 6 on the contrary indicate that the Gauss-Gauss approximation gives values closest to the Warren-Averbach method for crystallite sizes whereas the Cauchy-Gauss and especially the Cauchy-Cauchy approximation tend to give too large values For strain the trend is opposite The Cauchy-Cauchy approximation resembles most
Table 6 Comparison of results obtained with the integral-breadth methods Cauchy-Cauchy (C-C) Cauchy-Gauss (C-G) Gauss- Gauss (G-G) and single-line (S-L) analysis
Specimen hkl PiXKP PAXKP ltigt)v (Z)gt(A) (e^((DV2)gt2 eXlO^ (A-) (A-0 (A) C-C C-G G-G S-L xlO^ C-C C-G G-G S-L
W untreated 110 220
0259 0247
0259 0247
3500 3700 3810 3810 14500 4040
008 -001 -003 -005 024 0
W ground 110 220
125 204
125 205
1030 2240 1450 1220 940 550
054 090 093 105 045 032
Ag untreated 111 2
0600 0901
0600 0900
2000 3340 2390 2190 1670 1110
024 035 039 095 0 0
200 124 124 1030 2270 1470 1230 810 047 082 085 095 0 400 204 204 490 0
Ag ground 111 222
198 352
200 352
650 2080 1240 910 530 280
095 179 182 197 048 0
200 403 406 350 9380 4780 1320 260 180 405 405 408 082 400 803 803 120 0
Lai85Sroi3Cu04 004 006
0657 0881
0650 0880
2000 5230 3290 2660 1970 1140
049 076 078 088 044 0
110 119 119 940 1240 1000 970 840 044 052 064 080 0 220 158 158 630 0
La2Cu4 004 006
0988 132
0998 131
1200 2980 1940 1630 1490 760
08 107 112 127 081 0-
020 143 142 760 1200 910 860 1240 07 079 090 110 114 040 198 200 510 016 200 126 124 810 810 810 810 1250 03 002 011 015 089 400 1S 126 830 014
Not possible to evaluate because of too small Gauss integral breadth
342
Volume 98 Number 3 May-June 1993
Journal of Research of the National Institute of Standards and Technology
closely a Warren-Averbach method These results concur with the Klug and Alexander [24] compari- son of the published size and strain values obtained by Warren-Averbach (Stokes) and integral-breadth methods However for x-ray diffraction the Cauchy-Gauss assumption for the size-strain broadening is theoretically and experimentally more favored thpoundm the other two models The fact that the Gauss-Gauss method for crystallite size and the Cauchy-Cauchy method for strain give more realistic results may mean that the presump- tion that size and strain broadening are exclusively of one type is an oversimplification
The single-line method seems much less reliable If Gaussian breadth is very small no information about strain is obtained Moreover second-order reflections give much lower values of both size and strain than do basic reflections However if multi- ple reflections are not available the single-line method can give satisfactory estimations
54 Reliability of Profile Fitting
The profile fitting of a cluster of even severely overlapping peaks can be accomplished with a low error and excellent fit of total intensity But how reliable is information obtained about separate peaks in the cluster In the fitting procedure it is possible to put constraints on the particular profile parameter to limit intensity position and width of the peak If anisotropic broadening or different phases are present constraints may not be realistic Morever acceptable results can be obtained even using a different number of profiles in refinement [4] Hence the first condition for the successful ap- plication of this method is knowledge of actual phases present in the sample and their crystalline structures
In this regard two powders were measured or- thorhombic Lai94Sroo6Cu04 has a slightly distorted K2NiF4-type structure (space group Bmab a =53510(2) A b =53692 A(2) c = 131931(7) A) and tetragonal Lai76Sro24Cu04 (space group I4mmm a =37711(3) A c = 132580(8) A) Data were collected for each specimen separately and for a specimen obtained by mixing the same pow- ders Because diffracted intensity of each phase was lower for the mixture counting time was pro- portionally increased to obtain roughly the same counting statistics Figure 19 shows two partially separated orthorhombic (020) (200) and (040) (400) peaks overlapped with tetragonal (110) and (220) reflections During the profile fitting of the mixed powders (200) orthorhombic peak tended to disappear on account of neighboring (020) and
(110) reflections Its intensity was constrained to vary in range plusmn 30 of (020) peak intensity which can be justified if the crystallographic structure is known
60
-60
345
345
335 29 (deg)
345
Fig 19 (upper) Lai76Sro24Cu04 (110) peak (middle) Lai94Sroo6Cu04 (020) and (200) peaks (lower) (110) (020) and (200) peaks
Table 7 contains results of fitted specimen-Voigt functions as well as size and strain values obtained by the analysis of broadening Comparing integral breadths of the starting and mixed powders some profiles change from more Cauchy-like to Gauss- like and vice versa This is especially evident for the (400) reflection meaning that accurate deter- mination of the profile tails is indeed affected in the cluster of overlapping peaks However integral breadth does not change significantly so results of
343
Volume 98 Number 3 May-June 1993
Journal of Research of the National Institute of Standards and Technology
Table 7 Comparison between two specimens run separately and mixed togetlier
Specimen hkl 2Hdeg) )3cO PoO DUA) (D)v(A) (e2laquoD)v2))laquoxlO
Lai76Sroj4CuOr 110 3369 0058(6) 0094(7) 780(60) 850(60) 10(1) 220 7073 022(2) 013(2)
LaiMSro(KiCu04 020 3342 0084(9) 055(14) 500(90) 1000(200) 07(1) 040 7012 010(2) 014(1) 200 3353 00216(85) 0061(8) 1100(100) 1200(100) 03(1) 400 7040 0026(11) 0088(8)
Mix 110 3367 0083(21) 0064(14) 800(300) 1200(300) 08(3) Lai76Sro24Cu04 220 7072 019(7) 013(4)
+ 020 3343 0066(35) 0070(23) 800(300) 1000(300) 07(4) Lai94Sroo6Cu04 040 7012 0116(93) 013(5)
200 3354 0024(156) 0071(61) 900(700) 1000(600) 04(12) 400 7041 011(2) 0003(320)
the multiple-line methods are not much influenced On the contrary the single-line method gives quite different results This may support the conclusion of Suortti Ahtee and Unonius [43] that the Voigt function fails to account properly for size and strain broadening simultaneously if only Cauchy integral breadth determines crystallite size
Table 7 shows that the results of Warren- Averbach analysis of starting and mixed powders agree in the range of standard deviations How- ever errors are much larger especially for the hid- den (200)-(400) reflections From Eq (62) it follows that more counts (longer counting times) and more observables (smaller step-size) would lower standard deviations Therefore in the case of highly overlapping patterns to obtain desirable ac- curacy much longer measurements are needed al- though that will not change the fact that higher overlapping implies intrinsically higher errors of all refinable parameters To further minimize possible artifacts of the fitting procedure it is desirable to include in the analysis as many reflections in the same ciystallographic direction as possible
55 Remarks
By modeling the specimen size and strain broad- ening with the simple Voigt function it is possible to obtain domain sizes and strains that agree with experiment and show a logical interrelationship Furthermore the Voigt function shows the correct 1A(26y asymptotic behavior of peak tails as ex- pected from kinematical theory [139] However if the specimen profile is significantly asymmetric (because of twins and extrinsic stacking faults [140 59]) or the ratio FWHM^ is not intermediate to the Cauchy (2Tr) and Gauss (2(ln27r)^) functions then the Voigt function can not be applied [25]
Suortti Ahtee and Unonius [43] found good over- all agreement by fitting the Voigt function to the pure-specimen profiles of a Ni powder deconvo- luted by the instrumental function However more accurate comparison is limited because of unavoid- able deconvolution ripples of specimen profiles Furthermore the Voigt function might not be flex- ible enough to model a wide range of specimen broadening as well as the different causes of broadening Therefore the question whether the Voigt function can satisfactorily describe complex specimen broadening over the whole 20 range in a general case needs further evaluation
This method of Fourier analysis with the as- sumed profile-shape function is most useful in cases when the classical Stokes analysis fails there- fore when peak overlapping occurs and specimen broadening is comparable to instrumental broaden- ing It was shown that for a high degree of peak overlapping the fitting procedure can give unreli- able results of Gauss and Cauchy integral breadths that is the peak can change easily from predomi- nantly Cauchy-like to Gauss-like and contrary This can lead to illogical values of size-integral and strain-integral breadths according to Eqs (52) (53) (54) and (55) and to irregularities in the be- havior of Fourier coefficients for large L Simulta- neously if the size-broadened profile has a large Gauss-function contribution the hook effect will occur However volume-weighted domain sizes D)y and MSS eL)) for small L are much less affected because they rely on both Cauchy and Gauss parts of the broadened profile Any integral- breadth method that attempts to describe the size and strain broadening exclusively by a Cauchy or Gauss function in this case fails completely For specimens with lower crystallographic symmetry
344
Volume 98 Number 3 May-June 1993
Journal of Research of the National Institute of Standards and Technology
when many multiple-order reflections are avail- able but the peaks are overlapped it is therefore desirable to include in the analysis as many reflec- tions as possible to minimize the potential artifacts of the fltting process
6 Analysis of Superconductors 61 (La-M)2Cu04 Superconductors
Bednorz and Miiller [16] found the first high- temperature oxide superconductor in the La-Ba- Cu-O system Soon after substituting Ba with Sr and Ca Kishio et al [17] found superconductivity in two similar compounds Later many compounds with much higher transition temperatures (Tc) were found The (La-M)2Cu04 system remains favorable for study because the cation content responsible for the superconductivity is easier to control and measure than the oxygen stoichiometry Also this system provides a wide range of substitutional cation solubility in which the tetragonal K2NiF4- type structure is maintained Compared with much- studied Y-Ba-Cu-O this structure is simpler because it contains only one copper-ion site and two oxygen-ion sites
The undoped compound La2Cu04 is orthorhom- bic at room temperature It becomes superconduct- ing either with cation substitution on La sites or increased oxygen content to more than four atoms per formula unit Doping with divalent cations in- creases the itinerant hole carriers in the oxygen- derived electron band [141] which probably causes the superconductivity However different dopants influence the transition temperature Tc Although the unit-cell c-parameter simply reflects ionic dopant size [142] the in-plane unit-cell parameter (and accordingly the Cu-0 bond length) correlates with Tc for different dopants and for different dop- ing amounts [142 143]
LaiB5MouCu04 (M = Ba Ca Sr) have a tetrago- nal K2NiF4-type structure space group lAlmmm with four atoms in the asymmetric unit [117] One site is occupied with La partially substituted with dopant ions (Fig 20) La2Cu04 is orthorhombic at room temperature The best way to correlate these two structures is to describe La2Cu04 in space group Bmab the c axis remains the same tetrago- nal [110] and [110] directions become [010] and [100] orthorhombic axes and size of the unit cell is doubled [144]
Figure 21 shows parts of the x-ray diffraction patterns observed and refined of Lai85Moi5Cu04 (M = Sr Ba Ca) and La2Cu04 Refined lattice
parameters are given in Table 8 Table 9 shows resuhs of the line-broadening analysis Relatively
La(BaCaSr)
0(2)
0(1)
Fig 20 Ciystal structure of (La-M)2Cu04 showing one unit cell
300 JUU
(b)
200
100
U 0 M J Js-r-^
30
-30
300
40 41 42 43 44 45 40 41 42 43 44 45 29 (deg) 29 (deg)
mdashA-
gt t 200
Z
F-
- 100
(c)
f V kgt ii I 40 41 42 43 44 45 40 41 42 43 44 45
e (deg) ^^ 26 (deg)
-30 wwX mdash Wlaquo-
Fig 21 Diffraction patterns of LaiH5Moi5Cu04 specimens (a) M=Sr (b) M = Ba (c)M = Ca (d) M = U
345
Volume 98 Number 3 May-June 1993
Journal of Research of the National Institute of Standards and Technology
Table 8 Lattice parameters and T^ at zero resistivity (Ac method at 10 Ma current)
Specimen a (A) bk) c(A) rc(K)
Lairaquo5Sroi5Cu04 377814(7)
Lairaquo3Baoi3Cu04 37846(2)
LaiiijCaoi5Cu04 37863(7)
La2Cu04 53558(2) 54053(2)
231(2) 36
288(4) 28
17(2) 19
1451(8)
Table 9 Results of line-broadening analysis for (La-M)2Cu4 specimens
Specimen hkl PcO PoO (DUk) (Iraquo)(A) lte^((D)2))
Lai(laquoSroj5Cu04 004 006
0046(4) 0083(5)
0024(8) ltio-
1700(300) 2000(200) 000049(9)
110 0110(5) ltio- 470(20) 940(20) 000044(6) 220 0171(9) ltio-
Lai85Baoi3Cu04 004 006
0049(6) 0110(7)
0076(6) 0089(9)
1100(200) 1100(100) 00011(2)
110 0087(4) 000042(6) 560(20) 1110(20) 000024(5) 220 0116(3) ltio-5
Laiji5Caoi5Cu04 004 006
0120(13) 0146(12)
0032(22) 0033(27)
440(70) 780(90) 00007(4)
110 0045(25) 0200(19) 340(30) 360(20) 00013(2) 220 0343(22) ltio-
La2Cu04 004 006
0061(8) 0124(7)
0045(9) ltio-
1100(100) 1200(100) 00008(1)
020 0074(10) 0078(10) 680(50) 760(50) 00007(2) 040 0210(30) 0026(81) 200 0074(8) 0061(10) 680(50) 810(50) 00003(3) 400 0130(10) 0023(95)
weak peak broadening was observed which can not be attributed to the proximity of the phase trans- formation Lai85SroisCu04 is tetragonal down to = 170 K [145] Lai85Baoi5Cu04 to 140 K [146147] and Lai85Caoi5Cu04 to 130 K [148] Another possi- ble reason for peak broadening might be continu- ous compositional variations in dopant content The scanning Auger microprobe analysis of La2-SrtCu04 compounds [149] showed that grain- boundary segregation of Sr is weak and limited to a narrow region near the grain surface In the case of the separation of two phases with different Sr con- tent and similar lattice parameters asymmetry of some reflections would be observed [150] More- over in the case of compositional inhomogeneity microstrains eL)) would be roughly independent of the averaging distance L in the grains [151] therefore distribution of strains would be Gaus- sian For all specimens microstrain behavior is identical it decreases linearly with distance L
Rothman and Cohen [115] showed that such be- havior of microstrains is caused by dislocations that might arise during grinding Assuming the same applied stress microstrain would be approximately inversely proportional to the elastic moduli of these materials If mean microstrain is defined as the arithmetic average of strains for the [001] and [110] directions results agree with values of the Youngs moduli for polycrystalline La2Cu04 Lai85Moi5Cu04 (M = Sr Ba Ca) [152] However other factors may contribute to the microstrain Coordination-6 ionic radii of La^+ Sr Ba^+ Ca^+ are 106 116 136 100 A respectively [153] Substitution of La with ions of different sizes affects the lattice parameter [142] and may cause much larger strains in the [001] direction when some of the ions are replaced with Ba^ than with Sr^ in accord with results in Table 9 Substitution of Ca^^ ions produces an entirely different effect microstrains in the [110] direction are larger This may be explained by
346
Volume 98 Number 3 May-June 1993
Journal of Research of the National Institute of Standards and Technology
comparing effects of substitutional ions on the unit-cell a -parameter The Ba-doped specimen has a larger a-parameter than the Sr-doped but the Ca-doped a-parameter is largest although Ca^^ has the smallest ionic size This should increase the cell distortion in the a-b plane
Table 9 reveals high anisotropy in these materi- als consistent with other physical properties such as thermal expansion [154] and upper critical mag- netic field [155] Differences of domain sizes might arise from a layered structure in the [001] direction and consequently easy incorporation of stacking faults between regularly stacked layers The stack- ing-fault and twin-fault probabilities can be esti- mated from the average surface-weighted domain sizes [59]
^ = TAN + cf1fun(aa) (75) m im - (D)
Here c is a constant for the particular [hkl] direction and fun(a a) a linear combination of stacking-fault probability and twin-fault probability a The exact form of Eq (75) was derived only for the cubic and hexagonal crystal structures On con- dition that the true domain dimension D is isotropic or so large that the second term of Eq (75) dominates a linear function of stacking-fault and twin-fault probability is
fun(aa) = c( 1
) (76) Zgt)J (Dgttrade
Here c denotes a constant that depends only on geometrical factors and is the same for all three doped compounds
Figure 22 shows a possible correlation between Tc and fault-defect probabilities computed from TEM observations of La2-jcSrCu04 revealed that stacking-fault density increased with Sr content up to jc = 015 [156] That study suggests that a shear mechanism forming the fault-boundary dislocations implies oxygen vacancies andor cation deficiency We did not measure oxygen content but neutron- diffraction studies showed that oxygen deficiency starts to appear at much higher Sr content [157] However the increase of fault probability with the simultaneous decrease of microstrain in Fig 22 supports the assumption that defects are intro- duced to accommodate lattice strains [156] A simi- lar increase in Te was found in Y2Ba4Cu802o-laquo thin films [158] Compounds with asymmetric broad- ened and shifted peaks showed higher Tc which
was attributed to stacking faults Although extrinsic stacking faults may cause asymmetric peak broad- ening [140] it is probably caused by twinning Twinning in La-M-Cu-0 materials is less abundant than in Y-Ba-Cu-O compounds but it was ob- served in (La-Sr)2Cu04 monocrystals on (110) planes [159] In the profile-fitting procedure peak asymmetry is incorporated only in the instrumental function therefore we could not model asymmetric peak broadening However any significant asym- metry of the specimen profile would cause an un- even fit of low-angle and high-angle sides of peaks which was not observed This gives much more im- portance to stacking faults in Eq (76)
Fig 22 Arithmetic average of [110] and [001] root-mean- square strains and linear function of stacking-fault and twin- fault probabilities as a function of Tc
In Fig 22 average microstrains defined as the arithmetic average of [001] and [110] directions correlate inversely with Tc However we did not find a correlation of Tc and microstrains in a partic- ular direction [001] microstrains simply reflect dif- ference in size of dopant and host La^ ions (see Table 9)
In La2Cu04 (OkO) reflections are significantly broader than (hOO) This has also been observed in low-temperature orthorhombic Lai85Sroi5Cu04 and Lai85Baoi5Cu04 [160] and explained by either stacking faults or possible lower symmetry Our results reveal that domain sizes (D) have identical values for [010] and [100] directions (Table 9) From Eq (76) it follows that stacking-fault proba- bilities in these directions have the same values However microstrains in the [010] direction are roughly twice as large as in the [100] direction which is responsible for the different broadening In the case of doped La2Cu04 compounds different microstrains might be caused by oxygen
347
Volume 98 Number 3 May-June 1993
Journal of Research of the National Institute of Standards and Technology
vacancies ordered along one direction in the a-b plane similar to effects found in YBa2Cu307-laquo However undoped La2Cu04 is not expected to have significant o^Qgen deficiency Other possibili- ties are lower ciystallographic symmetry andor La vacancies although they were not reported for this system but La deficiency was found in an La2Co04 compound [161]
We can conclude that lattice strains and incoher- ently diffracting domain sizes confirm high an- isotropy in these materials This simple approach however does not allow unambiguous identifica- tion of the strains origin Probably the strains originate from dislocations and from different sizes of host and dopant ions Domain sizes of all com- pounds are larger in the c-direction than in the a-6 plane This indicates existence of stacking faults and twins However because estimated errors are relatively large and only three materials were stud- ied the possible connection between stacking faults and 7c needs further study
62 Bi-Cu-O Superconductors
Among the high-Tc superconductors the Bi- Cu-O compounds appear intriguing especially because their incommensurate structure modula- tion remains incompletely understood [162 163] The crystal structure consists of perovskite-like SrO-(Cu02Ca)mi-Cu02-SrO layers separated by NaCl-like BiO double layers (see Fig 23 [164]) The number m of Cu02 layers alters the supercon- ducting transition temperature Tc (for m = 12 and 3 rclaquo10 90 and 110 K respectively) This two- dimensional layered structure makes these materi- als highly anisotropic and favours the creation of defects
Bulk sintered specimens showed relatively weak peak broadening Moreover the diffraction pat- terns contained many overlapping peaks because the compound crystallizes in an orthorhombic low- symmetry space group A2aa [165] and incommen- surate modulation gives superlattice reflections All patterns revealed a strong [001] texture (Fig 24) making reflections other than (001) difficult to ana- lyze The lattice parameters vary depending on the exact compound stoichiometry and processing his- tory but characteristically they have almost identi- cal a and b parameters and large c parameter fl =54095 A 6=54202 A c =309297 A for Bi2Sr2CaCu208 (Bi-2212 [166] and A =5392 A b =5395 A c =36985 A for (BiPb)2Sr2Ca2Cu30io (BiPb-2223) [165] Thus we treated (hOO) and (0^0) reflections as single peaks Table 10 gives the
results for three specimens Bi-2212 (BiPb)2 (SrMg)2(BaCa)2Cu30io (BiPbMgBa-2223) which were one-phase specimens and BiPb-2223 con- taining approximately equal amounts of 2212 and 2223 phases The in-plane lattice parameters of 2212 and 2223 phases differ little hence only the [00] directions of the mixed-phase specimen were evaluated
b^ (c)
Fig 23 Average crystal structure of Bi2Sr2Cam-iCum04+2m for (a) m = 1 (b) w =2 (c) m =3 [164]
35
-35
42 44 46 48 50 52 54 56 58 60 62 26 (deg)
^ ^^^MK^Aa^Ndllaquop
Fig 24 Part of BiPbMgBa-2223 refined pattern There are 48 fundamental reflections in this region
Interpretation of the results in the case of these complicated compounds must be considered care- fully Microstrains are probably caused by disloca- tion arrays However substitution of different-sized ions and vacancies would also contribute to the strains as would other kinds of disorder especially
348
Volume 98 Number 3 May-June 1993
Journal of Research of the National Institute of Standards and Technology
Table 10 Results of line-btoadening analysis for Bi-Cu-O supreconductors
Specimen Phase hkl (A)
eD)sa)y^
Bi-2212 2212 008 0012
0163(8) 022(3)
001(6) 005(6)
420(80) 00021(6)
020+200 0104(4) ltio-^ 580(30) 00007(1) 040+400 018(2) 00004(6300)
BiPbMgBa-2223 7773 0010 0020
0097(1) 021(2)
00002(1700) 0007(150)
770(60) 00012(1)
020 + 200 012(27) 013(10) 380(430) 00009(71) 040 + 400 015(95) 021(33)
BiPb-73 2212 008 0012
023(2) 025(5)
0002(350) 0001(1000)
220(30) 00013(26)
2223 0010 0020
022(8) 023(99)
0092(67) 018(47)
230(190) 00012(197)
Stacking faults and twins Table 10 shows larger strains in the [001] direction that in the basal plane This can be explained by stacking disorder along the c-axis which was frequently observed in electron-diffraction patterns as streaking [167 168] Easy incorporation of stacking faults is possi- ble because of the two-dimensional weak-bonded layers (BiO double layers are spaced about 3 A apart) The difference in microstrain between in- plane and the c-direction is much smaller for the BiPbMgBa-2223 phase probably because Pb low- ers the faulting by stabilizing the higher-Tc 2223 phase [167] For the BiPb-2223 specimen with two phases there are two possibilities Either the speci- men consists mainly of a mk of two kinds of one- phase grains or both phases occur within the same grains The second possibility was confirmed exper- imentally [169 170] and our results concur be- cause microstrain in the 2212 phase is much smaller than in the one-phase Bi-2212 specimen Processing conditions and cation content probably favour development of the macroscopic inter- growth of both phases within the grains that is microscopic defects grow to sufficiently large re- gions to give a diffraction pattern of another phase with the different number of Cu02 layers As a re- sult strain is relieved and both strains and domain sizes being quite different in one-phase specimens tend to equalize
For the Bi-Cu-O specimens the mean surface- weighted domain sizes are generally smaller than for (La-M)2Cu04 compounds Therefore the com- putation of the stacking- and twin-fault probabili- ties by using Eq (75) may be wrong It would be very instructive to compare the different broaden-
ing of satellite and fundamental reflections which indicates a more pronounced stacking disorder in the modulated structure [171]
In summary we found that for both Bi-2212 and BiPbMgBa-2223 superconductors the c-axis strain exceeds the in-plane strain The BiPb-2223 specimen containing both 2212 and 2223 phases within the single grains shows smaller incoherently diffracting domains and lower c-axis strain than the one-phase specimens This fact may direct us to- ward the mechanism of the second-phase forma- tion in these materials
63 Remarks
It was shown that this particular method of the line-broadening analysis can give information about the size of incoherently diffracting domains and lattice strains in (La-M)2Cu04 and Bi-Clu-O superconductors Moreover results show high an- isotropy of both size and strain parameters as one may expect because of the layered structure of all superconducting cuprates Generally structural line broadening is not large that is a result of rela- tively large domain sizes (200-2000 A) and small strains (002-02) It is interesting to compare these values with the published results for YBa2Cu307-laquo (isotropic strains of 023 [77] and 005-03 [82]) Although the different materi- als were studied they seem too large especially be- cause they are the average of strains in different directions
The main drawback of the line-broadening the- ory is the uncertainty about the origins of the line broadening that is it is difficult to distinguish the main effects responsible for the broadening For
349
Volume 98 Number 3 May-June 1993
Journal of Research of the National Institute of Standards and Technology
the novel superconductors particularly the numer- ous defects (substitutions vacancies stacking faults dislocations and similar) can occur simulta- neously which makes it very difficult to determine their individual contributions Furthermore the crystal structures of most novel superconductors are relatively complicated The average structure has mostly a slightly distorted tetragonal symmetry very similar a and b lattice parameters and a large c parameter but c=36 for YBa2Cu307-laquo for in- stance This results in a large number of overlap- ping peaks and consequently in large errors of all results This showed especially in the case of Bi-Cu-O superconductors (see Table 10) Follow- ing the discussion of reliability of profile fitting in Sec 54 it would be desirable to include more than two reflections in the analysis of broadening but higher-order peaks are usually too weak and over- lapped One way to partially solve this problem would be a whole pattern fitting [172 173] and Rietveld structure refinement [23] in terms of size and strain parameters This requires an accurate preset function to model specimen broadening and precise definition of angular dependence of size and strain parameters The Rietveld programs that model the line broadening in terms of size and strain parameters are based either on the simpli- fied integral-breadth methods [78 95] or on the single-line method [174]
7 Conclusions
A method for analyzing the pure-specimen (structural) broadening of x-ray diffraction line profiles is proposed By modeling the specimen size and strain broadenings with the simple Voigt func- tion it is possible to obtain domain sizes and strains that agree with experiment and show a logi- cal interrelationship Furthermore some common consequences and problems in the Fourier-method analysis follow easily The specimen function is convoluted with the instrumental function to match the observed x-ray diffraction-line profile This avoids the Stokes deconvolution method thus al- lowing analysis of patterns with highly overlapping peaks and weak structural broadening Therefore the method was applied to some novel high-Tc superconductors We reached the following conclu- sions
(i) Surface-weighted domain size depends only on the Cauchy integral breadth of the size-broad- ened profile
(ii) The hook effect occurs when the Cauchy-content of the size-broadened profile is un-
derestimated that is for ^sc(n2)^3sG Usually this happens when the background is estimated too high so the long tails of the Cauchy function are prematurely cut off
(iii) It also follows from conclusion (ii) that the volume-weighted domain size can not be more than twice the surface-weighted domain size (limiting value D)v=2D)i is obtained for the pure-Cauchy size-broadened profile) Minimum value for D)J (D)j should not be less than -131
(iv) If the distortion coefficient is approxi- mated with a harmonic term this leads exactly to the Warren-Averbach method of separation of size and strain broadenings
(v) In that case mean-square strains decrease linearly with the distance L
(vi) It is possible to evaluate local strain ((e^(0))^) only in the case of pure-Gauss strain broadening Then root-mean-square strain is inde- pendent of the distance L and related to the upper limit of strain obtained from the integral breadth of the strain-broadened profile
(vii) If strain broadening is not described exclu- sively with the Gauss function the multiple-line Voigt integral breadth and Warren-Averbach analyses can not give the same results for volume- weighted domain size although D)v is defined identically in both approaches because the appar- ent strain -q = pdeg(29)cot9 is not angular- independent
(viii) Smooth size coefficients give column- length distribution functions without oscillations and make possible a computation of volume- weighted average domain sizes up to ~5000 A
(ix) Comparison with the simplified integral- breadth methods in most cases has shown not large but systematic discrepancy of results indicat- ing that size and strain broadening can not be accu- rately modeled by a single Cauchy or Gauss function Moreover the application of the single- line method is much less reliable and it should not be used where multiple reflections are available
(x) The knowledge of all phases present in the sample and their crystallographic structure is re- quired to successfully fit a cluster of overlapping peaks Although it is very difficult to accurately de- termine the Cauchy-Gauss ratio of an overlapped peak final results of domain size and strain are much less affected Therefore connecting the crys- tallite size exclusively with the Cauchy content and strain with the Gauss content of a specimen profile might be doubtful
(xi) Evaluated errors of domain sizes and strains increase substantially with the degree of
350
Volume 98 Number 3 May-June 1993
Journal of Research of the National Institute of Standards and Technology
peak overlapping Hence for complicated patterns very accurate measurements are necessary and one needs to analyze as many reflections in the same crystallographic direction as possible
(xii) Line-broadening analysis of (La-M)2Cu04 and Bi-Cu-O compounds confirms high anisotropy in these materials
(xiii) Strains in (La-M)2Cu04 probably origi- nate from dislocations and from different sizes of host and dopant ions
(xiv) Stacking-fault probability in (La-M)2Cu04 (M = Ba Ca Sr) increases with increasing Tc whereas the average strain decreases
(xv) In La2Cu04 different broadening of (lOO) and (OfcO) reflections is not caused by stacking faults
(xvi) All Bi-Cu-0 superconductors show larger strain in the c-direction than in the a-b plane which can be explained by stacking disorder along the [001] direction
(xvii) In the specimen with approximately equal amounts of Tl-2212 and TlPb-2223 phases it is likely that a secondary phase develops by the growth of the microscopic faulted regions of the primary phase
Acknowledgments
I am thankful to Dr Harry McHenry for his support and especially to Dr Hassel Ledbetter for his wise guidance and most useful help during my stay at NIST I am also indebted to my home insti- tution the Faculty of Metallurgy of the University of Zagreb for allowing me the leave of absence at NIST
8 References
[1] W Friedrich P Knipping and M v Laue Ann Physik 41 971 (1912)
[2] H M Rietveld Acta Cryst 22 151 (1967) [3] H M Rietveld J Appl Cryst 2 65 (1969) [4] S A Howard and K D Preston in Modern Powder Dif-
fraction Vol 20 The Mineralogical Society of America Washington DC (1989) p 217
[5] D Taupin J Appl Cryst 6 266 (1973) [6] T C Huang and W Parrish Appl Phys Lett 27 123
(1975) [7] M K Wu J R Ashburn C J Torng P H Hor R L
Meng L Gao Z J Hwang Y Q Wang and C W Chu Phys Rev Lett 58 908 (1987)
[8] D Shi MRS Bull 16 37 (1991) [9] D Larbalestier Phys Today 44 74 (1991)
[10] J C Phillips Phys Rev B 4512647 (1992) [11] B Raveau Phys Today 45 53 (1992) [12] A J Millis and K M Rabe Phys Rev B 38 8908 (1988)
[13] F Guinea Europhys Lett 7 549 (1988) [14] C P Dhard and P Singh in Proc Int Symp High-Temp
Supercond Jaipur India Oxford amp IBH Publishing New Delhi (1988) p 271
[15] J D Jorgensen Phys Today 44 34 (1991) [16] J G Bednorz and K A Muller Z Phys B 64 189
(1986) [17] K Kishio K Kitazawa S Kaube I Yasuda N Sugii H
Takagi S Uchida K Fueki and S Tanaka Chem Lett 429 (1987)
[18] J D Jorgensen B Dabrowski S Pei D G Hinks L Soderholm B Morosin J E Venturini and D S Ginley Phys Rev B 38 11337 (1988)
[19] J R Clem Phys Rev B 43 7837 (1991) [20] M Paranthaman M Foldejiki D Balzar H Ledbetter
A J Nelson and A M Hermann submitted to Phys Rev B
[21] A R Stokes Proc Phys Soc Lond 61 382 (1948) [22] B E Warren and B L Averbach J Appl Phys 23 497
(1952) [23] R Delhez Th H de Keijser and E J Mittemeijer in
Accuracy in Powder Diffraction S Block and C R Hub- bard eds Natl Bur Stand (US) Special Publication 567 (1980) p 213
[24] H P Klug and L E Alexander X-ray Diffraction Proce- dures 2nd Edition John Wiley New York (1974) p 661
[25] J I Langford J Appl Ciyst 11 10 (1978) [26] J I Langford in Accuracy in Powder Diffraction S
Block and C R Hubbard eds Natl Bur Stand (US) Special Pubication 567 (1950) p 255
[27] R Delhez Th H de Keijser and E J Mittemeijer Fre- senius Z Anal Chem 312 1 (1982)
[28] A J C Wilson Proc Phys Soc Lond 80 286 (1962) [29] A J C Wilson Proc Phys Soc Lond 81 41 (1963) [30] L P Smith Phys Rev 46 343 (1934) [31] H C Burger and P H van Cittert Z Phys 79 722
(1932) [32] S Ergun J Appl Ciyst 1 19 (1968) [33] R Croche and L Gatineau J Appl Ciyst 10479 (1977) [34] L H Schwarz and J B Cohen Diffraction from Materi-
als Academic Press New York (1977) p 391 [35] R Delhez Th H de Keijser E J Mittemeijer and J I
Langford J Appl Cryst 19 459 (1986) [36] R Delhez Th H de Keijser E J Mittemeijer and J I
Langford Aust J Phys 41 213 (1988) [37] R A Young and D B Wiles J Appl Cryst 15 430
(1982) [38] W Voigt Stizungsber K Bayer Akad Wiss 42 603
(1912) [39] E E Whiting J Quant Spectrosc Radiat Transfer 8
1379 (1968) [40] G K Wertheim M A Butler K W West and D N E
Buchanan Rev Sci Instrum 111369 (1974) [41] M M Hall Jr V G Veeraraghavan H Rubin and P G
Winchell J Appl Cryst 10 66 (1977) [42] A Brown and J W Edmonds Adv X-Ray Anal 23 361
(1980) [43] P Suortti M Ahtee L Unonius J Appl Cryst 12 365
(1979) [44] T Sundius J Raman Spectrosc 1 471 (1973) [45] B H Armstrong J Quant Spectrosc Radiat Transfer 7
61 (1967) [46] J F Kielkopf J Opt Soc Am 63 987 (1973) [47] B P Asthana and W Kiefer Appl Spectr 36 250
(1982)
351
Volume 98 Number 3 May-June 1993
Journal of Research of the National Institute of Standards and Technology
[48] J P M de Vreede S C Mehrotra A Tal and H A Dijkerraan Appl Spectr 36 227 (1982)
[49] F R L Schoening Ada Ciyst 18 975 (1965) [50] P Scherrer Gott Nachr 2 98 (1918) [51] A R Stokes and A J C Wilson Proc Cambridge
Philos Soc 38 313 (1942) [52] A J C Wilson X-Ray Optics 2nd edition Methuen
London (1962) [53] S Leie and T R Anantharaman Proc Indian Acad
Sci Sect A H 261 (1966) [54] D Louer D Weigel and J I Langford J Appl Ciyst
5 353 (1972) [55] A J C Wilson J Appl Ciyst 2 181 (1969) [56] J I Langford and A J C Wilson J Appl Ciyst 11102
(1978) [57] A R Stokes and A J C Wilson Proc Phys Soc Lond
56174 (1944) [58] B E Warren and B L Averbach J Appl Phys 21 595
(1950) [59] B E Warren X-Ray Diffraction Addison-Wesley
Reading Massachusetts (1969) p 264 [60] B E Warren in Progress in Metal Physics Vol 8 Perg-
amon Press London (1959) p 146 [61] F Bertaut C R Acad Sci Paris 228 187 (1949) [62] N C Haider and C N J Wagner Acta Cryst 20 312
(1966) [63] D Balzar and H Ledbetter in Proceedings of the Accu-
racy in Powder Diffraction II Natl Inst Stand Technol (1992) p 37
[64] D Balzar and H Ledbeter J Appl Cryst 26 (1993) in press
[65] J N Eastabrook and A J C Wilson Proc Phys Soc Lond B 65 67 (1952)
[66] R S Smith IBM J Res Develop 4 205 (1960) [67] B Y Pines and A F Sirenko Soviet Physics Ciyst 715
(1962) [68] G B Mitra and N K Misra Acta Ciyst 22 454 (1967) [69] A Gangulee J Appl Ciyst 7 434 (1974) [70] J Mignot D Rondot Acta Met 231321 (1975) [71] J Mignot and D Rondot Acta Ciyst A 33 327 (1977) [72] R K Nandi H K Kuo W Schlosberg G Wissler J B
Cohen and B Crist Jr J Appl Ciyst 17 22 (1984) [73] M Zocchi Acta Ciyst A 36164 (1980) [74] P Ramarao and T R Anantharaman Trans Ind Ins
Metals 18 181 (1965) [75] R K Nandi and S P Sen Gupta J App Cryst 11 6
(1978) [76] Th H de Keijser J I Langford E J Mittemeijer and
B P Vogels J Appl Ciyst IS 308 (1982) [77] A Williams G H Kwei R B Von Dreele A C Lar-
son L D Raistrick and D L Bish Phys Rev B 37 7960 (1988)
[78] A C Larson and R B Von Dreele Los Alamos Na- tional Laboratory Report No LA-UR-86-748 (1988)
[79] J D Jorgensen D H Johnson M H Mueller J G Worlton and R B Von Dreele in Proceedings of the Conference on Diffraction Profile Analysis Cracow Poland (1978) p 20
[80] R B Von Dreele J D Jorgensen and C G Windsor J Appl Ciyst 15 581 (1982)
[81] P Thompson D E Cox and J B Hastings J Appl Ciyst 20 79 (1987)
[82] J P Singh R A Guttschow D S Kupperman J T Dusek and R B Poeppel in High Temperature Super-
conducting Compounds III S Whang A Gupta and E Ceilings eds TMS AIME Warrendale (1991) p 281
[83] M O Eatough D S Glnley and B Morosin Adv X- Ray Anal 33 145 (1990)
[84] E J Peterson P J Kung R E Muenchausen and D M Smith in Proceedings of the 41st Annual Denver Conference on Applications of X-Ray Analysis Colo- rado Springs Colorado (1992) p 74
[85] M Rand J I Langford and J S Abell submitted to J Cryogenics (1992)
[86] D Balzar J Appl Ciyst 25 559 (1992) [87] D Balzar H Ledbetter and A Roshko Physica C 185-
189 871 (1991) [88] D Balzar and H Ledbetter J Mater Sci Lett 111419
(1992) [89] D Balzar H Ledbetter and A Roshko Pow Diffr 8
(1993) in press [90] S Johnson M Gusraan D Rowcliffe T Geballe and J
Sun Adv Ceram Mater 2 337 (1987) [91] H Ledbetter S A Kim R B Goldfarb and K Togano
Phys Rev B 39 9689 (1989) [92] H Friedman Electronics 132 (1945) [93] W Parrish (ed) in Advances in X-Ray Diffractometry
and X-Ray Spectrography Centrex Publishing Company Eindhoven The Netheriands (1962)
[94] W Soller Phys Rev 24158 (1924) [95] S A Howard R L Snyder J Appl Ciyst 22 238
(1989) [96] G H Stout and L H Jensen X-Ray Structure Determi-
nation 2nd edition Wiley New York (1989) p 373 [97] D E Appleman and T Evans Jr Final Report 92-14
US Geological Survey Washington DC (1973) Avail- able as NTIS Document No PB-216188
[98] M U Cohen Rev Sci Instrum 6 68 (1935) [99] M U Cohen Rev Sci Instrum 7 155 (1936) [100] M H Mueller L Heaton and K T Miller Acta Ciyst
13 828 (1960) [101] R A Young P E Mackie and R B Von Dreele J
Appl Ciyst 10 262 (1977) [102] D B Wiles and R A Young J Appl Cryst 14 149
(1981) [103] J K Yau and S A Howard J Appl Ciyst 22 244
(1989) [104] S A Howard J K Yau and H U Anderson J Appl
Phys 65 1492 (1989) [105] S Enzo G Fagherazzi A Benedetti and S Poilizzi J
Appl Ciyst 21 536 (1988) [106] A Benedetti G Fagherazzi S Enzo and M
Battagliarin J Appl Cryst 21 543 (1988) [107] Th H de Keijser E J Mittemeijer and H C F Rozen-
daal J Appl Ciyst 16 309 (1983) [108] Y Zhang J M Stewart C R Hubbard and B Mo-
rosin Adv X-Ray Anal 33 373 (1990) [109] Y Wang S Lee and Y Ue J Appl Ciyst IS 35
(1982) [110] V N Selivanov and E F Smislov Zavod Lab 57 28
(1991) [Ill] A Guinier X-Ray Diffraction W H Freeman San
Francisco (1963) p 139 [112] M Wilkens J Appl Cryst 12119 (1979) [113] D Du and Y Wang Pow Diffr 2180 (1987) [114] A P Prudnikov Yu A Brychkov and O L Marichev
Integrals and Series Vol 1 Gordon and Breach Am- sterdam The Netheriands (1986) p 344
352
Volume 98 Number 3 May-June 1993
Journal of Research of the National Institute of Standards and Technology
[115] R L Rothman and J B Cohen J Appl Phys 42 971 (1971)
[116] T Adier and C R Houska J Appl Phys 50 3282 (1979)
[117] C R Houska and T M Smith J Appl Phys 52 748 (1981)
[118] S Rao and C R Houska Acta Ciyst A 4214 (1986) [119] J I Langford R Delhez Th H de Keijser and E J
Mittemeijer Ausi J Phys 41173 (1988) [120] J I Langfoid J Appl Cryst IS 315 (1982) [121] M J Turunen Th H de Keijser R Delhez and N M
van der Pers J Appl Ciyst 16176 (1983) [122] A J C Wilson Acta Ciyst 23 888 (1967) [123] A J C Wilson Acta Ciyst A 24 478 (1968) [124] A J C Wilson Acta Ciyst A 25 584 (1969) [125] G Gagliotti A Paoletti and F P Ricci Nucl Instrum
3 223 (1958) [126] J I Langford R J Cernik and D Louer J Appl
Ciyst 24 913 (1991) [127] J I Langford in Accuracy in Powder Diffraction II
preprint [128] A J C Wilson Mathematical Theory of X-Ray Powder
Diffractometiy Centrex Eindhoven The Netherlands (1963)
[129] J L Langford Prog Ciyst Growth and Charact 14185 (1987)
[130] T G Fawcett C E Crowder S J Brownell Y Zhang C R Hubbard W Schreiner G P Hamill T C Huang E Sabino J I Langford R Hamilton and D Louer Pow Diffr 3 209 (1988)
[131] W L Smith J Appl Ciyst 9187 (1976) [132] J L Langford and D Louer J Appl Ciyst 15 20
(1982) [133] Fl Popescu and L Benes Acta Ciyst A 33 323 (1977) [134] P PSuse^cu R MSnaila M Popescu and E Jijovici j
Appl Cryst 7 281 (1974) [135] P F Bley Y Calvayrac and M Fayard J Appl Ciyst
7 493 (1974) [136] B Moraweck Ph de Montgolfier and A J Renouprez
J Appl Ciyst 10191 (1977) [137] A Le Bail and D Louer J Appl Cryst 11 50 (1978) [138] D R Buchanan R L McCuUough and R L Miller
Acta Ciyst 20 922 (1966) [139] P Suortti and L D Jennings Acta Cryst A 33 1012
(1977) [140] J B Cohen and C N J Wagner J Appl Phys 33 2073
(1962) [141] A Bianconi J Budnick A M Flank A Fontaine P
Lagarde A Marcelli H Tolentino B Chamberland C Michel B Raveau and G Demazeau Phys Lett A127 285 (1988)
[142] K Fueki K Kitazawa K Kishio T Hasegawa S Uchida H Takagi and S Tanaka in Chemistiy of High- Temperature Superconductors D L Nelson M S Whittingham and T F George eds American Chemi- cal Society (1987) p 38
[143] T Fujita Y Aoki Y Maeno J Sakurai H Fukuba and H Fujii J Appl Phys 26 U68 (1987)
[144] R M Hazen in Physical Properties of High-rc Super- conductors Vol 2 D M Ginsberg ed World Scien- tific Singapore (1990) p 121
[145] J B Torrance A Bezinge A I Nazzal T C Huang S P Parkin D T Keane S J LaPlaca P M Horn and G A Held Phys Rev B 40 8872 (1989)
[146] J D Axe A H Moudden D Hohlwein D E Cox K
M Mohanty A R Moodenbaugh and Y Xu Phys Rev Lett 62 2751 (1989)
[147] T Suzuki and T Fujita Physica C 159 111 (1989) [148] T Fujita and Y Maeno in Superconducting Materials
JJAP Series 1 (1988) p 34 [149] A Roshko and Y-M Chiang J Appl Phys 66 3710
(1989) [150] D E Cox S C Moss R L Meng P H Hor and C W
Chu J Mater Res 31327 (1988) [151] B Crist and J B Cohen J Polym Sci 17 1001 (1979) [152] H Ledbetter S Kim and A Roshko Z Phys B 89275
(1992) [153] R D Shannon and C T Prewitt Acta Ciyst B 25 925
(1969) [154] M Lang H Spille F Steglich Y Hidaka T Murakami
and Y Endoh Physica C 162-1641037 (1989) [155] Y Hidaka and T Murakami Phase trans 15 241
(1989) [156] P L Gai and E M McCarron Science 247 553 (1990) [157] T Kamiyama I Izumi H Asano H Takagi S Uchida
Y Tokura E Takayama-Muromachi M Matsuda K Yamada Y Endoh and Y Hidaka Physica C 172 120 (1990)
[158] A Kapitulnik Physica C 153-155 520 (1988) [159] L A Muradyan V N Molchanov R A Tamazyan and
V I Simonov Physica C 162-164 536 (1989) [160] P Day M Rosseinsky K Prassides W I F David O
Moze and A Soper J Phys C 20 L429 (1987) [161] J T Lewandowski R A Beyerlein J M Longo and R
A McCauley J Amer Ceram Soc 69 699 (1986) [162] R Ramesh G van Tendeloo G Thomas S M Green
Y Mei C Jiang and H L Luo Appl Phys Lett 53 2220 (1988)
[163] J Schneck L Pierre J C Tolddano and C Daguet Phys Rev B 39 9624 (1989)
[164] O Eibl Physica C 168 215 (1990) [165] W Carrilo-Cabrera and W Gopel Physica C 161 373
(1989) [166] P Bordet J J Capponi C Chaillout J Chenavas A
W Hewat E A Hewat J L Hodeau M Marezio J L Tholence and D Tranqui Physica C 156189 (1988)
[167] R Ramesh K Remschnig J M Tarascon and S M Green J Mater Res 6 278 (1991)
[168] Z Hiroi Y Ikeda M Takano and Y Bando J Mater Res 6 435 (1991)
[169] Y Inoue M Hasegawa Y Shichi I Munakata M Ya- manaka S Hiyama and O Nittono J Mater Res 5 737 (1990)
[170] R Ramesh B G Bagley J M Tarascon S M Green M L Rudee and H L Luo J Appl Phys 67 379 (1990)
[171] X B Kan J Kulik P C Chow S C Moss Y F Yan J H Wang and Z X Zhao J Mater Res 5 731 (1990)
[172] G S Pawley J Appl Ciyst 13 630 (1980) [173] H Toraya J Appl Ciyst 19 440 (1986) [174] L Lutterotti and P Scardi J Appl Ciyst 23 246
(1990)
About the author Davor Balzar is with Faculty of Metallurgy of the University of Zagreb Sisak Croatia and was a Guest Researcher at fflST The National Institute of Standards and Technology is an agency of the Technology Administration US Department of Commerce
353
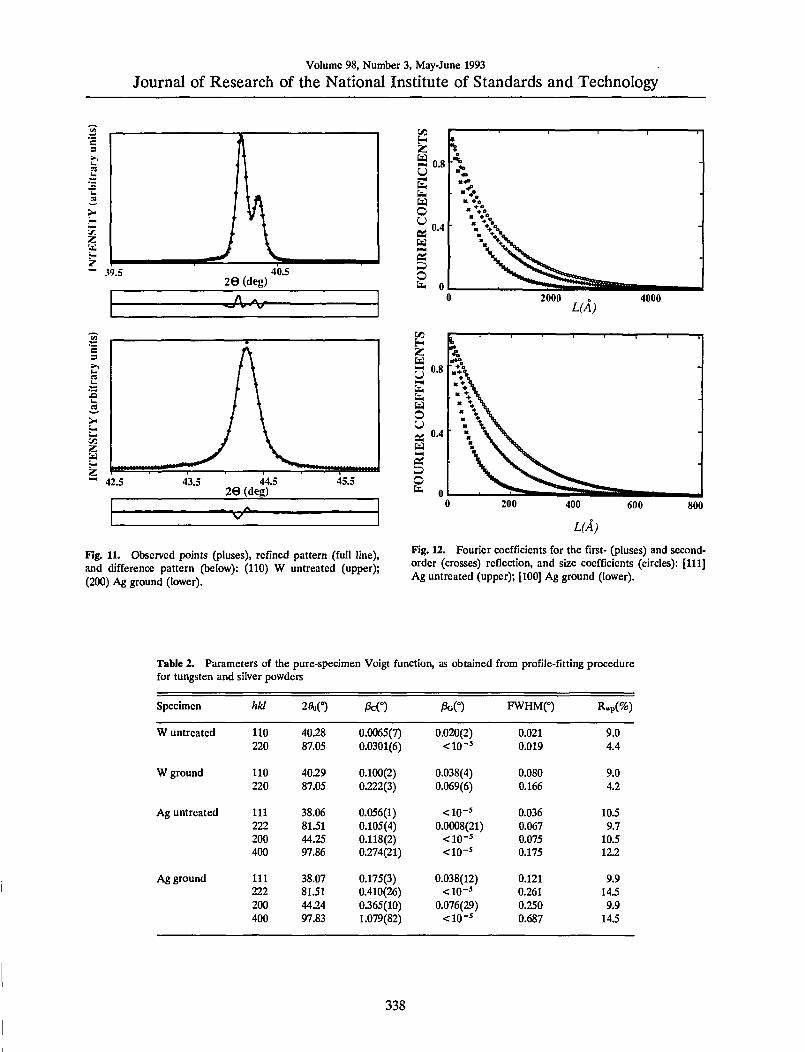
Volume 98 Number 3 May-June 1993
Journal of Research of the National Institute of Standards and Technology
C8
z
7- ^95
29 (deg) 405
bullJf^r-
z S 08
Ez U o u OS
a
04 bull
o Es
4P
2000 z^fA
4000
B
z u f- z
425 435 445 29 (deg)
455
yr 600 SOO
L(A)
Fig 11 Observed points (pluses) refined pattern (full line) and difference pattern (below) (110) W untreated (upper) (200) Ag ground (lower)
Fig 12 Fourier coefficients for the first- (pluses) and second- order (crosses) reflection and size coefficients (circles) [111] Ag untreated (upper) [100] Ag ground (lower)
Table 2 Parameters of the pure-specimen Voigt function as obtained from profile-fitting procedure for tungsten and silver powders
Specimen hkl 2ft(deg) 3c(deg) 3G(deg) FWHM(deg) Rwp()
W untreated 110 220
4028 8705
00065(7) 00301(6)
0020(2) ltio-
0021 0019
90 44
W ground 110 220
4029 8705
0100(2) 0222(3)
0038(4) 0069(6)
0080 0166
90 42
Ag untreated 111 222 200 400
3806 8151 4425 9786
0056(1) 0105(4) 0118(2) 0274(21)
ltio- 00008(21)
ltio-^ ltio-5
0036 0067 0075 0175
105 97
105 122
Ag ground 111 222 200 400
3807 8151 4424 9783
0175(3) 0410(26) 0365(10) 1079(82)
0038(12) ltio-
0076(29) ltio-
0121 0261 0250 0687
99 145 99
145
338
Volume 98 Number 3 May-June 1993
Journal of Research of the National Institute of Standards and Technology
Table 3 Microstructural parameters for tungsten and silver powders
Specimen Direction (poundgt)raquo( A) (2))v(A) ltpound^(fl3))laquo (^laquoD)v2)gtw
W untreated [110] 3200(200) 3500(200) 000038 000008(2)
W ground [110] 620(20) 1030(30) 00023 000054(2)
Ag untreated [111] [100]
1000(20) 510(20)
2000(20) 1030(20)
00010 00022
000024(1) 000047(5)
Ag ground [111] [100]
380(20) 210(10)
650(20) 350(20)
00047 00100
000095(7) 000180(14)
100 -_ - [100) Ag ground ^ ^~ mdash C1111 Ag ground ^bull
y y
o y ^ 50 A y
y y
y
0
y - y ^--
c ) 50 100 150
lLfAjxlO^
Fig 13 Mean-square strains (E^) as a function of VL
Errors in integral breadths allow estimation of errors in strain and size parameters (Sec 45) but in some cases the refinement algorithm gives unre- liable errors of integral breadths When a particu- lar parameter is close to the limiting value (for instance 10^ degrees has been put as the mini- mum value for integral breadths) errors become large However in Eqs (63) (65) (66) (67) and (68) only the product of integral breadth and ac- companying error is significant which is roughly equal for Cauchy and Gauss parts Errors of do- main sizes and strains are of the same order of magnitude as errors of integral breadths
The possible source of systematic error is poten- tial inadequacy of Voigt function to accurately de- scribe specimen broadening This effect can not be evaluated analytically but it would affect all derived parameters especially the column-length distribution functions The logical relationship be- tween values of domain sizes (see Table 3) for dif- ferent degrees of broadening indicates that possible systematic errors can not be large
Equation (41) allows computation of volume- weighted and surface-weighted average domain sizes if respective column-length distribution func- tions can be obtained Figure 14 gives surface- weighted and volume-weighted average column- length distribution functions following Eqs (39) and (38) Width of the distribution function deter- mines the relative difference between (D) and (pound))v The broader the distribution the larger the differences because small crystallites contribute more to the surface-weighted average That is much more evident comparing the surface- weighted column-length distribution with the vol- ume-weighted If they have similar shape and maximum position as in Fig 15 differences are small Conversely if the surface-weighted distribu- tion function has a sharp maximum toward smaller sizes differences are larger (see Fig 14) The dif- ference between (poundgt)s and (D)v and the actual mean dimension of the crystallites in a particular direction also depends strongly on the average shape of the crystallites [52 131 132]
If experimental profiles are deconvoluted by the Stokes method even for considerable specimen broadening size coefficients A ^ usually oscillate at larger L values [59 106] preventing computation of the column-length distribution function Few techniques were used to deal with this problem successive convolution unfolding method [32 133] smoothing and iterative methods [134 135 136 137] Figures 14 and 15 show very smooth column- length distribution functions However they follow from size coefficients ^4^ that depend on the accu- racy of the approximation for the distortion coeffi- cient given by Eq (47) Equation (47) is exact if the strain distribution is Gaussian but in general holds only for small harmonic numbers n if strain broadening is not negligible
339
Volume 98 Number 3 May-June 1993
Journal of Research of the National Institute of Standards and Technology
500 1000 L(A)
Fig 14 Surface-weighted and volume-weighted column-length distribution functions normalized on unit area [111] Ag un- treated (upper) [100] Ag ground (lower)
Fig 15 Surface-weighted and volume-weighted column-length distribution functions for [010] La2Cu04 normalized on unit area
522 La2-xSrtCu04 Powders To test the applicability of the discussed method to more com- plicated patterns two compounds with lower crystallographic symmetry were studied Lai85Sroi5Cii04 has a tetragonal K2NiF4-type struc- ture space group lAlmmm La2Cu04 is orthorhom-
bic at room temperature Both compounds show slight line broadening and relatively highly overlap- ping peaks (see Fig 16) which makes it very diffi- cult if not impossible to perform a Stokes analysis
25
-25
26 (deg)
yNraquo-
Fig 16 Observed points (pluses) refined pattern (full line) convoluted profiles (dashed line) and difference plot (below) for part of La2Cu04 pattern
Tables 4 and 5 list results from the fitting proce- dure and the analysis of specimen-broadened inte- gral breadths There are no qualitative differences in results for tungsten and silver powders How- ever average errors are higher as expected be- cause of overlapping peaks while weighted errors wp are surprisingly smaller This fact illustrates the unreliability of iwp when only a segment of the pat- tern is being refined because it depends on the number of counts accumulated in points as well as on the 28 range of the refinement
Figures 17 and 18 represent Fourier coefficients of Lai85Sroi5Cu04 [110] and La2Cu04 [010] direc- tions In the second plot the A (L )-versus-L plot shows a concave-downward part near L =0 the so- called hook effect It was shown in Sec 42 that the hook effect originates because of underesti- mation of background connected with the trunca- tion of profiles In the profile refinement all peaks separated less than 4deg 20 have been included in the refinement region to avoid possible overlapping of peak tails and specimen profiles have been trun- cated below 01 of the maximum intensity How- ever because the polynomial background was determined prior to profile refinement it may be overestimated for complicated patterns containing many overlapping peaks If background is refined with other profile parameters undesirable correla- tion with integral breadths occurs
340
Volume 98 Number 3 May-June 1993
Journal of Research of the National Institute of Standards and Technology
Table 4 Parameters of the pure-specimen Voigt function as obtained from profile-fitting procedure for La2-^SrCu04 powders
Specimen hid 2Hdeg) Pen PcO FWHM(deg) Rp()
Lai85Sroi5Cu04 004 2695 0046(4) 0024(8) 0042 34 006 4092 0083(5) ltio-= 0053 62 110 3352 0110(5) ltio- 0070 125 220 7046 0171(9) ltio- 0109 43
La2Cu04 004 2713 0061(8) 0045(9) 0067 39 006 4119 0124(7) ltio-^ 0079 77 020 3316 0074(10) 0078(10) 0102 29 040 6957 0210(30) 0026(81) 0135 29 200 3345 0074(8) 0061(10) 0087 69 400 7028 0130(10) 0023(95) 0089 29
Table 5 Microstructural parameters for Laij(5Srai3Cu04 and La2Cu04 powders
Specimen Direction (DUA) Pgt(A) lte^(fl3))laquo lte2((Z)gt2))laquo
Lai83Sro5Cu04
La2Cu04
[001] [110]
[001] [010] [100]
1700(300) 470(20)
1100(100) 680(50) 680(50)
2000(200) 940(20)
1200(100) 760(50) 810(50)
00024 00017
00038 00033 00016
000049(9) 000044(6)
00008(1) 00007(2) 00003(3)
c i ^- raquo sect 08 bulli - U
^0
ti- bull ll bull bullbullo
ffl M P bull- u ^ Di 04 Si - M bulldiamsbullbull a bull-v 3 o ^^=s^
u ^N^Sraquoraquo^
0 ^^^aaaa 1000
L(A) 2000
OQ bullbulldego UM o z a 08
o o bull bull bull
- u u bull raquo UU bull
a diams o bull o u ft 04 bull deg raquo deg - U bull bull deg Oi bullbullgt =3 bull- l o k u
0 bullbullbullraquo aaaMMi
500 1000
L(A)
Fig 17 Fourier coefficients for the first- (pluses) and second- order (crosses) reflection and size coefficients (circles) for [110] Lai^Sroi5Cu04
Fig 18 Fourier coefficients for first- (pluses) and second- order (crosses) reflection and size coefficients (circles) for [010] La2Cu04
341
Volume 98 Number 3 May-June 1993
Journal of Research of the National Institute of Standards and Technology
S3 Comparison with the Integral-Breadth Methods
Knowing the specimen integral breadths simpli- fied methods can be applied In Sec 212 we re- viewed multiple-line and single-line integral- breadth methods We shall compare the simplified multiple-line methods [Eqs (23) (24) and (30)] and the single-line method [76] [Eqs (29) and (30)] with results obtained for silver tungsten and La2-xSrxCu04 powders (Tables 3 and 5) We did not compare with the multiple-line Voigt-function method [26] because it was shown in Sec 44 that it is incompatible with the Warren-Averbach analy- sis In Table 6 integral breadth Pi was computed according to Eq (11) This value was compared with )8A integral breadth computed from Fourier coefficients [58]
i8A=- laquo3 2^(L)
(74)
Results obtained by the Warren-Averbach analysis are significantly smaller for both size and strain Integral-breadth methods give the upper limit for strain so comparison is limited Considering the approximation e = 125e^(L))^ [138] with L=(D)v2 or L=(D)s2 strains resemble more closely than crystallite sizes It must be noted how- ever that this approximation makes sense only in the case of pure-Gauss strain broadening Benedetti et al [106] reported excellent agreement for both size and strain using Warren-Averbach and Cauchy-Gauss [Eq (24)] methods Results from Table 6 on the contrary indicate that the Gauss-Gauss approximation gives values closest to the Warren-Averbach method for crystallite sizes whereas the Cauchy-Gauss and especially the Cauchy-Cauchy approximation tend to give too large values For strain the trend is opposite The Cauchy-Cauchy approximation resembles most
Table 6 Comparison of results obtained with the integral-breadth methods Cauchy-Cauchy (C-C) Cauchy-Gauss (C-G) Gauss- Gauss (G-G) and single-line (S-L) analysis
Specimen hkl PiXKP PAXKP ltigt)v (Z)gt(A) (e^((DV2)gt2 eXlO^ (A-) (A-0 (A) C-C C-G G-G S-L xlO^ C-C C-G G-G S-L
W untreated 110 220
0259 0247
0259 0247
3500 3700 3810 3810 14500 4040
008 -001 -003 -005 024 0
W ground 110 220
125 204
125 205
1030 2240 1450 1220 940 550
054 090 093 105 045 032
Ag untreated 111 2
0600 0901
0600 0900
2000 3340 2390 2190 1670 1110
024 035 039 095 0 0
200 124 124 1030 2270 1470 1230 810 047 082 085 095 0 400 204 204 490 0
Ag ground 111 222
198 352
200 352
650 2080 1240 910 530 280
095 179 182 197 048 0
200 403 406 350 9380 4780 1320 260 180 405 405 408 082 400 803 803 120 0
Lai85Sroi3Cu04 004 006
0657 0881
0650 0880
2000 5230 3290 2660 1970 1140
049 076 078 088 044 0
110 119 119 940 1240 1000 970 840 044 052 064 080 0 220 158 158 630 0
La2Cu4 004 006
0988 132
0998 131
1200 2980 1940 1630 1490 760
08 107 112 127 081 0-
020 143 142 760 1200 910 860 1240 07 079 090 110 114 040 198 200 510 016 200 126 124 810 810 810 810 1250 03 002 011 015 089 400 1S 126 830 014
Not possible to evaluate because of too small Gauss integral breadth
342
Volume 98 Number 3 May-June 1993
Journal of Research of the National Institute of Standards and Technology
closely a Warren-Averbach method These results concur with the Klug and Alexander [24] compari- son of the published size and strain values obtained by Warren-Averbach (Stokes) and integral-breadth methods However for x-ray diffraction the Cauchy-Gauss assumption for the size-strain broadening is theoretically and experimentally more favored thpoundm the other two models The fact that the Gauss-Gauss method for crystallite size and the Cauchy-Cauchy method for strain give more realistic results may mean that the presump- tion that size and strain broadening are exclusively of one type is an oversimplification
The single-line method seems much less reliable If Gaussian breadth is very small no information about strain is obtained Moreover second-order reflections give much lower values of both size and strain than do basic reflections However if multi- ple reflections are not available the single-line method can give satisfactory estimations
54 Reliability of Profile Fitting
The profile fitting of a cluster of even severely overlapping peaks can be accomplished with a low error and excellent fit of total intensity But how reliable is information obtained about separate peaks in the cluster In the fitting procedure it is possible to put constraints on the particular profile parameter to limit intensity position and width of the peak If anisotropic broadening or different phases are present constraints may not be realistic Morever acceptable results can be obtained even using a different number of profiles in refinement [4] Hence the first condition for the successful ap- plication of this method is knowledge of actual phases present in the sample and their crystalline structures
In this regard two powders were measured or- thorhombic Lai94Sroo6Cu04 has a slightly distorted K2NiF4-type structure (space group Bmab a =53510(2) A b =53692 A(2) c = 131931(7) A) and tetragonal Lai76Sro24Cu04 (space group I4mmm a =37711(3) A c = 132580(8) A) Data were collected for each specimen separately and for a specimen obtained by mixing the same pow- ders Because diffracted intensity of each phase was lower for the mixture counting time was pro- portionally increased to obtain roughly the same counting statistics Figure 19 shows two partially separated orthorhombic (020) (200) and (040) (400) peaks overlapped with tetragonal (110) and (220) reflections During the profile fitting of the mixed powders (200) orthorhombic peak tended to disappear on account of neighboring (020) and
(110) reflections Its intensity was constrained to vary in range plusmn 30 of (020) peak intensity which can be justified if the crystallographic structure is known
60
-60
345
345
335 29 (deg)
345
Fig 19 (upper) Lai76Sro24Cu04 (110) peak (middle) Lai94Sroo6Cu04 (020) and (200) peaks (lower) (110) (020) and (200) peaks
Table 7 contains results of fitted specimen-Voigt functions as well as size and strain values obtained by the analysis of broadening Comparing integral breadths of the starting and mixed powders some profiles change from more Cauchy-like to Gauss- like and vice versa This is especially evident for the (400) reflection meaning that accurate deter- mination of the profile tails is indeed affected in the cluster of overlapping peaks However integral breadth does not change significantly so results of
343
Volume 98 Number 3 May-June 1993
Journal of Research of the National Institute of Standards and Technology
Table 7 Comparison between two specimens run separately and mixed togetlier
Specimen hkl 2Hdeg) )3cO PoO DUA) (D)v(A) (e2laquoD)v2))laquoxlO
Lai76Sroj4CuOr 110 3369 0058(6) 0094(7) 780(60) 850(60) 10(1) 220 7073 022(2) 013(2)
LaiMSro(KiCu04 020 3342 0084(9) 055(14) 500(90) 1000(200) 07(1) 040 7012 010(2) 014(1) 200 3353 00216(85) 0061(8) 1100(100) 1200(100) 03(1) 400 7040 0026(11) 0088(8)
Mix 110 3367 0083(21) 0064(14) 800(300) 1200(300) 08(3) Lai76Sro24Cu04 220 7072 019(7) 013(4)
+ 020 3343 0066(35) 0070(23) 800(300) 1000(300) 07(4) Lai94Sroo6Cu04 040 7012 0116(93) 013(5)
200 3354 0024(156) 0071(61) 900(700) 1000(600) 04(12) 400 7041 011(2) 0003(320)
the multiple-line methods are not much influenced On the contrary the single-line method gives quite different results This may support the conclusion of Suortti Ahtee and Unonius [43] that the Voigt function fails to account properly for size and strain broadening simultaneously if only Cauchy integral breadth determines crystallite size
Table 7 shows that the results of Warren- Averbach analysis of starting and mixed powders agree in the range of standard deviations How- ever errors are much larger especially for the hid- den (200)-(400) reflections From Eq (62) it follows that more counts (longer counting times) and more observables (smaller step-size) would lower standard deviations Therefore in the case of highly overlapping patterns to obtain desirable ac- curacy much longer measurements are needed al- though that will not change the fact that higher overlapping implies intrinsically higher errors of all refinable parameters To further minimize possible artifacts of the fitting procedure it is desirable to include in the analysis as many reflections in the same ciystallographic direction as possible
55 Remarks
By modeling the specimen size and strain broad- ening with the simple Voigt function it is possible to obtain domain sizes and strains that agree with experiment and show a logical interrelationship Furthermore the Voigt function shows the correct 1A(26y asymptotic behavior of peak tails as ex- pected from kinematical theory [139] However if the specimen profile is significantly asymmetric (because of twins and extrinsic stacking faults [140 59]) or the ratio FWHM^ is not intermediate to the Cauchy (2Tr) and Gauss (2(ln27r)^) functions then the Voigt function can not be applied [25]
Suortti Ahtee and Unonius [43] found good over- all agreement by fitting the Voigt function to the pure-specimen profiles of a Ni powder deconvo- luted by the instrumental function However more accurate comparison is limited because of unavoid- able deconvolution ripples of specimen profiles Furthermore the Voigt function might not be flex- ible enough to model a wide range of specimen broadening as well as the different causes of broadening Therefore the question whether the Voigt function can satisfactorily describe complex specimen broadening over the whole 20 range in a general case needs further evaluation
This method of Fourier analysis with the as- sumed profile-shape function is most useful in cases when the classical Stokes analysis fails there- fore when peak overlapping occurs and specimen broadening is comparable to instrumental broaden- ing It was shown that for a high degree of peak overlapping the fitting procedure can give unreli- able results of Gauss and Cauchy integral breadths that is the peak can change easily from predomi- nantly Cauchy-like to Gauss-like and contrary This can lead to illogical values of size-integral and strain-integral breadths according to Eqs (52) (53) (54) and (55) and to irregularities in the be- havior of Fourier coefficients for large L Simulta- neously if the size-broadened profile has a large Gauss-function contribution the hook effect will occur However volume-weighted domain sizes D)y and MSS eL)) for small L are much less affected because they rely on both Cauchy and Gauss parts of the broadened profile Any integral- breadth method that attempts to describe the size and strain broadening exclusively by a Cauchy or Gauss function in this case fails completely For specimens with lower crystallographic symmetry
344
Volume 98 Number 3 May-June 1993
Journal of Research of the National Institute of Standards and Technology
when many multiple-order reflections are avail- able but the peaks are overlapped it is therefore desirable to include in the analysis as many reflec- tions as possible to minimize the potential artifacts of the fltting process
6 Analysis of Superconductors 61 (La-M)2Cu04 Superconductors
Bednorz and Miiller [16] found the first high- temperature oxide superconductor in the La-Ba- Cu-O system Soon after substituting Ba with Sr and Ca Kishio et al [17] found superconductivity in two similar compounds Later many compounds with much higher transition temperatures (Tc) were found The (La-M)2Cu04 system remains favorable for study because the cation content responsible for the superconductivity is easier to control and measure than the oxygen stoichiometry Also this system provides a wide range of substitutional cation solubility in which the tetragonal K2NiF4- type structure is maintained Compared with much- studied Y-Ba-Cu-O this structure is simpler because it contains only one copper-ion site and two oxygen-ion sites
The undoped compound La2Cu04 is orthorhom- bic at room temperature It becomes superconduct- ing either with cation substitution on La sites or increased oxygen content to more than four atoms per formula unit Doping with divalent cations in- creases the itinerant hole carriers in the oxygen- derived electron band [141] which probably causes the superconductivity However different dopants influence the transition temperature Tc Although the unit-cell c-parameter simply reflects ionic dopant size [142] the in-plane unit-cell parameter (and accordingly the Cu-0 bond length) correlates with Tc for different dopants and for different dop- ing amounts [142 143]
LaiB5MouCu04 (M = Ba Ca Sr) have a tetrago- nal K2NiF4-type structure space group lAlmmm with four atoms in the asymmetric unit [117] One site is occupied with La partially substituted with dopant ions (Fig 20) La2Cu04 is orthorhombic at room temperature The best way to correlate these two structures is to describe La2Cu04 in space group Bmab the c axis remains the same tetrago- nal [110] and [110] directions become [010] and [100] orthorhombic axes and size of the unit cell is doubled [144]
Figure 21 shows parts of the x-ray diffraction patterns observed and refined of Lai85Moi5Cu04 (M = Sr Ba Ca) and La2Cu04 Refined lattice
parameters are given in Table 8 Table 9 shows resuhs of the line-broadening analysis Relatively
La(BaCaSr)
0(2)
0(1)
Fig 20 Ciystal structure of (La-M)2Cu04 showing one unit cell
300 JUU
(b)
200
100
U 0 M J Js-r-^
30
-30
300
40 41 42 43 44 45 40 41 42 43 44 45 29 (deg) 29 (deg)
mdashA-
gt t 200
Z
F-
- 100
(c)
f V kgt ii I 40 41 42 43 44 45 40 41 42 43 44 45
e (deg) ^^ 26 (deg)
-30 wwX mdash Wlaquo-
Fig 21 Diffraction patterns of LaiH5Moi5Cu04 specimens (a) M=Sr (b) M = Ba (c)M = Ca (d) M = U
345
Volume 98 Number 3 May-June 1993
Journal of Research of the National Institute of Standards and Technology
Table 8 Lattice parameters and T^ at zero resistivity (Ac method at 10 Ma current)
Specimen a (A) bk) c(A) rc(K)
Lairaquo5Sroi5Cu04 377814(7)
Lairaquo3Baoi3Cu04 37846(2)
LaiiijCaoi5Cu04 37863(7)
La2Cu04 53558(2) 54053(2)
231(2) 36
288(4) 28
17(2) 19
1451(8)
Table 9 Results of line-broadening analysis for (La-M)2Cu4 specimens
Specimen hkl PcO PoO (DUk) (Iraquo)(A) lte^((D)2))
Lai(laquoSroj5Cu04 004 006
0046(4) 0083(5)
0024(8) ltio-
1700(300) 2000(200) 000049(9)
110 0110(5) ltio- 470(20) 940(20) 000044(6) 220 0171(9) ltio-
Lai85Baoi3Cu04 004 006
0049(6) 0110(7)
0076(6) 0089(9)
1100(200) 1100(100) 00011(2)
110 0087(4) 000042(6) 560(20) 1110(20) 000024(5) 220 0116(3) ltio-5
Laiji5Caoi5Cu04 004 006
0120(13) 0146(12)
0032(22) 0033(27)
440(70) 780(90) 00007(4)
110 0045(25) 0200(19) 340(30) 360(20) 00013(2) 220 0343(22) ltio-
La2Cu04 004 006
0061(8) 0124(7)
0045(9) ltio-
1100(100) 1200(100) 00008(1)
020 0074(10) 0078(10) 680(50) 760(50) 00007(2) 040 0210(30) 0026(81) 200 0074(8) 0061(10) 680(50) 810(50) 00003(3) 400 0130(10) 0023(95)
weak peak broadening was observed which can not be attributed to the proximity of the phase trans- formation Lai85SroisCu04 is tetragonal down to = 170 K [145] Lai85Baoi5Cu04 to 140 K [146147] and Lai85Caoi5Cu04 to 130 K [148] Another possi- ble reason for peak broadening might be continu- ous compositional variations in dopant content The scanning Auger microprobe analysis of La2-SrtCu04 compounds [149] showed that grain- boundary segregation of Sr is weak and limited to a narrow region near the grain surface In the case of the separation of two phases with different Sr con- tent and similar lattice parameters asymmetry of some reflections would be observed [150] More- over in the case of compositional inhomogeneity microstrains eL)) would be roughly independent of the averaging distance L in the grains [151] therefore distribution of strains would be Gaus- sian For all specimens microstrain behavior is identical it decreases linearly with distance L
Rothman and Cohen [115] showed that such be- havior of microstrains is caused by dislocations that might arise during grinding Assuming the same applied stress microstrain would be approximately inversely proportional to the elastic moduli of these materials If mean microstrain is defined as the arithmetic average of strains for the [001] and [110] directions results agree with values of the Youngs moduli for polycrystalline La2Cu04 Lai85Moi5Cu04 (M = Sr Ba Ca) [152] However other factors may contribute to the microstrain Coordination-6 ionic radii of La^+ Sr Ba^+ Ca^+ are 106 116 136 100 A respectively [153] Substitution of La with ions of different sizes affects the lattice parameter [142] and may cause much larger strains in the [001] direction when some of the ions are replaced with Ba^ than with Sr^ in accord with results in Table 9 Substitution of Ca^^ ions produces an entirely different effect microstrains in the [110] direction are larger This may be explained by
346
Volume 98 Number 3 May-June 1993
Journal of Research of the National Institute of Standards and Technology
comparing effects of substitutional ions on the unit-cell a -parameter The Ba-doped specimen has a larger a-parameter than the Sr-doped but the Ca-doped a-parameter is largest although Ca^^ has the smallest ionic size This should increase the cell distortion in the a-b plane
Table 9 reveals high anisotropy in these materi- als consistent with other physical properties such as thermal expansion [154] and upper critical mag- netic field [155] Differences of domain sizes might arise from a layered structure in the [001] direction and consequently easy incorporation of stacking faults between regularly stacked layers The stack- ing-fault and twin-fault probabilities can be esti- mated from the average surface-weighted domain sizes [59]
^ = TAN + cf1fun(aa) (75) m im - (D)
Here c is a constant for the particular [hkl] direction and fun(a a) a linear combination of stacking-fault probability and twin-fault probability a The exact form of Eq (75) was derived only for the cubic and hexagonal crystal structures On con- dition that the true domain dimension D is isotropic or so large that the second term of Eq (75) dominates a linear function of stacking-fault and twin-fault probability is
fun(aa) = c( 1
) (76) Zgt)J (Dgttrade
Here c denotes a constant that depends only on geometrical factors and is the same for all three doped compounds
Figure 22 shows a possible correlation between Tc and fault-defect probabilities computed from TEM observations of La2-jcSrCu04 revealed that stacking-fault density increased with Sr content up to jc = 015 [156] That study suggests that a shear mechanism forming the fault-boundary dislocations implies oxygen vacancies andor cation deficiency We did not measure oxygen content but neutron- diffraction studies showed that oxygen deficiency starts to appear at much higher Sr content [157] However the increase of fault probability with the simultaneous decrease of microstrain in Fig 22 supports the assumption that defects are intro- duced to accommodate lattice strains [156] A simi- lar increase in Te was found in Y2Ba4Cu802o-laquo thin films [158] Compounds with asymmetric broad- ened and shifted peaks showed higher Tc which
was attributed to stacking faults Although extrinsic stacking faults may cause asymmetric peak broad- ening [140] it is probably caused by twinning Twinning in La-M-Cu-0 materials is less abundant than in Y-Ba-Cu-O compounds but it was ob- served in (La-Sr)2Cu04 monocrystals on (110) planes [159] In the profile-fitting procedure peak asymmetry is incorporated only in the instrumental function therefore we could not model asymmetric peak broadening However any significant asym- metry of the specimen profile would cause an un- even fit of low-angle and high-angle sides of peaks which was not observed This gives much more im- portance to stacking faults in Eq (76)
Fig 22 Arithmetic average of [110] and [001] root-mean- square strains and linear function of stacking-fault and twin- fault probabilities as a function of Tc
In Fig 22 average microstrains defined as the arithmetic average of [001] and [110] directions correlate inversely with Tc However we did not find a correlation of Tc and microstrains in a partic- ular direction [001] microstrains simply reflect dif- ference in size of dopant and host La^ ions (see Table 9)
In La2Cu04 (OkO) reflections are significantly broader than (hOO) This has also been observed in low-temperature orthorhombic Lai85Sroi5Cu04 and Lai85Baoi5Cu04 [160] and explained by either stacking faults or possible lower symmetry Our results reveal that domain sizes (D) have identical values for [010] and [100] directions (Table 9) From Eq (76) it follows that stacking-fault proba- bilities in these directions have the same values However microstrains in the [010] direction are roughly twice as large as in the [100] direction which is responsible for the different broadening In the case of doped La2Cu04 compounds different microstrains might be caused by oxygen
347
Volume 98 Number 3 May-June 1993
Journal of Research of the National Institute of Standards and Technology
vacancies ordered along one direction in the a-b plane similar to effects found in YBa2Cu307-laquo However undoped La2Cu04 is not expected to have significant o^Qgen deficiency Other possibili- ties are lower ciystallographic symmetry andor La vacancies although they were not reported for this system but La deficiency was found in an La2Co04 compound [161]
We can conclude that lattice strains and incoher- ently diffracting domain sizes confirm high an- isotropy in these materials This simple approach however does not allow unambiguous identifica- tion of the strains origin Probably the strains originate from dislocations and from different sizes of host and dopant ions Domain sizes of all com- pounds are larger in the c-direction than in the a-6 plane This indicates existence of stacking faults and twins However because estimated errors are relatively large and only three materials were stud- ied the possible connection between stacking faults and 7c needs further study
62 Bi-Cu-O Superconductors
Among the high-Tc superconductors the Bi- Cu-O compounds appear intriguing especially because their incommensurate structure modula- tion remains incompletely understood [162 163] The crystal structure consists of perovskite-like SrO-(Cu02Ca)mi-Cu02-SrO layers separated by NaCl-like BiO double layers (see Fig 23 [164]) The number m of Cu02 layers alters the supercon- ducting transition temperature Tc (for m = 12 and 3 rclaquo10 90 and 110 K respectively) This two- dimensional layered structure makes these materi- als highly anisotropic and favours the creation of defects
Bulk sintered specimens showed relatively weak peak broadening Moreover the diffraction pat- terns contained many overlapping peaks because the compound crystallizes in an orthorhombic low- symmetry space group A2aa [165] and incommen- surate modulation gives superlattice reflections All patterns revealed a strong [001] texture (Fig 24) making reflections other than (001) difficult to ana- lyze The lattice parameters vary depending on the exact compound stoichiometry and processing his- tory but characteristically they have almost identi- cal a and b parameters and large c parameter fl =54095 A 6=54202 A c =309297 A for Bi2Sr2CaCu208 (Bi-2212 [166] and A =5392 A b =5395 A c =36985 A for (BiPb)2Sr2Ca2Cu30io (BiPb-2223) [165] Thus we treated (hOO) and (0^0) reflections as single peaks Table 10 gives the
results for three specimens Bi-2212 (BiPb)2 (SrMg)2(BaCa)2Cu30io (BiPbMgBa-2223) which were one-phase specimens and BiPb-2223 con- taining approximately equal amounts of 2212 and 2223 phases The in-plane lattice parameters of 2212 and 2223 phases differ little hence only the [00] directions of the mixed-phase specimen were evaluated
b^ (c)
Fig 23 Average crystal structure of Bi2Sr2Cam-iCum04+2m for (a) m = 1 (b) w =2 (c) m =3 [164]
35
-35
42 44 46 48 50 52 54 56 58 60 62 26 (deg)
^ ^^^MK^Aa^Ndllaquop
Fig 24 Part of BiPbMgBa-2223 refined pattern There are 48 fundamental reflections in this region
Interpretation of the results in the case of these complicated compounds must be considered care- fully Microstrains are probably caused by disloca- tion arrays However substitution of different-sized ions and vacancies would also contribute to the strains as would other kinds of disorder especially
348
Volume 98 Number 3 May-June 1993
Journal of Research of the National Institute of Standards and Technology
Table 10 Results of line-btoadening analysis for Bi-Cu-O supreconductors
Specimen Phase hkl (A)
eD)sa)y^
Bi-2212 2212 008 0012
0163(8) 022(3)
001(6) 005(6)
420(80) 00021(6)
020+200 0104(4) ltio-^ 580(30) 00007(1) 040+400 018(2) 00004(6300)
BiPbMgBa-2223 7773 0010 0020
0097(1) 021(2)
00002(1700) 0007(150)
770(60) 00012(1)
020 + 200 012(27) 013(10) 380(430) 00009(71) 040 + 400 015(95) 021(33)
BiPb-73 2212 008 0012
023(2) 025(5)
0002(350) 0001(1000)
220(30) 00013(26)
2223 0010 0020
022(8) 023(99)
0092(67) 018(47)
230(190) 00012(197)
Stacking faults and twins Table 10 shows larger strains in the [001] direction that in the basal plane This can be explained by stacking disorder along the c-axis which was frequently observed in electron-diffraction patterns as streaking [167 168] Easy incorporation of stacking faults is possi- ble because of the two-dimensional weak-bonded layers (BiO double layers are spaced about 3 A apart) The difference in microstrain between in- plane and the c-direction is much smaller for the BiPbMgBa-2223 phase probably because Pb low- ers the faulting by stabilizing the higher-Tc 2223 phase [167] For the BiPb-2223 specimen with two phases there are two possibilities Either the speci- men consists mainly of a mk of two kinds of one- phase grains or both phases occur within the same grains The second possibility was confirmed exper- imentally [169 170] and our results concur be- cause microstrain in the 2212 phase is much smaller than in the one-phase Bi-2212 specimen Processing conditions and cation content probably favour development of the macroscopic inter- growth of both phases within the grains that is microscopic defects grow to sufficiently large re- gions to give a diffraction pattern of another phase with the different number of Cu02 layers As a re- sult strain is relieved and both strains and domain sizes being quite different in one-phase specimens tend to equalize
For the Bi-Cu-O specimens the mean surface- weighted domain sizes are generally smaller than for (La-M)2Cu04 compounds Therefore the com- putation of the stacking- and twin-fault probabili- ties by using Eq (75) may be wrong It would be very instructive to compare the different broaden-
ing of satellite and fundamental reflections which indicates a more pronounced stacking disorder in the modulated structure [171]
In summary we found that for both Bi-2212 and BiPbMgBa-2223 superconductors the c-axis strain exceeds the in-plane strain The BiPb-2223 specimen containing both 2212 and 2223 phases within the single grains shows smaller incoherently diffracting domains and lower c-axis strain than the one-phase specimens This fact may direct us to- ward the mechanism of the second-phase forma- tion in these materials
63 Remarks
It was shown that this particular method of the line-broadening analysis can give information about the size of incoherently diffracting domains and lattice strains in (La-M)2Cu04 and Bi-Clu-O superconductors Moreover results show high an- isotropy of both size and strain parameters as one may expect because of the layered structure of all superconducting cuprates Generally structural line broadening is not large that is a result of rela- tively large domain sizes (200-2000 A) and small strains (002-02) It is interesting to compare these values with the published results for YBa2Cu307-laquo (isotropic strains of 023 [77] and 005-03 [82]) Although the different materi- als were studied they seem too large especially be- cause they are the average of strains in different directions
The main drawback of the line-broadening the- ory is the uncertainty about the origins of the line broadening that is it is difficult to distinguish the main effects responsible for the broadening For
349
Volume 98 Number 3 May-June 1993
Journal of Research of the National Institute of Standards and Technology
the novel superconductors particularly the numer- ous defects (substitutions vacancies stacking faults dislocations and similar) can occur simulta- neously which makes it very difficult to determine their individual contributions Furthermore the crystal structures of most novel superconductors are relatively complicated The average structure has mostly a slightly distorted tetragonal symmetry very similar a and b lattice parameters and a large c parameter but c=36 for YBa2Cu307-laquo for in- stance This results in a large number of overlap- ping peaks and consequently in large errors of all results This showed especially in the case of Bi-Cu-O superconductors (see Table 10) Follow- ing the discussion of reliability of profile fitting in Sec 54 it would be desirable to include more than two reflections in the analysis of broadening but higher-order peaks are usually too weak and over- lapped One way to partially solve this problem would be a whole pattern fitting [172 173] and Rietveld structure refinement [23] in terms of size and strain parameters This requires an accurate preset function to model specimen broadening and precise definition of angular dependence of size and strain parameters The Rietveld programs that model the line broadening in terms of size and strain parameters are based either on the simpli- fied integral-breadth methods [78 95] or on the single-line method [174]
7 Conclusions
A method for analyzing the pure-specimen (structural) broadening of x-ray diffraction line profiles is proposed By modeling the specimen size and strain broadenings with the simple Voigt func- tion it is possible to obtain domain sizes and strains that agree with experiment and show a logi- cal interrelationship Furthermore some common consequences and problems in the Fourier-method analysis follow easily The specimen function is convoluted with the instrumental function to match the observed x-ray diffraction-line profile This avoids the Stokes deconvolution method thus al- lowing analysis of patterns with highly overlapping peaks and weak structural broadening Therefore the method was applied to some novel high-Tc superconductors We reached the following conclu- sions
(i) Surface-weighted domain size depends only on the Cauchy integral breadth of the size-broad- ened profile
(ii) The hook effect occurs when the Cauchy-content of the size-broadened profile is un-
derestimated that is for ^sc(n2)^3sG Usually this happens when the background is estimated too high so the long tails of the Cauchy function are prematurely cut off
(iii) It also follows from conclusion (ii) that the volume-weighted domain size can not be more than twice the surface-weighted domain size (limiting value D)v=2D)i is obtained for the pure-Cauchy size-broadened profile) Minimum value for D)J (D)j should not be less than -131
(iv) If the distortion coefficient is approxi- mated with a harmonic term this leads exactly to the Warren-Averbach method of separation of size and strain broadenings
(v) In that case mean-square strains decrease linearly with the distance L
(vi) It is possible to evaluate local strain ((e^(0))^) only in the case of pure-Gauss strain broadening Then root-mean-square strain is inde- pendent of the distance L and related to the upper limit of strain obtained from the integral breadth of the strain-broadened profile
(vii) If strain broadening is not described exclu- sively with the Gauss function the multiple-line Voigt integral breadth and Warren-Averbach analyses can not give the same results for volume- weighted domain size although D)v is defined identically in both approaches because the appar- ent strain -q = pdeg(29)cot9 is not angular- independent
(viii) Smooth size coefficients give column- length distribution functions without oscillations and make possible a computation of volume- weighted average domain sizes up to ~5000 A
(ix) Comparison with the simplified integral- breadth methods in most cases has shown not large but systematic discrepancy of results indicat- ing that size and strain broadening can not be accu- rately modeled by a single Cauchy or Gauss function Moreover the application of the single- line method is much less reliable and it should not be used where multiple reflections are available
(x) The knowledge of all phases present in the sample and their crystallographic structure is re- quired to successfully fit a cluster of overlapping peaks Although it is very difficult to accurately de- termine the Cauchy-Gauss ratio of an overlapped peak final results of domain size and strain are much less affected Therefore connecting the crys- tallite size exclusively with the Cauchy content and strain with the Gauss content of a specimen profile might be doubtful
(xi) Evaluated errors of domain sizes and strains increase substantially with the degree of
350
Volume 98 Number 3 May-June 1993
Journal of Research of the National Institute of Standards and Technology
peak overlapping Hence for complicated patterns very accurate measurements are necessary and one needs to analyze as many reflections in the same crystallographic direction as possible
(xii) Line-broadening analysis of (La-M)2Cu04 and Bi-Cu-O compounds confirms high anisotropy in these materials
(xiii) Strains in (La-M)2Cu04 probably origi- nate from dislocations and from different sizes of host and dopant ions
(xiv) Stacking-fault probability in (La-M)2Cu04 (M = Ba Ca Sr) increases with increasing Tc whereas the average strain decreases
(xv) In La2Cu04 different broadening of (lOO) and (OfcO) reflections is not caused by stacking faults
(xvi) All Bi-Cu-0 superconductors show larger strain in the c-direction than in the a-b plane which can be explained by stacking disorder along the [001] direction
(xvii) In the specimen with approximately equal amounts of Tl-2212 and TlPb-2223 phases it is likely that a secondary phase develops by the growth of the microscopic faulted regions of the primary phase
Acknowledgments
I am thankful to Dr Harry McHenry for his support and especially to Dr Hassel Ledbetter for his wise guidance and most useful help during my stay at NIST I am also indebted to my home insti- tution the Faculty of Metallurgy of the University of Zagreb for allowing me the leave of absence at NIST
8 References
[1] W Friedrich P Knipping and M v Laue Ann Physik 41 971 (1912)
[2] H M Rietveld Acta Cryst 22 151 (1967) [3] H M Rietveld J Appl Cryst 2 65 (1969) [4] S A Howard and K D Preston in Modern Powder Dif-
fraction Vol 20 The Mineralogical Society of America Washington DC (1989) p 217
[5] D Taupin J Appl Cryst 6 266 (1973) [6] T C Huang and W Parrish Appl Phys Lett 27 123
(1975) [7] M K Wu J R Ashburn C J Torng P H Hor R L
Meng L Gao Z J Hwang Y Q Wang and C W Chu Phys Rev Lett 58 908 (1987)
[8] D Shi MRS Bull 16 37 (1991) [9] D Larbalestier Phys Today 44 74 (1991)
[10] J C Phillips Phys Rev B 4512647 (1992) [11] B Raveau Phys Today 45 53 (1992) [12] A J Millis and K M Rabe Phys Rev B 38 8908 (1988)
[13] F Guinea Europhys Lett 7 549 (1988) [14] C P Dhard and P Singh in Proc Int Symp High-Temp
Supercond Jaipur India Oxford amp IBH Publishing New Delhi (1988) p 271
[15] J D Jorgensen Phys Today 44 34 (1991) [16] J G Bednorz and K A Muller Z Phys B 64 189
(1986) [17] K Kishio K Kitazawa S Kaube I Yasuda N Sugii H
Takagi S Uchida K Fueki and S Tanaka Chem Lett 429 (1987)
[18] J D Jorgensen B Dabrowski S Pei D G Hinks L Soderholm B Morosin J E Venturini and D S Ginley Phys Rev B 38 11337 (1988)
[19] J R Clem Phys Rev B 43 7837 (1991) [20] M Paranthaman M Foldejiki D Balzar H Ledbetter
A J Nelson and A M Hermann submitted to Phys Rev B
[21] A R Stokes Proc Phys Soc Lond 61 382 (1948) [22] B E Warren and B L Averbach J Appl Phys 23 497
(1952) [23] R Delhez Th H de Keijser and E J Mittemeijer in
Accuracy in Powder Diffraction S Block and C R Hub- bard eds Natl Bur Stand (US) Special Publication 567 (1980) p 213
[24] H P Klug and L E Alexander X-ray Diffraction Proce- dures 2nd Edition John Wiley New York (1974) p 661
[25] J I Langford J Appl Ciyst 11 10 (1978) [26] J I Langford in Accuracy in Powder Diffraction S
Block and C R Hubbard eds Natl Bur Stand (US) Special Pubication 567 (1950) p 255
[27] R Delhez Th H de Keijser and E J Mittemeijer Fre- senius Z Anal Chem 312 1 (1982)
[28] A J C Wilson Proc Phys Soc Lond 80 286 (1962) [29] A J C Wilson Proc Phys Soc Lond 81 41 (1963) [30] L P Smith Phys Rev 46 343 (1934) [31] H C Burger and P H van Cittert Z Phys 79 722
(1932) [32] S Ergun J Appl Ciyst 1 19 (1968) [33] R Croche and L Gatineau J Appl Ciyst 10479 (1977) [34] L H Schwarz and J B Cohen Diffraction from Materi-
als Academic Press New York (1977) p 391 [35] R Delhez Th H de Keijser E J Mittemeijer and J I
Langford J Appl Cryst 19 459 (1986) [36] R Delhez Th H de Keijser E J Mittemeijer and J I
Langford Aust J Phys 41 213 (1988) [37] R A Young and D B Wiles J Appl Cryst 15 430
(1982) [38] W Voigt Stizungsber K Bayer Akad Wiss 42 603
(1912) [39] E E Whiting J Quant Spectrosc Radiat Transfer 8
1379 (1968) [40] G K Wertheim M A Butler K W West and D N E
Buchanan Rev Sci Instrum 111369 (1974) [41] M M Hall Jr V G Veeraraghavan H Rubin and P G
Winchell J Appl Cryst 10 66 (1977) [42] A Brown and J W Edmonds Adv X-Ray Anal 23 361
(1980) [43] P Suortti M Ahtee L Unonius J Appl Cryst 12 365
(1979) [44] T Sundius J Raman Spectrosc 1 471 (1973) [45] B H Armstrong J Quant Spectrosc Radiat Transfer 7
61 (1967) [46] J F Kielkopf J Opt Soc Am 63 987 (1973) [47] B P Asthana and W Kiefer Appl Spectr 36 250
(1982)
351
Volume 98 Number 3 May-June 1993
Journal of Research of the National Institute of Standards and Technology
[48] J P M de Vreede S C Mehrotra A Tal and H A Dijkerraan Appl Spectr 36 227 (1982)
[49] F R L Schoening Ada Ciyst 18 975 (1965) [50] P Scherrer Gott Nachr 2 98 (1918) [51] A R Stokes and A J C Wilson Proc Cambridge
Philos Soc 38 313 (1942) [52] A J C Wilson X-Ray Optics 2nd edition Methuen
London (1962) [53] S Leie and T R Anantharaman Proc Indian Acad
Sci Sect A H 261 (1966) [54] D Louer D Weigel and J I Langford J Appl Ciyst
5 353 (1972) [55] A J C Wilson J Appl Ciyst 2 181 (1969) [56] J I Langford and A J C Wilson J Appl Ciyst 11102
(1978) [57] A R Stokes and A J C Wilson Proc Phys Soc Lond
56174 (1944) [58] B E Warren and B L Averbach J Appl Phys 21 595
(1950) [59] B E Warren X-Ray Diffraction Addison-Wesley
Reading Massachusetts (1969) p 264 [60] B E Warren in Progress in Metal Physics Vol 8 Perg-
amon Press London (1959) p 146 [61] F Bertaut C R Acad Sci Paris 228 187 (1949) [62] N C Haider and C N J Wagner Acta Cryst 20 312
(1966) [63] D Balzar and H Ledbetter in Proceedings of the Accu-
racy in Powder Diffraction II Natl Inst Stand Technol (1992) p 37
[64] D Balzar and H Ledbeter J Appl Cryst 26 (1993) in press
[65] J N Eastabrook and A J C Wilson Proc Phys Soc Lond B 65 67 (1952)
[66] R S Smith IBM J Res Develop 4 205 (1960) [67] B Y Pines and A F Sirenko Soviet Physics Ciyst 715
(1962) [68] G B Mitra and N K Misra Acta Ciyst 22 454 (1967) [69] A Gangulee J Appl Ciyst 7 434 (1974) [70] J Mignot D Rondot Acta Met 231321 (1975) [71] J Mignot and D Rondot Acta Ciyst A 33 327 (1977) [72] R K Nandi H K Kuo W Schlosberg G Wissler J B
Cohen and B Crist Jr J Appl Ciyst 17 22 (1984) [73] M Zocchi Acta Ciyst A 36164 (1980) [74] P Ramarao and T R Anantharaman Trans Ind Ins
Metals 18 181 (1965) [75] R K Nandi and S P Sen Gupta J App Cryst 11 6
(1978) [76] Th H de Keijser J I Langford E J Mittemeijer and
B P Vogels J Appl Ciyst IS 308 (1982) [77] A Williams G H Kwei R B Von Dreele A C Lar-
son L D Raistrick and D L Bish Phys Rev B 37 7960 (1988)
[78] A C Larson and R B Von Dreele Los Alamos Na- tional Laboratory Report No LA-UR-86-748 (1988)
[79] J D Jorgensen D H Johnson M H Mueller J G Worlton and R B Von Dreele in Proceedings of the Conference on Diffraction Profile Analysis Cracow Poland (1978) p 20
[80] R B Von Dreele J D Jorgensen and C G Windsor J Appl Ciyst 15 581 (1982)
[81] P Thompson D E Cox and J B Hastings J Appl Ciyst 20 79 (1987)
[82] J P Singh R A Guttschow D S Kupperman J T Dusek and R B Poeppel in High Temperature Super-
conducting Compounds III S Whang A Gupta and E Ceilings eds TMS AIME Warrendale (1991) p 281
[83] M O Eatough D S Glnley and B Morosin Adv X- Ray Anal 33 145 (1990)
[84] E J Peterson P J Kung R E Muenchausen and D M Smith in Proceedings of the 41st Annual Denver Conference on Applications of X-Ray Analysis Colo- rado Springs Colorado (1992) p 74
[85] M Rand J I Langford and J S Abell submitted to J Cryogenics (1992)
[86] D Balzar J Appl Ciyst 25 559 (1992) [87] D Balzar H Ledbetter and A Roshko Physica C 185-
189 871 (1991) [88] D Balzar and H Ledbetter J Mater Sci Lett 111419
(1992) [89] D Balzar H Ledbetter and A Roshko Pow Diffr 8
(1993) in press [90] S Johnson M Gusraan D Rowcliffe T Geballe and J
Sun Adv Ceram Mater 2 337 (1987) [91] H Ledbetter S A Kim R B Goldfarb and K Togano
Phys Rev B 39 9689 (1989) [92] H Friedman Electronics 132 (1945) [93] W Parrish (ed) in Advances in X-Ray Diffractometry
and X-Ray Spectrography Centrex Publishing Company Eindhoven The Netheriands (1962)
[94] W Soller Phys Rev 24158 (1924) [95] S A Howard R L Snyder J Appl Ciyst 22 238
(1989) [96] G H Stout and L H Jensen X-Ray Structure Determi-
nation 2nd edition Wiley New York (1989) p 373 [97] D E Appleman and T Evans Jr Final Report 92-14
US Geological Survey Washington DC (1973) Avail- able as NTIS Document No PB-216188
[98] M U Cohen Rev Sci Instrum 6 68 (1935) [99] M U Cohen Rev Sci Instrum 7 155 (1936) [100] M H Mueller L Heaton and K T Miller Acta Ciyst
13 828 (1960) [101] R A Young P E Mackie and R B Von Dreele J
Appl Ciyst 10 262 (1977) [102] D B Wiles and R A Young J Appl Cryst 14 149
(1981) [103] J K Yau and S A Howard J Appl Ciyst 22 244
(1989) [104] S A Howard J K Yau and H U Anderson J Appl
Phys 65 1492 (1989) [105] S Enzo G Fagherazzi A Benedetti and S Poilizzi J
Appl Ciyst 21 536 (1988) [106] A Benedetti G Fagherazzi S Enzo and M
Battagliarin J Appl Cryst 21 543 (1988) [107] Th H de Keijser E J Mittemeijer and H C F Rozen-
daal J Appl Ciyst 16 309 (1983) [108] Y Zhang J M Stewart C R Hubbard and B Mo-
rosin Adv X-Ray Anal 33 373 (1990) [109] Y Wang S Lee and Y Ue J Appl Ciyst IS 35
(1982) [110] V N Selivanov and E F Smislov Zavod Lab 57 28
(1991) [Ill] A Guinier X-Ray Diffraction W H Freeman San
Francisco (1963) p 139 [112] M Wilkens J Appl Cryst 12119 (1979) [113] D Du and Y Wang Pow Diffr 2180 (1987) [114] A P Prudnikov Yu A Brychkov and O L Marichev
Integrals and Series Vol 1 Gordon and Breach Am- sterdam The Netheriands (1986) p 344
352
Volume 98 Number 3 May-June 1993
Journal of Research of the National Institute of Standards and Technology
[115] R L Rothman and J B Cohen J Appl Phys 42 971 (1971)
[116] T Adier and C R Houska J Appl Phys 50 3282 (1979)
[117] C R Houska and T M Smith J Appl Phys 52 748 (1981)
[118] S Rao and C R Houska Acta Ciyst A 4214 (1986) [119] J I Langford R Delhez Th H de Keijser and E J
Mittemeijer Ausi J Phys 41173 (1988) [120] J I Langfoid J Appl Cryst IS 315 (1982) [121] M J Turunen Th H de Keijser R Delhez and N M
van der Pers J Appl Ciyst 16176 (1983) [122] A J C Wilson Acta Ciyst 23 888 (1967) [123] A J C Wilson Acta Ciyst A 24 478 (1968) [124] A J C Wilson Acta Ciyst A 25 584 (1969) [125] G Gagliotti A Paoletti and F P Ricci Nucl Instrum
3 223 (1958) [126] J I Langford R J Cernik and D Louer J Appl
Ciyst 24 913 (1991) [127] J I Langford in Accuracy in Powder Diffraction II
preprint [128] A J C Wilson Mathematical Theory of X-Ray Powder
Diffractometiy Centrex Eindhoven The Netherlands (1963)
[129] J L Langford Prog Ciyst Growth and Charact 14185 (1987)
[130] T G Fawcett C E Crowder S J Brownell Y Zhang C R Hubbard W Schreiner G P Hamill T C Huang E Sabino J I Langford R Hamilton and D Louer Pow Diffr 3 209 (1988)
[131] W L Smith J Appl Ciyst 9187 (1976) [132] J L Langford and D Louer J Appl Ciyst 15 20
(1982) [133] Fl Popescu and L Benes Acta Ciyst A 33 323 (1977) [134] P PSuse^cu R MSnaila M Popescu and E Jijovici j
Appl Cryst 7 281 (1974) [135] P F Bley Y Calvayrac and M Fayard J Appl Ciyst
7 493 (1974) [136] B Moraweck Ph de Montgolfier and A J Renouprez
J Appl Ciyst 10191 (1977) [137] A Le Bail and D Louer J Appl Cryst 11 50 (1978) [138] D R Buchanan R L McCuUough and R L Miller
Acta Ciyst 20 922 (1966) [139] P Suortti and L D Jennings Acta Cryst A 33 1012
(1977) [140] J B Cohen and C N J Wagner J Appl Phys 33 2073
(1962) [141] A Bianconi J Budnick A M Flank A Fontaine P
Lagarde A Marcelli H Tolentino B Chamberland C Michel B Raveau and G Demazeau Phys Lett A127 285 (1988)
[142] K Fueki K Kitazawa K Kishio T Hasegawa S Uchida H Takagi and S Tanaka in Chemistiy of High- Temperature Superconductors D L Nelson M S Whittingham and T F George eds American Chemi- cal Society (1987) p 38
[143] T Fujita Y Aoki Y Maeno J Sakurai H Fukuba and H Fujii J Appl Phys 26 U68 (1987)
[144] R M Hazen in Physical Properties of High-rc Super- conductors Vol 2 D M Ginsberg ed World Scien- tific Singapore (1990) p 121
[145] J B Torrance A Bezinge A I Nazzal T C Huang S P Parkin D T Keane S J LaPlaca P M Horn and G A Held Phys Rev B 40 8872 (1989)
[146] J D Axe A H Moudden D Hohlwein D E Cox K
M Mohanty A R Moodenbaugh and Y Xu Phys Rev Lett 62 2751 (1989)
[147] T Suzuki and T Fujita Physica C 159 111 (1989) [148] T Fujita and Y Maeno in Superconducting Materials
JJAP Series 1 (1988) p 34 [149] A Roshko and Y-M Chiang J Appl Phys 66 3710
(1989) [150] D E Cox S C Moss R L Meng P H Hor and C W
Chu J Mater Res 31327 (1988) [151] B Crist and J B Cohen J Polym Sci 17 1001 (1979) [152] H Ledbetter S Kim and A Roshko Z Phys B 89275
(1992) [153] R D Shannon and C T Prewitt Acta Ciyst B 25 925
(1969) [154] M Lang H Spille F Steglich Y Hidaka T Murakami
and Y Endoh Physica C 162-1641037 (1989) [155] Y Hidaka and T Murakami Phase trans 15 241
(1989) [156] P L Gai and E M McCarron Science 247 553 (1990) [157] T Kamiyama I Izumi H Asano H Takagi S Uchida
Y Tokura E Takayama-Muromachi M Matsuda K Yamada Y Endoh and Y Hidaka Physica C 172 120 (1990)
[158] A Kapitulnik Physica C 153-155 520 (1988) [159] L A Muradyan V N Molchanov R A Tamazyan and
V I Simonov Physica C 162-164 536 (1989) [160] P Day M Rosseinsky K Prassides W I F David O
Moze and A Soper J Phys C 20 L429 (1987) [161] J T Lewandowski R A Beyerlein J M Longo and R
A McCauley J Amer Ceram Soc 69 699 (1986) [162] R Ramesh G van Tendeloo G Thomas S M Green
Y Mei C Jiang and H L Luo Appl Phys Lett 53 2220 (1988)
[163] J Schneck L Pierre J C Tolddano and C Daguet Phys Rev B 39 9624 (1989)
[164] O Eibl Physica C 168 215 (1990) [165] W Carrilo-Cabrera and W Gopel Physica C 161 373
(1989) [166] P Bordet J J Capponi C Chaillout J Chenavas A
W Hewat E A Hewat J L Hodeau M Marezio J L Tholence and D Tranqui Physica C 156189 (1988)
[167] R Ramesh K Remschnig J M Tarascon and S M Green J Mater Res 6 278 (1991)
[168] Z Hiroi Y Ikeda M Takano and Y Bando J Mater Res 6 435 (1991)
[169] Y Inoue M Hasegawa Y Shichi I Munakata M Ya- manaka S Hiyama and O Nittono J Mater Res 5 737 (1990)
[170] R Ramesh B G Bagley J M Tarascon S M Green M L Rudee and H L Luo J Appl Phys 67 379 (1990)
[171] X B Kan J Kulik P C Chow S C Moss Y F Yan J H Wang and Z X Zhao J Mater Res 5 731 (1990)
[172] G S Pawley J Appl Ciyst 13 630 (1980) [173] H Toraya J Appl Ciyst 19 440 (1986) [174] L Lutterotti and P Scardi J Appl Ciyst 23 246
(1990)
About the author Davor Balzar is with Faculty of Metallurgy of the University of Zagreb Sisak Croatia and was a Guest Researcher at fflST The National Institute of Standards and Technology is an agency of the Technology Administration US Department of Commerce
353
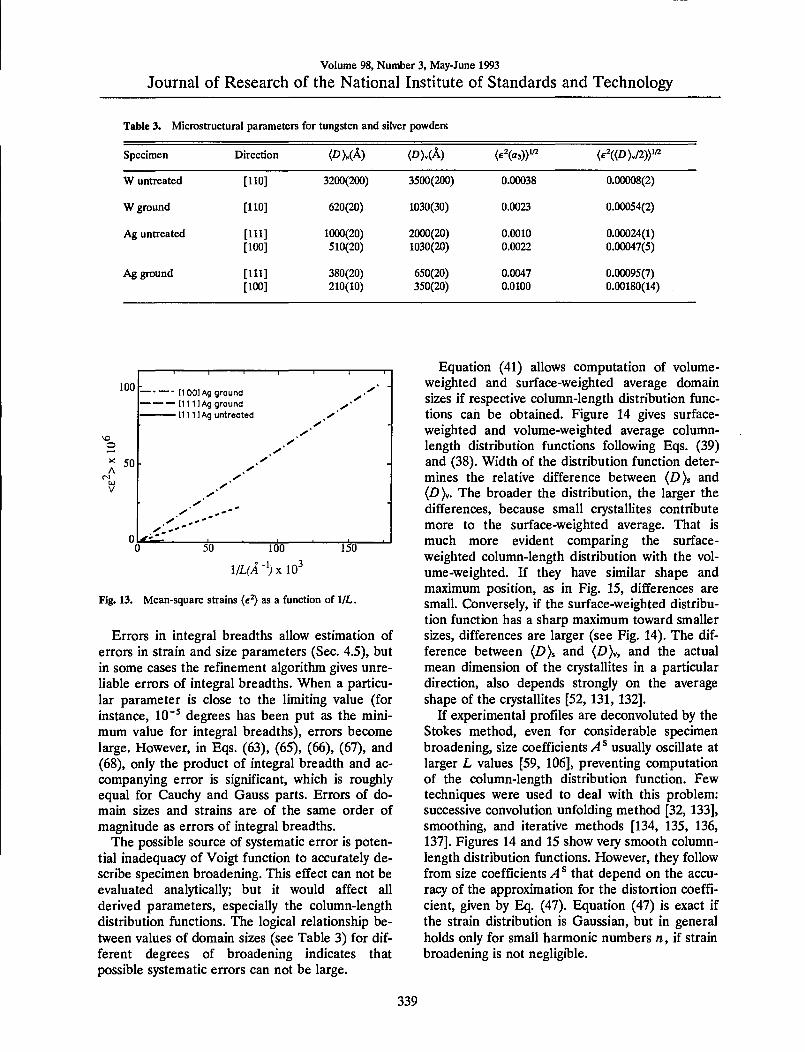
Volume 98 Number 3 May-June 1993
Journal of Research of the National Institute of Standards and Technology
Table 3 Microstructural parameters for tungsten and silver powders
Specimen Direction (poundgt)raquo( A) (2))v(A) ltpound^(fl3))laquo (^laquoD)v2)gtw
W untreated [110] 3200(200) 3500(200) 000038 000008(2)
W ground [110] 620(20) 1030(30) 00023 000054(2)
Ag untreated [111] [100]
1000(20) 510(20)
2000(20) 1030(20)
00010 00022
000024(1) 000047(5)
Ag ground [111] [100]
380(20) 210(10)
650(20) 350(20)
00047 00100
000095(7) 000180(14)
100 -_ - [100) Ag ground ^ ^~ mdash C1111 Ag ground ^bull
y y
o y ^ 50 A y
y y
y
0
y - y ^--
c ) 50 100 150
lLfAjxlO^
Fig 13 Mean-square strains (E^) as a function of VL
Errors in integral breadths allow estimation of errors in strain and size parameters (Sec 45) but in some cases the refinement algorithm gives unre- liable errors of integral breadths When a particu- lar parameter is close to the limiting value (for instance 10^ degrees has been put as the mini- mum value for integral breadths) errors become large However in Eqs (63) (65) (66) (67) and (68) only the product of integral breadth and ac- companying error is significant which is roughly equal for Cauchy and Gauss parts Errors of do- main sizes and strains are of the same order of magnitude as errors of integral breadths
The possible source of systematic error is poten- tial inadequacy of Voigt function to accurately de- scribe specimen broadening This effect can not be evaluated analytically but it would affect all derived parameters especially the column-length distribution functions The logical relationship be- tween values of domain sizes (see Table 3) for dif- ferent degrees of broadening indicates that possible systematic errors can not be large
Equation (41) allows computation of volume- weighted and surface-weighted average domain sizes if respective column-length distribution func- tions can be obtained Figure 14 gives surface- weighted and volume-weighted average column- length distribution functions following Eqs (39) and (38) Width of the distribution function deter- mines the relative difference between (D) and (pound))v The broader the distribution the larger the differences because small crystallites contribute more to the surface-weighted average That is much more evident comparing the surface- weighted column-length distribution with the vol- ume-weighted If they have similar shape and maximum position as in Fig 15 differences are small Conversely if the surface-weighted distribu- tion function has a sharp maximum toward smaller sizes differences are larger (see Fig 14) The dif- ference between (poundgt)s and (D)v and the actual mean dimension of the crystallites in a particular direction also depends strongly on the average shape of the crystallites [52 131 132]
If experimental profiles are deconvoluted by the Stokes method even for considerable specimen broadening size coefficients A ^ usually oscillate at larger L values [59 106] preventing computation of the column-length distribution function Few techniques were used to deal with this problem successive convolution unfolding method [32 133] smoothing and iterative methods [134 135 136 137] Figures 14 and 15 show very smooth column- length distribution functions However they follow from size coefficients ^4^ that depend on the accu- racy of the approximation for the distortion coeffi- cient given by Eq (47) Equation (47) is exact if the strain distribution is Gaussian but in general holds only for small harmonic numbers n if strain broadening is not negligible
339
Volume 98 Number 3 May-June 1993
Journal of Research of the National Institute of Standards and Technology
500 1000 L(A)
Fig 14 Surface-weighted and volume-weighted column-length distribution functions normalized on unit area [111] Ag un- treated (upper) [100] Ag ground (lower)
Fig 15 Surface-weighted and volume-weighted column-length distribution functions for [010] La2Cu04 normalized on unit area
522 La2-xSrtCu04 Powders To test the applicability of the discussed method to more com- plicated patterns two compounds with lower crystallographic symmetry were studied Lai85Sroi5Cii04 has a tetragonal K2NiF4-type struc- ture space group lAlmmm La2Cu04 is orthorhom-
bic at room temperature Both compounds show slight line broadening and relatively highly overlap- ping peaks (see Fig 16) which makes it very diffi- cult if not impossible to perform a Stokes analysis
25
-25
26 (deg)
yNraquo-
Fig 16 Observed points (pluses) refined pattern (full line) convoluted profiles (dashed line) and difference plot (below) for part of La2Cu04 pattern
Tables 4 and 5 list results from the fitting proce- dure and the analysis of specimen-broadened inte- gral breadths There are no qualitative differences in results for tungsten and silver powders How- ever average errors are higher as expected be- cause of overlapping peaks while weighted errors wp are surprisingly smaller This fact illustrates the unreliability of iwp when only a segment of the pat- tern is being refined because it depends on the number of counts accumulated in points as well as on the 28 range of the refinement
Figures 17 and 18 represent Fourier coefficients of Lai85Sroi5Cu04 [110] and La2Cu04 [010] direc- tions In the second plot the A (L )-versus-L plot shows a concave-downward part near L =0 the so- called hook effect It was shown in Sec 42 that the hook effect originates because of underesti- mation of background connected with the trunca- tion of profiles In the profile refinement all peaks separated less than 4deg 20 have been included in the refinement region to avoid possible overlapping of peak tails and specimen profiles have been trun- cated below 01 of the maximum intensity How- ever because the polynomial background was determined prior to profile refinement it may be overestimated for complicated patterns containing many overlapping peaks If background is refined with other profile parameters undesirable correla- tion with integral breadths occurs
340
Volume 98 Number 3 May-June 1993
Journal of Research of the National Institute of Standards and Technology
Table 4 Parameters of the pure-specimen Voigt function as obtained from profile-fitting procedure for La2-^SrCu04 powders
Specimen hid 2Hdeg) Pen PcO FWHM(deg) Rp()
Lai85Sroi5Cu04 004 2695 0046(4) 0024(8) 0042 34 006 4092 0083(5) ltio-= 0053 62 110 3352 0110(5) ltio- 0070 125 220 7046 0171(9) ltio- 0109 43
La2Cu04 004 2713 0061(8) 0045(9) 0067 39 006 4119 0124(7) ltio-^ 0079 77 020 3316 0074(10) 0078(10) 0102 29 040 6957 0210(30) 0026(81) 0135 29 200 3345 0074(8) 0061(10) 0087 69 400 7028 0130(10) 0023(95) 0089 29
Table 5 Microstructural parameters for Laij(5Srai3Cu04 and La2Cu04 powders
Specimen Direction (DUA) Pgt(A) lte^(fl3))laquo lte2((Z)gt2))laquo
Lai83Sro5Cu04
La2Cu04
[001] [110]
[001] [010] [100]
1700(300) 470(20)
1100(100) 680(50) 680(50)
2000(200) 940(20)
1200(100) 760(50) 810(50)
00024 00017
00038 00033 00016
000049(9) 000044(6)
00008(1) 00007(2) 00003(3)
c i ^- raquo sect 08 bulli - U
^0
ti- bull ll bull bullbullo
ffl M P bull- u ^ Di 04 Si - M bulldiamsbullbull a bull-v 3 o ^^=s^
u ^N^Sraquoraquo^
0 ^^^aaaa 1000
L(A) 2000
OQ bullbulldego UM o z a 08
o o bull bull bull
- u u bull raquo UU bull
a diams o bull o u ft 04 bull deg raquo deg - U bull bull deg Oi bullbullgt =3 bull- l o k u
0 bullbullbullraquo aaaMMi
500 1000
L(A)
Fig 17 Fourier coefficients for the first- (pluses) and second- order (crosses) reflection and size coefficients (circles) for [110] Lai^Sroi5Cu04
Fig 18 Fourier coefficients for first- (pluses) and second- order (crosses) reflection and size coefficients (circles) for [010] La2Cu04
341
Volume 98 Number 3 May-June 1993
Journal of Research of the National Institute of Standards and Technology
S3 Comparison with the Integral-Breadth Methods
Knowing the specimen integral breadths simpli- fied methods can be applied In Sec 212 we re- viewed multiple-line and single-line integral- breadth methods We shall compare the simplified multiple-line methods [Eqs (23) (24) and (30)] and the single-line method [76] [Eqs (29) and (30)] with results obtained for silver tungsten and La2-xSrxCu04 powders (Tables 3 and 5) We did not compare with the multiple-line Voigt-function method [26] because it was shown in Sec 44 that it is incompatible with the Warren-Averbach analy- sis In Table 6 integral breadth Pi was computed according to Eq (11) This value was compared with )8A integral breadth computed from Fourier coefficients [58]
i8A=- laquo3 2^(L)
(74)
Results obtained by the Warren-Averbach analysis are significantly smaller for both size and strain Integral-breadth methods give the upper limit for strain so comparison is limited Considering the approximation e = 125e^(L))^ [138] with L=(D)v2 or L=(D)s2 strains resemble more closely than crystallite sizes It must be noted how- ever that this approximation makes sense only in the case of pure-Gauss strain broadening Benedetti et al [106] reported excellent agreement for both size and strain using Warren-Averbach and Cauchy-Gauss [Eq (24)] methods Results from Table 6 on the contrary indicate that the Gauss-Gauss approximation gives values closest to the Warren-Averbach method for crystallite sizes whereas the Cauchy-Gauss and especially the Cauchy-Cauchy approximation tend to give too large values For strain the trend is opposite The Cauchy-Cauchy approximation resembles most
Table 6 Comparison of results obtained with the integral-breadth methods Cauchy-Cauchy (C-C) Cauchy-Gauss (C-G) Gauss- Gauss (G-G) and single-line (S-L) analysis
Specimen hkl PiXKP PAXKP ltigt)v (Z)gt(A) (e^((DV2)gt2 eXlO^ (A-) (A-0 (A) C-C C-G G-G S-L xlO^ C-C C-G G-G S-L
W untreated 110 220
0259 0247
0259 0247
3500 3700 3810 3810 14500 4040
008 -001 -003 -005 024 0
W ground 110 220
125 204
125 205
1030 2240 1450 1220 940 550
054 090 093 105 045 032
Ag untreated 111 2
0600 0901
0600 0900
2000 3340 2390 2190 1670 1110
024 035 039 095 0 0
200 124 124 1030 2270 1470 1230 810 047 082 085 095 0 400 204 204 490 0
Ag ground 111 222
198 352
200 352
650 2080 1240 910 530 280
095 179 182 197 048 0
200 403 406 350 9380 4780 1320 260 180 405 405 408 082 400 803 803 120 0
Lai85Sroi3Cu04 004 006
0657 0881
0650 0880
2000 5230 3290 2660 1970 1140
049 076 078 088 044 0
110 119 119 940 1240 1000 970 840 044 052 064 080 0 220 158 158 630 0
La2Cu4 004 006
0988 132
0998 131
1200 2980 1940 1630 1490 760
08 107 112 127 081 0-
020 143 142 760 1200 910 860 1240 07 079 090 110 114 040 198 200 510 016 200 126 124 810 810 810 810 1250 03 002 011 015 089 400 1S 126 830 014
Not possible to evaluate because of too small Gauss integral breadth
342
Volume 98 Number 3 May-June 1993
Journal of Research of the National Institute of Standards and Technology
closely a Warren-Averbach method These results concur with the Klug and Alexander [24] compari- son of the published size and strain values obtained by Warren-Averbach (Stokes) and integral-breadth methods However for x-ray diffraction the Cauchy-Gauss assumption for the size-strain broadening is theoretically and experimentally more favored thpoundm the other two models The fact that the Gauss-Gauss method for crystallite size and the Cauchy-Cauchy method for strain give more realistic results may mean that the presump- tion that size and strain broadening are exclusively of one type is an oversimplification
The single-line method seems much less reliable If Gaussian breadth is very small no information about strain is obtained Moreover second-order reflections give much lower values of both size and strain than do basic reflections However if multi- ple reflections are not available the single-line method can give satisfactory estimations
54 Reliability of Profile Fitting
The profile fitting of a cluster of even severely overlapping peaks can be accomplished with a low error and excellent fit of total intensity But how reliable is information obtained about separate peaks in the cluster In the fitting procedure it is possible to put constraints on the particular profile parameter to limit intensity position and width of the peak If anisotropic broadening or different phases are present constraints may not be realistic Morever acceptable results can be obtained even using a different number of profiles in refinement [4] Hence the first condition for the successful ap- plication of this method is knowledge of actual phases present in the sample and their crystalline structures
In this regard two powders were measured or- thorhombic Lai94Sroo6Cu04 has a slightly distorted K2NiF4-type structure (space group Bmab a =53510(2) A b =53692 A(2) c = 131931(7) A) and tetragonal Lai76Sro24Cu04 (space group I4mmm a =37711(3) A c = 132580(8) A) Data were collected for each specimen separately and for a specimen obtained by mixing the same pow- ders Because diffracted intensity of each phase was lower for the mixture counting time was pro- portionally increased to obtain roughly the same counting statistics Figure 19 shows two partially separated orthorhombic (020) (200) and (040) (400) peaks overlapped with tetragonal (110) and (220) reflections During the profile fitting of the mixed powders (200) orthorhombic peak tended to disappear on account of neighboring (020) and
(110) reflections Its intensity was constrained to vary in range plusmn 30 of (020) peak intensity which can be justified if the crystallographic structure is known
60
-60
345
345
335 29 (deg)
345
Fig 19 (upper) Lai76Sro24Cu04 (110) peak (middle) Lai94Sroo6Cu04 (020) and (200) peaks (lower) (110) (020) and (200) peaks
Table 7 contains results of fitted specimen-Voigt functions as well as size and strain values obtained by the analysis of broadening Comparing integral breadths of the starting and mixed powders some profiles change from more Cauchy-like to Gauss- like and vice versa This is especially evident for the (400) reflection meaning that accurate deter- mination of the profile tails is indeed affected in the cluster of overlapping peaks However integral breadth does not change significantly so results of
343
Volume 98 Number 3 May-June 1993
Journal of Research of the National Institute of Standards and Technology
Table 7 Comparison between two specimens run separately and mixed togetlier
Specimen hkl 2Hdeg) )3cO PoO DUA) (D)v(A) (e2laquoD)v2))laquoxlO
Lai76Sroj4CuOr 110 3369 0058(6) 0094(7) 780(60) 850(60) 10(1) 220 7073 022(2) 013(2)
LaiMSro(KiCu04 020 3342 0084(9) 055(14) 500(90) 1000(200) 07(1) 040 7012 010(2) 014(1) 200 3353 00216(85) 0061(8) 1100(100) 1200(100) 03(1) 400 7040 0026(11) 0088(8)
Mix 110 3367 0083(21) 0064(14) 800(300) 1200(300) 08(3) Lai76Sro24Cu04 220 7072 019(7) 013(4)
+ 020 3343 0066(35) 0070(23) 800(300) 1000(300) 07(4) Lai94Sroo6Cu04 040 7012 0116(93) 013(5)
200 3354 0024(156) 0071(61) 900(700) 1000(600) 04(12) 400 7041 011(2) 0003(320)
the multiple-line methods are not much influenced On the contrary the single-line method gives quite different results This may support the conclusion of Suortti Ahtee and Unonius [43] that the Voigt function fails to account properly for size and strain broadening simultaneously if only Cauchy integral breadth determines crystallite size
Table 7 shows that the results of Warren- Averbach analysis of starting and mixed powders agree in the range of standard deviations How- ever errors are much larger especially for the hid- den (200)-(400) reflections From Eq (62) it follows that more counts (longer counting times) and more observables (smaller step-size) would lower standard deviations Therefore in the case of highly overlapping patterns to obtain desirable ac- curacy much longer measurements are needed al- though that will not change the fact that higher overlapping implies intrinsically higher errors of all refinable parameters To further minimize possible artifacts of the fitting procedure it is desirable to include in the analysis as many reflections in the same ciystallographic direction as possible
55 Remarks
By modeling the specimen size and strain broad- ening with the simple Voigt function it is possible to obtain domain sizes and strains that agree with experiment and show a logical interrelationship Furthermore the Voigt function shows the correct 1A(26y asymptotic behavior of peak tails as ex- pected from kinematical theory [139] However if the specimen profile is significantly asymmetric (because of twins and extrinsic stacking faults [140 59]) or the ratio FWHM^ is not intermediate to the Cauchy (2Tr) and Gauss (2(ln27r)^) functions then the Voigt function can not be applied [25]
Suortti Ahtee and Unonius [43] found good over- all agreement by fitting the Voigt function to the pure-specimen profiles of a Ni powder deconvo- luted by the instrumental function However more accurate comparison is limited because of unavoid- able deconvolution ripples of specimen profiles Furthermore the Voigt function might not be flex- ible enough to model a wide range of specimen broadening as well as the different causes of broadening Therefore the question whether the Voigt function can satisfactorily describe complex specimen broadening over the whole 20 range in a general case needs further evaluation
This method of Fourier analysis with the as- sumed profile-shape function is most useful in cases when the classical Stokes analysis fails there- fore when peak overlapping occurs and specimen broadening is comparable to instrumental broaden- ing It was shown that for a high degree of peak overlapping the fitting procedure can give unreli- able results of Gauss and Cauchy integral breadths that is the peak can change easily from predomi- nantly Cauchy-like to Gauss-like and contrary This can lead to illogical values of size-integral and strain-integral breadths according to Eqs (52) (53) (54) and (55) and to irregularities in the be- havior of Fourier coefficients for large L Simulta- neously if the size-broadened profile has a large Gauss-function contribution the hook effect will occur However volume-weighted domain sizes D)y and MSS eL)) for small L are much less affected because they rely on both Cauchy and Gauss parts of the broadened profile Any integral- breadth method that attempts to describe the size and strain broadening exclusively by a Cauchy or Gauss function in this case fails completely For specimens with lower crystallographic symmetry
344
Volume 98 Number 3 May-June 1993
Journal of Research of the National Institute of Standards and Technology
when many multiple-order reflections are avail- able but the peaks are overlapped it is therefore desirable to include in the analysis as many reflec- tions as possible to minimize the potential artifacts of the fltting process
6 Analysis of Superconductors 61 (La-M)2Cu04 Superconductors
Bednorz and Miiller [16] found the first high- temperature oxide superconductor in the La-Ba- Cu-O system Soon after substituting Ba with Sr and Ca Kishio et al [17] found superconductivity in two similar compounds Later many compounds with much higher transition temperatures (Tc) were found The (La-M)2Cu04 system remains favorable for study because the cation content responsible for the superconductivity is easier to control and measure than the oxygen stoichiometry Also this system provides a wide range of substitutional cation solubility in which the tetragonal K2NiF4- type structure is maintained Compared with much- studied Y-Ba-Cu-O this structure is simpler because it contains only one copper-ion site and two oxygen-ion sites
The undoped compound La2Cu04 is orthorhom- bic at room temperature It becomes superconduct- ing either with cation substitution on La sites or increased oxygen content to more than four atoms per formula unit Doping with divalent cations in- creases the itinerant hole carriers in the oxygen- derived electron band [141] which probably causes the superconductivity However different dopants influence the transition temperature Tc Although the unit-cell c-parameter simply reflects ionic dopant size [142] the in-plane unit-cell parameter (and accordingly the Cu-0 bond length) correlates with Tc for different dopants and for different dop- ing amounts [142 143]
LaiB5MouCu04 (M = Ba Ca Sr) have a tetrago- nal K2NiF4-type structure space group lAlmmm with four atoms in the asymmetric unit [117] One site is occupied with La partially substituted with dopant ions (Fig 20) La2Cu04 is orthorhombic at room temperature The best way to correlate these two structures is to describe La2Cu04 in space group Bmab the c axis remains the same tetrago- nal [110] and [110] directions become [010] and [100] orthorhombic axes and size of the unit cell is doubled [144]
Figure 21 shows parts of the x-ray diffraction patterns observed and refined of Lai85Moi5Cu04 (M = Sr Ba Ca) and La2Cu04 Refined lattice
parameters are given in Table 8 Table 9 shows resuhs of the line-broadening analysis Relatively
La(BaCaSr)
0(2)
0(1)
Fig 20 Ciystal structure of (La-M)2Cu04 showing one unit cell
300 JUU
(b)
200
100
U 0 M J Js-r-^
30
-30
300
40 41 42 43 44 45 40 41 42 43 44 45 29 (deg) 29 (deg)
mdashA-
gt t 200
Z
F-
- 100
(c)
f V kgt ii I 40 41 42 43 44 45 40 41 42 43 44 45
e (deg) ^^ 26 (deg)
-30 wwX mdash Wlaquo-
Fig 21 Diffraction patterns of LaiH5Moi5Cu04 specimens (a) M=Sr (b) M = Ba (c)M = Ca (d) M = U
345
Volume 98 Number 3 May-June 1993
Journal of Research of the National Institute of Standards and Technology
Table 8 Lattice parameters and T^ at zero resistivity (Ac method at 10 Ma current)
Specimen a (A) bk) c(A) rc(K)
Lairaquo5Sroi5Cu04 377814(7)
Lairaquo3Baoi3Cu04 37846(2)
LaiiijCaoi5Cu04 37863(7)
La2Cu04 53558(2) 54053(2)
231(2) 36
288(4) 28
17(2) 19
1451(8)
Table 9 Results of line-broadening analysis for (La-M)2Cu4 specimens
Specimen hkl PcO PoO (DUk) (Iraquo)(A) lte^((D)2))
Lai(laquoSroj5Cu04 004 006
0046(4) 0083(5)
0024(8) ltio-
1700(300) 2000(200) 000049(9)
110 0110(5) ltio- 470(20) 940(20) 000044(6) 220 0171(9) ltio-
Lai85Baoi3Cu04 004 006
0049(6) 0110(7)
0076(6) 0089(9)
1100(200) 1100(100) 00011(2)
110 0087(4) 000042(6) 560(20) 1110(20) 000024(5) 220 0116(3) ltio-5
Laiji5Caoi5Cu04 004 006
0120(13) 0146(12)
0032(22) 0033(27)
440(70) 780(90) 00007(4)
110 0045(25) 0200(19) 340(30) 360(20) 00013(2) 220 0343(22) ltio-
La2Cu04 004 006
0061(8) 0124(7)
0045(9) ltio-
1100(100) 1200(100) 00008(1)
020 0074(10) 0078(10) 680(50) 760(50) 00007(2) 040 0210(30) 0026(81) 200 0074(8) 0061(10) 680(50) 810(50) 00003(3) 400 0130(10) 0023(95)
weak peak broadening was observed which can not be attributed to the proximity of the phase trans- formation Lai85SroisCu04 is tetragonal down to = 170 K [145] Lai85Baoi5Cu04 to 140 K [146147] and Lai85Caoi5Cu04 to 130 K [148] Another possi- ble reason for peak broadening might be continu- ous compositional variations in dopant content The scanning Auger microprobe analysis of La2-SrtCu04 compounds [149] showed that grain- boundary segregation of Sr is weak and limited to a narrow region near the grain surface In the case of the separation of two phases with different Sr con- tent and similar lattice parameters asymmetry of some reflections would be observed [150] More- over in the case of compositional inhomogeneity microstrains eL)) would be roughly independent of the averaging distance L in the grains [151] therefore distribution of strains would be Gaus- sian For all specimens microstrain behavior is identical it decreases linearly with distance L
Rothman and Cohen [115] showed that such be- havior of microstrains is caused by dislocations that might arise during grinding Assuming the same applied stress microstrain would be approximately inversely proportional to the elastic moduli of these materials If mean microstrain is defined as the arithmetic average of strains for the [001] and [110] directions results agree with values of the Youngs moduli for polycrystalline La2Cu04 Lai85Moi5Cu04 (M = Sr Ba Ca) [152] However other factors may contribute to the microstrain Coordination-6 ionic radii of La^+ Sr Ba^+ Ca^+ are 106 116 136 100 A respectively [153] Substitution of La with ions of different sizes affects the lattice parameter [142] and may cause much larger strains in the [001] direction when some of the ions are replaced with Ba^ than with Sr^ in accord with results in Table 9 Substitution of Ca^^ ions produces an entirely different effect microstrains in the [110] direction are larger This may be explained by
346
Volume 98 Number 3 May-June 1993
Journal of Research of the National Institute of Standards and Technology
comparing effects of substitutional ions on the unit-cell a -parameter The Ba-doped specimen has a larger a-parameter than the Sr-doped but the Ca-doped a-parameter is largest although Ca^^ has the smallest ionic size This should increase the cell distortion in the a-b plane
Table 9 reveals high anisotropy in these materi- als consistent with other physical properties such as thermal expansion [154] and upper critical mag- netic field [155] Differences of domain sizes might arise from a layered structure in the [001] direction and consequently easy incorporation of stacking faults between regularly stacked layers The stack- ing-fault and twin-fault probabilities can be esti- mated from the average surface-weighted domain sizes [59]
^ = TAN + cf1fun(aa) (75) m im - (D)
Here c is a constant for the particular [hkl] direction and fun(a a) a linear combination of stacking-fault probability and twin-fault probability a The exact form of Eq (75) was derived only for the cubic and hexagonal crystal structures On con- dition that the true domain dimension D is isotropic or so large that the second term of Eq (75) dominates a linear function of stacking-fault and twin-fault probability is
fun(aa) = c( 1
) (76) Zgt)J (Dgttrade
Here c denotes a constant that depends only on geometrical factors and is the same for all three doped compounds
Figure 22 shows a possible correlation between Tc and fault-defect probabilities computed from TEM observations of La2-jcSrCu04 revealed that stacking-fault density increased with Sr content up to jc = 015 [156] That study suggests that a shear mechanism forming the fault-boundary dislocations implies oxygen vacancies andor cation deficiency We did not measure oxygen content but neutron- diffraction studies showed that oxygen deficiency starts to appear at much higher Sr content [157] However the increase of fault probability with the simultaneous decrease of microstrain in Fig 22 supports the assumption that defects are intro- duced to accommodate lattice strains [156] A simi- lar increase in Te was found in Y2Ba4Cu802o-laquo thin films [158] Compounds with asymmetric broad- ened and shifted peaks showed higher Tc which
was attributed to stacking faults Although extrinsic stacking faults may cause asymmetric peak broad- ening [140] it is probably caused by twinning Twinning in La-M-Cu-0 materials is less abundant than in Y-Ba-Cu-O compounds but it was ob- served in (La-Sr)2Cu04 monocrystals on (110) planes [159] In the profile-fitting procedure peak asymmetry is incorporated only in the instrumental function therefore we could not model asymmetric peak broadening However any significant asym- metry of the specimen profile would cause an un- even fit of low-angle and high-angle sides of peaks which was not observed This gives much more im- portance to stacking faults in Eq (76)
Fig 22 Arithmetic average of [110] and [001] root-mean- square strains and linear function of stacking-fault and twin- fault probabilities as a function of Tc
In Fig 22 average microstrains defined as the arithmetic average of [001] and [110] directions correlate inversely with Tc However we did not find a correlation of Tc and microstrains in a partic- ular direction [001] microstrains simply reflect dif- ference in size of dopant and host La^ ions (see Table 9)
In La2Cu04 (OkO) reflections are significantly broader than (hOO) This has also been observed in low-temperature orthorhombic Lai85Sroi5Cu04 and Lai85Baoi5Cu04 [160] and explained by either stacking faults or possible lower symmetry Our results reveal that domain sizes (D) have identical values for [010] and [100] directions (Table 9) From Eq (76) it follows that stacking-fault proba- bilities in these directions have the same values However microstrains in the [010] direction are roughly twice as large as in the [100] direction which is responsible for the different broadening In the case of doped La2Cu04 compounds different microstrains might be caused by oxygen
347
Volume 98 Number 3 May-June 1993
Journal of Research of the National Institute of Standards and Technology
vacancies ordered along one direction in the a-b plane similar to effects found in YBa2Cu307-laquo However undoped La2Cu04 is not expected to have significant o^Qgen deficiency Other possibili- ties are lower ciystallographic symmetry andor La vacancies although they were not reported for this system but La deficiency was found in an La2Co04 compound [161]
We can conclude that lattice strains and incoher- ently diffracting domain sizes confirm high an- isotropy in these materials This simple approach however does not allow unambiguous identifica- tion of the strains origin Probably the strains originate from dislocations and from different sizes of host and dopant ions Domain sizes of all com- pounds are larger in the c-direction than in the a-6 plane This indicates existence of stacking faults and twins However because estimated errors are relatively large and only three materials were stud- ied the possible connection between stacking faults and 7c needs further study
62 Bi-Cu-O Superconductors
Among the high-Tc superconductors the Bi- Cu-O compounds appear intriguing especially because their incommensurate structure modula- tion remains incompletely understood [162 163] The crystal structure consists of perovskite-like SrO-(Cu02Ca)mi-Cu02-SrO layers separated by NaCl-like BiO double layers (see Fig 23 [164]) The number m of Cu02 layers alters the supercon- ducting transition temperature Tc (for m = 12 and 3 rclaquo10 90 and 110 K respectively) This two- dimensional layered structure makes these materi- als highly anisotropic and favours the creation of defects
Bulk sintered specimens showed relatively weak peak broadening Moreover the diffraction pat- terns contained many overlapping peaks because the compound crystallizes in an orthorhombic low- symmetry space group A2aa [165] and incommen- surate modulation gives superlattice reflections All patterns revealed a strong [001] texture (Fig 24) making reflections other than (001) difficult to ana- lyze The lattice parameters vary depending on the exact compound stoichiometry and processing his- tory but characteristically they have almost identi- cal a and b parameters and large c parameter fl =54095 A 6=54202 A c =309297 A for Bi2Sr2CaCu208 (Bi-2212 [166] and A =5392 A b =5395 A c =36985 A for (BiPb)2Sr2Ca2Cu30io (BiPb-2223) [165] Thus we treated (hOO) and (0^0) reflections as single peaks Table 10 gives the
results for three specimens Bi-2212 (BiPb)2 (SrMg)2(BaCa)2Cu30io (BiPbMgBa-2223) which were one-phase specimens and BiPb-2223 con- taining approximately equal amounts of 2212 and 2223 phases The in-plane lattice parameters of 2212 and 2223 phases differ little hence only the [00] directions of the mixed-phase specimen were evaluated
b^ (c)
Fig 23 Average crystal structure of Bi2Sr2Cam-iCum04+2m for (a) m = 1 (b) w =2 (c) m =3 [164]
35
-35
42 44 46 48 50 52 54 56 58 60 62 26 (deg)
^ ^^^MK^Aa^Ndllaquop
Fig 24 Part of BiPbMgBa-2223 refined pattern There are 48 fundamental reflections in this region
Interpretation of the results in the case of these complicated compounds must be considered care- fully Microstrains are probably caused by disloca- tion arrays However substitution of different-sized ions and vacancies would also contribute to the strains as would other kinds of disorder especially
348
Volume 98 Number 3 May-June 1993
Journal of Research of the National Institute of Standards and Technology
Table 10 Results of line-btoadening analysis for Bi-Cu-O supreconductors
Specimen Phase hkl (A)
eD)sa)y^
Bi-2212 2212 008 0012
0163(8) 022(3)
001(6) 005(6)
420(80) 00021(6)
020+200 0104(4) ltio-^ 580(30) 00007(1) 040+400 018(2) 00004(6300)
BiPbMgBa-2223 7773 0010 0020
0097(1) 021(2)
00002(1700) 0007(150)
770(60) 00012(1)
020 + 200 012(27) 013(10) 380(430) 00009(71) 040 + 400 015(95) 021(33)
BiPb-73 2212 008 0012
023(2) 025(5)
0002(350) 0001(1000)
220(30) 00013(26)
2223 0010 0020
022(8) 023(99)
0092(67) 018(47)
230(190) 00012(197)
Stacking faults and twins Table 10 shows larger strains in the [001] direction that in the basal plane This can be explained by stacking disorder along the c-axis which was frequently observed in electron-diffraction patterns as streaking [167 168] Easy incorporation of stacking faults is possi- ble because of the two-dimensional weak-bonded layers (BiO double layers are spaced about 3 A apart) The difference in microstrain between in- plane and the c-direction is much smaller for the BiPbMgBa-2223 phase probably because Pb low- ers the faulting by stabilizing the higher-Tc 2223 phase [167] For the BiPb-2223 specimen with two phases there are two possibilities Either the speci- men consists mainly of a mk of two kinds of one- phase grains or both phases occur within the same grains The second possibility was confirmed exper- imentally [169 170] and our results concur be- cause microstrain in the 2212 phase is much smaller than in the one-phase Bi-2212 specimen Processing conditions and cation content probably favour development of the macroscopic inter- growth of both phases within the grains that is microscopic defects grow to sufficiently large re- gions to give a diffraction pattern of another phase with the different number of Cu02 layers As a re- sult strain is relieved and both strains and domain sizes being quite different in one-phase specimens tend to equalize
For the Bi-Cu-O specimens the mean surface- weighted domain sizes are generally smaller than for (La-M)2Cu04 compounds Therefore the com- putation of the stacking- and twin-fault probabili- ties by using Eq (75) may be wrong It would be very instructive to compare the different broaden-
ing of satellite and fundamental reflections which indicates a more pronounced stacking disorder in the modulated structure [171]
In summary we found that for both Bi-2212 and BiPbMgBa-2223 superconductors the c-axis strain exceeds the in-plane strain The BiPb-2223 specimen containing both 2212 and 2223 phases within the single grains shows smaller incoherently diffracting domains and lower c-axis strain than the one-phase specimens This fact may direct us to- ward the mechanism of the second-phase forma- tion in these materials
63 Remarks
It was shown that this particular method of the line-broadening analysis can give information about the size of incoherently diffracting domains and lattice strains in (La-M)2Cu04 and Bi-Clu-O superconductors Moreover results show high an- isotropy of both size and strain parameters as one may expect because of the layered structure of all superconducting cuprates Generally structural line broadening is not large that is a result of rela- tively large domain sizes (200-2000 A) and small strains (002-02) It is interesting to compare these values with the published results for YBa2Cu307-laquo (isotropic strains of 023 [77] and 005-03 [82]) Although the different materi- als were studied they seem too large especially be- cause they are the average of strains in different directions
The main drawback of the line-broadening the- ory is the uncertainty about the origins of the line broadening that is it is difficult to distinguish the main effects responsible for the broadening For
349
Volume 98 Number 3 May-June 1993
Journal of Research of the National Institute of Standards and Technology
the novel superconductors particularly the numer- ous defects (substitutions vacancies stacking faults dislocations and similar) can occur simulta- neously which makes it very difficult to determine their individual contributions Furthermore the crystal structures of most novel superconductors are relatively complicated The average structure has mostly a slightly distorted tetragonal symmetry very similar a and b lattice parameters and a large c parameter but c=36 for YBa2Cu307-laquo for in- stance This results in a large number of overlap- ping peaks and consequently in large errors of all results This showed especially in the case of Bi-Cu-O superconductors (see Table 10) Follow- ing the discussion of reliability of profile fitting in Sec 54 it would be desirable to include more than two reflections in the analysis of broadening but higher-order peaks are usually too weak and over- lapped One way to partially solve this problem would be a whole pattern fitting [172 173] and Rietveld structure refinement [23] in terms of size and strain parameters This requires an accurate preset function to model specimen broadening and precise definition of angular dependence of size and strain parameters The Rietveld programs that model the line broadening in terms of size and strain parameters are based either on the simpli- fied integral-breadth methods [78 95] or on the single-line method [174]
7 Conclusions
A method for analyzing the pure-specimen (structural) broadening of x-ray diffraction line profiles is proposed By modeling the specimen size and strain broadenings with the simple Voigt func- tion it is possible to obtain domain sizes and strains that agree with experiment and show a logi- cal interrelationship Furthermore some common consequences and problems in the Fourier-method analysis follow easily The specimen function is convoluted with the instrumental function to match the observed x-ray diffraction-line profile This avoids the Stokes deconvolution method thus al- lowing analysis of patterns with highly overlapping peaks and weak structural broadening Therefore the method was applied to some novel high-Tc superconductors We reached the following conclu- sions
(i) Surface-weighted domain size depends only on the Cauchy integral breadth of the size-broad- ened profile
(ii) The hook effect occurs when the Cauchy-content of the size-broadened profile is un-
derestimated that is for ^sc(n2)^3sG Usually this happens when the background is estimated too high so the long tails of the Cauchy function are prematurely cut off
(iii) It also follows from conclusion (ii) that the volume-weighted domain size can not be more than twice the surface-weighted domain size (limiting value D)v=2D)i is obtained for the pure-Cauchy size-broadened profile) Minimum value for D)J (D)j should not be less than -131
(iv) If the distortion coefficient is approxi- mated with a harmonic term this leads exactly to the Warren-Averbach method of separation of size and strain broadenings
(v) In that case mean-square strains decrease linearly with the distance L
(vi) It is possible to evaluate local strain ((e^(0))^) only in the case of pure-Gauss strain broadening Then root-mean-square strain is inde- pendent of the distance L and related to the upper limit of strain obtained from the integral breadth of the strain-broadened profile
(vii) If strain broadening is not described exclu- sively with the Gauss function the multiple-line Voigt integral breadth and Warren-Averbach analyses can not give the same results for volume- weighted domain size although D)v is defined identically in both approaches because the appar- ent strain -q = pdeg(29)cot9 is not angular- independent
(viii) Smooth size coefficients give column- length distribution functions without oscillations and make possible a computation of volume- weighted average domain sizes up to ~5000 A
(ix) Comparison with the simplified integral- breadth methods in most cases has shown not large but systematic discrepancy of results indicat- ing that size and strain broadening can not be accu- rately modeled by a single Cauchy or Gauss function Moreover the application of the single- line method is much less reliable and it should not be used where multiple reflections are available
(x) The knowledge of all phases present in the sample and their crystallographic structure is re- quired to successfully fit a cluster of overlapping peaks Although it is very difficult to accurately de- termine the Cauchy-Gauss ratio of an overlapped peak final results of domain size and strain are much less affected Therefore connecting the crys- tallite size exclusively with the Cauchy content and strain with the Gauss content of a specimen profile might be doubtful
(xi) Evaluated errors of domain sizes and strains increase substantially with the degree of
350
Volume 98 Number 3 May-June 1993
Journal of Research of the National Institute of Standards and Technology
peak overlapping Hence for complicated patterns very accurate measurements are necessary and one needs to analyze as many reflections in the same crystallographic direction as possible
(xii) Line-broadening analysis of (La-M)2Cu04 and Bi-Cu-O compounds confirms high anisotropy in these materials
(xiii) Strains in (La-M)2Cu04 probably origi- nate from dislocations and from different sizes of host and dopant ions
(xiv) Stacking-fault probability in (La-M)2Cu04 (M = Ba Ca Sr) increases with increasing Tc whereas the average strain decreases
(xv) In La2Cu04 different broadening of (lOO) and (OfcO) reflections is not caused by stacking faults
(xvi) All Bi-Cu-0 superconductors show larger strain in the c-direction than in the a-b plane which can be explained by stacking disorder along the [001] direction
(xvii) In the specimen with approximately equal amounts of Tl-2212 and TlPb-2223 phases it is likely that a secondary phase develops by the growth of the microscopic faulted regions of the primary phase
Acknowledgments
I am thankful to Dr Harry McHenry for his support and especially to Dr Hassel Ledbetter for his wise guidance and most useful help during my stay at NIST I am also indebted to my home insti- tution the Faculty of Metallurgy of the University of Zagreb for allowing me the leave of absence at NIST
8 References
[1] W Friedrich P Knipping and M v Laue Ann Physik 41 971 (1912)
[2] H M Rietveld Acta Cryst 22 151 (1967) [3] H M Rietveld J Appl Cryst 2 65 (1969) [4] S A Howard and K D Preston in Modern Powder Dif-
fraction Vol 20 The Mineralogical Society of America Washington DC (1989) p 217
[5] D Taupin J Appl Cryst 6 266 (1973) [6] T C Huang and W Parrish Appl Phys Lett 27 123
(1975) [7] M K Wu J R Ashburn C J Torng P H Hor R L
Meng L Gao Z J Hwang Y Q Wang and C W Chu Phys Rev Lett 58 908 (1987)
[8] D Shi MRS Bull 16 37 (1991) [9] D Larbalestier Phys Today 44 74 (1991)
[10] J C Phillips Phys Rev B 4512647 (1992) [11] B Raveau Phys Today 45 53 (1992) [12] A J Millis and K M Rabe Phys Rev B 38 8908 (1988)
[13] F Guinea Europhys Lett 7 549 (1988) [14] C P Dhard and P Singh in Proc Int Symp High-Temp
Supercond Jaipur India Oxford amp IBH Publishing New Delhi (1988) p 271
[15] J D Jorgensen Phys Today 44 34 (1991) [16] J G Bednorz and K A Muller Z Phys B 64 189
(1986) [17] K Kishio K Kitazawa S Kaube I Yasuda N Sugii H
Takagi S Uchida K Fueki and S Tanaka Chem Lett 429 (1987)
[18] J D Jorgensen B Dabrowski S Pei D G Hinks L Soderholm B Morosin J E Venturini and D S Ginley Phys Rev B 38 11337 (1988)
[19] J R Clem Phys Rev B 43 7837 (1991) [20] M Paranthaman M Foldejiki D Balzar H Ledbetter
A J Nelson and A M Hermann submitted to Phys Rev B
[21] A R Stokes Proc Phys Soc Lond 61 382 (1948) [22] B E Warren and B L Averbach J Appl Phys 23 497
(1952) [23] R Delhez Th H de Keijser and E J Mittemeijer in
Accuracy in Powder Diffraction S Block and C R Hub- bard eds Natl Bur Stand (US) Special Publication 567 (1980) p 213
[24] H P Klug and L E Alexander X-ray Diffraction Proce- dures 2nd Edition John Wiley New York (1974) p 661
[25] J I Langford J Appl Ciyst 11 10 (1978) [26] J I Langford in Accuracy in Powder Diffraction S
Block and C R Hubbard eds Natl Bur Stand (US) Special Pubication 567 (1950) p 255
[27] R Delhez Th H de Keijser and E J Mittemeijer Fre- senius Z Anal Chem 312 1 (1982)
[28] A J C Wilson Proc Phys Soc Lond 80 286 (1962) [29] A J C Wilson Proc Phys Soc Lond 81 41 (1963) [30] L P Smith Phys Rev 46 343 (1934) [31] H C Burger and P H van Cittert Z Phys 79 722
(1932) [32] S Ergun J Appl Ciyst 1 19 (1968) [33] R Croche and L Gatineau J Appl Ciyst 10479 (1977) [34] L H Schwarz and J B Cohen Diffraction from Materi-
als Academic Press New York (1977) p 391 [35] R Delhez Th H de Keijser E J Mittemeijer and J I
Langford J Appl Cryst 19 459 (1986) [36] R Delhez Th H de Keijser E J Mittemeijer and J I
Langford Aust J Phys 41 213 (1988) [37] R A Young and D B Wiles J Appl Cryst 15 430
(1982) [38] W Voigt Stizungsber K Bayer Akad Wiss 42 603
(1912) [39] E E Whiting J Quant Spectrosc Radiat Transfer 8
1379 (1968) [40] G K Wertheim M A Butler K W West and D N E
Buchanan Rev Sci Instrum 111369 (1974) [41] M M Hall Jr V G Veeraraghavan H Rubin and P G
Winchell J Appl Cryst 10 66 (1977) [42] A Brown and J W Edmonds Adv X-Ray Anal 23 361
(1980) [43] P Suortti M Ahtee L Unonius J Appl Cryst 12 365
(1979) [44] T Sundius J Raman Spectrosc 1 471 (1973) [45] B H Armstrong J Quant Spectrosc Radiat Transfer 7
61 (1967) [46] J F Kielkopf J Opt Soc Am 63 987 (1973) [47] B P Asthana and W Kiefer Appl Spectr 36 250
(1982)
351
Volume 98 Number 3 May-June 1993
Journal of Research of the National Institute of Standards and Technology
[48] J P M de Vreede S C Mehrotra A Tal and H A Dijkerraan Appl Spectr 36 227 (1982)
[49] F R L Schoening Ada Ciyst 18 975 (1965) [50] P Scherrer Gott Nachr 2 98 (1918) [51] A R Stokes and A J C Wilson Proc Cambridge
Philos Soc 38 313 (1942) [52] A J C Wilson X-Ray Optics 2nd edition Methuen
London (1962) [53] S Leie and T R Anantharaman Proc Indian Acad
Sci Sect A H 261 (1966) [54] D Louer D Weigel and J I Langford J Appl Ciyst
5 353 (1972) [55] A J C Wilson J Appl Ciyst 2 181 (1969) [56] J I Langford and A J C Wilson J Appl Ciyst 11102
(1978) [57] A R Stokes and A J C Wilson Proc Phys Soc Lond
56174 (1944) [58] B E Warren and B L Averbach J Appl Phys 21 595
(1950) [59] B E Warren X-Ray Diffraction Addison-Wesley
Reading Massachusetts (1969) p 264 [60] B E Warren in Progress in Metal Physics Vol 8 Perg-
amon Press London (1959) p 146 [61] F Bertaut C R Acad Sci Paris 228 187 (1949) [62] N C Haider and C N J Wagner Acta Cryst 20 312
(1966) [63] D Balzar and H Ledbetter in Proceedings of the Accu-
racy in Powder Diffraction II Natl Inst Stand Technol (1992) p 37
[64] D Balzar and H Ledbeter J Appl Cryst 26 (1993) in press
[65] J N Eastabrook and A J C Wilson Proc Phys Soc Lond B 65 67 (1952)
[66] R S Smith IBM J Res Develop 4 205 (1960) [67] B Y Pines and A F Sirenko Soviet Physics Ciyst 715
(1962) [68] G B Mitra and N K Misra Acta Ciyst 22 454 (1967) [69] A Gangulee J Appl Ciyst 7 434 (1974) [70] J Mignot D Rondot Acta Met 231321 (1975) [71] J Mignot and D Rondot Acta Ciyst A 33 327 (1977) [72] R K Nandi H K Kuo W Schlosberg G Wissler J B
Cohen and B Crist Jr J Appl Ciyst 17 22 (1984) [73] M Zocchi Acta Ciyst A 36164 (1980) [74] P Ramarao and T R Anantharaman Trans Ind Ins
Metals 18 181 (1965) [75] R K Nandi and S P Sen Gupta J App Cryst 11 6
(1978) [76] Th H de Keijser J I Langford E J Mittemeijer and
B P Vogels J Appl Ciyst IS 308 (1982) [77] A Williams G H Kwei R B Von Dreele A C Lar-
son L D Raistrick and D L Bish Phys Rev B 37 7960 (1988)
[78] A C Larson and R B Von Dreele Los Alamos Na- tional Laboratory Report No LA-UR-86-748 (1988)
[79] J D Jorgensen D H Johnson M H Mueller J G Worlton and R B Von Dreele in Proceedings of the Conference on Diffraction Profile Analysis Cracow Poland (1978) p 20
[80] R B Von Dreele J D Jorgensen and C G Windsor J Appl Ciyst 15 581 (1982)
[81] P Thompson D E Cox and J B Hastings J Appl Ciyst 20 79 (1987)
[82] J P Singh R A Guttschow D S Kupperman J T Dusek and R B Poeppel in High Temperature Super-
conducting Compounds III S Whang A Gupta and E Ceilings eds TMS AIME Warrendale (1991) p 281
[83] M O Eatough D S Glnley and B Morosin Adv X- Ray Anal 33 145 (1990)
[84] E J Peterson P J Kung R E Muenchausen and D M Smith in Proceedings of the 41st Annual Denver Conference on Applications of X-Ray Analysis Colo- rado Springs Colorado (1992) p 74
[85] M Rand J I Langford and J S Abell submitted to J Cryogenics (1992)
[86] D Balzar J Appl Ciyst 25 559 (1992) [87] D Balzar H Ledbetter and A Roshko Physica C 185-
189 871 (1991) [88] D Balzar and H Ledbetter J Mater Sci Lett 111419
(1992) [89] D Balzar H Ledbetter and A Roshko Pow Diffr 8
(1993) in press [90] S Johnson M Gusraan D Rowcliffe T Geballe and J
Sun Adv Ceram Mater 2 337 (1987) [91] H Ledbetter S A Kim R B Goldfarb and K Togano
Phys Rev B 39 9689 (1989) [92] H Friedman Electronics 132 (1945) [93] W Parrish (ed) in Advances in X-Ray Diffractometry
and X-Ray Spectrography Centrex Publishing Company Eindhoven The Netheriands (1962)
[94] W Soller Phys Rev 24158 (1924) [95] S A Howard R L Snyder J Appl Ciyst 22 238
(1989) [96] G H Stout and L H Jensen X-Ray Structure Determi-
nation 2nd edition Wiley New York (1989) p 373 [97] D E Appleman and T Evans Jr Final Report 92-14
US Geological Survey Washington DC (1973) Avail- able as NTIS Document No PB-216188
[98] M U Cohen Rev Sci Instrum 6 68 (1935) [99] M U Cohen Rev Sci Instrum 7 155 (1936) [100] M H Mueller L Heaton and K T Miller Acta Ciyst
13 828 (1960) [101] R A Young P E Mackie and R B Von Dreele J
Appl Ciyst 10 262 (1977) [102] D B Wiles and R A Young J Appl Cryst 14 149
(1981) [103] J K Yau and S A Howard J Appl Ciyst 22 244
(1989) [104] S A Howard J K Yau and H U Anderson J Appl
Phys 65 1492 (1989) [105] S Enzo G Fagherazzi A Benedetti and S Poilizzi J
Appl Ciyst 21 536 (1988) [106] A Benedetti G Fagherazzi S Enzo and M
Battagliarin J Appl Cryst 21 543 (1988) [107] Th H de Keijser E J Mittemeijer and H C F Rozen-
daal J Appl Ciyst 16 309 (1983) [108] Y Zhang J M Stewart C R Hubbard and B Mo-
rosin Adv X-Ray Anal 33 373 (1990) [109] Y Wang S Lee and Y Ue J Appl Ciyst IS 35
(1982) [110] V N Selivanov and E F Smislov Zavod Lab 57 28
(1991) [Ill] A Guinier X-Ray Diffraction W H Freeman San
Francisco (1963) p 139 [112] M Wilkens J Appl Cryst 12119 (1979) [113] D Du and Y Wang Pow Diffr 2180 (1987) [114] A P Prudnikov Yu A Brychkov and O L Marichev
Integrals and Series Vol 1 Gordon and Breach Am- sterdam The Netheriands (1986) p 344
352
Volume 98 Number 3 May-June 1993
Journal of Research of the National Institute of Standards and Technology
[115] R L Rothman and J B Cohen J Appl Phys 42 971 (1971)
[116] T Adier and C R Houska J Appl Phys 50 3282 (1979)
[117] C R Houska and T M Smith J Appl Phys 52 748 (1981)
[118] S Rao and C R Houska Acta Ciyst A 4214 (1986) [119] J I Langford R Delhez Th H de Keijser and E J
Mittemeijer Ausi J Phys 41173 (1988) [120] J I Langfoid J Appl Cryst IS 315 (1982) [121] M J Turunen Th H de Keijser R Delhez and N M
van der Pers J Appl Ciyst 16176 (1983) [122] A J C Wilson Acta Ciyst 23 888 (1967) [123] A J C Wilson Acta Ciyst A 24 478 (1968) [124] A J C Wilson Acta Ciyst A 25 584 (1969) [125] G Gagliotti A Paoletti and F P Ricci Nucl Instrum
3 223 (1958) [126] J I Langford R J Cernik and D Louer J Appl
Ciyst 24 913 (1991) [127] J I Langford in Accuracy in Powder Diffraction II
preprint [128] A J C Wilson Mathematical Theory of X-Ray Powder
Diffractometiy Centrex Eindhoven The Netherlands (1963)
[129] J L Langford Prog Ciyst Growth and Charact 14185 (1987)
[130] T G Fawcett C E Crowder S J Brownell Y Zhang C R Hubbard W Schreiner G P Hamill T C Huang E Sabino J I Langford R Hamilton and D Louer Pow Diffr 3 209 (1988)
[131] W L Smith J Appl Ciyst 9187 (1976) [132] J L Langford and D Louer J Appl Ciyst 15 20
(1982) [133] Fl Popescu and L Benes Acta Ciyst A 33 323 (1977) [134] P PSuse^cu R MSnaila M Popescu and E Jijovici j
Appl Cryst 7 281 (1974) [135] P F Bley Y Calvayrac and M Fayard J Appl Ciyst
7 493 (1974) [136] B Moraweck Ph de Montgolfier and A J Renouprez
J Appl Ciyst 10191 (1977) [137] A Le Bail and D Louer J Appl Cryst 11 50 (1978) [138] D R Buchanan R L McCuUough and R L Miller
Acta Ciyst 20 922 (1966) [139] P Suortti and L D Jennings Acta Cryst A 33 1012
(1977) [140] J B Cohen and C N J Wagner J Appl Phys 33 2073
(1962) [141] A Bianconi J Budnick A M Flank A Fontaine P
Lagarde A Marcelli H Tolentino B Chamberland C Michel B Raveau and G Demazeau Phys Lett A127 285 (1988)
[142] K Fueki K Kitazawa K Kishio T Hasegawa S Uchida H Takagi and S Tanaka in Chemistiy of High- Temperature Superconductors D L Nelson M S Whittingham and T F George eds American Chemi- cal Society (1987) p 38
[143] T Fujita Y Aoki Y Maeno J Sakurai H Fukuba and H Fujii J Appl Phys 26 U68 (1987)
[144] R M Hazen in Physical Properties of High-rc Super- conductors Vol 2 D M Ginsberg ed World Scien- tific Singapore (1990) p 121
[145] J B Torrance A Bezinge A I Nazzal T C Huang S P Parkin D T Keane S J LaPlaca P M Horn and G A Held Phys Rev B 40 8872 (1989)
[146] J D Axe A H Moudden D Hohlwein D E Cox K
M Mohanty A R Moodenbaugh and Y Xu Phys Rev Lett 62 2751 (1989)
[147] T Suzuki and T Fujita Physica C 159 111 (1989) [148] T Fujita and Y Maeno in Superconducting Materials
JJAP Series 1 (1988) p 34 [149] A Roshko and Y-M Chiang J Appl Phys 66 3710
(1989) [150] D E Cox S C Moss R L Meng P H Hor and C W
Chu J Mater Res 31327 (1988) [151] B Crist and J B Cohen J Polym Sci 17 1001 (1979) [152] H Ledbetter S Kim and A Roshko Z Phys B 89275
(1992) [153] R D Shannon and C T Prewitt Acta Ciyst B 25 925
(1969) [154] M Lang H Spille F Steglich Y Hidaka T Murakami
and Y Endoh Physica C 162-1641037 (1989) [155] Y Hidaka and T Murakami Phase trans 15 241
(1989) [156] P L Gai and E M McCarron Science 247 553 (1990) [157] T Kamiyama I Izumi H Asano H Takagi S Uchida
Y Tokura E Takayama-Muromachi M Matsuda K Yamada Y Endoh and Y Hidaka Physica C 172 120 (1990)
[158] A Kapitulnik Physica C 153-155 520 (1988) [159] L A Muradyan V N Molchanov R A Tamazyan and
V I Simonov Physica C 162-164 536 (1989) [160] P Day M Rosseinsky K Prassides W I F David O
Moze and A Soper J Phys C 20 L429 (1987) [161] J T Lewandowski R A Beyerlein J M Longo and R
A McCauley J Amer Ceram Soc 69 699 (1986) [162] R Ramesh G van Tendeloo G Thomas S M Green
Y Mei C Jiang and H L Luo Appl Phys Lett 53 2220 (1988)
[163] J Schneck L Pierre J C Tolddano and C Daguet Phys Rev B 39 9624 (1989)
[164] O Eibl Physica C 168 215 (1990) [165] W Carrilo-Cabrera and W Gopel Physica C 161 373
(1989) [166] P Bordet J J Capponi C Chaillout J Chenavas A
W Hewat E A Hewat J L Hodeau M Marezio J L Tholence and D Tranqui Physica C 156189 (1988)
[167] R Ramesh K Remschnig J M Tarascon and S M Green J Mater Res 6 278 (1991)
[168] Z Hiroi Y Ikeda M Takano and Y Bando J Mater Res 6 435 (1991)
[169] Y Inoue M Hasegawa Y Shichi I Munakata M Ya- manaka S Hiyama and O Nittono J Mater Res 5 737 (1990)
[170] R Ramesh B G Bagley J M Tarascon S M Green M L Rudee and H L Luo J Appl Phys 67 379 (1990)
[171] X B Kan J Kulik P C Chow S C Moss Y F Yan J H Wang and Z X Zhao J Mater Res 5 731 (1990)
[172] G S Pawley J Appl Ciyst 13 630 (1980) [173] H Toraya J Appl Ciyst 19 440 (1986) [174] L Lutterotti and P Scardi J Appl Ciyst 23 246
(1990)
About the author Davor Balzar is with Faculty of Metallurgy of the University of Zagreb Sisak Croatia and was a Guest Researcher at fflST The National Institute of Standards and Technology is an agency of the Technology Administration US Department of Commerce
353
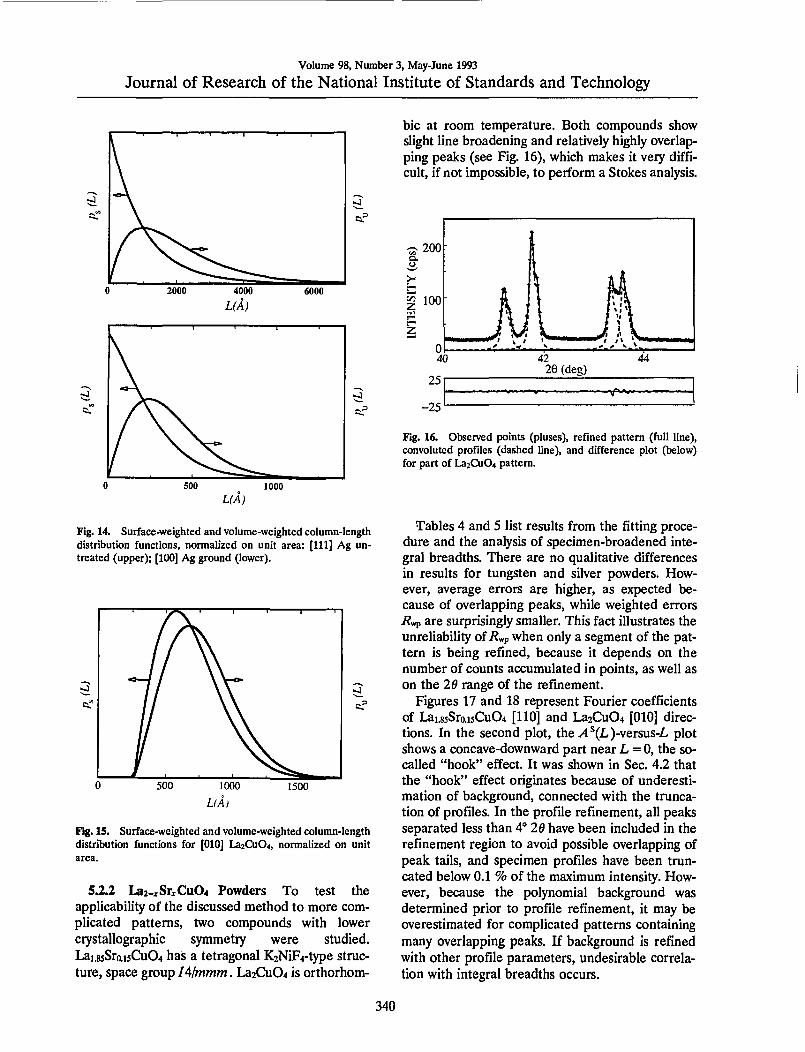
Volume 98 Number 3 May-June 1993
Journal of Research of the National Institute of Standards and Technology
500 1000 L(A)
Fig 14 Surface-weighted and volume-weighted column-length distribution functions normalized on unit area [111] Ag un- treated (upper) [100] Ag ground (lower)
Fig 15 Surface-weighted and volume-weighted column-length distribution functions for [010] La2Cu04 normalized on unit area
522 La2-xSrtCu04 Powders To test the applicability of the discussed method to more com- plicated patterns two compounds with lower crystallographic symmetry were studied Lai85Sroi5Cii04 has a tetragonal K2NiF4-type struc- ture space group lAlmmm La2Cu04 is orthorhom-
bic at room temperature Both compounds show slight line broadening and relatively highly overlap- ping peaks (see Fig 16) which makes it very diffi- cult if not impossible to perform a Stokes analysis
25
-25
26 (deg)
yNraquo-
Fig 16 Observed points (pluses) refined pattern (full line) convoluted profiles (dashed line) and difference plot (below) for part of La2Cu04 pattern
Tables 4 and 5 list results from the fitting proce- dure and the analysis of specimen-broadened inte- gral breadths There are no qualitative differences in results for tungsten and silver powders How- ever average errors are higher as expected be- cause of overlapping peaks while weighted errors wp are surprisingly smaller This fact illustrates the unreliability of iwp when only a segment of the pat- tern is being refined because it depends on the number of counts accumulated in points as well as on the 28 range of the refinement
Figures 17 and 18 represent Fourier coefficients of Lai85Sroi5Cu04 [110] and La2Cu04 [010] direc- tions In the second plot the A (L )-versus-L plot shows a concave-downward part near L =0 the so- called hook effect It was shown in Sec 42 that the hook effect originates because of underesti- mation of background connected with the trunca- tion of profiles In the profile refinement all peaks separated less than 4deg 20 have been included in the refinement region to avoid possible overlapping of peak tails and specimen profiles have been trun- cated below 01 of the maximum intensity How- ever because the polynomial background was determined prior to profile refinement it may be overestimated for complicated patterns containing many overlapping peaks If background is refined with other profile parameters undesirable correla- tion with integral breadths occurs
340
Volume 98 Number 3 May-June 1993
Journal of Research of the National Institute of Standards and Technology
Table 4 Parameters of the pure-specimen Voigt function as obtained from profile-fitting procedure for La2-^SrCu04 powders
Specimen hid 2Hdeg) Pen PcO FWHM(deg) Rp()
Lai85Sroi5Cu04 004 2695 0046(4) 0024(8) 0042 34 006 4092 0083(5) ltio-= 0053 62 110 3352 0110(5) ltio- 0070 125 220 7046 0171(9) ltio- 0109 43
La2Cu04 004 2713 0061(8) 0045(9) 0067 39 006 4119 0124(7) ltio-^ 0079 77 020 3316 0074(10) 0078(10) 0102 29 040 6957 0210(30) 0026(81) 0135 29 200 3345 0074(8) 0061(10) 0087 69 400 7028 0130(10) 0023(95) 0089 29
Table 5 Microstructural parameters for Laij(5Srai3Cu04 and La2Cu04 powders
Specimen Direction (DUA) Pgt(A) lte^(fl3))laquo lte2((Z)gt2))laquo
Lai83Sro5Cu04
La2Cu04
[001] [110]
[001] [010] [100]
1700(300) 470(20)
1100(100) 680(50) 680(50)
2000(200) 940(20)
1200(100) 760(50) 810(50)
00024 00017
00038 00033 00016
000049(9) 000044(6)
00008(1) 00007(2) 00003(3)
c i ^- raquo sect 08 bulli - U
^0
ti- bull ll bull bullbullo
ffl M P bull- u ^ Di 04 Si - M bulldiamsbullbull a bull-v 3 o ^^=s^
u ^N^Sraquoraquo^
0 ^^^aaaa 1000
L(A) 2000
OQ bullbulldego UM o z a 08
o o bull bull bull
- u u bull raquo UU bull
a diams o bull o u ft 04 bull deg raquo deg - U bull bull deg Oi bullbullgt =3 bull- l o k u
0 bullbullbullraquo aaaMMi
500 1000
L(A)
Fig 17 Fourier coefficients for the first- (pluses) and second- order (crosses) reflection and size coefficients (circles) for [110] Lai^Sroi5Cu04
Fig 18 Fourier coefficients for first- (pluses) and second- order (crosses) reflection and size coefficients (circles) for [010] La2Cu04
341
Volume 98 Number 3 May-June 1993
Journal of Research of the National Institute of Standards and Technology
S3 Comparison with the Integral-Breadth Methods
Knowing the specimen integral breadths simpli- fied methods can be applied In Sec 212 we re- viewed multiple-line and single-line integral- breadth methods We shall compare the simplified multiple-line methods [Eqs (23) (24) and (30)] and the single-line method [76] [Eqs (29) and (30)] with results obtained for silver tungsten and La2-xSrxCu04 powders (Tables 3 and 5) We did not compare with the multiple-line Voigt-function method [26] because it was shown in Sec 44 that it is incompatible with the Warren-Averbach analy- sis In Table 6 integral breadth Pi was computed according to Eq (11) This value was compared with )8A integral breadth computed from Fourier coefficients [58]
i8A=- laquo3 2^(L)
(74)
Results obtained by the Warren-Averbach analysis are significantly smaller for both size and strain Integral-breadth methods give the upper limit for strain so comparison is limited Considering the approximation e = 125e^(L))^ [138] with L=(D)v2 or L=(D)s2 strains resemble more closely than crystallite sizes It must be noted how- ever that this approximation makes sense only in the case of pure-Gauss strain broadening Benedetti et al [106] reported excellent agreement for both size and strain using Warren-Averbach and Cauchy-Gauss [Eq (24)] methods Results from Table 6 on the contrary indicate that the Gauss-Gauss approximation gives values closest to the Warren-Averbach method for crystallite sizes whereas the Cauchy-Gauss and especially the Cauchy-Cauchy approximation tend to give too large values For strain the trend is opposite The Cauchy-Cauchy approximation resembles most
Table 6 Comparison of results obtained with the integral-breadth methods Cauchy-Cauchy (C-C) Cauchy-Gauss (C-G) Gauss- Gauss (G-G) and single-line (S-L) analysis
Specimen hkl PiXKP PAXKP ltigt)v (Z)gt(A) (e^((DV2)gt2 eXlO^ (A-) (A-0 (A) C-C C-G G-G S-L xlO^ C-C C-G G-G S-L
W untreated 110 220
0259 0247
0259 0247
3500 3700 3810 3810 14500 4040
008 -001 -003 -005 024 0
W ground 110 220
125 204
125 205
1030 2240 1450 1220 940 550
054 090 093 105 045 032
Ag untreated 111 2
0600 0901
0600 0900
2000 3340 2390 2190 1670 1110
024 035 039 095 0 0
200 124 124 1030 2270 1470 1230 810 047 082 085 095 0 400 204 204 490 0
Ag ground 111 222
198 352
200 352
650 2080 1240 910 530 280
095 179 182 197 048 0
200 403 406 350 9380 4780 1320 260 180 405 405 408 082 400 803 803 120 0
Lai85Sroi3Cu04 004 006
0657 0881
0650 0880
2000 5230 3290 2660 1970 1140
049 076 078 088 044 0
110 119 119 940 1240 1000 970 840 044 052 064 080 0 220 158 158 630 0
La2Cu4 004 006
0988 132
0998 131
1200 2980 1940 1630 1490 760
08 107 112 127 081 0-
020 143 142 760 1200 910 860 1240 07 079 090 110 114 040 198 200 510 016 200 126 124 810 810 810 810 1250 03 002 011 015 089 400 1S 126 830 014
Not possible to evaluate because of too small Gauss integral breadth
342
Volume 98 Number 3 May-June 1993
Journal of Research of the National Institute of Standards and Technology
closely a Warren-Averbach method These results concur with the Klug and Alexander [24] compari- son of the published size and strain values obtained by Warren-Averbach (Stokes) and integral-breadth methods However for x-ray diffraction the Cauchy-Gauss assumption for the size-strain broadening is theoretically and experimentally more favored thpoundm the other two models The fact that the Gauss-Gauss method for crystallite size and the Cauchy-Cauchy method for strain give more realistic results may mean that the presump- tion that size and strain broadening are exclusively of one type is an oversimplification
The single-line method seems much less reliable If Gaussian breadth is very small no information about strain is obtained Moreover second-order reflections give much lower values of both size and strain than do basic reflections However if multi- ple reflections are not available the single-line method can give satisfactory estimations
54 Reliability of Profile Fitting
The profile fitting of a cluster of even severely overlapping peaks can be accomplished with a low error and excellent fit of total intensity But how reliable is information obtained about separate peaks in the cluster In the fitting procedure it is possible to put constraints on the particular profile parameter to limit intensity position and width of the peak If anisotropic broadening or different phases are present constraints may not be realistic Morever acceptable results can be obtained even using a different number of profiles in refinement [4] Hence the first condition for the successful ap- plication of this method is knowledge of actual phases present in the sample and their crystalline structures
In this regard two powders were measured or- thorhombic Lai94Sroo6Cu04 has a slightly distorted K2NiF4-type structure (space group Bmab a =53510(2) A b =53692 A(2) c = 131931(7) A) and tetragonal Lai76Sro24Cu04 (space group I4mmm a =37711(3) A c = 132580(8) A) Data were collected for each specimen separately and for a specimen obtained by mixing the same pow- ders Because diffracted intensity of each phase was lower for the mixture counting time was pro- portionally increased to obtain roughly the same counting statistics Figure 19 shows two partially separated orthorhombic (020) (200) and (040) (400) peaks overlapped with tetragonal (110) and (220) reflections During the profile fitting of the mixed powders (200) orthorhombic peak tended to disappear on account of neighboring (020) and
(110) reflections Its intensity was constrained to vary in range plusmn 30 of (020) peak intensity which can be justified if the crystallographic structure is known
60
-60
345
345
335 29 (deg)
345
Fig 19 (upper) Lai76Sro24Cu04 (110) peak (middle) Lai94Sroo6Cu04 (020) and (200) peaks (lower) (110) (020) and (200) peaks
Table 7 contains results of fitted specimen-Voigt functions as well as size and strain values obtained by the analysis of broadening Comparing integral breadths of the starting and mixed powders some profiles change from more Cauchy-like to Gauss- like and vice versa This is especially evident for the (400) reflection meaning that accurate deter- mination of the profile tails is indeed affected in the cluster of overlapping peaks However integral breadth does not change significantly so results of
343
Volume 98 Number 3 May-June 1993
Journal of Research of the National Institute of Standards and Technology
Table 7 Comparison between two specimens run separately and mixed togetlier
Specimen hkl 2Hdeg) )3cO PoO DUA) (D)v(A) (e2laquoD)v2))laquoxlO
Lai76Sroj4CuOr 110 3369 0058(6) 0094(7) 780(60) 850(60) 10(1) 220 7073 022(2) 013(2)
LaiMSro(KiCu04 020 3342 0084(9) 055(14) 500(90) 1000(200) 07(1) 040 7012 010(2) 014(1) 200 3353 00216(85) 0061(8) 1100(100) 1200(100) 03(1) 400 7040 0026(11) 0088(8)
Mix 110 3367 0083(21) 0064(14) 800(300) 1200(300) 08(3) Lai76Sro24Cu04 220 7072 019(7) 013(4)
+ 020 3343 0066(35) 0070(23) 800(300) 1000(300) 07(4) Lai94Sroo6Cu04 040 7012 0116(93) 013(5)
200 3354 0024(156) 0071(61) 900(700) 1000(600) 04(12) 400 7041 011(2) 0003(320)
the multiple-line methods are not much influenced On the contrary the single-line method gives quite different results This may support the conclusion of Suortti Ahtee and Unonius [43] that the Voigt function fails to account properly for size and strain broadening simultaneously if only Cauchy integral breadth determines crystallite size
Table 7 shows that the results of Warren- Averbach analysis of starting and mixed powders agree in the range of standard deviations How- ever errors are much larger especially for the hid- den (200)-(400) reflections From Eq (62) it follows that more counts (longer counting times) and more observables (smaller step-size) would lower standard deviations Therefore in the case of highly overlapping patterns to obtain desirable ac- curacy much longer measurements are needed al- though that will not change the fact that higher overlapping implies intrinsically higher errors of all refinable parameters To further minimize possible artifacts of the fitting procedure it is desirable to include in the analysis as many reflections in the same ciystallographic direction as possible
55 Remarks
By modeling the specimen size and strain broad- ening with the simple Voigt function it is possible to obtain domain sizes and strains that agree with experiment and show a logical interrelationship Furthermore the Voigt function shows the correct 1A(26y asymptotic behavior of peak tails as ex- pected from kinematical theory [139] However if the specimen profile is significantly asymmetric (because of twins and extrinsic stacking faults [140 59]) or the ratio FWHM^ is not intermediate to the Cauchy (2Tr) and Gauss (2(ln27r)^) functions then the Voigt function can not be applied [25]
Suortti Ahtee and Unonius [43] found good over- all agreement by fitting the Voigt function to the pure-specimen profiles of a Ni powder deconvo- luted by the instrumental function However more accurate comparison is limited because of unavoid- able deconvolution ripples of specimen profiles Furthermore the Voigt function might not be flex- ible enough to model a wide range of specimen broadening as well as the different causes of broadening Therefore the question whether the Voigt function can satisfactorily describe complex specimen broadening over the whole 20 range in a general case needs further evaluation
This method of Fourier analysis with the as- sumed profile-shape function is most useful in cases when the classical Stokes analysis fails there- fore when peak overlapping occurs and specimen broadening is comparable to instrumental broaden- ing It was shown that for a high degree of peak overlapping the fitting procedure can give unreli- able results of Gauss and Cauchy integral breadths that is the peak can change easily from predomi- nantly Cauchy-like to Gauss-like and contrary This can lead to illogical values of size-integral and strain-integral breadths according to Eqs (52) (53) (54) and (55) and to irregularities in the be- havior of Fourier coefficients for large L Simulta- neously if the size-broadened profile has a large Gauss-function contribution the hook effect will occur However volume-weighted domain sizes D)y and MSS eL)) for small L are much less affected because they rely on both Cauchy and Gauss parts of the broadened profile Any integral- breadth method that attempts to describe the size and strain broadening exclusively by a Cauchy or Gauss function in this case fails completely For specimens with lower crystallographic symmetry
344
Volume 98 Number 3 May-June 1993
Journal of Research of the National Institute of Standards and Technology
when many multiple-order reflections are avail- able but the peaks are overlapped it is therefore desirable to include in the analysis as many reflec- tions as possible to minimize the potential artifacts of the fltting process
6 Analysis of Superconductors 61 (La-M)2Cu04 Superconductors
Bednorz and Miiller [16] found the first high- temperature oxide superconductor in the La-Ba- Cu-O system Soon after substituting Ba with Sr and Ca Kishio et al [17] found superconductivity in two similar compounds Later many compounds with much higher transition temperatures (Tc) were found The (La-M)2Cu04 system remains favorable for study because the cation content responsible for the superconductivity is easier to control and measure than the oxygen stoichiometry Also this system provides a wide range of substitutional cation solubility in which the tetragonal K2NiF4- type structure is maintained Compared with much- studied Y-Ba-Cu-O this structure is simpler because it contains only one copper-ion site and two oxygen-ion sites
The undoped compound La2Cu04 is orthorhom- bic at room temperature It becomes superconduct- ing either with cation substitution on La sites or increased oxygen content to more than four atoms per formula unit Doping with divalent cations in- creases the itinerant hole carriers in the oxygen- derived electron band [141] which probably causes the superconductivity However different dopants influence the transition temperature Tc Although the unit-cell c-parameter simply reflects ionic dopant size [142] the in-plane unit-cell parameter (and accordingly the Cu-0 bond length) correlates with Tc for different dopants and for different dop- ing amounts [142 143]
LaiB5MouCu04 (M = Ba Ca Sr) have a tetrago- nal K2NiF4-type structure space group lAlmmm with four atoms in the asymmetric unit [117] One site is occupied with La partially substituted with dopant ions (Fig 20) La2Cu04 is orthorhombic at room temperature The best way to correlate these two structures is to describe La2Cu04 in space group Bmab the c axis remains the same tetrago- nal [110] and [110] directions become [010] and [100] orthorhombic axes and size of the unit cell is doubled [144]
Figure 21 shows parts of the x-ray diffraction patterns observed and refined of Lai85Moi5Cu04 (M = Sr Ba Ca) and La2Cu04 Refined lattice
parameters are given in Table 8 Table 9 shows resuhs of the line-broadening analysis Relatively
La(BaCaSr)
0(2)
0(1)
Fig 20 Ciystal structure of (La-M)2Cu04 showing one unit cell
300 JUU
(b)
200
100
U 0 M J Js-r-^
30
-30
300
40 41 42 43 44 45 40 41 42 43 44 45 29 (deg) 29 (deg)
mdashA-
gt t 200
Z
F-
- 100
(c)
f V kgt ii I 40 41 42 43 44 45 40 41 42 43 44 45
e (deg) ^^ 26 (deg)
-30 wwX mdash Wlaquo-
Fig 21 Diffraction patterns of LaiH5Moi5Cu04 specimens (a) M=Sr (b) M = Ba (c)M = Ca (d) M = U
345
Volume 98 Number 3 May-June 1993
Journal of Research of the National Institute of Standards and Technology
Table 8 Lattice parameters and T^ at zero resistivity (Ac method at 10 Ma current)
Specimen a (A) bk) c(A) rc(K)
Lairaquo5Sroi5Cu04 377814(7)
Lairaquo3Baoi3Cu04 37846(2)
LaiiijCaoi5Cu04 37863(7)
La2Cu04 53558(2) 54053(2)
231(2) 36
288(4) 28
17(2) 19
1451(8)
Table 9 Results of line-broadening analysis for (La-M)2Cu4 specimens
Specimen hkl PcO PoO (DUk) (Iraquo)(A) lte^((D)2))
Lai(laquoSroj5Cu04 004 006
0046(4) 0083(5)
0024(8) ltio-
1700(300) 2000(200) 000049(9)
110 0110(5) ltio- 470(20) 940(20) 000044(6) 220 0171(9) ltio-
Lai85Baoi3Cu04 004 006
0049(6) 0110(7)
0076(6) 0089(9)
1100(200) 1100(100) 00011(2)
110 0087(4) 000042(6) 560(20) 1110(20) 000024(5) 220 0116(3) ltio-5
Laiji5Caoi5Cu04 004 006
0120(13) 0146(12)
0032(22) 0033(27)
440(70) 780(90) 00007(4)
110 0045(25) 0200(19) 340(30) 360(20) 00013(2) 220 0343(22) ltio-
La2Cu04 004 006
0061(8) 0124(7)
0045(9) ltio-
1100(100) 1200(100) 00008(1)
020 0074(10) 0078(10) 680(50) 760(50) 00007(2) 040 0210(30) 0026(81) 200 0074(8) 0061(10) 680(50) 810(50) 00003(3) 400 0130(10) 0023(95)
weak peak broadening was observed which can not be attributed to the proximity of the phase trans- formation Lai85SroisCu04 is tetragonal down to = 170 K [145] Lai85Baoi5Cu04 to 140 K [146147] and Lai85Caoi5Cu04 to 130 K [148] Another possi- ble reason for peak broadening might be continu- ous compositional variations in dopant content The scanning Auger microprobe analysis of La2-SrtCu04 compounds [149] showed that grain- boundary segregation of Sr is weak and limited to a narrow region near the grain surface In the case of the separation of two phases with different Sr con- tent and similar lattice parameters asymmetry of some reflections would be observed [150] More- over in the case of compositional inhomogeneity microstrains eL)) would be roughly independent of the averaging distance L in the grains [151] therefore distribution of strains would be Gaus- sian For all specimens microstrain behavior is identical it decreases linearly with distance L
Rothman and Cohen [115] showed that such be- havior of microstrains is caused by dislocations that might arise during grinding Assuming the same applied stress microstrain would be approximately inversely proportional to the elastic moduli of these materials If mean microstrain is defined as the arithmetic average of strains for the [001] and [110] directions results agree with values of the Youngs moduli for polycrystalline La2Cu04 Lai85Moi5Cu04 (M = Sr Ba Ca) [152] However other factors may contribute to the microstrain Coordination-6 ionic radii of La^+ Sr Ba^+ Ca^+ are 106 116 136 100 A respectively [153] Substitution of La with ions of different sizes affects the lattice parameter [142] and may cause much larger strains in the [001] direction when some of the ions are replaced with Ba^ than with Sr^ in accord with results in Table 9 Substitution of Ca^^ ions produces an entirely different effect microstrains in the [110] direction are larger This may be explained by
346
Volume 98 Number 3 May-June 1993
Journal of Research of the National Institute of Standards and Technology
comparing effects of substitutional ions on the unit-cell a -parameter The Ba-doped specimen has a larger a-parameter than the Sr-doped but the Ca-doped a-parameter is largest although Ca^^ has the smallest ionic size This should increase the cell distortion in the a-b plane
Table 9 reveals high anisotropy in these materi- als consistent with other physical properties such as thermal expansion [154] and upper critical mag- netic field [155] Differences of domain sizes might arise from a layered structure in the [001] direction and consequently easy incorporation of stacking faults between regularly stacked layers The stack- ing-fault and twin-fault probabilities can be esti- mated from the average surface-weighted domain sizes [59]
^ = TAN + cf1fun(aa) (75) m im - (D)
Here c is a constant for the particular [hkl] direction and fun(a a) a linear combination of stacking-fault probability and twin-fault probability a The exact form of Eq (75) was derived only for the cubic and hexagonal crystal structures On con- dition that the true domain dimension D is isotropic or so large that the second term of Eq (75) dominates a linear function of stacking-fault and twin-fault probability is
fun(aa) = c( 1
) (76) Zgt)J (Dgttrade
Here c denotes a constant that depends only on geometrical factors and is the same for all three doped compounds
Figure 22 shows a possible correlation between Tc and fault-defect probabilities computed from TEM observations of La2-jcSrCu04 revealed that stacking-fault density increased with Sr content up to jc = 015 [156] That study suggests that a shear mechanism forming the fault-boundary dislocations implies oxygen vacancies andor cation deficiency We did not measure oxygen content but neutron- diffraction studies showed that oxygen deficiency starts to appear at much higher Sr content [157] However the increase of fault probability with the simultaneous decrease of microstrain in Fig 22 supports the assumption that defects are intro- duced to accommodate lattice strains [156] A simi- lar increase in Te was found in Y2Ba4Cu802o-laquo thin films [158] Compounds with asymmetric broad- ened and shifted peaks showed higher Tc which
was attributed to stacking faults Although extrinsic stacking faults may cause asymmetric peak broad- ening [140] it is probably caused by twinning Twinning in La-M-Cu-0 materials is less abundant than in Y-Ba-Cu-O compounds but it was ob- served in (La-Sr)2Cu04 monocrystals on (110) planes [159] In the profile-fitting procedure peak asymmetry is incorporated only in the instrumental function therefore we could not model asymmetric peak broadening However any significant asym- metry of the specimen profile would cause an un- even fit of low-angle and high-angle sides of peaks which was not observed This gives much more im- portance to stacking faults in Eq (76)
Fig 22 Arithmetic average of [110] and [001] root-mean- square strains and linear function of stacking-fault and twin- fault probabilities as a function of Tc
In Fig 22 average microstrains defined as the arithmetic average of [001] and [110] directions correlate inversely with Tc However we did not find a correlation of Tc and microstrains in a partic- ular direction [001] microstrains simply reflect dif- ference in size of dopant and host La^ ions (see Table 9)
In La2Cu04 (OkO) reflections are significantly broader than (hOO) This has also been observed in low-temperature orthorhombic Lai85Sroi5Cu04 and Lai85Baoi5Cu04 [160] and explained by either stacking faults or possible lower symmetry Our results reveal that domain sizes (D) have identical values for [010] and [100] directions (Table 9) From Eq (76) it follows that stacking-fault proba- bilities in these directions have the same values However microstrains in the [010] direction are roughly twice as large as in the [100] direction which is responsible for the different broadening In the case of doped La2Cu04 compounds different microstrains might be caused by oxygen
347
Volume 98 Number 3 May-June 1993
Journal of Research of the National Institute of Standards and Technology
vacancies ordered along one direction in the a-b plane similar to effects found in YBa2Cu307-laquo However undoped La2Cu04 is not expected to have significant o^Qgen deficiency Other possibili- ties are lower ciystallographic symmetry andor La vacancies although they were not reported for this system but La deficiency was found in an La2Co04 compound [161]
We can conclude that lattice strains and incoher- ently diffracting domain sizes confirm high an- isotropy in these materials This simple approach however does not allow unambiguous identifica- tion of the strains origin Probably the strains originate from dislocations and from different sizes of host and dopant ions Domain sizes of all com- pounds are larger in the c-direction than in the a-6 plane This indicates existence of stacking faults and twins However because estimated errors are relatively large and only three materials were stud- ied the possible connection between stacking faults and 7c needs further study
62 Bi-Cu-O Superconductors
Among the high-Tc superconductors the Bi- Cu-O compounds appear intriguing especially because their incommensurate structure modula- tion remains incompletely understood [162 163] The crystal structure consists of perovskite-like SrO-(Cu02Ca)mi-Cu02-SrO layers separated by NaCl-like BiO double layers (see Fig 23 [164]) The number m of Cu02 layers alters the supercon- ducting transition temperature Tc (for m = 12 and 3 rclaquo10 90 and 110 K respectively) This two- dimensional layered structure makes these materi- als highly anisotropic and favours the creation of defects
Bulk sintered specimens showed relatively weak peak broadening Moreover the diffraction pat- terns contained many overlapping peaks because the compound crystallizes in an orthorhombic low- symmetry space group A2aa [165] and incommen- surate modulation gives superlattice reflections All patterns revealed a strong [001] texture (Fig 24) making reflections other than (001) difficult to ana- lyze The lattice parameters vary depending on the exact compound stoichiometry and processing his- tory but characteristically they have almost identi- cal a and b parameters and large c parameter fl =54095 A 6=54202 A c =309297 A for Bi2Sr2CaCu208 (Bi-2212 [166] and A =5392 A b =5395 A c =36985 A for (BiPb)2Sr2Ca2Cu30io (BiPb-2223) [165] Thus we treated (hOO) and (0^0) reflections as single peaks Table 10 gives the
results for three specimens Bi-2212 (BiPb)2 (SrMg)2(BaCa)2Cu30io (BiPbMgBa-2223) which were one-phase specimens and BiPb-2223 con- taining approximately equal amounts of 2212 and 2223 phases The in-plane lattice parameters of 2212 and 2223 phases differ little hence only the [00] directions of the mixed-phase specimen were evaluated
b^ (c)
Fig 23 Average crystal structure of Bi2Sr2Cam-iCum04+2m for (a) m = 1 (b) w =2 (c) m =3 [164]
35
-35
42 44 46 48 50 52 54 56 58 60 62 26 (deg)
^ ^^^MK^Aa^Ndllaquop
Fig 24 Part of BiPbMgBa-2223 refined pattern There are 48 fundamental reflections in this region
Interpretation of the results in the case of these complicated compounds must be considered care- fully Microstrains are probably caused by disloca- tion arrays However substitution of different-sized ions and vacancies would also contribute to the strains as would other kinds of disorder especially
348
Volume 98 Number 3 May-June 1993
Journal of Research of the National Institute of Standards and Technology
Table 10 Results of line-btoadening analysis for Bi-Cu-O supreconductors
Specimen Phase hkl (A)
eD)sa)y^
Bi-2212 2212 008 0012
0163(8) 022(3)
001(6) 005(6)
420(80) 00021(6)
020+200 0104(4) ltio-^ 580(30) 00007(1) 040+400 018(2) 00004(6300)
BiPbMgBa-2223 7773 0010 0020
0097(1) 021(2)
00002(1700) 0007(150)
770(60) 00012(1)
020 + 200 012(27) 013(10) 380(430) 00009(71) 040 + 400 015(95) 021(33)
BiPb-73 2212 008 0012
023(2) 025(5)
0002(350) 0001(1000)
220(30) 00013(26)
2223 0010 0020
022(8) 023(99)
0092(67) 018(47)
230(190) 00012(197)
Stacking faults and twins Table 10 shows larger strains in the [001] direction that in the basal plane This can be explained by stacking disorder along the c-axis which was frequently observed in electron-diffraction patterns as streaking [167 168] Easy incorporation of stacking faults is possi- ble because of the two-dimensional weak-bonded layers (BiO double layers are spaced about 3 A apart) The difference in microstrain between in- plane and the c-direction is much smaller for the BiPbMgBa-2223 phase probably because Pb low- ers the faulting by stabilizing the higher-Tc 2223 phase [167] For the BiPb-2223 specimen with two phases there are two possibilities Either the speci- men consists mainly of a mk of two kinds of one- phase grains or both phases occur within the same grains The second possibility was confirmed exper- imentally [169 170] and our results concur be- cause microstrain in the 2212 phase is much smaller than in the one-phase Bi-2212 specimen Processing conditions and cation content probably favour development of the macroscopic inter- growth of both phases within the grains that is microscopic defects grow to sufficiently large re- gions to give a diffraction pattern of another phase with the different number of Cu02 layers As a re- sult strain is relieved and both strains and domain sizes being quite different in one-phase specimens tend to equalize
For the Bi-Cu-O specimens the mean surface- weighted domain sizes are generally smaller than for (La-M)2Cu04 compounds Therefore the com- putation of the stacking- and twin-fault probabili- ties by using Eq (75) may be wrong It would be very instructive to compare the different broaden-
ing of satellite and fundamental reflections which indicates a more pronounced stacking disorder in the modulated structure [171]
In summary we found that for both Bi-2212 and BiPbMgBa-2223 superconductors the c-axis strain exceeds the in-plane strain The BiPb-2223 specimen containing both 2212 and 2223 phases within the single grains shows smaller incoherently diffracting domains and lower c-axis strain than the one-phase specimens This fact may direct us to- ward the mechanism of the second-phase forma- tion in these materials
63 Remarks
It was shown that this particular method of the line-broadening analysis can give information about the size of incoherently diffracting domains and lattice strains in (La-M)2Cu04 and Bi-Clu-O superconductors Moreover results show high an- isotropy of both size and strain parameters as one may expect because of the layered structure of all superconducting cuprates Generally structural line broadening is not large that is a result of rela- tively large domain sizes (200-2000 A) and small strains (002-02) It is interesting to compare these values with the published results for YBa2Cu307-laquo (isotropic strains of 023 [77] and 005-03 [82]) Although the different materi- als were studied they seem too large especially be- cause they are the average of strains in different directions
The main drawback of the line-broadening the- ory is the uncertainty about the origins of the line broadening that is it is difficult to distinguish the main effects responsible for the broadening For
349
Volume 98 Number 3 May-June 1993
Journal of Research of the National Institute of Standards and Technology
the novel superconductors particularly the numer- ous defects (substitutions vacancies stacking faults dislocations and similar) can occur simulta- neously which makes it very difficult to determine their individual contributions Furthermore the crystal structures of most novel superconductors are relatively complicated The average structure has mostly a slightly distorted tetragonal symmetry very similar a and b lattice parameters and a large c parameter but c=36 for YBa2Cu307-laquo for in- stance This results in a large number of overlap- ping peaks and consequently in large errors of all results This showed especially in the case of Bi-Cu-O superconductors (see Table 10) Follow- ing the discussion of reliability of profile fitting in Sec 54 it would be desirable to include more than two reflections in the analysis of broadening but higher-order peaks are usually too weak and over- lapped One way to partially solve this problem would be a whole pattern fitting [172 173] and Rietveld structure refinement [23] in terms of size and strain parameters This requires an accurate preset function to model specimen broadening and precise definition of angular dependence of size and strain parameters The Rietveld programs that model the line broadening in terms of size and strain parameters are based either on the simpli- fied integral-breadth methods [78 95] or on the single-line method [174]
7 Conclusions
A method for analyzing the pure-specimen (structural) broadening of x-ray diffraction line profiles is proposed By modeling the specimen size and strain broadenings with the simple Voigt func- tion it is possible to obtain domain sizes and strains that agree with experiment and show a logi- cal interrelationship Furthermore some common consequences and problems in the Fourier-method analysis follow easily The specimen function is convoluted with the instrumental function to match the observed x-ray diffraction-line profile This avoids the Stokes deconvolution method thus al- lowing analysis of patterns with highly overlapping peaks and weak structural broadening Therefore the method was applied to some novel high-Tc superconductors We reached the following conclu- sions
(i) Surface-weighted domain size depends only on the Cauchy integral breadth of the size-broad- ened profile
(ii) The hook effect occurs when the Cauchy-content of the size-broadened profile is un-
derestimated that is for ^sc(n2)^3sG Usually this happens when the background is estimated too high so the long tails of the Cauchy function are prematurely cut off
(iii) It also follows from conclusion (ii) that the volume-weighted domain size can not be more than twice the surface-weighted domain size (limiting value D)v=2D)i is obtained for the pure-Cauchy size-broadened profile) Minimum value for D)J (D)j should not be less than -131
(iv) If the distortion coefficient is approxi- mated with a harmonic term this leads exactly to the Warren-Averbach method of separation of size and strain broadenings
(v) In that case mean-square strains decrease linearly with the distance L
(vi) It is possible to evaluate local strain ((e^(0))^) only in the case of pure-Gauss strain broadening Then root-mean-square strain is inde- pendent of the distance L and related to the upper limit of strain obtained from the integral breadth of the strain-broadened profile
(vii) If strain broadening is not described exclu- sively with the Gauss function the multiple-line Voigt integral breadth and Warren-Averbach analyses can not give the same results for volume- weighted domain size although D)v is defined identically in both approaches because the appar- ent strain -q = pdeg(29)cot9 is not angular- independent
(viii) Smooth size coefficients give column- length distribution functions without oscillations and make possible a computation of volume- weighted average domain sizes up to ~5000 A
(ix) Comparison with the simplified integral- breadth methods in most cases has shown not large but systematic discrepancy of results indicat- ing that size and strain broadening can not be accu- rately modeled by a single Cauchy or Gauss function Moreover the application of the single- line method is much less reliable and it should not be used where multiple reflections are available
(x) The knowledge of all phases present in the sample and their crystallographic structure is re- quired to successfully fit a cluster of overlapping peaks Although it is very difficult to accurately de- termine the Cauchy-Gauss ratio of an overlapped peak final results of domain size and strain are much less affected Therefore connecting the crys- tallite size exclusively with the Cauchy content and strain with the Gauss content of a specimen profile might be doubtful
(xi) Evaluated errors of domain sizes and strains increase substantially with the degree of
350
Volume 98 Number 3 May-June 1993
Journal of Research of the National Institute of Standards and Technology
peak overlapping Hence for complicated patterns very accurate measurements are necessary and one needs to analyze as many reflections in the same crystallographic direction as possible
(xii) Line-broadening analysis of (La-M)2Cu04 and Bi-Cu-O compounds confirms high anisotropy in these materials
(xiii) Strains in (La-M)2Cu04 probably origi- nate from dislocations and from different sizes of host and dopant ions
(xiv) Stacking-fault probability in (La-M)2Cu04 (M = Ba Ca Sr) increases with increasing Tc whereas the average strain decreases
(xv) In La2Cu04 different broadening of (lOO) and (OfcO) reflections is not caused by stacking faults
(xvi) All Bi-Cu-0 superconductors show larger strain in the c-direction than in the a-b plane which can be explained by stacking disorder along the [001] direction
(xvii) In the specimen with approximately equal amounts of Tl-2212 and TlPb-2223 phases it is likely that a secondary phase develops by the growth of the microscopic faulted regions of the primary phase
Acknowledgments
I am thankful to Dr Harry McHenry for his support and especially to Dr Hassel Ledbetter for his wise guidance and most useful help during my stay at NIST I am also indebted to my home insti- tution the Faculty of Metallurgy of the University of Zagreb for allowing me the leave of absence at NIST
8 References
[1] W Friedrich P Knipping and M v Laue Ann Physik 41 971 (1912)
[2] H M Rietveld Acta Cryst 22 151 (1967) [3] H M Rietveld J Appl Cryst 2 65 (1969) [4] S A Howard and K D Preston in Modern Powder Dif-
fraction Vol 20 The Mineralogical Society of America Washington DC (1989) p 217
[5] D Taupin J Appl Cryst 6 266 (1973) [6] T C Huang and W Parrish Appl Phys Lett 27 123
(1975) [7] M K Wu J R Ashburn C J Torng P H Hor R L
Meng L Gao Z J Hwang Y Q Wang and C W Chu Phys Rev Lett 58 908 (1987)
[8] D Shi MRS Bull 16 37 (1991) [9] D Larbalestier Phys Today 44 74 (1991)
[10] J C Phillips Phys Rev B 4512647 (1992) [11] B Raveau Phys Today 45 53 (1992) [12] A J Millis and K M Rabe Phys Rev B 38 8908 (1988)
[13] F Guinea Europhys Lett 7 549 (1988) [14] C P Dhard and P Singh in Proc Int Symp High-Temp
Supercond Jaipur India Oxford amp IBH Publishing New Delhi (1988) p 271
[15] J D Jorgensen Phys Today 44 34 (1991) [16] J G Bednorz and K A Muller Z Phys B 64 189
(1986) [17] K Kishio K Kitazawa S Kaube I Yasuda N Sugii H
Takagi S Uchida K Fueki and S Tanaka Chem Lett 429 (1987)
[18] J D Jorgensen B Dabrowski S Pei D G Hinks L Soderholm B Morosin J E Venturini and D S Ginley Phys Rev B 38 11337 (1988)
[19] J R Clem Phys Rev B 43 7837 (1991) [20] M Paranthaman M Foldejiki D Balzar H Ledbetter
A J Nelson and A M Hermann submitted to Phys Rev B
[21] A R Stokes Proc Phys Soc Lond 61 382 (1948) [22] B E Warren and B L Averbach J Appl Phys 23 497
(1952) [23] R Delhez Th H de Keijser and E J Mittemeijer in
Accuracy in Powder Diffraction S Block and C R Hub- bard eds Natl Bur Stand (US) Special Publication 567 (1980) p 213
[24] H P Klug and L E Alexander X-ray Diffraction Proce- dures 2nd Edition John Wiley New York (1974) p 661
[25] J I Langford J Appl Ciyst 11 10 (1978) [26] J I Langford in Accuracy in Powder Diffraction S
Block and C R Hubbard eds Natl Bur Stand (US) Special Pubication 567 (1950) p 255
[27] R Delhez Th H de Keijser and E J Mittemeijer Fre- senius Z Anal Chem 312 1 (1982)
[28] A J C Wilson Proc Phys Soc Lond 80 286 (1962) [29] A J C Wilson Proc Phys Soc Lond 81 41 (1963) [30] L P Smith Phys Rev 46 343 (1934) [31] H C Burger and P H van Cittert Z Phys 79 722
(1932) [32] S Ergun J Appl Ciyst 1 19 (1968) [33] R Croche and L Gatineau J Appl Ciyst 10479 (1977) [34] L H Schwarz and J B Cohen Diffraction from Materi-
als Academic Press New York (1977) p 391 [35] R Delhez Th H de Keijser E J Mittemeijer and J I
Langford J Appl Cryst 19 459 (1986) [36] R Delhez Th H de Keijser E J Mittemeijer and J I
Langford Aust J Phys 41 213 (1988) [37] R A Young and D B Wiles J Appl Cryst 15 430
(1982) [38] W Voigt Stizungsber K Bayer Akad Wiss 42 603
(1912) [39] E E Whiting J Quant Spectrosc Radiat Transfer 8
1379 (1968) [40] G K Wertheim M A Butler K W West and D N E
Buchanan Rev Sci Instrum 111369 (1974) [41] M M Hall Jr V G Veeraraghavan H Rubin and P G
Winchell J Appl Cryst 10 66 (1977) [42] A Brown and J W Edmonds Adv X-Ray Anal 23 361
(1980) [43] P Suortti M Ahtee L Unonius J Appl Cryst 12 365
(1979) [44] T Sundius J Raman Spectrosc 1 471 (1973) [45] B H Armstrong J Quant Spectrosc Radiat Transfer 7
61 (1967) [46] J F Kielkopf J Opt Soc Am 63 987 (1973) [47] B P Asthana and W Kiefer Appl Spectr 36 250
(1982)
351
Volume 98 Number 3 May-June 1993
Journal of Research of the National Institute of Standards and Technology
[48] J P M de Vreede S C Mehrotra A Tal and H A Dijkerraan Appl Spectr 36 227 (1982)
[49] F R L Schoening Ada Ciyst 18 975 (1965) [50] P Scherrer Gott Nachr 2 98 (1918) [51] A R Stokes and A J C Wilson Proc Cambridge
Philos Soc 38 313 (1942) [52] A J C Wilson X-Ray Optics 2nd edition Methuen
London (1962) [53] S Leie and T R Anantharaman Proc Indian Acad
Sci Sect A H 261 (1966) [54] D Louer D Weigel and J I Langford J Appl Ciyst
5 353 (1972) [55] A J C Wilson J Appl Ciyst 2 181 (1969) [56] J I Langford and A J C Wilson J Appl Ciyst 11102
(1978) [57] A R Stokes and A J C Wilson Proc Phys Soc Lond
56174 (1944) [58] B E Warren and B L Averbach J Appl Phys 21 595
(1950) [59] B E Warren X-Ray Diffraction Addison-Wesley
Reading Massachusetts (1969) p 264 [60] B E Warren in Progress in Metal Physics Vol 8 Perg-
amon Press London (1959) p 146 [61] F Bertaut C R Acad Sci Paris 228 187 (1949) [62] N C Haider and C N J Wagner Acta Cryst 20 312
(1966) [63] D Balzar and H Ledbetter in Proceedings of the Accu-
racy in Powder Diffraction II Natl Inst Stand Technol (1992) p 37
[64] D Balzar and H Ledbeter J Appl Cryst 26 (1993) in press
[65] J N Eastabrook and A J C Wilson Proc Phys Soc Lond B 65 67 (1952)
[66] R S Smith IBM J Res Develop 4 205 (1960) [67] B Y Pines and A F Sirenko Soviet Physics Ciyst 715
(1962) [68] G B Mitra and N K Misra Acta Ciyst 22 454 (1967) [69] A Gangulee J Appl Ciyst 7 434 (1974) [70] J Mignot D Rondot Acta Met 231321 (1975) [71] J Mignot and D Rondot Acta Ciyst A 33 327 (1977) [72] R K Nandi H K Kuo W Schlosberg G Wissler J B
Cohen and B Crist Jr J Appl Ciyst 17 22 (1984) [73] M Zocchi Acta Ciyst A 36164 (1980) [74] P Ramarao and T R Anantharaman Trans Ind Ins
Metals 18 181 (1965) [75] R K Nandi and S P Sen Gupta J App Cryst 11 6
(1978) [76] Th H de Keijser J I Langford E J Mittemeijer and
B P Vogels J Appl Ciyst IS 308 (1982) [77] A Williams G H Kwei R B Von Dreele A C Lar-
son L D Raistrick and D L Bish Phys Rev B 37 7960 (1988)
[78] A C Larson and R B Von Dreele Los Alamos Na- tional Laboratory Report No LA-UR-86-748 (1988)
[79] J D Jorgensen D H Johnson M H Mueller J G Worlton and R B Von Dreele in Proceedings of the Conference on Diffraction Profile Analysis Cracow Poland (1978) p 20
[80] R B Von Dreele J D Jorgensen and C G Windsor J Appl Ciyst 15 581 (1982)
[81] P Thompson D E Cox and J B Hastings J Appl Ciyst 20 79 (1987)
[82] J P Singh R A Guttschow D S Kupperman J T Dusek and R B Poeppel in High Temperature Super-
conducting Compounds III S Whang A Gupta and E Ceilings eds TMS AIME Warrendale (1991) p 281
[83] M O Eatough D S Glnley and B Morosin Adv X- Ray Anal 33 145 (1990)
[84] E J Peterson P J Kung R E Muenchausen and D M Smith in Proceedings of the 41st Annual Denver Conference on Applications of X-Ray Analysis Colo- rado Springs Colorado (1992) p 74
[85] M Rand J I Langford and J S Abell submitted to J Cryogenics (1992)
[86] D Balzar J Appl Ciyst 25 559 (1992) [87] D Balzar H Ledbetter and A Roshko Physica C 185-
189 871 (1991) [88] D Balzar and H Ledbetter J Mater Sci Lett 111419
(1992) [89] D Balzar H Ledbetter and A Roshko Pow Diffr 8
(1993) in press [90] S Johnson M Gusraan D Rowcliffe T Geballe and J
Sun Adv Ceram Mater 2 337 (1987) [91] H Ledbetter S A Kim R B Goldfarb and K Togano
Phys Rev B 39 9689 (1989) [92] H Friedman Electronics 132 (1945) [93] W Parrish (ed) in Advances in X-Ray Diffractometry
and X-Ray Spectrography Centrex Publishing Company Eindhoven The Netheriands (1962)
[94] W Soller Phys Rev 24158 (1924) [95] S A Howard R L Snyder J Appl Ciyst 22 238
(1989) [96] G H Stout and L H Jensen X-Ray Structure Determi-
nation 2nd edition Wiley New York (1989) p 373 [97] D E Appleman and T Evans Jr Final Report 92-14
US Geological Survey Washington DC (1973) Avail- able as NTIS Document No PB-216188
[98] M U Cohen Rev Sci Instrum 6 68 (1935) [99] M U Cohen Rev Sci Instrum 7 155 (1936) [100] M H Mueller L Heaton and K T Miller Acta Ciyst
13 828 (1960) [101] R A Young P E Mackie and R B Von Dreele J
Appl Ciyst 10 262 (1977) [102] D B Wiles and R A Young J Appl Cryst 14 149
(1981) [103] J K Yau and S A Howard J Appl Ciyst 22 244
(1989) [104] S A Howard J K Yau and H U Anderson J Appl
Phys 65 1492 (1989) [105] S Enzo G Fagherazzi A Benedetti and S Poilizzi J
Appl Ciyst 21 536 (1988) [106] A Benedetti G Fagherazzi S Enzo and M
Battagliarin J Appl Cryst 21 543 (1988) [107] Th H de Keijser E J Mittemeijer and H C F Rozen-
daal J Appl Ciyst 16 309 (1983) [108] Y Zhang J M Stewart C R Hubbard and B Mo-
rosin Adv X-Ray Anal 33 373 (1990) [109] Y Wang S Lee and Y Ue J Appl Ciyst IS 35
(1982) [110] V N Selivanov and E F Smislov Zavod Lab 57 28
(1991) [Ill] A Guinier X-Ray Diffraction W H Freeman San
Francisco (1963) p 139 [112] M Wilkens J Appl Cryst 12119 (1979) [113] D Du and Y Wang Pow Diffr 2180 (1987) [114] A P Prudnikov Yu A Brychkov and O L Marichev
Integrals and Series Vol 1 Gordon and Breach Am- sterdam The Netheriands (1986) p 344
352
Volume 98 Number 3 May-June 1993
Journal of Research of the National Institute of Standards and Technology
[115] R L Rothman and J B Cohen J Appl Phys 42 971 (1971)
[116] T Adier and C R Houska J Appl Phys 50 3282 (1979)
[117] C R Houska and T M Smith J Appl Phys 52 748 (1981)
[118] S Rao and C R Houska Acta Ciyst A 4214 (1986) [119] J I Langford R Delhez Th H de Keijser and E J
Mittemeijer Ausi J Phys 41173 (1988) [120] J I Langfoid J Appl Cryst IS 315 (1982) [121] M J Turunen Th H de Keijser R Delhez and N M
van der Pers J Appl Ciyst 16176 (1983) [122] A J C Wilson Acta Ciyst 23 888 (1967) [123] A J C Wilson Acta Ciyst A 24 478 (1968) [124] A J C Wilson Acta Ciyst A 25 584 (1969) [125] G Gagliotti A Paoletti and F P Ricci Nucl Instrum
3 223 (1958) [126] J I Langford R J Cernik and D Louer J Appl
Ciyst 24 913 (1991) [127] J I Langford in Accuracy in Powder Diffraction II
preprint [128] A J C Wilson Mathematical Theory of X-Ray Powder
Diffractometiy Centrex Eindhoven The Netherlands (1963)
[129] J L Langford Prog Ciyst Growth and Charact 14185 (1987)
[130] T G Fawcett C E Crowder S J Brownell Y Zhang C R Hubbard W Schreiner G P Hamill T C Huang E Sabino J I Langford R Hamilton and D Louer Pow Diffr 3 209 (1988)
[131] W L Smith J Appl Ciyst 9187 (1976) [132] J L Langford and D Louer J Appl Ciyst 15 20
(1982) [133] Fl Popescu and L Benes Acta Ciyst A 33 323 (1977) [134] P PSuse^cu R MSnaila M Popescu and E Jijovici j
Appl Cryst 7 281 (1974) [135] P F Bley Y Calvayrac and M Fayard J Appl Ciyst
7 493 (1974) [136] B Moraweck Ph de Montgolfier and A J Renouprez
J Appl Ciyst 10191 (1977) [137] A Le Bail and D Louer J Appl Cryst 11 50 (1978) [138] D R Buchanan R L McCuUough and R L Miller
Acta Ciyst 20 922 (1966) [139] P Suortti and L D Jennings Acta Cryst A 33 1012
(1977) [140] J B Cohen and C N J Wagner J Appl Phys 33 2073
(1962) [141] A Bianconi J Budnick A M Flank A Fontaine P
Lagarde A Marcelli H Tolentino B Chamberland C Michel B Raveau and G Demazeau Phys Lett A127 285 (1988)
[142] K Fueki K Kitazawa K Kishio T Hasegawa S Uchida H Takagi and S Tanaka in Chemistiy of High- Temperature Superconductors D L Nelson M S Whittingham and T F George eds American Chemi- cal Society (1987) p 38
[143] T Fujita Y Aoki Y Maeno J Sakurai H Fukuba and H Fujii J Appl Phys 26 U68 (1987)
[144] R M Hazen in Physical Properties of High-rc Super- conductors Vol 2 D M Ginsberg ed World Scien- tific Singapore (1990) p 121
[145] J B Torrance A Bezinge A I Nazzal T C Huang S P Parkin D T Keane S J LaPlaca P M Horn and G A Held Phys Rev B 40 8872 (1989)
[146] J D Axe A H Moudden D Hohlwein D E Cox K
M Mohanty A R Moodenbaugh and Y Xu Phys Rev Lett 62 2751 (1989)
[147] T Suzuki and T Fujita Physica C 159 111 (1989) [148] T Fujita and Y Maeno in Superconducting Materials
JJAP Series 1 (1988) p 34 [149] A Roshko and Y-M Chiang J Appl Phys 66 3710
(1989) [150] D E Cox S C Moss R L Meng P H Hor and C W
Chu J Mater Res 31327 (1988) [151] B Crist and J B Cohen J Polym Sci 17 1001 (1979) [152] H Ledbetter S Kim and A Roshko Z Phys B 89275
(1992) [153] R D Shannon and C T Prewitt Acta Ciyst B 25 925
(1969) [154] M Lang H Spille F Steglich Y Hidaka T Murakami
and Y Endoh Physica C 162-1641037 (1989) [155] Y Hidaka and T Murakami Phase trans 15 241
(1989) [156] P L Gai and E M McCarron Science 247 553 (1990) [157] T Kamiyama I Izumi H Asano H Takagi S Uchida
Y Tokura E Takayama-Muromachi M Matsuda K Yamada Y Endoh and Y Hidaka Physica C 172 120 (1990)
[158] A Kapitulnik Physica C 153-155 520 (1988) [159] L A Muradyan V N Molchanov R A Tamazyan and
V I Simonov Physica C 162-164 536 (1989) [160] P Day M Rosseinsky K Prassides W I F David O
Moze and A Soper J Phys C 20 L429 (1987) [161] J T Lewandowski R A Beyerlein J M Longo and R
A McCauley J Amer Ceram Soc 69 699 (1986) [162] R Ramesh G van Tendeloo G Thomas S M Green
Y Mei C Jiang and H L Luo Appl Phys Lett 53 2220 (1988)
[163] J Schneck L Pierre J C Tolddano and C Daguet Phys Rev B 39 9624 (1989)
[164] O Eibl Physica C 168 215 (1990) [165] W Carrilo-Cabrera and W Gopel Physica C 161 373
(1989) [166] P Bordet J J Capponi C Chaillout J Chenavas A
W Hewat E A Hewat J L Hodeau M Marezio J L Tholence and D Tranqui Physica C 156189 (1988)
[167] R Ramesh K Remschnig J M Tarascon and S M Green J Mater Res 6 278 (1991)
[168] Z Hiroi Y Ikeda M Takano and Y Bando J Mater Res 6 435 (1991)
[169] Y Inoue M Hasegawa Y Shichi I Munakata M Ya- manaka S Hiyama and O Nittono J Mater Res 5 737 (1990)
[170] R Ramesh B G Bagley J M Tarascon S M Green M L Rudee and H L Luo J Appl Phys 67 379 (1990)
[171] X B Kan J Kulik P C Chow S C Moss Y F Yan J H Wang and Z X Zhao J Mater Res 5 731 (1990)
[172] G S Pawley J Appl Ciyst 13 630 (1980) [173] H Toraya J Appl Ciyst 19 440 (1986) [174] L Lutterotti and P Scardi J Appl Ciyst 23 246
(1990)
About the author Davor Balzar is with Faculty of Metallurgy of the University of Zagreb Sisak Croatia and was a Guest Researcher at fflST The National Institute of Standards and Technology is an agency of the Technology Administration US Department of Commerce
353
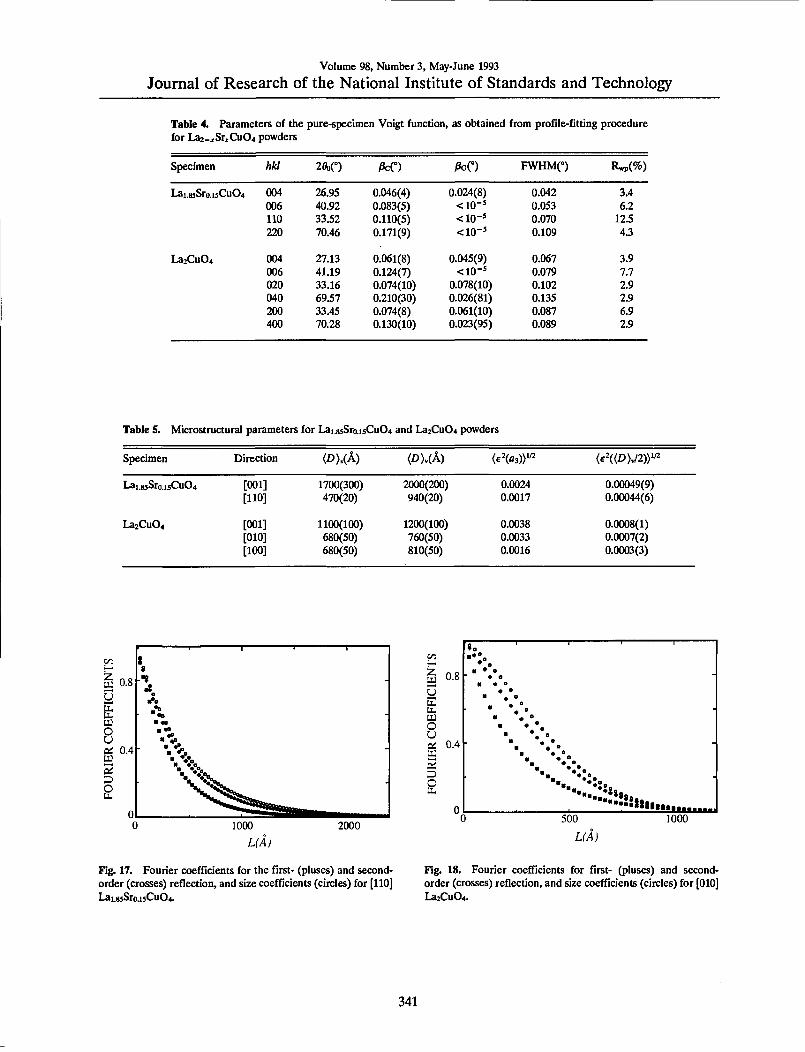
Volume 98 Number 3 May-June 1993
Journal of Research of the National Institute of Standards and Technology
Table 4 Parameters of the pure-specimen Voigt function as obtained from profile-fitting procedure for La2-^SrCu04 powders
Specimen hid 2Hdeg) Pen PcO FWHM(deg) Rp()
Lai85Sroi5Cu04 004 2695 0046(4) 0024(8) 0042 34 006 4092 0083(5) ltio-= 0053 62 110 3352 0110(5) ltio- 0070 125 220 7046 0171(9) ltio- 0109 43
La2Cu04 004 2713 0061(8) 0045(9) 0067 39 006 4119 0124(7) ltio-^ 0079 77 020 3316 0074(10) 0078(10) 0102 29 040 6957 0210(30) 0026(81) 0135 29 200 3345 0074(8) 0061(10) 0087 69 400 7028 0130(10) 0023(95) 0089 29
Table 5 Microstructural parameters for Laij(5Srai3Cu04 and La2Cu04 powders
Specimen Direction (DUA) Pgt(A) lte^(fl3))laquo lte2((Z)gt2))laquo
Lai83Sro5Cu04
La2Cu04
[001] [110]
[001] [010] [100]
1700(300) 470(20)
1100(100) 680(50) 680(50)
2000(200) 940(20)
1200(100) 760(50) 810(50)
00024 00017
00038 00033 00016
000049(9) 000044(6)
00008(1) 00007(2) 00003(3)
c i ^- raquo sect 08 bulli - U
^0
ti- bull ll bull bullbullo
ffl M P bull- u ^ Di 04 Si - M bulldiamsbullbull a bull-v 3 o ^^=s^
u ^N^Sraquoraquo^
0 ^^^aaaa 1000
L(A) 2000
OQ bullbulldego UM o z a 08
o o bull bull bull
- u u bull raquo UU bull
a diams o bull o u ft 04 bull deg raquo deg - U bull bull deg Oi bullbullgt =3 bull- l o k u
0 bullbullbullraquo aaaMMi
500 1000
L(A)
Fig 17 Fourier coefficients for the first- (pluses) and second- order (crosses) reflection and size coefficients (circles) for [110] Lai^Sroi5Cu04
Fig 18 Fourier coefficients for first- (pluses) and second- order (crosses) reflection and size coefficients (circles) for [010] La2Cu04
341
Volume 98 Number 3 May-June 1993
Journal of Research of the National Institute of Standards and Technology
S3 Comparison with the Integral-Breadth Methods
Knowing the specimen integral breadths simpli- fied methods can be applied In Sec 212 we re- viewed multiple-line and single-line integral- breadth methods We shall compare the simplified multiple-line methods [Eqs (23) (24) and (30)] and the single-line method [76] [Eqs (29) and (30)] with results obtained for silver tungsten and La2-xSrxCu04 powders (Tables 3 and 5) We did not compare with the multiple-line Voigt-function method [26] because it was shown in Sec 44 that it is incompatible with the Warren-Averbach analy- sis In Table 6 integral breadth Pi was computed according to Eq (11) This value was compared with )8A integral breadth computed from Fourier coefficients [58]
i8A=- laquo3 2^(L)
(74)
Results obtained by the Warren-Averbach analysis are significantly smaller for both size and strain Integral-breadth methods give the upper limit for strain so comparison is limited Considering the approximation e = 125e^(L))^ [138] with L=(D)v2 or L=(D)s2 strains resemble more closely than crystallite sizes It must be noted how- ever that this approximation makes sense only in the case of pure-Gauss strain broadening Benedetti et al [106] reported excellent agreement for both size and strain using Warren-Averbach and Cauchy-Gauss [Eq (24)] methods Results from Table 6 on the contrary indicate that the Gauss-Gauss approximation gives values closest to the Warren-Averbach method for crystallite sizes whereas the Cauchy-Gauss and especially the Cauchy-Cauchy approximation tend to give too large values For strain the trend is opposite The Cauchy-Cauchy approximation resembles most
Table 6 Comparison of results obtained with the integral-breadth methods Cauchy-Cauchy (C-C) Cauchy-Gauss (C-G) Gauss- Gauss (G-G) and single-line (S-L) analysis
Specimen hkl PiXKP PAXKP ltigt)v (Z)gt(A) (e^((DV2)gt2 eXlO^ (A-) (A-0 (A) C-C C-G G-G S-L xlO^ C-C C-G G-G S-L
W untreated 110 220
0259 0247
0259 0247
3500 3700 3810 3810 14500 4040
008 -001 -003 -005 024 0
W ground 110 220
125 204
125 205
1030 2240 1450 1220 940 550
054 090 093 105 045 032
Ag untreated 111 2
0600 0901
0600 0900
2000 3340 2390 2190 1670 1110
024 035 039 095 0 0
200 124 124 1030 2270 1470 1230 810 047 082 085 095 0 400 204 204 490 0
Ag ground 111 222
198 352
200 352
650 2080 1240 910 530 280
095 179 182 197 048 0
200 403 406 350 9380 4780 1320 260 180 405 405 408 082 400 803 803 120 0
Lai85Sroi3Cu04 004 006
0657 0881
0650 0880
2000 5230 3290 2660 1970 1140
049 076 078 088 044 0
110 119 119 940 1240 1000 970 840 044 052 064 080 0 220 158 158 630 0
La2Cu4 004 006
0988 132
0998 131
1200 2980 1940 1630 1490 760
08 107 112 127 081 0-
020 143 142 760 1200 910 860 1240 07 079 090 110 114 040 198 200 510 016 200 126 124 810 810 810 810 1250 03 002 011 015 089 400 1S 126 830 014
Not possible to evaluate because of too small Gauss integral breadth
342
Volume 98 Number 3 May-June 1993
Journal of Research of the National Institute of Standards and Technology
closely a Warren-Averbach method These results concur with the Klug and Alexander [24] compari- son of the published size and strain values obtained by Warren-Averbach (Stokes) and integral-breadth methods However for x-ray diffraction the Cauchy-Gauss assumption for the size-strain broadening is theoretically and experimentally more favored thpoundm the other two models The fact that the Gauss-Gauss method for crystallite size and the Cauchy-Cauchy method for strain give more realistic results may mean that the presump- tion that size and strain broadening are exclusively of one type is an oversimplification
The single-line method seems much less reliable If Gaussian breadth is very small no information about strain is obtained Moreover second-order reflections give much lower values of both size and strain than do basic reflections However if multi- ple reflections are not available the single-line method can give satisfactory estimations
54 Reliability of Profile Fitting
The profile fitting of a cluster of even severely overlapping peaks can be accomplished with a low error and excellent fit of total intensity But how reliable is information obtained about separate peaks in the cluster In the fitting procedure it is possible to put constraints on the particular profile parameter to limit intensity position and width of the peak If anisotropic broadening or different phases are present constraints may not be realistic Morever acceptable results can be obtained even using a different number of profiles in refinement [4] Hence the first condition for the successful ap- plication of this method is knowledge of actual phases present in the sample and their crystalline structures
In this regard two powders were measured or- thorhombic Lai94Sroo6Cu04 has a slightly distorted K2NiF4-type structure (space group Bmab a =53510(2) A b =53692 A(2) c = 131931(7) A) and tetragonal Lai76Sro24Cu04 (space group I4mmm a =37711(3) A c = 132580(8) A) Data were collected for each specimen separately and for a specimen obtained by mixing the same pow- ders Because diffracted intensity of each phase was lower for the mixture counting time was pro- portionally increased to obtain roughly the same counting statistics Figure 19 shows two partially separated orthorhombic (020) (200) and (040) (400) peaks overlapped with tetragonal (110) and (220) reflections During the profile fitting of the mixed powders (200) orthorhombic peak tended to disappear on account of neighboring (020) and
(110) reflections Its intensity was constrained to vary in range plusmn 30 of (020) peak intensity which can be justified if the crystallographic structure is known
60
-60
345
345
335 29 (deg)
345
Fig 19 (upper) Lai76Sro24Cu04 (110) peak (middle) Lai94Sroo6Cu04 (020) and (200) peaks (lower) (110) (020) and (200) peaks
Table 7 contains results of fitted specimen-Voigt functions as well as size and strain values obtained by the analysis of broadening Comparing integral breadths of the starting and mixed powders some profiles change from more Cauchy-like to Gauss- like and vice versa This is especially evident for the (400) reflection meaning that accurate deter- mination of the profile tails is indeed affected in the cluster of overlapping peaks However integral breadth does not change significantly so results of
343
Volume 98 Number 3 May-June 1993
Journal of Research of the National Institute of Standards and Technology
Table 7 Comparison between two specimens run separately and mixed togetlier
Specimen hkl 2Hdeg) )3cO PoO DUA) (D)v(A) (e2laquoD)v2))laquoxlO
Lai76Sroj4CuOr 110 3369 0058(6) 0094(7) 780(60) 850(60) 10(1) 220 7073 022(2) 013(2)
LaiMSro(KiCu04 020 3342 0084(9) 055(14) 500(90) 1000(200) 07(1) 040 7012 010(2) 014(1) 200 3353 00216(85) 0061(8) 1100(100) 1200(100) 03(1) 400 7040 0026(11) 0088(8)
Mix 110 3367 0083(21) 0064(14) 800(300) 1200(300) 08(3) Lai76Sro24Cu04 220 7072 019(7) 013(4)
+ 020 3343 0066(35) 0070(23) 800(300) 1000(300) 07(4) Lai94Sroo6Cu04 040 7012 0116(93) 013(5)
200 3354 0024(156) 0071(61) 900(700) 1000(600) 04(12) 400 7041 011(2) 0003(320)
the multiple-line methods are not much influenced On the contrary the single-line method gives quite different results This may support the conclusion of Suortti Ahtee and Unonius [43] that the Voigt function fails to account properly for size and strain broadening simultaneously if only Cauchy integral breadth determines crystallite size
Table 7 shows that the results of Warren- Averbach analysis of starting and mixed powders agree in the range of standard deviations How- ever errors are much larger especially for the hid- den (200)-(400) reflections From Eq (62) it follows that more counts (longer counting times) and more observables (smaller step-size) would lower standard deviations Therefore in the case of highly overlapping patterns to obtain desirable ac- curacy much longer measurements are needed al- though that will not change the fact that higher overlapping implies intrinsically higher errors of all refinable parameters To further minimize possible artifacts of the fitting procedure it is desirable to include in the analysis as many reflections in the same ciystallographic direction as possible
55 Remarks
By modeling the specimen size and strain broad- ening with the simple Voigt function it is possible to obtain domain sizes and strains that agree with experiment and show a logical interrelationship Furthermore the Voigt function shows the correct 1A(26y asymptotic behavior of peak tails as ex- pected from kinematical theory [139] However if the specimen profile is significantly asymmetric (because of twins and extrinsic stacking faults [140 59]) or the ratio FWHM^ is not intermediate to the Cauchy (2Tr) and Gauss (2(ln27r)^) functions then the Voigt function can not be applied [25]
Suortti Ahtee and Unonius [43] found good over- all agreement by fitting the Voigt function to the pure-specimen profiles of a Ni powder deconvo- luted by the instrumental function However more accurate comparison is limited because of unavoid- able deconvolution ripples of specimen profiles Furthermore the Voigt function might not be flex- ible enough to model a wide range of specimen broadening as well as the different causes of broadening Therefore the question whether the Voigt function can satisfactorily describe complex specimen broadening over the whole 20 range in a general case needs further evaluation
This method of Fourier analysis with the as- sumed profile-shape function is most useful in cases when the classical Stokes analysis fails there- fore when peak overlapping occurs and specimen broadening is comparable to instrumental broaden- ing It was shown that for a high degree of peak overlapping the fitting procedure can give unreli- able results of Gauss and Cauchy integral breadths that is the peak can change easily from predomi- nantly Cauchy-like to Gauss-like and contrary This can lead to illogical values of size-integral and strain-integral breadths according to Eqs (52) (53) (54) and (55) and to irregularities in the be- havior of Fourier coefficients for large L Simulta- neously if the size-broadened profile has a large Gauss-function contribution the hook effect will occur However volume-weighted domain sizes D)y and MSS eL)) for small L are much less affected because they rely on both Cauchy and Gauss parts of the broadened profile Any integral- breadth method that attempts to describe the size and strain broadening exclusively by a Cauchy or Gauss function in this case fails completely For specimens with lower crystallographic symmetry
344
Volume 98 Number 3 May-June 1993
Journal of Research of the National Institute of Standards and Technology
when many multiple-order reflections are avail- able but the peaks are overlapped it is therefore desirable to include in the analysis as many reflec- tions as possible to minimize the potential artifacts of the fltting process
6 Analysis of Superconductors 61 (La-M)2Cu04 Superconductors
Bednorz and Miiller [16] found the first high- temperature oxide superconductor in the La-Ba- Cu-O system Soon after substituting Ba with Sr and Ca Kishio et al [17] found superconductivity in two similar compounds Later many compounds with much higher transition temperatures (Tc) were found The (La-M)2Cu04 system remains favorable for study because the cation content responsible for the superconductivity is easier to control and measure than the oxygen stoichiometry Also this system provides a wide range of substitutional cation solubility in which the tetragonal K2NiF4- type structure is maintained Compared with much- studied Y-Ba-Cu-O this structure is simpler because it contains only one copper-ion site and two oxygen-ion sites
The undoped compound La2Cu04 is orthorhom- bic at room temperature It becomes superconduct- ing either with cation substitution on La sites or increased oxygen content to more than four atoms per formula unit Doping with divalent cations in- creases the itinerant hole carriers in the oxygen- derived electron band [141] which probably causes the superconductivity However different dopants influence the transition temperature Tc Although the unit-cell c-parameter simply reflects ionic dopant size [142] the in-plane unit-cell parameter (and accordingly the Cu-0 bond length) correlates with Tc for different dopants and for different dop- ing amounts [142 143]
LaiB5MouCu04 (M = Ba Ca Sr) have a tetrago- nal K2NiF4-type structure space group lAlmmm with four atoms in the asymmetric unit [117] One site is occupied with La partially substituted with dopant ions (Fig 20) La2Cu04 is orthorhombic at room temperature The best way to correlate these two structures is to describe La2Cu04 in space group Bmab the c axis remains the same tetrago- nal [110] and [110] directions become [010] and [100] orthorhombic axes and size of the unit cell is doubled [144]
Figure 21 shows parts of the x-ray diffraction patterns observed and refined of Lai85Moi5Cu04 (M = Sr Ba Ca) and La2Cu04 Refined lattice
parameters are given in Table 8 Table 9 shows resuhs of the line-broadening analysis Relatively
La(BaCaSr)
0(2)
0(1)
Fig 20 Ciystal structure of (La-M)2Cu04 showing one unit cell
300 JUU
(b)
200
100
U 0 M J Js-r-^
30
-30
300
40 41 42 43 44 45 40 41 42 43 44 45 29 (deg) 29 (deg)
mdashA-
gt t 200
Z
F-
- 100
(c)
f V kgt ii I 40 41 42 43 44 45 40 41 42 43 44 45
e (deg) ^^ 26 (deg)
-30 wwX mdash Wlaquo-
Fig 21 Diffraction patterns of LaiH5Moi5Cu04 specimens (a) M=Sr (b) M = Ba (c)M = Ca (d) M = U
345
Volume 98 Number 3 May-June 1993
Journal of Research of the National Institute of Standards and Technology
Table 8 Lattice parameters and T^ at zero resistivity (Ac method at 10 Ma current)
Specimen a (A) bk) c(A) rc(K)
Lairaquo5Sroi5Cu04 377814(7)
Lairaquo3Baoi3Cu04 37846(2)
LaiiijCaoi5Cu04 37863(7)
La2Cu04 53558(2) 54053(2)
231(2) 36
288(4) 28
17(2) 19
1451(8)
Table 9 Results of line-broadening analysis for (La-M)2Cu4 specimens
Specimen hkl PcO PoO (DUk) (Iraquo)(A) lte^((D)2))
Lai(laquoSroj5Cu04 004 006
0046(4) 0083(5)
0024(8) ltio-
1700(300) 2000(200) 000049(9)
110 0110(5) ltio- 470(20) 940(20) 000044(6) 220 0171(9) ltio-
Lai85Baoi3Cu04 004 006
0049(6) 0110(7)
0076(6) 0089(9)
1100(200) 1100(100) 00011(2)
110 0087(4) 000042(6) 560(20) 1110(20) 000024(5) 220 0116(3) ltio-5
Laiji5Caoi5Cu04 004 006
0120(13) 0146(12)
0032(22) 0033(27)
440(70) 780(90) 00007(4)
110 0045(25) 0200(19) 340(30) 360(20) 00013(2) 220 0343(22) ltio-
La2Cu04 004 006
0061(8) 0124(7)
0045(9) ltio-
1100(100) 1200(100) 00008(1)
020 0074(10) 0078(10) 680(50) 760(50) 00007(2) 040 0210(30) 0026(81) 200 0074(8) 0061(10) 680(50) 810(50) 00003(3) 400 0130(10) 0023(95)
weak peak broadening was observed which can not be attributed to the proximity of the phase trans- formation Lai85SroisCu04 is tetragonal down to = 170 K [145] Lai85Baoi5Cu04 to 140 K [146147] and Lai85Caoi5Cu04 to 130 K [148] Another possi- ble reason for peak broadening might be continu- ous compositional variations in dopant content The scanning Auger microprobe analysis of La2-SrtCu04 compounds [149] showed that grain- boundary segregation of Sr is weak and limited to a narrow region near the grain surface In the case of the separation of two phases with different Sr con- tent and similar lattice parameters asymmetry of some reflections would be observed [150] More- over in the case of compositional inhomogeneity microstrains eL)) would be roughly independent of the averaging distance L in the grains [151] therefore distribution of strains would be Gaus- sian For all specimens microstrain behavior is identical it decreases linearly with distance L
Rothman and Cohen [115] showed that such be- havior of microstrains is caused by dislocations that might arise during grinding Assuming the same applied stress microstrain would be approximately inversely proportional to the elastic moduli of these materials If mean microstrain is defined as the arithmetic average of strains for the [001] and [110] directions results agree with values of the Youngs moduli for polycrystalline La2Cu04 Lai85Moi5Cu04 (M = Sr Ba Ca) [152] However other factors may contribute to the microstrain Coordination-6 ionic radii of La^+ Sr Ba^+ Ca^+ are 106 116 136 100 A respectively [153] Substitution of La with ions of different sizes affects the lattice parameter [142] and may cause much larger strains in the [001] direction when some of the ions are replaced with Ba^ than with Sr^ in accord with results in Table 9 Substitution of Ca^^ ions produces an entirely different effect microstrains in the [110] direction are larger This may be explained by
346
Volume 98 Number 3 May-June 1993
Journal of Research of the National Institute of Standards and Technology
comparing effects of substitutional ions on the unit-cell a -parameter The Ba-doped specimen has a larger a-parameter than the Sr-doped but the Ca-doped a-parameter is largest although Ca^^ has the smallest ionic size This should increase the cell distortion in the a-b plane
Table 9 reveals high anisotropy in these materi- als consistent with other physical properties such as thermal expansion [154] and upper critical mag- netic field [155] Differences of domain sizes might arise from a layered structure in the [001] direction and consequently easy incorporation of stacking faults between regularly stacked layers The stack- ing-fault and twin-fault probabilities can be esti- mated from the average surface-weighted domain sizes [59]
^ = TAN + cf1fun(aa) (75) m im - (D)
Here c is a constant for the particular [hkl] direction and fun(a a) a linear combination of stacking-fault probability and twin-fault probability a The exact form of Eq (75) was derived only for the cubic and hexagonal crystal structures On con- dition that the true domain dimension D is isotropic or so large that the second term of Eq (75) dominates a linear function of stacking-fault and twin-fault probability is
fun(aa) = c( 1
) (76) Zgt)J (Dgttrade
Here c denotes a constant that depends only on geometrical factors and is the same for all three doped compounds
Figure 22 shows a possible correlation between Tc and fault-defect probabilities computed from TEM observations of La2-jcSrCu04 revealed that stacking-fault density increased with Sr content up to jc = 015 [156] That study suggests that a shear mechanism forming the fault-boundary dislocations implies oxygen vacancies andor cation deficiency We did not measure oxygen content but neutron- diffraction studies showed that oxygen deficiency starts to appear at much higher Sr content [157] However the increase of fault probability with the simultaneous decrease of microstrain in Fig 22 supports the assumption that defects are intro- duced to accommodate lattice strains [156] A simi- lar increase in Te was found in Y2Ba4Cu802o-laquo thin films [158] Compounds with asymmetric broad- ened and shifted peaks showed higher Tc which
was attributed to stacking faults Although extrinsic stacking faults may cause asymmetric peak broad- ening [140] it is probably caused by twinning Twinning in La-M-Cu-0 materials is less abundant than in Y-Ba-Cu-O compounds but it was ob- served in (La-Sr)2Cu04 monocrystals on (110) planes [159] In the profile-fitting procedure peak asymmetry is incorporated only in the instrumental function therefore we could not model asymmetric peak broadening However any significant asym- metry of the specimen profile would cause an un- even fit of low-angle and high-angle sides of peaks which was not observed This gives much more im- portance to stacking faults in Eq (76)
Fig 22 Arithmetic average of [110] and [001] root-mean- square strains and linear function of stacking-fault and twin- fault probabilities as a function of Tc
In Fig 22 average microstrains defined as the arithmetic average of [001] and [110] directions correlate inversely with Tc However we did not find a correlation of Tc and microstrains in a partic- ular direction [001] microstrains simply reflect dif- ference in size of dopant and host La^ ions (see Table 9)
In La2Cu04 (OkO) reflections are significantly broader than (hOO) This has also been observed in low-temperature orthorhombic Lai85Sroi5Cu04 and Lai85Baoi5Cu04 [160] and explained by either stacking faults or possible lower symmetry Our results reveal that domain sizes (D) have identical values for [010] and [100] directions (Table 9) From Eq (76) it follows that stacking-fault proba- bilities in these directions have the same values However microstrains in the [010] direction are roughly twice as large as in the [100] direction which is responsible for the different broadening In the case of doped La2Cu04 compounds different microstrains might be caused by oxygen
347
Volume 98 Number 3 May-June 1993
Journal of Research of the National Institute of Standards and Technology
vacancies ordered along one direction in the a-b plane similar to effects found in YBa2Cu307-laquo However undoped La2Cu04 is not expected to have significant o^Qgen deficiency Other possibili- ties are lower ciystallographic symmetry andor La vacancies although they were not reported for this system but La deficiency was found in an La2Co04 compound [161]
We can conclude that lattice strains and incoher- ently diffracting domain sizes confirm high an- isotropy in these materials This simple approach however does not allow unambiguous identifica- tion of the strains origin Probably the strains originate from dislocations and from different sizes of host and dopant ions Domain sizes of all com- pounds are larger in the c-direction than in the a-6 plane This indicates existence of stacking faults and twins However because estimated errors are relatively large and only three materials were stud- ied the possible connection between stacking faults and 7c needs further study
62 Bi-Cu-O Superconductors
Among the high-Tc superconductors the Bi- Cu-O compounds appear intriguing especially because their incommensurate structure modula- tion remains incompletely understood [162 163] The crystal structure consists of perovskite-like SrO-(Cu02Ca)mi-Cu02-SrO layers separated by NaCl-like BiO double layers (see Fig 23 [164]) The number m of Cu02 layers alters the supercon- ducting transition temperature Tc (for m = 12 and 3 rclaquo10 90 and 110 K respectively) This two- dimensional layered structure makes these materi- als highly anisotropic and favours the creation of defects
Bulk sintered specimens showed relatively weak peak broadening Moreover the diffraction pat- terns contained many overlapping peaks because the compound crystallizes in an orthorhombic low- symmetry space group A2aa [165] and incommen- surate modulation gives superlattice reflections All patterns revealed a strong [001] texture (Fig 24) making reflections other than (001) difficult to ana- lyze The lattice parameters vary depending on the exact compound stoichiometry and processing his- tory but characteristically they have almost identi- cal a and b parameters and large c parameter fl =54095 A 6=54202 A c =309297 A for Bi2Sr2CaCu208 (Bi-2212 [166] and A =5392 A b =5395 A c =36985 A for (BiPb)2Sr2Ca2Cu30io (BiPb-2223) [165] Thus we treated (hOO) and (0^0) reflections as single peaks Table 10 gives the
results for three specimens Bi-2212 (BiPb)2 (SrMg)2(BaCa)2Cu30io (BiPbMgBa-2223) which were one-phase specimens and BiPb-2223 con- taining approximately equal amounts of 2212 and 2223 phases The in-plane lattice parameters of 2212 and 2223 phases differ little hence only the [00] directions of the mixed-phase specimen were evaluated
b^ (c)
Fig 23 Average crystal structure of Bi2Sr2Cam-iCum04+2m for (a) m = 1 (b) w =2 (c) m =3 [164]
35
-35
42 44 46 48 50 52 54 56 58 60 62 26 (deg)
^ ^^^MK^Aa^Ndllaquop
Fig 24 Part of BiPbMgBa-2223 refined pattern There are 48 fundamental reflections in this region
Interpretation of the results in the case of these complicated compounds must be considered care- fully Microstrains are probably caused by disloca- tion arrays However substitution of different-sized ions and vacancies would also contribute to the strains as would other kinds of disorder especially
348
Volume 98 Number 3 May-June 1993
Journal of Research of the National Institute of Standards and Technology
Table 10 Results of line-btoadening analysis for Bi-Cu-O supreconductors
Specimen Phase hkl (A)
eD)sa)y^
Bi-2212 2212 008 0012
0163(8) 022(3)
001(6) 005(6)
420(80) 00021(6)
020+200 0104(4) ltio-^ 580(30) 00007(1) 040+400 018(2) 00004(6300)
BiPbMgBa-2223 7773 0010 0020
0097(1) 021(2)
00002(1700) 0007(150)
770(60) 00012(1)
020 + 200 012(27) 013(10) 380(430) 00009(71) 040 + 400 015(95) 021(33)
BiPb-73 2212 008 0012
023(2) 025(5)
0002(350) 0001(1000)
220(30) 00013(26)
2223 0010 0020
022(8) 023(99)
0092(67) 018(47)
230(190) 00012(197)
Stacking faults and twins Table 10 shows larger strains in the [001] direction that in the basal plane This can be explained by stacking disorder along the c-axis which was frequently observed in electron-diffraction patterns as streaking [167 168] Easy incorporation of stacking faults is possi- ble because of the two-dimensional weak-bonded layers (BiO double layers are spaced about 3 A apart) The difference in microstrain between in- plane and the c-direction is much smaller for the BiPbMgBa-2223 phase probably because Pb low- ers the faulting by stabilizing the higher-Tc 2223 phase [167] For the BiPb-2223 specimen with two phases there are two possibilities Either the speci- men consists mainly of a mk of two kinds of one- phase grains or both phases occur within the same grains The second possibility was confirmed exper- imentally [169 170] and our results concur be- cause microstrain in the 2212 phase is much smaller than in the one-phase Bi-2212 specimen Processing conditions and cation content probably favour development of the macroscopic inter- growth of both phases within the grains that is microscopic defects grow to sufficiently large re- gions to give a diffraction pattern of another phase with the different number of Cu02 layers As a re- sult strain is relieved and both strains and domain sizes being quite different in one-phase specimens tend to equalize
For the Bi-Cu-O specimens the mean surface- weighted domain sizes are generally smaller than for (La-M)2Cu04 compounds Therefore the com- putation of the stacking- and twin-fault probabili- ties by using Eq (75) may be wrong It would be very instructive to compare the different broaden-
ing of satellite and fundamental reflections which indicates a more pronounced stacking disorder in the modulated structure [171]
In summary we found that for both Bi-2212 and BiPbMgBa-2223 superconductors the c-axis strain exceeds the in-plane strain The BiPb-2223 specimen containing both 2212 and 2223 phases within the single grains shows smaller incoherently diffracting domains and lower c-axis strain than the one-phase specimens This fact may direct us to- ward the mechanism of the second-phase forma- tion in these materials
63 Remarks
It was shown that this particular method of the line-broadening analysis can give information about the size of incoherently diffracting domains and lattice strains in (La-M)2Cu04 and Bi-Clu-O superconductors Moreover results show high an- isotropy of both size and strain parameters as one may expect because of the layered structure of all superconducting cuprates Generally structural line broadening is not large that is a result of rela- tively large domain sizes (200-2000 A) and small strains (002-02) It is interesting to compare these values with the published results for YBa2Cu307-laquo (isotropic strains of 023 [77] and 005-03 [82]) Although the different materi- als were studied they seem too large especially be- cause they are the average of strains in different directions
The main drawback of the line-broadening the- ory is the uncertainty about the origins of the line broadening that is it is difficult to distinguish the main effects responsible for the broadening For
349
Volume 98 Number 3 May-June 1993
Journal of Research of the National Institute of Standards and Technology
the novel superconductors particularly the numer- ous defects (substitutions vacancies stacking faults dislocations and similar) can occur simulta- neously which makes it very difficult to determine their individual contributions Furthermore the crystal structures of most novel superconductors are relatively complicated The average structure has mostly a slightly distorted tetragonal symmetry very similar a and b lattice parameters and a large c parameter but c=36 for YBa2Cu307-laquo for in- stance This results in a large number of overlap- ping peaks and consequently in large errors of all results This showed especially in the case of Bi-Cu-O superconductors (see Table 10) Follow- ing the discussion of reliability of profile fitting in Sec 54 it would be desirable to include more than two reflections in the analysis of broadening but higher-order peaks are usually too weak and over- lapped One way to partially solve this problem would be a whole pattern fitting [172 173] and Rietveld structure refinement [23] in terms of size and strain parameters This requires an accurate preset function to model specimen broadening and precise definition of angular dependence of size and strain parameters The Rietveld programs that model the line broadening in terms of size and strain parameters are based either on the simpli- fied integral-breadth methods [78 95] or on the single-line method [174]
7 Conclusions
A method for analyzing the pure-specimen (structural) broadening of x-ray diffraction line profiles is proposed By modeling the specimen size and strain broadenings with the simple Voigt func- tion it is possible to obtain domain sizes and strains that agree with experiment and show a logi- cal interrelationship Furthermore some common consequences and problems in the Fourier-method analysis follow easily The specimen function is convoluted with the instrumental function to match the observed x-ray diffraction-line profile This avoids the Stokes deconvolution method thus al- lowing analysis of patterns with highly overlapping peaks and weak structural broadening Therefore the method was applied to some novel high-Tc superconductors We reached the following conclu- sions
(i) Surface-weighted domain size depends only on the Cauchy integral breadth of the size-broad- ened profile
(ii) The hook effect occurs when the Cauchy-content of the size-broadened profile is un-
derestimated that is for ^sc(n2)^3sG Usually this happens when the background is estimated too high so the long tails of the Cauchy function are prematurely cut off
(iii) It also follows from conclusion (ii) that the volume-weighted domain size can not be more than twice the surface-weighted domain size (limiting value D)v=2D)i is obtained for the pure-Cauchy size-broadened profile) Minimum value for D)J (D)j should not be less than -131
(iv) If the distortion coefficient is approxi- mated with a harmonic term this leads exactly to the Warren-Averbach method of separation of size and strain broadenings
(v) In that case mean-square strains decrease linearly with the distance L
(vi) It is possible to evaluate local strain ((e^(0))^) only in the case of pure-Gauss strain broadening Then root-mean-square strain is inde- pendent of the distance L and related to the upper limit of strain obtained from the integral breadth of the strain-broadened profile
(vii) If strain broadening is not described exclu- sively with the Gauss function the multiple-line Voigt integral breadth and Warren-Averbach analyses can not give the same results for volume- weighted domain size although D)v is defined identically in both approaches because the appar- ent strain -q = pdeg(29)cot9 is not angular- independent
(viii) Smooth size coefficients give column- length distribution functions without oscillations and make possible a computation of volume- weighted average domain sizes up to ~5000 A
(ix) Comparison with the simplified integral- breadth methods in most cases has shown not large but systematic discrepancy of results indicat- ing that size and strain broadening can not be accu- rately modeled by a single Cauchy or Gauss function Moreover the application of the single- line method is much less reliable and it should not be used where multiple reflections are available
(x) The knowledge of all phases present in the sample and their crystallographic structure is re- quired to successfully fit a cluster of overlapping peaks Although it is very difficult to accurately de- termine the Cauchy-Gauss ratio of an overlapped peak final results of domain size and strain are much less affected Therefore connecting the crys- tallite size exclusively with the Cauchy content and strain with the Gauss content of a specimen profile might be doubtful
(xi) Evaluated errors of domain sizes and strains increase substantially with the degree of
350
Volume 98 Number 3 May-June 1993
Journal of Research of the National Institute of Standards and Technology
peak overlapping Hence for complicated patterns very accurate measurements are necessary and one needs to analyze as many reflections in the same crystallographic direction as possible
(xii) Line-broadening analysis of (La-M)2Cu04 and Bi-Cu-O compounds confirms high anisotropy in these materials
(xiii) Strains in (La-M)2Cu04 probably origi- nate from dislocations and from different sizes of host and dopant ions
(xiv) Stacking-fault probability in (La-M)2Cu04 (M = Ba Ca Sr) increases with increasing Tc whereas the average strain decreases
(xv) In La2Cu04 different broadening of (lOO) and (OfcO) reflections is not caused by stacking faults
(xvi) All Bi-Cu-0 superconductors show larger strain in the c-direction than in the a-b plane which can be explained by stacking disorder along the [001] direction
(xvii) In the specimen with approximately equal amounts of Tl-2212 and TlPb-2223 phases it is likely that a secondary phase develops by the growth of the microscopic faulted regions of the primary phase
Acknowledgments
I am thankful to Dr Harry McHenry for his support and especially to Dr Hassel Ledbetter for his wise guidance and most useful help during my stay at NIST I am also indebted to my home insti- tution the Faculty of Metallurgy of the University of Zagreb for allowing me the leave of absence at NIST
8 References
[1] W Friedrich P Knipping and M v Laue Ann Physik 41 971 (1912)
[2] H M Rietveld Acta Cryst 22 151 (1967) [3] H M Rietveld J Appl Cryst 2 65 (1969) [4] S A Howard and K D Preston in Modern Powder Dif-
fraction Vol 20 The Mineralogical Society of America Washington DC (1989) p 217
[5] D Taupin J Appl Cryst 6 266 (1973) [6] T C Huang and W Parrish Appl Phys Lett 27 123
(1975) [7] M K Wu J R Ashburn C J Torng P H Hor R L
Meng L Gao Z J Hwang Y Q Wang and C W Chu Phys Rev Lett 58 908 (1987)
[8] D Shi MRS Bull 16 37 (1991) [9] D Larbalestier Phys Today 44 74 (1991)
[10] J C Phillips Phys Rev B 4512647 (1992) [11] B Raveau Phys Today 45 53 (1992) [12] A J Millis and K M Rabe Phys Rev B 38 8908 (1988)
[13] F Guinea Europhys Lett 7 549 (1988) [14] C P Dhard and P Singh in Proc Int Symp High-Temp
Supercond Jaipur India Oxford amp IBH Publishing New Delhi (1988) p 271
[15] J D Jorgensen Phys Today 44 34 (1991) [16] J G Bednorz and K A Muller Z Phys B 64 189
(1986) [17] K Kishio K Kitazawa S Kaube I Yasuda N Sugii H
Takagi S Uchida K Fueki and S Tanaka Chem Lett 429 (1987)
[18] J D Jorgensen B Dabrowski S Pei D G Hinks L Soderholm B Morosin J E Venturini and D S Ginley Phys Rev B 38 11337 (1988)
[19] J R Clem Phys Rev B 43 7837 (1991) [20] M Paranthaman M Foldejiki D Balzar H Ledbetter
A J Nelson and A M Hermann submitted to Phys Rev B
[21] A R Stokes Proc Phys Soc Lond 61 382 (1948) [22] B E Warren and B L Averbach J Appl Phys 23 497
(1952) [23] R Delhez Th H de Keijser and E J Mittemeijer in
Accuracy in Powder Diffraction S Block and C R Hub- bard eds Natl Bur Stand (US) Special Publication 567 (1980) p 213
[24] H P Klug and L E Alexander X-ray Diffraction Proce- dures 2nd Edition John Wiley New York (1974) p 661
[25] J I Langford J Appl Ciyst 11 10 (1978) [26] J I Langford in Accuracy in Powder Diffraction S
Block and C R Hubbard eds Natl Bur Stand (US) Special Pubication 567 (1950) p 255
[27] R Delhez Th H de Keijser and E J Mittemeijer Fre- senius Z Anal Chem 312 1 (1982)
[28] A J C Wilson Proc Phys Soc Lond 80 286 (1962) [29] A J C Wilson Proc Phys Soc Lond 81 41 (1963) [30] L P Smith Phys Rev 46 343 (1934) [31] H C Burger and P H van Cittert Z Phys 79 722
(1932) [32] S Ergun J Appl Ciyst 1 19 (1968) [33] R Croche and L Gatineau J Appl Ciyst 10479 (1977) [34] L H Schwarz and J B Cohen Diffraction from Materi-
als Academic Press New York (1977) p 391 [35] R Delhez Th H de Keijser E J Mittemeijer and J I
Langford J Appl Cryst 19 459 (1986) [36] R Delhez Th H de Keijser E J Mittemeijer and J I
Langford Aust J Phys 41 213 (1988) [37] R A Young and D B Wiles J Appl Cryst 15 430
(1982) [38] W Voigt Stizungsber K Bayer Akad Wiss 42 603
(1912) [39] E E Whiting J Quant Spectrosc Radiat Transfer 8
1379 (1968) [40] G K Wertheim M A Butler K W West and D N E
Buchanan Rev Sci Instrum 111369 (1974) [41] M M Hall Jr V G Veeraraghavan H Rubin and P G
Winchell J Appl Cryst 10 66 (1977) [42] A Brown and J W Edmonds Adv X-Ray Anal 23 361
(1980) [43] P Suortti M Ahtee L Unonius J Appl Cryst 12 365
(1979) [44] T Sundius J Raman Spectrosc 1 471 (1973) [45] B H Armstrong J Quant Spectrosc Radiat Transfer 7
61 (1967) [46] J F Kielkopf J Opt Soc Am 63 987 (1973) [47] B P Asthana and W Kiefer Appl Spectr 36 250
(1982)
351
Volume 98 Number 3 May-June 1993
Journal of Research of the National Institute of Standards and Technology
[48] J P M de Vreede S C Mehrotra A Tal and H A Dijkerraan Appl Spectr 36 227 (1982)
[49] F R L Schoening Ada Ciyst 18 975 (1965) [50] P Scherrer Gott Nachr 2 98 (1918) [51] A R Stokes and A J C Wilson Proc Cambridge
Philos Soc 38 313 (1942) [52] A J C Wilson X-Ray Optics 2nd edition Methuen
London (1962) [53] S Leie and T R Anantharaman Proc Indian Acad
Sci Sect A H 261 (1966) [54] D Louer D Weigel and J I Langford J Appl Ciyst
5 353 (1972) [55] A J C Wilson J Appl Ciyst 2 181 (1969) [56] J I Langford and A J C Wilson J Appl Ciyst 11102
(1978) [57] A R Stokes and A J C Wilson Proc Phys Soc Lond
56174 (1944) [58] B E Warren and B L Averbach J Appl Phys 21 595
(1950) [59] B E Warren X-Ray Diffraction Addison-Wesley
Reading Massachusetts (1969) p 264 [60] B E Warren in Progress in Metal Physics Vol 8 Perg-
amon Press London (1959) p 146 [61] F Bertaut C R Acad Sci Paris 228 187 (1949) [62] N C Haider and C N J Wagner Acta Cryst 20 312
(1966) [63] D Balzar and H Ledbetter in Proceedings of the Accu-
racy in Powder Diffraction II Natl Inst Stand Technol (1992) p 37
[64] D Balzar and H Ledbeter J Appl Cryst 26 (1993) in press
[65] J N Eastabrook and A J C Wilson Proc Phys Soc Lond B 65 67 (1952)
[66] R S Smith IBM J Res Develop 4 205 (1960) [67] B Y Pines and A F Sirenko Soviet Physics Ciyst 715
(1962) [68] G B Mitra and N K Misra Acta Ciyst 22 454 (1967) [69] A Gangulee J Appl Ciyst 7 434 (1974) [70] J Mignot D Rondot Acta Met 231321 (1975) [71] J Mignot and D Rondot Acta Ciyst A 33 327 (1977) [72] R K Nandi H K Kuo W Schlosberg G Wissler J B
Cohen and B Crist Jr J Appl Ciyst 17 22 (1984) [73] M Zocchi Acta Ciyst A 36164 (1980) [74] P Ramarao and T R Anantharaman Trans Ind Ins
Metals 18 181 (1965) [75] R K Nandi and S P Sen Gupta J App Cryst 11 6
(1978) [76] Th H de Keijser J I Langford E J Mittemeijer and
B P Vogels J Appl Ciyst IS 308 (1982) [77] A Williams G H Kwei R B Von Dreele A C Lar-
son L D Raistrick and D L Bish Phys Rev B 37 7960 (1988)
[78] A C Larson and R B Von Dreele Los Alamos Na- tional Laboratory Report No LA-UR-86-748 (1988)
[79] J D Jorgensen D H Johnson M H Mueller J G Worlton and R B Von Dreele in Proceedings of the Conference on Diffraction Profile Analysis Cracow Poland (1978) p 20
[80] R B Von Dreele J D Jorgensen and C G Windsor J Appl Ciyst 15 581 (1982)
[81] P Thompson D E Cox and J B Hastings J Appl Ciyst 20 79 (1987)
[82] J P Singh R A Guttschow D S Kupperman J T Dusek and R B Poeppel in High Temperature Super-
conducting Compounds III S Whang A Gupta and E Ceilings eds TMS AIME Warrendale (1991) p 281
[83] M O Eatough D S Glnley and B Morosin Adv X- Ray Anal 33 145 (1990)
[84] E J Peterson P J Kung R E Muenchausen and D M Smith in Proceedings of the 41st Annual Denver Conference on Applications of X-Ray Analysis Colo- rado Springs Colorado (1992) p 74
[85] M Rand J I Langford and J S Abell submitted to J Cryogenics (1992)
[86] D Balzar J Appl Ciyst 25 559 (1992) [87] D Balzar H Ledbetter and A Roshko Physica C 185-
189 871 (1991) [88] D Balzar and H Ledbetter J Mater Sci Lett 111419
(1992) [89] D Balzar H Ledbetter and A Roshko Pow Diffr 8
(1993) in press [90] S Johnson M Gusraan D Rowcliffe T Geballe and J
Sun Adv Ceram Mater 2 337 (1987) [91] H Ledbetter S A Kim R B Goldfarb and K Togano
Phys Rev B 39 9689 (1989) [92] H Friedman Electronics 132 (1945) [93] W Parrish (ed) in Advances in X-Ray Diffractometry
and X-Ray Spectrography Centrex Publishing Company Eindhoven The Netheriands (1962)
[94] W Soller Phys Rev 24158 (1924) [95] S A Howard R L Snyder J Appl Ciyst 22 238
(1989) [96] G H Stout and L H Jensen X-Ray Structure Determi-
nation 2nd edition Wiley New York (1989) p 373 [97] D E Appleman and T Evans Jr Final Report 92-14
US Geological Survey Washington DC (1973) Avail- able as NTIS Document No PB-216188
[98] M U Cohen Rev Sci Instrum 6 68 (1935) [99] M U Cohen Rev Sci Instrum 7 155 (1936) [100] M H Mueller L Heaton and K T Miller Acta Ciyst
13 828 (1960) [101] R A Young P E Mackie and R B Von Dreele J
Appl Ciyst 10 262 (1977) [102] D B Wiles and R A Young J Appl Cryst 14 149
(1981) [103] J K Yau and S A Howard J Appl Ciyst 22 244
(1989) [104] S A Howard J K Yau and H U Anderson J Appl
Phys 65 1492 (1989) [105] S Enzo G Fagherazzi A Benedetti and S Poilizzi J
Appl Ciyst 21 536 (1988) [106] A Benedetti G Fagherazzi S Enzo and M
Battagliarin J Appl Cryst 21 543 (1988) [107] Th H de Keijser E J Mittemeijer and H C F Rozen-
daal J Appl Ciyst 16 309 (1983) [108] Y Zhang J M Stewart C R Hubbard and B Mo-
rosin Adv X-Ray Anal 33 373 (1990) [109] Y Wang S Lee and Y Ue J Appl Ciyst IS 35
(1982) [110] V N Selivanov and E F Smislov Zavod Lab 57 28
(1991) [Ill] A Guinier X-Ray Diffraction W H Freeman San
Francisco (1963) p 139 [112] M Wilkens J Appl Cryst 12119 (1979) [113] D Du and Y Wang Pow Diffr 2180 (1987) [114] A P Prudnikov Yu A Brychkov and O L Marichev
Integrals and Series Vol 1 Gordon and Breach Am- sterdam The Netheriands (1986) p 344
352
Volume 98 Number 3 May-June 1993
Journal of Research of the National Institute of Standards and Technology
[115] R L Rothman and J B Cohen J Appl Phys 42 971 (1971)
[116] T Adier and C R Houska J Appl Phys 50 3282 (1979)
[117] C R Houska and T M Smith J Appl Phys 52 748 (1981)
[118] S Rao and C R Houska Acta Ciyst A 4214 (1986) [119] J I Langford R Delhez Th H de Keijser and E J
Mittemeijer Ausi J Phys 41173 (1988) [120] J I Langfoid J Appl Cryst IS 315 (1982) [121] M J Turunen Th H de Keijser R Delhez and N M
van der Pers J Appl Ciyst 16176 (1983) [122] A J C Wilson Acta Ciyst 23 888 (1967) [123] A J C Wilson Acta Ciyst A 24 478 (1968) [124] A J C Wilson Acta Ciyst A 25 584 (1969) [125] G Gagliotti A Paoletti and F P Ricci Nucl Instrum
3 223 (1958) [126] J I Langford R J Cernik and D Louer J Appl
Ciyst 24 913 (1991) [127] J I Langford in Accuracy in Powder Diffraction II
preprint [128] A J C Wilson Mathematical Theory of X-Ray Powder
Diffractometiy Centrex Eindhoven The Netherlands (1963)
[129] J L Langford Prog Ciyst Growth and Charact 14185 (1987)
[130] T G Fawcett C E Crowder S J Brownell Y Zhang C R Hubbard W Schreiner G P Hamill T C Huang E Sabino J I Langford R Hamilton and D Louer Pow Diffr 3 209 (1988)
[131] W L Smith J Appl Ciyst 9187 (1976) [132] J L Langford and D Louer J Appl Ciyst 15 20
(1982) [133] Fl Popescu and L Benes Acta Ciyst A 33 323 (1977) [134] P PSuse^cu R MSnaila M Popescu and E Jijovici j
Appl Cryst 7 281 (1974) [135] P F Bley Y Calvayrac and M Fayard J Appl Ciyst
7 493 (1974) [136] B Moraweck Ph de Montgolfier and A J Renouprez
J Appl Ciyst 10191 (1977) [137] A Le Bail and D Louer J Appl Cryst 11 50 (1978) [138] D R Buchanan R L McCuUough and R L Miller
Acta Ciyst 20 922 (1966) [139] P Suortti and L D Jennings Acta Cryst A 33 1012
(1977) [140] J B Cohen and C N J Wagner J Appl Phys 33 2073
(1962) [141] A Bianconi J Budnick A M Flank A Fontaine P
Lagarde A Marcelli H Tolentino B Chamberland C Michel B Raveau and G Demazeau Phys Lett A127 285 (1988)
[142] K Fueki K Kitazawa K Kishio T Hasegawa S Uchida H Takagi and S Tanaka in Chemistiy of High- Temperature Superconductors D L Nelson M S Whittingham and T F George eds American Chemi- cal Society (1987) p 38
[143] T Fujita Y Aoki Y Maeno J Sakurai H Fukuba and H Fujii J Appl Phys 26 U68 (1987)
[144] R M Hazen in Physical Properties of High-rc Super- conductors Vol 2 D M Ginsberg ed World Scien- tific Singapore (1990) p 121
[145] J B Torrance A Bezinge A I Nazzal T C Huang S P Parkin D T Keane S J LaPlaca P M Horn and G A Held Phys Rev B 40 8872 (1989)
[146] J D Axe A H Moudden D Hohlwein D E Cox K
M Mohanty A R Moodenbaugh and Y Xu Phys Rev Lett 62 2751 (1989)
[147] T Suzuki and T Fujita Physica C 159 111 (1989) [148] T Fujita and Y Maeno in Superconducting Materials
JJAP Series 1 (1988) p 34 [149] A Roshko and Y-M Chiang J Appl Phys 66 3710
(1989) [150] D E Cox S C Moss R L Meng P H Hor and C W
Chu J Mater Res 31327 (1988) [151] B Crist and J B Cohen J Polym Sci 17 1001 (1979) [152] H Ledbetter S Kim and A Roshko Z Phys B 89275
(1992) [153] R D Shannon and C T Prewitt Acta Ciyst B 25 925
(1969) [154] M Lang H Spille F Steglich Y Hidaka T Murakami
and Y Endoh Physica C 162-1641037 (1989) [155] Y Hidaka and T Murakami Phase trans 15 241
(1989) [156] P L Gai and E M McCarron Science 247 553 (1990) [157] T Kamiyama I Izumi H Asano H Takagi S Uchida
Y Tokura E Takayama-Muromachi M Matsuda K Yamada Y Endoh and Y Hidaka Physica C 172 120 (1990)
[158] A Kapitulnik Physica C 153-155 520 (1988) [159] L A Muradyan V N Molchanov R A Tamazyan and
V I Simonov Physica C 162-164 536 (1989) [160] P Day M Rosseinsky K Prassides W I F David O
Moze and A Soper J Phys C 20 L429 (1987) [161] J T Lewandowski R A Beyerlein J M Longo and R
A McCauley J Amer Ceram Soc 69 699 (1986) [162] R Ramesh G van Tendeloo G Thomas S M Green
Y Mei C Jiang and H L Luo Appl Phys Lett 53 2220 (1988)
[163] J Schneck L Pierre J C Tolddano and C Daguet Phys Rev B 39 9624 (1989)
[164] O Eibl Physica C 168 215 (1990) [165] W Carrilo-Cabrera and W Gopel Physica C 161 373
(1989) [166] P Bordet J J Capponi C Chaillout J Chenavas A
W Hewat E A Hewat J L Hodeau M Marezio J L Tholence and D Tranqui Physica C 156189 (1988)
[167] R Ramesh K Remschnig J M Tarascon and S M Green J Mater Res 6 278 (1991)
[168] Z Hiroi Y Ikeda M Takano and Y Bando J Mater Res 6 435 (1991)
[169] Y Inoue M Hasegawa Y Shichi I Munakata M Ya- manaka S Hiyama and O Nittono J Mater Res 5 737 (1990)
[170] R Ramesh B G Bagley J M Tarascon S M Green M L Rudee and H L Luo J Appl Phys 67 379 (1990)
[171] X B Kan J Kulik P C Chow S C Moss Y F Yan J H Wang and Z X Zhao J Mater Res 5 731 (1990)
[172] G S Pawley J Appl Ciyst 13 630 (1980) [173] H Toraya J Appl Ciyst 19 440 (1986) [174] L Lutterotti and P Scardi J Appl Ciyst 23 246
(1990)
About the author Davor Balzar is with Faculty of Metallurgy of the University of Zagreb Sisak Croatia and was a Guest Researcher at fflST The National Institute of Standards and Technology is an agency of the Technology Administration US Department of Commerce
353
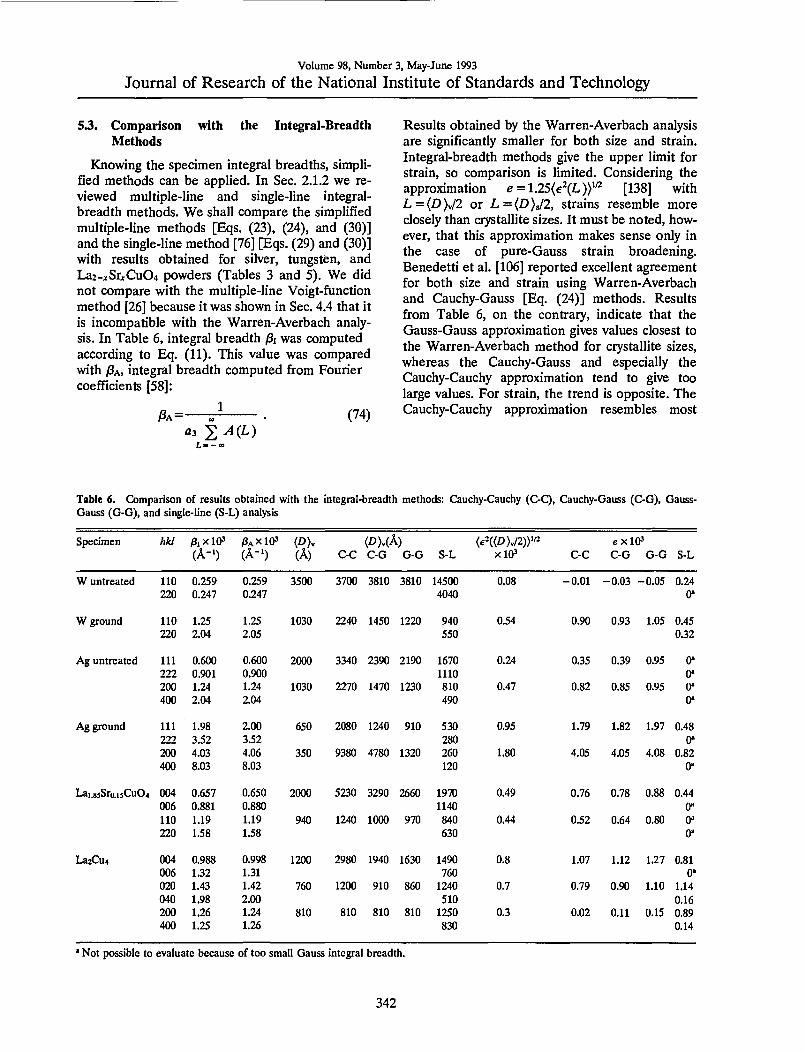
Volume 98 Number 3 May-June 1993
Journal of Research of the National Institute of Standards and Technology
S3 Comparison with the Integral-Breadth Methods
Knowing the specimen integral breadths simpli- fied methods can be applied In Sec 212 we re- viewed multiple-line and single-line integral- breadth methods We shall compare the simplified multiple-line methods [Eqs (23) (24) and (30)] and the single-line method [76] [Eqs (29) and (30)] with results obtained for silver tungsten and La2-xSrxCu04 powders (Tables 3 and 5) We did not compare with the multiple-line Voigt-function method [26] because it was shown in Sec 44 that it is incompatible with the Warren-Averbach analy- sis In Table 6 integral breadth Pi was computed according to Eq (11) This value was compared with )8A integral breadth computed from Fourier coefficients [58]
i8A=- laquo3 2^(L)
(74)
Results obtained by the Warren-Averbach analysis are significantly smaller for both size and strain Integral-breadth methods give the upper limit for strain so comparison is limited Considering the approximation e = 125e^(L))^ [138] with L=(D)v2 or L=(D)s2 strains resemble more closely than crystallite sizes It must be noted how- ever that this approximation makes sense only in the case of pure-Gauss strain broadening Benedetti et al [106] reported excellent agreement for both size and strain using Warren-Averbach and Cauchy-Gauss [Eq (24)] methods Results from Table 6 on the contrary indicate that the Gauss-Gauss approximation gives values closest to the Warren-Averbach method for crystallite sizes whereas the Cauchy-Gauss and especially the Cauchy-Cauchy approximation tend to give too large values For strain the trend is opposite The Cauchy-Cauchy approximation resembles most
Table 6 Comparison of results obtained with the integral-breadth methods Cauchy-Cauchy (C-C) Cauchy-Gauss (C-G) Gauss- Gauss (G-G) and single-line (S-L) analysis
Specimen hkl PiXKP PAXKP ltigt)v (Z)gt(A) (e^((DV2)gt2 eXlO^ (A-) (A-0 (A) C-C C-G G-G S-L xlO^ C-C C-G G-G S-L
W untreated 110 220
0259 0247
0259 0247
3500 3700 3810 3810 14500 4040
008 -001 -003 -005 024 0
W ground 110 220
125 204
125 205
1030 2240 1450 1220 940 550
054 090 093 105 045 032
Ag untreated 111 2
0600 0901
0600 0900
2000 3340 2390 2190 1670 1110
024 035 039 095 0 0
200 124 124 1030 2270 1470 1230 810 047 082 085 095 0 400 204 204 490 0
Ag ground 111 222
198 352
200 352
650 2080 1240 910 530 280
095 179 182 197 048 0
200 403 406 350 9380 4780 1320 260 180 405 405 408 082 400 803 803 120 0
Lai85Sroi3Cu04 004 006
0657 0881
0650 0880
2000 5230 3290 2660 1970 1140
049 076 078 088 044 0
110 119 119 940 1240 1000 970 840 044 052 064 080 0 220 158 158 630 0
La2Cu4 004 006
0988 132
0998 131
1200 2980 1940 1630 1490 760
08 107 112 127 081 0-
020 143 142 760 1200 910 860 1240 07 079 090 110 114 040 198 200 510 016 200 126 124 810 810 810 810 1250 03 002 011 015 089 400 1S 126 830 014
Not possible to evaluate because of too small Gauss integral breadth
342
Volume 98 Number 3 May-June 1993
Journal of Research of the National Institute of Standards and Technology
closely a Warren-Averbach method These results concur with the Klug and Alexander [24] compari- son of the published size and strain values obtained by Warren-Averbach (Stokes) and integral-breadth methods However for x-ray diffraction the Cauchy-Gauss assumption for the size-strain broadening is theoretically and experimentally more favored thpoundm the other two models The fact that the Gauss-Gauss method for crystallite size and the Cauchy-Cauchy method for strain give more realistic results may mean that the presump- tion that size and strain broadening are exclusively of one type is an oversimplification
The single-line method seems much less reliable If Gaussian breadth is very small no information about strain is obtained Moreover second-order reflections give much lower values of both size and strain than do basic reflections However if multi- ple reflections are not available the single-line method can give satisfactory estimations
54 Reliability of Profile Fitting
The profile fitting of a cluster of even severely overlapping peaks can be accomplished with a low error and excellent fit of total intensity But how reliable is information obtained about separate peaks in the cluster In the fitting procedure it is possible to put constraints on the particular profile parameter to limit intensity position and width of the peak If anisotropic broadening or different phases are present constraints may not be realistic Morever acceptable results can be obtained even using a different number of profiles in refinement [4] Hence the first condition for the successful ap- plication of this method is knowledge of actual phases present in the sample and their crystalline structures
In this regard two powders were measured or- thorhombic Lai94Sroo6Cu04 has a slightly distorted K2NiF4-type structure (space group Bmab a =53510(2) A b =53692 A(2) c = 131931(7) A) and tetragonal Lai76Sro24Cu04 (space group I4mmm a =37711(3) A c = 132580(8) A) Data were collected for each specimen separately and for a specimen obtained by mixing the same pow- ders Because diffracted intensity of each phase was lower for the mixture counting time was pro- portionally increased to obtain roughly the same counting statistics Figure 19 shows two partially separated orthorhombic (020) (200) and (040) (400) peaks overlapped with tetragonal (110) and (220) reflections During the profile fitting of the mixed powders (200) orthorhombic peak tended to disappear on account of neighboring (020) and
(110) reflections Its intensity was constrained to vary in range plusmn 30 of (020) peak intensity which can be justified if the crystallographic structure is known
60
-60
345
345
335 29 (deg)
345
Fig 19 (upper) Lai76Sro24Cu04 (110) peak (middle) Lai94Sroo6Cu04 (020) and (200) peaks (lower) (110) (020) and (200) peaks
Table 7 contains results of fitted specimen-Voigt functions as well as size and strain values obtained by the analysis of broadening Comparing integral breadths of the starting and mixed powders some profiles change from more Cauchy-like to Gauss- like and vice versa This is especially evident for the (400) reflection meaning that accurate deter- mination of the profile tails is indeed affected in the cluster of overlapping peaks However integral breadth does not change significantly so results of
343
Volume 98 Number 3 May-June 1993
Journal of Research of the National Institute of Standards and Technology
Table 7 Comparison between two specimens run separately and mixed togetlier
Specimen hkl 2Hdeg) )3cO PoO DUA) (D)v(A) (e2laquoD)v2))laquoxlO
Lai76Sroj4CuOr 110 3369 0058(6) 0094(7) 780(60) 850(60) 10(1) 220 7073 022(2) 013(2)
LaiMSro(KiCu04 020 3342 0084(9) 055(14) 500(90) 1000(200) 07(1) 040 7012 010(2) 014(1) 200 3353 00216(85) 0061(8) 1100(100) 1200(100) 03(1) 400 7040 0026(11) 0088(8)
Mix 110 3367 0083(21) 0064(14) 800(300) 1200(300) 08(3) Lai76Sro24Cu04 220 7072 019(7) 013(4)
+ 020 3343 0066(35) 0070(23) 800(300) 1000(300) 07(4) Lai94Sroo6Cu04 040 7012 0116(93) 013(5)
200 3354 0024(156) 0071(61) 900(700) 1000(600) 04(12) 400 7041 011(2) 0003(320)
the multiple-line methods are not much influenced On the contrary the single-line method gives quite different results This may support the conclusion of Suortti Ahtee and Unonius [43] that the Voigt function fails to account properly for size and strain broadening simultaneously if only Cauchy integral breadth determines crystallite size
Table 7 shows that the results of Warren- Averbach analysis of starting and mixed powders agree in the range of standard deviations How- ever errors are much larger especially for the hid- den (200)-(400) reflections From Eq (62) it follows that more counts (longer counting times) and more observables (smaller step-size) would lower standard deviations Therefore in the case of highly overlapping patterns to obtain desirable ac- curacy much longer measurements are needed al- though that will not change the fact that higher overlapping implies intrinsically higher errors of all refinable parameters To further minimize possible artifacts of the fitting procedure it is desirable to include in the analysis as many reflections in the same ciystallographic direction as possible
55 Remarks
By modeling the specimen size and strain broad- ening with the simple Voigt function it is possible to obtain domain sizes and strains that agree with experiment and show a logical interrelationship Furthermore the Voigt function shows the correct 1A(26y asymptotic behavior of peak tails as ex- pected from kinematical theory [139] However if the specimen profile is significantly asymmetric (because of twins and extrinsic stacking faults [140 59]) or the ratio FWHM^ is not intermediate to the Cauchy (2Tr) and Gauss (2(ln27r)^) functions then the Voigt function can not be applied [25]
Suortti Ahtee and Unonius [43] found good over- all agreement by fitting the Voigt function to the pure-specimen profiles of a Ni powder deconvo- luted by the instrumental function However more accurate comparison is limited because of unavoid- able deconvolution ripples of specimen profiles Furthermore the Voigt function might not be flex- ible enough to model a wide range of specimen broadening as well as the different causes of broadening Therefore the question whether the Voigt function can satisfactorily describe complex specimen broadening over the whole 20 range in a general case needs further evaluation
This method of Fourier analysis with the as- sumed profile-shape function is most useful in cases when the classical Stokes analysis fails there- fore when peak overlapping occurs and specimen broadening is comparable to instrumental broaden- ing It was shown that for a high degree of peak overlapping the fitting procedure can give unreli- able results of Gauss and Cauchy integral breadths that is the peak can change easily from predomi- nantly Cauchy-like to Gauss-like and contrary This can lead to illogical values of size-integral and strain-integral breadths according to Eqs (52) (53) (54) and (55) and to irregularities in the be- havior of Fourier coefficients for large L Simulta- neously if the size-broadened profile has a large Gauss-function contribution the hook effect will occur However volume-weighted domain sizes D)y and MSS eL)) for small L are much less affected because they rely on both Cauchy and Gauss parts of the broadened profile Any integral- breadth method that attempts to describe the size and strain broadening exclusively by a Cauchy or Gauss function in this case fails completely For specimens with lower crystallographic symmetry
344
Volume 98 Number 3 May-June 1993
Journal of Research of the National Institute of Standards and Technology
when many multiple-order reflections are avail- able but the peaks are overlapped it is therefore desirable to include in the analysis as many reflec- tions as possible to minimize the potential artifacts of the fltting process
6 Analysis of Superconductors 61 (La-M)2Cu04 Superconductors
Bednorz and Miiller [16] found the first high- temperature oxide superconductor in the La-Ba- Cu-O system Soon after substituting Ba with Sr and Ca Kishio et al [17] found superconductivity in two similar compounds Later many compounds with much higher transition temperatures (Tc) were found The (La-M)2Cu04 system remains favorable for study because the cation content responsible for the superconductivity is easier to control and measure than the oxygen stoichiometry Also this system provides a wide range of substitutional cation solubility in which the tetragonal K2NiF4- type structure is maintained Compared with much- studied Y-Ba-Cu-O this structure is simpler because it contains only one copper-ion site and two oxygen-ion sites
The undoped compound La2Cu04 is orthorhom- bic at room temperature It becomes superconduct- ing either with cation substitution on La sites or increased oxygen content to more than four atoms per formula unit Doping with divalent cations in- creases the itinerant hole carriers in the oxygen- derived electron band [141] which probably causes the superconductivity However different dopants influence the transition temperature Tc Although the unit-cell c-parameter simply reflects ionic dopant size [142] the in-plane unit-cell parameter (and accordingly the Cu-0 bond length) correlates with Tc for different dopants and for different dop- ing amounts [142 143]
LaiB5MouCu04 (M = Ba Ca Sr) have a tetrago- nal K2NiF4-type structure space group lAlmmm with four atoms in the asymmetric unit [117] One site is occupied with La partially substituted with dopant ions (Fig 20) La2Cu04 is orthorhombic at room temperature The best way to correlate these two structures is to describe La2Cu04 in space group Bmab the c axis remains the same tetrago- nal [110] and [110] directions become [010] and [100] orthorhombic axes and size of the unit cell is doubled [144]
Figure 21 shows parts of the x-ray diffraction patterns observed and refined of Lai85Moi5Cu04 (M = Sr Ba Ca) and La2Cu04 Refined lattice
parameters are given in Table 8 Table 9 shows resuhs of the line-broadening analysis Relatively
La(BaCaSr)
0(2)
0(1)
Fig 20 Ciystal structure of (La-M)2Cu04 showing one unit cell
300 JUU
(b)
200
100
U 0 M J Js-r-^
30
-30
300
40 41 42 43 44 45 40 41 42 43 44 45 29 (deg) 29 (deg)
mdashA-
gt t 200
Z
F-
- 100
(c)
f V kgt ii I 40 41 42 43 44 45 40 41 42 43 44 45
e (deg) ^^ 26 (deg)
-30 wwX mdash Wlaquo-
Fig 21 Diffraction patterns of LaiH5Moi5Cu04 specimens (a) M=Sr (b) M = Ba (c)M = Ca (d) M = U
345
Volume 98 Number 3 May-June 1993
Journal of Research of the National Institute of Standards and Technology
Table 8 Lattice parameters and T^ at zero resistivity (Ac method at 10 Ma current)
Specimen a (A) bk) c(A) rc(K)
Lairaquo5Sroi5Cu04 377814(7)
Lairaquo3Baoi3Cu04 37846(2)
LaiiijCaoi5Cu04 37863(7)
La2Cu04 53558(2) 54053(2)
231(2) 36
288(4) 28
17(2) 19
1451(8)
Table 9 Results of line-broadening analysis for (La-M)2Cu4 specimens
Specimen hkl PcO PoO (DUk) (Iraquo)(A) lte^((D)2))
Lai(laquoSroj5Cu04 004 006
0046(4) 0083(5)
0024(8) ltio-
1700(300) 2000(200) 000049(9)
110 0110(5) ltio- 470(20) 940(20) 000044(6) 220 0171(9) ltio-
Lai85Baoi3Cu04 004 006
0049(6) 0110(7)
0076(6) 0089(9)
1100(200) 1100(100) 00011(2)
110 0087(4) 000042(6) 560(20) 1110(20) 000024(5) 220 0116(3) ltio-5
Laiji5Caoi5Cu04 004 006
0120(13) 0146(12)
0032(22) 0033(27)
440(70) 780(90) 00007(4)
110 0045(25) 0200(19) 340(30) 360(20) 00013(2) 220 0343(22) ltio-
La2Cu04 004 006
0061(8) 0124(7)
0045(9) ltio-
1100(100) 1200(100) 00008(1)
020 0074(10) 0078(10) 680(50) 760(50) 00007(2) 040 0210(30) 0026(81) 200 0074(8) 0061(10) 680(50) 810(50) 00003(3) 400 0130(10) 0023(95)
weak peak broadening was observed which can not be attributed to the proximity of the phase trans- formation Lai85SroisCu04 is tetragonal down to = 170 K [145] Lai85Baoi5Cu04 to 140 K [146147] and Lai85Caoi5Cu04 to 130 K [148] Another possi- ble reason for peak broadening might be continu- ous compositional variations in dopant content The scanning Auger microprobe analysis of La2-SrtCu04 compounds [149] showed that grain- boundary segregation of Sr is weak and limited to a narrow region near the grain surface In the case of the separation of two phases with different Sr con- tent and similar lattice parameters asymmetry of some reflections would be observed [150] More- over in the case of compositional inhomogeneity microstrains eL)) would be roughly independent of the averaging distance L in the grains [151] therefore distribution of strains would be Gaus- sian For all specimens microstrain behavior is identical it decreases linearly with distance L
Rothman and Cohen [115] showed that such be- havior of microstrains is caused by dislocations that might arise during grinding Assuming the same applied stress microstrain would be approximately inversely proportional to the elastic moduli of these materials If mean microstrain is defined as the arithmetic average of strains for the [001] and [110] directions results agree with values of the Youngs moduli for polycrystalline La2Cu04 Lai85Moi5Cu04 (M = Sr Ba Ca) [152] However other factors may contribute to the microstrain Coordination-6 ionic radii of La^+ Sr Ba^+ Ca^+ are 106 116 136 100 A respectively [153] Substitution of La with ions of different sizes affects the lattice parameter [142] and may cause much larger strains in the [001] direction when some of the ions are replaced with Ba^ than with Sr^ in accord with results in Table 9 Substitution of Ca^^ ions produces an entirely different effect microstrains in the [110] direction are larger This may be explained by
346
Volume 98 Number 3 May-June 1993
Journal of Research of the National Institute of Standards and Technology
comparing effects of substitutional ions on the unit-cell a -parameter The Ba-doped specimen has a larger a-parameter than the Sr-doped but the Ca-doped a-parameter is largest although Ca^^ has the smallest ionic size This should increase the cell distortion in the a-b plane
Table 9 reveals high anisotropy in these materi- als consistent with other physical properties such as thermal expansion [154] and upper critical mag- netic field [155] Differences of domain sizes might arise from a layered structure in the [001] direction and consequently easy incorporation of stacking faults between regularly stacked layers The stack- ing-fault and twin-fault probabilities can be esti- mated from the average surface-weighted domain sizes [59]
^ = TAN + cf1fun(aa) (75) m im - (D)
Here c is a constant for the particular [hkl] direction and fun(a a) a linear combination of stacking-fault probability and twin-fault probability a The exact form of Eq (75) was derived only for the cubic and hexagonal crystal structures On con- dition that the true domain dimension D is isotropic or so large that the second term of Eq (75) dominates a linear function of stacking-fault and twin-fault probability is
fun(aa) = c( 1
) (76) Zgt)J (Dgttrade
Here c denotes a constant that depends only on geometrical factors and is the same for all three doped compounds
Figure 22 shows a possible correlation between Tc and fault-defect probabilities computed from TEM observations of La2-jcSrCu04 revealed that stacking-fault density increased with Sr content up to jc = 015 [156] That study suggests that a shear mechanism forming the fault-boundary dislocations implies oxygen vacancies andor cation deficiency We did not measure oxygen content but neutron- diffraction studies showed that oxygen deficiency starts to appear at much higher Sr content [157] However the increase of fault probability with the simultaneous decrease of microstrain in Fig 22 supports the assumption that defects are intro- duced to accommodate lattice strains [156] A simi- lar increase in Te was found in Y2Ba4Cu802o-laquo thin films [158] Compounds with asymmetric broad- ened and shifted peaks showed higher Tc which
was attributed to stacking faults Although extrinsic stacking faults may cause asymmetric peak broad- ening [140] it is probably caused by twinning Twinning in La-M-Cu-0 materials is less abundant than in Y-Ba-Cu-O compounds but it was ob- served in (La-Sr)2Cu04 monocrystals on (110) planes [159] In the profile-fitting procedure peak asymmetry is incorporated only in the instrumental function therefore we could not model asymmetric peak broadening However any significant asym- metry of the specimen profile would cause an un- even fit of low-angle and high-angle sides of peaks which was not observed This gives much more im- portance to stacking faults in Eq (76)
Fig 22 Arithmetic average of [110] and [001] root-mean- square strains and linear function of stacking-fault and twin- fault probabilities as a function of Tc
In Fig 22 average microstrains defined as the arithmetic average of [001] and [110] directions correlate inversely with Tc However we did not find a correlation of Tc and microstrains in a partic- ular direction [001] microstrains simply reflect dif- ference in size of dopant and host La^ ions (see Table 9)
In La2Cu04 (OkO) reflections are significantly broader than (hOO) This has also been observed in low-temperature orthorhombic Lai85Sroi5Cu04 and Lai85Baoi5Cu04 [160] and explained by either stacking faults or possible lower symmetry Our results reveal that domain sizes (D) have identical values for [010] and [100] directions (Table 9) From Eq (76) it follows that stacking-fault proba- bilities in these directions have the same values However microstrains in the [010] direction are roughly twice as large as in the [100] direction which is responsible for the different broadening In the case of doped La2Cu04 compounds different microstrains might be caused by oxygen
347
Volume 98 Number 3 May-June 1993
Journal of Research of the National Institute of Standards and Technology
vacancies ordered along one direction in the a-b plane similar to effects found in YBa2Cu307-laquo However undoped La2Cu04 is not expected to have significant o^Qgen deficiency Other possibili- ties are lower ciystallographic symmetry andor La vacancies although they were not reported for this system but La deficiency was found in an La2Co04 compound [161]
We can conclude that lattice strains and incoher- ently diffracting domain sizes confirm high an- isotropy in these materials This simple approach however does not allow unambiguous identifica- tion of the strains origin Probably the strains originate from dislocations and from different sizes of host and dopant ions Domain sizes of all com- pounds are larger in the c-direction than in the a-6 plane This indicates existence of stacking faults and twins However because estimated errors are relatively large and only three materials were stud- ied the possible connection between stacking faults and 7c needs further study
62 Bi-Cu-O Superconductors
Among the high-Tc superconductors the Bi- Cu-O compounds appear intriguing especially because their incommensurate structure modula- tion remains incompletely understood [162 163] The crystal structure consists of perovskite-like SrO-(Cu02Ca)mi-Cu02-SrO layers separated by NaCl-like BiO double layers (see Fig 23 [164]) The number m of Cu02 layers alters the supercon- ducting transition temperature Tc (for m = 12 and 3 rclaquo10 90 and 110 K respectively) This two- dimensional layered structure makes these materi- als highly anisotropic and favours the creation of defects
Bulk sintered specimens showed relatively weak peak broadening Moreover the diffraction pat- terns contained many overlapping peaks because the compound crystallizes in an orthorhombic low- symmetry space group A2aa [165] and incommen- surate modulation gives superlattice reflections All patterns revealed a strong [001] texture (Fig 24) making reflections other than (001) difficult to ana- lyze The lattice parameters vary depending on the exact compound stoichiometry and processing his- tory but characteristically they have almost identi- cal a and b parameters and large c parameter fl =54095 A 6=54202 A c =309297 A for Bi2Sr2CaCu208 (Bi-2212 [166] and A =5392 A b =5395 A c =36985 A for (BiPb)2Sr2Ca2Cu30io (BiPb-2223) [165] Thus we treated (hOO) and (0^0) reflections as single peaks Table 10 gives the
results for three specimens Bi-2212 (BiPb)2 (SrMg)2(BaCa)2Cu30io (BiPbMgBa-2223) which were one-phase specimens and BiPb-2223 con- taining approximately equal amounts of 2212 and 2223 phases The in-plane lattice parameters of 2212 and 2223 phases differ little hence only the [00] directions of the mixed-phase specimen were evaluated
b^ (c)
Fig 23 Average crystal structure of Bi2Sr2Cam-iCum04+2m for (a) m = 1 (b) w =2 (c) m =3 [164]
35
-35
42 44 46 48 50 52 54 56 58 60 62 26 (deg)
^ ^^^MK^Aa^Ndllaquop
Fig 24 Part of BiPbMgBa-2223 refined pattern There are 48 fundamental reflections in this region
Interpretation of the results in the case of these complicated compounds must be considered care- fully Microstrains are probably caused by disloca- tion arrays However substitution of different-sized ions and vacancies would also contribute to the strains as would other kinds of disorder especially
348
Volume 98 Number 3 May-June 1993
Journal of Research of the National Institute of Standards and Technology
Table 10 Results of line-btoadening analysis for Bi-Cu-O supreconductors
Specimen Phase hkl (A)
eD)sa)y^
Bi-2212 2212 008 0012
0163(8) 022(3)
001(6) 005(6)
420(80) 00021(6)
020+200 0104(4) ltio-^ 580(30) 00007(1) 040+400 018(2) 00004(6300)
BiPbMgBa-2223 7773 0010 0020
0097(1) 021(2)
00002(1700) 0007(150)
770(60) 00012(1)
020 + 200 012(27) 013(10) 380(430) 00009(71) 040 + 400 015(95) 021(33)
BiPb-73 2212 008 0012
023(2) 025(5)
0002(350) 0001(1000)
220(30) 00013(26)
2223 0010 0020
022(8) 023(99)
0092(67) 018(47)
230(190) 00012(197)
Stacking faults and twins Table 10 shows larger strains in the [001] direction that in the basal plane This can be explained by stacking disorder along the c-axis which was frequently observed in electron-diffraction patterns as streaking [167 168] Easy incorporation of stacking faults is possi- ble because of the two-dimensional weak-bonded layers (BiO double layers are spaced about 3 A apart) The difference in microstrain between in- plane and the c-direction is much smaller for the BiPbMgBa-2223 phase probably because Pb low- ers the faulting by stabilizing the higher-Tc 2223 phase [167] For the BiPb-2223 specimen with two phases there are two possibilities Either the speci- men consists mainly of a mk of two kinds of one- phase grains or both phases occur within the same grains The second possibility was confirmed exper- imentally [169 170] and our results concur be- cause microstrain in the 2212 phase is much smaller than in the one-phase Bi-2212 specimen Processing conditions and cation content probably favour development of the macroscopic inter- growth of both phases within the grains that is microscopic defects grow to sufficiently large re- gions to give a diffraction pattern of another phase with the different number of Cu02 layers As a re- sult strain is relieved and both strains and domain sizes being quite different in one-phase specimens tend to equalize
For the Bi-Cu-O specimens the mean surface- weighted domain sizes are generally smaller than for (La-M)2Cu04 compounds Therefore the com- putation of the stacking- and twin-fault probabili- ties by using Eq (75) may be wrong It would be very instructive to compare the different broaden-
ing of satellite and fundamental reflections which indicates a more pronounced stacking disorder in the modulated structure [171]
In summary we found that for both Bi-2212 and BiPbMgBa-2223 superconductors the c-axis strain exceeds the in-plane strain The BiPb-2223 specimen containing both 2212 and 2223 phases within the single grains shows smaller incoherently diffracting domains and lower c-axis strain than the one-phase specimens This fact may direct us to- ward the mechanism of the second-phase forma- tion in these materials
63 Remarks
It was shown that this particular method of the line-broadening analysis can give information about the size of incoherently diffracting domains and lattice strains in (La-M)2Cu04 and Bi-Clu-O superconductors Moreover results show high an- isotropy of both size and strain parameters as one may expect because of the layered structure of all superconducting cuprates Generally structural line broadening is not large that is a result of rela- tively large domain sizes (200-2000 A) and small strains (002-02) It is interesting to compare these values with the published results for YBa2Cu307-laquo (isotropic strains of 023 [77] and 005-03 [82]) Although the different materi- als were studied they seem too large especially be- cause they are the average of strains in different directions
The main drawback of the line-broadening the- ory is the uncertainty about the origins of the line broadening that is it is difficult to distinguish the main effects responsible for the broadening For
349
Volume 98 Number 3 May-June 1993
Journal of Research of the National Institute of Standards and Technology
the novel superconductors particularly the numer- ous defects (substitutions vacancies stacking faults dislocations and similar) can occur simulta- neously which makes it very difficult to determine their individual contributions Furthermore the crystal structures of most novel superconductors are relatively complicated The average structure has mostly a slightly distorted tetragonal symmetry very similar a and b lattice parameters and a large c parameter but c=36 for YBa2Cu307-laquo for in- stance This results in a large number of overlap- ping peaks and consequently in large errors of all results This showed especially in the case of Bi-Cu-O superconductors (see Table 10) Follow- ing the discussion of reliability of profile fitting in Sec 54 it would be desirable to include more than two reflections in the analysis of broadening but higher-order peaks are usually too weak and over- lapped One way to partially solve this problem would be a whole pattern fitting [172 173] and Rietveld structure refinement [23] in terms of size and strain parameters This requires an accurate preset function to model specimen broadening and precise definition of angular dependence of size and strain parameters The Rietveld programs that model the line broadening in terms of size and strain parameters are based either on the simpli- fied integral-breadth methods [78 95] or on the single-line method [174]
7 Conclusions
A method for analyzing the pure-specimen (structural) broadening of x-ray diffraction line profiles is proposed By modeling the specimen size and strain broadenings with the simple Voigt func- tion it is possible to obtain domain sizes and strains that agree with experiment and show a logi- cal interrelationship Furthermore some common consequences and problems in the Fourier-method analysis follow easily The specimen function is convoluted with the instrumental function to match the observed x-ray diffraction-line profile This avoids the Stokes deconvolution method thus al- lowing analysis of patterns with highly overlapping peaks and weak structural broadening Therefore the method was applied to some novel high-Tc superconductors We reached the following conclu- sions
(i) Surface-weighted domain size depends only on the Cauchy integral breadth of the size-broad- ened profile
(ii) The hook effect occurs when the Cauchy-content of the size-broadened profile is un-
derestimated that is for ^sc(n2)^3sG Usually this happens when the background is estimated too high so the long tails of the Cauchy function are prematurely cut off
(iii) It also follows from conclusion (ii) that the volume-weighted domain size can not be more than twice the surface-weighted domain size (limiting value D)v=2D)i is obtained for the pure-Cauchy size-broadened profile) Minimum value for D)J (D)j should not be less than -131
(iv) If the distortion coefficient is approxi- mated with a harmonic term this leads exactly to the Warren-Averbach method of separation of size and strain broadenings
(v) In that case mean-square strains decrease linearly with the distance L
(vi) It is possible to evaluate local strain ((e^(0))^) only in the case of pure-Gauss strain broadening Then root-mean-square strain is inde- pendent of the distance L and related to the upper limit of strain obtained from the integral breadth of the strain-broadened profile
(vii) If strain broadening is not described exclu- sively with the Gauss function the multiple-line Voigt integral breadth and Warren-Averbach analyses can not give the same results for volume- weighted domain size although D)v is defined identically in both approaches because the appar- ent strain -q = pdeg(29)cot9 is not angular- independent
(viii) Smooth size coefficients give column- length distribution functions without oscillations and make possible a computation of volume- weighted average domain sizes up to ~5000 A
(ix) Comparison with the simplified integral- breadth methods in most cases has shown not large but systematic discrepancy of results indicat- ing that size and strain broadening can not be accu- rately modeled by a single Cauchy or Gauss function Moreover the application of the single- line method is much less reliable and it should not be used where multiple reflections are available
(x) The knowledge of all phases present in the sample and their crystallographic structure is re- quired to successfully fit a cluster of overlapping peaks Although it is very difficult to accurately de- termine the Cauchy-Gauss ratio of an overlapped peak final results of domain size and strain are much less affected Therefore connecting the crys- tallite size exclusively with the Cauchy content and strain with the Gauss content of a specimen profile might be doubtful
(xi) Evaluated errors of domain sizes and strains increase substantially with the degree of
350
Volume 98 Number 3 May-June 1993
Journal of Research of the National Institute of Standards and Technology
peak overlapping Hence for complicated patterns very accurate measurements are necessary and one needs to analyze as many reflections in the same crystallographic direction as possible
(xii) Line-broadening analysis of (La-M)2Cu04 and Bi-Cu-O compounds confirms high anisotropy in these materials
(xiii) Strains in (La-M)2Cu04 probably origi- nate from dislocations and from different sizes of host and dopant ions
(xiv) Stacking-fault probability in (La-M)2Cu04 (M = Ba Ca Sr) increases with increasing Tc whereas the average strain decreases
(xv) In La2Cu04 different broadening of (lOO) and (OfcO) reflections is not caused by stacking faults
(xvi) All Bi-Cu-0 superconductors show larger strain in the c-direction than in the a-b plane which can be explained by stacking disorder along the [001] direction
(xvii) In the specimen with approximately equal amounts of Tl-2212 and TlPb-2223 phases it is likely that a secondary phase develops by the growth of the microscopic faulted regions of the primary phase
Acknowledgments
I am thankful to Dr Harry McHenry for his support and especially to Dr Hassel Ledbetter for his wise guidance and most useful help during my stay at NIST I am also indebted to my home insti- tution the Faculty of Metallurgy of the University of Zagreb for allowing me the leave of absence at NIST
8 References
[1] W Friedrich P Knipping and M v Laue Ann Physik 41 971 (1912)
[2] H M Rietveld Acta Cryst 22 151 (1967) [3] H M Rietveld J Appl Cryst 2 65 (1969) [4] S A Howard and K D Preston in Modern Powder Dif-
fraction Vol 20 The Mineralogical Society of America Washington DC (1989) p 217
[5] D Taupin J Appl Cryst 6 266 (1973) [6] T C Huang and W Parrish Appl Phys Lett 27 123
(1975) [7] M K Wu J R Ashburn C J Torng P H Hor R L
Meng L Gao Z J Hwang Y Q Wang and C W Chu Phys Rev Lett 58 908 (1987)
[8] D Shi MRS Bull 16 37 (1991) [9] D Larbalestier Phys Today 44 74 (1991)
[10] J C Phillips Phys Rev B 4512647 (1992) [11] B Raveau Phys Today 45 53 (1992) [12] A J Millis and K M Rabe Phys Rev B 38 8908 (1988)
[13] F Guinea Europhys Lett 7 549 (1988) [14] C P Dhard and P Singh in Proc Int Symp High-Temp
Supercond Jaipur India Oxford amp IBH Publishing New Delhi (1988) p 271
[15] J D Jorgensen Phys Today 44 34 (1991) [16] J G Bednorz and K A Muller Z Phys B 64 189
(1986) [17] K Kishio K Kitazawa S Kaube I Yasuda N Sugii H
Takagi S Uchida K Fueki and S Tanaka Chem Lett 429 (1987)
[18] J D Jorgensen B Dabrowski S Pei D G Hinks L Soderholm B Morosin J E Venturini and D S Ginley Phys Rev B 38 11337 (1988)
[19] J R Clem Phys Rev B 43 7837 (1991) [20] M Paranthaman M Foldejiki D Balzar H Ledbetter
A J Nelson and A M Hermann submitted to Phys Rev B
[21] A R Stokes Proc Phys Soc Lond 61 382 (1948) [22] B E Warren and B L Averbach J Appl Phys 23 497
(1952) [23] R Delhez Th H de Keijser and E J Mittemeijer in
Accuracy in Powder Diffraction S Block and C R Hub- bard eds Natl Bur Stand (US) Special Publication 567 (1980) p 213
[24] H P Klug and L E Alexander X-ray Diffraction Proce- dures 2nd Edition John Wiley New York (1974) p 661
[25] J I Langford J Appl Ciyst 11 10 (1978) [26] J I Langford in Accuracy in Powder Diffraction S
Block and C R Hubbard eds Natl Bur Stand (US) Special Pubication 567 (1950) p 255
[27] R Delhez Th H de Keijser and E J Mittemeijer Fre- senius Z Anal Chem 312 1 (1982)
[28] A J C Wilson Proc Phys Soc Lond 80 286 (1962) [29] A J C Wilson Proc Phys Soc Lond 81 41 (1963) [30] L P Smith Phys Rev 46 343 (1934) [31] H C Burger and P H van Cittert Z Phys 79 722
(1932) [32] S Ergun J Appl Ciyst 1 19 (1968) [33] R Croche and L Gatineau J Appl Ciyst 10479 (1977) [34] L H Schwarz and J B Cohen Diffraction from Materi-
als Academic Press New York (1977) p 391 [35] R Delhez Th H de Keijser E J Mittemeijer and J I
Langford J Appl Cryst 19 459 (1986) [36] R Delhez Th H de Keijser E J Mittemeijer and J I
Langford Aust J Phys 41 213 (1988) [37] R A Young and D B Wiles J Appl Cryst 15 430
(1982) [38] W Voigt Stizungsber K Bayer Akad Wiss 42 603
(1912) [39] E E Whiting J Quant Spectrosc Radiat Transfer 8
1379 (1968) [40] G K Wertheim M A Butler K W West and D N E
Buchanan Rev Sci Instrum 111369 (1974) [41] M M Hall Jr V G Veeraraghavan H Rubin and P G
Winchell J Appl Cryst 10 66 (1977) [42] A Brown and J W Edmonds Adv X-Ray Anal 23 361
(1980) [43] P Suortti M Ahtee L Unonius J Appl Cryst 12 365
(1979) [44] T Sundius J Raman Spectrosc 1 471 (1973) [45] B H Armstrong J Quant Spectrosc Radiat Transfer 7
61 (1967) [46] J F Kielkopf J Opt Soc Am 63 987 (1973) [47] B P Asthana and W Kiefer Appl Spectr 36 250
(1982)
351
Volume 98 Number 3 May-June 1993
Journal of Research of the National Institute of Standards and Technology
[48] J P M de Vreede S C Mehrotra A Tal and H A Dijkerraan Appl Spectr 36 227 (1982)
[49] F R L Schoening Ada Ciyst 18 975 (1965) [50] P Scherrer Gott Nachr 2 98 (1918) [51] A R Stokes and A J C Wilson Proc Cambridge
Philos Soc 38 313 (1942) [52] A J C Wilson X-Ray Optics 2nd edition Methuen
London (1962) [53] S Leie and T R Anantharaman Proc Indian Acad
Sci Sect A H 261 (1966) [54] D Louer D Weigel and J I Langford J Appl Ciyst
5 353 (1972) [55] A J C Wilson J Appl Ciyst 2 181 (1969) [56] J I Langford and A J C Wilson J Appl Ciyst 11102
(1978) [57] A R Stokes and A J C Wilson Proc Phys Soc Lond
56174 (1944) [58] B E Warren and B L Averbach J Appl Phys 21 595
(1950) [59] B E Warren X-Ray Diffraction Addison-Wesley
Reading Massachusetts (1969) p 264 [60] B E Warren in Progress in Metal Physics Vol 8 Perg-
amon Press London (1959) p 146 [61] F Bertaut C R Acad Sci Paris 228 187 (1949) [62] N C Haider and C N J Wagner Acta Cryst 20 312
(1966) [63] D Balzar and H Ledbetter in Proceedings of the Accu-
racy in Powder Diffraction II Natl Inst Stand Technol (1992) p 37
[64] D Balzar and H Ledbeter J Appl Cryst 26 (1993) in press
[65] J N Eastabrook and A J C Wilson Proc Phys Soc Lond B 65 67 (1952)
[66] R S Smith IBM J Res Develop 4 205 (1960) [67] B Y Pines and A F Sirenko Soviet Physics Ciyst 715
(1962) [68] G B Mitra and N K Misra Acta Ciyst 22 454 (1967) [69] A Gangulee J Appl Ciyst 7 434 (1974) [70] J Mignot D Rondot Acta Met 231321 (1975) [71] J Mignot and D Rondot Acta Ciyst A 33 327 (1977) [72] R K Nandi H K Kuo W Schlosberg G Wissler J B
Cohen and B Crist Jr J Appl Ciyst 17 22 (1984) [73] M Zocchi Acta Ciyst A 36164 (1980) [74] P Ramarao and T R Anantharaman Trans Ind Ins
Metals 18 181 (1965) [75] R K Nandi and S P Sen Gupta J App Cryst 11 6
(1978) [76] Th H de Keijser J I Langford E J Mittemeijer and
B P Vogels J Appl Ciyst IS 308 (1982) [77] A Williams G H Kwei R B Von Dreele A C Lar-
son L D Raistrick and D L Bish Phys Rev B 37 7960 (1988)
[78] A C Larson and R B Von Dreele Los Alamos Na- tional Laboratory Report No LA-UR-86-748 (1988)
[79] J D Jorgensen D H Johnson M H Mueller J G Worlton and R B Von Dreele in Proceedings of the Conference on Diffraction Profile Analysis Cracow Poland (1978) p 20
[80] R B Von Dreele J D Jorgensen and C G Windsor J Appl Ciyst 15 581 (1982)
[81] P Thompson D E Cox and J B Hastings J Appl Ciyst 20 79 (1987)
[82] J P Singh R A Guttschow D S Kupperman J T Dusek and R B Poeppel in High Temperature Super-
conducting Compounds III S Whang A Gupta and E Ceilings eds TMS AIME Warrendale (1991) p 281
[83] M O Eatough D S Glnley and B Morosin Adv X- Ray Anal 33 145 (1990)
[84] E J Peterson P J Kung R E Muenchausen and D M Smith in Proceedings of the 41st Annual Denver Conference on Applications of X-Ray Analysis Colo- rado Springs Colorado (1992) p 74
[85] M Rand J I Langford and J S Abell submitted to J Cryogenics (1992)
[86] D Balzar J Appl Ciyst 25 559 (1992) [87] D Balzar H Ledbetter and A Roshko Physica C 185-
189 871 (1991) [88] D Balzar and H Ledbetter J Mater Sci Lett 111419
(1992) [89] D Balzar H Ledbetter and A Roshko Pow Diffr 8
(1993) in press [90] S Johnson M Gusraan D Rowcliffe T Geballe and J
Sun Adv Ceram Mater 2 337 (1987) [91] H Ledbetter S A Kim R B Goldfarb and K Togano
Phys Rev B 39 9689 (1989) [92] H Friedman Electronics 132 (1945) [93] W Parrish (ed) in Advances in X-Ray Diffractometry
and X-Ray Spectrography Centrex Publishing Company Eindhoven The Netheriands (1962)
[94] W Soller Phys Rev 24158 (1924) [95] S A Howard R L Snyder J Appl Ciyst 22 238
(1989) [96] G H Stout and L H Jensen X-Ray Structure Determi-
nation 2nd edition Wiley New York (1989) p 373 [97] D E Appleman and T Evans Jr Final Report 92-14
US Geological Survey Washington DC (1973) Avail- able as NTIS Document No PB-216188
[98] M U Cohen Rev Sci Instrum 6 68 (1935) [99] M U Cohen Rev Sci Instrum 7 155 (1936) [100] M H Mueller L Heaton and K T Miller Acta Ciyst
13 828 (1960) [101] R A Young P E Mackie and R B Von Dreele J
Appl Ciyst 10 262 (1977) [102] D B Wiles and R A Young J Appl Cryst 14 149
(1981) [103] J K Yau and S A Howard J Appl Ciyst 22 244
(1989) [104] S A Howard J K Yau and H U Anderson J Appl
Phys 65 1492 (1989) [105] S Enzo G Fagherazzi A Benedetti and S Poilizzi J
Appl Ciyst 21 536 (1988) [106] A Benedetti G Fagherazzi S Enzo and M
Battagliarin J Appl Cryst 21 543 (1988) [107] Th H de Keijser E J Mittemeijer and H C F Rozen-
daal J Appl Ciyst 16 309 (1983) [108] Y Zhang J M Stewart C R Hubbard and B Mo-
rosin Adv X-Ray Anal 33 373 (1990) [109] Y Wang S Lee and Y Ue J Appl Ciyst IS 35
(1982) [110] V N Selivanov and E F Smislov Zavod Lab 57 28
(1991) [Ill] A Guinier X-Ray Diffraction W H Freeman San
Francisco (1963) p 139 [112] M Wilkens J Appl Cryst 12119 (1979) [113] D Du and Y Wang Pow Diffr 2180 (1987) [114] A P Prudnikov Yu A Brychkov and O L Marichev
Integrals and Series Vol 1 Gordon and Breach Am- sterdam The Netheriands (1986) p 344
352
Volume 98 Number 3 May-June 1993
Journal of Research of the National Institute of Standards and Technology
[115] R L Rothman and J B Cohen J Appl Phys 42 971 (1971)
[116] T Adier and C R Houska J Appl Phys 50 3282 (1979)
[117] C R Houska and T M Smith J Appl Phys 52 748 (1981)
[118] S Rao and C R Houska Acta Ciyst A 4214 (1986) [119] J I Langford R Delhez Th H de Keijser and E J
Mittemeijer Ausi J Phys 41173 (1988) [120] J I Langfoid J Appl Cryst IS 315 (1982) [121] M J Turunen Th H de Keijser R Delhez and N M
van der Pers J Appl Ciyst 16176 (1983) [122] A J C Wilson Acta Ciyst 23 888 (1967) [123] A J C Wilson Acta Ciyst A 24 478 (1968) [124] A J C Wilson Acta Ciyst A 25 584 (1969) [125] G Gagliotti A Paoletti and F P Ricci Nucl Instrum
3 223 (1958) [126] J I Langford R J Cernik and D Louer J Appl
Ciyst 24 913 (1991) [127] J I Langford in Accuracy in Powder Diffraction II
preprint [128] A J C Wilson Mathematical Theory of X-Ray Powder
Diffractometiy Centrex Eindhoven The Netherlands (1963)
[129] J L Langford Prog Ciyst Growth and Charact 14185 (1987)
[130] T G Fawcett C E Crowder S J Brownell Y Zhang C R Hubbard W Schreiner G P Hamill T C Huang E Sabino J I Langford R Hamilton and D Louer Pow Diffr 3 209 (1988)
[131] W L Smith J Appl Ciyst 9187 (1976) [132] J L Langford and D Louer J Appl Ciyst 15 20
(1982) [133] Fl Popescu and L Benes Acta Ciyst A 33 323 (1977) [134] P PSuse^cu R MSnaila M Popescu and E Jijovici j
Appl Cryst 7 281 (1974) [135] P F Bley Y Calvayrac and M Fayard J Appl Ciyst
7 493 (1974) [136] B Moraweck Ph de Montgolfier and A J Renouprez
J Appl Ciyst 10191 (1977) [137] A Le Bail and D Louer J Appl Cryst 11 50 (1978) [138] D R Buchanan R L McCuUough and R L Miller
Acta Ciyst 20 922 (1966) [139] P Suortti and L D Jennings Acta Cryst A 33 1012
(1977) [140] J B Cohen and C N J Wagner J Appl Phys 33 2073
(1962) [141] A Bianconi J Budnick A M Flank A Fontaine P
Lagarde A Marcelli H Tolentino B Chamberland C Michel B Raveau and G Demazeau Phys Lett A127 285 (1988)
[142] K Fueki K Kitazawa K Kishio T Hasegawa S Uchida H Takagi and S Tanaka in Chemistiy of High- Temperature Superconductors D L Nelson M S Whittingham and T F George eds American Chemi- cal Society (1987) p 38
[143] T Fujita Y Aoki Y Maeno J Sakurai H Fukuba and H Fujii J Appl Phys 26 U68 (1987)
[144] R M Hazen in Physical Properties of High-rc Super- conductors Vol 2 D M Ginsberg ed World Scien- tific Singapore (1990) p 121
[145] J B Torrance A Bezinge A I Nazzal T C Huang S P Parkin D T Keane S J LaPlaca P M Horn and G A Held Phys Rev B 40 8872 (1989)
[146] J D Axe A H Moudden D Hohlwein D E Cox K
M Mohanty A R Moodenbaugh and Y Xu Phys Rev Lett 62 2751 (1989)
[147] T Suzuki and T Fujita Physica C 159 111 (1989) [148] T Fujita and Y Maeno in Superconducting Materials
JJAP Series 1 (1988) p 34 [149] A Roshko and Y-M Chiang J Appl Phys 66 3710
(1989) [150] D E Cox S C Moss R L Meng P H Hor and C W
Chu J Mater Res 31327 (1988) [151] B Crist and J B Cohen J Polym Sci 17 1001 (1979) [152] H Ledbetter S Kim and A Roshko Z Phys B 89275
(1992) [153] R D Shannon and C T Prewitt Acta Ciyst B 25 925
(1969) [154] M Lang H Spille F Steglich Y Hidaka T Murakami
and Y Endoh Physica C 162-1641037 (1989) [155] Y Hidaka and T Murakami Phase trans 15 241
(1989) [156] P L Gai and E M McCarron Science 247 553 (1990) [157] T Kamiyama I Izumi H Asano H Takagi S Uchida
Y Tokura E Takayama-Muromachi M Matsuda K Yamada Y Endoh and Y Hidaka Physica C 172 120 (1990)
[158] A Kapitulnik Physica C 153-155 520 (1988) [159] L A Muradyan V N Molchanov R A Tamazyan and
V I Simonov Physica C 162-164 536 (1989) [160] P Day M Rosseinsky K Prassides W I F David O
Moze and A Soper J Phys C 20 L429 (1987) [161] J T Lewandowski R A Beyerlein J M Longo and R
A McCauley J Amer Ceram Soc 69 699 (1986) [162] R Ramesh G van Tendeloo G Thomas S M Green
Y Mei C Jiang and H L Luo Appl Phys Lett 53 2220 (1988)
[163] J Schneck L Pierre J C Tolddano and C Daguet Phys Rev B 39 9624 (1989)
[164] O Eibl Physica C 168 215 (1990) [165] W Carrilo-Cabrera and W Gopel Physica C 161 373
(1989) [166] P Bordet J J Capponi C Chaillout J Chenavas A
W Hewat E A Hewat J L Hodeau M Marezio J L Tholence and D Tranqui Physica C 156189 (1988)
[167] R Ramesh K Remschnig J M Tarascon and S M Green J Mater Res 6 278 (1991)
[168] Z Hiroi Y Ikeda M Takano and Y Bando J Mater Res 6 435 (1991)
[169] Y Inoue M Hasegawa Y Shichi I Munakata M Ya- manaka S Hiyama and O Nittono J Mater Res 5 737 (1990)
[170] R Ramesh B G Bagley J M Tarascon S M Green M L Rudee and H L Luo J Appl Phys 67 379 (1990)
[171] X B Kan J Kulik P C Chow S C Moss Y F Yan J H Wang and Z X Zhao J Mater Res 5 731 (1990)
[172] G S Pawley J Appl Ciyst 13 630 (1980) [173] H Toraya J Appl Ciyst 19 440 (1986) [174] L Lutterotti and P Scardi J Appl Ciyst 23 246
(1990)
About the author Davor Balzar is with Faculty of Metallurgy of the University of Zagreb Sisak Croatia and was a Guest Researcher at fflST The National Institute of Standards and Technology is an agency of the Technology Administration US Department of Commerce
353
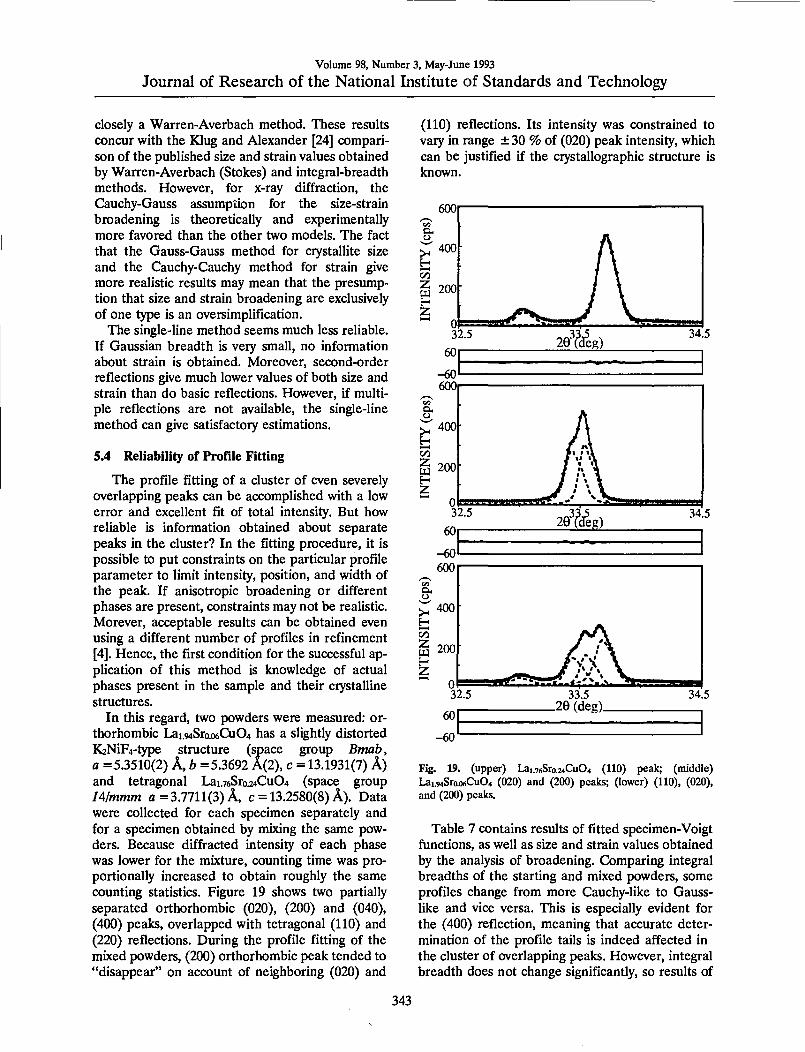
Volume 98 Number 3 May-June 1993
Journal of Research of the National Institute of Standards and Technology
closely a Warren-Averbach method These results concur with the Klug and Alexander [24] compari- son of the published size and strain values obtained by Warren-Averbach (Stokes) and integral-breadth methods However for x-ray diffraction the Cauchy-Gauss assumption for the size-strain broadening is theoretically and experimentally more favored thpoundm the other two models The fact that the Gauss-Gauss method for crystallite size and the Cauchy-Cauchy method for strain give more realistic results may mean that the presump- tion that size and strain broadening are exclusively of one type is an oversimplification
The single-line method seems much less reliable If Gaussian breadth is very small no information about strain is obtained Moreover second-order reflections give much lower values of both size and strain than do basic reflections However if multi- ple reflections are not available the single-line method can give satisfactory estimations
54 Reliability of Profile Fitting
The profile fitting of a cluster of even severely overlapping peaks can be accomplished with a low error and excellent fit of total intensity But how reliable is information obtained about separate peaks in the cluster In the fitting procedure it is possible to put constraints on the particular profile parameter to limit intensity position and width of the peak If anisotropic broadening or different phases are present constraints may not be realistic Morever acceptable results can be obtained even using a different number of profiles in refinement [4] Hence the first condition for the successful ap- plication of this method is knowledge of actual phases present in the sample and their crystalline structures
In this regard two powders were measured or- thorhombic Lai94Sroo6Cu04 has a slightly distorted K2NiF4-type structure (space group Bmab a =53510(2) A b =53692 A(2) c = 131931(7) A) and tetragonal Lai76Sro24Cu04 (space group I4mmm a =37711(3) A c = 132580(8) A) Data were collected for each specimen separately and for a specimen obtained by mixing the same pow- ders Because diffracted intensity of each phase was lower for the mixture counting time was pro- portionally increased to obtain roughly the same counting statistics Figure 19 shows two partially separated orthorhombic (020) (200) and (040) (400) peaks overlapped with tetragonal (110) and (220) reflections During the profile fitting of the mixed powders (200) orthorhombic peak tended to disappear on account of neighboring (020) and
(110) reflections Its intensity was constrained to vary in range plusmn 30 of (020) peak intensity which can be justified if the crystallographic structure is known
60
-60
345
345
335 29 (deg)
345
Fig 19 (upper) Lai76Sro24Cu04 (110) peak (middle) Lai94Sroo6Cu04 (020) and (200) peaks (lower) (110) (020) and (200) peaks
Table 7 contains results of fitted specimen-Voigt functions as well as size and strain values obtained by the analysis of broadening Comparing integral breadths of the starting and mixed powders some profiles change from more Cauchy-like to Gauss- like and vice versa This is especially evident for the (400) reflection meaning that accurate deter- mination of the profile tails is indeed affected in the cluster of overlapping peaks However integral breadth does not change significantly so results of
343
Volume 98 Number 3 May-June 1993
Journal of Research of the National Institute of Standards and Technology
Table 7 Comparison between two specimens run separately and mixed togetlier
Specimen hkl 2Hdeg) )3cO PoO DUA) (D)v(A) (e2laquoD)v2))laquoxlO
Lai76Sroj4CuOr 110 3369 0058(6) 0094(7) 780(60) 850(60) 10(1) 220 7073 022(2) 013(2)
LaiMSro(KiCu04 020 3342 0084(9) 055(14) 500(90) 1000(200) 07(1) 040 7012 010(2) 014(1) 200 3353 00216(85) 0061(8) 1100(100) 1200(100) 03(1) 400 7040 0026(11) 0088(8)
Mix 110 3367 0083(21) 0064(14) 800(300) 1200(300) 08(3) Lai76Sro24Cu04 220 7072 019(7) 013(4)
+ 020 3343 0066(35) 0070(23) 800(300) 1000(300) 07(4) Lai94Sroo6Cu04 040 7012 0116(93) 013(5)
200 3354 0024(156) 0071(61) 900(700) 1000(600) 04(12) 400 7041 011(2) 0003(320)
the multiple-line methods are not much influenced On the contrary the single-line method gives quite different results This may support the conclusion of Suortti Ahtee and Unonius [43] that the Voigt function fails to account properly for size and strain broadening simultaneously if only Cauchy integral breadth determines crystallite size
Table 7 shows that the results of Warren- Averbach analysis of starting and mixed powders agree in the range of standard deviations How- ever errors are much larger especially for the hid- den (200)-(400) reflections From Eq (62) it follows that more counts (longer counting times) and more observables (smaller step-size) would lower standard deviations Therefore in the case of highly overlapping patterns to obtain desirable ac- curacy much longer measurements are needed al- though that will not change the fact that higher overlapping implies intrinsically higher errors of all refinable parameters To further minimize possible artifacts of the fitting procedure it is desirable to include in the analysis as many reflections in the same ciystallographic direction as possible
55 Remarks
By modeling the specimen size and strain broad- ening with the simple Voigt function it is possible to obtain domain sizes and strains that agree with experiment and show a logical interrelationship Furthermore the Voigt function shows the correct 1A(26y asymptotic behavior of peak tails as ex- pected from kinematical theory [139] However if the specimen profile is significantly asymmetric (because of twins and extrinsic stacking faults [140 59]) or the ratio FWHM^ is not intermediate to the Cauchy (2Tr) and Gauss (2(ln27r)^) functions then the Voigt function can not be applied [25]
Suortti Ahtee and Unonius [43] found good over- all agreement by fitting the Voigt function to the pure-specimen profiles of a Ni powder deconvo- luted by the instrumental function However more accurate comparison is limited because of unavoid- able deconvolution ripples of specimen profiles Furthermore the Voigt function might not be flex- ible enough to model a wide range of specimen broadening as well as the different causes of broadening Therefore the question whether the Voigt function can satisfactorily describe complex specimen broadening over the whole 20 range in a general case needs further evaluation
This method of Fourier analysis with the as- sumed profile-shape function is most useful in cases when the classical Stokes analysis fails there- fore when peak overlapping occurs and specimen broadening is comparable to instrumental broaden- ing It was shown that for a high degree of peak overlapping the fitting procedure can give unreli- able results of Gauss and Cauchy integral breadths that is the peak can change easily from predomi- nantly Cauchy-like to Gauss-like and contrary This can lead to illogical values of size-integral and strain-integral breadths according to Eqs (52) (53) (54) and (55) and to irregularities in the be- havior of Fourier coefficients for large L Simulta- neously if the size-broadened profile has a large Gauss-function contribution the hook effect will occur However volume-weighted domain sizes D)y and MSS eL)) for small L are much less affected because they rely on both Cauchy and Gauss parts of the broadened profile Any integral- breadth method that attempts to describe the size and strain broadening exclusively by a Cauchy or Gauss function in this case fails completely For specimens with lower crystallographic symmetry
344
Volume 98 Number 3 May-June 1993
Journal of Research of the National Institute of Standards and Technology
when many multiple-order reflections are avail- able but the peaks are overlapped it is therefore desirable to include in the analysis as many reflec- tions as possible to minimize the potential artifacts of the fltting process
6 Analysis of Superconductors 61 (La-M)2Cu04 Superconductors
Bednorz and Miiller [16] found the first high- temperature oxide superconductor in the La-Ba- Cu-O system Soon after substituting Ba with Sr and Ca Kishio et al [17] found superconductivity in two similar compounds Later many compounds with much higher transition temperatures (Tc) were found The (La-M)2Cu04 system remains favorable for study because the cation content responsible for the superconductivity is easier to control and measure than the oxygen stoichiometry Also this system provides a wide range of substitutional cation solubility in which the tetragonal K2NiF4- type structure is maintained Compared with much- studied Y-Ba-Cu-O this structure is simpler because it contains only one copper-ion site and two oxygen-ion sites
The undoped compound La2Cu04 is orthorhom- bic at room temperature It becomes superconduct- ing either with cation substitution on La sites or increased oxygen content to more than four atoms per formula unit Doping with divalent cations in- creases the itinerant hole carriers in the oxygen- derived electron band [141] which probably causes the superconductivity However different dopants influence the transition temperature Tc Although the unit-cell c-parameter simply reflects ionic dopant size [142] the in-plane unit-cell parameter (and accordingly the Cu-0 bond length) correlates with Tc for different dopants and for different dop- ing amounts [142 143]
LaiB5MouCu04 (M = Ba Ca Sr) have a tetrago- nal K2NiF4-type structure space group lAlmmm with four atoms in the asymmetric unit [117] One site is occupied with La partially substituted with dopant ions (Fig 20) La2Cu04 is orthorhombic at room temperature The best way to correlate these two structures is to describe La2Cu04 in space group Bmab the c axis remains the same tetrago- nal [110] and [110] directions become [010] and [100] orthorhombic axes and size of the unit cell is doubled [144]
Figure 21 shows parts of the x-ray diffraction patterns observed and refined of Lai85Moi5Cu04 (M = Sr Ba Ca) and La2Cu04 Refined lattice
parameters are given in Table 8 Table 9 shows resuhs of the line-broadening analysis Relatively
La(BaCaSr)
0(2)
0(1)
Fig 20 Ciystal structure of (La-M)2Cu04 showing one unit cell
300 JUU
(b)
200
100
U 0 M J Js-r-^
30
-30
300
40 41 42 43 44 45 40 41 42 43 44 45 29 (deg) 29 (deg)
mdashA-
gt t 200
Z
F-
- 100
(c)
f V kgt ii I 40 41 42 43 44 45 40 41 42 43 44 45
e (deg) ^^ 26 (deg)
-30 wwX mdash Wlaquo-
Fig 21 Diffraction patterns of LaiH5Moi5Cu04 specimens (a) M=Sr (b) M = Ba (c)M = Ca (d) M = U
345
Volume 98 Number 3 May-June 1993
Journal of Research of the National Institute of Standards and Technology
Table 8 Lattice parameters and T^ at zero resistivity (Ac method at 10 Ma current)
Specimen a (A) bk) c(A) rc(K)
Lairaquo5Sroi5Cu04 377814(7)
Lairaquo3Baoi3Cu04 37846(2)
LaiiijCaoi5Cu04 37863(7)
La2Cu04 53558(2) 54053(2)
231(2) 36
288(4) 28
17(2) 19
1451(8)
Table 9 Results of line-broadening analysis for (La-M)2Cu4 specimens
Specimen hkl PcO PoO (DUk) (Iraquo)(A) lte^((D)2))
Lai(laquoSroj5Cu04 004 006
0046(4) 0083(5)
0024(8) ltio-
1700(300) 2000(200) 000049(9)
110 0110(5) ltio- 470(20) 940(20) 000044(6) 220 0171(9) ltio-
Lai85Baoi3Cu04 004 006
0049(6) 0110(7)
0076(6) 0089(9)
1100(200) 1100(100) 00011(2)
110 0087(4) 000042(6) 560(20) 1110(20) 000024(5) 220 0116(3) ltio-5
Laiji5Caoi5Cu04 004 006
0120(13) 0146(12)
0032(22) 0033(27)
440(70) 780(90) 00007(4)
110 0045(25) 0200(19) 340(30) 360(20) 00013(2) 220 0343(22) ltio-
La2Cu04 004 006
0061(8) 0124(7)
0045(9) ltio-
1100(100) 1200(100) 00008(1)
020 0074(10) 0078(10) 680(50) 760(50) 00007(2) 040 0210(30) 0026(81) 200 0074(8) 0061(10) 680(50) 810(50) 00003(3) 400 0130(10) 0023(95)
weak peak broadening was observed which can not be attributed to the proximity of the phase trans- formation Lai85SroisCu04 is tetragonal down to = 170 K [145] Lai85Baoi5Cu04 to 140 K [146147] and Lai85Caoi5Cu04 to 130 K [148] Another possi- ble reason for peak broadening might be continu- ous compositional variations in dopant content The scanning Auger microprobe analysis of La2-SrtCu04 compounds [149] showed that grain- boundary segregation of Sr is weak and limited to a narrow region near the grain surface In the case of the separation of two phases with different Sr con- tent and similar lattice parameters asymmetry of some reflections would be observed [150] More- over in the case of compositional inhomogeneity microstrains eL)) would be roughly independent of the averaging distance L in the grains [151] therefore distribution of strains would be Gaus- sian For all specimens microstrain behavior is identical it decreases linearly with distance L
Rothman and Cohen [115] showed that such be- havior of microstrains is caused by dislocations that might arise during grinding Assuming the same applied stress microstrain would be approximately inversely proportional to the elastic moduli of these materials If mean microstrain is defined as the arithmetic average of strains for the [001] and [110] directions results agree with values of the Youngs moduli for polycrystalline La2Cu04 Lai85Moi5Cu04 (M = Sr Ba Ca) [152] However other factors may contribute to the microstrain Coordination-6 ionic radii of La^+ Sr Ba^+ Ca^+ are 106 116 136 100 A respectively [153] Substitution of La with ions of different sizes affects the lattice parameter [142] and may cause much larger strains in the [001] direction when some of the ions are replaced with Ba^ than with Sr^ in accord with results in Table 9 Substitution of Ca^^ ions produces an entirely different effect microstrains in the [110] direction are larger This may be explained by
346
Volume 98 Number 3 May-June 1993
Journal of Research of the National Institute of Standards and Technology
comparing effects of substitutional ions on the unit-cell a -parameter The Ba-doped specimen has a larger a-parameter than the Sr-doped but the Ca-doped a-parameter is largest although Ca^^ has the smallest ionic size This should increase the cell distortion in the a-b plane
Table 9 reveals high anisotropy in these materi- als consistent with other physical properties such as thermal expansion [154] and upper critical mag- netic field [155] Differences of domain sizes might arise from a layered structure in the [001] direction and consequently easy incorporation of stacking faults between regularly stacked layers The stack- ing-fault and twin-fault probabilities can be esti- mated from the average surface-weighted domain sizes [59]
^ = TAN + cf1fun(aa) (75) m im - (D)
Here c is a constant for the particular [hkl] direction and fun(a a) a linear combination of stacking-fault probability and twin-fault probability a The exact form of Eq (75) was derived only for the cubic and hexagonal crystal structures On con- dition that the true domain dimension D is isotropic or so large that the second term of Eq (75) dominates a linear function of stacking-fault and twin-fault probability is
fun(aa) = c( 1
) (76) Zgt)J (Dgttrade
Here c denotes a constant that depends only on geometrical factors and is the same for all three doped compounds
Figure 22 shows a possible correlation between Tc and fault-defect probabilities computed from TEM observations of La2-jcSrCu04 revealed that stacking-fault density increased with Sr content up to jc = 015 [156] That study suggests that a shear mechanism forming the fault-boundary dislocations implies oxygen vacancies andor cation deficiency We did not measure oxygen content but neutron- diffraction studies showed that oxygen deficiency starts to appear at much higher Sr content [157] However the increase of fault probability with the simultaneous decrease of microstrain in Fig 22 supports the assumption that defects are intro- duced to accommodate lattice strains [156] A simi- lar increase in Te was found in Y2Ba4Cu802o-laquo thin films [158] Compounds with asymmetric broad- ened and shifted peaks showed higher Tc which
was attributed to stacking faults Although extrinsic stacking faults may cause asymmetric peak broad- ening [140] it is probably caused by twinning Twinning in La-M-Cu-0 materials is less abundant than in Y-Ba-Cu-O compounds but it was ob- served in (La-Sr)2Cu04 monocrystals on (110) planes [159] In the profile-fitting procedure peak asymmetry is incorporated only in the instrumental function therefore we could not model asymmetric peak broadening However any significant asym- metry of the specimen profile would cause an un- even fit of low-angle and high-angle sides of peaks which was not observed This gives much more im- portance to stacking faults in Eq (76)
Fig 22 Arithmetic average of [110] and [001] root-mean- square strains and linear function of stacking-fault and twin- fault probabilities as a function of Tc
In Fig 22 average microstrains defined as the arithmetic average of [001] and [110] directions correlate inversely with Tc However we did not find a correlation of Tc and microstrains in a partic- ular direction [001] microstrains simply reflect dif- ference in size of dopant and host La^ ions (see Table 9)
In La2Cu04 (OkO) reflections are significantly broader than (hOO) This has also been observed in low-temperature orthorhombic Lai85Sroi5Cu04 and Lai85Baoi5Cu04 [160] and explained by either stacking faults or possible lower symmetry Our results reveal that domain sizes (D) have identical values for [010] and [100] directions (Table 9) From Eq (76) it follows that stacking-fault proba- bilities in these directions have the same values However microstrains in the [010] direction are roughly twice as large as in the [100] direction which is responsible for the different broadening In the case of doped La2Cu04 compounds different microstrains might be caused by oxygen
347
Volume 98 Number 3 May-June 1993
Journal of Research of the National Institute of Standards and Technology
vacancies ordered along one direction in the a-b plane similar to effects found in YBa2Cu307-laquo However undoped La2Cu04 is not expected to have significant o^Qgen deficiency Other possibili- ties are lower ciystallographic symmetry andor La vacancies although they were not reported for this system but La deficiency was found in an La2Co04 compound [161]
We can conclude that lattice strains and incoher- ently diffracting domain sizes confirm high an- isotropy in these materials This simple approach however does not allow unambiguous identifica- tion of the strains origin Probably the strains originate from dislocations and from different sizes of host and dopant ions Domain sizes of all com- pounds are larger in the c-direction than in the a-6 plane This indicates existence of stacking faults and twins However because estimated errors are relatively large and only three materials were stud- ied the possible connection between stacking faults and 7c needs further study
62 Bi-Cu-O Superconductors
Among the high-Tc superconductors the Bi- Cu-O compounds appear intriguing especially because their incommensurate structure modula- tion remains incompletely understood [162 163] The crystal structure consists of perovskite-like SrO-(Cu02Ca)mi-Cu02-SrO layers separated by NaCl-like BiO double layers (see Fig 23 [164]) The number m of Cu02 layers alters the supercon- ducting transition temperature Tc (for m = 12 and 3 rclaquo10 90 and 110 K respectively) This two- dimensional layered structure makes these materi- als highly anisotropic and favours the creation of defects
Bulk sintered specimens showed relatively weak peak broadening Moreover the diffraction pat- terns contained many overlapping peaks because the compound crystallizes in an orthorhombic low- symmetry space group A2aa [165] and incommen- surate modulation gives superlattice reflections All patterns revealed a strong [001] texture (Fig 24) making reflections other than (001) difficult to ana- lyze The lattice parameters vary depending on the exact compound stoichiometry and processing his- tory but characteristically they have almost identi- cal a and b parameters and large c parameter fl =54095 A 6=54202 A c =309297 A for Bi2Sr2CaCu208 (Bi-2212 [166] and A =5392 A b =5395 A c =36985 A for (BiPb)2Sr2Ca2Cu30io (BiPb-2223) [165] Thus we treated (hOO) and (0^0) reflections as single peaks Table 10 gives the
results for three specimens Bi-2212 (BiPb)2 (SrMg)2(BaCa)2Cu30io (BiPbMgBa-2223) which were one-phase specimens and BiPb-2223 con- taining approximately equal amounts of 2212 and 2223 phases The in-plane lattice parameters of 2212 and 2223 phases differ little hence only the [00] directions of the mixed-phase specimen were evaluated
b^ (c)
Fig 23 Average crystal structure of Bi2Sr2Cam-iCum04+2m for (a) m = 1 (b) w =2 (c) m =3 [164]
35
-35
42 44 46 48 50 52 54 56 58 60 62 26 (deg)
^ ^^^MK^Aa^Ndllaquop
Fig 24 Part of BiPbMgBa-2223 refined pattern There are 48 fundamental reflections in this region
Interpretation of the results in the case of these complicated compounds must be considered care- fully Microstrains are probably caused by disloca- tion arrays However substitution of different-sized ions and vacancies would also contribute to the strains as would other kinds of disorder especially
348
Volume 98 Number 3 May-June 1993
Journal of Research of the National Institute of Standards and Technology
Table 10 Results of line-btoadening analysis for Bi-Cu-O supreconductors
Specimen Phase hkl (A)
eD)sa)y^
Bi-2212 2212 008 0012
0163(8) 022(3)
001(6) 005(6)
420(80) 00021(6)
020+200 0104(4) ltio-^ 580(30) 00007(1) 040+400 018(2) 00004(6300)
BiPbMgBa-2223 7773 0010 0020
0097(1) 021(2)
00002(1700) 0007(150)
770(60) 00012(1)
020 + 200 012(27) 013(10) 380(430) 00009(71) 040 + 400 015(95) 021(33)
BiPb-73 2212 008 0012
023(2) 025(5)
0002(350) 0001(1000)
220(30) 00013(26)
2223 0010 0020
022(8) 023(99)
0092(67) 018(47)
230(190) 00012(197)
Stacking faults and twins Table 10 shows larger strains in the [001] direction that in the basal plane This can be explained by stacking disorder along the c-axis which was frequently observed in electron-diffraction patterns as streaking [167 168] Easy incorporation of stacking faults is possi- ble because of the two-dimensional weak-bonded layers (BiO double layers are spaced about 3 A apart) The difference in microstrain between in- plane and the c-direction is much smaller for the BiPbMgBa-2223 phase probably because Pb low- ers the faulting by stabilizing the higher-Tc 2223 phase [167] For the BiPb-2223 specimen with two phases there are two possibilities Either the speci- men consists mainly of a mk of two kinds of one- phase grains or both phases occur within the same grains The second possibility was confirmed exper- imentally [169 170] and our results concur be- cause microstrain in the 2212 phase is much smaller than in the one-phase Bi-2212 specimen Processing conditions and cation content probably favour development of the macroscopic inter- growth of both phases within the grains that is microscopic defects grow to sufficiently large re- gions to give a diffraction pattern of another phase with the different number of Cu02 layers As a re- sult strain is relieved and both strains and domain sizes being quite different in one-phase specimens tend to equalize
For the Bi-Cu-O specimens the mean surface- weighted domain sizes are generally smaller than for (La-M)2Cu04 compounds Therefore the com- putation of the stacking- and twin-fault probabili- ties by using Eq (75) may be wrong It would be very instructive to compare the different broaden-
ing of satellite and fundamental reflections which indicates a more pronounced stacking disorder in the modulated structure [171]
In summary we found that for both Bi-2212 and BiPbMgBa-2223 superconductors the c-axis strain exceeds the in-plane strain The BiPb-2223 specimen containing both 2212 and 2223 phases within the single grains shows smaller incoherently diffracting domains and lower c-axis strain than the one-phase specimens This fact may direct us to- ward the mechanism of the second-phase forma- tion in these materials
63 Remarks
It was shown that this particular method of the line-broadening analysis can give information about the size of incoherently diffracting domains and lattice strains in (La-M)2Cu04 and Bi-Clu-O superconductors Moreover results show high an- isotropy of both size and strain parameters as one may expect because of the layered structure of all superconducting cuprates Generally structural line broadening is not large that is a result of rela- tively large domain sizes (200-2000 A) and small strains (002-02) It is interesting to compare these values with the published results for YBa2Cu307-laquo (isotropic strains of 023 [77] and 005-03 [82]) Although the different materi- als were studied they seem too large especially be- cause they are the average of strains in different directions
The main drawback of the line-broadening the- ory is the uncertainty about the origins of the line broadening that is it is difficult to distinguish the main effects responsible for the broadening For
349
Volume 98 Number 3 May-June 1993
Journal of Research of the National Institute of Standards and Technology
the novel superconductors particularly the numer- ous defects (substitutions vacancies stacking faults dislocations and similar) can occur simulta- neously which makes it very difficult to determine their individual contributions Furthermore the crystal structures of most novel superconductors are relatively complicated The average structure has mostly a slightly distorted tetragonal symmetry very similar a and b lattice parameters and a large c parameter but c=36 for YBa2Cu307-laquo for in- stance This results in a large number of overlap- ping peaks and consequently in large errors of all results This showed especially in the case of Bi-Cu-O superconductors (see Table 10) Follow- ing the discussion of reliability of profile fitting in Sec 54 it would be desirable to include more than two reflections in the analysis of broadening but higher-order peaks are usually too weak and over- lapped One way to partially solve this problem would be a whole pattern fitting [172 173] and Rietveld structure refinement [23] in terms of size and strain parameters This requires an accurate preset function to model specimen broadening and precise definition of angular dependence of size and strain parameters The Rietveld programs that model the line broadening in terms of size and strain parameters are based either on the simpli- fied integral-breadth methods [78 95] or on the single-line method [174]
7 Conclusions
A method for analyzing the pure-specimen (structural) broadening of x-ray diffraction line profiles is proposed By modeling the specimen size and strain broadenings with the simple Voigt func- tion it is possible to obtain domain sizes and strains that agree with experiment and show a logi- cal interrelationship Furthermore some common consequences and problems in the Fourier-method analysis follow easily The specimen function is convoluted with the instrumental function to match the observed x-ray diffraction-line profile This avoids the Stokes deconvolution method thus al- lowing analysis of patterns with highly overlapping peaks and weak structural broadening Therefore the method was applied to some novel high-Tc superconductors We reached the following conclu- sions
(i) Surface-weighted domain size depends only on the Cauchy integral breadth of the size-broad- ened profile
(ii) The hook effect occurs when the Cauchy-content of the size-broadened profile is un-
derestimated that is for ^sc(n2)^3sG Usually this happens when the background is estimated too high so the long tails of the Cauchy function are prematurely cut off
(iii) It also follows from conclusion (ii) that the volume-weighted domain size can not be more than twice the surface-weighted domain size (limiting value D)v=2D)i is obtained for the pure-Cauchy size-broadened profile) Minimum value for D)J (D)j should not be less than -131
(iv) If the distortion coefficient is approxi- mated with a harmonic term this leads exactly to the Warren-Averbach method of separation of size and strain broadenings
(v) In that case mean-square strains decrease linearly with the distance L
(vi) It is possible to evaluate local strain ((e^(0))^) only in the case of pure-Gauss strain broadening Then root-mean-square strain is inde- pendent of the distance L and related to the upper limit of strain obtained from the integral breadth of the strain-broadened profile
(vii) If strain broadening is not described exclu- sively with the Gauss function the multiple-line Voigt integral breadth and Warren-Averbach analyses can not give the same results for volume- weighted domain size although D)v is defined identically in both approaches because the appar- ent strain -q = pdeg(29)cot9 is not angular- independent
(viii) Smooth size coefficients give column- length distribution functions without oscillations and make possible a computation of volume- weighted average domain sizes up to ~5000 A
(ix) Comparison with the simplified integral- breadth methods in most cases has shown not large but systematic discrepancy of results indicat- ing that size and strain broadening can not be accu- rately modeled by a single Cauchy or Gauss function Moreover the application of the single- line method is much less reliable and it should not be used where multiple reflections are available
(x) The knowledge of all phases present in the sample and their crystallographic structure is re- quired to successfully fit a cluster of overlapping peaks Although it is very difficult to accurately de- termine the Cauchy-Gauss ratio of an overlapped peak final results of domain size and strain are much less affected Therefore connecting the crys- tallite size exclusively with the Cauchy content and strain with the Gauss content of a specimen profile might be doubtful
(xi) Evaluated errors of domain sizes and strains increase substantially with the degree of
350
Volume 98 Number 3 May-June 1993
Journal of Research of the National Institute of Standards and Technology
peak overlapping Hence for complicated patterns very accurate measurements are necessary and one needs to analyze as many reflections in the same crystallographic direction as possible
(xii) Line-broadening analysis of (La-M)2Cu04 and Bi-Cu-O compounds confirms high anisotropy in these materials
(xiii) Strains in (La-M)2Cu04 probably origi- nate from dislocations and from different sizes of host and dopant ions
(xiv) Stacking-fault probability in (La-M)2Cu04 (M = Ba Ca Sr) increases with increasing Tc whereas the average strain decreases
(xv) In La2Cu04 different broadening of (lOO) and (OfcO) reflections is not caused by stacking faults
(xvi) All Bi-Cu-0 superconductors show larger strain in the c-direction than in the a-b plane which can be explained by stacking disorder along the [001] direction
(xvii) In the specimen with approximately equal amounts of Tl-2212 and TlPb-2223 phases it is likely that a secondary phase develops by the growth of the microscopic faulted regions of the primary phase
Acknowledgments
I am thankful to Dr Harry McHenry for his support and especially to Dr Hassel Ledbetter for his wise guidance and most useful help during my stay at NIST I am also indebted to my home insti- tution the Faculty of Metallurgy of the University of Zagreb for allowing me the leave of absence at NIST
8 References
[1] W Friedrich P Knipping and M v Laue Ann Physik 41 971 (1912)
[2] H M Rietveld Acta Cryst 22 151 (1967) [3] H M Rietveld J Appl Cryst 2 65 (1969) [4] S A Howard and K D Preston in Modern Powder Dif-
fraction Vol 20 The Mineralogical Society of America Washington DC (1989) p 217
[5] D Taupin J Appl Cryst 6 266 (1973) [6] T C Huang and W Parrish Appl Phys Lett 27 123
(1975) [7] M K Wu J R Ashburn C J Torng P H Hor R L
Meng L Gao Z J Hwang Y Q Wang and C W Chu Phys Rev Lett 58 908 (1987)
[8] D Shi MRS Bull 16 37 (1991) [9] D Larbalestier Phys Today 44 74 (1991)
[10] J C Phillips Phys Rev B 4512647 (1992) [11] B Raveau Phys Today 45 53 (1992) [12] A J Millis and K M Rabe Phys Rev B 38 8908 (1988)
[13] F Guinea Europhys Lett 7 549 (1988) [14] C P Dhard and P Singh in Proc Int Symp High-Temp
Supercond Jaipur India Oxford amp IBH Publishing New Delhi (1988) p 271
[15] J D Jorgensen Phys Today 44 34 (1991) [16] J G Bednorz and K A Muller Z Phys B 64 189
(1986) [17] K Kishio K Kitazawa S Kaube I Yasuda N Sugii H
Takagi S Uchida K Fueki and S Tanaka Chem Lett 429 (1987)
[18] J D Jorgensen B Dabrowski S Pei D G Hinks L Soderholm B Morosin J E Venturini and D S Ginley Phys Rev B 38 11337 (1988)
[19] J R Clem Phys Rev B 43 7837 (1991) [20] M Paranthaman M Foldejiki D Balzar H Ledbetter
A J Nelson and A M Hermann submitted to Phys Rev B
[21] A R Stokes Proc Phys Soc Lond 61 382 (1948) [22] B E Warren and B L Averbach J Appl Phys 23 497
(1952) [23] R Delhez Th H de Keijser and E J Mittemeijer in
Accuracy in Powder Diffraction S Block and C R Hub- bard eds Natl Bur Stand (US) Special Publication 567 (1980) p 213
[24] H P Klug and L E Alexander X-ray Diffraction Proce- dures 2nd Edition John Wiley New York (1974) p 661
[25] J I Langford J Appl Ciyst 11 10 (1978) [26] J I Langford in Accuracy in Powder Diffraction S
Block and C R Hubbard eds Natl Bur Stand (US) Special Pubication 567 (1950) p 255
[27] R Delhez Th H de Keijser and E J Mittemeijer Fre- senius Z Anal Chem 312 1 (1982)
[28] A J C Wilson Proc Phys Soc Lond 80 286 (1962) [29] A J C Wilson Proc Phys Soc Lond 81 41 (1963) [30] L P Smith Phys Rev 46 343 (1934) [31] H C Burger and P H van Cittert Z Phys 79 722
(1932) [32] S Ergun J Appl Ciyst 1 19 (1968) [33] R Croche and L Gatineau J Appl Ciyst 10479 (1977) [34] L H Schwarz and J B Cohen Diffraction from Materi-
als Academic Press New York (1977) p 391 [35] R Delhez Th H de Keijser E J Mittemeijer and J I
Langford J Appl Cryst 19 459 (1986) [36] R Delhez Th H de Keijser E J Mittemeijer and J I
Langford Aust J Phys 41 213 (1988) [37] R A Young and D B Wiles J Appl Cryst 15 430
(1982) [38] W Voigt Stizungsber K Bayer Akad Wiss 42 603
(1912) [39] E E Whiting J Quant Spectrosc Radiat Transfer 8
1379 (1968) [40] G K Wertheim M A Butler K W West and D N E
Buchanan Rev Sci Instrum 111369 (1974) [41] M M Hall Jr V G Veeraraghavan H Rubin and P G
Winchell J Appl Cryst 10 66 (1977) [42] A Brown and J W Edmonds Adv X-Ray Anal 23 361
(1980) [43] P Suortti M Ahtee L Unonius J Appl Cryst 12 365
(1979) [44] T Sundius J Raman Spectrosc 1 471 (1973) [45] B H Armstrong J Quant Spectrosc Radiat Transfer 7
61 (1967) [46] J F Kielkopf J Opt Soc Am 63 987 (1973) [47] B P Asthana and W Kiefer Appl Spectr 36 250
(1982)
351
Volume 98 Number 3 May-June 1993
Journal of Research of the National Institute of Standards and Technology
[48] J P M de Vreede S C Mehrotra A Tal and H A Dijkerraan Appl Spectr 36 227 (1982)
[49] F R L Schoening Ada Ciyst 18 975 (1965) [50] P Scherrer Gott Nachr 2 98 (1918) [51] A R Stokes and A J C Wilson Proc Cambridge
Philos Soc 38 313 (1942) [52] A J C Wilson X-Ray Optics 2nd edition Methuen
London (1962) [53] S Leie and T R Anantharaman Proc Indian Acad
Sci Sect A H 261 (1966) [54] D Louer D Weigel and J I Langford J Appl Ciyst
5 353 (1972) [55] A J C Wilson J Appl Ciyst 2 181 (1969) [56] J I Langford and A J C Wilson J Appl Ciyst 11102
(1978) [57] A R Stokes and A J C Wilson Proc Phys Soc Lond
56174 (1944) [58] B E Warren and B L Averbach J Appl Phys 21 595
(1950) [59] B E Warren X-Ray Diffraction Addison-Wesley
Reading Massachusetts (1969) p 264 [60] B E Warren in Progress in Metal Physics Vol 8 Perg-
amon Press London (1959) p 146 [61] F Bertaut C R Acad Sci Paris 228 187 (1949) [62] N C Haider and C N J Wagner Acta Cryst 20 312
(1966) [63] D Balzar and H Ledbetter in Proceedings of the Accu-
racy in Powder Diffraction II Natl Inst Stand Technol (1992) p 37
[64] D Balzar and H Ledbeter J Appl Cryst 26 (1993) in press
[65] J N Eastabrook and A J C Wilson Proc Phys Soc Lond B 65 67 (1952)
[66] R S Smith IBM J Res Develop 4 205 (1960) [67] B Y Pines and A F Sirenko Soviet Physics Ciyst 715
(1962) [68] G B Mitra and N K Misra Acta Ciyst 22 454 (1967) [69] A Gangulee J Appl Ciyst 7 434 (1974) [70] J Mignot D Rondot Acta Met 231321 (1975) [71] J Mignot and D Rondot Acta Ciyst A 33 327 (1977) [72] R K Nandi H K Kuo W Schlosberg G Wissler J B
Cohen and B Crist Jr J Appl Ciyst 17 22 (1984) [73] M Zocchi Acta Ciyst A 36164 (1980) [74] P Ramarao and T R Anantharaman Trans Ind Ins
Metals 18 181 (1965) [75] R K Nandi and S P Sen Gupta J App Cryst 11 6
(1978) [76] Th H de Keijser J I Langford E J Mittemeijer and
B P Vogels J Appl Ciyst IS 308 (1982) [77] A Williams G H Kwei R B Von Dreele A C Lar-
son L D Raistrick and D L Bish Phys Rev B 37 7960 (1988)
[78] A C Larson and R B Von Dreele Los Alamos Na- tional Laboratory Report No LA-UR-86-748 (1988)
[79] J D Jorgensen D H Johnson M H Mueller J G Worlton and R B Von Dreele in Proceedings of the Conference on Diffraction Profile Analysis Cracow Poland (1978) p 20
[80] R B Von Dreele J D Jorgensen and C G Windsor J Appl Ciyst 15 581 (1982)
[81] P Thompson D E Cox and J B Hastings J Appl Ciyst 20 79 (1987)
[82] J P Singh R A Guttschow D S Kupperman J T Dusek and R B Poeppel in High Temperature Super-
conducting Compounds III S Whang A Gupta and E Ceilings eds TMS AIME Warrendale (1991) p 281
[83] M O Eatough D S Glnley and B Morosin Adv X- Ray Anal 33 145 (1990)
[84] E J Peterson P J Kung R E Muenchausen and D M Smith in Proceedings of the 41st Annual Denver Conference on Applications of X-Ray Analysis Colo- rado Springs Colorado (1992) p 74
[85] M Rand J I Langford and J S Abell submitted to J Cryogenics (1992)
[86] D Balzar J Appl Ciyst 25 559 (1992) [87] D Balzar H Ledbetter and A Roshko Physica C 185-
189 871 (1991) [88] D Balzar and H Ledbetter J Mater Sci Lett 111419
(1992) [89] D Balzar H Ledbetter and A Roshko Pow Diffr 8
(1993) in press [90] S Johnson M Gusraan D Rowcliffe T Geballe and J
Sun Adv Ceram Mater 2 337 (1987) [91] H Ledbetter S A Kim R B Goldfarb and K Togano
Phys Rev B 39 9689 (1989) [92] H Friedman Electronics 132 (1945) [93] W Parrish (ed) in Advances in X-Ray Diffractometry
and X-Ray Spectrography Centrex Publishing Company Eindhoven The Netheriands (1962)
[94] W Soller Phys Rev 24158 (1924) [95] S A Howard R L Snyder J Appl Ciyst 22 238
(1989) [96] G H Stout and L H Jensen X-Ray Structure Determi-
nation 2nd edition Wiley New York (1989) p 373 [97] D E Appleman and T Evans Jr Final Report 92-14
US Geological Survey Washington DC (1973) Avail- able as NTIS Document No PB-216188
[98] M U Cohen Rev Sci Instrum 6 68 (1935) [99] M U Cohen Rev Sci Instrum 7 155 (1936) [100] M H Mueller L Heaton and K T Miller Acta Ciyst
13 828 (1960) [101] R A Young P E Mackie and R B Von Dreele J
Appl Ciyst 10 262 (1977) [102] D B Wiles and R A Young J Appl Cryst 14 149
(1981) [103] J K Yau and S A Howard J Appl Ciyst 22 244
(1989) [104] S A Howard J K Yau and H U Anderson J Appl
Phys 65 1492 (1989) [105] S Enzo G Fagherazzi A Benedetti and S Poilizzi J
Appl Ciyst 21 536 (1988) [106] A Benedetti G Fagherazzi S Enzo and M
Battagliarin J Appl Cryst 21 543 (1988) [107] Th H de Keijser E J Mittemeijer and H C F Rozen-
daal J Appl Ciyst 16 309 (1983) [108] Y Zhang J M Stewart C R Hubbard and B Mo-
rosin Adv X-Ray Anal 33 373 (1990) [109] Y Wang S Lee and Y Ue J Appl Ciyst IS 35
(1982) [110] V N Selivanov and E F Smislov Zavod Lab 57 28
(1991) [Ill] A Guinier X-Ray Diffraction W H Freeman San
Francisco (1963) p 139 [112] M Wilkens J Appl Cryst 12119 (1979) [113] D Du and Y Wang Pow Diffr 2180 (1987) [114] A P Prudnikov Yu A Brychkov and O L Marichev
Integrals and Series Vol 1 Gordon and Breach Am- sterdam The Netheriands (1986) p 344
352
Volume 98 Number 3 May-June 1993
Journal of Research of the National Institute of Standards and Technology
[115] R L Rothman and J B Cohen J Appl Phys 42 971 (1971)
[116] T Adier and C R Houska J Appl Phys 50 3282 (1979)
[117] C R Houska and T M Smith J Appl Phys 52 748 (1981)
[118] S Rao and C R Houska Acta Ciyst A 4214 (1986) [119] J I Langford R Delhez Th H de Keijser and E J
Mittemeijer Ausi J Phys 41173 (1988) [120] J I Langfoid J Appl Cryst IS 315 (1982) [121] M J Turunen Th H de Keijser R Delhez and N M
van der Pers J Appl Ciyst 16176 (1983) [122] A J C Wilson Acta Ciyst 23 888 (1967) [123] A J C Wilson Acta Ciyst A 24 478 (1968) [124] A J C Wilson Acta Ciyst A 25 584 (1969) [125] G Gagliotti A Paoletti and F P Ricci Nucl Instrum
3 223 (1958) [126] J I Langford R J Cernik and D Louer J Appl
Ciyst 24 913 (1991) [127] J I Langford in Accuracy in Powder Diffraction II
preprint [128] A J C Wilson Mathematical Theory of X-Ray Powder
Diffractometiy Centrex Eindhoven The Netherlands (1963)
[129] J L Langford Prog Ciyst Growth and Charact 14185 (1987)
[130] T G Fawcett C E Crowder S J Brownell Y Zhang C R Hubbard W Schreiner G P Hamill T C Huang E Sabino J I Langford R Hamilton and D Louer Pow Diffr 3 209 (1988)
[131] W L Smith J Appl Ciyst 9187 (1976) [132] J L Langford and D Louer J Appl Ciyst 15 20
(1982) [133] Fl Popescu and L Benes Acta Ciyst A 33 323 (1977) [134] P PSuse^cu R MSnaila M Popescu and E Jijovici j
Appl Cryst 7 281 (1974) [135] P F Bley Y Calvayrac and M Fayard J Appl Ciyst
7 493 (1974) [136] B Moraweck Ph de Montgolfier and A J Renouprez
J Appl Ciyst 10191 (1977) [137] A Le Bail and D Louer J Appl Cryst 11 50 (1978) [138] D R Buchanan R L McCuUough and R L Miller
Acta Ciyst 20 922 (1966) [139] P Suortti and L D Jennings Acta Cryst A 33 1012
(1977) [140] J B Cohen and C N J Wagner J Appl Phys 33 2073
(1962) [141] A Bianconi J Budnick A M Flank A Fontaine P
Lagarde A Marcelli H Tolentino B Chamberland C Michel B Raveau and G Demazeau Phys Lett A127 285 (1988)
[142] K Fueki K Kitazawa K Kishio T Hasegawa S Uchida H Takagi and S Tanaka in Chemistiy of High- Temperature Superconductors D L Nelson M S Whittingham and T F George eds American Chemi- cal Society (1987) p 38
[143] T Fujita Y Aoki Y Maeno J Sakurai H Fukuba and H Fujii J Appl Phys 26 U68 (1987)
[144] R M Hazen in Physical Properties of High-rc Super- conductors Vol 2 D M Ginsberg ed World Scien- tific Singapore (1990) p 121
[145] J B Torrance A Bezinge A I Nazzal T C Huang S P Parkin D T Keane S J LaPlaca P M Horn and G A Held Phys Rev B 40 8872 (1989)
[146] J D Axe A H Moudden D Hohlwein D E Cox K
M Mohanty A R Moodenbaugh and Y Xu Phys Rev Lett 62 2751 (1989)
[147] T Suzuki and T Fujita Physica C 159 111 (1989) [148] T Fujita and Y Maeno in Superconducting Materials
JJAP Series 1 (1988) p 34 [149] A Roshko and Y-M Chiang J Appl Phys 66 3710
(1989) [150] D E Cox S C Moss R L Meng P H Hor and C W
Chu J Mater Res 31327 (1988) [151] B Crist and J B Cohen J Polym Sci 17 1001 (1979) [152] H Ledbetter S Kim and A Roshko Z Phys B 89275
(1992) [153] R D Shannon and C T Prewitt Acta Ciyst B 25 925
(1969) [154] M Lang H Spille F Steglich Y Hidaka T Murakami
and Y Endoh Physica C 162-1641037 (1989) [155] Y Hidaka and T Murakami Phase trans 15 241
(1989) [156] P L Gai and E M McCarron Science 247 553 (1990) [157] T Kamiyama I Izumi H Asano H Takagi S Uchida
Y Tokura E Takayama-Muromachi M Matsuda K Yamada Y Endoh and Y Hidaka Physica C 172 120 (1990)
[158] A Kapitulnik Physica C 153-155 520 (1988) [159] L A Muradyan V N Molchanov R A Tamazyan and
V I Simonov Physica C 162-164 536 (1989) [160] P Day M Rosseinsky K Prassides W I F David O
Moze and A Soper J Phys C 20 L429 (1987) [161] J T Lewandowski R A Beyerlein J M Longo and R
A McCauley J Amer Ceram Soc 69 699 (1986) [162] R Ramesh G van Tendeloo G Thomas S M Green
Y Mei C Jiang and H L Luo Appl Phys Lett 53 2220 (1988)
[163] J Schneck L Pierre J C Tolddano and C Daguet Phys Rev B 39 9624 (1989)
[164] O Eibl Physica C 168 215 (1990) [165] W Carrilo-Cabrera and W Gopel Physica C 161 373
(1989) [166] P Bordet J J Capponi C Chaillout J Chenavas A
W Hewat E A Hewat J L Hodeau M Marezio J L Tholence and D Tranqui Physica C 156189 (1988)
[167] R Ramesh K Remschnig J M Tarascon and S M Green J Mater Res 6 278 (1991)
[168] Z Hiroi Y Ikeda M Takano and Y Bando J Mater Res 6 435 (1991)
[169] Y Inoue M Hasegawa Y Shichi I Munakata M Ya- manaka S Hiyama and O Nittono J Mater Res 5 737 (1990)
[170] R Ramesh B G Bagley J M Tarascon S M Green M L Rudee and H L Luo J Appl Phys 67 379 (1990)
[171] X B Kan J Kulik P C Chow S C Moss Y F Yan J H Wang and Z X Zhao J Mater Res 5 731 (1990)
[172] G S Pawley J Appl Ciyst 13 630 (1980) [173] H Toraya J Appl Ciyst 19 440 (1986) [174] L Lutterotti and P Scardi J Appl Ciyst 23 246
(1990)
About the author Davor Balzar is with Faculty of Metallurgy of the University of Zagreb Sisak Croatia and was a Guest Researcher at fflST The National Institute of Standards and Technology is an agency of the Technology Administration US Department of Commerce
353
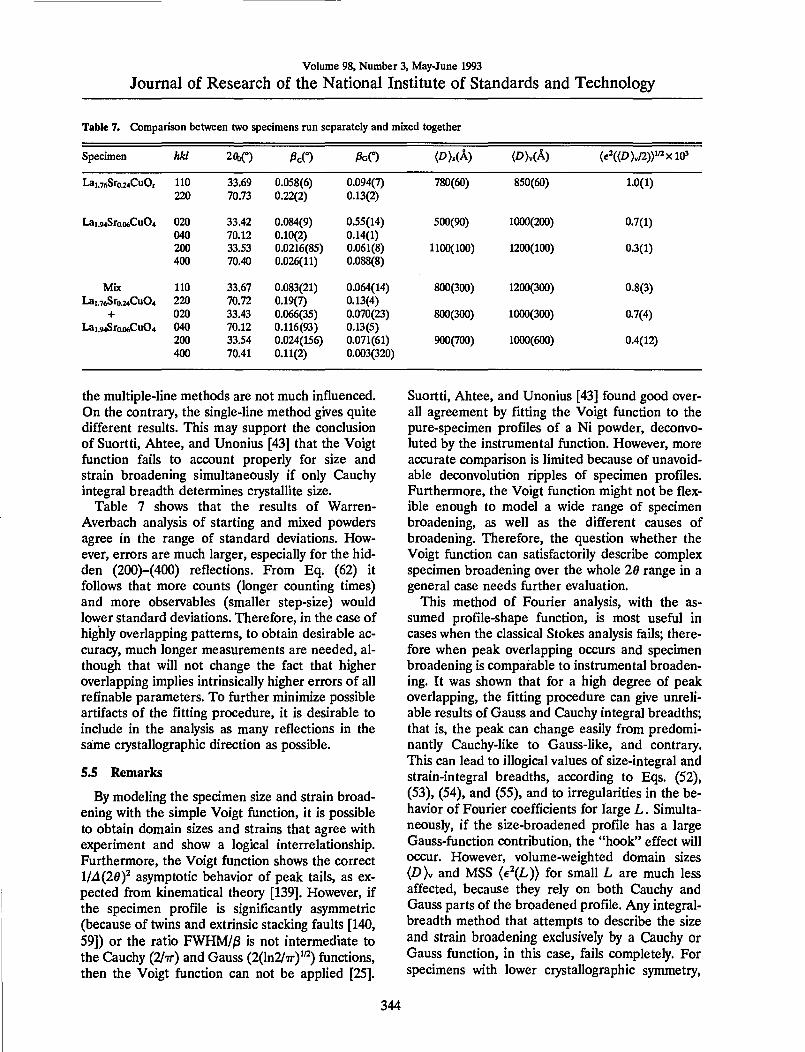
Volume 98 Number 3 May-June 1993
Journal of Research of the National Institute of Standards and Technology
Table 7 Comparison between two specimens run separately and mixed togetlier
Specimen hkl 2Hdeg) )3cO PoO DUA) (D)v(A) (e2laquoD)v2))laquoxlO
Lai76Sroj4CuOr 110 3369 0058(6) 0094(7) 780(60) 850(60) 10(1) 220 7073 022(2) 013(2)
LaiMSro(KiCu04 020 3342 0084(9) 055(14) 500(90) 1000(200) 07(1) 040 7012 010(2) 014(1) 200 3353 00216(85) 0061(8) 1100(100) 1200(100) 03(1) 400 7040 0026(11) 0088(8)
Mix 110 3367 0083(21) 0064(14) 800(300) 1200(300) 08(3) Lai76Sro24Cu04 220 7072 019(7) 013(4)
+ 020 3343 0066(35) 0070(23) 800(300) 1000(300) 07(4) Lai94Sroo6Cu04 040 7012 0116(93) 013(5)
200 3354 0024(156) 0071(61) 900(700) 1000(600) 04(12) 400 7041 011(2) 0003(320)
the multiple-line methods are not much influenced On the contrary the single-line method gives quite different results This may support the conclusion of Suortti Ahtee and Unonius [43] that the Voigt function fails to account properly for size and strain broadening simultaneously if only Cauchy integral breadth determines crystallite size
Table 7 shows that the results of Warren- Averbach analysis of starting and mixed powders agree in the range of standard deviations How- ever errors are much larger especially for the hid- den (200)-(400) reflections From Eq (62) it follows that more counts (longer counting times) and more observables (smaller step-size) would lower standard deviations Therefore in the case of highly overlapping patterns to obtain desirable ac- curacy much longer measurements are needed al- though that will not change the fact that higher overlapping implies intrinsically higher errors of all refinable parameters To further minimize possible artifacts of the fitting procedure it is desirable to include in the analysis as many reflections in the same ciystallographic direction as possible
55 Remarks
By modeling the specimen size and strain broad- ening with the simple Voigt function it is possible to obtain domain sizes and strains that agree with experiment and show a logical interrelationship Furthermore the Voigt function shows the correct 1A(26y asymptotic behavior of peak tails as ex- pected from kinematical theory [139] However if the specimen profile is significantly asymmetric (because of twins and extrinsic stacking faults [140 59]) or the ratio FWHM^ is not intermediate to the Cauchy (2Tr) and Gauss (2(ln27r)^) functions then the Voigt function can not be applied [25]
Suortti Ahtee and Unonius [43] found good over- all agreement by fitting the Voigt function to the pure-specimen profiles of a Ni powder deconvo- luted by the instrumental function However more accurate comparison is limited because of unavoid- able deconvolution ripples of specimen profiles Furthermore the Voigt function might not be flex- ible enough to model a wide range of specimen broadening as well as the different causes of broadening Therefore the question whether the Voigt function can satisfactorily describe complex specimen broadening over the whole 20 range in a general case needs further evaluation
This method of Fourier analysis with the as- sumed profile-shape function is most useful in cases when the classical Stokes analysis fails there- fore when peak overlapping occurs and specimen broadening is comparable to instrumental broaden- ing It was shown that for a high degree of peak overlapping the fitting procedure can give unreli- able results of Gauss and Cauchy integral breadths that is the peak can change easily from predomi- nantly Cauchy-like to Gauss-like and contrary This can lead to illogical values of size-integral and strain-integral breadths according to Eqs (52) (53) (54) and (55) and to irregularities in the be- havior of Fourier coefficients for large L Simulta- neously if the size-broadened profile has a large Gauss-function contribution the hook effect will occur However volume-weighted domain sizes D)y and MSS eL)) for small L are much less affected because they rely on both Cauchy and Gauss parts of the broadened profile Any integral- breadth method that attempts to describe the size and strain broadening exclusively by a Cauchy or Gauss function in this case fails completely For specimens with lower crystallographic symmetry
344
Volume 98 Number 3 May-June 1993
Journal of Research of the National Institute of Standards and Technology
when many multiple-order reflections are avail- able but the peaks are overlapped it is therefore desirable to include in the analysis as many reflec- tions as possible to minimize the potential artifacts of the fltting process
6 Analysis of Superconductors 61 (La-M)2Cu04 Superconductors
Bednorz and Miiller [16] found the first high- temperature oxide superconductor in the La-Ba- Cu-O system Soon after substituting Ba with Sr and Ca Kishio et al [17] found superconductivity in two similar compounds Later many compounds with much higher transition temperatures (Tc) were found The (La-M)2Cu04 system remains favorable for study because the cation content responsible for the superconductivity is easier to control and measure than the oxygen stoichiometry Also this system provides a wide range of substitutional cation solubility in which the tetragonal K2NiF4- type structure is maintained Compared with much- studied Y-Ba-Cu-O this structure is simpler because it contains only one copper-ion site and two oxygen-ion sites
The undoped compound La2Cu04 is orthorhom- bic at room temperature It becomes superconduct- ing either with cation substitution on La sites or increased oxygen content to more than four atoms per formula unit Doping with divalent cations in- creases the itinerant hole carriers in the oxygen- derived electron band [141] which probably causes the superconductivity However different dopants influence the transition temperature Tc Although the unit-cell c-parameter simply reflects ionic dopant size [142] the in-plane unit-cell parameter (and accordingly the Cu-0 bond length) correlates with Tc for different dopants and for different dop- ing amounts [142 143]
LaiB5MouCu04 (M = Ba Ca Sr) have a tetrago- nal K2NiF4-type structure space group lAlmmm with four atoms in the asymmetric unit [117] One site is occupied with La partially substituted with dopant ions (Fig 20) La2Cu04 is orthorhombic at room temperature The best way to correlate these two structures is to describe La2Cu04 in space group Bmab the c axis remains the same tetrago- nal [110] and [110] directions become [010] and [100] orthorhombic axes and size of the unit cell is doubled [144]
Figure 21 shows parts of the x-ray diffraction patterns observed and refined of Lai85Moi5Cu04 (M = Sr Ba Ca) and La2Cu04 Refined lattice
parameters are given in Table 8 Table 9 shows resuhs of the line-broadening analysis Relatively
La(BaCaSr)
0(2)
0(1)
Fig 20 Ciystal structure of (La-M)2Cu04 showing one unit cell
300 JUU
(b)
200
100
U 0 M J Js-r-^
30
-30
300
40 41 42 43 44 45 40 41 42 43 44 45 29 (deg) 29 (deg)
mdashA-
gt t 200
Z
F-
- 100
(c)
f V kgt ii I 40 41 42 43 44 45 40 41 42 43 44 45
e (deg) ^^ 26 (deg)
-30 wwX mdash Wlaquo-
Fig 21 Diffraction patterns of LaiH5Moi5Cu04 specimens (a) M=Sr (b) M = Ba (c)M = Ca (d) M = U
345
Volume 98 Number 3 May-June 1993
Journal of Research of the National Institute of Standards and Technology
Table 8 Lattice parameters and T^ at zero resistivity (Ac method at 10 Ma current)
Specimen a (A) bk) c(A) rc(K)
Lairaquo5Sroi5Cu04 377814(7)
Lairaquo3Baoi3Cu04 37846(2)
LaiiijCaoi5Cu04 37863(7)
La2Cu04 53558(2) 54053(2)
231(2) 36
288(4) 28
17(2) 19
1451(8)
Table 9 Results of line-broadening analysis for (La-M)2Cu4 specimens
Specimen hkl PcO PoO (DUk) (Iraquo)(A) lte^((D)2))
Lai(laquoSroj5Cu04 004 006
0046(4) 0083(5)
0024(8) ltio-
1700(300) 2000(200) 000049(9)
110 0110(5) ltio- 470(20) 940(20) 000044(6) 220 0171(9) ltio-
Lai85Baoi3Cu04 004 006
0049(6) 0110(7)
0076(6) 0089(9)
1100(200) 1100(100) 00011(2)
110 0087(4) 000042(6) 560(20) 1110(20) 000024(5) 220 0116(3) ltio-5
Laiji5Caoi5Cu04 004 006
0120(13) 0146(12)
0032(22) 0033(27)
440(70) 780(90) 00007(4)
110 0045(25) 0200(19) 340(30) 360(20) 00013(2) 220 0343(22) ltio-
La2Cu04 004 006
0061(8) 0124(7)
0045(9) ltio-
1100(100) 1200(100) 00008(1)
020 0074(10) 0078(10) 680(50) 760(50) 00007(2) 040 0210(30) 0026(81) 200 0074(8) 0061(10) 680(50) 810(50) 00003(3) 400 0130(10) 0023(95)
weak peak broadening was observed which can not be attributed to the proximity of the phase trans- formation Lai85SroisCu04 is tetragonal down to = 170 K [145] Lai85Baoi5Cu04 to 140 K [146147] and Lai85Caoi5Cu04 to 130 K [148] Another possi- ble reason for peak broadening might be continu- ous compositional variations in dopant content The scanning Auger microprobe analysis of La2-SrtCu04 compounds [149] showed that grain- boundary segregation of Sr is weak and limited to a narrow region near the grain surface In the case of the separation of two phases with different Sr con- tent and similar lattice parameters asymmetry of some reflections would be observed [150] More- over in the case of compositional inhomogeneity microstrains eL)) would be roughly independent of the averaging distance L in the grains [151] therefore distribution of strains would be Gaus- sian For all specimens microstrain behavior is identical it decreases linearly with distance L
Rothman and Cohen [115] showed that such be- havior of microstrains is caused by dislocations that might arise during grinding Assuming the same applied stress microstrain would be approximately inversely proportional to the elastic moduli of these materials If mean microstrain is defined as the arithmetic average of strains for the [001] and [110] directions results agree with values of the Youngs moduli for polycrystalline La2Cu04 Lai85Moi5Cu04 (M = Sr Ba Ca) [152] However other factors may contribute to the microstrain Coordination-6 ionic radii of La^+ Sr Ba^+ Ca^+ are 106 116 136 100 A respectively [153] Substitution of La with ions of different sizes affects the lattice parameter [142] and may cause much larger strains in the [001] direction when some of the ions are replaced with Ba^ than with Sr^ in accord with results in Table 9 Substitution of Ca^^ ions produces an entirely different effect microstrains in the [110] direction are larger This may be explained by
346
Volume 98 Number 3 May-June 1993
Journal of Research of the National Institute of Standards and Technology
comparing effects of substitutional ions on the unit-cell a -parameter The Ba-doped specimen has a larger a-parameter than the Sr-doped but the Ca-doped a-parameter is largest although Ca^^ has the smallest ionic size This should increase the cell distortion in the a-b plane
Table 9 reveals high anisotropy in these materi- als consistent with other physical properties such as thermal expansion [154] and upper critical mag- netic field [155] Differences of domain sizes might arise from a layered structure in the [001] direction and consequently easy incorporation of stacking faults between regularly stacked layers The stack- ing-fault and twin-fault probabilities can be esti- mated from the average surface-weighted domain sizes [59]
^ = TAN + cf1fun(aa) (75) m im - (D)
Here c is a constant for the particular [hkl] direction and fun(a a) a linear combination of stacking-fault probability and twin-fault probability a The exact form of Eq (75) was derived only for the cubic and hexagonal crystal structures On con- dition that the true domain dimension D is isotropic or so large that the second term of Eq (75) dominates a linear function of stacking-fault and twin-fault probability is
fun(aa) = c( 1
) (76) Zgt)J (Dgttrade
Here c denotes a constant that depends only on geometrical factors and is the same for all three doped compounds
Figure 22 shows a possible correlation between Tc and fault-defect probabilities computed from TEM observations of La2-jcSrCu04 revealed that stacking-fault density increased with Sr content up to jc = 015 [156] That study suggests that a shear mechanism forming the fault-boundary dislocations implies oxygen vacancies andor cation deficiency We did not measure oxygen content but neutron- diffraction studies showed that oxygen deficiency starts to appear at much higher Sr content [157] However the increase of fault probability with the simultaneous decrease of microstrain in Fig 22 supports the assumption that defects are intro- duced to accommodate lattice strains [156] A simi- lar increase in Te was found in Y2Ba4Cu802o-laquo thin films [158] Compounds with asymmetric broad- ened and shifted peaks showed higher Tc which
was attributed to stacking faults Although extrinsic stacking faults may cause asymmetric peak broad- ening [140] it is probably caused by twinning Twinning in La-M-Cu-0 materials is less abundant than in Y-Ba-Cu-O compounds but it was ob- served in (La-Sr)2Cu04 monocrystals on (110) planes [159] In the profile-fitting procedure peak asymmetry is incorporated only in the instrumental function therefore we could not model asymmetric peak broadening However any significant asym- metry of the specimen profile would cause an un- even fit of low-angle and high-angle sides of peaks which was not observed This gives much more im- portance to stacking faults in Eq (76)
Fig 22 Arithmetic average of [110] and [001] root-mean- square strains and linear function of stacking-fault and twin- fault probabilities as a function of Tc
In Fig 22 average microstrains defined as the arithmetic average of [001] and [110] directions correlate inversely with Tc However we did not find a correlation of Tc and microstrains in a partic- ular direction [001] microstrains simply reflect dif- ference in size of dopant and host La^ ions (see Table 9)
In La2Cu04 (OkO) reflections are significantly broader than (hOO) This has also been observed in low-temperature orthorhombic Lai85Sroi5Cu04 and Lai85Baoi5Cu04 [160] and explained by either stacking faults or possible lower symmetry Our results reveal that domain sizes (D) have identical values for [010] and [100] directions (Table 9) From Eq (76) it follows that stacking-fault proba- bilities in these directions have the same values However microstrains in the [010] direction are roughly twice as large as in the [100] direction which is responsible for the different broadening In the case of doped La2Cu04 compounds different microstrains might be caused by oxygen
347
Volume 98 Number 3 May-June 1993
Journal of Research of the National Institute of Standards and Technology
vacancies ordered along one direction in the a-b plane similar to effects found in YBa2Cu307-laquo However undoped La2Cu04 is not expected to have significant o^Qgen deficiency Other possibili- ties are lower ciystallographic symmetry andor La vacancies although they were not reported for this system but La deficiency was found in an La2Co04 compound [161]
We can conclude that lattice strains and incoher- ently diffracting domain sizes confirm high an- isotropy in these materials This simple approach however does not allow unambiguous identifica- tion of the strains origin Probably the strains originate from dislocations and from different sizes of host and dopant ions Domain sizes of all com- pounds are larger in the c-direction than in the a-6 plane This indicates existence of stacking faults and twins However because estimated errors are relatively large and only three materials were stud- ied the possible connection between stacking faults and 7c needs further study
62 Bi-Cu-O Superconductors
Among the high-Tc superconductors the Bi- Cu-O compounds appear intriguing especially because their incommensurate structure modula- tion remains incompletely understood [162 163] The crystal structure consists of perovskite-like SrO-(Cu02Ca)mi-Cu02-SrO layers separated by NaCl-like BiO double layers (see Fig 23 [164]) The number m of Cu02 layers alters the supercon- ducting transition temperature Tc (for m = 12 and 3 rclaquo10 90 and 110 K respectively) This two- dimensional layered structure makes these materi- als highly anisotropic and favours the creation of defects
Bulk sintered specimens showed relatively weak peak broadening Moreover the diffraction pat- terns contained many overlapping peaks because the compound crystallizes in an orthorhombic low- symmetry space group A2aa [165] and incommen- surate modulation gives superlattice reflections All patterns revealed a strong [001] texture (Fig 24) making reflections other than (001) difficult to ana- lyze The lattice parameters vary depending on the exact compound stoichiometry and processing his- tory but characteristically they have almost identi- cal a and b parameters and large c parameter fl =54095 A 6=54202 A c =309297 A for Bi2Sr2CaCu208 (Bi-2212 [166] and A =5392 A b =5395 A c =36985 A for (BiPb)2Sr2Ca2Cu30io (BiPb-2223) [165] Thus we treated (hOO) and (0^0) reflections as single peaks Table 10 gives the
results for three specimens Bi-2212 (BiPb)2 (SrMg)2(BaCa)2Cu30io (BiPbMgBa-2223) which were one-phase specimens and BiPb-2223 con- taining approximately equal amounts of 2212 and 2223 phases The in-plane lattice parameters of 2212 and 2223 phases differ little hence only the [00] directions of the mixed-phase specimen were evaluated
b^ (c)
Fig 23 Average crystal structure of Bi2Sr2Cam-iCum04+2m for (a) m = 1 (b) w =2 (c) m =3 [164]
35
-35
42 44 46 48 50 52 54 56 58 60 62 26 (deg)
^ ^^^MK^Aa^Ndllaquop
Fig 24 Part of BiPbMgBa-2223 refined pattern There are 48 fundamental reflections in this region
Interpretation of the results in the case of these complicated compounds must be considered care- fully Microstrains are probably caused by disloca- tion arrays However substitution of different-sized ions and vacancies would also contribute to the strains as would other kinds of disorder especially
348
Volume 98 Number 3 May-June 1993
Journal of Research of the National Institute of Standards and Technology
Table 10 Results of line-btoadening analysis for Bi-Cu-O supreconductors
Specimen Phase hkl (A)
eD)sa)y^
Bi-2212 2212 008 0012
0163(8) 022(3)
001(6) 005(6)
420(80) 00021(6)
020+200 0104(4) ltio-^ 580(30) 00007(1) 040+400 018(2) 00004(6300)
BiPbMgBa-2223 7773 0010 0020
0097(1) 021(2)
00002(1700) 0007(150)
770(60) 00012(1)
020 + 200 012(27) 013(10) 380(430) 00009(71) 040 + 400 015(95) 021(33)
BiPb-73 2212 008 0012
023(2) 025(5)
0002(350) 0001(1000)
220(30) 00013(26)
2223 0010 0020
022(8) 023(99)
0092(67) 018(47)
230(190) 00012(197)
Stacking faults and twins Table 10 shows larger strains in the [001] direction that in the basal plane This can be explained by stacking disorder along the c-axis which was frequently observed in electron-diffraction patterns as streaking [167 168] Easy incorporation of stacking faults is possi- ble because of the two-dimensional weak-bonded layers (BiO double layers are spaced about 3 A apart) The difference in microstrain between in- plane and the c-direction is much smaller for the BiPbMgBa-2223 phase probably because Pb low- ers the faulting by stabilizing the higher-Tc 2223 phase [167] For the BiPb-2223 specimen with two phases there are two possibilities Either the speci- men consists mainly of a mk of two kinds of one- phase grains or both phases occur within the same grains The second possibility was confirmed exper- imentally [169 170] and our results concur be- cause microstrain in the 2212 phase is much smaller than in the one-phase Bi-2212 specimen Processing conditions and cation content probably favour development of the macroscopic inter- growth of both phases within the grains that is microscopic defects grow to sufficiently large re- gions to give a diffraction pattern of another phase with the different number of Cu02 layers As a re- sult strain is relieved and both strains and domain sizes being quite different in one-phase specimens tend to equalize
For the Bi-Cu-O specimens the mean surface- weighted domain sizes are generally smaller than for (La-M)2Cu04 compounds Therefore the com- putation of the stacking- and twin-fault probabili- ties by using Eq (75) may be wrong It would be very instructive to compare the different broaden-
ing of satellite and fundamental reflections which indicates a more pronounced stacking disorder in the modulated structure [171]
In summary we found that for both Bi-2212 and BiPbMgBa-2223 superconductors the c-axis strain exceeds the in-plane strain The BiPb-2223 specimen containing both 2212 and 2223 phases within the single grains shows smaller incoherently diffracting domains and lower c-axis strain than the one-phase specimens This fact may direct us to- ward the mechanism of the second-phase forma- tion in these materials
63 Remarks
It was shown that this particular method of the line-broadening analysis can give information about the size of incoherently diffracting domains and lattice strains in (La-M)2Cu04 and Bi-Clu-O superconductors Moreover results show high an- isotropy of both size and strain parameters as one may expect because of the layered structure of all superconducting cuprates Generally structural line broadening is not large that is a result of rela- tively large domain sizes (200-2000 A) and small strains (002-02) It is interesting to compare these values with the published results for YBa2Cu307-laquo (isotropic strains of 023 [77] and 005-03 [82]) Although the different materi- als were studied they seem too large especially be- cause they are the average of strains in different directions
The main drawback of the line-broadening the- ory is the uncertainty about the origins of the line broadening that is it is difficult to distinguish the main effects responsible for the broadening For
349
Volume 98 Number 3 May-June 1993
Journal of Research of the National Institute of Standards and Technology
the novel superconductors particularly the numer- ous defects (substitutions vacancies stacking faults dislocations and similar) can occur simulta- neously which makes it very difficult to determine their individual contributions Furthermore the crystal structures of most novel superconductors are relatively complicated The average structure has mostly a slightly distorted tetragonal symmetry very similar a and b lattice parameters and a large c parameter but c=36 for YBa2Cu307-laquo for in- stance This results in a large number of overlap- ping peaks and consequently in large errors of all results This showed especially in the case of Bi-Cu-O superconductors (see Table 10) Follow- ing the discussion of reliability of profile fitting in Sec 54 it would be desirable to include more than two reflections in the analysis of broadening but higher-order peaks are usually too weak and over- lapped One way to partially solve this problem would be a whole pattern fitting [172 173] and Rietveld structure refinement [23] in terms of size and strain parameters This requires an accurate preset function to model specimen broadening and precise definition of angular dependence of size and strain parameters The Rietveld programs that model the line broadening in terms of size and strain parameters are based either on the simpli- fied integral-breadth methods [78 95] or on the single-line method [174]
7 Conclusions
A method for analyzing the pure-specimen (structural) broadening of x-ray diffraction line profiles is proposed By modeling the specimen size and strain broadenings with the simple Voigt func- tion it is possible to obtain domain sizes and strains that agree with experiment and show a logi- cal interrelationship Furthermore some common consequences and problems in the Fourier-method analysis follow easily The specimen function is convoluted with the instrumental function to match the observed x-ray diffraction-line profile This avoids the Stokes deconvolution method thus al- lowing analysis of patterns with highly overlapping peaks and weak structural broadening Therefore the method was applied to some novel high-Tc superconductors We reached the following conclu- sions
(i) Surface-weighted domain size depends only on the Cauchy integral breadth of the size-broad- ened profile
(ii) The hook effect occurs when the Cauchy-content of the size-broadened profile is un-
derestimated that is for ^sc(n2)^3sG Usually this happens when the background is estimated too high so the long tails of the Cauchy function are prematurely cut off
(iii) It also follows from conclusion (ii) that the volume-weighted domain size can not be more than twice the surface-weighted domain size (limiting value D)v=2D)i is obtained for the pure-Cauchy size-broadened profile) Minimum value for D)J (D)j should not be less than -131
(iv) If the distortion coefficient is approxi- mated with a harmonic term this leads exactly to the Warren-Averbach method of separation of size and strain broadenings
(v) In that case mean-square strains decrease linearly with the distance L
(vi) It is possible to evaluate local strain ((e^(0))^) only in the case of pure-Gauss strain broadening Then root-mean-square strain is inde- pendent of the distance L and related to the upper limit of strain obtained from the integral breadth of the strain-broadened profile
(vii) If strain broadening is not described exclu- sively with the Gauss function the multiple-line Voigt integral breadth and Warren-Averbach analyses can not give the same results for volume- weighted domain size although D)v is defined identically in both approaches because the appar- ent strain -q = pdeg(29)cot9 is not angular- independent
(viii) Smooth size coefficients give column- length distribution functions without oscillations and make possible a computation of volume- weighted average domain sizes up to ~5000 A
(ix) Comparison with the simplified integral- breadth methods in most cases has shown not large but systematic discrepancy of results indicat- ing that size and strain broadening can not be accu- rately modeled by a single Cauchy or Gauss function Moreover the application of the single- line method is much less reliable and it should not be used where multiple reflections are available
(x) The knowledge of all phases present in the sample and their crystallographic structure is re- quired to successfully fit a cluster of overlapping peaks Although it is very difficult to accurately de- termine the Cauchy-Gauss ratio of an overlapped peak final results of domain size and strain are much less affected Therefore connecting the crys- tallite size exclusively with the Cauchy content and strain with the Gauss content of a specimen profile might be doubtful
(xi) Evaluated errors of domain sizes and strains increase substantially with the degree of
350
Volume 98 Number 3 May-June 1993
Journal of Research of the National Institute of Standards and Technology
peak overlapping Hence for complicated patterns very accurate measurements are necessary and one needs to analyze as many reflections in the same crystallographic direction as possible
(xii) Line-broadening analysis of (La-M)2Cu04 and Bi-Cu-O compounds confirms high anisotropy in these materials
(xiii) Strains in (La-M)2Cu04 probably origi- nate from dislocations and from different sizes of host and dopant ions
(xiv) Stacking-fault probability in (La-M)2Cu04 (M = Ba Ca Sr) increases with increasing Tc whereas the average strain decreases
(xv) In La2Cu04 different broadening of (lOO) and (OfcO) reflections is not caused by stacking faults
(xvi) All Bi-Cu-0 superconductors show larger strain in the c-direction than in the a-b plane which can be explained by stacking disorder along the [001] direction
(xvii) In the specimen with approximately equal amounts of Tl-2212 and TlPb-2223 phases it is likely that a secondary phase develops by the growth of the microscopic faulted regions of the primary phase
Acknowledgments
I am thankful to Dr Harry McHenry for his support and especially to Dr Hassel Ledbetter for his wise guidance and most useful help during my stay at NIST I am also indebted to my home insti- tution the Faculty of Metallurgy of the University of Zagreb for allowing me the leave of absence at NIST
8 References
[1] W Friedrich P Knipping and M v Laue Ann Physik 41 971 (1912)
[2] H M Rietveld Acta Cryst 22 151 (1967) [3] H M Rietveld J Appl Cryst 2 65 (1969) [4] S A Howard and K D Preston in Modern Powder Dif-
fraction Vol 20 The Mineralogical Society of America Washington DC (1989) p 217
[5] D Taupin J Appl Cryst 6 266 (1973) [6] T C Huang and W Parrish Appl Phys Lett 27 123
(1975) [7] M K Wu J R Ashburn C J Torng P H Hor R L
Meng L Gao Z J Hwang Y Q Wang and C W Chu Phys Rev Lett 58 908 (1987)
[8] D Shi MRS Bull 16 37 (1991) [9] D Larbalestier Phys Today 44 74 (1991)
[10] J C Phillips Phys Rev B 4512647 (1992) [11] B Raveau Phys Today 45 53 (1992) [12] A J Millis and K M Rabe Phys Rev B 38 8908 (1988)
[13] F Guinea Europhys Lett 7 549 (1988) [14] C P Dhard and P Singh in Proc Int Symp High-Temp
Supercond Jaipur India Oxford amp IBH Publishing New Delhi (1988) p 271
[15] J D Jorgensen Phys Today 44 34 (1991) [16] J G Bednorz and K A Muller Z Phys B 64 189
(1986) [17] K Kishio K Kitazawa S Kaube I Yasuda N Sugii H
Takagi S Uchida K Fueki and S Tanaka Chem Lett 429 (1987)
[18] J D Jorgensen B Dabrowski S Pei D G Hinks L Soderholm B Morosin J E Venturini and D S Ginley Phys Rev B 38 11337 (1988)
[19] J R Clem Phys Rev B 43 7837 (1991) [20] M Paranthaman M Foldejiki D Balzar H Ledbetter
A J Nelson and A M Hermann submitted to Phys Rev B
[21] A R Stokes Proc Phys Soc Lond 61 382 (1948) [22] B E Warren and B L Averbach J Appl Phys 23 497
(1952) [23] R Delhez Th H de Keijser and E J Mittemeijer in
Accuracy in Powder Diffraction S Block and C R Hub- bard eds Natl Bur Stand (US) Special Publication 567 (1980) p 213
[24] H P Klug and L E Alexander X-ray Diffraction Proce- dures 2nd Edition John Wiley New York (1974) p 661
[25] J I Langford J Appl Ciyst 11 10 (1978) [26] J I Langford in Accuracy in Powder Diffraction S
Block and C R Hubbard eds Natl Bur Stand (US) Special Pubication 567 (1950) p 255
[27] R Delhez Th H de Keijser and E J Mittemeijer Fre- senius Z Anal Chem 312 1 (1982)
[28] A J C Wilson Proc Phys Soc Lond 80 286 (1962) [29] A J C Wilson Proc Phys Soc Lond 81 41 (1963) [30] L P Smith Phys Rev 46 343 (1934) [31] H C Burger and P H van Cittert Z Phys 79 722
(1932) [32] S Ergun J Appl Ciyst 1 19 (1968) [33] R Croche and L Gatineau J Appl Ciyst 10479 (1977) [34] L H Schwarz and J B Cohen Diffraction from Materi-
als Academic Press New York (1977) p 391 [35] R Delhez Th H de Keijser E J Mittemeijer and J I
Langford J Appl Cryst 19 459 (1986) [36] R Delhez Th H de Keijser E J Mittemeijer and J I
Langford Aust J Phys 41 213 (1988) [37] R A Young and D B Wiles J Appl Cryst 15 430
(1982) [38] W Voigt Stizungsber K Bayer Akad Wiss 42 603
(1912) [39] E E Whiting J Quant Spectrosc Radiat Transfer 8
1379 (1968) [40] G K Wertheim M A Butler K W West and D N E
Buchanan Rev Sci Instrum 111369 (1974) [41] M M Hall Jr V G Veeraraghavan H Rubin and P G
Winchell J Appl Cryst 10 66 (1977) [42] A Brown and J W Edmonds Adv X-Ray Anal 23 361
(1980) [43] P Suortti M Ahtee L Unonius J Appl Cryst 12 365
(1979) [44] T Sundius J Raman Spectrosc 1 471 (1973) [45] B H Armstrong J Quant Spectrosc Radiat Transfer 7
61 (1967) [46] J F Kielkopf J Opt Soc Am 63 987 (1973) [47] B P Asthana and W Kiefer Appl Spectr 36 250
(1982)
351
Volume 98 Number 3 May-June 1993
Journal of Research of the National Institute of Standards and Technology
[48] J P M de Vreede S C Mehrotra A Tal and H A Dijkerraan Appl Spectr 36 227 (1982)
[49] F R L Schoening Ada Ciyst 18 975 (1965) [50] P Scherrer Gott Nachr 2 98 (1918) [51] A R Stokes and A J C Wilson Proc Cambridge
Philos Soc 38 313 (1942) [52] A J C Wilson X-Ray Optics 2nd edition Methuen
London (1962) [53] S Leie and T R Anantharaman Proc Indian Acad
Sci Sect A H 261 (1966) [54] D Louer D Weigel and J I Langford J Appl Ciyst
5 353 (1972) [55] A J C Wilson J Appl Ciyst 2 181 (1969) [56] J I Langford and A J C Wilson J Appl Ciyst 11102
(1978) [57] A R Stokes and A J C Wilson Proc Phys Soc Lond
56174 (1944) [58] B E Warren and B L Averbach J Appl Phys 21 595
(1950) [59] B E Warren X-Ray Diffraction Addison-Wesley
Reading Massachusetts (1969) p 264 [60] B E Warren in Progress in Metal Physics Vol 8 Perg-
amon Press London (1959) p 146 [61] F Bertaut C R Acad Sci Paris 228 187 (1949) [62] N C Haider and C N J Wagner Acta Cryst 20 312
(1966) [63] D Balzar and H Ledbetter in Proceedings of the Accu-
racy in Powder Diffraction II Natl Inst Stand Technol (1992) p 37
[64] D Balzar and H Ledbeter J Appl Cryst 26 (1993) in press
[65] J N Eastabrook and A J C Wilson Proc Phys Soc Lond B 65 67 (1952)
[66] R S Smith IBM J Res Develop 4 205 (1960) [67] B Y Pines and A F Sirenko Soviet Physics Ciyst 715
(1962) [68] G B Mitra and N K Misra Acta Ciyst 22 454 (1967) [69] A Gangulee J Appl Ciyst 7 434 (1974) [70] J Mignot D Rondot Acta Met 231321 (1975) [71] J Mignot and D Rondot Acta Ciyst A 33 327 (1977) [72] R K Nandi H K Kuo W Schlosberg G Wissler J B
Cohen and B Crist Jr J Appl Ciyst 17 22 (1984) [73] M Zocchi Acta Ciyst A 36164 (1980) [74] P Ramarao and T R Anantharaman Trans Ind Ins
Metals 18 181 (1965) [75] R K Nandi and S P Sen Gupta J App Cryst 11 6
(1978) [76] Th H de Keijser J I Langford E J Mittemeijer and
B P Vogels J Appl Ciyst IS 308 (1982) [77] A Williams G H Kwei R B Von Dreele A C Lar-
son L D Raistrick and D L Bish Phys Rev B 37 7960 (1988)
[78] A C Larson and R B Von Dreele Los Alamos Na- tional Laboratory Report No LA-UR-86-748 (1988)
[79] J D Jorgensen D H Johnson M H Mueller J G Worlton and R B Von Dreele in Proceedings of the Conference on Diffraction Profile Analysis Cracow Poland (1978) p 20
[80] R B Von Dreele J D Jorgensen and C G Windsor J Appl Ciyst 15 581 (1982)
[81] P Thompson D E Cox and J B Hastings J Appl Ciyst 20 79 (1987)
[82] J P Singh R A Guttschow D S Kupperman J T Dusek and R B Poeppel in High Temperature Super-
conducting Compounds III S Whang A Gupta and E Ceilings eds TMS AIME Warrendale (1991) p 281
[83] M O Eatough D S Glnley and B Morosin Adv X- Ray Anal 33 145 (1990)
[84] E J Peterson P J Kung R E Muenchausen and D M Smith in Proceedings of the 41st Annual Denver Conference on Applications of X-Ray Analysis Colo- rado Springs Colorado (1992) p 74
[85] M Rand J I Langford and J S Abell submitted to J Cryogenics (1992)
[86] D Balzar J Appl Ciyst 25 559 (1992) [87] D Balzar H Ledbetter and A Roshko Physica C 185-
189 871 (1991) [88] D Balzar and H Ledbetter J Mater Sci Lett 111419
(1992) [89] D Balzar H Ledbetter and A Roshko Pow Diffr 8
(1993) in press [90] S Johnson M Gusraan D Rowcliffe T Geballe and J
Sun Adv Ceram Mater 2 337 (1987) [91] H Ledbetter S A Kim R B Goldfarb and K Togano
Phys Rev B 39 9689 (1989) [92] H Friedman Electronics 132 (1945) [93] W Parrish (ed) in Advances in X-Ray Diffractometry
and X-Ray Spectrography Centrex Publishing Company Eindhoven The Netheriands (1962)
[94] W Soller Phys Rev 24158 (1924) [95] S A Howard R L Snyder J Appl Ciyst 22 238
(1989) [96] G H Stout and L H Jensen X-Ray Structure Determi-
nation 2nd edition Wiley New York (1989) p 373 [97] D E Appleman and T Evans Jr Final Report 92-14
US Geological Survey Washington DC (1973) Avail- able as NTIS Document No PB-216188
[98] M U Cohen Rev Sci Instrum 6 68 (1935) [99] M U Cohen Rev Sci Instrum 7 155 (1936) [100] M H Mueller L Heaton and K T Miller Acta Ciyst
13 828 (1960) [101] R A Young P E Mackie and R B Von Dreele J
Appl Ciyst 10 262 (1977) [102] D B Wiles and R A Young J Appl Cryst 14 149
(1981) [103] J K Yau and S A Howard J Appl Ciyst 22 244
(1989) [104] S A Howard J K Yau and H U Anderson J Appl
Phys 65 1492 (1989) [105] S Enzo G Fagherazzi A Benedetti and S Poilizzi J
Appl Ciyst 21 536 (1988) [106] A Benedetti G Fagherazzi S Enzo and M
Battagliarin J Appl Cryst 21 543 (1988) [107] Th H de Keijser E J Mittemeijer and H C F Rozen-
daal J Appl Ciyst 16 309 (1983) [108] Y Zhang J M Stewart C R Hubbard and B Mo-
rosin Adv X-Ray Anal 33 373 (1990) [109] Y Wang S Lee and Y Ue J Appl Ciyst IS 35
(1982) [110] V N Selivanov and E F Smislov Zavod Lab 57 28
(1991) [Ill] A Guinier X-Ray Diffraction W H Freeman San
Francisco (1963) p 139 [112] M Wilkens J Appl Cryst 12119 (1979) [113] D Du and Y Wang Pow Diffr 2180 (1987) [114] A P Prudnikov Yu A Brychkov and O L Marichev
Integrals and Series Vol 1 Gordon and Breach Am- sterdam The Netheriands (1986) p 344
352
Volume 98 Number 3 May-June 1993
Journal of Research of the National Institute of Standards and Technology
[115] R L Rothman and J B Cohen J Appl Phys 42 971 (1971)
[116] T Adier and C R Houska J Appl Phys 50 3282 (1979)
[117] C R Houska and T M Smith J Appl Phys 52 748 (1981)
[118] S Rao and C R Houska Acta Ciyst A 4214 (1986) [119] J I Langford R Delhez Th H de Keijser and E J
Mittemeijer Ausi J Phys 41173 (1988) [120] J I Langfoid J Appl Cryst IS 315 (1982) [121] M J Turunen Th H de Keijser R Delhez and N M
van der Pers J Appl Ciyst 16176 (1983) [122] A J C Wilson Acta Ciyst 23 888 (1967) [123] A J C Wilson Acta Ciyst A 24 478 (1968) [124] A J C Wilson Acta Ciyst A 25 584 (1969) [125] G Gagliotti A Paoletti and F P Ricci Nucl Instrum
3 223 (1958) [126] J I Langford R J Cernik and D Louer J Appl
Ciyst 24 913 (1991) [127] J I Langford in Accuracy in Powder Diffraction II
preprint [128] A J C Wilson Mathematical Theory of X-Ray Powder
Diffractometiy Centrex Eindhoven The Netherlands (1963)
[129] J L Langford Prog Ciyst Growth and Charact 14185 (1987)
[130] T G Fawcett C E Crowder S J Brownell Y Zhang C R Hubbard W Schreiner G P Hamill T C Huang E Sabino J I Langford R Hamilton and D Louer Pow Diffr 3 209 (1988)
[131] W L Smith J Appl Ciyst 9187 (1976) [132] J L Langford and D Louer J Appl Ciyst 15 20
(1982) [133] Fl Popescu and L Benes Acta Ciyst A 33 323 (1977) [134] P PSuse^cu R MSnaila M Popescu and E Jijovici j
Appl Cryst 7 281 (1974) [135] P F Bley Y Calvayrac and M Fayard J Appl Ciyst
7 493 (1974) [136] B Moraweck Ph de Montgolfier and A J Renouprez
J Appl Ciyst 10191 (1977) [137] A Le Bail and D Louer J Appl Cryst 11 50 (1978) [138] D R Buchanan R L McCuUough and R L Miller
Acta Ciyst 20 922 (1966) [139] P Suortti and L D Jennings Acta Cryst A 33 1012
(1977) [140] J B Cohen and C N J Wagner J Appl Phys 33 2073
(1962) [141] A Bianconi J Budnick A M Flank A Fontaine P
Lagarde A Marcelli H Tolentino B Chamberland C Michel B Raveau and G Demazeau Phys Lett A127 285 (1988)
[142] K Fueki K Kitazawa K Kishio T Hasegawa S Uchida H Takagi and S Tanaka in Chemistiy of High- Temperature Superconductors D L Nelson M S Whittingham and T F George eds American Chemi- cal Society (1987) p 38
[143] T Fujita Y Aoki Y Maeno J Sakurai H Fukuba and H Fujii J Appl Phys 26 U68 (1987)
[144] R M Hazen in Physical Properties of High-rc Super- conductors Vol 2 D M Ginsberg ed World Scien- tific Singapore (1990) p 121
[145] J B Torrance A Bezinge A I Nazzal T C Huang S P Parkin D T Keane S J LaPlaca P M Horn and G A Held Phys Rev B 40 8872 (1989)
[146] J D Axe A H Moudden D Hohlwein D E Cox K
M Mohanty A R Moodenbaugh and Y Xu Phys Rev Lett 62 2751 (1989)
[147] T Suzuki and T Fujita Physica C 159 111 (1989) [148] T Fujita and Y Maeno in Superconducting Materials
JJAP Series 1 (1988) p 34 [149] A Roshko and Y-M Chiang J Appl Phys 66 3710
(1989) [150] D E Cox S C Moss R L Meng P H Hor and C W
Chu J Mater Res 31327 (1988) [151] B Crist and J B Cohen J Polym Sci 17 1001 (1979) [152] H Ledbetter S Kim and A Roshko Z Phys B 89275
(1992) [153] R D Shannon and C T Prewitt Acta Ciyst B 25 925
(1969) [154] M Lang H Spille F Steglich Y Hidaka T Murakami
and Y Endoh Physica C 162-1641037 (1989) [155] Y Hidaka and T Murakami Phase trans 15 241
(1989) [156] P L Gai and E M McCarron Science 247 553 (1990) [157] T Kamiyama I Izumi H Asano H Takagi S Uchida
Y Tokura E Takayama-Muromachi M Matsuda K Yamada Y Endoh and Y Hidaka Physica C 172 120 (1990)
[158] A Kapitulnik Physica C 153-155 520 (1988) [159] L A Muradyan V N Molchanov R A Tamazyan and
V I Simonov Physica C 162-164 536 (1989) [160] P Day M Rosseinsky K Prassides W I F David O
Moze and A Soper J Phys C 20 L429 (1987) [161] J T Lewandowski R A Beyerlein J M Longo and R
A McCauley J Amer Ceram Soc 69 699 (1986) [162] R Ramesh G van Tendeloo G Thomas S M Green
Y Mei C Jiang and H L Luo Appl Phys Lett 53 2220 (1988)
[163] J Schneck L Pierre J C Tolddano and C Daguet Phys Rev B 39 9624 (1989)
[164] O Eibl Physica C 168 215 (1990) [165] W Carrilo-Cabrera and W Gopel Physica C 161 373
(1989) [166] P Bordet J J Capponi C Chaillout J Chenavas A
W Hewat E A Hewat J L Hodeau M Marezio J L Tholence and D Tranqui Physica C 156189 (1988)
[167] R Ramesh K Remschnig J M Tarascon and S M Green J Mater Res 6 278 (1991)
[168] Z Hiroi Y Ikeda M Takano and Y Bando J Mater Res 6 435 (1991)
[169] Y Inoue M Hasegawa Y Shichi I Munakata M Ya- manaka S Hiyama and O Nittono J Mater Res 5 737 (1990)
[170] R Ramesh B G Bagley J M Tarascon S M Green M L Rudee and H L Luo J Appl Phys 67 379 (1990)
[171] X B Kan J Kulik P C Chow S C Moss Y F Yan J H Wang and Z X Zhao J Mater Res 5 731 (1990)
[172] G S Pawley J Appl Ciyst 13 630 (1980) [173] H Toraya J Appl Ciyst 19 440 (1986) [174] L Lutterotti and P Scardi J Appl Ciyst 23 246
(1990)
About the author Davor Balzar is with Faculty of Metallurgy of the University of Zagreb Sisak Croatia and was a Guest Researcher at fflST The National Institute of Standards and Technology is an agency of the Technology Administration US Department of Commerce
353
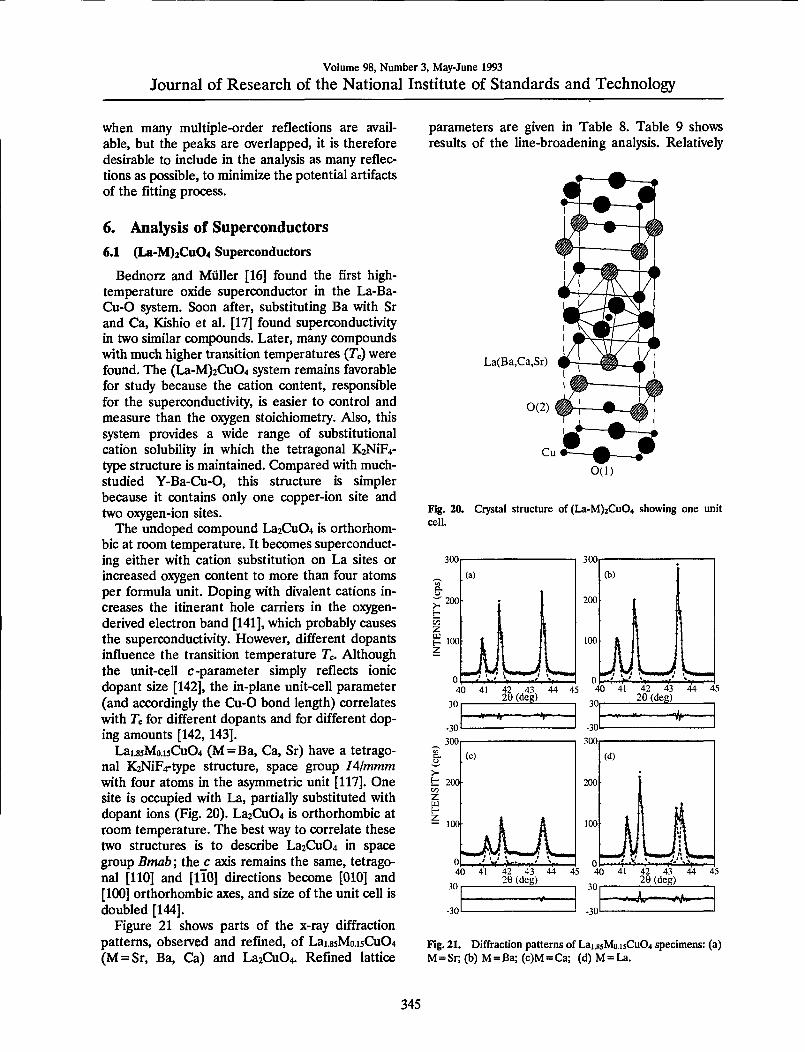
Volume 98 Number 3 May-June 1993
Journal of Research of the National Institute of Standards and Technology
when many multiple-order reflections are avail- able but the peaks are overlapped it is therefore desirable to include in the analysis as many reflec- tions as possible to minimize the potential artifacts of the fltting process
6 Analysis of Superconductors 61 (La-M)2Cu04 Superconductors
Bednorz and Miiller [16] found the first high- temperature oxide superconductor in the La-Ba- Cu-O system Soon after substituting Ba with Sr and Ca Kishio et al [17] found superconductivity in two similar compounds Later many compounds with much higher transition temperatures (Tc) were found The (La-M)2Cu04 system remains favorable for study because the cation content responsible for the superconductivity is easier to control and measure than the oxygen stoichiometry Also this system provides a wide range of substitutional cation solubility in which the tetragonal K2NiF4- type structure is maintained Compared with much- studied Y-Ba-Cu-O this structure is simpler because it contains only one copper-ion site and two oxygen-ion sites
The undoped compound La2Cu04 is orthorhom- bic at room temperature It becomes superconduct- ing either with cation substitution on La sites or increased oxygen content to more than four atoms per formula unit Doping with divalent cations in- creases the itinerant hole carriers in the oxygen- derived electron band [141] which probably causes the superconductivity However different dopants influence the transition temperature Tc Although the unit-cell c-parameter simply reflects ionic dopant size [142] the in-plane unit-cell parameter (and accordingly the Cu-0 bond length) correlates with Tc for different dopants and for different dop- ing amounts [142 143]
LaiB5MouCu04 (M = Ba Ca Sr) have a tetrago- nal K2NiF4-type structure space group lAlmmm with four atoms in the asymmetric unit [117] One site is occupied with La partially substituted with dopant ions (Fig 20) La2Cu04 is orthorhombic at room temperature The best way to correlate these two structures is to describe La2Cu04 in space group Bmab the c axis remains the same tetrago- nal [110] and [110] directions become [010] and [100] orthorhombic axes and size of the unit cell is doubled [144]
Figure 21 shows parts of the x-ray diffraction patterns observed and refined of Lai85Moi5Cu04 (M = Sr Ba Ca) and La2Cu04 Refined lattice
parameters are given in Table 8 Table 9 shows resuhs of the line-broadening analysis Relatively
La(BaCaSr)
0(2)
0(1)
Fig 20 Ciystal structure of (La-M)2Cu04 showing one unit cell
300 JUU
(b)
200
100
U 0 M J Js-r-^
30
-30
300
40 41 42 43 44 45 40 41 42 43 44 45 29 (deg) 29 (deg)
mdashA-
gt t 200
Z
F-
- 100
(c)
f V kgt ii I 40 41 42 43 44 45 40 41 42 43 44 45
e (deg) ^^ 26 (deg)
-30 wwX mdash Wlaquo-
Fig 21 Diffraction patterns of LaiH5Moi5Cu04 specimens (a) M=Sr (b) M = Ba (c)M = Ca (d) M = U
345
Volume 98 Number 3 May-June 1993
Journal of Research of the National Institute of Standards and Technology
Table 8 Lattice parameters and T^ at zero resistivity (Ac method at 10 Ma current)
Specimen a (A) bk) c(A) rc(K)
Lairaquo5Sroi5Cu04 377814(7)
Lairaquo3Baoi3Cu04 37846(2)
LaiiijCaoi5Cu04 37863(7)
La2Cu04 53558(2) 54053(2)
231(2) 36
288(4) 28
17(2) 19
1451(8)
Table 9 Results of line-broadening analysis for (La-M)2Cu4 specimens
Specimen hkl PcO PoO (DUk) (Iraquo)(A) lte^((D)2))
Lai(laquoSroj5Cu04 004 006
0046(4) 0083(5)
0024(8) ltio-
1700(300) 2000(200) 000049(9)
110 0110(5) ltio- 470(20) 940(20) 000044(6) 220 0171(9) ltio-
Lai85Baoi3Cu04 004 006
0049(6) 0110(7)
0076(6) 0089(9)
1100(200) 1100(100) 00011(2)
110 0087(4) 000042(6) 560(20) 1110(20) 000024(5) 220 0116(3) ltio-5
Laiji5Caoi5Cu04 004 006
0120(13) 0146(12)
0032(22) 0033(27)
440(70) 780(90) 00007(4)
110 0045(25) 0200(19) 340(30) 360(20) 00013(2) 220 0343(22) ltio-
La2Cu04 004 006
0061(8) 0124(7)
0045(9) ltio-
1100(100) 1200(100) 00008(1)
020 0074(10) 0078(10) 680(50) 760(50) 00007(2) 040 0210(30) 0026(81) 200 0074(8) 0061(10) 680(50) 810(50) 00003(3) 400 0130(10) 0023(95)
weak peak broadening was observed which can not be attributed to the proximity of the phase trans- formation Lai85SroisCu04 is tetragonal down to = 170 K [145] Lai85Baoi5Cu04 to 140 K [146147] and Lai85Caoi5Cu04 to 130 K [148] Another possi- ble reason for peak broadening might be continu- ous compositional variations in dopant content The scanning Auger microprobe analysis of La2-SrtCu04 compounds [149] showed that grain- boundary segregation of Sr is weak and limited to a narrow region near the grain surface In the case of the separation of two phases with different Sr con- tent and similar lattice parameters asymmetry of some reflections would be observed [150] More- over in the case of compositional inhomogeneity microstrains eL)) would be roughly independent of the averaging distance L in the grains [151] therefore distribution of strains would be Gaus- sian For all specimens microstrain behavior is identical it decreases linearly with distance L
Rothman and Cohen [115] showed that such be- havior of microstrains is caused by dislocations that might arise during grinding Assuming the same applied stress microstrain would be approximately inversely proportional to the elastic moduli of these materials If mean microstrain is defined as the arithmetic average of strains for the [001] and [110] directions results agree with values of the Youngs moduli for polycrystalline La2Cu04 Lai85Moi5Cu04 (M = Sr Ba Ca) [152] However other factors may contribute to the microstrain Coordination-6 ionic radii of La^+ Sr Ba^+ Ca^+ are 106 116 136 100 A respectively [153] Substitution of La with ions of different sizes affects the lattice parameter [142] and may cause much larger strains in the [001] direction when some of the ions are replaced with Ba^ than with Sr^ in accord with results in Table 9 Substitution of Ca^^ ions produces an entirely different effect microstrains in the [110] direction are larger This may be explained by
346
Volume 98 Number 3 May-June 1993
Journal of Research of the National Institute of Standards and Technology
comparing effects of substitutional ions on the unit-cell a -parameter The Ba-doped specimen has a larger a-parameter than the Sr-doped but the Ca-doped a-parameter is largest although Ca^^ has the smallest ionic size This should increase the cell distortion in the a-b plane
Table 9 reveals high anisotropy in these materi- als consistent with other physical properties such as thermal expansion [154] and upper critical mag- netic field [155] Differences of domain sizes might arise from a layered structure in the [001] direction and consequently easy incorporation of stacking faults between regularly stacked layers The stack- ing-fault and twin-fault probabilities can be esti- mated from the average surface-weighted domain sizes [59]
^ = TAN + cf1fun(aa) (75) m im - (D)
Here c is a constant for the particular [hkl] direction and fun(a a) a linear combination of stacking-fault probability and twin-fault probability a The exact form of Eq (75) was derived only for the cubic and hexagonal crystal structures On con- dition that the true domain dimension D is isotropic or so large that the second term of Eq (75) dominates a linear function of stacking-fault and twin-fault probability is
fun(aa) = c( 1
) (76) Zgt)J (Dgttrade
Here c denotes a constant that depends only on geometrical factors and is the same for all three doped compounds
Figure 22 shows a possible correlation between Tc and fault-defect probabilities computed from TEM observations of La2-jcSrCu04 revealed that stacking-fault density increased with Sr content up to jc = 015 [156] That study suggests that a shear mechanism forming the fault-boundary dislocations implies oxygen vacancies andor cation deficiency We did not measure oxygen content but neutron- diffraction studies showed that oxygen deficiency starts to appear at much higher Sr content [157] However the increase of fault probability with the simultaneous decrease of microstrain in Fig 22 supports the assumption that defects are intro- duced to accommodate lattice strains [156] A simi- lar increase in Te was found in Y2Ba4Cu802o-laquo thin films [158] Compounds with asymmetric broad- ened and shifted peaks showed higher Tc which
was attributed to stacking faults Although extrinsic stacking faults may cause asymmetric peak broad- ening [140] it is probably caused by twinning Twinning in La-M-Cu-0 materials is less abundant than in Y-Ba-Cu-O compounds but it was ob- served in (La-Sr)2Cu04 monocrystals on (110) planes [159] In the profile-fitting procedure peak asymmetry is incorporated only in the instrumental function therefore we could not model asymmetric peak broadening However any significant asym- metry of the specimen profile would cause an un- even fit of low-angle and high-angle sides of peaks which was not observed This gives much more im- portance to stacking faults in Eq (76)
Fig 22 Arithmetic average of [110] and [001] root-mean- square strains and linear function of stacking-fault and twin- fault probabilities as a function of Tc
In Fig 22 average microstrains defined as the arithmetic average of [001] and [110] directions correlate inversely with Tc However we did not find a correlation of Tc and microstrains in a partic- ular direction [001] microstrains simply reflect dif- ference in size of dopant and host La^ ions (see Table 9)
In La2Cu04 (OkO) reflections are significantly broader than (hOO) This has also been observed in low-temperature orthorhombic Lai85Sroi5Cu04 and Lai85Baoi5Cu04 [160] and explained by either stacking faults or possible lower symmetry Our results reveal that domain sizes (D) have identical values for [010] and [100] directions (Table 9) From Eq (76) it follows that stacking-fault proba- bilities in these directions have the same values However microstrains in the [010] direction are roughly twice as large as in the [100] direction which is responsible for the different broadening In the case of doped La2Cu04 compounds different microstrains might be caused by oxygen
347
Volume 98 Number 3 May-June 1993
Journal of Research of the National Institute of Standards and Technology
vacancies ordered along one direction in the a-b plane similar to effects found in YBa2Cu307-laquo However undoped La2Cu04 is not expected to have significant o^Qgen deficiency Other possibili- ties are lower ciystallographic symmetry andor La vacancies although they were not reported for this system but La deficiency was found in an La2Co04 compound [161]
We can conclude that lattice strains and incoher- ently diffracting domain sizes confirm high an- isotropy in these materials This simple approach however does not allow unambiguous identifica- tion of the strains origin Probably the strains originate from dislocations and from different sizes of host and dopant ions Domain sizes of all com- pounds are larger in the c-direction than in the a-6 plane This indicates existence of stacking faults and twins However because estimated errors are relatively large and only three materials were stud- ied the possible connection between stacking faults and 7c needs further study
62 Bi-Cu-O Superconductors
Among the high-Tc superconductors the Bi- Cu-O compounds appear intriguing especially because their incommensurate structure modula- tion remains incompletely understood [162 163] The crystal structure consists of perovskite-like SrO-(Cu02Ca)mi-Cu02-SrO layers separated by NaCl-like BiO double layers (see Fig 23 [164]) The number m of Cu02 layers alters the supercon- ducting transition temperature Tc (for m = 12 and 3 rclaquo10 90 and 110 K respectively) This two- dimensional layered structure makes these materi- als highly anisotropic and favours the creation of defects
Bulk sintered specimens showed relatively weak peak broadening Moreover the diffraction pat- terns contained many overlapping peaks because the compound crystallizes in an orthorhombic low- symmetry space group A2aa [165] and incommen- surate modulation gives superlattice reflections All patterns revealed a strong [001] texture (Fig 24) making reflections other than (001) difficult to ana- lyze The lattice parameters vary depending on the exact compound stoichiometry and processing his- tory but characteristically they have almost identi- cal a and b parameters and large c parameter fl =54095 A 6=54202 A c =309297 A for Bi2Sr2CaCu208 (Bi-2212 [166] and A =5392 A b =5395 A c =36985 A for (BiPb)2Sr2Ca2Cu30io (BiPb-2223) [165] Thus we treated (hOO) and (0^0) reflections as single peaks Table 10 gives the
results for three specimens Bi-2212 (BiPb)2 (SrMg)2(BaCa)2Cu30io (BiPbMgBa-2223) which were one-phase specimens and BiPb-2223 con- taining approximately equal amounts of 2212 and 2223 phases The in-plane lattice parameters of 2212 and 2223 phases differ little hence only the [00] directions of the mixed-phase specimen were evaluated
b^ (c)
Fig 23 Average crystal structure of Bi2Sr2Cam-iCum04+2m for (a) m = 1 (b) w =2 (c) m =3 [164]
35
-35
42 44 46 48 50 52 54 56 58 60 62 26 (deg)
^ ^^^MK^Aa^Ndllaquop
Fig 24 Part of BiPbMgBa-2223 refined pattern There are 48 fundamental reflections in this region
Interpretation of the results in the case of these complicated compounds must be considered care- fully Microstrains are probably caused by disloca- tion arrays However substitution of different-sized ions and vacancies would also contribute to the strains as would other kinds of disorder especially
348
Volume 98 Number 3 May-June 1993
Journal of Research of the National Institute of Standards and Technology
Table 10 Results of line-btoadening analysis for Bi-Cu-O supreconductors
Specimen Phase hkl (A)
eD)sa)y^
Bi-2212 2212 008 0012
0163(8) 022(3)
001(6) 005(6)
420(80) 00021(6)
020+200 0104(4) ltio-^ 580(30) 00007(1) 040+400 018(2) 00004(6300)
BiPbMgBa-2223 7773 0010 0020
0097(1) 021(2)
00002(1700) 0007(150)
770(60) 00012(1)
020 + 200 012(27) 013(10) 380(430) 00009(71) 040 + 400 015(95) 021(33)
BiPb-73 2212 008 0012
023(2) 025(5)
0002(350) 0001(1000)
220(30) 00013(26)
2223 0010 0020
022(8) 023(99)
0092(67) 018(47)
230(190) 00012(197)
Stacking faults and twins Table 10 shows larger strains in the [001] direction that in the basal plane This can be explained by stacking disorder along the c-axis which was frequently observed in electron-diffraction patterns as streaking [167 168] Easy incorporation of stacking faults is possi- ble because of the two-dimensional weak-bonded layers (BiO double layers are spaced about 3 A apart) The difference in microstrain between in- plane and the c-direction is much smaller for the BiPbMgBa-2223 phase probably because Pb low- ers the faulting by stabilizing the higher-Tc 2223 phase [167] For the BiPb-2223 specimen with two phases there are two possibilities Either the speci- men consists mainly of a mk of two kinds of one- phase grains or both phases occur within the same grains The second possibility was confirmed exper- imentally [169 170] and our results concur be- cause microstrain in the 2212 phase is much smaller than in the one-phase Bi-2212 specimen Processing conditions and cation content probably favour development of the macroscopic inter- growth of both phases within the grains that is microscopic defects grow to sufficiently large re- gions to give a diffraction pattern of another phase with the different number of Cu02 layers As a re- sult strain is relieved and both strains and domain sizes being quite different in one-phase specimens tend to equalize
For the Bi-Cu-O specimens the mean surface- weighted domain sizes are generally smaller than for (La-M)2Cu04 compounds Therefore the com- putation of the stacking- and twin-fault probabili- ties by using Eq (75) may be wrong It would be very instructive to compare the different broaden-
ing of satellite and fundamental reflections which indicates a more pronounced stacking disorder in the modulated structure [171]
In summary we found that for both Bi-2212 and BiPbMgBa-2223 superconductors the c-axis strain exceeds the in-plane strain The BiPb-2223 specimen containing both 2212 and 2223 phases within the single grains shows smaller incoherently diffracting domains and lower c-axis strain than the one-phase specimens This fact may direct us to- ward the mechanism of the second-phase forma- tion in these materials
63 Remarks
It was shown that this particular method of the line-broadening analysis can give information about the size of incoherently diffracting domains and lattice strains in (La-M)2Cu04 and Bi-Clu-O superconductors Moreover results show high an- isotropy of both size and strain parameters as one may expect because of the layered structure of all superconducting cuprates Generally structural line broadening is not large that is a result of rela- tively large domain sizes (200-2000 A) and small strains (002-02) It is interesting to compare these values with the published results for YBa2Cu307-laquo (isotropic strains of 023 [77] and 005-03 [82]) Although the different materi- als were studied they seem too large especially be- cause they are the average of strains in different directions
The main drawback of the line-broadening the- ory is the uncertainty about the origins of the line broadening that is it is difficult to distinguish the main effects responsible for the broadening For
349
Volume 98 Number 3 May-June 1993
Journal of Research of the National Institute of Standards and Technology
the novel superconductors particularly the numer- ous defects (substitutions vacancies stacking faults dislocations and similar) can occur simulta- neously which makes it very difficult to determine their individual contributions Furthermore the crystal structures of most novel superconductors are relatively complicated The average structure has mostly a slightly distorted tetragonal symmetry very similar a and b lattice parameters and a large c parameter but c=36 for YBa2Cu307-laquo for in- stance This results in a large number of overlap- ping peaks and consequently in large errors of all results This showed especially in the case of Bi-Cu-O superconductors (see Table 10) Follow- ing the discussion of reliability of profile fitting in Sec 54 it would be desirable to include more than two reflections in the analysis of broadening but higher-order peaks are usually too weak and over- lapped One way to partially solve this problem would be a whole pattern fitting [172 173] and Rietveld structure refinement [23] in terms of size and strain parameters This requires an accurate preset function to model specimen broadening and precise definition of angular dependence of size and strain parameters The Rietveld programs that model the line broadening in terms of size and strain parameters are based either on the simpli- fied integral-breadth methods [78 95] or on the single-line method [174]
7 Conclusions
A method for analyzing the pure-specimen (structural) broadening of x-ray diffraction line profiles is proposed By modeling the specimen size and strain broadenings with the simple Voigt func- tion it is possible to obtain domain sizes and strains that agree with experiment and show a logi- cal interrelationship Furthermore some common consequences and problems in the Fourier-method analysis follow easily The specimen function is convoluted with the instrumental function to match the observed x-ray diffraction-line profile This avoids the Stokes deconvolution method thus al- lowing analysis of patterns with highly overlapping peaks and weak structural broadening Therefore the method was applied to some novel high-Tc superconductors We reached the following conclu- sions
(i) Surface-weighted domain size depends only on the Cauchy integral breadth of the size-broad- ened profile
(ii) The hook effect occurs when the Cauchy-content of the size-broadened profile is un-
derestimated that is for ^sc(n2)^3sG Usually this happens when the background is estimated too high so the long tails of the Cauchy function are prematurely cut off
(iii) It also follows from conclusion (ii) that the volume-weighted domain size can not be more than twice the surface-weighted domain size (limiting value D)v=2D)i is obtained for the pure-Cauchy size-broadened profile) Minimum value for D)J (D)j should not be less than -131
(iv) If the distortion coefficient is approxi- mated with a harmonic term this leads exactly to the Warren-Averbach method of separation of size and strain broadenings
(v) In that case mean-square strains decrease linearly with the distance L
(vi) It is possible to evaluate local strain ((e^(0))^) only in the case of pure-Gauss strain broadening Then root-mean-square strain is inde- pendent of the distance L and related to the upper limit of strain obtained from the integral breadth of the strain-broadened profile
(vii) If strain broadening is not described exclu- sively with the Gauss function the multiple-line Voigt integral breadth and Warren-Averbach analyses can not give the same results for volume- weighted domain size although D)v is defined identically in both approaches because the appar- ent strain -q = pdeg(29)cot9 is not angular- independent
(viii) Smooth size coefficients give column- length distribution functions without oscillations and make possible a computation of volume- weighted average domain sizes up to ~5000 A
(ix) Comparison with the simplified integral- breadth methods in most cases has shown not large but systematic discrepancy of results indicat- ing that size and strain broadening can not be accu- rately modeled by a single Cauchy or Gauss function Moreover the application of the single- line method is much less reliable and it should not be used where multiple reflections are available
(x) The knowledge of all phases present in the sample and their crystallographic structure is re- quired to successfully fit a cluster of overlapping peaks Although it is very difficult to accurately de- termine the Cauchy-Gauss ratio of an overlapped peak final results of domain size and strain are much less affected Therefore connecting the crys- tallite size exclusively with the Cauchy content and strain with the Gauss content of a specimen profile might be doubtful
(xi) Evaluated errors of domain sizes and strains increase substantially with the degree of
350
Volume 98 Number 3 May-June 1993
Journal of Research of the National Institute of Standards and Technology
peak overlapping Hence for complicated patterns very accurate measurements are necessary and one needs to analyze as many reflections in the same crystallographic direction as possible
(xii) Line-broadening analysis of (La-M)2Cu04 and Bi-Cu-O compounds confirms high anisotropy in these materials
(xiii) Strains in (La-M)2Cu04 probably origi- nate from dislocations and from different sizes of host and dopant ions
(xiv) Stacking-fault probability in (La-M)2Cu04 (M = Ba Ca Sr) increases with increasing Tc whereas the average strain decreases
(xv) In La2Cu04 different broadening of (lOO) and (OfcO) reflections is not caused by stacking faults
(xvi) All Bi-Cu-0 superconductors show larger strain in the c-direction than in the a-b plane which can be explained by stacking disorder along the [001] direction
(xvii) In the specimen with approximately equal amounts of Tl-2212 and TlPb-2223 phases it is likely that a secondary phase develops by the growth of the microscopic faulted regions of the primary phase
Acknowledgments
I am thankful to Dr Harry McHenry for his support and especially to Dr Hassel Ledbetter for his wise guidance and most useful help during my stay at NIST I am also indebted to my home insti- tution the Faculty of Metallurgy of the University of Zagreb for allowing me the leave of absence at NIST
8 References
[1] W Friedrich P Knipping and M v Laue Ann Physik 41 971 (1912)
[2] H M Rietveld Acta Cryst 22 151 (1967) [3] H M Rietveld J Appl Cryst 2 65 (1969) [4] S A Howard and K D Preston in Modern Powder Dif-
fraction Vol 20 The Mineralogical Society of America Washington DC (1989) p 217
[5] D Taupin J Appl Cryst 6 266 (1973) [6] T C Huang and W Parrish Appl Phys Lett 27 123
(1975) [7] M K Wu J R Ashburn C J Torng P H Hor R L
Meng L Gao Z J Hwang Y Q Wang and C W Chu Phys Rev Lett 58 908 (1987)
[8] D Shi MRS Bull 16 37 (1991) [9] D Larbalestier Phys Today 44 74 (1991)
[10] J C Phillips Phys Rev B 4512647 (1992) [11] B Raveau Phys Today 45 53 (1992) [12] A J Millis and K M Rabe Phys Rev B 38 8908 (1988)
[13] F Guinea Europhys Lett 7 549 (1988) [14] C P Dhard and P Singh in Proc Int Symp High-Temp
Supercond Jaipur India Oxford amp IBH Publishing New Delhi (1988) p 271
[15] J D Jorgensen Phys Today 44 34 (1991) [16] J G Bednorz and K A Muller Z Phys B 64 189
(1986) [17] K Kishio K Kitazawa S Kaube I Yasuda N Sugii H
Takagi S Uchida K Fueki and S Tanaka Chem Lett 429 (1987)
[18] J D Jorgensen B Dabrowski S Pei D G Hinks L Soderholm B Morosin J E Venturini and D S Ginley Phys Rev B 38 11337 (1988)
[19] J R Clem Phys Rev B 43 7837 (1991) [20] M Paranthaman M Foldejiki D Balzar H Ledbetter
A J Nelson and A M Hermann submitted to Phys Rev B
[21] A R Stokes Proc Phys Soc Lond 61 382 (1948) [22] B E Warren and B L Averbach J Appl Phys 23 497
(1952) [23] R Delhez Th H de Keijser and E J Mittemeijer in
Accuracy in Powder Diffraction S Block and C R Hub- bard eds Natl Bur Stand (US) Special Publication 567 (1980) p 213
[24] H P Klug and L E Alexander X-ray Diffraction Proce- dures 2nd Edition John Wiley New York (1974) p 661
[25] J I Langford J Appl Ciyst 11 10 (1978) [26] J I Langford in Accuracy in Powder Diffraction S
Block and C R Hubbard eds Natl Bur Stand (US) Special Pubication 567 (1950) p 255
[27] R Delhez Th H de Keijser and E J Mittemeijer Fre- senius Z Anal Chem 312 1 (1982)
[28] A J C Wilson Proc Phys Soc Lond 80 286 (1962) [29] A J C Wilson Proc Phys Soc Lond 81 41 (1963) [30] L P Smith Phys Rev 46 343 (1934) [31] H C Burger and P H van Cittert Z Phys 79 722
(1932) [32] S Ergun J Appl Ciyst 1 19 (1968) [33] R Croche and L Gatineau J Appl Ciyst 10479 (1977) [34] L H Schwarz and J B Cohen Diffraction from Materi-
als Academic Press New York (1977) p 391 [35] R Delhez Th H de Keijser E J Mittemeijer and J I
Langford J Appl Cryst 19 459 (1986) [36] R Delhez Th H de Keijser E J Mittemeijer and J I
Langford Aust J Phys 41 213 (1988) [37] R A Young and D B Wiles J Appl Cryst 15 430
(1982) [38] W Voigt Stizungsber K Bayer Akad Wiss 42 603
(1912) [39] E E Whiting J Quant Spectrosc Radiat Transfer 8
1379 (1968) [40] G K Wertheim M A Butler K W West and D N E
Buchanan Rev Sci Instrum 111369 (1974) [41] M M Hall Jr V G Veeraraghavan H Rubin and P G
Winchell J Appl Cryst 10 66 (1977) [42] A Brown and J W Edmonds Adv X-Ray Anal 23 361
(1980) [43] P Suortti M Ahtee L Unonius J Appl Cryst 12 365
(1979) [44] T Sundius J Raman Spectrosc 1 471 (1973) [45] B H Armstrong J Quant Spectrosc Radiat Transfer 7
61 (1967) [46] J F Kielkopf J Opt Soc Am 63 987 (1973) [47] B P Asthana and W Kiefer Appl Spectr 36 250
(1982)
351
Volume 98 Number 3 May-June 1993
Journal of Research of the National Institute of Standards and Technology
[48] J P M de Vreede S C Mehrotra A Tal and H A Dijkerraan Appl Spectr 36 227 (1982)
[49] F R L Schoening Ada Ciyst 18 975 (1965) [50] P Scherrer Gott Nachr 2 98 (1918) [51] A R Stokes and A J C Wilson Proc Cambridge
Philos Soc 38 313 (1942) [52] A J C Wilson X-Ray Optics 2nd edition Methuen
London (1962) [53] S Leie and T R Anantharaman Proc Indian Acad
Sci Sect A H 261 (1966) [54] D Louer D Weigel and J I Langford J Appl Ciyst
5 353 (1972) [55] A J C Wilson J Appl Ciyst 2 181 (1969) [56] J I Langford and A J C Wilson J Appl Ciyst 11102
(1978) [57] A R Stokes and A J C Wilson Proc Phys Soc Lond
56174 (1944) [58] B E Warren and B L Averbach J Appl Phys 21 595
(1950) [59] B E Warren X-Ray Diffraction Addison-Wesley
Reading Massachusetts (1969) p 264 [60] B E Warren in Progress in Metal Physics Vol 8 Perg-
amon Press London (1959) p 146 [61] F Bertaut C R Acad Sci Paris 228 187 (1949) [62] N C Haider and C N J Wagner Acta Cryst 20 312
(1966) [63] D Balzar and H Ledbetter in Proceedings of the Accu-
racy in Powder Diffraction II Natl Inst Stand Technol (1992) p 37
[64] D Balzar and H Ledbeter J Appl Cryst 26 (1993) in press
[65] J N Eastabrook and A J C Wilson Proc Phys Soc Lond B 65 67 (1952)
[66] R S Smith IBM J Res Develop 4 205 (1960) [67] B Y Pines and A F Sirenko Soviet Physics Ciyst 715
(1962) [68] G B Mitra and N K Misra Acta Ciyst 22 454 (1967) [69] A Gangulee J Appl Ciyst 7 434 (1974) [70] J Mignot D Rondot Acta Met 231321 (1975) [71] J Mignot and D Rondot Acta Ciyst A 33 327 (1977) [72] R K Nandi H K Kuo W Schlosberg G Wissler J B
Cohen and B Crist Jr J Appl Ciyst 17 22 (1984) [73] M Zocchi Acta Ciyst A 36164 (1980) [74] P Ramarao and T R Anantharaman Trans Ind Ins
Metals 18 181 (1965) [75] R K Nandi and S P Sen Gupta J App Cryst 11 6
(1978) [76] Th H de Keijser J I Langford E J Mittemeijer and
B P Vogels J Appl Ciyst IS 308 (1982) [77] A Williams G H Kwei R B Von Dreele A C Lar-
son L D Raistrick and D L Bish Phys Rev B 37 7960 (1988)
[78] A C Larson and R B Von Dreele Los Alamos Na- tional Laboratory Report No LA-UR-86-748 (1988)
[79] J D Jorgensen D H Johnson M H Mueller J G Worlton and R B Von Dreele in Proceedings of the Conference on Diffraction Profile Analysis Cracow Poland (1978) p 20
[80] R B Von Dreele J D Jorgensen and C G Windsor J Appl Ciyst 15 581 (1982)
[81] P Thompson D E Cox and J B Hastings J Appl Ciyst 20 79 (1987)
[82] J P Singh R A Guttschow D S Kupperman J T Dusek and R B Poeppel in High Temperature Super-
conducting Compounds III S Whang A Gupta and E Ceilings eds TMS AIME Warrendale (1991) p 281
[83] M O Eatough D S Glnley and B Morosin Adv X- Ray Anal 33 145 (1990)
[84] E J Peterson P J Kung R E Muenchausen and D M Smith in Proceedings of the 41st Annual Denver Conference on Applications of X-Ray Analysis Colo- rado Springs Colorado (1992) p 74
[85] M Rand J I Langford and J S Abell submitted to J Cryogenics (1992)
[86] D Balzar J Appl Ciyst 25 559 (1992) [87] D Balzar H Ledbetter and A Roshko Physica C 185-
189 871 (1991) [88] D Balzar and H Ledbetter J Mater Sci Lett 111419
(1992) [89] D Balzar H Ledbetter and A Roshko Pow Diffr 8
(1993) in press [90] S Johnson M Gusraan D Rowcliffe T Geballe and J
Sun Adv Ceram Mater 2 337 (1987) [91] H Ledbetter S A Kim R B Goldfarb and K Togano
Phys Rev B 39 9689 (1989) [92] H Friedman Electronics 132 (1945) [93] W Parrish (ed) in Advances in X-Ray Diffractometry
and X-Ray Spectrography Centrex Publishing Company Eindhoven The Netheriands (1962)
[94] W Soller Phys Rev 24158 (1924) [95] S A Howard R L Snyder J Appl Ciyst 22 238
(1989) [96] G H Stout and L H Jensen X-Ray Structure Determi-
nation 2nd edition Wiley New York (1989) p 373 [97] D E Appleman and T Evans Jr Final Report 92-14
US Geological Survey Washington DC (1973) Avail- able as NTIS Document No PB-216188
[98] M U Cohen Rev Sci Instrum 6 68 (1935) [99] M U Cohen Rev Sci Instrum 7 155 (1936) [100] M H Mueller L Heaton and K T Miller Acta Ciyst
13 828 (1960) [101] R A Young P E Mackie and R B Von Dreele J
Appl Ciyst 10 262 (1977) [102] D B Wiles and R A Young J Appl Cryst 14 149
(1981) [103] J K Yau and S A Howard J Appl Ciyst 22 244
(1989) [104] S A Howard J K Yau and H U Anderson J Appl
Phys 65 1492 (1989) [105] S Enzo G Fagherazzi A Benedetti and S Poilizzi J
Appl Ciyst 21 536 (1988) [106] A Benedetti G Fagherazzi S Enzo and M
Battagliarin J Appl Cryst 21 543 (1988) [107] Th H de Keijser E J Mittemeijer and H C F Rozen-
daal J Appl Ciyst 16 309 (1983) [108] Y Zhang J M Stewart C R Hubbard and B Mo-
rosin Adv X-Ray Anal 33 373 (1990) [109] Y Wang S Lee and Y Ue J Appl Ciyst IS 35
(1982) [110] V N Selivanov and E F Smislov Zavod Lab 57 28
(1991) [Ill] A Guinier X-Ray Diffraction W H Freeman San
Francisco (1963) p 139 [112] M Wilkens J Appl Cryst 12119 (1979) [113] D Du and Y Wang Pow Diffr 2180 (1987) [114] A P Prudnikov Yu A Brychkov and O L Marichev
Integrals and Series Vol 1 Gordon and Breach Am- sterdam The Netheriands (1986) p 344
352
Volume 98 Number 3 May-June 1993
Journal of Research of the National Institute of Standards and Technology
[115] R L Rothman and J B Cohen J Appl Phys 42 971 (1971)
[116] T Adier and C R Houska J Appl Phys 50 3282 (1979)
[117] C R Houska and T M Smith J Appl Phys 52 748 (1981)
[118] S Rao and C R Houska Acta Ciyst A 4214 (1986) [119] J I Langford R Delhez Th H de Keijser and E J
Mittemeijer Ausi J Phys 41173 (1988) [120] J I Langfoid J Appl Cryst IS 315 (1982) [121] M J Turunen Th H de Keijser R Delhez and N M
van der Pers J Appl Ciyst 16176 (1983) [122] A J C Wilson Acta Ciyst 23 888 (1967) [123] A J C Wilson Acta Ciyst A 24 478 (1968) [124] A J C Wilson Acta Ciyst A 25 584 (1969) [125] G Gagliotti A Paoletti and F P Ricci Nucl Instrum
3 223 (1958) [126] J I Langford R J Cernik and D Louer J Appl
Ciyst 24 913 (1991) [127] J I Langford in Accuracy in Powder Diffraction II
preprint [128] A J C Wilson Mathematical Theory of X-Ray Powder
Diffractometiy Centrex Eindhoven The Netherlands (1963)
[129] J L Langford Prog Ciyst Growth and Charact 14185 (1987)
[130] T G Fawcett C E Crowder S J Brownell Y Zhang C R Hubbard W Schreiner G P Hamill T C Huang E Sabino J I Langford R Hamilton and D Louer Pow Diffr 3 209 (1988)
[131] W L Smith J Appl Ciyst 9187 (1976) [132] J L Langford and D Louer J Appl Ciyst 15 20
(1982) [133] Fl Popescu and L Benes Acta Ciyst A 33 323 (1977) [134] P PSuse^cu R MSnaila M Popescu and E Jijovici j
Appl Cryst 7 281 (1974) [135] P F Bley Y Calvayrac and M Fayard J Appl Ciyst
7 493 (1974) [136] B Moraweck Ph de Montgolfier and A J Renouprez
J Appl Ciyst 10191 (1977) [137] A Le Bail and D Louer J Appl Cryst 11 50 (1978) [138] D R Buchanan R L McCuUough and R L Miller
Acta Ciyst 20 922 (1966) [139] P Suortti and L D Jennings Acta Cryst A 33 1012
(1977) [140] J B Cohen and C N J Wagner J Appl Phys 33 2073
(1962) [141] A Bianconi J Budnick A M Flank A Fontaine P
Lagarde A Marcelli H Tolentino B Chamberland C Michel B Raveau and G Demazeau Phys Lett A127 285 (1988)
[142] K Fueki K Kitazawa K Kishio T Hasegawa S Uchida H Takagi and S Tanaka in Chemistiy of High- Temperature Superconductors D L Nelson M S Whittingham and T F George eds American Chemi- cal Society (1987) p 38
[143] T Fujita Y Aoki Y Maeno J Sakurai H Fukuba and H Fujii J Appl Phys 26 U68 (1987)
[144] R M Hazen in Physical Properties of High-rc Super- conductors Vol 2 D M Ginsberg ed World Scien- tific Singapore (1990) p 121
[145] J B Torrance A Bezinge A I Nazzal T C Huang S P Parkin D T Keane S J LaPlaca P M Horn and G A Held Phys Rev B 40 8872 (1989)
[146] J D Axe A H Moudden D Hohlwein D E Cox K
M Mohanty A R Moodenbaugh and Y Xu Phys Rev Lett 62 2751 (1989)
[147] T Suzuki and T Fujita Physica C 159 111 (1989) [148] T Fujita and Y Maeno in Superconducting Materials
JJAP Series 1 (1988) p 34 [149] A Roshko and Y-M Chiang J Appl Phys 66 3710
(1989) [150] D E Cox S C Moss R L Meng P H Hor and C W
Chu J Mater Res 31327 (1988) [151] B Crist and J B Cohen J Polym Sci 17 1001 (1979) [152] H Ledbetter S Kim and A Roshko Z Phys B 89275
(1992) [153] R D Shannon and C T Prewitt Acta Ciyst B 25 925
(1969) [154] M Lang H Spille F Steglich Y Hidaka T Murakami
and Y Endoh Physica C 162-1641037 (1989) [155] Y Hidaka and T Murakami Phase trans 15 241
(1989) [156] P L Gai and E M McCarron Science 247 553 (1990) [157] T Kamiyama I Izumi H Asano H Takagi S Uchida
Y Tokura E Takayama-Muromachi M Matsuda K Yamada Y Endoh and Y Hidaka Physica C 172 120 (1990)
[158] A Kapitulnik Physica C 153-155 520 (1988) [159] L A Muradyan V N Molchanov R A Tamazyan and
V I Simonov Physica C 162-164 536 (1989) [160] P Day M Rosseinsky K Prassides W I F David O
Moze and A Soper J Phys C 20 L429 (1987) [161] J T Lewandowski R A Beyerlein J M Longo and R
A McCauley J Amer Ceram Soc 69 699 (1986) [162] R Ramesh G van Tendeloo G Thomas S M Green
Y Mei C Jiang and H L Luo Appl Phys Lett 53 2220 (1988)
[163] J Schneck L Pierre J C Tolddano and C Daguet Phys Rev B 39 9624 (1989)
[164] O Eibl Physica C 168 215 (1990) [165] W Carrilo-Cabrera and W Gopel Physica C 161 373
(1989) [166] P Bordet J J Capponi C Chaillout J Chenavas A
W Hewat E A Hewat J L Hodeau M Marezio J L Tholence and D Tranqui Physica C 156189 (1988)
[167] R Ramesh K Remschnig J M Tarascon and S M Green J Mater Res 6 278 (1991)
[168] Z Hiroi Y Ikeda M Takano and Y Bando J Mater Res 6 435 (1991)
[169] Y Inoue M Hasegawa Y Shichi I Munakata M Ya- manaka S Hiyama and O Nittono J Mater Res 5 737 (1990)
[170] R Ramesh B G Bagley J M Tarascon S M Green M L Rudee and H L Luo J Appl Phys 67 379 (1990)
[171] X B Kan J Kulik P C Chow S C Moss Y F Yan J H Wang and Z X Zhao J Mater Res 5 731 (1990)
[172] G S Pawley J Appl Ciyst 13 630 (1980) [173] H Toraya J Appl Ciyst 19 440 (1986) [174] L Lutterotti and P Scardi J Appl Ciyst 23 246
(1990)
About the author Davor Balzar is with Faculty of Metallurgy of the University of Zagreb Sisak Croatia and was a Guest Researcher at fflST The National Institute of Standards and Technology is an agency of the Technology Administration US Department of Commerce
353
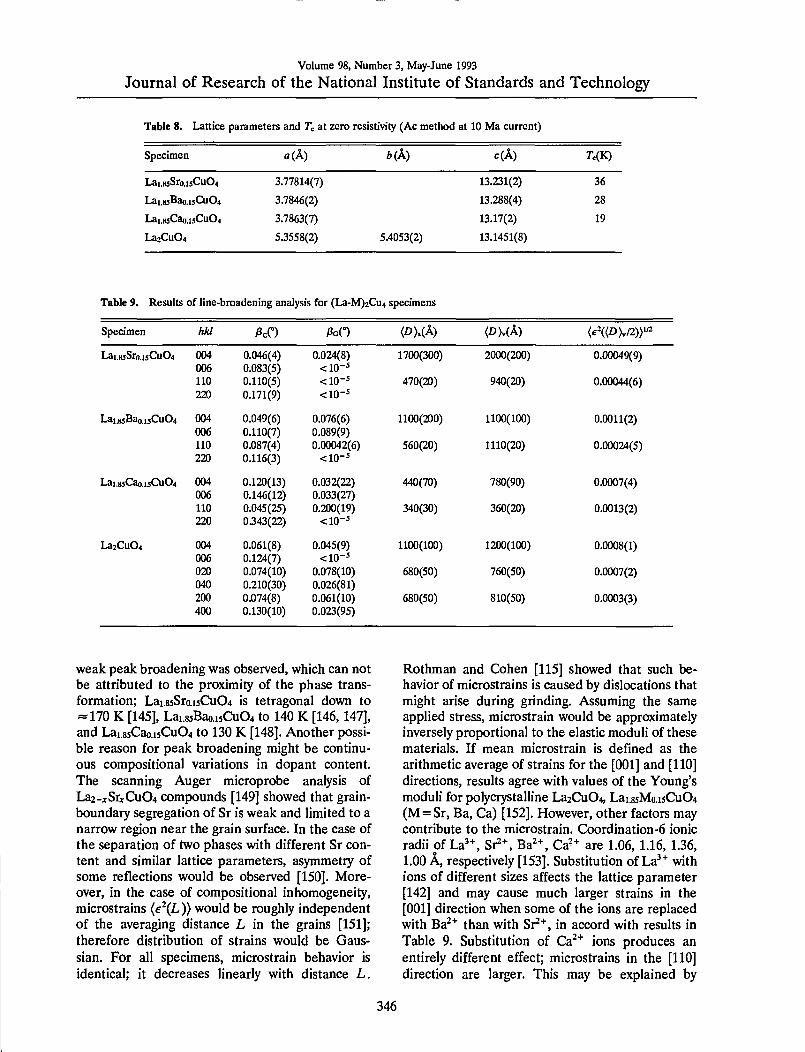
Volume 98 Number 3 May-June 1993
Journal of Research of the National Institute of Standards and Technology
Table 8 Lattice parameters and T^ at zero resistivity (Ac method at 10 Ma current)
Specimen a (A) bk) c(A) rc(K)
Lairaquo5Sroi5Cu04 377814(7)
Lairaquo3Baoi3Cu04 37846(2)
LaiiijCaoi5Cu04 37863(7)
La2Cu04 53558(2) 54053(2)
231(2) 36
288(4) 28
17(2) 19
1451(8)
Table 9 Results of line-broadening analysis for (La-M)2Cu4 specimens
Specimen hkl PcO PoO (DUk) (Iraquo)(A) lte^((D)2))
Lai(laquoSroj5Cu04 004 006
0046(4) 0083(5)
0024(8) ltio-
1700(300) 2000(200) 000049(9)
110 0110(5) ltio- 470(20) 940(20) 000044(6) 220 0171(9) ltio-
Lai85Baoi3Cu04 004 006
0049(6) 0110(7)
0076(6) 0089(9)
1100(200) 1100(100) 00011(2)
110 0087(4) 000042(6) 560(20) 1110(20) 000024(5) 220 0116(3) ltio-5
Laiji5Caoi5Cu04 004 006
0120(13) 0146(12)
0032(22) 0033(27)
440(70) 780(90) 00007(4)
110 0045(25) 0200(19) 340(30) 360(20) 00013(2) 220 0343(22) ltio-
La2Cu04 004 006
0061(8) 0124(7)
0045(9) ltio-
1100(100) 1200(100) 00008(1)
020 0074(10) 0078(10) 680(50) 760(50) 00007(2) 040 0210(30) 0026(81) 200 0074(8) 0061(10) 680(50) 810(50) 00003(3) 400 0130(10) 0023(95)
weak peak broadening was observed which can not be attributed to the proximity of the phase trans- formation Lai85SroisCu04 is tetragonal down to = 170 K [145] Lai85Baoi5Cu04 to 140 K [146147] and Lai85Caoi5Cu04 to 130 K [148] Another possi- ble reason for peak broadening might be continu- ous compositional variations in dopant content The scanning Auger microprobe analysis of La2-SrtCu04 compounds [149] showed that grain- boundary segregation of Sr is weak and limited to a narrow region near the grain surface In the case of the separation of two phases with different Sr con- tent and similar lattice parameters asymmetry of some reflections would be observed [150] More- over in the case of compositional inhomogeneity microstrains eL)) would be roughly independent of the averaging distance L in the grains [151] therefore distribution of strains would be Gaus- sian For all specimens microstrain behavior is identical it decreases linearly with distance L
Rothman and Cohen [115] showed that such be- havior of microstrains is caused by dislocations that might arise during grinding Assuming the same applied stress microstrain would be approximately inversely proportional to the elastic moduli of these materials If mean microstrain is defined as the arithmetic average of strains for the [001] and [110] directions results agree with values of the Youngs moduli for polycrystalline La2Cu04 Lai85Moi5Cu04 (M = Sr Ba Ca) [152] However other factors may contribute to the microstrain Coordination-6 ionic radii of La^+ Sr Ba^+ Ca^+ are 106 116 136 100 A respectively [153] Substitution of La with ions of different sizes affects the lattice parameter [142] and may cause much larger strains in the [001] direction when some of the ions are replaced with Ba^ than with Sr^ in accord with results in Table 9 Substitution of Ca^^ ions produces an entirely different effect microstrains in the [110] direction are larger This may be explained by
346
Volume 98 Number 3 May-June 1993
Journal of Research of the National Institute of Standards and Technology
comparing effects of substitutional ions on the unit-cell a -parameter The Ba-doped specimen has a larger a-parameter than the Sr-doped but the Ca-doped a-parameter is largest although Ca^^ has the smallest ionic size This should increase the cell distortion in the a-b plane
Table 9 reveals high anisotropy in these materi- als consistent with other physical properties such as thermal expansion [154] and upper critical mag- netic field [155] Differences of domain sizes might arise from a layered structure in the [001] direction and consequently easy incorporation of stacking faults between regularly stacked layers The stack- ing-fault and twin-fault probabilities can be esti- mated from the average surface-weighted domain sizes [59]
^ = TAN + cf1fun(aa) (75) m im - (D)
Here c is a constant for the particular [hkl] direction and fun(a a) a linear combination of stacking-fault probability and twin-fault probability a The exact form of Eq (75) was derived only for the cubic and hexagonal crystal structures On con- dition that the true domain dimension D is isotropic or so large that the second term of Eq (75) dominates a linear function of stacking-fault and twin-fault probability is
fun(aa) = c( 1
) (76) Zgt)J (Dgttrade
Here c denotes a constant that depends only on geometrical factors and is the same for all three doped compounds
Figure 22 shows a possible correlation between Tc and fault-defect probabilities computed from TEM observations of La2-jcSrCu04 revealed that stacking-fault density increased with Sr content up to jc = 015 [156] That study suggests that a shear mechanism forming the fault-boundary dislocations implies oxygen vacancies andor cation deficiency We did not measure oxygen content but neutron- diffraction studies showed that oxygen deficiency starts to appear at much higher Sr content [157] However the increase of fault probability with the simultaneous decrease of microstrain in Fig 22 supports the assumption that defects are intro- duced to accommodate lattice strains [156] A simi- lar increase in Te was found in Y2Ba4Cu802o-laquo thin films [158] Compounds with asymmetric broad- ened and shifted peaks showed higher Tc which
was attributed to stacking faults Although extrinsic stacking faults may cause asymmetric peak broad- ening [140] it is probably caused by twinning Twinning in La-M-Cu-0 materials is less abundant than in Y-Ba-Cu-O compounds but it was ob- served in (La-Sr)2Cu04 monocrystals on (110) planes [159] In the profile-fitting procedure peak asymmetry is incorporated only in the instrumental function therefore we could not model asymmetric peak broadening However any significant asym- metry of the specimen profile would cause an un- even fit of low-angle and high-angle sides of peaks which was not observed This gives much more im- portance to stacking faults in Eq (76)
Fig 22 Arithmetic average of [110] and [001] root-mean- square strains and linear function of stacking-fault and twin- fault probabilities as a function of Tc
In Fig 22 average microstrains defined as the arithmetic average of [001] and [110] directions correlate inversely with Tc However we did not find a correlation of Tc and microstrains in a partic- ular direction [001] microstrains simply reflect dif- ference in size of dopant and host La^ ions (see Table 9)
In La2Cu04 (OkO) reflections are significantly broader than (hOO) This has also been observed in low-temperature orthorhombic Lai85Sroi5Cu04 and Lai85Baoi5Cu04 [160] and explained by either stacking faults or possible lower symmetry Our results reveal that domain sizes (D) have identical values for [010] and [100] directions (Table 9) From Eq (76) it follows that stacking-fault proba- bilities in these directions have the same values However microstrains in the [010] direction are roughly twice as large as in the [100] direction which is responsible for the different broadening In the case of doped La2Cu04 compounds different microstrains might be caused by oxygen
347
Volume 98 Number 3 May-June 1993
Journal of Research of the National Institute of Standards and Technology
vacancies ordered along one direction in the a-b plane similar to effects found in YBa2Cu307-laquo However undoped La2Cu04 is not expected to have significant o^Qgen deficiency Other possibili- ties are lower ciystallographic symmetry andor La vacancies although they were not reported for this system but La deficiency was found in an La2Co04 compound [161]
We can conclude that lattice strains and incoher- ently diffracting domain sizes confirm high an- isotropy in these materials This simple approach however does not allow unambiguous identifica- tion of the strains origin Probably the strains originate from dislocations and from different sizes of host and dopant ions Domain sizes of all com- pounds are larger in the c-direction than in the a-6 plane This indicates existence of stacking faults and twins However because estimated errors are relatively large and only three materials were stud- ied the possible connection between stacking faults and 7c needs further study
62 Bi-Cu-O Superconductors
Among the high-Tc superconductors the Bi- Cu-O compounds appear intriguing especially because their incommensurate structure modula- tion remains incompletely understood [162 163] The crystal structure consists of perovskite-like SrO-(Cu02Ca)mi-Cu02-SrO layers separated by NaCl-like BiO double layers (see Fig 23 [164]) The number m of Cu02 layers alters the supercon- ducting transition temperature Tc (for m = 12 and 3 rclaquo10 90 and 110 K respectively) This two- dimensional layered structure makes these materi- als highly anisotropic and favours the creation of defects
Bulk sintered specimens showed relatively weak peak broadening Moreover the diffraction pat- terns contained many overlapping peaks because the compound crystallizes in an orthorhombic low- symmetry space group A2aa [165] and incommen- surate modulation gives superlattice reflections All patterns revealed a strong [001] texture (Fig 24) making reflections other than (001) difficult to ana- lyze The lattice parameters vary depending on the exact compound stoichiometry and processing his- tory but characteristically they have almost identi- cal a and b parameters and large c parameter fl =54095 A 6=54202 A c =309297 A for Bi2Sr2CaCu208 (Bi-2212 [166] and A =5392 A b =5395 A c =36985 A for (BiPb)2Sr2Ca2Cu30io (BiPb-2223) [165] Thus we treated (hOO) and (0^0) reflections as single peaks Table 10 gives the
results for three specimens Bi-2212 (BiPb)2 (SrMg)2(BaCa)2Cu30io (BiPbMgBa-2223) which were one-phase specimens and BiPb-2223 con- taining approximately equal amounts of 2212 and 2223 phases The in-plane lattice parameters of 2212 and 2223 phases differ little hence only the [00] directions of the mixed-phase specimen were evaluated
b^ (c)
Fig 23 Average crystal structure of Bi2Sr2Cam-iCum04+2m for (a) m = 1 (b) w =2 (c) m =3 [164]
35
-35
42 44 46 48 50 52 54 56 58 60 62 26 (deg)
^ ^^^MK^Aa^Ndllaquop
Fig 24 Part of BiPbMgBa-2223 refined pattern There are 48 fundamental reflections in this region
Interpretation of the results in the case of these complicated compounds must be considered care- fully Microstrains are probably caused by disloca- tion arrays However substitution of different-sized ions and vacancies would also contribute to the strains as would other kinds of disorder especially
348
Volume 98 Number 3 May-June 1993
Journal of Research of the National Institute of Standards and Technology
Table 10 Results of line-btoadening analysis for Bi-Cu-O supreconductors
Specimen Phase hkl (A)
eD)sa)y^
Bi-2212 2212 008 0012
0163(8) 022(3)
001(6) 005(6)
420(80) 00021(6)
020+200 0104(4) ltio-^ 580(30) 00007(1) 040+400 018(2) 00004(6300)
BiPbMgBa-2223 7773 0010 0020
0097(1) 021(2)
00002(1700) 0007(150)
770(60) 00012(1)
020 + 200 012(27) 013(10) 380(430) 00009(71) 040 + 400 015(95) 021(33)
BiPb-73 2212 008 0012
023(2) 025(5)
0002(350) 0001(1000)
220(30) 00013(26)
2223 0010 0020
022(8) 023(99)
0092(67) 018(47)
230(190) 00012(197)
Stacking faults and twins Table 10 shows larger strains in the [001] direction that in the basal plane This can be explained by stacking disorder along the c-axis which was frequently observed in electron-diffraction patterns as streaking [167 168] Easy incorporation of stacking faults is possi- ble because of the two-dimensional weak-bonded layers (BiO double layers are spaced about 3 A apart) The difference in microstrain between in- plane and the c-direction is much smaller for the BiPbMgBa-2223 phase probably because Pb low- ers the faulting by stabilizing the higher-Tc 2223 phase [167] For the BiPb-2223 specimen with two phases there are two possibilities Either the speci- men consists mainly of a mk of two kinds of one- phase grains or both phases occur within the same grains The second possibility was confirmed exper- imentally [169 170] and our results concur be- cause microstrain in the 2212 phase is much smaller than in the one-phase Bi-2212 specimen Processing conditions and cation content probably favour development of the macroscopic inter- growth of both phases within the grains that is microscopic defects grow to sufficiently large re- gions to give a diffraction pattern of another phase with the different number of Cu02 layers As a re- sult strain is relieved and both strains and domain sizes being quite different in one-phase specimens tend to equalize
For the Bi-Cu-O specimens the mean surface- weighted domain sizes are generally smaller than for (La-M)2Cu04 compounds Therefore the com- putation of the stacking- and twin-fault probabili- ties by using Eq (75) may be wrong It would be very instructive to compare the different broaden-
ing of satellite and fundamental reflections which indicates a more pronounced stacking disorder in the modulated structure [171]
In summary we found that for both Bi-2212 and BiPbMgBa-2223 superconductors the c-axis strain exceeds the in-plane strain The BiPb-2223 specimen containing both 2212 and 2223 phases within the single grains shows smaller incoherently diffracting domains and lower c-axis strain than the one-phase specimens This fact may direct us to- ward the mechanism of the second-phase forma- tion in these materials
63 Remarks
It was shown that this particular method of the line-broadening analysis can give information about the size of incoherently diffracting domains and lattice strains in (La-M)2Cu04 and Bi-Clu-O superconductors Moreover results show high an- isotropy of both size and strain parameters as one may expect because of the layered structure of all superconducting cuprates Generally structural line broadening is not large that is a result of rela- tively large domain sizes (200-2000 A) and small strains (002-02) It is interesting to compare these values with the published results for YBa2Cu307-laquo (isotropic strains of 023 [77] and 005-03 [82]) Although the different materi- als were studied they seem too large especially be- cause they are the average of strains in different directions
The main drawback of the line-broadening the- ory is the uncertainty about the origins of the line broadening that is it is difficult to distinguish the main effects responsible for the broadening For
349
Volume 98 Number 3 May-June 1993
Journal of Research of the National Institute of Standards and Technology
the novel superconductors particularly the numer- ous defects (substitutions vacancies stacking faults dislocations and similar) can occur simulta- neously which makes it very difficult to determine their individual contributions Furthermore the crystal structures of most novel superconductors are relatively complicated The average structure has mostly a slightly distorted tetragonal symmetry very similar a and b lattice parameters and a large c parameter but c=36 for YBa2Cu307-laquo for in- stance This results in a large number of overlap- ping peaks and consequently in large errors of all results This showed especially in the case of Bi-Cu-O superconductors (see Table 10) Follow- ing the discussion of reliability of profile fitting in Sec 54 it would be desirable to include more than two reflections in the analysis of broadening but higher-order peaks are usually too weak and over- lapped One way to partially solve this problem would be a whole pattern fitting [172 173] and Rietveld structure refinement [23] in terms of size and strain parameters This requires an accurate preset function to model specimen broadening and precise definition of angular dependence of size and strain parameters The Rietveld programs that model the line broadening in terms of size and strain parameters are based either on the simpli- fied integral-breadth methods [78 95] or on the single-line method [174]
7 Conclusions
A method for analyzing the pure-specimen (structural) broadening of x-ray diffraction line profiles is proposed By modeling the specimen size and strain broadenings with the simple Voigt func- tion it is possible to obtain domain sizes and strains that agree with experiment and show a logi- cal interrelationship Furthermore some common consequences and problems in the Fourier-method analysis follow easily The specimen function is convoluted with the instrumental function to match the observed x-ray diffraction-line profile This avoids the Stokes deconvolution method thus al- lowing analysis of patterns with highly overlapping peaks and weak structural broadening Therefore the method was applied to some novel high-Tc superconductors We reached the following conclu- sions
(i) Surface-weighted domain size depends only on the Cauchy integral breadth of the size-broad- ened profile
(ii) The hook effect occurs when the Cauchy-content of the size-broadened profile is un-
derestimated that is for ^sc(n2)^3sG Usually this happens when the background is estimated too high so the long tails of the Cauchy function are prematurely cut off
(iii) It also follows from conclusion (ii) that the volume-weighted domain size can not be more than twice the surface-weighted domain size (limiting value D)v=2D)i is obtained for the pure-Cauchy size-broadened profile) Minimum value for D)J (D)j should not be less than -131
(iv) If the distortion coefficient is approxi- mated with a harmonic term this leads exactly to the Warren-Averbach method of separation of size and strain broadenings
(v) In that case mean-square strains decrease linearly with the distance L
(vi) It is possible to evaluate local strain ((e^(0))^) only in the case of pure-Gauss strain broadening Then root-mean-square strain is inde- pendent of the distance L and related to the upper limit of strain obtained from the integral breadth of the strain-broadened profile
(vii) If strain broadening is not described exclu- sively with the Gauss function the multiple-line Voigt integral breadth and Warren-Averbach analyses can not give the same results for volume- weighted domain size although D)v is defined identically in both approaches because the appar- ent strain -q = pdeg(29)cot9 is not angular- independent
(viii) Smooth size coefficients give column- length distribution functions without oscillations and make possible a computation of volume- weighted average domain sizes up to ~5000 A
(ix) Comparison with the simplified integral- breadth methods in most cases has shown not large but systematic discrepancy of results indicat- ing that size and strain broadening can not be accu- rately modeled by a single Cauchy or Gauss function Moreover the application of the single- line method is much less reliable and it should not be used where multiple reflections are available
(x) The knowledge of all phases present in the sample and their crystallographic structure is re- quired to successfully fit a cluster of overlapping peaks Although it is very difficult to accurately de- termine the Cauchy-Gauss ratio of an overlapped peak final results of domain size and strain are much less affected Therefore connecting the crys- tallite size exclusively with the Cauchy content and strain with the Gauss content of a specimen profile might be doubtful
(xi) Evaluated errors of domain sizes and strains increase substantially with the degree of
350
Volume 98 Number 3 May-June 1993
Journal of Research of the National Institute of Standards and Technology
peak overlapping Hence for complicated patterns very accurate measurements are necessary and one needs to analyze as many reflections in the same crystallographic direction as possible
(xii) Line-broadening analysis of (La-M)2Cu04 and Bi-Cu-O compounds confirms high anisotropy in these materials
(xiii) Strains in (La-M)2Cu04 probably origi- nate from dislocations and from different sizes of host and dopant ions
(xiv) Stacking-fault probability in (La-M)2Cu04 (M = Ba Ca Sr) increases with increasing Tc whereas the average strain decreases
(xv) In La2Cu04 different broadening of (lOO) and (OfcO) reflections is not caused by stacking faults
(xvi) All Bi-Cu-0 superconductors show larger strain in the c-direction than in the a-b plane which can be explained by stacking disorder along the [001] direction
(xvii) In the specimen with approximately equal amounts of Tl-2212 and TlPb-2223 phases it is likely that a secondary phase develops by the growth of the microscopic faulted regions of the primary phase
Acknowledgments
I am thankful to Dr Harry McHenry for his support and especially to Dr Hassel Ledbetter for his wise guidance and most useful help during my stay at NIST I am also indebted to my home insti- tution the Faculty of Metallurgy of the University of Zagreb for allowing me the leave of absence at NIST
8 References
[1] W Friedrich P Knipping and M v Laue Ann Physik 41 971 (1912)
[2] H M Rietveld Acta Cryst 22 151 (1967) [3] H M Rietveld J Appl Cryst 2 65 (1969) [4] S A Howard and K D Preston in Modern Powder Dif-
fraction Vol 20 The Mineralogical Society of America Washington DC (1989) p 217
[5] D Taupin J Appl Cryst 6 266 (1973) [6] T C Huang and W Parrish Appl Phys Lett 27 123
(1975) [7] M K Wu J R Ashburn C J Torng P H Hor R L
Meng L Gao Z J Hwang Y Q Wang and C W Chu Phys Rev Lett 58 908 (1987)
[8] D Shi MRS Bull 16 37 (1991) [9] D Larbalestier Phys Today 44 74 (1991)
[10] J C Phillips Phys Rev B 4512647 (1992) [11] B Raveau Phys Today 45 53 (1992) [12] A J Millis and K M Rabe Phys Rev B 38 8908 (1988)
[13] F Guinea Europhys Lett 7 549 (1988) [14] C P Dhard and P Singh in Proc Int Symp High-Temp
Supercond Jaipur India Oxford amp IBH Publishing New Delhi (1988) p 271
[15] J D Jorgensen Phys Today 44 34 (1991) [16] J G Bednorz and K A Muller Z Phys B 64 189
(1986) [17] K Kishio K Kitazawa S Kaube I Yasuda N Sugii H
Takagi S Uchida K Fueki and S Tanaka Chem Lett 429 (1987)
[18] J D Jorgensen B Dabrowski S Pei D G Hinks L Soderholm B Morosin J E Venturini and D S Ginley Phys Rev B 38 11337 (1988)
[19] J R Clem Phys Rev B 43 7837 (1991) [20] M Paranthaman M Foldejiki D Balzar H Ledbetter
A J Nelson and A M Hermann submitted to Phys Rev B
[21] A R Stokes Proc Phys Soc Lond 61 382 (1948) [22] B E Warren and B L Averbach J Appl Phys 23 497
(1952) [23] R Delhez Th H de Keijser and E J Mittemeijer in
Accuracy in Powder Diffraction S Block and C R Hub- bard eds Natl Bur Stand (US) Special Publication 567 (1980) p 213
[24] H P Klug and L E Alexander X-ray Diffraction Proce- dures 2nd Edition John Wiley New York (1974) p 661
[25] J I Langford J Appl Ciyst 11 10 (1978) [26] J I Langford in Accuracy in Powder Diffraction S
Block and C R Hubbard eds Natl Bur Stand (US) Special Pubication 567 (1950) p 255
[27] R Delhez Th H de Keijser and E J Mittemeijer Fre- senius Z Anal Chem 312 1 (1982)
[28] A J C Wilson Proc Phys Soc Lond 80 286 (1962) [29] A J C Wilson Proc Phys Soc Lond 81 41 (1963) [30] L P Smith Phys Rev 46 343 (1934) [31] H C Burger and P H van Cittert Z Phys 79 722
(1932) [32] S Ergun J Appl Ciyst 1 19 (1968) [33] R Croche and L Gatineau J Appl Ciyst 10479 (1977) [34] L H Schwarz and J B Cohen Diffraction from Materi-
als Academic Press New York (1977) p 391 [35] R Delhez Th H de Keijser E J Mittemeijer and J I
Langford J Appl Cryst 19 459 (1986) [36] R Delhez Th H de Keijser E J Mittemeijer and J I
Langford Aust J Phys 41 213 (1988) [37] R A Young and D B Wiles J Appl Cryst 15 430
(1982) [38] W Voigt Stizungsber K Bayer Akad Wiss 42 603
(1912) [39] E E Whiting J Quant Spectrosc Radiat Transfer 8
1379 (1968) [40] G K Wertheim M A Butler K W West and D N E
Buchanan Rev Sci Instrum 111369 (1974) [41] M M Hall Jr V G Veeraraghavan H Rubin and P G
Winchell J Appl Cryst 10 66 (1977) [42] A Brown and J W Edmonds Adv X-Ray Anal 23 361
(1980) [43] P Suortti M Ahtee L Unonius J Appl Cryst 12 365
(1979) [44] T Sundius J Raman Spectrosc 1 471 (1973) [45] B H Armstrong J Quant Spectrosc Radiat Transfer 7
61 (1967) [46] J F Kielkopf J Opt Soc Am 63 987 (1973) [47] B P Asthana and W Kiefer Appl Spectr 36 250
(1982)
351
Volume 98 Number 3 May-June 1993
Journal of Research of the National Institute of Standards and Technology
[48] J P M de Vreede S C Mehrotra A Tal and H A Dijkerraan Appl Spectr 36 227 (1982)
[49] F R L Schoening Ada Ciyst 18 975 (1965) [50] P Scherrer Gott Nachr 2 98 (1918) [51] A R Stokes and A J C Wilson Proc Cambridge
Philos Soc 38 313 (1942) [52] A J C Wilson X-Ray Optics 2nd edition Methuen
London (1962) [53] S Leie and T R Anantharaman Proc Indian Acad
Sci Sect A H 261 (1966) [54] D Louer D Weigel and J I Langford J Appl Ciyst
5 353 (1972) [55] A J C Wilson J Appl Ciyst 2 181 (1969) [56] J I Langford and A J C Wilson J Appl Ciyst 11102
(1978) [57] A R Stokes and A J C Wilson Proc Phys Soc Lond
56174 (1944) [58] B E Warren and B L Averbach J Appl Phys 21 595
(1950) [59] B E Warren X-Ray Diffraction Addison-Wesley
Reading Massachusetts (1969) p 264 [60] B E Warren in Progress in Metal Physics Vol 8 Perg-
amon Press London (1959) p 146 [61] F Bertaut C R Acad Sci Paris 228 187 (1949) [62] N C Haider and C N J Wagner Acta Cryst 20 312
(1966) [63] D Balzar and H Ledbetter in Proceedings of the Accu-
racy in Powder Diffraction II Natl Inst Stand Technol (1992) p 37
[64] D Balzar and H Ledbeter J Appl Cryst 26 (1993) in press
[65] J N Eastabrook and A J C Wilson Proc Phys Soc Lond B 65 67 (1952)
[66] R S Smith IBM J Res Develop 4 205 (1960) [67] B Y Pines and A F Sirenko Soviet Physics Ciyst 715
(1962) [68] G B Mitra and N K Misra Acta Ciyst 22 454 (1967) [69] A Gangulee J Appl Ciyst 7 434 (1974) [70] J Mignot D Rondot Acta Met 231321 (1975) [71] J Mignot and D Rondot Acta Ciyst A 33 327 (1977) [72] R K Nandi H K Kuo W Schlosberg G Wissler J B
Cohen and B Crist Jr J Appl Ciyst 17 22 (1984) [73] M Zocchi Acta Ciyst A 36164 (1980) [74] P Ramarao and T R Anantharaman Trans Ind Ins
Metals 18 181 (1965) [75] R K Nandi and S P Sen Gupta J App Cryst 11 6
(1978) [76] Th H de Keijser J I Langford E J Mittemeijer and
B P Vogels J Appl Ciyst IS 308 (1982) [77] A Williams G H Kwei R B Von Dreele A C Lar-
son L D Raistrick and D L Bish Phys Rev B 37 7960 (1988)
[78] A C Larson and R B Von Dreele Los Alamos Na- tional Laboratory Report No LA-UR-86-748 (1988)
[79] J D Jorgensen D H Johnson M H Mueller J G Worlton and R B Von Dreele in Proceedings of the Conference on Diffraction Profile Analysis Cracow Poland (1978) p 20
[80] R B Von Dreele J D Jorgensen and C G Windsor J Appl Ciyst 15 581 (1982)
[81] P Thompson D E Cox and J B Hastings J Appl Ciyst 20 79 (1987)
[82] J P Singh R A Guttschow D S Kupperman J T Dusek and R B Poeppel in High Temperature Super-
conducting Compounds III S Whang A Gupta and E Ceilings eds TMS AIME Warrendale (1991) p 281
[83] M O Eatough D S Glnley and B Morosin Adv X- Ray Anal 33 145 (1990)
[84] E J Peterson P J Kung R E Muenchausen and D M Smith in Proceedings of the 41st Annual Denver Conference on Applications of X-Ray Analysis Colo- rado Springs Colorado (1992) p 74
[85] M Rand J I Langford and J S Abell submitted to J Cryogenics (1992)
[86] D Balzar J Appl Ciyst 25 559 (1992) [87] D Balzar H Ledbetter and A Roshko Physica C 185-
189 871 (1991) [88] D Balzar and H Ledbetter J Mater Sci Lett 111419
(1992) [89] D Balzar H Ledbetter and A Roshko Pow Diffr 8
(1993) in press [90] S Johnson M Gusraan D Rowcliffe T Geballe and J
Sun Adv Ceram Mater 2 337 (1987) [91] H Ledbetter S A Kim R B Goldfarb and K Togano
Phys Rev B 39 9689 (1989) [92] H Friedman Electronics 132 (1945) [93] W Parrish (ed) in Advances in X-Ray Diffractometry
and X-Ray Spectrography Centrex Publishing Company Eindhoven The Netheriands (1962)
[94] W Soller Phys Rev 24158 (1924) [95] S A Howard R L Snyder J Appl Ciyst 22 238
(1989) [96] G H Stout and L H Jensen X-Ray Structure Determi-
nation 2nd edition Wiley New York (1989) p 373 [97] D E Appleman and T Evans Jr Final Report 92-14
US Geological Survey Washington DC (1973) Avail- able as NTIS Document No PB-216188
[98] M U Cohen Rev Sci Instrum 6 68 (1935) [99] M U Cohen Rev Sci Instrum 7 155 (1936) [100] M H Mueller L Heaton and K T Miller Acta Ciyst
13 828 (1960) [101] R A Young P E Mackie and R B Von Dreele J
Appl Ciyst 10 262 (1977) [102] D B Wiles and R A Young J Appl Cryst 14 149
(1981) [103] J K Yau and S A Howard J Appl Ciyst 22 244
(1989) [104] S A Howard J K Yau and H U Anderson J Appl
Phys 65 1492 (1989) [105] S Enzo G Fagherazzi A Benedetti and S Poilizzi J
Appl Ciyst 21 536 (1988) [106] A Benedetti G Fagherazzi S Enzo and M
Battagliarin J Appl Cryst 21 543 (1988) [107] Th H de Keijser E J Mittemeijer and H C F Rozen-
daal J Appl Ciyst 16 309 (1983) [108] Y Zhang J M Stewart C R Hubbard and B Mo-
rosin Adv X-Ray Anal 33 373 (1990) [109] Y Wang S Lee and Y Ue J Appl Ciyst IS 35
(1982) [110] V N Selivanov and E F Smislov Zavod Lab 57 28
(1991) [Ill] A Guinier X-Ray Diffraction W H Freeman San
Francisco (1963) p 139 [112] M Wilkens J Appl Cryst 12119 (1979) [113] D Du and Y Wang Pow Diffr 2180 (1987) [114] A P Prudnikov Yu A Brychkov and O L Marichev
Integrals and Series Vol 1 Gordon and Breach Am- sterdam The Netheriands (1986) p 344
352
Volume 98 Number 3 May-June 1993
Journal of Research of the National Institute of Standards and Technology
[115] R L Rothman and J B Cohen J Appl Phys 42 971 (1971)
[116] T Adier and C R Houska J Appl Phys 50 3282 (1979)
[117] C R Houska and T M Smith J Appl Phys 52 748 (1981)
[118] S Rao and C R Houska Acta Ciyst A 4214 (1986) [119] J I Langford R Delhez Th H de Keijser and E J
Mittemeijer Ausi J Phys 41173 (1988) [120] J I Langfoid J Appl Cryst IS 315 (1982) [121] M J Turunen Th H de Keijser R Delhez and N M
van der Pers J Appl Ciyst 16176 (1983) [122] A J C Wilson Acta Ciyst 23 888 (1967) [123] A J C Wilson Acta Ciyst A 24 478 (1968) [124] A J C Wilson Acta Ciyst A 25 584 (1969) [125] G Gagliotti A Paoletti and F P Ricci Nucl Instrum
3 223 (1958) [126] J I Langford R J Cernik and D Louer J Appl
Ciyst 24 913 (1991) [127] J I Langford in Accuracy in Powder Diffraction II
preprint [128] A J C Wilson Mathematical Theory of X-Ray Powder
Diffractometiy Centrex Eindhoven The Netherlands (1963)
[129] J L Langford Prog Ciyst Growth and Charact 14185 (1987)
[130] T G Fawcett C E Crowder S J Brownell Y Zhang C R Hubbard W Schreiner G P Hamill T C Huang E Sabino J I Langford R Hamilton and D Louer Pow Diffr 3 209 (1988)
[131] W L Smith J Appl Ciyst 9187 (1976) [132] J L Langford and D Louer J Appl Ciyst 15 20
(1982) [133] Fl Popescu and L Benes Acta Ciyst A 33 323 (1977) [134] P PSuse^cu R MSnaila M Popescu and E Jijovici j
Appl Cryst 7 281 (1974) [135] P F Bley Y Calvayrac and M Fayard J Appl Ciyst
7 493 (1974) [136] B Moraweck Ph de Montgolfier and A J Renouprez
J Appl Ciyst 10191 (1977) [137] A Le Bail and D Louer J Appl Cryst 11 50 (1978) [138] D R Buchanan R L McCuUough and R L Miller
Acta Ciyst 20 922 (1966) [139] P Suortti and L D Jennings Acta Cryst A 33 1012
(1977) [140] J B Cohen and C N J Wagner J Appl Phys 33 2073
(1962) [141] A Bianconi J Budnick A M Flank A Fontaine P
Lagarde A Marcelli H Tolentino B Chamberland C Michel B Raveau and G Demazeau Phys Lett A127 285 (1988)
[142] K Fueki K Kitazawa K Kishio T Hasegawa S Uchida H Takagi and S Tanaka in Chemistiy of High- Temperature Superconductors D L Nelson M S Whittingham and T F George eds American Chemi- cal Society (1987) p 38
[143] T Fujita Y Aoki Y Maeno J Sakurai H Fukuba and H Fujii J Appl Phys 26 U68 (1987)
[144] R M Hazen in Physical Properties of High-rc Super- conductors Vol 2 D M Ginsberg ed World Scien- tific Singapore (1990) p 121
[145] J B Torrance A Bezinge A I Nazzal T C Huang S P Parkin D T Keane S J LaPlaca P M Horn and G A Held Phys Rev B 40 8872 (1989)
[146] J D Axe A H Moudden D Hohlwein D E Cox K
M Mohanty A R Moodenbaugh and Y Xu Phys Rev Lett 62 2751 (1989)
[147] T Suzuki and T Fujita Physica C 159 111 (1989) [148] T Fujita and Y Maeno in Superconducting Materials
JJAP Series 1 (1988) p 34 [149] A Roshko and Y-M Chiang J Appl Phys 66 3710
(1989) [150] D E Cox S C Moss R L Meng P H Hor and C W
Chu J Mater Res 31327 (1988) [151] B Crist and J B Cohen J Polym Sci 17 1001 (1979) [152] H Ledbetter S Kim and A Roshko Z Phys B 89275
(1992) [153] R D Shannon and C T Prewitt Acta Ciyst B 25 925
(1969) [154] M Lang H Spille F Steglich Y Hidaka T Murakami
and Y Endoh Physica C 162-1641037 (1989) [155] Y Hidaka and T Murakami Phase trans 15 241
(1989) [156] P L Gai and E M McCarron Science 247 553 (1990) [157] T Kamiyama I Izumi H Asano H Takagi S Uchida
Y Tokura E Takayama-Muromachi M Matsuda K Yamada Y Endoh and Y Hidaka Physica C 172 120 (1990)
[158] A Kapitulnik Physica C 153-155 520 (1988) [159] L A Muradyan V N Molchanov R A Tamazyan and
V I Simonov Physica C 162-164 536 (1989) [160] P Day M Rosseinsky K Prassides W I F David O
Moze and A Soper J Phys C 20 L429 (1987) [161] J T Lewandowski R A Beyerlein J M Longo and R
A McCauley J Amer Ceram Soc 69 699 (1986) [162] R Ramesh G van Tendeloo G Thomas S M Green
Y Mei C Jiang and H L Luo Appl Phys Lett 53 2220 (1988)
[163] J Schneck L Pierre J C Tolddano and C Daguet Phys Rev B 39 9624 (1989)
[164] O Eibl Physica C 168 215 (1990) [165] W Carrilo-Cabrera and W Gopel Physica C 161 373
(1989) [166] P Bordet J J Capponi C Chaillout J Chenavas A
W Hewat E A Hewat J L Hodeau M Marezio J L Tholence and D Tranqui Physica C 156189 (1988)
[167] R Ramesh K Remschnig J M Tarascon and S M Green J Mater Res 6 278 (1991)
[168] Z Hiroi Y Ikeda M Takano and Y Bando J Mater Res 6 435 (1991)
[169] Y Inoue M Hasegawa Y Shichi I Munakata M Ya- manaka S Hiyama and O Nittono J Mater Res 5 737 (1990)
[170] R Ramesh B G Bagley J M Tarascon S M Green M L Rudee and H L Luo J Appl Phys 67 379 (1990)
[171] X B Kan J Kulik P C Chow S C Moss Y F Yan J H Wang and Z X Zhao J Mater Res 5 731 (1990)
[172] G S Pawley J Appl Ciyst 13 630 (1980) [173] H Toraya J Appl Ciyst 19 440 (1986) [174] L Lutterotti and P Scardi J Appl Ciyst 23 246
(1990)
About the author Davor Balzar is with Faculty of Metallurgy of the University of Zagreb Sisak Croatia and was a Guest Researcher at fflST The National Institute of Standards and Technology is an agency of the Technology Administration US Department of Commerce
353
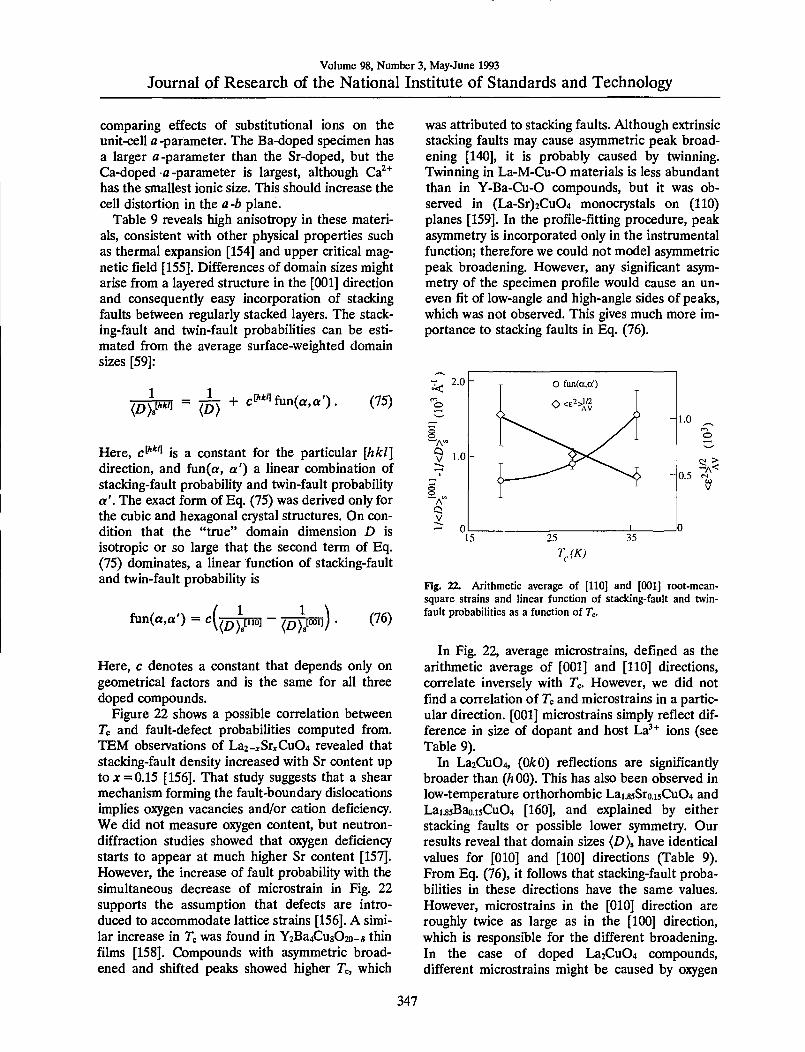
Volume 98 Number 3 May-June 1993
Journal of Research of the National Institute of Standards and Technology
comparing effects of substitutional ions on the unit-cell a -parameter The Ba-doped specimen has a larger a-parameter than the Sr-doped but the Ca-doped a-parameter is largest although Ca^^ has the smallest ionic size This should increase the cell distortion in the a-b plane
Table 9 reveals high anisotropy in these materi- als consistent with other physical properties such as thermal expansion [154] and upper critical mag- netic field [155] Differences of domain sizes might arise from a layered structure in the [001] direction and consequently easy incorporation of stacking faults between regularly stacked layers The stack- ing-fault and twin-fault probabilities can be esti- mated from the average surface-weighted domain sizes [59]
^ = TAN + cf1fun(aa) (75) m im - (D)
Here c is a constant for the particular [hkl] direction and fun(a a) a linear combination of stacking-fault probability and twin-fault probability a The exact form of Eq (75) was derived only for the cubic and hexagonal crystal structures On con- dition that the true domain dimension D is isotropic or so large that the second term of Eq (75) dominates a linear function of stacking-fault and twin-fault probability is
fun(aa) = c( 1
) (76) Zgt)J (Dgttrade
Here c denotes a constant that depends only on geometrical factors and is the same for all three doped compounds
Figure 22 shows a possible correlation between Tc and fault-defect probabilities computed from TEM observations of La2-jcSrCu04 revealed that stacking-fault density increased with Sr content up to jc = 015 [156] That study suggests that a shear mechanism forming the fault-boundary dislocations implies oxygen vacancies andor cation deficiency We did not measure oxygen content but neutron- diffraction studies showed that oxygen deficiency starts to appear at much higher Sr content [157] However the increase of fault probability with the simultaneous decrease of microstrain in Fig 22 supports the assumption that defects are intro- duced to accommodate lattice strains [156] A simi- lar increase in Te was found in Y2Ba4Cu802o-laquo thin films [158] Compounds with asymmetric broad- ened and shifted peaks showed higher Tc which
was attributed to stacking faults Although extrinsic stacking faults may cause asymmetric peak broad- ening [140] it is probably caused by twinning Twinning in La-M-Cu-0 materials is less abundant than in Y-Ba-Cu-O compounds but it was ob- served in (La-Sr)2Cu04 monocrystals on (110) planes [159] In the profile-fitting procedure peak asymmetry is incorporated only in the instrumental function therefore we could not model asymmetric peak broadening However any significant asym- metry of the specimen profile would cause an un- even fit of low-angle and high-angle sides of peaks which was not observed This gives much more im- portance to stacking faults in Eq (76)
Fig 22 Arithmetic average of [110] and [001] root-mean- square strains and linear function of stacking-fault and twin- fault probabilities as a function of Tc
In Fig 22 average microstrains defined as the arithmetic average of [001] and [110] directions correlate inversely with Tc However we did not find a correlation of Tc and microstrains in a partic- ular direction [001] microstrains simply reflect dif- ference in size of dopant and host La^ ions (see Table 9)
In La2Cu04 (OkO) reflections are significantly broader than (hOO) This has also been observed in low-temperature orthorhombic Lai85Sroi5Cu04 and Lai85Baoi5Cu04 [160] and explained by either stacking faults or possible lower symmetry Our results reveal that domain sizes (D) have identical values for [010] and [100] directions (Table 9) From Eq (76) it follows that stacking-fault proba- bilities in these directions have the same values However microstrains in the [010] direction are roughly twice as large as in the [100] direction which is responsible for the different broadening In the case of doped La2Cu04 compounds different microstrains might be caused by oxygen
347
Volume 98 Number 3 May-June 1993
Journal of Research of the National Institute of Standards and Technology
vacancies ordered along one direction in the a-b plane similar to effects found in YBa2Cu307-laquo However undoped La2Cu04 is not expected to have significant o^Qgen deficiency Other possibili- ties are lower ciystallographic symmetry andor La vacancies although they were not reported for this system but La deficiency was found in an La2Co04 compound [161]
We can conclude that lattice strains and incoher- ently diffracting domain sizes confirm high an- isotropy in these materials This simple approach however does not allow unambiguous identifica- tion of the strains origin Probably the strains originate from dislocations and from different sizes of host and dopant ions Domain sizes of all com- pounds are larger in the c-direction than in the a-6 plane This indicates existence of stacking faults and twins However because estimated errors are relatively large and only three materials were stud- ied the possible connection between stacking faults and 7c needs further study
62 Bi-Cu-O Superconductors
Among the high-Tc superconductors the Bi- Cu-O compounds appear intriguing especially because their incommensurate structure modula- tion remains incompletely understood [162 163] The crystal structure consists of perovskite-like SrO-(Cu02Ca)mi-Cu02-SrO layers separated by NaCl-like BiO double layers (see Fig 23 [164]) The number m of Cu02 layers alters the supercon- ducting transition temperature Tc (for m = 12 and 3 rclaquo10 90 and 110 K respectively) This two- dimensional layered structure makes these materi- als highly anisotropic and favours the creation of defects
Bulk sintered specimens showed relatively weak peak broadening Moreover the diffraction pat- terns contained many overlapping peaks because the compound crystallizes in an orthorhombic low- symmetry space group A2aa [165] and incommen- surate modulation gives superlattice reflections All patterns revealed a strong [001] texture (Fig 24) making reflections other than (001) difficult to ana- lyze The lattice parameters vary depending on the exact compound stoichiometry and processing his- tory but characteristically they have almost identi- cal a and b parameters and large c parameter fl =54095 A 6=54202 A c =309297 A for Bi2Sr2CaCu208 (Bi-2212 [166] and A =5392 A b =5395 A c =36985 A for (BiPb)2Sr2Ca2Cu30io (BiPb-2223) [165] Thus we treated (hOO) and (0^0) reflections as single peaks Table 10 gives the
results for three specimens Bi-2212 (BiPb)2 (SrMg)2(BaCa)2Cu30io (BiPbMgBa-2223) which were one-phase specimens and BiPb-2223 con- taining approximately equal amounts of 2212 and 2223 phases The in-plane lattice parameters of 2212 and 2223 phases differ little hence only the [00] directions of the mixed-phase specimen were evaluated
b^ (c)
Fig 23 Average crystal structure of Bi2Sr2Cam-iCum04+2m for (a) m = 1 (b) w =2 (c) m =3 [164]
35
-35
42 44 46 48 50 52 54 56 58 60 62 26 (deg)
^ ^^^MK^Aa^Ndllaquop
Fig 24 Part of BiPbMgBa-2223 refined pattern There are 48 fundamental reflections in this region
Interpretation of the results in the case of these complicated compounds must be considered care- fully Microstrains are probably caused by disloca- tion arrays However substitution of different-sized ions and vacancies would also contribute to the strains as would other kinds of disorder especially
348
Volume 98 Number 3 May-June 1993
Journal of Research of the National Institute of Standards and Technology
Table 10 Results of line-btoadening analysis for Bi-Cu-O supreconductors
Specimen Phase hkl (A)
eD)sa)y^
Bi-2212 2212 008 0012
0163(8) 022(3)
001(6) 005(6)
420(80) 00021(6)
020+200 0104(4) ltio-^ 580(30) 00007(1) 040+400 018(2) 00004(6300)
BiPbMgBa-2223 7773 0010 0020
0097(1) 021(2)
00002(1700) 0007(150)
770(60) 00012(1)
020 + 200 012(27) 013(10) 380(430) 00009(71) 040 + 400 015(95) 021(33)
BiPb-73 2212 008 0012
023(2) 025(5)
0002(350) 0001(1000)
220(30) 00013(26)
2223 0010 0020
022(8) 023(99)
0092(67) 018(47)
230(190) 00012(197)
Stacking faults and twins Table 10 shows larger strains in the [001] direction that in the basal plane This can be explained by stacking disorder along the c-axis which was frequently observed in electron-diffraction patterns as streaking [167 168] Easy incorporation of stacking faults is possi- ble because of the two-dimensional weak-bonded layers (BiO double layers are spaced about 3 A apart) The difference in microstrain between in- plane and the c-direction is much smaller for the BiPbMgBa-2223 phase probably because Pb low- ers the faulting by stabilizing the higher-Tc 2223 phase [167] For the BiPb-2223 specimen with two phases there are two possibilities Either the speci- men consists mainly of a mk of two kinds of one- phase grains or both phases occur within the same grains The second possibility was confirmed exper- imentally [169 170] and our results concur be- cause microstrain in the 2212 phase is much smaller than in the one-phase Bi-2212 specimen Processing conditions and cation content probably favour development of the macroscopic inter- growth of both phases within the grains that is microscopic defects grow to sufficiently large re- gions to give a diffraction pattern of another phase with the different number of Cu02 layers As a re- sult strain is relieved and both strains and domain sizes being quite different in one-phase specimens tend to equalize
For the Bi-Cu-O specimens the mean surface- weighted domain sizes are generally smaller than for (La-M)2Cu04 compounds Therefore the com- putation of the stacking- and twin-fault probabili- ties by using Eq (75) may be wrong It would be very instructive to compare the different broaden-
ing of satellite and fundamental reflections which indicates a more pronounced stacking disorder in the modulated structure [171]
In summary we found that for both Bi-2212 and BiPbMgBa-2223 superconductors the c-axis strain exceeds the in-plane strain The BiPb-2223 specimen containing both 2212 and 2223 phases within the single grains shows smaller incoherently diffracting domains and lower c-axis strain than the one-phase specimens This fact may direct us to- ward the mechanism of the second-phase forma- tion in these materials
63 Remarks
It was shown that this particular method of the line-broadening analysis can give information about the size of incoherently diffracting domains and lattice strains in (La-M)2Cu04 and Bi-Clu-O superconductors Moreover results show high an- isotropy of both size and strain parameters as one may expect because of the layered structure of all superconducting cuprates Generally structural line broadening is not large that is a result of rela- tively large domain sizes (200-2000 A) and small strains (002-02) It is interesting to compare these values with the published results for YBa2Cu307-laquo (isotropic strains of 023 [77] and 005-03 [82]) Although the different materi- als were studied they seem too large especially be- cause they are the average of strains in different directions
The main drawback of the line-broadening the- ory is the uncertainty about the origins of the line broadening that is it is difficult to distinguish the main effects responsible for the broadening For
349
Volume 98 Number 3 May-June 1993
Journal of Research of the National Institute of Standards and Technology
the novel superconductors particularly the numer- ous defects (substitutions vacancies stacking faults dislocations and similar) can occur simulta- neously which makes it very difficult to determine their individual contributions Furthermore the crystal structures of most novel superconductors are relatively complicated The average structure has mostly a slightly distorted tetragonal symmetry very similar a and b lattice parameters and a large c parameter but c=36 for YBa2Cu307-laquo for in- stance This results in a large number of overlap- ping peaks and consequently in large errors of all results This showed especially in the case of Bi-Cu-O superconductors (see Table 10) Follow- ing the discussion of reliability of profile fitting in Sec 54 it would be desirable to include more than two reflections in the analysis of broadening but higher-order peaks are usually too weak and over- lapped One way to partially solve this problem would be a whole pattern fitting [172 173] and Rietveld structure refinement [23] in terms of size and strain parameters This requires an accurate preset function to model specimen broadening and precise definition of angular dependence of size and strain parameters The Rietveld programs that model the line broadening in terms of size and strain parameters are based either on the simpli- fied integral-breadth methods [78 95] or on the single-line method [174]
7 Conclusions
A method for analyzing the pure-specimen (structural) broadening of x-ray diffraction line profiles is proposed By modeling the specimen size and strain broadenings with the simple Voigt func- tion it is possible to obtain domain sizes and strains that agree with experiment and show a logi- cal interrelationship Furthermore some common consequences and problems in the Fourier-method analysis follow easily The specimen function is convoluted with the instrumental function to match the observed x-ray diffraction-line profile This avoids the Stokes deconvolution method thus al- lowing analysis of patterns with highly overlapping peaks and weak structural broadening Therefore the method was applied to some novel high-Tc superconductors We reached the following conclu- sions
(i) Surface-weighted domain size depends only on the Cauchy integral breadth of the size-broad- ened profile
(ii) The hook effect occurs when the Cauchy-content of the size-broadened profile is un-
derestimated that is for ^sc(n2)^3sG Usually this happens when the background is estimated too high so the long tails of the Cauchy function are prematurely cut off
(iii) It also follows from conclusion (ii) that the volume-weighted domain size can not be more than twice the surface-weighted domain size (limiting value D)v=2D)i is obtained for the pure-Cauchy size-broadened profile) Minimum value for D)J (D)j should not be less than -131
(iv) If the distortion coefficient is approxi- mated with a harmonic term this leads exactly to the Warren-Averbach method of separation of size and strain broadenings
(v) In that case mean-square strains decrease linearly with the distance L
(vi) It is possible to evaluate local strain ((e^(0))^) only in the case of pure-Gauss strain broadening Then root-mean-square strain is inde- pendent of the distance L and related to the upper limit of strain obtained from the integral breadth of the strain-broadened profile
(vii) If strain broadening is not described exclu- sively with the Gauss function the multiple-line Voigt integral breadth and Warren-Averbach analyses can not give the same results for volume- weighted domain size although D)v is defined identically in both approaches because the appar- ent strain -q = pdeg(29)cot9 is not angular- independent
(viii) Smooth size coefficients give column- length distribution functions without oscillations and make possible a computation of volume- weighted average domain sizes up to ~5000 A
(ix) Comparison with the simplified integral- breadth methods in most cases has shown not large but systematic discrepancy of results indicat- ing that size and strain broadening can not be accu- rately modeled by a single Cauchy or Gauss function Moreover the application of the single- line method is much less reliable and it should not be used where multiple reflections are available
(x) The knowledge of all phases present in the sample and their crystallographic structure is re- quired to successfully fit a cluster of overlapping peaks Although it is very difficult to accurately de- termine the Cauchy-Gauss ratio of an overlapped peak final results of domain size and strain are much less affected Therefore connecting the crys- tallite size exclusively with the Cauchy content and strain with the Gauss content of a specimen profile might be doubtful
(xi) Evaluated errors of domain sizes and strains increase substantially with the degree of
350
Volume 98 Number 3 May-June 1993
Journal of Research of the National Institute of Standards and Technology
peak overlapping Hence for complicated patterns very accurate measurements are necessary and one needs to analyze as many reflections in the same crystallographic direction as possible
(xii) Line-broadening analysis of (La-M)2Cu04 and Bi-Cu-O compounds confirms high anisotropy in these materials
(xiii) Strains in (La-M)2Cu04 probably origi- nate from dislocations and from different sizes of host and dopant ions
(xiv) Stacking-fault probability in (La-M)2Cu04 (M = Ba Ca Sr) increases with increasing Tc whereas the average strain decreases
(xv) In La2Cu04 different broadening of (lOO) and (OfcO) reflections is not caused by stacking faults
(xvi) All Bi-Cu-0 superconductors show larger strain in the c-direction than in the a-b plane which can be explained by stacking disorder along the [001] direction
(xvii) In the specimen with approximately equal amounts of Tl-2212 and TlPb-2223 phases it is likely that a secondary phase develops by the growth of the microscopic faulted regions of the primary phase
Acknowledgments
I am thankful to Dr Harry McHenry for his support and especially to Dr Hassel Ledbetter for his wise guidance and most useful help during my stay at NIST I am also indebted to my home insti- tution the Faculty of Metallurgy of the University of Zagreb for allowing me the leave of absence at NIST
8 References
[1] W Friedrich P Knipping and M v Laue Ann Physik 41 971 (1912)
[2] H M Rietveld Acta Cryst 22 151 (1967) [3] H M Rietveld J Appl Cryst 2 65 (1969) [4] S A Howard and K D Preston in Modern Powder Dif-
fraction Vol 20 The Mineralogical Society of America Washington DC (1989) p 217
[5] D Taupin J Appl Cryst 6 266 (1973) [6] T C Huang and W Parrish Appl Phys Lett 27 123
(1975) [7] M K Wu J R Ashburn C J Torng P H Hor R L
Meng L Gao Z J Hwang Y Q Wang and C W Chu Phys Rev Lett 58 908 (1987)
[8] D Shi MRS Bull 16 37 (1991) [9] D Larbalestier Phys Today 44 74 (1991)
[10] J C Phillips Phys Rev B 4512647 (1992) [11] B Raveau Phys Today 45 53 (1992) [12] A J Millis and K M Rabe Phys Rev B 38 8908 (1988)
[13] F Guinea Europhys Lett 7 549 (1988) [14] C P Dhard and P Singh in Proc Int Symp High-Temp
Supercond Jaipur India Oxford amp IBH Publishing New Delhi (1988) p 271
[15] J D Jorgensen Phys Today 44 34 (1991) [16] J G Bednorz and K A Muller Z Phys B 64 189
(1986) [17] K Kishio K Kitazawa S Kaube I Yasuda N Sugii H
Takagi S Uchida K Fueki and S Tanaka Chem Lett 429 (1987)
[18] J D Jorgensen B Dabrowski S Pei D G Hinks L Soderholm B Morosin J E Venturini and D S Ginley Phys Rev B 38 11337 (1988)
[19] J R Clem Phys Rev B 43 7837 (1991) [20] M Paranthaman M Foldejiki D Balzar H Ledbetter
A J Nelson and A M Hermann submitted to Phys Rev B
[21] A R Stokes Proc Phys Soc Lond 61 382 (1948) [22] B E Warren and B L Averbach J Appl Phys 23 497
(1952) [23] R Delhez Th H de Keijser and E J Mittemeijer in
Accuracy in Powder Diffraction S Block and C R Hub- bard eds Natl Bur Stand (US) Special Publication 567 (1980) p 213
[24] H P Klug and L E Alexander X-ray Diffraction Proce- dures 2nd Edition John Wiley New York (1974) p 661
[25] J I Langford J Appl Ciyst 11 10 (1978) [26] J I Langford in Accuracy in Powder Diffraction S
Block and C R Hubbard eds Natl Bur Stand (US) Special Pubication 567 (1950) p 255
[27] R Delhez Th H de Keijser and E J Mittemeijer Fre- senius Z Anal Chem 312 1 (1982)
[28] A J C Wilson Proc Phys Soc Lond 80 286 (1962) [29] A J C Wilson Proc Phys Soc Lond 81 41 (1963) [30] L P Smith Phys Rev 46 343 (1934) [31] H C Burger and P H van Cittert Z Phys 79 722
(1932) [32] S Ergun J Appl Ciyst 1 19 (1968) [33] R Croche and L Gatineau J Appl Ciyst 10479 (1977) [34] L H Schwarz and J B Cohen Diffraction from Materi-
als Academic Press New York (1977) p 391 [35] R Delhez Th H de Keijser E J Mittemeijer and J I
Langford J Appl Cryst 19 459 (1986) [36] R Delhez Th H de Keijser E J Mittemeijer and J I
Langford Aust J Phys 41 213 (1988) [37] R A Young and D B Wiles J Appl Cryst 15 430
(1982) [38] W Voigt Stizungsber K Bayer Akad Wiss 42 603
(1912) [39] E E Whiting J Quant Spectrosc Radiat Transfer 8
1379 (1968) [40] G K Wertheim M A Butler K W West and D N E
Buchanan Rev Sci Instrum 111369 (1974) [41] M M Hall Jr V G Veeraraghavan H Rubin and P G
Winchell J Appl Cryst 10 66 (1977) [42] A Brown and J W Edmonds Adv X-Ray Anal 23 361
(1980) [43] P Suortti M Ahtee L Unonius J Appl Cryst 12 365
(1979) [44] T Sundius J Raman Spectrosc 1 471 (1973) [45] B H Armstrong J Quant Spectrosc Radiat Transfer 7
61 (1967) [46] J F Kielkopf J Opt Soc Am 63 987 (1973) [47] B P Asthana and W Kiefer Appl Spectr 36 250
(1982)
351
Volume 98 Number 3 May-June 1993
Journal of Research of the National Institute of Standards and Technology
[48] J P M de Vreede S C Mehrotra A Tal and H A Dijkerraan Appl Spectr 36 227 (1982)
[49] F R L Schoening Ada Ciyst 18 975 (1965) [50] P Scherrer Gott Nachr 2 98 (1918) [51] A R Stokes and A J C Wilson Proc Cambridge
Philos Soc 38 313 (1942) [52] A J C Wilson X-Ray Optics 2nd edition Methuen
London (1962) [53] S Leie and T R Anantharaman Proc Indian Acad
Sci Sect A H 261 (1966) [54] D Louer D Weigel and J I Langford J Appl Ciyst
5 353 (1972) [55] A J C Wilson J Appl Ciyst 2 181 (1969) [56] J I Langford and A J C Wilson J Appl Ciyst 11102
(1978) [57] A R Stokes and A J C Wilson Proc Phys Soc Lond
56174 (1944) [58] B E Warren and B L Averbach J Appl Phys 21 595
(1950) [59] B E Warren X-Ray Diffraction Addison-Wesley
Reading Massachusetts (1969) p 264 [60] B E Warren in Progress in Metal Physics Vol 8 Perg-
amon Press London (1959) p 146 [61] F Bertaut C R Acad Sci Paris 228 187 (1949) [62] N C Haider and C N J Wagner Acta Cryst 20 312
(1966) [63] D Balzar and H Ledbetter in Proceedings of the Accu-
racy in Powder Diffraction II Natl Inst Stand Technol (1992) p 37
[64] D Balzar and H Ledbeter J Appl Cryst 26 (1993) in press
[65] J N Eastabrook and A J C Wilson Proc Phys Soc Lond B 65 67 (1952)
[66] R S Smith IBM J Res Develop 4 205 (1960) [67] B Y Pines and A F Sirenko Soviet Physics Ciyst 715
(1962) [68] G B Mitra and N K Misra Acta Ciyst 22 454 (1967) [69] A Gangulee J Appl Ciyst 7 434 (1974) [70] J Mignot D Rondot Acta Met 231321 (1975) [71] J Mignot and D Rondot Acta Ciyst A 33 327 (1977) [72] R K Nandi H K Kuo W Schlosberg G Wissler J B
Cohen and B Crist Jr J Appl Ciyst 17 22 (1984) [73] M Zocchi Acta Ciyst A 36164 (1980) [74] P Ramarao and T R Anantharaman Trans Ind Ins
Metals 18 181 (1965) [75] R K Nandi and S P Sen Gupta J App Cryst 11 6
(1978) [76] Th H de Keijser J I Langford E J Mittemeijer and
B P Vogels J Appl Ciyst IS 308 (1982) [77] A Williams G H Kwei R B Von Dreele A C Lar-
son L D Raistrick and D L Bish Phys Rev B 37 7960 (1988)
[78] A C Larson and R B Von Dreele Los Alamos Na- tional Laboratory Report No LA-UR-86-748 (1988)
[79] J D Jorgensen D H Johnson M H Mueller J G Worlton and R B Von Dreele in Proceedings of the Conference on Diffraction Profile Analysis Cracow Poland (1978) p 20
[80] R B Von Dreele J D Jorgensen and C G Windsor J Appl Ciyst 15 581 (1982)
[81] P Thompson D E Cox and J B Hastings J Appl Ciyst 20 79 (1987)
[82] J P Singh R A Guttschow D S Kupperman J T Dusek and R B Poeppel in High Temperature Super-
conducting Compounds III S Whang A Gupta and E Ceilings eds TMS AIME Warrendale (1991) p 281
[83] M O Eatough D S Glnley and B Morosin Adv X- Ray Anal 33 145 (1990)
[84] E J Peterson P J Kung R E Muenchausen and D M Smith in Proceedings of the 41st Annual Denver Conference on Applications of X-Ray Analysis Colo- rado Springs Colorado (1992) p 74
[85] M Rand J I Langford and J S Abell submitted to J Cryogenics (1992)
[86] D Balzar J Appl Ciyst 25 559 (1992) [87] D Balzar H Ledbetter and A Roshko Physica C 185-
189 871 (1991) [88] D Balzar and H Ledbetter J Mater Sci Lett 111419
(1992) [89] D Balzar H Ledbetter and A Roshko Pow Diffr 8
(1993) in press [90] S Johnson M Gusraan D Rowcliffe T Geballe and J
Sun Adv Ceram Mater 2 337 (1987) [91] H Ledbetter S A Kim R B Goldfarb and K Togano
Phys Rev B 39 9689 (1989) [92] H Friedman Electronics 132 (1945) [93] W Parrish (ed) in Advances in X-Ray Diffractometry
and X-Ray Spectrography Centrex Publishing Company Eindhoven The Netheriands (1962)
[94] W Soller Phys Rev 24158 (1924) [95] S A Howard R L Snyder J Appl Ciyst 22 238
(1989) [96] G H Stout and L H Jensen X-Ray Structure Determi-
nation 2nd edition Wiley New York (1989) p 373 [97] D E Appleman and T Evans Jr Final Report 92-14
US Geological Survey Washington DC (1973) Avail- able as NTIS Document No PB-216188
[98] M U Cohen Rev Sci Instrum 6 68 (1935) [99] M U Cohen Rev Sci Instrum 7 155 (1936) [100] M H Mueller L Heaton and K T Miller Acta Ciyst
13 828 (1960) [101] R A Young P E Mackie and R B Von Dreele J
Appl Ciyst 10 262 (1977) [102] D B Wiles and R A Young J Appl Cryst 14 149
(1981) [103] J K Yau and S A Howard J Appl Ciyst 22 244
(1989) [104] S A Howard J K Yau and H U Anderson J Appl
Phys 65 1492 (1989) [105] S Enzo G Fagherazzi A Benedetti and S Poilizzi J
Appl Ciyst 21 536 (1988) [106] A Benedetti G Fagherazzi S Enzo and M
Battagliarin J Appl Cryst 21 543 (1988) [107] Th H de Keijser E J Mittemeijer and H C F Rozen-
daal J Appl Ciyst 16 309 (1983) [108] Y Zhang J M Stewart C R Hubbard and B Mo-
rosin Adv X-Ray Anal 33 373 (1990) [109] Y Wang S Lee and Y Ue J Appl Ciyst IS 35
(1982) [110] V N Selivanov and E F Smislov Zavod Lab 57 28
(1991) [Ill] A Guinier X-Ray Diffraction W H Freeman San
Francisco (1963) p 139 [112] M Wilkens J Appl Cryst 12119 (1979) [113] D Du and Y Wang Pow Diffr 2180 (1987) [114] A P Prudnikov Yu A Brychkov and O L Marichev
Integrals and Series Vol 1 Gordon and Breach Am- sterdam The Netheriands (1986) p 344
352
Volume 98 Number 3 May-June 1993
Journal of Research of the National Institute of Standards and Technology
[115] R L Rothman and J B Cohen J Appl Phys 42 971 (1971)
[116] T Adier and C R Houska J Appl Phys 50 3282 (1979)
[117] C R Houska and T M Smith J Appl Phys 52 748 (1981)
[118] S Rao and C R Houska Acta Ciyst A 4214 (1986) [119] J I Langford R Delhez Th H de Keijser and E J
Mittemeijer Ausi J Phys 41173 (1988) [120] J I Langfoid J Appl Cryst IS 315 (1982) [121] M J Turunen Th H de Keijser R Delhez and N M
van der Pers J Appl Ciyst 16176 (1983) [122] A J C Wilson Acta Ciyst 23 888 (1967) [123] A J C Wilson Acta Ciyst A 24 478 (1968) [124] A J C Wilson Acta Ciyst A 25 584 (1969) [125] G Gagliotti A Paoletti and F P Ricci Nucl Instrum
3 223 (1958) [126] J I Langford R J Cernik and D Louer J Appl
Ciyst 24 913 (1991) [127] J I Langford in Accuracy in Powder Diffraction II
preprint [128] A J C Wilson Mathematical Theory of X-Ray Powder
Diffractometiy Centrex Eindhoven The Netherlands (1963)
[129] J L Langford Prog Ciyst Growth and Charact 14185 (1987)
[130] T G Fawcett C E Crowder S J Brownell Y Zhang C R Hubbard W Schreiner G P Hamill T C Huang E Sabino J I Langford R Hamilton and D Louer Pow Diffr 3 209 (1988)
[131] W L Smith J Appl Ciyst 9187 (1976) [132] J L Langford and D Louer J Appl Ciyst 15 20
(1982) [133] Fl Popescu and L Benes Acta Ciyst A 33 323 (1977) [134] P PSuse^cu R MSnaila M Popescu and E Jijovici j
Appl Cryst 7 281 (1974) [135] P F Bley Y Calvayrac and M Fayard J Appl Ciyst
7 493 (1974) [136] B Moraweck Ph de Montgolfier and A J Renouprez
J Appl Ciyst 10191 (1977) [137] A Le Bail and D Louer J Appl Cryst 11 50 (1978) [138] D R Buchanan R L McCuUough and R L Miller
Acta Ciyst 20 922 (1966) [139] P Suortti and L D Jennings Acta Cryst A 33 1012
(1977) [140] J B Cohen and C N J Wagner J Appl Phys 33 2073
(1962) [141] A Bianconi J Budnick A M Flank A Fontaine P
Lagarde A Marcelli H Tolentino B Chamberland C Michel B Raveau and G Demazeau Phys Lett A127 285 (1988)
[142] K Fueki K Kitazawa K Kishio T Hasegawa S Uchida H Takagi and S Tanaka in Chemistiy of High- Temperature Superconductors D L Nelson M S Whittingham and T F George eds American Chemi- cal Society (1987) p 38
[143] T Fujita Y Aoki Y Maeno J Sakurai H Fukuba and H Fujii J Appl Phys 26 U68 (1987)
[144] R M Hazen in Physical Properties of High-rc Super- conductors Vol 2 D M Ginsberg ed World Scien- tific Singapore (1990) p 121
[145] J B Torrance A Bezinge A I Nazzal T C Huang S P Parkin D T Keane S J LaPlaca P M Horn and G A Held Phys Rev B 40 8872 (1989)
[146] J D Axe A H Moudden D Hohlwein D E Cox K
M Mohanty A R Moodenbaugh and Y Xu Phys Rev Lett 62 2751 (1989)
[147] T Suzuki and T Fujita Physica C 159 111 (1989) [148] T Fujita and Y Maeno in Superconducting Materials
JJAP Series 1 (1988) p 34 [149] A Roshko and Y-M Chiang J Appl Phys 66 3710
(1989) [150] D E Cox S C Moss R L Meng P H Hor and C W
Chu J Mater Res 31327 (1988) [151] B Crist and J B Cohen J Polym Sci 17 1001 (1979) [152] H Ledbetter S Kim and A Roshko Z Phys B 89275
(1992) [153] R D Shannon and C T Prewitt Acta Ciyst B 25 925
(1969) [154] M Lang H Spille F Steglich Y Hidaka T Murakami
and Y Endoh Physica C 162-1641037 (1989) [155] Y Hidaka and T Murakami Phase trans 15 241
(1989) [156] P L Gai and E M McCarron Science 247 553 (1990) [157] T Kamiyama I Izumi H Asano H Takagi S Uchida
Y Tokura E Takayama-Muromachi M Matsuda K Yamada Y Endoh and Y Hidaka Physica C 172 120 (1990)
[158] A Kapitulnik Physica C 153-155 520 (1988) [159] L A Muradyan V N Molchanov R A Tamazyan and
V I Simonov Physica C 162-164 536 (1989) [160] P Day M Rosseinsky K Prassides W I F David O
Moze and A Soper J Phys C 20 L429 (1987) [161] J T Lewandowski R A Beyerlein J M Longo and R
A McCauley J Amer Ceram Soc 69 699 (1986) [162] R Ramesh G van Tendeloo G Thomas S M Green
Y Mei C Jiang and H L Luo Appl Phys Lett 53 2220 (1988)
[163] J Schneck L Pierre J C Tolddano and C Daguet Phys Rev B 39 9624 (1989)
[164] O Eibl Physica C 168 215 (1990) [165] W Carrilo-Cabrera and W Gopel Physica C 161 373
(1989) [166] P Bordet J J Capponi C Chaillout J Chenavas A
W Hewat E A Hewat J L Hodeau M Marezio J L Tholence and D Tranqui Physica C 156189 (1988)
[167] R Ramesh K Remschnig J M Tarascon and S M Green J Mater Res 6 278 (1991)
[168] Z Hiroi Y Ikeda M Takano and Y Bando J Mater Res 6 435 (1991)
[169] Y Inoue M Hasegawa Y Shichi I Munakata M Ya- manaka S Hiyama and O Nittono J Mater Res 5 737 (1990)
[170] R Ramesh B G Bagley J M Tarascon S M Green M L Rudee and H L Luo J Appl Phys 67 379 (1990)
[171] X B Kan J Kulik P C Chow S C Moss Y F Yan J H Wang and Z X Zhao J Mater Res 5 731 (1990)
[172] G S Pawley J Appl Ciyst 13 630 (1980) [173] H Toraya J Appl Ciyst 19 440 (1986) [174] L Lutterotti and P Scardi J Appl Ciyst 23 246
(1990)
About the author Davor Balzar is with Faculty of Metallurgy of the University of Zagreb Sisak Croatia and was a Guest Researcher at fflST The National Institute of Standards and Technology is an agency of the Technology Administration US Department of Commerce
353
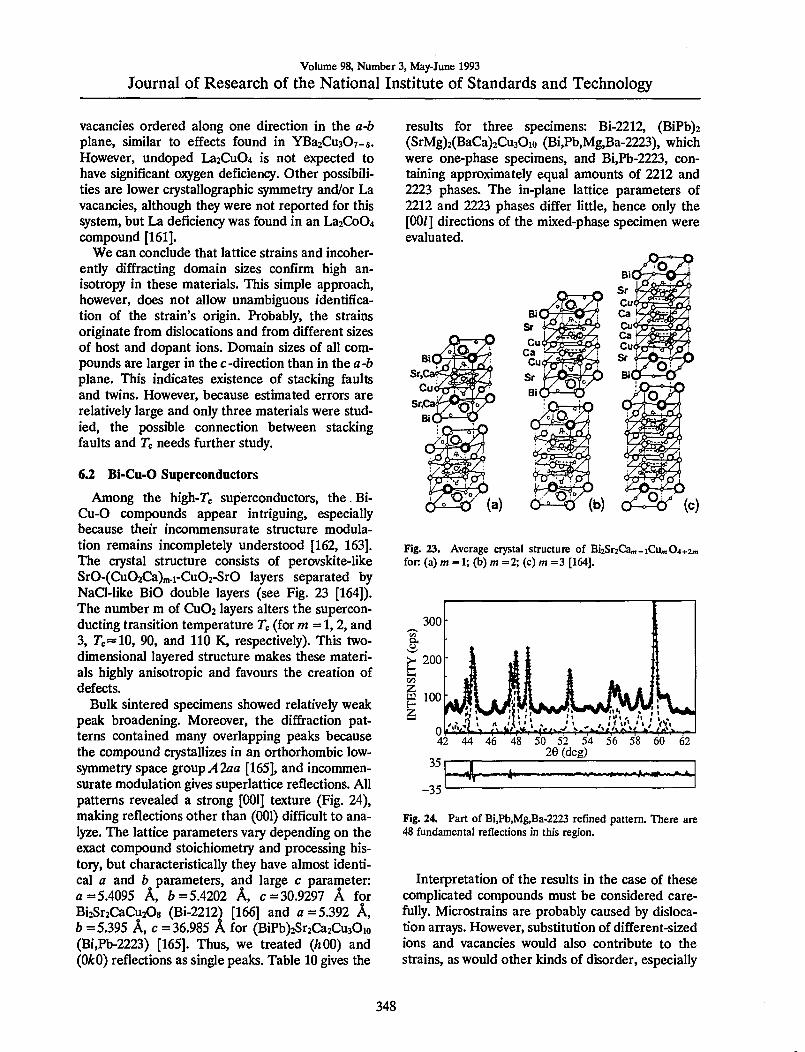
Volume 98 Number 3 May-June 1993
Journal of Research of the National Institute of Standards and Technology
vacancies ordered along one direction in the a-b plane similar to effects found in YBa2Cu307-laquo However undoped La2Cu04 is not expected to have significant o^Qgen deficiency Other possibili- ties are lower ciystallographic symmetry andor La vacancies although they were not reported for this system but La deficiency was found in an La2Co04 compound [161]
We can conclude that lattice strains and incoher- ently diffracting domain sizes confirm high an- isotropy in these materials This simple approach however does not allow unambiguous identifica- tion of the strains origin Probably the strains originate from dislocations and from different sizes of host and dopant ions Domain sizes of all com- pounds are larger in the c-direction than in the a-6 plane This indicates existence of stacking faults and twins However because estimated errors are relatively large and only three materials were stud- ied the possible connection between stacking faults and 7c needs further study
62 Bi-Cu-O Superconductors
Among the high-Tc superconductors the Bi- Cu-O compounds appear intriguing especially because their incommensurate structure modula- tion remains incompletely understood [162 163] The crystal structure consists of perovskite-like SrO-(Cu02Ca)mi-Cu02-SrO layers separated by NaCl-like BiO double layers (see Fig 23 [164]) The number m of Cu02 layers alters the supercon- ducting transition temperature Tc (for m = 12 and 3 rclaquo10 90 and 110 K respectively) This two- dimensional layered structure makes these materi- als highly anisotropic and favours the creation of defects
Bulk sintered specimens showed relatively weak peak broadening Moreover the diffraction pat- terns contained many overlapping peaks because the compound crystallizes in an orthorhombic low- symmetry space group A2aa [165] and incommen- surate modulation gives superlattice reflections All patterns revealed a strong [001] texture (Fig 24) making reflections other than (001) difficult to ana- lyze The lattice parameters vary depending on the exact compound stoichiometry and processing his- tory but characteristically they have almost identi- cal a and b parameters and large c parameter fl =54095 A 6=54202 A c =309297 A for Bi2Sr2CaCu208 (Bi-2212 [166] and A =5392 A b =5395 A c =36985 A for (BiPb)2Sr2Ca2Cu30io (BiPb-2223) [165] Thus we treated (hOO) and (0^0) reflections as single peaks Table 10 gives the
results for three specimens Bi-2212 (BiPb)2 (SrMg)2(BaCa)2Cu30io (BiPbMgBa-2223) which were one-phase specimens and BiPb-2223 con- taining approximately equal amounts of 2212 and 2223 phases The in-plane lattice parameters of 2212 and 2223 phases differ little hence only the [00] directions of the mixed-phase specimen were evaluated
b^ (c)
Fig 23 Average crystal structure of Bi2Sr2Cam-iCum04+2m for (a) m = 1 (b) w =2 (c) m =3 [164]
35
-35
42 44 46 48 50 52 54 56 58 60 62 26 (deg)
^ ^^^MK^Aa^Ndllaquop
Fig 24 Part of BiPbMgBa-2223 refined pattern There are 48 fundamental reflections in this region
Interpretation of the results in the case of these complicated compounds must be considered care- fully Microstrains are probably caused by disloca- tion arrays However substitution of different-sized ions and vacancies would also contribute to the strains as would other kinds of disorder especially
348
Volume 98 Number 3 May-June 1993
Journal of Research of the National Institute of Standards and Technology
Table 10 Results of line-btoadening analysis for Bi-Cu-O supreconductors
Specimen Phase hkl (A)
eD)sa)y^
Bi-2212 2212 008 0012
0163(8) 022(3)
001(6) 005(6)
420(80) 00021(6)
020+200 0104(4) ltio-^ 580(30) 00007(1) 040+400 018(2) 00004(6300)
BiPbMgBa-2223 7773 0010 0020
0097(1) 021(2)
00002(1700) 0007(150)
770(60) 00012(1)
020 + 200 012(27) 013(10) 380(430) 00009(71) 040 + 400 015(95) 021(33)
BiPb-73 2212 008 0012
023(2) 025(5)
0002(350) 0001(1000)
220(30) 00013(26)
2223 0010 0020
022(8) 023(99)
0092(67) 018(47)
230(190) 00012(197)
Stacking faults and twins Table 10 shows larger strains in the [001] direction that in the basal plane This can be explained by stacking disorder along the c-axis which was frequently observed in electron-diffraction patterns as streaking [167 168] Easy incorporation of stacking faults is possi- ble because of the two-dimensional weak-bonded layers (BiO double layers are spaced about 3 A apart) The difference in microstrain between in- plane and the c-direction is much smaller for the BiPbMgBa-2223 phase probably because Pb low- ers the faulting by stabilizing the higher-Tc 2223 phase [167] For the BiPb-2223 specimen with two phases there are two possibilities Either the speci- men consists mainly of a mk of two kinds of one- phase grains or both phases occur within the same grains The second possibility was confirmed exper- imentally [169 170] and our results concur be- cause microstrain in the 2212 phase is much smaller than in the one-phase Bi-2212 specimen Processing conditions and cation content probably favour development of the macroscopic inter- growth of both phases within the grains that is microscopic defects grow to sufficiently large re- gions to give a diffraction pattern of another phase with the different number of Cu02 layers As a re- sult strain is relieved and both strains and domain sizes being quite different in one-phase specimens tend to equalize
For the Bi-Cu-O specimens the mean surface- weighted domain sizes are generally smaller than for (La-M)2Cu04 compounds Therefore the com- putation of the stacking- and twin-fault probabili- ties by using Eq (75) may be wrong It would be very instructive to compare the different broaden-
ing of satellite and fundamental reflections which indicates a more pronounced stacking disorder in the modulated structure [171]
In summary we found that for both Bi-2212 and BiPbMgBa-2223 superconductors the c-axis strain exceeds the in-plane strain The BiPb-2223 specimen containing both 2212 and 2223 phases within the single grains shows smaller incoherently diffracting domains and lower c-axis strain than the one-phase specimens This fact may direct us to- ward the mechanism of the second-phase forma- tion in these materials
63 Remarks
It was shown that this particular method of the line-broadening analysis can give information about the size of incoherently diffracting domains and lattice strains in (La-M)2Cu04 and Bi-Clu-O superconductors Moreover results show high an- isotropy of both size and strain parameters as one may expect because of the layered structure of all superconducting cuprates Generally structural line broadening is not large that is a result of rela- tively large domain sizes (200-2000 A) and small strains (002-02) It is interesting to compare these values with the published results for YBa2Cu307-laquo (isotropic strains of 023 [77] and 005-03 [82]) Although the different materi- als were studied they seem too large especially be- cause they are the average of strains in different directions
The main drawback of the line-broadening the- ory is the uncertainty about the origins of the line broadening that is it is difficult to distinguish the main effects responsible for the broadening For
349
Volume 98 Number 3 May-June 1993
Journal of Research of the National Institute of Standards and Technology
the novel superconductors particularly the numer- ous defects (substitutions vacancies stacking faults dislocations and similar) can occur simulta- neously which makes it very difficult to determine their individual contributions Furthermore the crystal structures of most novel superconductors are relatively complicated The average structure has mostly a slightly distorted tetragonal symmetry very similar a and b lattice parameters and a large c parameter but c=36 for YBa2Cu307-laquo for in- stance This results in a large number of overlap- ping peaks and consequently in large errors of all results This showed especially in the case of Bi-Cu-O superconductors (see Table 10) Follow- ing the discussion of reliability of profile fitting in Sec 54 it would be desirable to include more than two reflections in the analysis of broadening but higher-order peaks are usually too weak and over- lapped One way to partially solve this problem would be a whole pattern fitting [172 173] and Rietveld structure refinement [23] in terms of size and strain parameters This requires an accurate preset function to model specimen broadening and precise definition of angular dependence of size and strain parameters The Rietveld programs that model the line broadening in terms of size and strain parameters are based either on the simpli- fied integral-breadth methods [78 95] or on the single-line method [174]
7 Conclusions
A method for analyzing the pure-specimen (structural) broadening of x-ray diffraction line profiles is proposed By modeling the specimen size and strain broadenings with the simple Voigt func- tion it is possible to obtain domain sizes and strains that agree with experiment and show a logi- cal interrelationship Furthermore some common consequences and problems in the Fourier-method analysis follow easily The specimen function is convoluted with the instrumental function to match the observed x-ray diffraction-line profile This avoids the Stokes deconvolution method thus al- lowing analysis of patterns with highly overlapping peaks and weak structural broadening Therefore the method was applied to some novel high-Tc superconductors We reached the following conclu- sions
(i) Surface-weighted domain size depends only on the Cauchy integral breadth of the size-broad- ened profile
(ii) The hook effect occurs when the Cauchy-content of the size-broadened profile is un-
derestimated that is for ^sc(n2)^3sG Usually this happens when the background is estimated too high so the long tails of the Cauchy function are prematurely cut off
(iii) It also follows from conclusion (ii) that the volume-weighted domain size can not be more than twice the surface-weighted domain size (limiting value D)v=2D)i is obtained for the pure-Cauchy size-broadened profile) Minimum value for D)J (D)j should not be less than -131
(iv) If the distortion coefficient is approxi- mated with a harmonic term this leads exactly to the Warren-Averbach method of separation of size and strain broadenings
(v) In that case mean-square strains decrease linearly with the distance L
(vi) It is possible to evaluate local strain ((e^(0))^) only in the case of pure-Gauss strain broadening Then root-mean-square strain is inde- pendent of the distance L and related to the upper limit of strain obtained from the integral breadth of the strain-broadened profile
(vii) If strain broadening is not described exclu- sively with the Gauss function the multiple-line Voigt integral breadth and Warren-Averbach analyses can not give the same results for volume- weighted domain size although D)v is defined identically in both approaches because the appar- ent strain -q = pdeg(29)cot9 is not angular- independent
(viii) Smooth size coefficients give column- length distribution functions without oscillations and make possible a computation of volume- weighted average domain sizes up to ~5000 A
(ix) Comparison with the simplified integral- breadth methods in most cases has shown not large but systematic discrepancy of results indicat- ing that size and strain broadening can not be accu- rately modeled by a single Cauchy or Gauss function Moreover the application of the single- line method is much less reliable and it should not be used where multiple reflections are available
(x) The knowledge of all phases present in the sample and their crystallographic structure is re- quired to successfully fit a cluster of overlapping peaks Although it is very difficult to accurately de- termine the Cauchy-Gauss ratio of an overlapped peak final results of domain size and strain are much less affected Therefore connecting the crys- tallite size exclusively with the Cauchy content and strain with the Gauss content of a specimen profile might be doubtful
(xi) Evaluated errors of domain sizes and strains increase substantially with the degree of
350
Volume 98 Number 3 May-June 1993
Journal of Research of the National Institute of Standards and Technology
peak overlapping Hence for complicated patterns very accurate measurements are necessary and one needs to analyze as many reflections in the same crystallographic direction as possible
(xii) Line-broadening analysis of (La-M)2Cu04 and Bi-Cu-O compounds confirms high anisotropy in these materials
(xiii) Strains in (La-M)2Cu04 probably origi- nate from dislocations and from different sizes of host and dopant ions
(xiv) Stacking-fault probability in (La-M)2Cu04 (M = Ba Ca Sr) increases with increasing Tc whereas the average strain decreases
(xv) In La2Cu04 different broadening of (lOO) and (OfcO) reflections is not caused by stacking faults
(xvi) All Bi-Cu-0 superconductors show larger strain in the c-direction than in the a-b plane which can be explained by stacking disorder along the [001] direction
(xvii) In the specimen with approximately equal amounts of Tl-2212 and TlPb-2223 phases it is likely that a secondary phase develops by the growth of the microscopic faulted regions of the primary phase
Acknowledgments
I am thankful to Dr Harry McHenry for his support and especially to Dr Hassel Ledbetter for his wise guidance and most useful help during my stay at NIST I am also indebted to my home insti- tution the Faculty of Metallurgy of the University of Zagreb for allowing me the leave of absence at NIST
8 References
[1] W Friedrich P Knipping and M v Laue Ann Physik 41 971 (1912)
[2] H M Rietveld Acta Cryst 22 151 (1967) [3] H M Rietveld J Appl Cryst 2 65 (1969) [4] S A Howard and K D Preston in Modern Powder Dif-
fraction Vol 20 The Mineralogical Society of America Washington DC (1989) p 217
[5] D Taupin J Appl Cryst 6 266 (1973) [6] T C Huang and W Parrish Appl Phys Lett 27 123
(1975) [7] M K Wu J R Ashburn C J Torng P H Hor R L
Meng L Gao Z J Hwang Y Q Wang and C W Chu Phys Rev Lett 58 908 (1987)
[8] D Shi MRS Bull 16 37 (1991) [9] D Larbalestier Phys Today 44 74 (1991)
[10] J C Phillips Phys Rev B 4512647 (1992) [11] B Raveau Phys Today 45 53 (1992) [12] A J Millis and K M Rabe Phys Rev B 38 8908 (1988)
[13] F Guinea Europhys Lett 7 549 (1988) [14] C P Dhard and P Singh in Proc Int Symp High-Temp
Supercond Jaipur India Oxford amp IBH Publishing New Delhi (1988) p 271
[15] J D Jorgensen Phys Today 44 34 (1991) [16] J G Bednorz and K A Muller Z Phys B 64 189
(1986) [17] K Kishio K Kitazawa S Kaube I Yasuda N Sugii H
Takagi S Uchida K Fueki and S Tanaka Chem Lett 429 (1987)
[18] J D Jorgensen B Dabrowski S Pei D G Hinks L Soderholm B Morosin J E Venturini and D S Ginley Phys Rev B 38 11337 (1988)
[19] J R Clem Phys Rev B 43 7837 (1991) [20] M Paranthaman M Foldejiki D Balzar H Ledbetter
A J Nelson and A M Hermann submitted to Phys Rev B
[21] A R Stokes Proc Phys Soc Lond 61 382 (1948) [22] B E Warren and B L Averbach J Appl Phys 23 497
(1952) [23] R Delhez Th H de Keijser and E J Mittemeijer in
Accuracy in Powder Diffraction S Block and C R Hub- bard eds Natl Bur Stand (US) Special Publication 567 (1980) p 213
[24] H P Klug and L E Alexander X-ray Diffraction Proce- dures 2nd Edition John Wiley New York (1974) p 661
[25] J I Langford J Appl Ciyst 11 10 (1978) [26] J I Langford in Accuracy in Powder Diffraction S
Block and C R Hubbard eds Natl Bur Stand (US) Special Pubication 567 (1950) p 255
[27] R Delhez Th H de Keijser and E J Mittemeijer Fre- senius Z Anal Chem 312 1 (1982)
[28] A J C Wilson Proc Phys Soc Lond 80 286 (1962) [29] A J C Wilson Proc Phys Soc Lond 81 41 (1963) [30] L P Smith Phys Rev 46 343 (1934) [31] H C Burger and P H van Cittert Z Phys 79 722
(1932) [32] S Ergun J Appl Ciyst 1 19 (1968) [33] R Croche and L Gatineau J Appl Ciyst 10479 (1977) [34] L H Schwarz and J B Cohen Diffraction from Materi-
als Academic Press New York (1977) p 391 [35] R Delhez Th H de Keijser E J Mittemeijer and J I
Langford J Appl Cryst 19 459 (1986) [36] R Delhez Th H de Keijser E J Mittemeijer and J I
Langford Aust J Phys 41 213 (1988) [37] R A Young and D B Wiles J Appl Cryst 15 430
(1982) [38] W Voigt Stizungsber K Bayer Akad Wiss 42 603
(1912) [39] E E Whiting J Quant Spectrosc Radiat Transfer 8
1379 (1968) [40] G K Wertheim M A Butler K W West and D N E
Buchanan Rev Sci Instrum 111369 (1974) [41] M M Hall Jr V G Veeraraghavan H Rubin and P G
Winchell J Appl Cryst 10 66 (1977) [42] A Brown and J W Edmonds Adv X-Ray Anal 23 361
(1980) [43] P Suortti M Ahtee L Unonius J Appl Cryst 12 365
(1979) [44] T Sundius J Raman Spectrosc 1 471 (1973) [45] B H Armstrong J Quant Spectrosc Radiat Transfer 7
61 (1967) [46] J F Kielkopf J Opt Soc Am 63 987 (1973) [47] B P Asthana and W Kiefer Appl Spectr 36 250
(1982)
351
Volume 98 Number 3 May-June 1993
Journal of Research of the National Institute of Standards and Technology
[48] J P M de Vreede S C Mehrotra A Tal and H A Dijkerraan Appl Spectr 36 227 (1982)
[49] F R L Schoening Ada Ciyst 18 975 (1965) [50] P Scherrer Gott Nachr 2 98 (1918) [51] A R Stokes and A J C Wilson Proc Cambridge
Philos Soc 38 313 (1942) [52] A J C Wilson X-Ray Optics 2nd edition Methuen
London (1962) [53] S Leie and T R Anantharaman Proc Indian Acad
Sci Sect A H 261 (1966) [54] D Louer D Weigel and J I Langford J Appl Ciyst
5 353 (1972) [55] A J C Wilson J Appl Ciyst 2 181 (1969) [56] J I Langford and A J C Wilson J Appl Ciyst 11102
(1978) [57] A R Stokes and A J C Wilson Proc Phys Soc Lond
56174 (1944) [58] B E Warren and B L Averbach J Appl Phys 21 595
(1950) [59] B E Warren X-Ray Diffraction Addison-Wesley
Reading Massachusetts (1969) p 264 [60] B E Warren in Progress in Metal Physics Vol 8 Perg-
amon Press London (1959) p 146 [61] F Bertaut C R Acad Sci Paris 228 187 (1949) [62] N C Haider and C N J Wagner Acta Cryst 20 312
(1966) [63] D Balzar and H Ledbetter in Proceedings of the Accu-
racy in Powder Diffraction II Natl Inst Stand Technol (1992) p 37
[64] D Balzar and H Ledbeter J Appl Cryst 26 (1993) in press
[65] J N Eastabrook and A J C Wilson Proc Phys Soc Lond B 65 67 (1952)
[66] R S Smith IBM J Res Develop 4 205 (1960) [67] B Y Pines and A F Sirenko Soviet Physics Ciyst 715
(1962) [68] G B Mitra and N K Misra Acta Ciyst 22 454 (1967) [69] A Gangulee J Appl Ciyst 7 434 (1974) [70] J Mignot D Rondot Acta Met 231321 (1975) [71] J Mignot and D Rondot Acta Ciyst A 33 327 (1977) [72] R K Nandi H K Kuo W Schlosberg G Wissler J B
Cohen and B Crist Jr J Appl Ciyst 17 22 (1984) [73] M Zocchi Acta Ciyst A 36164 (1980) [74] P Ramarao and T R Anantharaman Trans Ind Ins
Metals 18 181 (1965) [75] R K Nandi and S P Sen Gupta J App Cryst 11 6
(1978) [76] Th H de Keijser J I Langford E J Mittemeijer and
B P Vogels J Appl Ciyst IS 308 (1982) [77] A Williams G H Kwei R B Von Dreele A C Lar-
son L D Raistrick and D L Bish Phys Rev B 37 7960 (1988)
[78] A C Larson and R B Von Dreele Los Alamos Na- tional Laboratory Report No LA-UR-86-748 (1988)
[79] J D Jorgensen D H Johnson M H Mueller J G Worlton and R B Von Dreele in Proceedings of the Conference on Diffraction Profile Analysis Cracow Poland (1978) p 20
[80] R B Von Dreele J D Jorgensen and C G Windsor J Appl Ciyst 15 581 (1982)
[81] P Thompson D E Cox and J B Hastings J Appl Ciyst 20 79 (1987)
[82] J P Singh R A Guttschow D S Kupperman J T Dusek and R B Poeppel in High Temperature Super-
conducting Compounds III S Whang A Gupta and E Ceilings eds TMS AIME Warrendale (1991) p 281
[83] M O Eatough D S Glnley and B Morosin Adv X- Ray Anal 33 145 (1990)
[84] E J Peterson P J Kung R E Muenchausen and D M Smith in Proceedings of the 41st Annual Denver Conference on Applications of X-Ray Analysis Colo- rado Springs Colorado (1992) p 74
[85] M Rand J I Langford and J S Abell submitted to J Cryogenics (1992)
[86] D Balzar J Appl Ciyst 25 559 (1992) [87] D Balzar H Ledbetter and A Roshko Physica C 185-
189 871 (1991) [88] D Balzar and H Ledbetter J Mater Sci Lett 111419
(1992) [89] D Balzar H Ledbetter and A Roshko Pow Diffr 8
(1993) in press [90] S Johnson M Gusraan D Rowcliffe T Geballe and J
Sun Adv Ceram Mater 2 337 (1987) [91] H Ledbetter S A Kim R B Goldfarb and K Togano
Phys Rev B 39 9689 (1989) [92] H Friedman Electronics 132 (1945) [93] W Parrish (ed) in Advances in X-Ray Diffractometry
and X-Ray Spectrography Centrex Publishing Company Eindhoven The Netheriands (1962)
[94] W Soller Phys Rev 24158 (1924) [95] S A Howard R L Snyder J Appl Ciyst 22 238
(1989) [96] G H Stout and L H Jensen X-Ray Structure Determi-
nation 2nd edition Wiley New York (1989) p 373 [97] D E Appleman and T Evans Jr Final Report 92-14
US Geological Survey Washington DC (1973) Avail- able as NTIS Document No PB-216188
[98] M U Cohen Rev Sci Instrum 6 68 (1935) [99] M U Cohen Rev Sci Instrum 7 155 (1936) [100] M H Mueller L Heaton and K T Miller Acta Ciyst
13 828 (1960) [101] R A Young P E Mackie and R B Von Dreele J
Appl Ciyst 10 262 (1977) [102] D B Wiles and R A Young J Appl Cryst 14 149
(1981) [103] J K Yau and S A Howard J Appl Ciyst 22 244
(1989) [104] S A Howard J K Yau and H U Anderson J Appl
Phys 65 1492 (1989) [105] S Enzo G Fagherazzi A Benedetti and S Poilizzi J
Appl Ciyst 21 536 (1988) [106] A Benedetti G Fagherazzi S Enzo and M
Battagliarin J Appl Cryst 21 543 (1988) [107] Th H de Keijser E J Mittemeijer and H C F Rozen-
daal J Appl Ciyst 16 309 (1983) [108] Y Zhang J M Stewart C R Hubbard and B Mo-
rosin Adv X-Ray Anal 33 373 (1990) [109] Y Wang S Lee and Y Ue J Appl Ciyst IS 35
(1982) [110] V N Selivanov and E F Smislov Zavod Lab 57 28
(1991) [Ill] A Guinier X-Ray Diffraction W H Freeman San
Francisco (1963) p 139 [112] M Wilkens J Appl Cryst 12119 (1979) [113] D Du and Y Wang Pow Diffr 2180 (1987) [114] A P Prudnikov Yu A Brychkov and O L Marichev
Integrals and Series Vol 1 Gordon and Breach Am- sterdam The Netheriands (1986) p 344
352
Volume 98 Number 3 May-June 1993
Journal of Research of the National Institute of Standards and Technology
[115] R L Rothman and J B Cohen J Appl Phys 42 971 (1971)
[116] T Adier and C R Houska J Appl Phys 50 3282 (1979)
[117] C R Houska and T M Smith J Appl Phys 52 748 (1981)
[118] S Rao and C R Houska Acta Ciyst A 4214 (1986) [119] J I Langford R Delhez Th H de Keijser and E J
Mittemeijer Ausi J Phys 41173 (1988) [120] J I Langfoid J Appl Cryst IS 315 (1982) [121] M J Turunen Th H de Keijser R Delhez and N M
van der Pers J Appl Ciyst 16176 (1983) [122] A J C Wilson Acta Ciyst 23 888 (1967) [123] A J C Wilson Acta Ciyst A 24 478 (1968) [124] A J C Wilson Acta Ciyst A 25 584 (1969) [125] G Gagliotti A Paoletti and F P Ricci Nucl Instrum
3 223 (1958) [126] J I Langford R J Cernik and D Louer J Appl
Ciyst 24 913 (1991) [127] J I Langford in Accuracy in Powder Diffraction II
preprint [128] A J C Wilson Mathematical Theory of X-Ray Powder
Diffractometiy Centrex Eindhoven The Netherlands (1963)
[129] J L Langford Prog Ciyst Growth and Charact 14185 (1987)
[130] T G Fawcett C E Crowder S J Brownell Y Zhang C R Hubbard W Schreiner G P Hamill T C Huang E Sabino J I Langford R Hamilton and D Louer Pow Diffr 3 209 (1988)
[131] W L Smith J Appl Ciyst 9187 (1976) [132] J L Langford and D Louer J Appl Ciyst 15 20
(1982) [133] Fl Popescu and L Benes Acta Ciyst A 33 323 (1977) [134] P PSuse^cu R MSnaila M Popescu and E Jijovici j
Appl Cryst 7 281 (1974) [135] P F Bley Y Calvayrac and M Fayard J Appl Ciyst
7 493 (1974) [136] B Moraweck Ph de Montgolfier and A J Renouprez
J Appl Ciyst 10191 (1977) [137] A Le Bail and D Louer J Appl Cryst 11 50 (1978) [138] D R Buchanan R L McCuUough and R L Miller
Acta Ciyst 20 922 (1966) [139] P Suortti and L D Jennings Acta Cryst A 33 1012
(1977) [140] J B Cohen and C N J Wagner J Appl Phys 33 2073
(1962) [141] A Bianconi J Budnick A M Flank A Fontaine P
Lagarde A Marcelli H Tolentino B Chamberland C Michel B Raveau and G Demazeau Phys Lett A127 285 (1988)
[142] K Fueki K Kitazawa K Kishio T Hasegawa S Uchida H Takagi and S Tanaka in Chemistiy of High- Temperature Superconductors D L Nelson M S Whittingham and T F George eds American Chemi- cal Society (1987) p 38
[143] T Fujita Y Aoki Y Maeno J Sakurai H Fukuba and H Fujii J Appl Phys 26 U68 (1987)
[144] R M Hazen in Physical Properties of High-rc Super- conductors Vol 2 D M Ginsberg ed World Scien- tific Singapore (1990) p 121
[145] J B Torrance A Bezinge A I Nazzal T C Huang S P Parkin D T Keane S J LaPlaca P M Horn and G A Held Phys Rev B 40 8872 (1989)
[146] J D Axe A H Moudden D Hohlwein D E Cox K
M Mohanty A R Moodenbaugh and Y Xu Phys Rev Lett 62 2751 (1989)
[147] T Suzuki and T Fujita Physica C 159 111 (1989) [148] T Fujita and Y Maeno in Superconducting Materials
JJAP Series 1 (1988) p 34 [149] A Roshko and Y-M Chiang J Appl Phys 66 3710
(1989) [150] D E Cox S C Moss R L Meng P H Hor and C W
Chu J Mater Res 31327 (1988) [151] B Crist and J B Cohen J Polym Sci 17 1001 (1979) [152] H Ledbetter S Kim and A Roshko Z Phys B 89275
(1992) [153] R D Shannon and C T Prewitt Acta Ciyst B 25 925
(1969) [154] M Lang H Spille F Steglich Y Hidaka T Murakami
and Y Endoh Physica C 162-1641037 (1989) [155] Y Hidaka and T Murakami Phase trans 15 241
(1989) [156] P L Gai and E M McCarron Science 247 553 (1990) [157] T Kamiyama I Izumi H Asano H Takagi S Uchida
Y Tokura E Takayama-Muromachi M Matsuda K Yamada Y Endoh and Y Hidaka Physica C 172 120 (1990)
[158] A Kapitulnik Physica C 153-155 520 (1988) [159] L A Muradyan V N Molchanov R A Tamazyan and
V I Simonov Physica C 162-164 536 (1989) [160] P Day M Rosseinsky K Prassides W I F David O
Moze and A Soper J Phys C 20 L429 (1987) [161] J T Lewandowski R A Beyerlein J M Longo and R
A McCauley J Amer Ceram Soc 69 699 (1986) [162] R Ramesh G van Tendeloo G Thomas S M Green
Y Mei C Jiang and H L Luo Appl Phys Lett 53 2220 (1988)
[163] J Schneck L Pierre J C Tolddano and C Daguet Phys Rev B 39 9624 (1989)
[164] O Eibl Physica C 168 215 (1990) [165] W Carrilo-Cabrera and W Gopel Physica C 161 373
(1989) [166] P Bordet J J Capponi C Chaillout J Chenavas A
W Hewat E A Hewat J L Hodeau M Marezio J L Tholence and D Tranqui Physica C 156189 (1988)
[167] R Ramesh K Remschnig J M Tarascon and S M Green J Mater Res 6 278 (1991)
[168] Z Hiroi Y Ikeda M Takano and Y Bando J Mater Res 6 435 (1991)
[169] Y Inoue M Hasegawa Y Shichi I Munakata M Ya- manaka S Hiyama and O Nittono J Mater Res 5 737 (1990)
[170] R Ramesh B G Bagley J M Tarascon S M Green M L Rudee and H L Luo J Appl Phys 67 379 (1990)
[171] X B Kan J Kulik P C Chow S C Moss Y F Yan J H Wang and Z X Zhao J Mater Res 5 731 (1990)
[172] G S Pawley J Appl Ciyst 13 630 (1980) [173] H Toraya J Appl Ciyst 19 440 (1986) [174] L Lutterotti and P Scardi J Appl Ciyst 23 246
(1990)
About the author Davor Balzar is with Faculty of Metallurgy of the University of Zagreb Sisak Croatia and was a Guest Researcher at fflST The National Institute of Standards and Technology is an agency of the Technology Administration US Department of Commerce
353
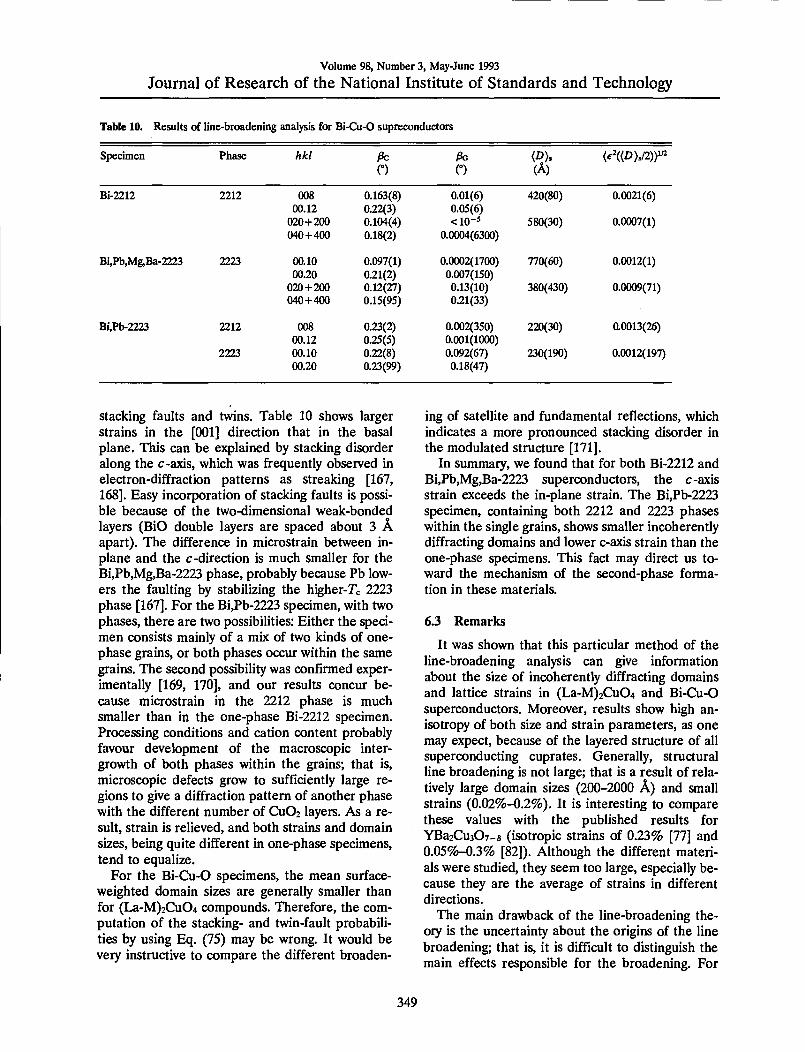
Volume 98 Number 3 May-June 1993
Journal of Research of the National Institute of Standards and Technology
Table 10 Results of line-btoadening analysis for Bi-Cu-O supreconductors
Specimen Phase hkl (A)
eD)sa)y^
Bi-2212 2212 008 0012
0163(8) 022(3)
001(6) 005(6)
420(80) 00021(6)
020+200 0104(4) ltio-^ 580(30) 00007(1) 040+400 018(2) 00004(6300)
BiPbMgBa-2223 7773 0010 0020
0097(1) 021(2)
00002(1700) 0007(150)
770(60) 00012(1)
020 + 200 012(27) 013(10) 380(430) 00009(71) 040 + 400 015(95) 021(33)
BiPb-73 2212 008 0012
023(2) 025(5)
0002(350) 0001(1000)
220(30) 00013(26)
2223 0010 0020
022(8) 023(99)
0092(67) 018(47)
230(190) 00012(197)
Stacking faults and twins Table 10 shows larger strains in the [001] direction that in the basal plane This can be explained by stacking disorder along the c-axis which was frequently observed in electron-diffraction patterns as streaking [167 168] Easy incorporation of stacking faults is possi- ble because of the two-dimensional weak-bonded layers (BiO double layers are spaced about 3 A apart) The difference in microstrain between in- plane and the c-direction is much smaller for the BiPbMgBa-2223 phase probably because Pb low- ers the faulting by stabilizing the higher-Tc 2223 phase [167] For the BiPb-2223 specimen with two phases there are two possibilities Either the speci- men consists mainly of a mk of two kinds of one- phase grains or both phases occur within the same grains The second possibility was confirmed exper- imentally [169 170] and our results concur be- cause microstrain in the 2212 phase is much smaller than in the one-phase Bi-2212 specimen Processing conditions and cation content probably favour development of the macroscopic inter- growth of both phases within the grains that is microscopic defects grow to sufficiently large re- gions to give a diffraction pattern of another phase with the different number of Cu02 layers As a re- sult strain is relieved and both strains and domain sizes being quite different in one-phase specimens tend to equalize
For the Bi-Cu-O specimens the mean surface- weighted domain sizes are generally smaller than for (La-M)2Cu04 compounds Therefore the com- putation of the stacking- and twin-fault probabili- ties by using Eq (75) may be wrong It would be very instructive to compare the different broaden-
ing of satellite and fundamental reflections which indicates a more pronounced stacking disorder in the modulated structure [171]
In summary we found that for both Bi-2212 and BiPbMgBa-2223 superconductors the c-axis strain exceeds the in-plane strain The BiPb-2223 specimen containing both 2212 and 2223 phases within the single grains shows smaller incoherently diffracting domains and lower c-axis strain than the one-phase specimens This fact may direct us to- ward the mechanism of the second-phase forma- tion in these materials
63 Remarks
It was shown that this particular method of the line-broadening analysis can give information about the size of incoherently diffracting domains and lattice strains in (La-M)2Cu04 and Bi-Clu-O superconductors Moreover results show high an- isotropy of both size and strain parameters as one may expect because of the layered structure of all superconducting cuprates Generally structural line broadening is not large that is a result of rela- tively large domain sizes (200-2000 A) and small strains (002-02) It is interesting to compare these values with the published results for YBa2Cu307-laquo (isotropic strains of 023 [77] and 005-03 [82]) Although the different materi- als were studied they seem too large especially be- cause they are the average of strains in different directions
The main drawback of the line-broadening the- ory is the uncertainty about the origins of the line broadening that is it is difficult to distinguish the main effects responsible for the broadening For
349
Volume 98 Number 3 May-June 1993
Journal of Research of the National Institute of Standards and Technology
the novel superconductors particularly the numer- ous defects (substitutions vacancies stacking faults dislocations and similar) can occur simulta- neously which makes it very difficult to determine their individual contributions Furthermore the crystal structures of most novel superconductors are relatively complicated The average structure has mostly a slightly distorted tetragonal symmetry very similar a and b lattice parameters and a large c parameter but c=36 for YBa2Cu307-laquo for in- stance This results in a large number of overlap- ping peaks and consequently in large errors of all results This showed especially in the case of Bi-Cu-O superconductors (see Table 10) Follow- ing the discussion of reliability of profile fitting in Sec 54 it would be desirable to include more than two reflections in the analysis of broadening but higher-order peaks are usually too weak and over- lapped One way to partially solve this problem would be a whole pattern fitting [172 173] and Rietveld structure refinement [23] in terms of size and strain parameters This requires an accurate preset function to model specimen broadening and precise definition of angular dependence of size and strain parameters The Rietveld programs that model the line broadening in terms of size and strain parameters are based either on the simpli- fied integral-breadth methods [78 95] or on the single-line method [174]
7 Conclusions
A method for analyzing the pure-specimen (structural) broadening of x-ray diffraction line profiles is proposed By modeling the specimen size and strain broadenings with the simple Voigt func- tion it is possible to obtain domain sizes and strains that agree with experiment and show a logi- cal interrelationship Furthermore some common consequences and problems in the Fourier-method analysis follow easily The specimen function is convoluted with the instrumental function to match the observed x-ray diffraction-line profile This avoids the Stokes deconvolution method thus al- lowing analysis of patterns with highly overlapping peaks and weak structural broadening Therefore the method was applied to some novel high-Tc superconductors We reached the following conclu- sions
(i) Surface-weighted domain size depends only on the Cauchy integral breadth of the size-broad- ened profile
(ii) The hook effect occurs when the Cauchy-content of the size-broadened profile is un-
derestimated that is for ^sc(n2)^3sG Usually this happens when the background is estimated too high so the long tails of the Cauchy function are prematurely cut off
(iii) It also follows from conclusion (ii) that the volume-weighted domain size can not be more than twice the surface-weighted domain size (limiting value D)v=2D)i is obtained for the pure-Cauchy size-broadened profile) Minimum value for D)J (D)j should not be less than -131
(iv) If the distortion coefficient is approxi- mated with a harmonic term this leads exactly to the Warren-Averbach method of separation of size and strain broadenings
(v) In that case mean-square strains decrease linearly with the distance L
(vi) It is possible to evaluate local strain ((e^(0))^) only in the case of pure-Gauss strain broadening Then root-mean-square strain is inde- pendent of the distance L and related to the upper limit of strain obtained from the integral breadth of the strain-broadened profile
(vii) If strain broadening is not described exclu- sively with the Gauss function the multiple-line Voigt integral breadth and Warren-Averbach analyses can not give the same results for volume- weighted domain size although D)v is defined identically in both approaches because the appar- ent strain -q = pdeg(29)cot9 is not angular- independent
(viii) Smooth size coefficients give column- length distribution functions without oscillations and make possible a computation of volume- weighted average domain sizes up to ~5000 A
(ix) Comparison with the simplified integral- breadth methods in most cases has shown not large but systematic discrepancy of results indicat- ing that size and strain broadening can not be accu- rately modeled by a single Cauchy or Gauss function Moreover the application of the single- line method is much less reliable and it should not be used where multiple reflections are available
(x) The knowledge of all phases present in the sample and their crystallographic structure is re- quired to successfully fit a cluster of overlapping peaks Although it is very difficult to accurately de- termine the Cauchy-Gauss ratio of an overlapped peak final results of domain size and strain are much less affected Therefore connecting the crys- tallite size exclusively with the Cauchy content and strain with the Gauss content of a specimen profile might be doubtful
(xi) Evaluated errors of domain sizes and strains increase substantially with the degree of
350
Volume 98 Number 3 May-June 1993
Journal of Research of the National Institute of Standards and Technology
peak overlapping Hence for complicated patterns very accurate measurements are necessary and one needs to analyze as many reflections in the same crystallographic direction as possible
(xii) Line-broadening analysis of (La-M)2Cu04 and Bi-Cu-O compounds confirms high anisotropy in these materials
(xiii) Strains in (La-M)2Cu04 probably origi- nate from dislocations and from different sizes of host and dopant ions
(xiv) Stacking-fault probability in (La-M)2Cu04 (M = Ba Ca Sr) increases with increasing Tc whereas the average strain decreases
(xv) In La2Cu04 different broadening of (lOO) and (OfcO) reflections is not caused by stacking faults
(xvi) All Bi-Cu-0 superconductors show larger strain in the c-direction than in the a-b plane which can be explained by stacking disorder along the [001] direction
(xvii) In the specimen with approximately equal amounts of Tl-2212 and TlPb-2223 phases it is likely that a secondary phase develops by the growth of the microscopic faulted regions of the primary phase
Acknowledgments
I am thankful to Dr Harry McHenry for his support and especially to Dr Hassel Ledbetter for his wise guidance and most useful help during my stay at NIST I am also indebted to my home insti- tution the Faculty of Metallurgy of the University of Zagreb for allowing me the leave of absence at NIST
8 References
[1] W Friedrich P Knipping and M v Laue Ann Physik 41 971 (1912)
[2] H M Rietveld Acta Cryst 22 151 (1967) [3] H M Rietveld J Appl Cryst 2 65 (1969) [4] S A Howard and K D Preston in Modern Powder Dif-
fraction Vol 20 The Mineralogical Society of America Washington DC (1989) p 217
[5] D Taupin J Appl Cryst 6 266 (1973) [6] T C Huang and W Parrish Appl Phys Lett 27 123
(1975) [7] M K Wu J R Ashburn C J Torng P H Hor R L
Meng L Gao Z J Hwang Y Q Wang and C W Chu Phys Rev Lett 58 908 (1987)
[8] D Shi MRS Bull 16 37 (1991) [9] D Larbalestier Phys Today 44 74 (1991)
[10] J C Phillips Phys Rev B 4512647 (1992) [11] B Raveau Phys Today 45 53 (1992) [12] A J Millis and K M Rabe Phys Rev B 38 8908 (1988)
[13] F Guinea Europhys Lett 7 549 (1988) [14] C P Dhard and P Singh in Proc Int Symp High-Temp
Supercond Jaipur India Oxford amp IBH Publishing New Delhi (1988) p 271
[15] J D Jorgensen Phys Today 44 34 (1991) [16] J G Bednorz and K A Muller Z Phys B 64 189
(1986) [17] K Kishio K Kitazawa S Kaube I Yasuda N Sugii H
Takagi S Uchida K Fueki and S Tanaka Chem Lett 429 (1987)
[18] J D Jorgensen B Dabrowski S Pei D G Hinks L Soderholm B Morosin J E Venturini and D S Ginley Phys Rev B 38 11337 (1988)
[19] J R Clem Phys Rev B 43 7837 (1991) [20] M Paranthaman M Foldejiki D Balzar H Ledbetter
A J Nelson and A M Hermann submitted to Phys Rev B
[21] A R Stokes Proc Phys Soc Lond 61 382 (1948) [22] B E Warren and B L Averbach J Appl Phys 23 497
(1952) [23] R Delhez Th H de Keijser and E J Mittemeijer in
Accuracy in Powder Diffraction S Block and C R Hub- bard eds Natl Bur Stand (US) Special Publication 567 (1980) p 213
[24] H P Klug and L E Alexander X-ray Diffraction Proce- dures 2nd Edition John Wiley New York (1974) p 661
[25] J I Langford J Appl Ciyst 11 10 (1978) [26] J I Langford in Accuracy in Powder Diffraction S
Block and C R Hubbard eds Natl Bur Stand (US) Special Pubication 567 (1950) p 255
[27] R Delhez Th H de Keijser and E J Mittemeijer Fre- senius Z Anal Chem 312 1 (1982)
[28] A J C Wilson Proc Phys Soc Lond 80 286 (1962) [29] A J C Wilson Proc Phys Soc Lond 81 41 (1963) [30] L P Smith Phys Rev 46 343 (1934) [31] H C Burger and P H van Cittert Z Phys 79 722
(1932) [32] S Ergun J Appl Ciyst 1 19 (1968) [33] R Croche and L Gatineau J Appl Ciyst 10479 (1977) [34] L H Schwarz and J B Cohen Diffraction from Materi-
als Academic Press New York (1977) p 391 [35] R Delhez Th H de Keijser E J Mittemeijer and J I
Langford J Appl Cryst 19 459 (1986) [36] R Delhez Th H de Keijser E J Mittemeijer and J I
Langford Aust J Phys 41 213 (1988) [37] R A Young and D B Wiles J Appl Cryst 15 430
(1982) [38] W Voigt Stizungsber K Bayer Akad Wiss 42 603
(1912) [39] E E Whiting J Quant Spectrosc Radiat Transfer 8
1379 (1968) [40] G K Wertheim M A Butler K W West and D N E
Buchanan Rev Sci Instrum 111369 (1974) [41] M M Hall Jr V G Veeraraghavan H Rubin and P G
Winchell J Appl Cryst 10 66 (1977) [42] A Brown and J W Edmonds Adv X-Ray Anal 23 361
(1980) [43] P Suortti M Ahtee L Unonius J Appl Cryst 12 365
(1979) [44] T Sundius J Raman Spectrosc 1 471 (1973) [45] B H Armstrong J Quant Spectrosc Radiat Transfer 7
61 (1967) [46] J F Kielkopf J Opt Soc Am 63 987 (1973) [47] B P Asthana and W Kiefer Appl Spectr 36 250
(1982)
351
Volume 98 Number 3 May-June 1993
Journal of Research of the National Institute of Standards and Technology
[48] J P M de Vreede S C Mehrotra A Tal and H A Dijkerraan Appl Spectr 36 227 (1982)
[49] F R L Schoening Ada Ciyst 18 975 (1965) [50] P Scherrer Gott Nachr 2 98 (1918) [51] A R Stokes and A J C Wilson Proc Cambridge
Philos Soc 38 313 (1942) [52] A J C Wilson X-Ray Optics 2nd edition Methuen
London (1962) [53] S Leie and T R Anantharaman Proc Indian Acad
Sci Sect A H 261 (1966) [54] D Louer D Weigel and J I Langford J Appl Ciyst
5 353 (1972) [55] A J C Wilson J Appl Ciyst 2 181 (1969) [56] J I Langford and A J C Wilson J Appl Ciyst 11102
(1978) [57] A R Stokes and A J C Wilson Proc Phys Soc Lond
56174 (1944) [58] B E Warren and B L Averbach J Appl Phys 21 595
(1950) [59] B E Warren X-Ray Diffraction Addison-Wesley
Reading Massachusetts (1969) p 264 [60] B E Warren in Progress in Metal Physics Vol 8 Perg-
amon Press London (1959) p 146 [61] F Bertaut C R Acad Sci Paris 228 187 (1949) [62] N C Haider and C N J Wagner Acta Cryst 20 312
(1966) [63] D Balzar and H Ledbetter in Proceedings of the Accu-
racy in Powder Diffraction II Natl Inst Stand Technol (1992) p 37
[64] D Balzar and H Ledbeter J Appl Cryst 26 (1993) in press
[65] J N Eastabrook and A J C Wilson Proc Phys Soc Lond B 65 67 (1952)
[66] R S Smith IBM J Res Develop 4 205 (1960) [67] B Y Pines and A F Sirenko Soviet Physics Ciyst 715
(1962) [68] G B Mitra and N K Misra Acta Ciyst 22 454 (1967) [69] A Gangulee J Appl Ciyst 7 434 (1974) [70] J Mignot D Rondot Acta Met 231321 (1975) [71] J Mignot and D Rondot Acta Ciyst A 33 327 (1977) [72] R K Nandi H K Kuo W Schlosberg G Wissler J B
Cohen and B Crist Jr J Appl Ciyst 17 22 (1984) [73] M Zocchi Acta Ciyst A 36164 (1980) [74] P Ramarao and T R Anantharaman Trans Ind Ins
Metals 18 181 (1965) [75] R K Nandi and S P Sen Gupta J App Cryst 11 6
(1978) [76] Th H de Keijser J I Langford E J Mittemeijer and
B P Vogels J Appl Ciyst IS 308 (1982) [77] A Williams G H Kwei R B Von Dreele A C Lar-
son L D Raistrick and D L Bish Phys Rev B 37 7960 (1988)
[78] A C Larson and R B Von Dreele Los Alamos Na- tional Laboratory Report No LA-UR-86-748 (1988)
[79] J D Jorgensen D H Johnson M H Mueller J G Worlton and R B Von Dreele in Proceedings of the Conference on Diffraction Profile Analysis Cracow Poland (1978) p 20
[80] R B Von Dreele J D Jorgensen and C G Windsor J Appl Ciyst 15 581 (1982)
[81] P Thompson D E Cox and J B Hastings J Appl Ciyst 20 79 (1987)
[82] J P Singh R A Guttschow D S Kupperman J T Dusek and R B Poeppel in High Temperature Super-
conducting Compounds III S Whang A Gupta and E Ceilings eds TMS AIME Warrendale (1991) p 281
[83] M O Eatough D S Glnley and B Morosin Adv X- Ray Anal 33 145 (1990)
[84] E J Peterson P J Kung R E Muenchausen and D M Smith in Proceedings of the 41st Annual Denver Conference on Applications of X-Ray Analysis Colo- rado Springs Colorado (1992) p 74
[85] M Rand J I Langford and J S Abell submitted to J Cryogenics (1992)
[86] D Balzar J Appl Ciyst 25 559 (1992) [87] D Balzar H Ledbetter and A Roshko Physica C 185-
189 871 (1991) [88] D Balzar and H Ledbetter J Mater Sci Lett 111419
(1992) [89] D Balzar H Ledbetter and A Roshko Pow Diffr 8
(1993) in press [90] S Johnson M Gusraan D Rowcliffe T Geballe and J
Sun Adv Ceram Mater 2 337 (1987) [91] H Ledbetter S A Kim R B Goldfarb and K Togano
Phys Rev B 39 9689 (1989) [92] H Friedman Electronics 132 (1945) [93] W Parrish (ed) in Advances in X-Ray Diffractometry
and X-Ray Spectrography Centrex Publishing Company Eindhoven The Netheriands (1962)
[94] W Soller Phys Rev 24158 (1924) [95] S A Howard R L Snyder J Appl Ciyst 22 238
(1989) [96] G H Stout and L H Jensen X-Ray Structure Determi-
nation 2nd edition Wiley New York (1989) p 373 [97] D E Appleman and T Evans Jr Final Report 92-14
US Geological Survey Washington DC (1973) Avail- able as NTIS Document No PB-216188
[98] M U Cohen Rev Sci Instrum 6 68 (1935) [99] M U Cohen Rev Sci Instrum 7 155 (1936) [100] M H Mueller L Heaton and K T Miller Acta Ciyst
13 828 (1960) [101] R A Young P E Mackie and R B Von Dreele J
Appl Ciyst 10 262 (1977) [102] D B Wiles and R A Young J Appl Cryst 14 149
(1981) [103] J K Yau and S A Howard J Appl Ciyst 22 244
(1989) [104] S A Howard J K Yau and H U Anderson J Appl
Phys 65 1492 (1989) [105] S Enzo G Fagherazzi A Benedetti and S Poilizzi J
Appl Ciyst 21 536 (1988) [106] A Benedetti G Fagherazzi S Enzo and M
Battagliarin J Appl Cryst 21 543 (1988) [107] Th H de Keijser E J Mittemeijer and H C F Rozen-
daal J Appl Ciyst 16 309 (1983) [108] Y Zhang J M Stewart C R Hubbard and B Mo-
rosin Adv X-Ray Anal 33 373 (1990) [109] Y Wang S Lee and Y Ue J Appl Ciyst IS 35
(1982) [110] V N Selivanov and E F Smislov Zavod Lab 57 28
(1991) [Ill] A Guinier X-Ray Diffraction W H Freeman San
Francisco (1963) p 139 [112] M Wilkens J Appl Cryst 12119 (1979) [113] D Du and Y Wang Pow Diffr 2180 (1987) [114] A P Prudnikov Yu A Brychkov and O L Marichev
Integrals and Series Vol 1 Gordon and Breach Am- sterdam The Netheriands (1986) p 344
352
Volume 98 Number 3 May-June 1993
Journal of Research of the National Institute of Standards and Technology
[115] R L Rothman and J B Cohen J Appl Phys 42 971 (1971)
[116] T Adier and C R Houska J Appl Phys 50 3282 (1979)
[117] C R Houska and T M Smith J Appl Phys 52 748 (1981)
[118] S Rao and C R Houska Acta Ciyst A 4214 (1986) [119] J I Langford R Delhez Th H de Keijser and E J
Mittemeijer Ausi J Phys 41173 (1988) [120] J I Langfoid J Appl Cryst IS 315 (1982) [121] M J Turunen Th H de Keijser R Delhez and N M
van der Pers J Appl Ciyst 16176 (1983) [122] A J C Wilson Acta Ciyst 23 888 (1967) [123] A J C Wilson Acta Ciyst A 24 478 (1968) [124] A J C Wilson Acta Ciyst A 25 584 (1969) [125] G Gagliotti A Paoletti and F P Ricci Nucl Instrum
3 223 (1958) [126] J I Langford R J Cernik and D Louer J Appl
Ciyst 24 913 (1991) [127] J I Langford in Accuracy in Powder Diffraction II
preprint [128] A J C Wilson Mathematical Theory of X-Ray Powder
Diffractometiy Centrex Eindhoven The Netherlands (1963)
[129] J L Langford Prog Ciyst Growth and Charact 14185 (1987)
[130] T G Fawcett C E Crowder S J Brownell Y Zhang C R Hubbard W Schreiner G P Hamill T C Huang E Sabino J I Langford R Hamilton and D Louer Pow Diffr 3 209 (1988)
[131] W L Smith J Appl Ciyst 9187 (1976) [132] J L Langford and D Louer J Appl Ciyst 15 20
(1982) [133] Fl Popescu and L Benes Acta Ciyst A 33 323 (1977) [134] P PSuse^cu R MSnaila M Popescu and E Jijovici j
Appl Cryst 7 281 (1974) [135] P F Bley Y Calvayrac and M Fayard J Appl Ciyst
7 493 (1974) [136] B Moraweck Ph de Montgolfier and A J Renouprez
J Appl Ciyst 10191 (1977) [137] A Le Bail and D Louer J Appl Cryst 11 50 (1978) [138] D R Buchanan R L McCuUough and R L Miller
Acta Ciyst 20 922 (1966) [139] P Suortti and L D Jennings Acta Cryst A 33 1012
(1977) [140] J B Cohen and C N J Wagner J Appl Phys 33 2073
(1962) [141] A Bianconi J Budnick A M Flank A Fontaine P
Lagarde A Marcelli H Tolentino B Chamberland C Michel B Raveau and G Demazeau Phys Lett A127 285 (1988)
[142] K Fueki K Kitazawa K Kishio T Hasegawa S Uchida H Takagi and S Tanaka in Chemistiy of High- Temperature Superconductors D L Nelson M S Whittingham and T F George eds American Chemi- cal Society (1987) p 38
[143] T Fujita Y Aoki Y Maeno J Sakurai H Fukuba and H Fujii J Appl Phys 26 U68 (1987)
[144] R M Hazen in Physical Properties of High-rc Super- conductors Vol 2 D M Ginsberg ed World Scien- tific Singapore (1990) p 121
[145] J B Torrance A Bezinge A I Nazzal T C Huang S P Parkin D T Keane S J LaPlaca P M Horn and G A Held Phys Rev B 40 8872 (1989)
[146] J D Axe A H Moudden D Hohlwein D E Cox K
M Mohanty A R Moodenbaugh and Y Xu Phys Rev Lett 62 2751 (1989)
[147] T Suzuki and T Fujita Physica C 159 111 (1989) [148] T Fujita and Y Maeno in Superconducting Materials
JJAP Series 1 (1988) p 34 [149] A Roshko and Y-M Chiang J Appl Phys 66 3710
(1989) [150] D E Cox S C Moss R L Meng P H Hor and C W
Chu J Mater Res 31327 (1988) [151] B Crist and J B Cohen J Polym Sci 17 1001 (1979) [152] H Ledbetter S Kim and A Roshko Z Phys B 89275
(1992) [153] R D Shannon and C T Prewitt Acta Ciyst B 25 925
(1969) [154] M Lang H Spille F Steglich Y Hidaka T Murakami
and Y Endoh Physica C 162-1641037 (1989) [155] Y Hidaka and T Murakami Phase trans 15 241
(1989) [156] P L Gai and E M McCarron Science 247 553 (1990) [157] T Kamiyama I Izumi H Asano H Takagi S Uchida
Y Tokura E Takayama-Muromachi M Matsuda K Yamada Y Endoh and Y Hidaka Physica C 172 120 (1990)
[158] A Kapitulnik Physica C 153-155 520 (1988) [159] L A Muradyan V N Molchanov R A Tamazyan and
V I Simonov Physica C 162-164 536 (1989) [160] P Day M Rosseinsky K Prassides W I F David O
Moze and A Soper J Phys C 20 L429 (1987) [161] J T Lewandowski R A Beyerlein J M Longo and R
A McCauley J Amer Ceram Soc 69 699 (1986) [162] R Ramesh G van Tendeloo G Thomas S M Green
Y Mei C Jiang and H L Luo Appl Phys Lett 53 2220 (1988)
[163] J Schneck L Pierre J C Tolddano and C Daguet Phys Rev B 39 9624 (1989)
[164] O Eibl Physica C 168 215 (1990) [165] W Carrilo-Cabrera and W Gopel Physica C 161 373
(1989) [166] P Bordet J J Capponi C Chaillout J Chenavas A
W Hewat E A Hewat J L Hodeau M Marezio J L Tholence and D Tranqui Physica C 156189 (1988)
[167] R Ramesh K Remschnig J M Tarascon and S M Green J Mater Res 6 278 (1991)
[168] Z Hiroi Y Ikeda M Takano and Y Bando J Mater Res 6 435 (1991)
[169] Y Inoue M Hasegawa Y Shichi I Munakata M Ya- manaka S Hiyama and O Nittono J Mater Res 5 737 (1990)
[170] R Ramesh B G Bagley J M Tarascon S M Green M L Rudee and H L Luo J Appl Phys 67 379 (1990)
[171] X B Kan J Kulik P C Chow S C Moss Y F Yan J H Wang and Z X Zhao J Mater Res 5 731 (1990)
[172] G S Pawley J Appl Ciyst 13 630 (1980) [173] H Toraya J Appl Ciyst 19 440 (1986) [174] L Lutterotti and P Scardi J Appl Ciyst 23 246
(1990)
About the author Davor Balzar is with Faculty of Metallurgy of the University of Zagreb Sisak Croatia and was a Guest Researcher at fflST The National Institute of Standards and Technology is an agency of the Technology Administration US Department of Commerce
353
Volume 98 Number 3 May-June 1993
Journal of Research of the National Institute of Standards and Technology
[115] R L Rothman and J B Cohen J Appl Phys 42 971 (1971)
[116] T Adier and C R Houska J Appl Phys 50 3282 (1979)
[117] C R Houska and T M Smith J Appl Phys 52 748 (1981)
[118] S Rao and C R Houska Acta Ciyst A 4214 (1986) [119] J I Langford R Delhez Th H de Keijser and E J
Mittemeijer Ausi J Phys 41173 (1988) [120] J I Langfoid J Appl Cryst IS 315 (1982) [121] M J Turunen Th H de Keijser R Delhez and N M
van der Pers J Appl Ciyst 16176 (1983) [122] A J C Wilson Acta Ciyst 23 888 (1967) [123] A J C Wilson Acta Ciyst A 24 478 (1968) [124] A J C Wilson Acta Ciyst A 25 584 (1969) [125] G Gagliotti A Paoletti and F P Ricci Nucl Instrum
3 223 (1958) [126] J I Langford R J Cernik and D Louer J Appl
Ciyst 24 913 (1991) [127] J I Langford in Accuracy in Powder Diffraction II
preprint [128] A J C Wilson Mathematical Theory of X-Ray Powder
Diffractometiy Centrex Eindhoven The Netherlands (1963)
[129] J L Langford Prog Ciyst Growth and Charact 14185 (1987)
[130] T G Fawcett C E Crowder S J Brownell Y Zhang C R Hubbard W Schreiner G P Hamill T C Huang E Sabino J I Langford R Hamilton and D Louer Pow Diffr 3 209 (1988)
[131] W L Smith J Appl Ciyst 9187 (1976) [132] J L Langford and D Louer J Appl Ciyst 15 20
(1982) [133] Fl Popescu and L Benes Acta Ciyst A 33 323 (1977) [134] P PSuse^cu R MSnaila M Popescu and E Jijovici j
Appl Cryst 7 281 (1974) [135] P F Bley Y Calvayrac and M Fayard J Appl Ciyst
7 493 (1974) [136] B Moraweck Ph de Montgolfier and A J Renouprez
J Appl Ciyst 10191 (1977) [137] A Le Bail and D Louer J Appl Cryst 11 50 (1978) [138] D R Buchanan R L McCuUough and R L Miller
Acta Ciyst 20 922 (1966) [139] P Suortti and L D Jennings Acta Cryst A 33 1012
(1977) [140] J B Cohen and C N J Wagner J Appl Phys 33 2073
(1962) [141] A Bianconi J Budnick A M Flank A Fontaine P
Lagarde A Marcelli H Tolentino B Chamberland C Michel B Raveau and G Demazeau Phys Lett A127 285 (1988)
[142] K Fueki K Kitazawa K Kishio T Hasegawa S Uchida H Takagi and S Tanaka in Chemistiy of High- Temperature Superconductors D L Nelson M S Whittingham and T F George eds American Chemi- cal Society (1987) p 38
[143] T Fujita Y Aoki Y Maeno J Sakurai H Fukuba and H Fujii J Appl Phys 26 U68 (1987)
[144] R M Hazen in Physical Properties of High-rc Super- conductors Vol 2 D M Ginsberg ed World Scien- tific Singapore (1990) p 121
[145] J B Torrance A Bezinge A I Nazzal T C Huang S P Parkin D T Keane S J LaPlaca P M Horn and G A Held Phys Rev B 40 8872 (1989)
[146] J D Axe A H Moudden D Hohlwein D E Cox K
M Mohanty A R Moodenbaugh and Y Xu Phys Rev Lett 62 2751 (1989)
[147] T Suzuki and T Fujita Physica C 159 111 (1989) [148] T Fujita and Y Maeno in Superconducting Materials
JJAP Series 1 (1988) p 34 [149] A Roshko and Y-M Chiang J Appl Phys 66 3710
(1989) [150] D E Cox S C Moss R L Meng P H Hor and C W
Chu J Mater Res 31327 (1988) [151] B Crist and J B Cohen J Polym Sci 17 1001 (1979) [152] H Ledbetter S Kim and A Roshko Z Phys B 89275
(1992) [153] R D Shannon and C T Prewitt Acta Ciyst B 25 925
(1969) [154] M Lang H Spille F Steglich Y Hidaka T Murakami
and Y Endoh Physica C 162-1641037 (1989) [155] Y Hidaka and T Murakami Phase trans 15 241
(1989) [156] P L Gai and E M McCarron Science 247 553 (1990) [157] T Kamiyama I Izumi H Asano H Takagi S Uchida
Y Tokura E Takayama-Muromachi M Matsuda K Yamada Y Endoh and Y Hidaka Physica C 172 120 (1990)
[158] A Kapitulnik Physica C 153-155 520 (1988) [159] L A Muradyan V N Molchanov R A Tamazyan and
V I Simonov Physica C 162-164 536 (1989) [160] P Day M Rosseinsky K Prassides W I F David O
Moze and A Soper J Phys C 20 L429 (1987) [161] J T Lewandowski R A Beyerlein J M Longo and R
A McCauley J Amer Ceram Soc 69 699 (1986) [162] R Ramesh G van Tendeloo G Thomas S M Green
Y Mei C Jiang and H L Luo Appl Phys Lett 53 2220 (1988)
[163] J Schneck L Pierre J C Tolddano and C Daguet Phys Rev B 39 9624 (1989)
[164] O Eibl Physica C 168 215 (1990) [165] W Carrilo-Cabrera and W Gopel Physica C 161 373
(1989) [166] P Bordet J J Capponi C Chaillout J Chenavas A
W Hewat E A Hewat J L Hodeau M Marezio J L Tholence and D Tranqui Physica C 156189 (1988)
[167] R Ramesh K Remschnig J M Tarascon and S M Green J Mater Res 6 278 (1991)
[168] Z Hiroi Y Ikeda M Takano and Y Bando J Mater Res 6 435 (1991)
[169] Y Inoue M Hasegawa Y Shichi I Munakata M Ya- manaka S Hiyama and O Nittono J Mater Res 5 737 (1990)
[170] R Ramesh B G Bagley J M Tarascon S M Green M L Rudee and H L Luo J Appl Phys 67 379 (1990)
[171] X B Kan J Kulik P C Chow S C Moss Y F Yan J H Wang and Z X Zhao J Mater Res 5 731 (1990)
[172] G S Pawley J Appl Ciyst 13 630 (1980) [173] H Toraya J Appl Ciyst 19 440 (1986) [174] L Lutterotti and P Scardi J Appl Ciyst 23 246
(1990)
About the author Davor Balzar is with Faculty of Metallurgy of the University of Zagreb Sisak Croatia and was a Guest Researcher at fflST The National Institute of Standards and Technology is an agency of the Technology Administration US Department of Commerce
353


![Green Synthesis of Ag Nanoparticles in Large Quantity by ... · The peak broadening in X-ray diffraction patterns is constituted by different type of broadening [15] ... H. P. Klug](https://img.pdfslide.us/doc/110x75/60a1deecfecf106ac0479540/green-synthesis-of-ag-nanoparticles-in-large-quantity-by-the-peak-broadening.jpg)