Embed Size (px)
Citation preview
DOCUMENT RESUME
ED 341 738 TM 017 934
AUTHOR Herman, Joan L.; Golan, Shari
TITLE Effects of Standardized Testing on Teachers and
Learning--Another Look.
INSTITUTION Center for Research on Evaluation, Standards, andStudent Testing, Los Angeles, CA.
SPONS AGENCY Office of Educational Research and Improvement (ED),
Washington, DC.
REPORT NO CSE-TR-334PUB DATE 90
CONTRACT OERI-R117G10027
NOTE 110p.
PUB TYPE Reports - Research/Technical (143) --Tests/Evaluation Instruments (160)
EDRS PRICE MF01/PC05 Plus Postage.
DESCRIPTORS Achievement Gains; Curriculum Development;Educational Change; Elementary Education; *ElementarySchool Teachers; Learning Processes; SchoolDistricts; *Scores; *Standardized Tests; *TeacherAttitudes; Test Coaching; Testing Problems; *Test
Use; Test Wiseness
IDENTIFIERS Teaching to the Test; *Testing Effects
ABSTRACTThe effects of standardized testing on schools and on
the teaching and learning processes within schools were studied using
responses from upper elementary school teachers in matched pairs from
11 medium-to-large school districts in 9 states. In all, 341 teachers
responded to a 136-item questionnaire prepared for the study thatexplored the amount and type of test preparation in the classroom andschool, the impact of testing on non-tested subjects, the impact oftesting on teacher pride and professionalism, and attitudes about
reasons why test scores change. Results indicate that testing does
influence the teaching and learning within schools. Substantial time
and attention are devoted to assuring that students are taught tested
objectives and given practice in test content. Schools send messagesto their teachers about the importance of test-curriculum alignment
and teachers design instruction with such alignment in mind. These
effects are particularly evident in schools serving low socioeconomicstatus students. Less apparent is whether test score improvements
signal school improvement or teaching to the test. Twenty-nine tables
and one flowchart present study data. A 25-item list of references
and the Teacher Questionnaire are included. (SLD)
**************************************************************x********Reproductions supplied by EDRS are the best that can be made
from the original document.***********************************************************************
CrRrESFSU.t DEPARTMENT OP EDUCATION
Office of Educational Research and improvement
EDUCATIONAL RESOURCES INFORMMIONCENTER (ERIC)
6/(This document has betro reproduced allreceived rroM the Dyson Or Organilationoriginating it
C) Minor Osman hove been made to improve
reproducton Quality
Points of view Or opinions stated in this docu .
ment do not necessarily represent officialOE RI position or policy
Center tor Researchon Evaluation, Standards:and Student Teshng
Effects of StandardizedTesthig onTeachers
and Learning Another Look
1
CSE Technical Report 334
Joan L. HermanShari Golar
BEST COPY AVAILABLE
Effects of Standardized Testing on Teachersand Learning Another Look
CSE Technical Report 334
Joan L. HermanShari Golan
National Center for Research on Evaluation, Standardsand Student Testing (CRESST)
UCLA Graduate School of Education
:3
Effects of Standardized Testing on Teachers
and Learning Another Look
Mastract
Joan L. Herman
Shari Golan
National Center for Research on Evaluation, Standards
and Student Testing (CRESST)
UCLA Graduate School of Education1
This current study brings additional empirical data tothe debate about the actual effects of standardized testingon teaching and learning. Specifically, this study poses aseries of interrelated questions. First, what are the effectsof standardized testing on (a) schools, and (b) the teachingand learning processes within them? Second, what do testscores mean? For instance, are increasing scores a reflec-tion of a school's test preparation practices, its emphasison basic skills, and/or its efforts toward instructionalrenewal? Third, are there differences in how testing effectsinstruction and what test scores mean between schools servinglower socioeconomic status (SES) students and those servingmore advantaged students?
This paper begins with a review of some past studies onthe effects of standardized testing on schooling. Next,summaries of the study's methodology and its results areprovided. Finally, the implications of the study's findingsfor educational policy and research are reported.
Results indicate that testing does appear to influencethe teaching and learning within schools. Substantial timeand attention are devoted to assuring students are taughttested objectives and given practice in test content.Schools send out messages to their teachers about theimportance of test-curriculum alignment and teachers designtheir instructional programs with such alignment in mind.Such effects are particularly in evidence in schools servinglow SES students. Results were less clear-cut about whethertest score gains signal school improvement or teaching to thetest.
'The work reported herein wu supported ander the Educational Research and Development Center Program cooperative agreement R117G10027 andCFDA catalog numbez 84.1170 as administered by the Office of Educational Reseirch and Improvement, U.S. Department of Education The findingsand opinions expreued in this repon do not reflect the position or policies of the Office of Educational Research and Impftwanan or the U.S.Department of Education.
Effects of Standardized Testing on Teachers
and Learning Another Look
Joan L. Herman
Shari Golan
National Center for Research on Evaluation, Standards
and Student Testing (CRESST)
UCLA Graduate School of Education1
Standardized testing has assumed a prominent role in
recent efforts to improve the quality of education. National,
state, and district tests, combined with minimum competency,
special program, and special diploma evaluations, have
resulted in a greatly expanded set of testing requirements
for most schools. At a cost of millions, even billions, of
dollars and at the expense of valuable student, teacher, and
administrator time, testing advocates and many policymakers
still view testing as a significant, positive, and cost-
effective tool in educational improvement.
Testing advocates' support for testing as such a tool is
based on a simple set of arguments. First, testing sets
meaningful standards to which school districts, schools,
teachers, and students can aspire. Second, test data can be
used as feedback to shape classroom instruction. Third,
1 The work reported herein was supported under the Educational ReLearch and Development Center Programcooperative agreement R117G10027 and CFDA catalog number 841.11'/C as administered by the Office ofEducational Research and Improvement, U.S. Department of Education. The findings and opinions expressed inthis report do not reflect the position or policies of the Office of Educational Research and Improvement orthe U.S. Department of Education.
2
testing makes school systems, schools, and teachers more
accountable for student learning. Finally, testing, coupled
with incentives and/or sanctions, can be used to promote fast
and broad changes within schools and can stimulate major
educational. reform.
While testing is thought by many to benefit education in
a variety of ways, the validity and value of traditional
standardized tests are subjects of increasing debate. Recent
studies raise questions about whether improvements in test
score performance actually signal improvement in learning
(Cannell, 1987; Linn, Grave, & Sanders, 1989; Shepard, 1990).
Other studies point to standardized tests' narrowness of
content, their lack of match with curricula and instruction,
their neglect of higher order thinking skills, and the
limited relevance and meaningfulnes of their multiple choice
formats (Baker, 1989; Herman, 1989; Shepard, 1990).
According to these and other researchers, rather than exert-
ing a positive influence on student learning, testing may
trivialize the learning and instructional process, distort
curricula, and usurp valuable instructional _Arne (Bracey,
1989; Dorr-Bremme & Herman, 1986; Romberg, Zarinnia,
Williams, 1989; Smith, Edelsky, Draper, Rottenberg, &
Cherland, 1989; Stake, 1988) . Schools serving disadvantaged
students are thought tc be particularly at risk for such
adverse effects (Dorr-Bremme & Herman, 1986),
3
This current study brings additional empirical data to
the debate about the actual effects of standardized testing
on teaching and learning. Specifically, this study poses a
series of interrelated questions. First, what are the effects
of standardized testing on (a) schools, and (b) the teaching
and learning processes within them? Second, what do test
scores mean? For instance, are increasing scores a reflec-
tion of a school's test preparation practices, its emphasis
on basic skills, and/or its efforts toward instructional
renewal? Third, are there differences in how testing effects
instruction and what test scores mean between schools serving
lower socioeconomic status (SES) students and those serving
more advantaged students?
This paper begins with a review of some past studies on
the effects of standardized testing on schooling. (The find-
ings of these studies helped focus our key research questions
and suggested specific items for study instrumentation.)
Next, summaries of the study's methodology and its results
are provided. Finally, the implications of the study's find-
ings for educational policy and research are reported.
Literature Review
The following review examines research on a number of
variables through which testing may influence schools. The
variables are: accountability pressure, teacher attention to
testing in instructional planning and delivery, time spent on
test preparation, teachers' sense of professional pride, and
4
general attitudes teachers hold about the fairness and util-
ity of testing.
Accountability pressure. It is well documented that
standardized test scores are used by school administrators
and the public to evaluate schools, teachers, and educational
programs. Purther, test scores are used in making a variety
of decisions which have important consequences for teachers
and students, that is, student promotion, teacher promotion,
and program funding (Madaus, 1985, 1988, 1990; Tyler & White,
1979) . The accountability pressure thus promoted has been
examined in a number of studies. Some have investigated the
factors which influence the amount of pressure experienced by
teachers (Fish, 1988), while others have examined how
accountability pres.:ures influence teachers and teaching
behavior (Kelleghan & Madaus, 1985; Fish, 1989; Dorr-Bremme
1983).
Fish found that apparent pressure on teachers to improve
their students' test scores was influenced by a number of
factors including: the degree and nature of administrator
involvement, teachers' professional self-concepts, and teach-
ers' years of teaching experience (Fish, 1988) . Thus, admin-
istrator concern over test scores was positively related to
accountability pressure reported by teachers. Both positive
teacher self-concept and more years of teaching experience
were negatively related to such pressure. One possible
explanation for experienced teachers feeling less account-
5
ability pressure comes from a study by Smi h, et al. (1989).
Smith and her colleagues found that veteran teachers more
often believed that low test scores were due to factors
beyond their control, such as low student ability and
discrepancies between the test and curriculum, than did
novice teachers.
Madaus (1988) also studied factors that increase the
accountability pressure on teachers to improve their
students' test scores. He coined the phrase "high stakes
testing" to refer to testing which promotes pressure and
behavior change by associating test results with important
consequences. Also noting this phenomenon, Romberg et al.
(1989) concluded "the greater the consequences attached to
the test, the more likely it would be to have an impact [on
teaching)" (p. 14). Similar to Madaus, Fish (1988) found
that the amount of pressure felt by teachers increased with
their belief that test results were to be used more for
teacher evaluation than for student diagnosis and prescrip-
tion.
The literature shows disagreement over whether account-
ability pressure exerts positive, negative, or no effects on
teaching and teaching behavior. Some, for example, have noted
potential positive effects on teacher motivation. Madaus
(1985) observed that when test score gains are tied to incen-
tives, such as Distinguished School Awards, Cash for CAP,
career ladder incentives, and celebrations; teachers feel
6
motivated rather than pressured to increase scores. In addi-
tion, Fish (1988) found that teachers were enthusiastic about
efforts to raise test scores when their principals adopted a
collaborative rather than a dictatolial approach to test
score improvement.
Other literature suggests that teachers respond nega-
tively to pressure created by testing. Fish (1988) found
that one factor reducing such negative impact was years of
teaching experience. She observed that relatively inexperi-
enced teachers felt greater anxiety and accountability pres-
sure than experienced teachers. Fish also found that teach-
ers reacted negatively to pressure created by public displays
of classroom scores. Furthermore, when teacher-specific
and/or classroom-specific accountability existed, teachers
reported instances of cheatinggiving direct hints to
students or changing student responses on testsand feelings
of anxiety and low self-esteem. Dorr-Bremme, Burry,
Catterall, Cabello, and Daniels (1983) reported similar
teacher testimonies about feelings of anxiety when scores
were publicly posted. In addition, they found that anxiety
increased when principals wanted to know why there had been a
decline in scores.
Still other studies argue that testing and accounta-
bility pressure have little or no effect on teaching.
According to these studies, teachers discount the credibility
of standardized tests and do not take action based on them.
7
Salmon-Cox (1981) found that mandated achievement tests were
of little relevance to teachers, and that teachers viewed the
results of such tests as relatively unreliable sources of
information. Dorr-Bremme and Herman (1983) as well as
Ruddell (1985) found that teachers paid little attention to
standardized tests for these same reasons. Goslin (1967)
similarly observed that teachers felt that standardized
achievement tests were unfair and inaccurate measures of
student ability and therefore were not worth considering in
their decision-making.
Influence of testing on teacher planning and
instruction. Several studies have investigated the ways in
which testing influences teacher planning and instruction.
Herman and Dorr-Bremme (1983) found relatively little influ-
ence of standardized tests on teacher decision-making; for
instance, in grouping students, planning instruction, grad-
ing, diagnosing/prescribingcompared to other sources of
information available to teachers. In contrast, Salmon-Cox
(1981) reported that teachers in Pittsburgh found the
California Achievement Test to be useful in sequencing
instruction, planning instruction and grouping students.
Mehrens (1984) found that achievement testing served to
broaden the curriculum; that is, testing encouraged teachers
to add to, rather than replace existing instructional topics.
However, when test results are linked to rewards or
sanctions, studies have found that "high stakes" testing
8
leads to a narrowing of curricula and instruction. Madaus
(1988) noted that teachers taught to the test when they
believed important decisions, 1.1ch as student promotion,
would be based on test scores. Smith et al. (1989) found that
pressure to improve students' test scores caused some teach-
ers to "neglect material that the external test does not
include...reading real books, writing in authentic context,
solving higher-order problems, creative and divergent think-
ing projects, longer-term integrative unit projects, [and]
computer education..." (p. 268). She and her colleagues also
found that teachers were using worksheets with the same ques-
tion format as the mandated test. Corbett and Wilson (1988),
in a study of Maryland schools, similarly found that schools
redefined course objectives and resequenced course content in
an attempt to improve test scores. Stodolsky (1988) further
observed that accounta-bility pressure discouraged teachers
from using joint or team teaching approaches and from chang-
ing their methods to facilitate serious student learning.
Time spent on testing and test preparation. The
amount oil instructional time teachers spend on test prepara-
tion has been well documented. Smith and her colleagues
(1989) reported that teachers in two case study schools spent
three to four weeks of school time on special test prepara-
tion for standardized tests, and that time spent on test
preparation increased with the approach of the test date.
Similarly, Edelman (1981) found that even though teachers

9
varied in the specific ways and extent to which they prepared
students for mandated tests, 60% of the teachers stressed
test content over a long period of time. Moreover, Fish
(1989) found that teachers, over the past five to six years,
increased the amount of time they spent on practices which
they believed would increase test scores.
Teachers' sense of professionalism and pride in
work. Fish (1988), as previously mentioned, found that teach-
ers' professional self-images are negatively related to the
pressure they feel to raise test scores. She noted that
feelings of guilt, anger, and low professional esteem
increased when teachers engaged in questionable testing and
test preparation activities. Corbett and Wilson (1988) also
substantiated the high pressure and negative affect felt by
teachers. A common reaction, according to Corbett and Wilson,
was captured by this frustrated teacher's comments, "Teachers
feel jerked around. The test dictates what I will do in the
classroom. If you deviate from the objectives, you feel
guilty...we were told 'here's how to get kids to pass the
test fast'"(p. 36).
Teachers' general attitudes about the validity of
testing. Teacher reactions to the validity of standardized
testing, according to the literature, range from concern to
distrust. Findings from Dorr-Bremme et al. (1983) indicated
that teachers were concerned about the utility of mandated
tests, their appropriateness for some students, and the
.1 j
10
impact of testing on instructional time and student self-
confidence. Similarly Smith et al. (1989) reported that
tea,: ers were pessimistic about what scores reveal. Less
than one-fifth of the teachers interviewed felt that results
from the mandated, standardized test used in their schools
accurately reflected their students' learning for the year.
Moreover, only 3% of the teachers from their study felt that
the test was appropriate for ethnic minorities or non-English
speakers. Finally, Fish (1988) documented the general
teacher attitude that tests do not reflect classroom curricu-
lum or student learning. Interestingly, however, Fish found
that even teachers who viewed standardized tests as poor
measures of student achievement still felt the need to spend
a great deal of time on test preparation.
These findings raise questions concerning possible
discrepancies between teachers' beliefs about the utility and
reliability of standardized testing and their classroom
instructional behavior in preparing their students for tests.
The meaning of test score gains. The meaningfulness
of standardized test scores as indicators of true student
learning has recently come under serious question from other
sources as well. Cannell (1987) discovered that all 50
states and most districts reported above-average performance
on standardized, norm-referenced achievement test scores, an
unnatural occurrence given the norm-referenced metric. Using
greater technical rigor, Linn et al. (1989) replicated
11
Cannell's findings, but moved beyond them in identifying
underlying causes for such seemingly spurious results, among
them the age of norms. In a related interview study, Shepard
(1990) identified additional issues which contribute to score
inflation, among them the practice of using the same test
forms year after year, the practice of having classroom
teachers administer the tests, questionable test preparation
practices, and the pressure on teachers to raise test scores.
The combined results from these studies raise questions
about whether test score gains signal improvement in broader
student learning or whether they simply reflect teaching to
the test, that is, unduly focusing the currimilum on narrow
test content and/or having students practice items nearly
identical to those appearing on the test, and/or, worse
still, giving students practice with the actual items. A
basic issue is: Do current accountability pressures drive
schools to narrow their curriculum and engage in unsound
instructional practices at the cost of broader student learn-
ing, school attitudes, and climate?
Key Research Questions
The current inquiry investigated a number of issues
raised separately by these previous studies, looking particu-
larly at the interplay between the effects of testing on
teaching and learning processes in schools an4 the consequent
meaning of test score gains. Specific research questions
included:

12
1. What are the effects of testing on schools and on the
teaching and learning processes within them?
a. How much and from where do teachers feel
pressure to improve their students' test scores?
b. How much and how does test preparation affect
teachers' instructional planning, learning strate-
gies, and curriculum content for tested subjects
and what impact does test preparation have on non-
tested subjects?
c. How much time do school administrators spend on
test preparation and how does that amount of time
compare to the time they spend on instructional
renewal?
d. What effect does testing have on teachers' sense
of professionalism and pride in their work?
e. What general attitudes do teachers hold about
the reasons test scores change, their fairness, and
their usefulness?
2. What is the meaning of test score gains? Specifical-
ly, can we differentiate schools showing increasing
scores from those showing stable or decreasing scores in
terms of:
a. Emphasis on testing and test preparation?
b. Attention to school renewal?

13
3. Does testing have differential meaning in schools
serving students from mostly economically disadvantaged
backgrounds and those serving their more advantaged
counterparts?
Our study used survey methodology to address these ques-
tions, comparing the testing and educational practices of
schools with increasing test scores to the practices of
schools with stable or decreasing test scores. Responses
from schools serving higher and lower socioeconomic status
students also were compared.
Methodology
Subjects (Table 1). The study results are based on
responses from upper elementary school teachers in matched
pairs of schools from 11 medium-to-large school districts in
nine states across the country. This sample was the result of
a phased selection process. First, districts representing
diverse geographical locales were identified and their will-
ingness to participate in the study was secured. Directors
of research and evaluation (or their counterparts) in
consenting districts were then asked to identify pairs of
schools in their districts which were demographically simi-
lar, for example, having the same socioeconomic standing. It
was also requested that one school in the pair had shown a
significant increase in standardized test scores over the
previous three years (8 to 10 National Curve Equivalent
points) and the other school had shown no such increase
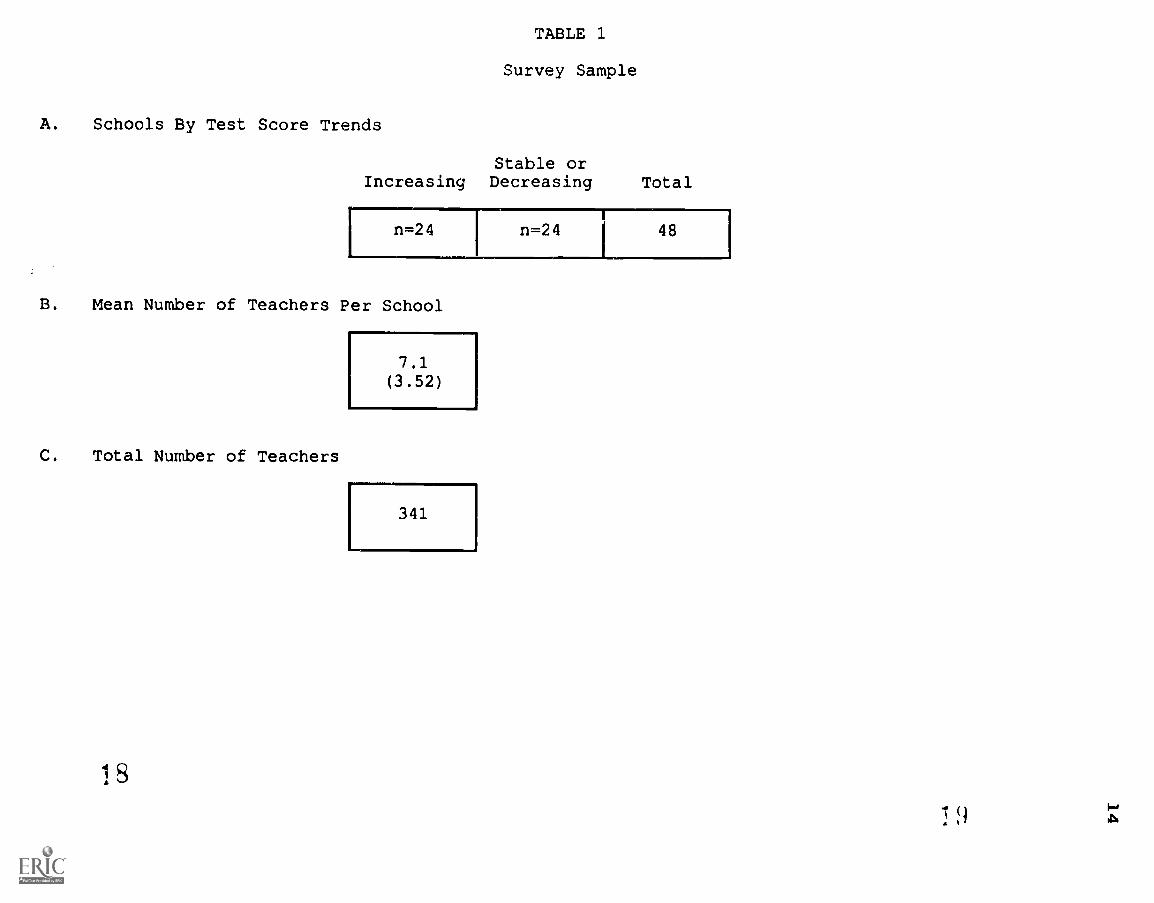
TABLE 1
Survey Sample
A. Schools By Test Score Trends
Stable orIncreasing Decreasing Total
n=24 n=24 48
B. Mean Number of Teachers Per School
C. Total Number of Teachers
7.1(3.52)
r 341
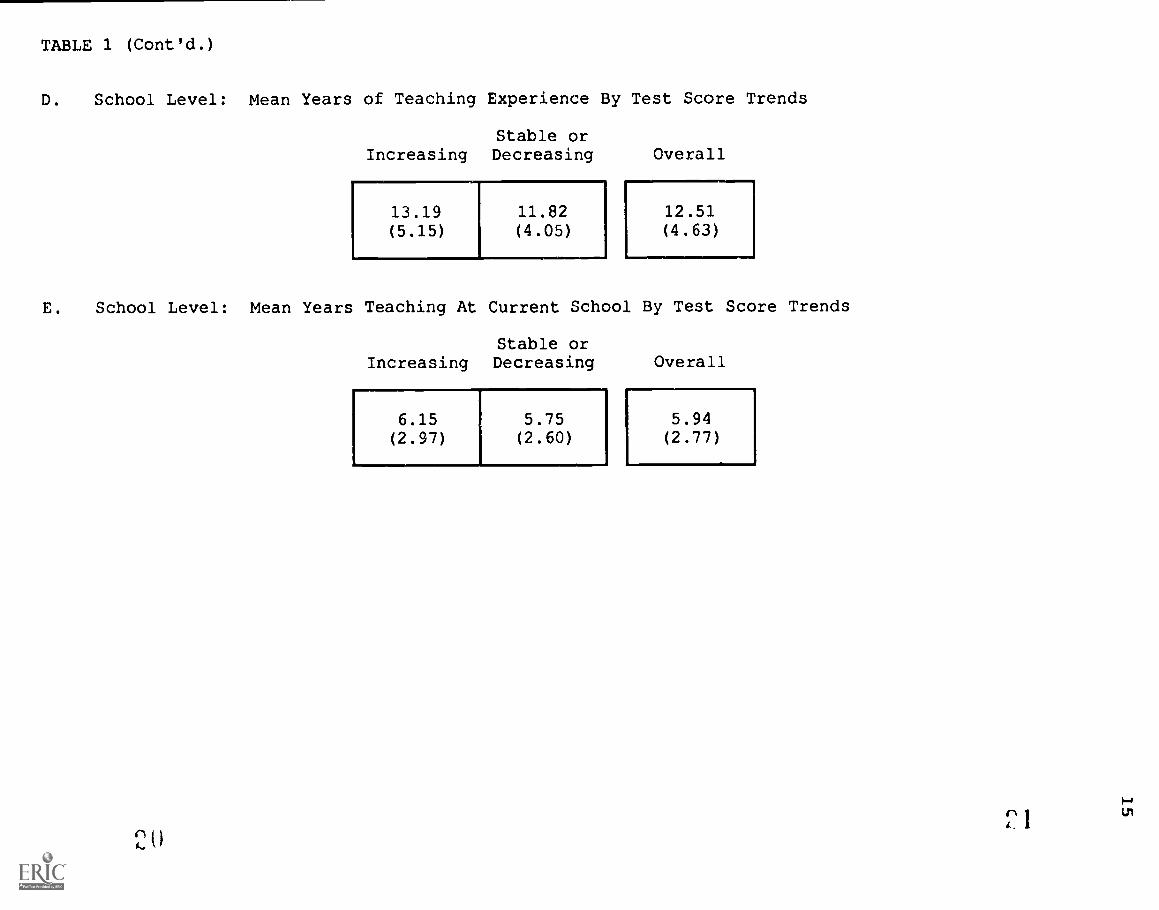
TABLE 1 (Cont'd.)
D. School Level: Mean Years of Teaching Experience By Test Score Trends
Stable orIncreasing Decreasing Overall
13.19(5.15)
11.82(4.05)
L12.51](4.63)
E. School Level: Mean Years Teaching At Current School By Test Score Trends
Stable orIncreasing Decreasing Overall
6.15(2.97)
5.75(2.60)
T-5.94(2.77)
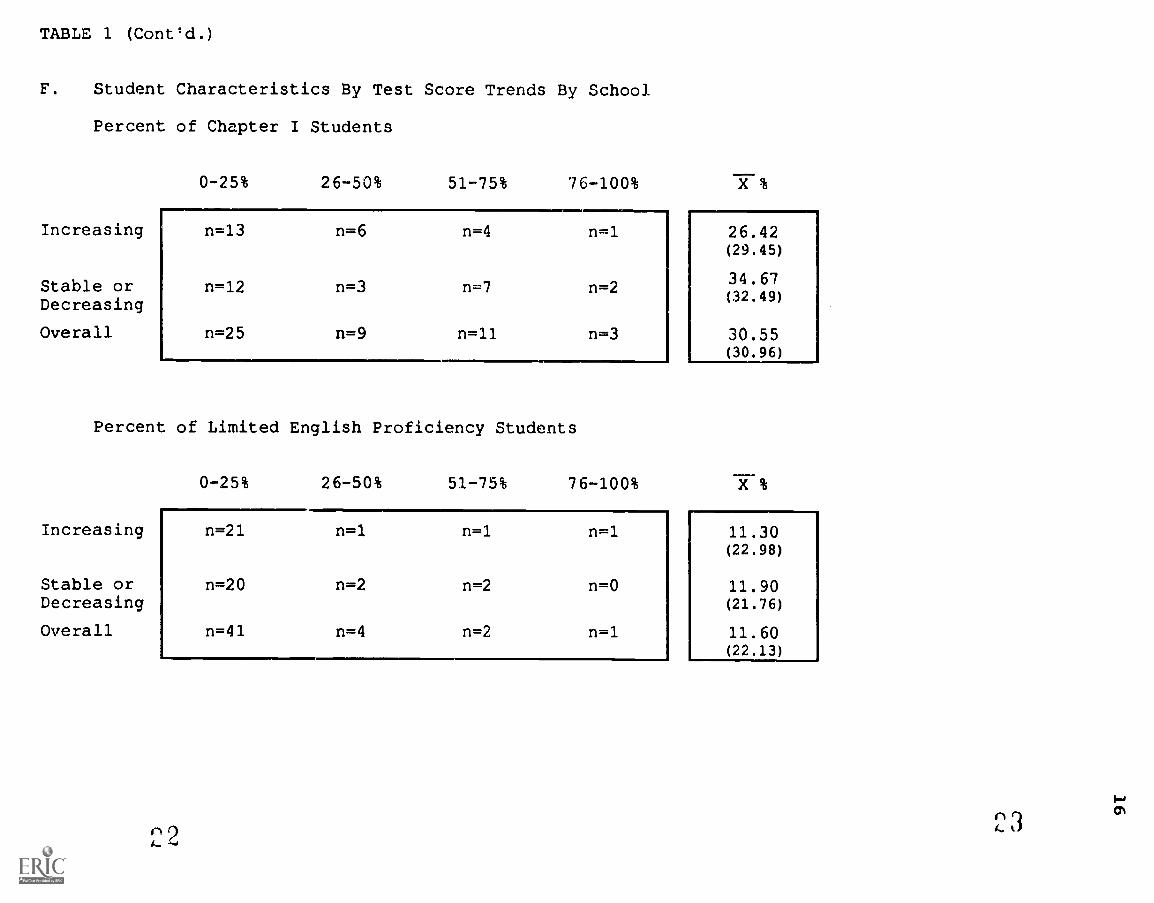
TABLE 1 (Cont'd.)
F. Student Characteristics By Test Score Trends By School
Percent of Chapter I Students
0-25% 26-50% 51-75% 76-100%
--
Increasing n=13 n=6 n=4 n=1
Stable or n=12 n=3 n=7 n=2Decreasing
Overall n=25 n=9 n=11 n=3
Percent of Limited English Proficiency Students
Increasing
Stable orDecreasing
Overall
0-25% 26-50%
X %
26.42(29.45)
34.67(32.49)
30.55(30.96)
51-75% 76-100%
n=21 n=1
n=20 n=2
n=41 n=4
n=1
n=2
n=2
n=1
n=0
n=1
22
11.30(22.98)
11.90(21.76)
11.60(22.13)
23
17
(having either remained stable or decreased over the same
time period) . The plan asked for two low SES pairs and one
medium or high SES pair. The majority of directors, however,
could not generate three such pairs. (In fact, a number of
additional districts who were willing to participate in the
study were unable to generate three pairs of schools with
contrasting performance trends because they could not iden-
tify any schools that had demonstrated clear upward score
trends.)
Identified schools were then contacted, and all upper
elementary school teachers within them asked to complete
questionnaires. A modest honorarium was offered to each
teacher returning a survey. All schools so contacted agreed
to participate in this study. Data were subsequently
received from 341 third- through sixth-grade teachers from 24
matched pairs of schools, a total of 48 schools representing
the West, the Southwest, the Midwest, the Southeast, and the
East Coast regions of the country. Responses were received
from approximately seven teachers at each school.
Based on the results of the survey, the schools in this
study had highly experienced teaching staffs, with an average
of 12.5 years of teaching experience. The teaching staffs at
schools with increasing scores had a slightly higher average
of 13.2 years teaching experience than staffs at schools with
decreasing or stable scores who averaged 11.8 years of
experience. Teacher respondents from both types of schools
18
showed similar longevity; both groups on average had taught
at those schools for approximately six years.
The teachers in this study also provided data about the
students they taught. Specifically, they estimated the
percentage of their students who were classified as Chapter
One participants and/or Limited English Proficient. The aver-
age percentage of Chapter One students reported at the
schools with increasing scores is slightly lower (26.4%) than
the number reported at schools with decreasing or stable
scores (34.7%) . Both types of schools reported a similarly
low percentage of Limited English Proficient students
(11.6%). Chapter One percentages were used subsequer'-ly to
determine schools' socioeconomic status (SES) for study
purposes. Low SES schools were those reporting more than 50%
Chapter One students, while high SES schools were those
reporting 20% or less Chapter One students (Table 2).
Measures. A teacher questionnaire containing 136 items
was specially developed for the study. The questionnaire
asked about teacher and student background characteristics,
perceived pressure to improve test scores, and influence of
testing on teacher planning. The questionnaire also asked
about amount and type of test preparation at the classroom
and school level, impact of testing on non-tested subjects,
impact of testing on teacher pride and sense of professional-
ism, and general attitudes about reasons test scores change,
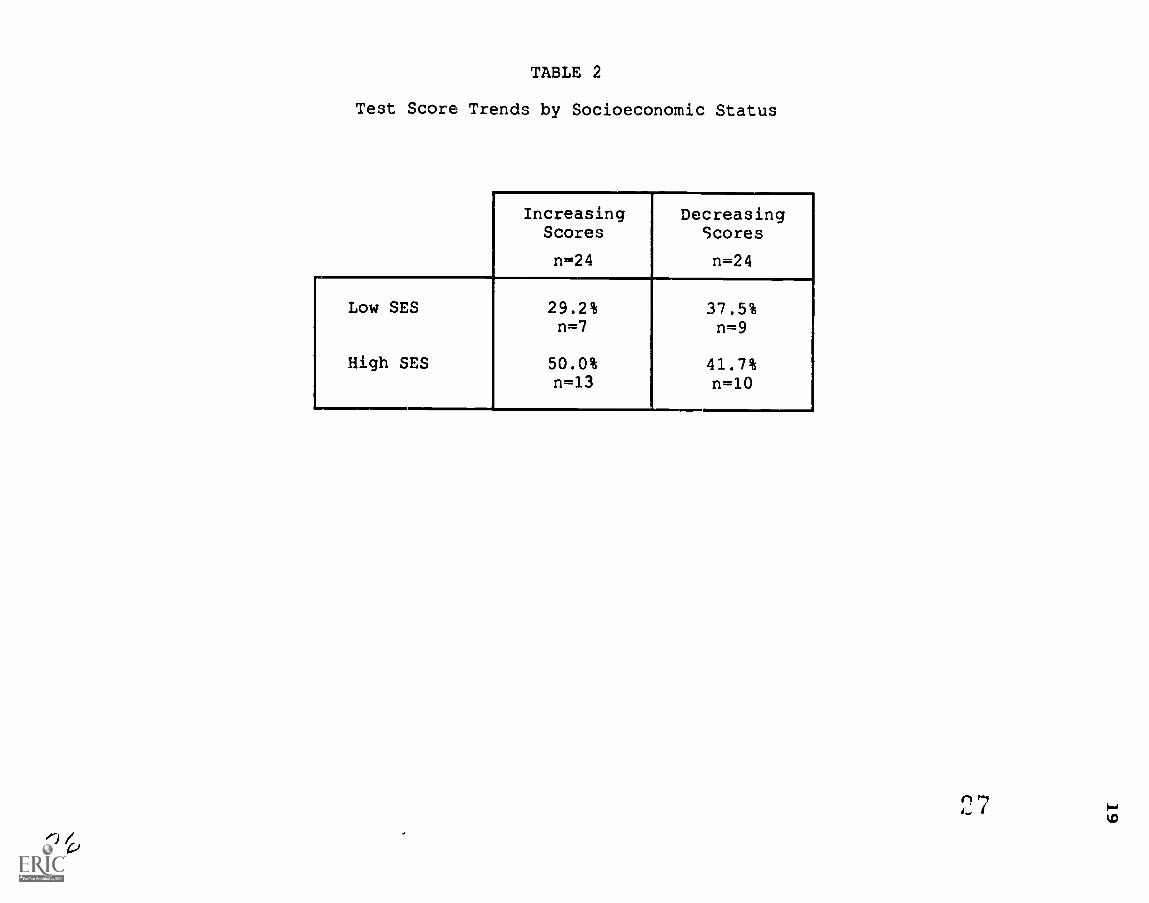
TABLE 2
Test Score Trends by Socioeconomic Status
Increasing DecreasingScores Scores
n=24 n=24
Low SES 29.2% 37.5%n=7 n=9
High SES 50.0% 41.7%n=13 n=10
20
their fairness, and their usefulness. The complete question-
naire can be found in Appendix A.
Data collection procedures. As soon as permission
was received to conduct the study, testing directors called
the principals of the paired schools to notify them of their
selection. Next, study researchers contacted the principals
both by phone and letter to communicate the purpose and the
methodology of the study. Along with a set of teacher ques-
tionnaires and return envelopes, principals were sent a
letter that gave a brief rationale of the study to share with
their teachers, and a reminder to inform teachers that they
would be paid a modest honorarium for their participation.
Teachers were instructed to mail back their questionnaires
directly to the researchers.
Data analysis procedures. Data were coded by school,
test score trend status, socioeconomic status and other iden-
tifying information. Data were then aggregated at the school
level for analysis; that is, the responses of individual
teachers were averaged with those of other teachers from
their school and then comparisons made between matched
responses from schools with increasing scores and those with
stable or decreasing scores. School level estimates were
based on at least three responses from a school, and only
matched schools were included in the final data set. Thus,
if there were no responses from one school within a matched
21
pair, responses from the other school were eliminated from
the analysis.
Comparisons also were made between high and low SES
schools, both within and across schools with different test
score trends. Because the research design was not fully
crossed on these latter variables, these analyses are
intended only as exploratory. Finally, correlations were
used to examine relationships between overall factors
believed to contribute to testing effects and test score
gains.
Limitations of study. Beyond reliance on self-report
data, an important limitation of the study is related to the
selection of suitable school pairs, especially in urban
districts with large numbers of disadvantaged students (our
original target population) . Our methodology relied on
research and evaluation directors' expert judgm nt in identi-
fying demographically similar pairs of schools, where one
school had demonstrated a clear improvement in test scores
and one had not. As mentioned, a number of districts had
difficulty in identifying schools with clear upward trends,
skewing the sample; and it is possible that some directors
who did identify schools for our sample may have used infor-
mation in addition to test scores when defining whether or
not a school was improving.
gesuli-a
22
Pressure to improve student test scores (Tables 3
and 4) . Overall, teachers report feeling strong pressure
from district administrators and the media to improve their
students' test scores. Teachers also report feeling a moder-
ate amount of such pressure from their principals, other
school administrators, other teachers, parents, and the com-
munity. Interestingly, teachers in schools with increasing
test scores report feeling more pressure from every source
than teachers in schools with stable or decreasing scores.
Further, when responses from high and low SES schools are
compared, teachers in these schools feel the greatest pres-
sure from different sources, with the exception of the media.
Teachers in high SES schools report that parents, the commu-
nity, and the media are the strongest sources of pressure,
while teachers in low SES schools feel the most pressure from
district administrators, principals, other school administra-
tors, and the media. Finally, it is interesting to note that
teachers in high SES schools with increasing test scores
report the most overall pressure, while the teachers in low
SES schools with decreasing scores report the least amount of
overall pressure.
Effects of test preparation on curriculum
content, teachers' instructional planning, and class-
room activities for tested subjects (Tables 5-8) . In
general, the teachers in our sample report that testing
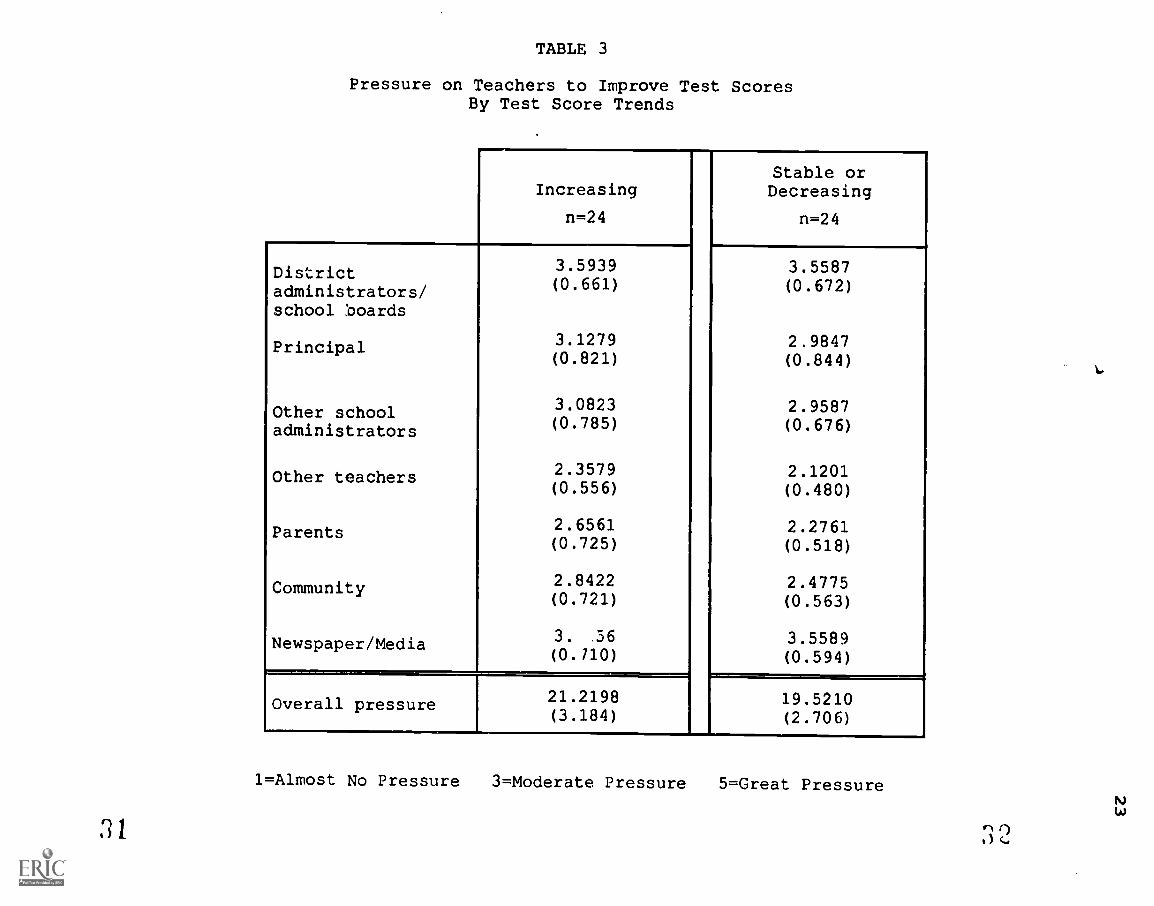
TABLE 3
Pressure on Teachers to Improve Test ScoresBy Test Score Trends
Increasing
n=24
Districtadministrators/school boards
Principal
Other schooladministrators
Other teachers
Parents
Community
Newspaper/Media
Overall pressure
3.5939(0.661)
3.1279(0.821)
3.0823(0.785)
2.3579(0.556)
2.6561(0.725)
2.8422(0.721)
3. 36(0.710)
21.2198(3.184)
Stable orDecreasing
n=24
3.5587(0.672)
2.9847(0.844)
2.9587(0.676)
2.1201(0.480)
2.2761(0.518)
2.4775(0.563)
3.5589(0.594)
19.5210(2.706)
1=Almost No Pressure 3=Moderate Pressure 5=Great Pressure
Ina
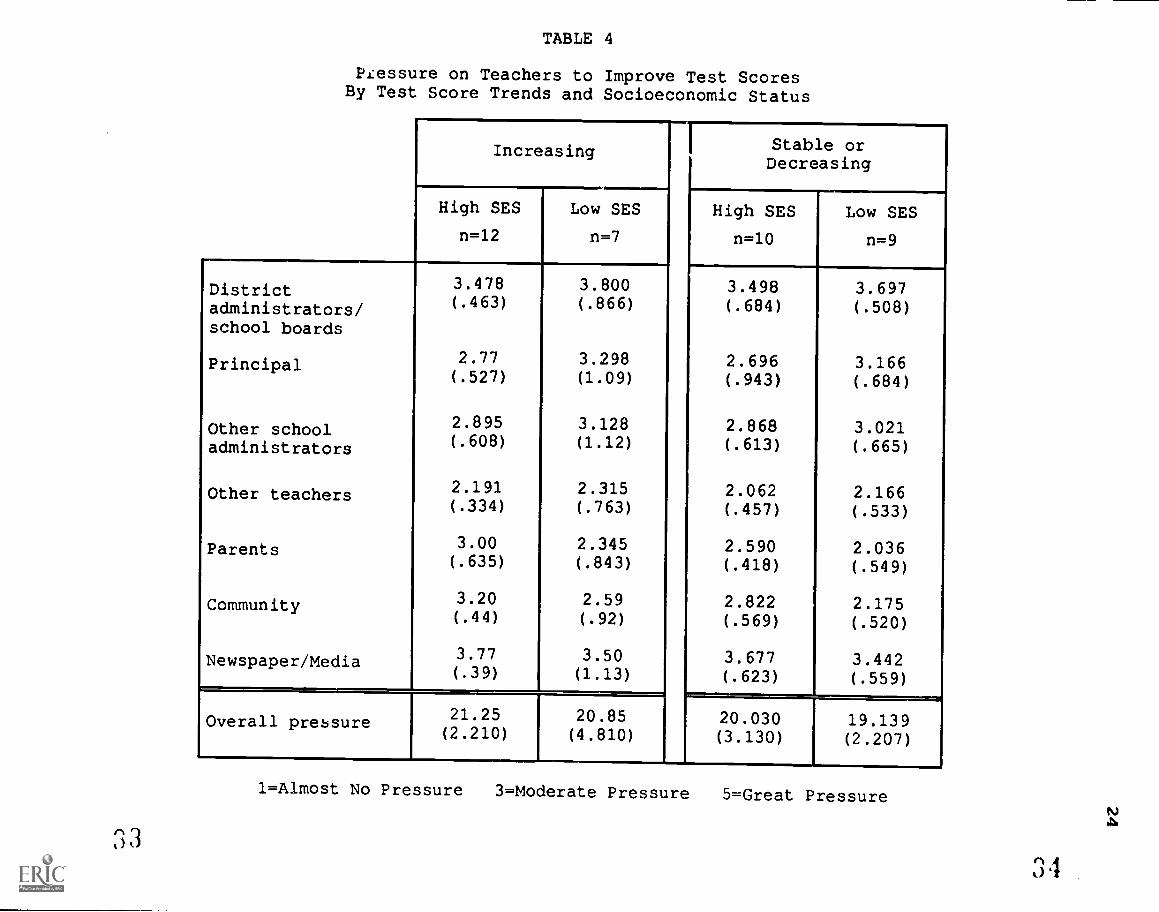
TABLE 4
PI:essure on Teachers to Improve Test ScoresBy Test Score Trends and Socioeconomic Status
Increasing
High SES
n=12
Low SES
n=7
Districtadministrators/school boards
Principal
Other schooladministrators
Other teachers
Parents
Community
Newspaper/Media
3.478(.463)
2.77(.527)
2.895(.608)
2.191(.334)
3.00(.635)
3.20(.44)
3.77(.39)
Overall pressure 21.25(2.210)
3.800(.866)
3.298(1.09)
3.128(1.12)
2.315(.763)
2.345(.843)
2.59(.92)
3.50(1.13)
20.85(4.810)
Stable orDecreasing
High SES
n=10
Low SES
n=9
3.498 3.697(.684) (.508)
2.696 3.166(.943) (.684)
2.868 3.021(.613) (.665)
2.062 2.166(.457) (.533)
2.590 2.036(.418) (.549)
2.822 2.175(.569) (.520)
3.677 3.442(.623) (.559)
20.030 19.139(3.130) (2.207)
1=A1most No Pressure 3=Moderate Pressure 5=Great Pressure
;') :3
3 4
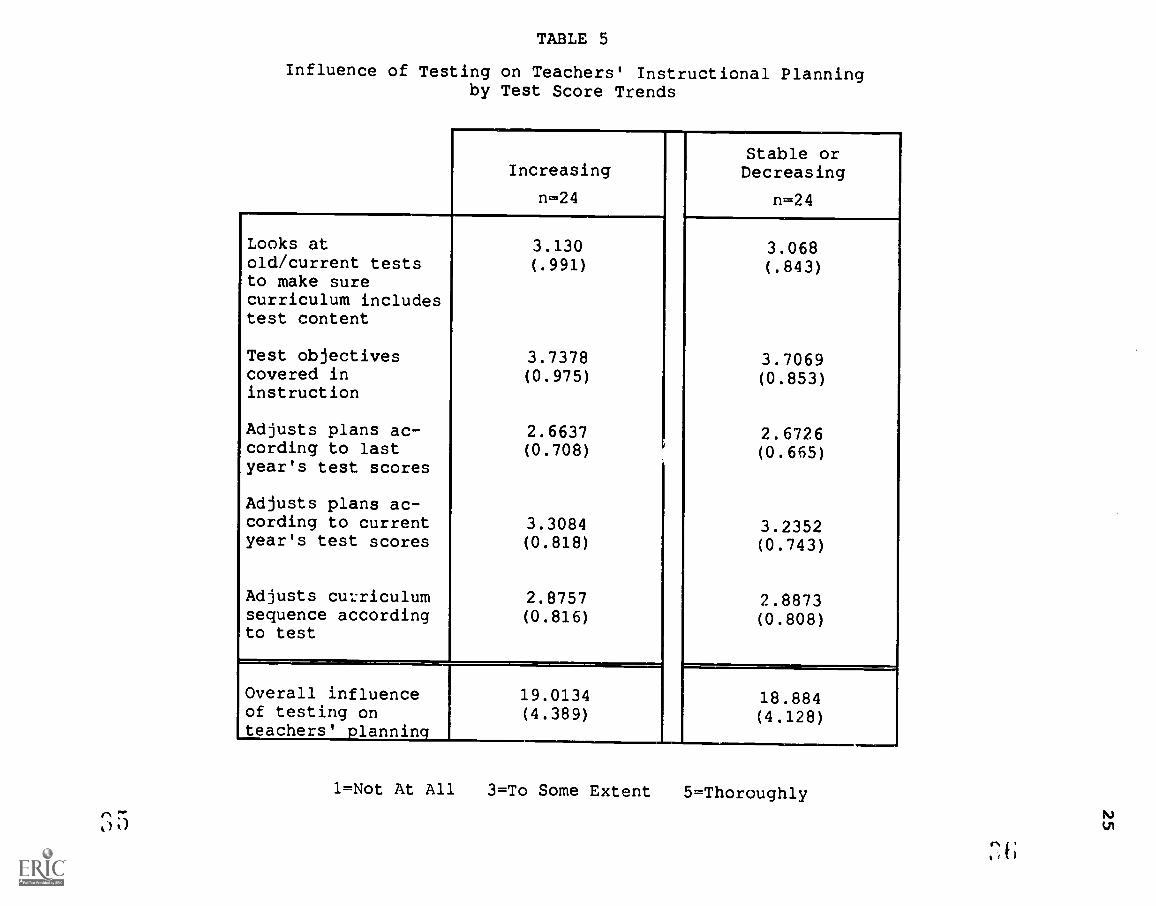
TABLE 5
Influence of Testing on Teachers' Instructional Planningby Test Score Trends
Increasing
n=24
Looks atold/current teststo make surecurriculum includestest content
Test objectivescovered ininstruction
Adjusts plans ac-cording to lastyear's test scores
Adjusts plans ac-cording to currentyear's test scores
Adjusts cul:riculumsequence accordingto test
3.130(.991)
3.7378(0.975)
2.6637(0.708)
3.3084(0.818)
2.8757(0.816)
Overall influenceof testing onteachers' lannin
19.0134(4.389)
Stable orDecreasing
n=24
3.068(.843)
3.7069(0.853)
2.6726(0.665)
3.2352(0.743)
2.8873(0.808)
18.884(4.128)
1=Not At All 3=To Some Extent 5=Thoroughly
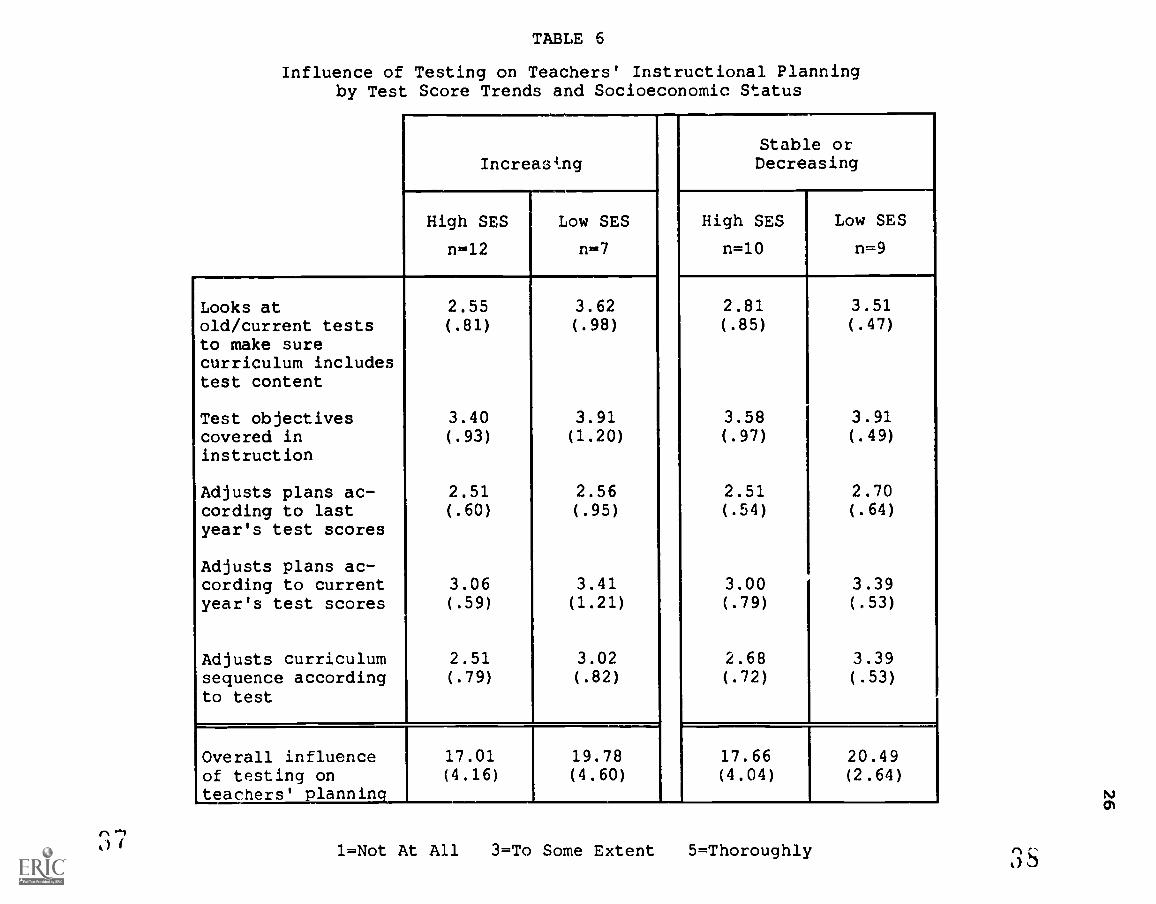
TABLE 6
Influence of Testing on Teachers' Instructional Planningby Test Score Trends and Socioeconomic Status
Increas4.ng
High SES
n=12
Looks atold/current teststo make surecurriculum includestest content
Test objectivescovered ininstruction
Adjusts plans ac-cording to lastyear's test scores
Adjusts plans ac-cording to currentyear's test scores
Adjusts curriculumsequence accordingto test
2.55(.81)
3.40(.93)
2.51(.60)
3.06( .59)
2.51(.79)
Low SES
n=7
3.62(.98)
3.91(1.20)
2.56(.95)
3.41(1.21)
3.02(.82)
Overall influenceof testing onteachers' planning
17.01(4.16)
19.78(4.60)
Stable orDecreasing
High SES
n=10
Low SES
n=9
2.81(.85)
3.58(.97)
2.51(.54)
3.00(.79)
2.68(.72)
3.51(.47)
3.91(.49)
2.70( .64)
3.39(.53)
3.39(.53)
17.66(4.04)
20.49(2.64)
1=Not At All 3=To Some Extent 5=Thorough1y 3S
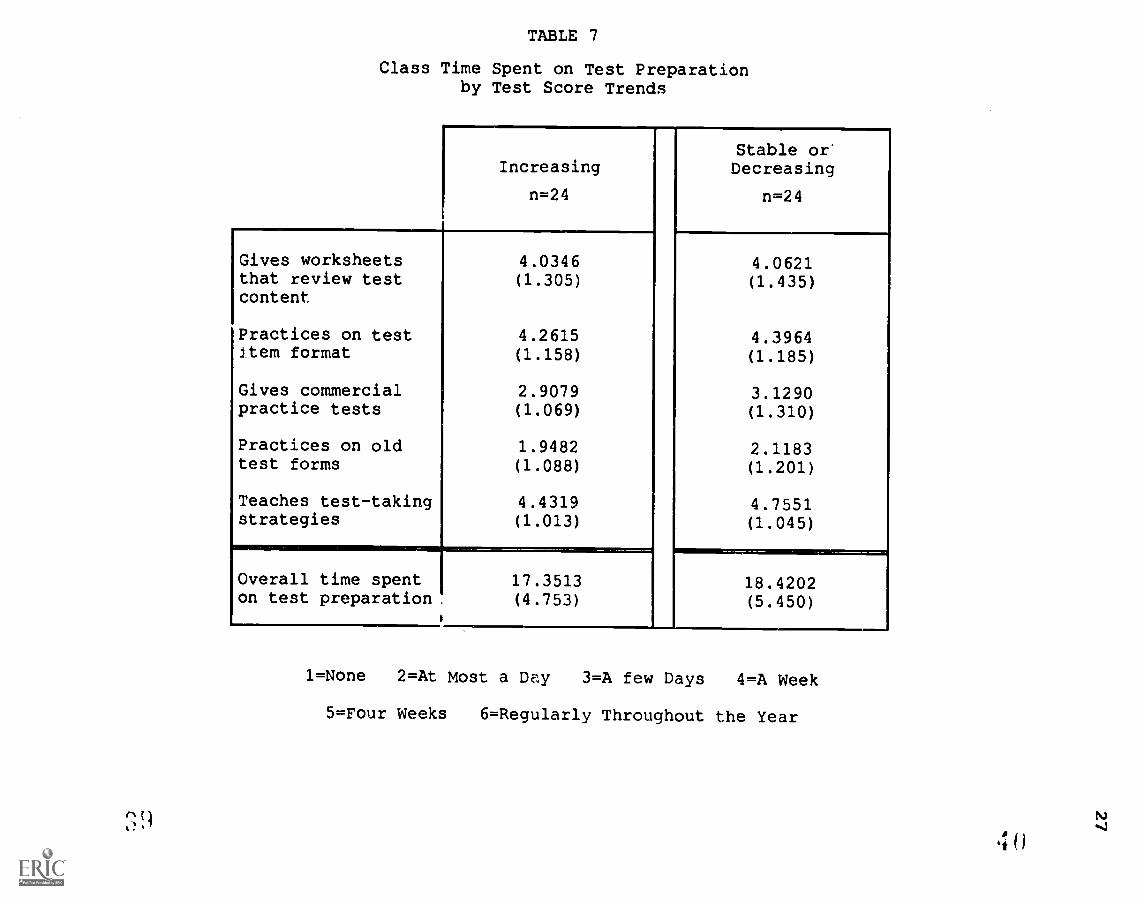
TABLE 7
Class Time Spent on Test Preparationby Test Score Trends
Increasing
n=24
Stable orDecreasing
n=24
Gives worksheets 4.0346 4.0621that review testcontent
(1.305) (1.435)
Practices on test 4.2615 4.3964Jtem format (1.158) (1.185)
Gives commercial 2.9079 3.1290practice tests (1.069) (1.310)
Practices on old 1.9482 2.1183test forms (1.088) (1.201)
Teaches test-taking 4.4319 4.7551strategies (1.013) (1.045)
Overall time spent 17.3513 18.4202on test preparation. (4.753) (5.450)
1=None 2=At Most a Day 3=A few Days 4=A Week
5=Four Weeks 6=Regularly Throughout the Year
n(1
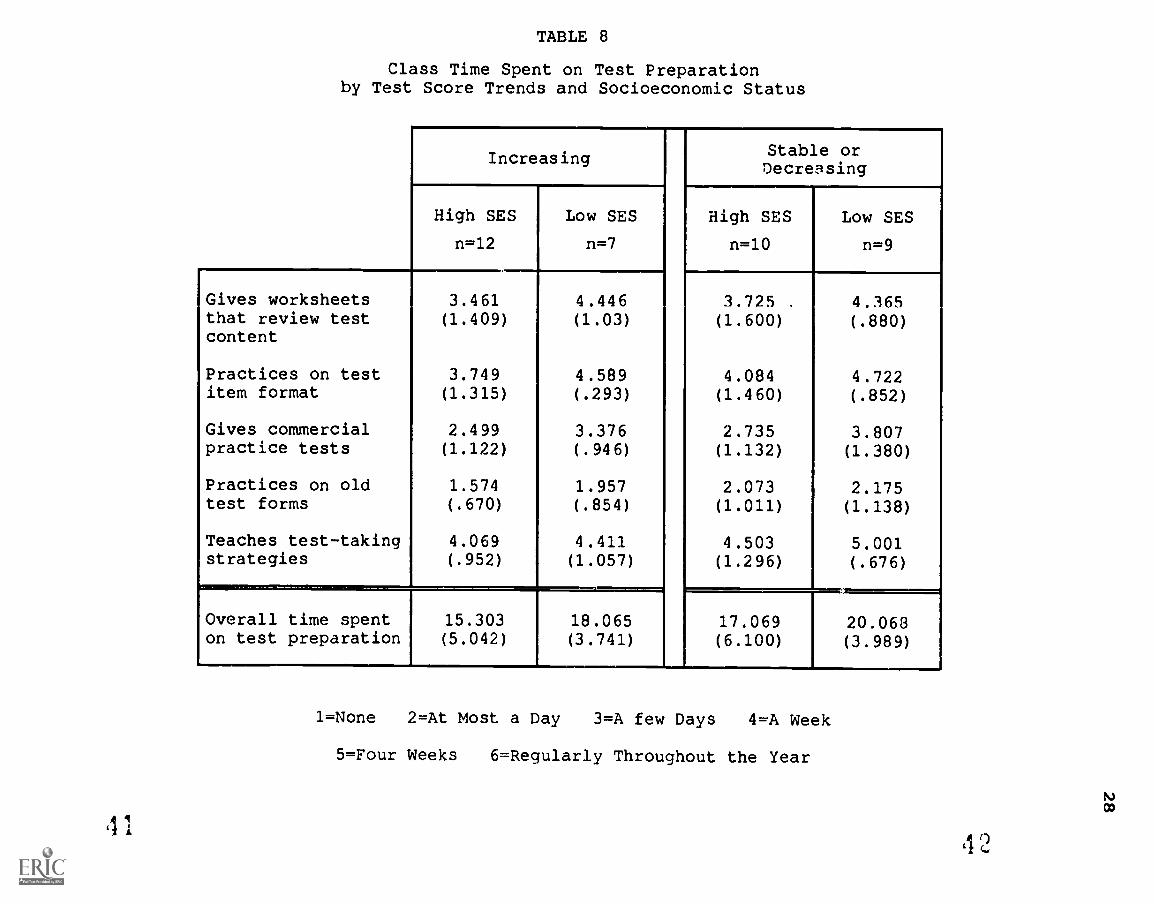
TABLE 8
Class Time Spent on Test Preparationby Test Score Trends and Socioeconomic Status
Increasing
High SES
n=12
Low SES
n=7
Gives worksheetsthat review testcontent
Practices on testitem format
Gives commercialpractice tests
Practices on oldtest forms
Teaches test-takingstrategies
3.461(1.409)
3.749(1.315)
2.499(1.122)
1.574(.670)
4.069(.952)
4.446(1.03)
4.589(.293)
3.376(.946)
1.957(.854)
4.411(1.057)
Overall time spenton test preparation
15.303(5.042)
18.065(3.741)
Stable orDecreasing
High SES
n=10
Low SES
n=9
3.725 .
(1.600)
4.084(1.460)
2.735(1.132)
2.073(1.011)
4.503(1.296)
17.069(6.100)
4.365(.880)
4.722(.852)
3.807(1.380)
2.175(1.138)
5.001(.676)
20.063(3.989)
1=None 2=At Most a Day 3=A few Days 4=A Week
5=Four Weeks 6=Regular1y Throughout the Year
2
29
substantially influences their instructional planning.
Specifically, they report that in devising their plans for
instruction they (a) look at prior tests to make sure that
their curricula includes all or most of the test content, and
(b) plan to assure that they cover test objectives. Further,
they report that to some extent they adjust their instruc-
tional plans based on the test performance of the class they
had last year and more so on the most recent test performance
of their current class. They also adjust the sequence of
their curriculum based on what is included in the test.
There appear to be no differences between how testing influ-
ences teachers' planning at schools with increasing sco:.es
and how testing influences teacher planning at schools with
stable or decreasing scores. However, when teachers at high
and low SES schools are compared, it is clear that the
instructional plans of teachers at low SES schools are more
influenced by testing than those of teachers at high SES
schools.
Beyond its effects on teacher planning and instructional
delivery, testing also affects the teaching-learning process
through instructional time devoted to dirk.:t test preparation
activities. In general, teachers report spending from one to
four weeks of class time on the following: having students
complete worksheets that review expected test content, having
students practice item formats expected on the test, and
instructing students in test-taking strategies. Teachers
30
also report spending from one to several days administering
commercially produced practice tests and old forms of the
test to their students. While no differences on these items
were found between the reports of teachers at schools with
increasing scores and those at schools with stable or
decreasing scores, teachers at low SES schools report spend-
ing more of their classroom time on all test preparation
activities than do teachers at high SES schools.
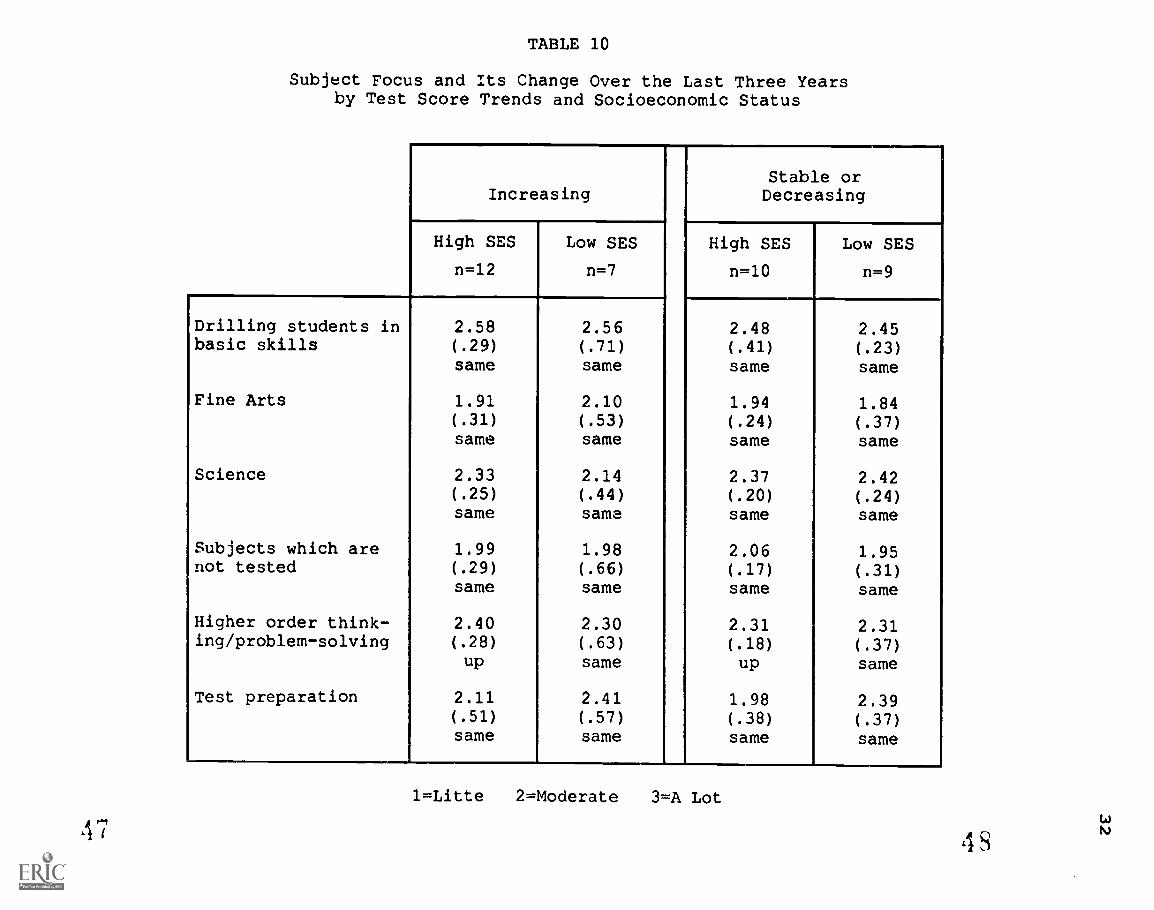
Impact of test preparation on non-tested
subjects (Tables 9 and 10). Even though teachers report
substantial pressure to improve test scores, spend substan-
tial classroom time on test preparation activities, and give
more than a moderate amount of their attention to drilling
students in basic skills; they still report giving at least
moderate classroom attention to non-tested subjects, such as
fine arts, science, and higher order thinking skills. It is
of interest to note, however, that while fine arts and non-
tested subjects receive moderate attention, teachers indicate
that drilling students in basic skills receives the most
emphasis. Furthermore, while most teachers report that
attention to all subjects has remained relatively stable over
the last three years, teachers at high SES schools report an
increase in attention to higher order thinking skills during
this period. Teachers in low SES schools, furthermore,
report significantly more attention to test preparation than
their higher SES counterparts.
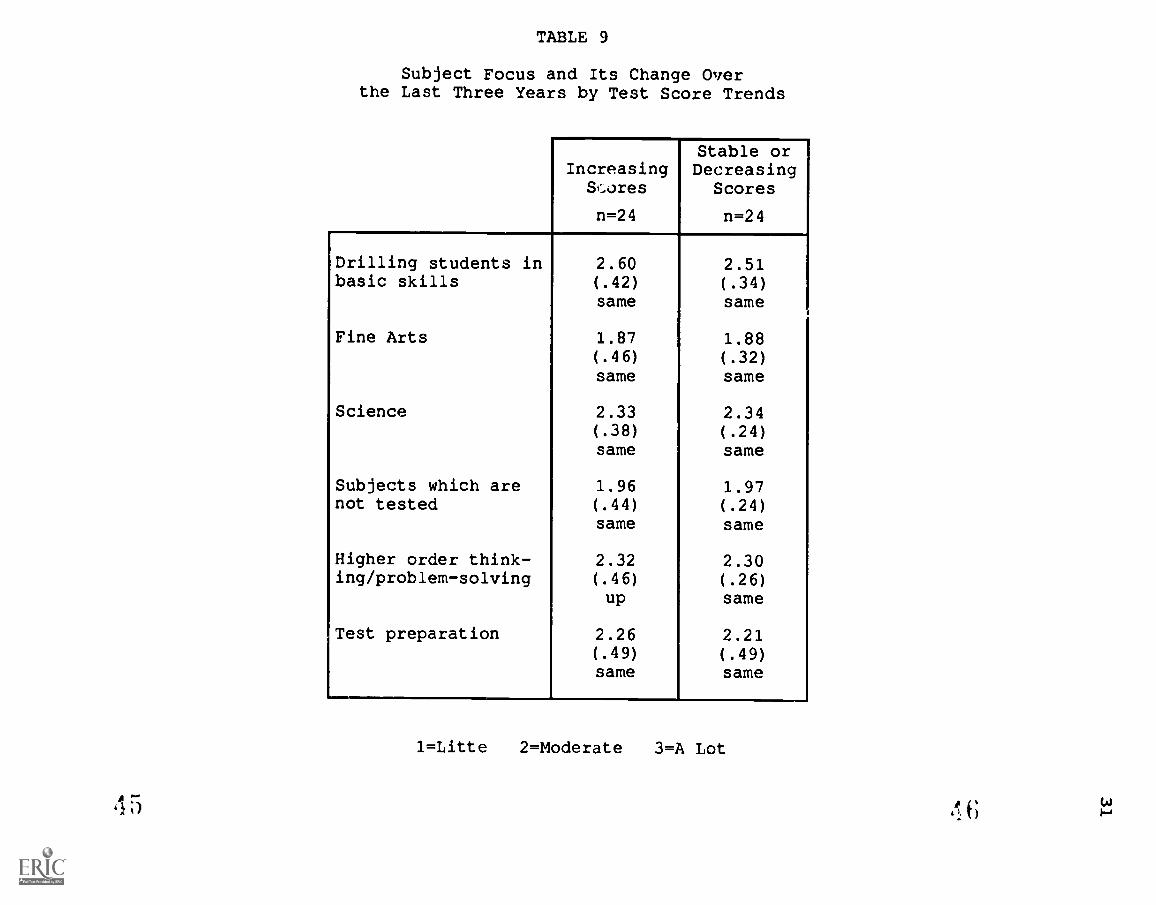
TABLE 9
Subject Focus and Its Change Overthe Last Three Years by Test Score Trends
IncreasingSi.ores
n=24
Stable orDecreasing
Scores
n=24
Drilling students in 2.60 2.51basic skills (.42) (.34)
same same
Fine Arts 1.87 1.88(.46) (.32)same same
Science 2.33 2.34(.38) (.24)same same
Subjects which are 1.96 1.97not tested (.44) (.24)
same same
Higher order think- 2.32 2.30ing/problem-solving (.46) (.26)
up same
Test preparation 2.26 2.21(.49) (.49)same same
1=Litte 2=Moderate 3=A Lot
45 0.1)
1
TABLE 10
Subject Focus and Its Change Over the Last Three Yearsby Test Score Trends and Socioeconomic Status
Increasing
High SES
n=12
Low SES
n=7
Drilling students inbasic skills
Fine Arts
Science
Subjects which arenot tested
Higher order think-ing/problem-solving
Test preparation
2.58(.29)
same
1.91(.31)
same
2.33(.25)same
1.99(.29)same
2.40(.28)
up
2.11(.51)
same
2.56(.71)same
2.10(.53)same
2.14(.44)same
1.98(.66)same
2.30(.63)same
2.41(.57)same
Stable orDecreasing
High SES Low SES
n=10 n=9
2.48 2.45(.41) (.23)same same
1.94 1.84(.24) (.37)same same
2.37 2.42(.20) (.24)same same
2.06 1.95(.17) (.31)same same
2.31 2.31(.18) (.37)up same
1.98 2.39(.38) (.37)same same
1=Litte 2=Moderate 3=A Lot
47 48
33
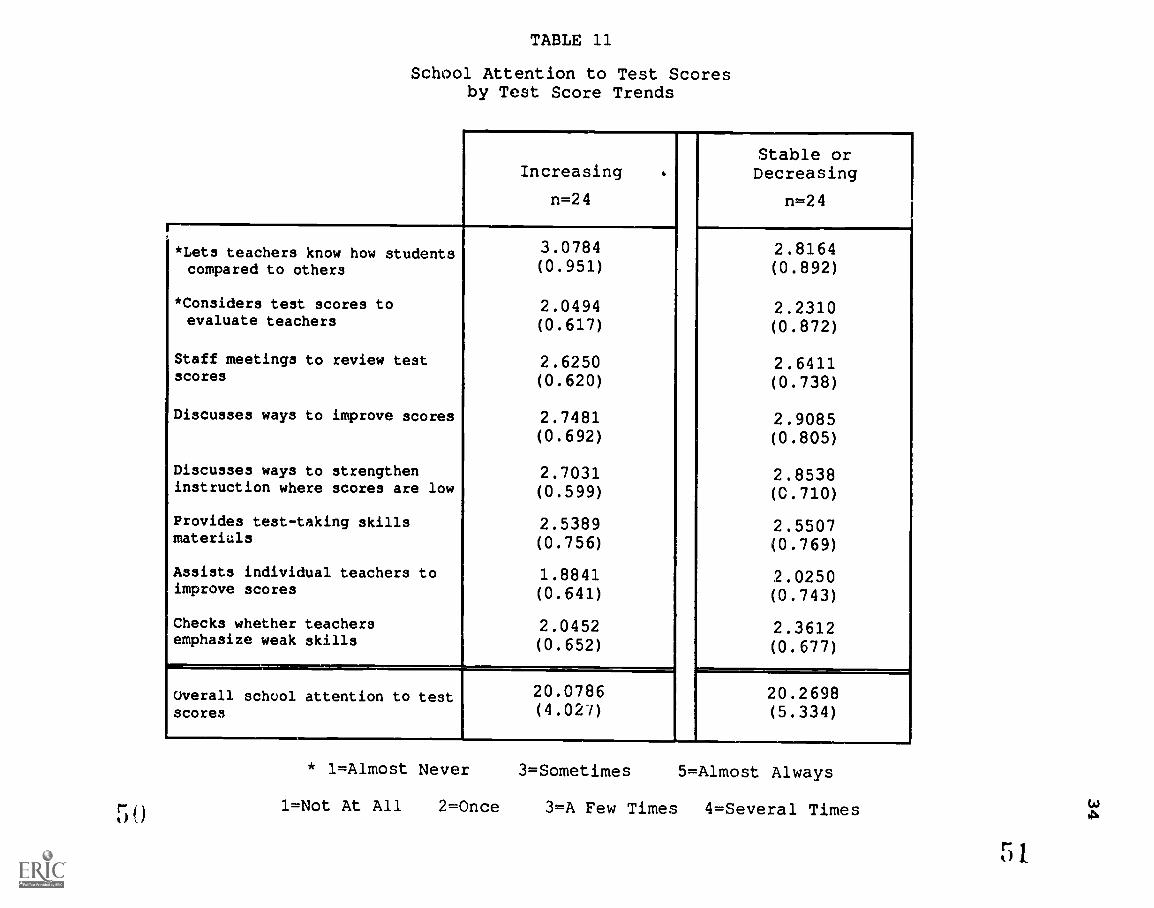
Time school administrations spend on test prepa-
ration (Tables 11 and 12) . School administrators pay atten-
tion to student performance, and they use a variety of
strategies to let their staff know that they care about test
scores. The teachers in our sample report that a few times a
year, school administrators engage in each of the following:
staff meetings to review test scores, discussions with teach-
ers on ways to improve test scores, discussions with teachers
on ways to strengthen instruction in specific areas where
test scores are weak, and providing teachers with materials
to improve their students' test-taking skills. Teachers also
report that their school administrators provide individual
teachers with assistance in how to improve their students'
test scores at least once a year, and likewise check whether
teachers are emphasizing skills which showed weakness from
past test results. In addition, teachers report that their
school administrators sometimes publicly let teachers know
how their students performed compared to other teachers'
students, and on occasion, administrators consider test
scores when evaluating teachers.
Results indicate that there are no significant differ-
ences between the amount of (a) school attention to test
scores reported by teachers from schools with increasing
scores and, (b) school attention to test scores reported at
schools with decreasing or stable scores. Teachers at low
SES schools, however, do report more school attention to test
50
TABLE 11
School Attention to Test Scoresby Test Score Trends
*Lets teachers know how studentscompared to others
*Considers test scores toevaluate teachers
Staff meetings to review testscores
Discusses ways to improve scores
Discusses ways to strengtheninstruction where scores are low
Provides test-taking skillsmaterials
Assists individual teachers toImprove scores
Checks whether teachersemphasize weak skills
Overall school attention to testscores
Increasing
n=24
Stable orDecreasing
n=24
3.0784 2.8164(0.951) (0.892)
2.0494 2.2310(0.617) (0.872)
2.6250 2.6411(0.620) (0.738)
2.7481 2.9085(0.692) (0.805)
2.7031 2.8538(0.599) (C.710)
2.5389 2.5507(0.756) (0.769)
1.8841 2.0250(0.641) (0.743)
2.0452 2.3612(0.652) (0.677)
20.0786 20.2698(4.027) (5.334)
* 1=Almost Never 3=Sometimes 5=Almost Always
w1=Not At All 2=Once 3=A Few Times 4=Several Times 4
5 I
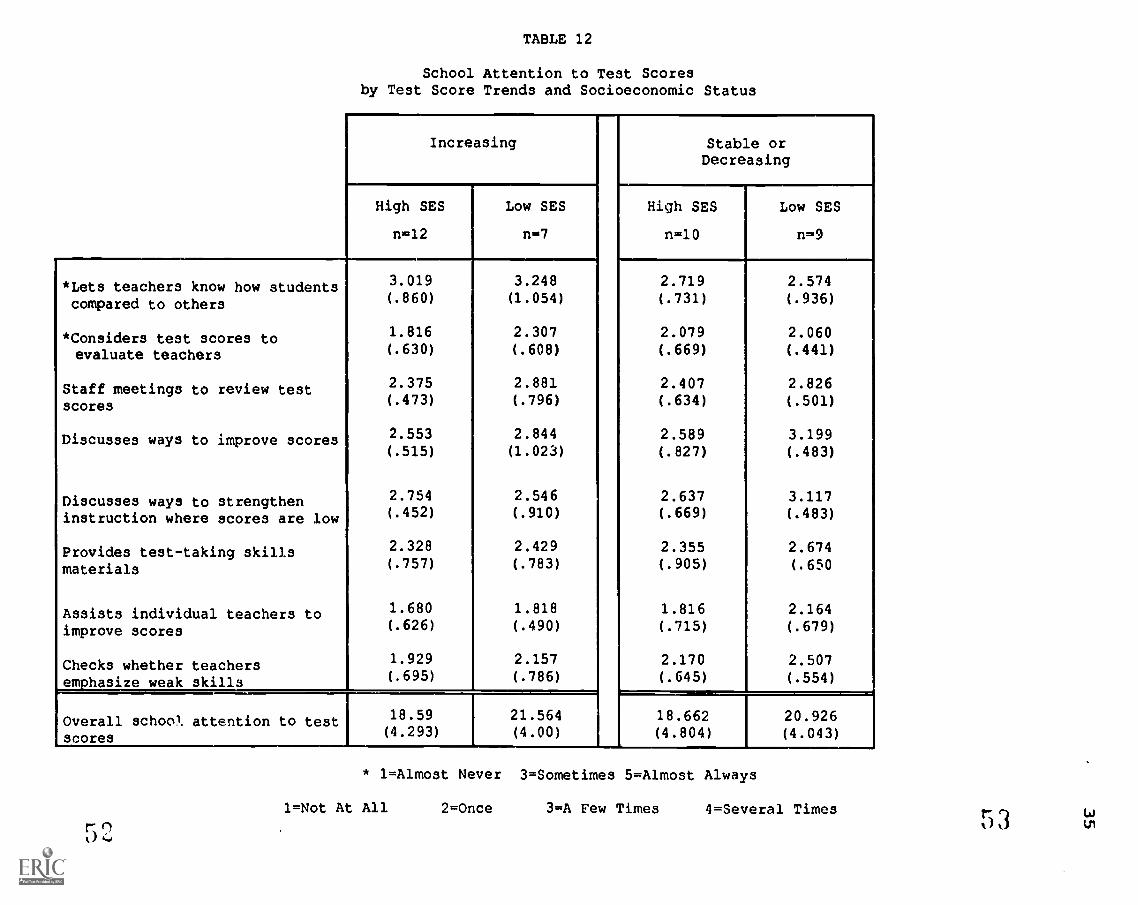
TABLE 12
School Attention to Test Scoresby Test Score Trends and Socioeconomic Status
Increasing Stable orDecreasing
High SES
n=12
Low SES
n=7
High SES
n=10
Low SES
n=9
*Lets teachers know how students 3.019 3.248 2.719 2.574
compared to others (.860) (1.054) (.731) (.936)
*Considers test scores to 1.816 2.307 2.079 2.060
evaluate teachers (.630) (.608) (.669) (.441)
Staff meetings to review test 2.375 2.881 2.407 2.826
scores (.473) (.796) (.634) (.501)
Discusses ways to improve scores 2.553 2.844 2.589 3.199(.515) (1.023) (.827) (.483)
Discusses ways to strengthen 2.754 2.546 2.637 3.117
instruction where scores are low (.452) (.910) (.669) (.483)
Provides test-taking skills 2.328 2.429 2.355 2.674
materials (.757) (.783) (.905) (.650
Assists individual teachers to 1.680 1.818 1.816 2.164
improve scores (.626) (.490) (.715) (.679)
Checks whether teachers 1.929 2.157 2.170 2.507
emphasize weak skills (.695) (.786) (.645) (.554)
Overall school attention to test 18.59 21.564 18.662 20.926
scores (4.293) (4.00) (4.804) (4.043)
* 1=Almost Never 3=Sometimes 5=Almost Always
1=Not At All 2=Once 3=A Few Times 4=Several Times
36
scores than teachers at high SES schools. This is especially
true when (a) test scores are used to compare and/or evaluate
teachers, (b) staff meetings are held to review test scores,
(c) discussions occur on ways to improve scores, and (d)
individual teachers receive assistance on improving their
students' performance.
School attention to instructional renewal (Tables
13-16) .According to teacher responses, school attention to
non-tested areas of instruction is similar to that devoted to
test preparation. Teachers report that a few times a year
school administrators discuss ways to improve students' atti-
tudes and interest in learning, as well as introduce and
discuss important new instructional ideas. They also report
that more than once a year their administrators discuss with
teachers ways to improve instruction in higher-order thinking
skills, on average a decidedly less frequent occurrence than
test preparation discussions.
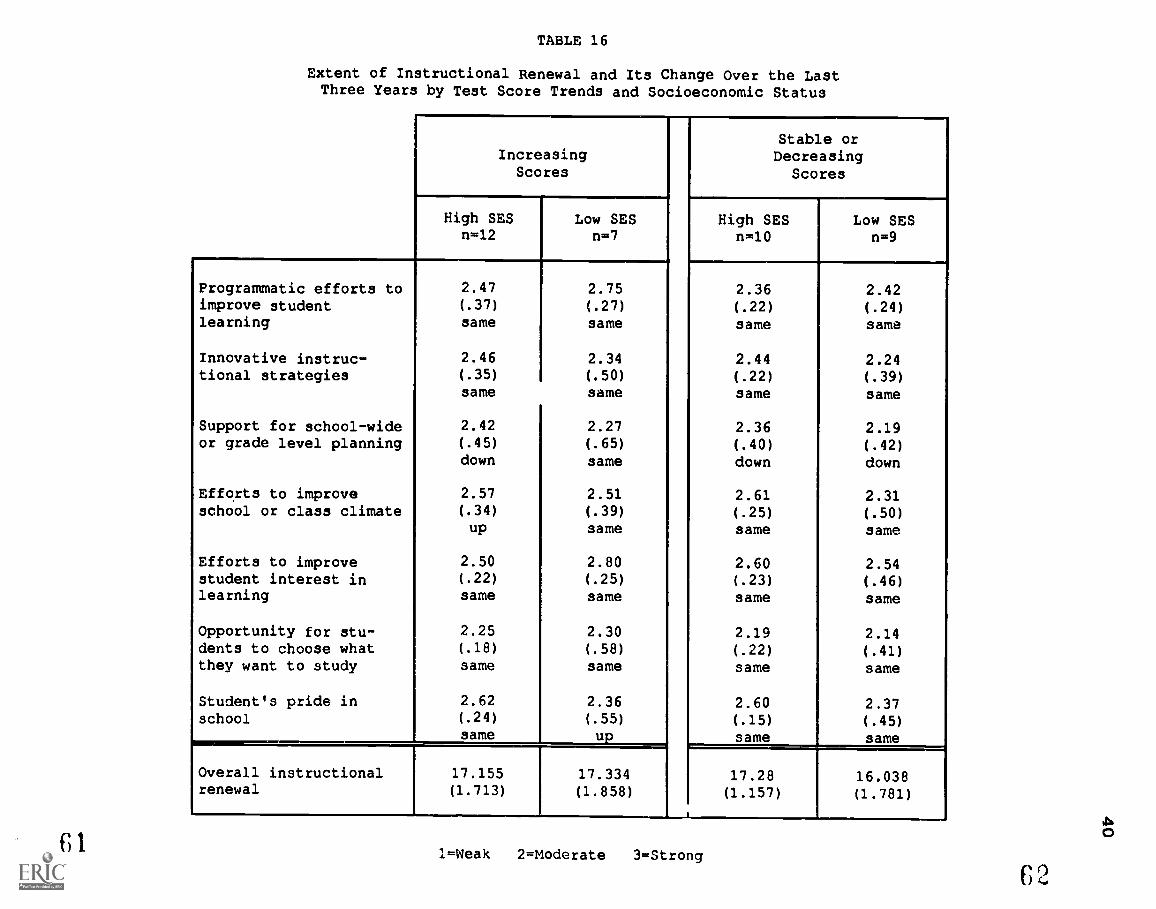
Nonetheless, the teachers in our sample generally report
substantial school-wide instructional renewal. They see a
somewhat strong presence in their schools of programmatic
efforts to improve student learning, school climate, and
students' attitudes and interest in school; and a moderately
strong presence of innovative instructional strategies. Less
strongly felt, but still reported was some school-wide or
grade-level planning. It is of interest that teachers in low
SES schools with stable or decreasing scores report the least
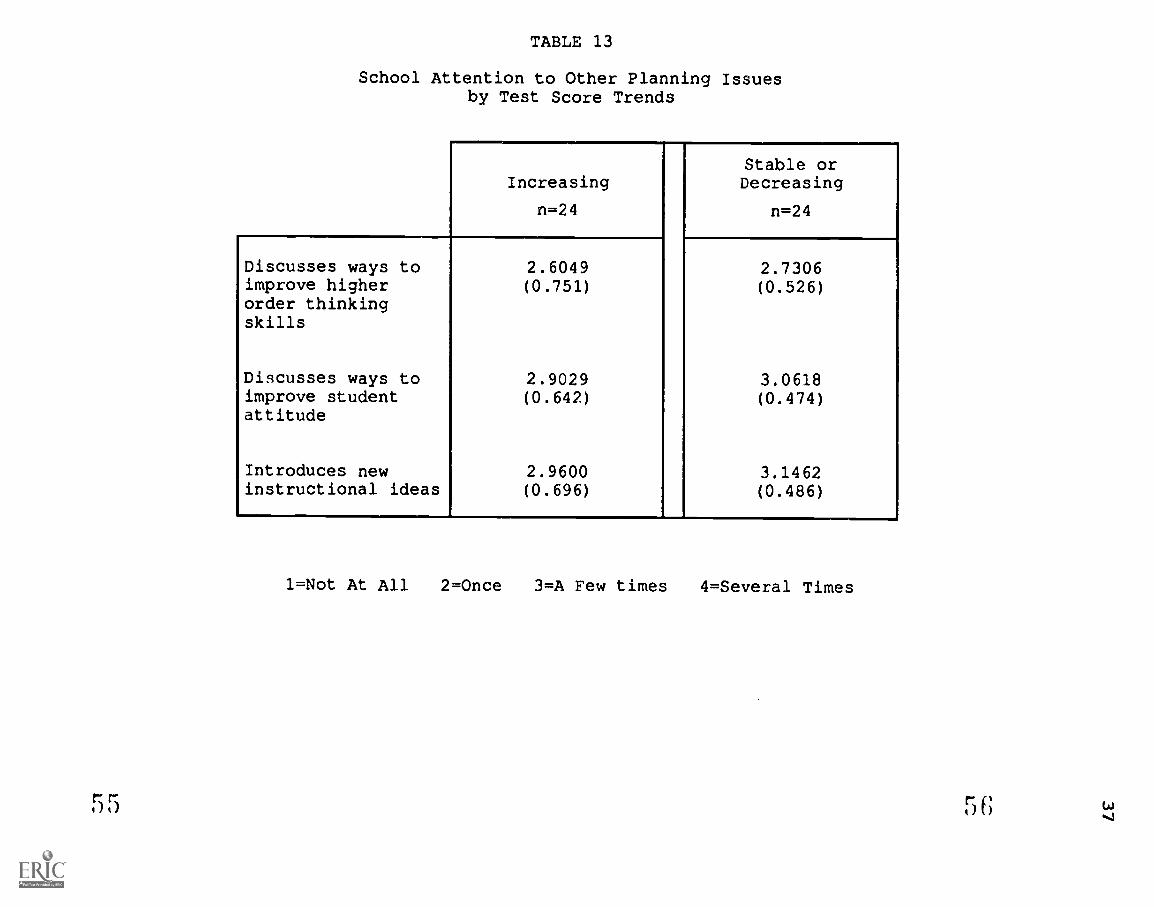
TABLE 13
School Attention to Other Planning Issuesby Test Score Trends
Increasing
n=24
Discusses ways toimprove higherorder thinkingskills
Discusses ways toimprove studentattitude
Introduces newinstructional ideas
2.6049(0.751)
2.9029(0.642)
2.9600(0.696)
Stable orDecreasing
n=24
2.7306(0.526)
3.0618(0.474)
3.1462(0.486)
1=Not At All 2=Once 3=A Few times 4=Several Times
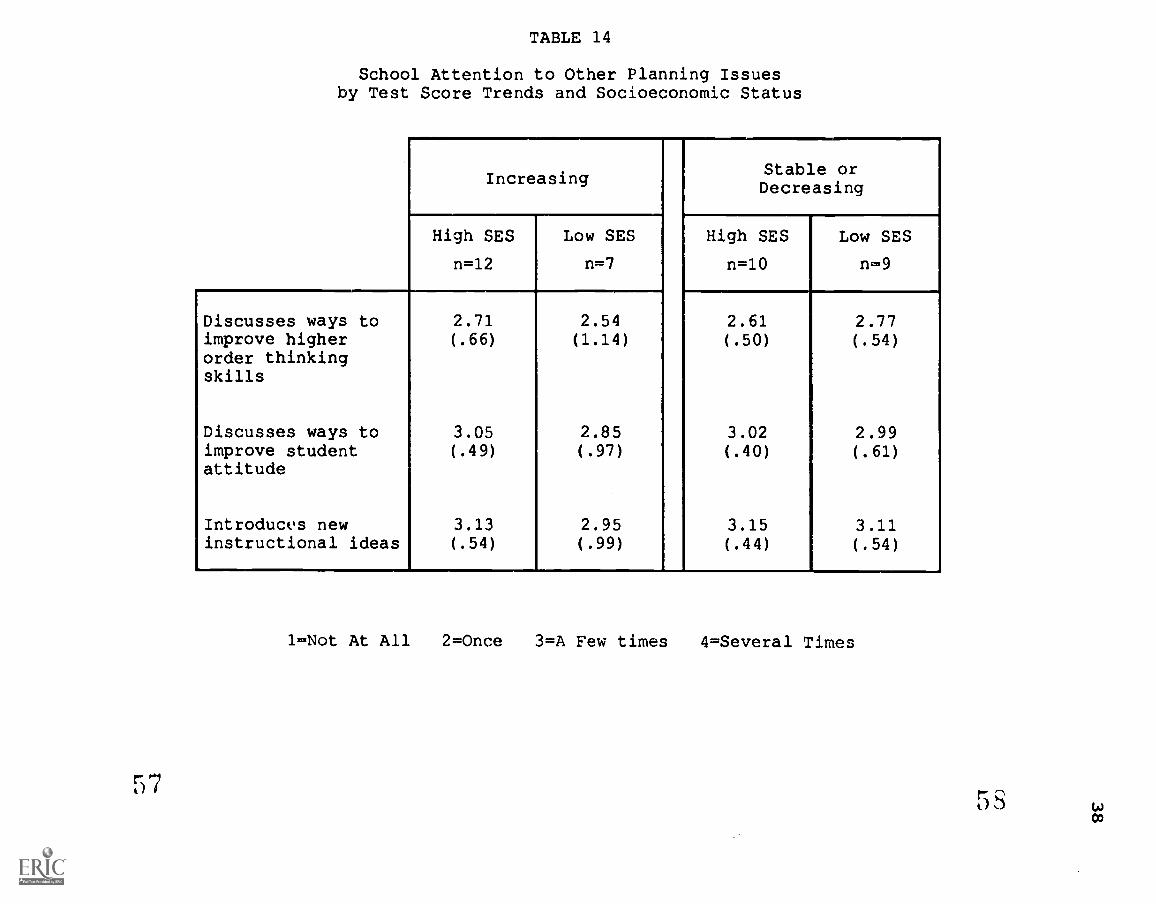
TABLE 14
School Attention to Other Planning Issuesby Test Score Trends and Socioeconomic Status
Discusses ways toimprove higherorder thinkingskills
Discusses ways toimprove studentattitude
Introduces newinstructional ideas
IncreasingStable orDecreasing
High SES
n=12
Low SES
n=7
High SES
n=10
Low SES
n=9
2.71(.66)
2.54(1.14)
2.61(.50)
2.77(.54)
3.05 2.85 3.02 2.99(.49) (.97) (.40) (.61)
3.13 2.95 3.15 3.11(.54) (.99) (.44) (.54)
1=Not At All 2=Once 3=A Few times 4=Several Times
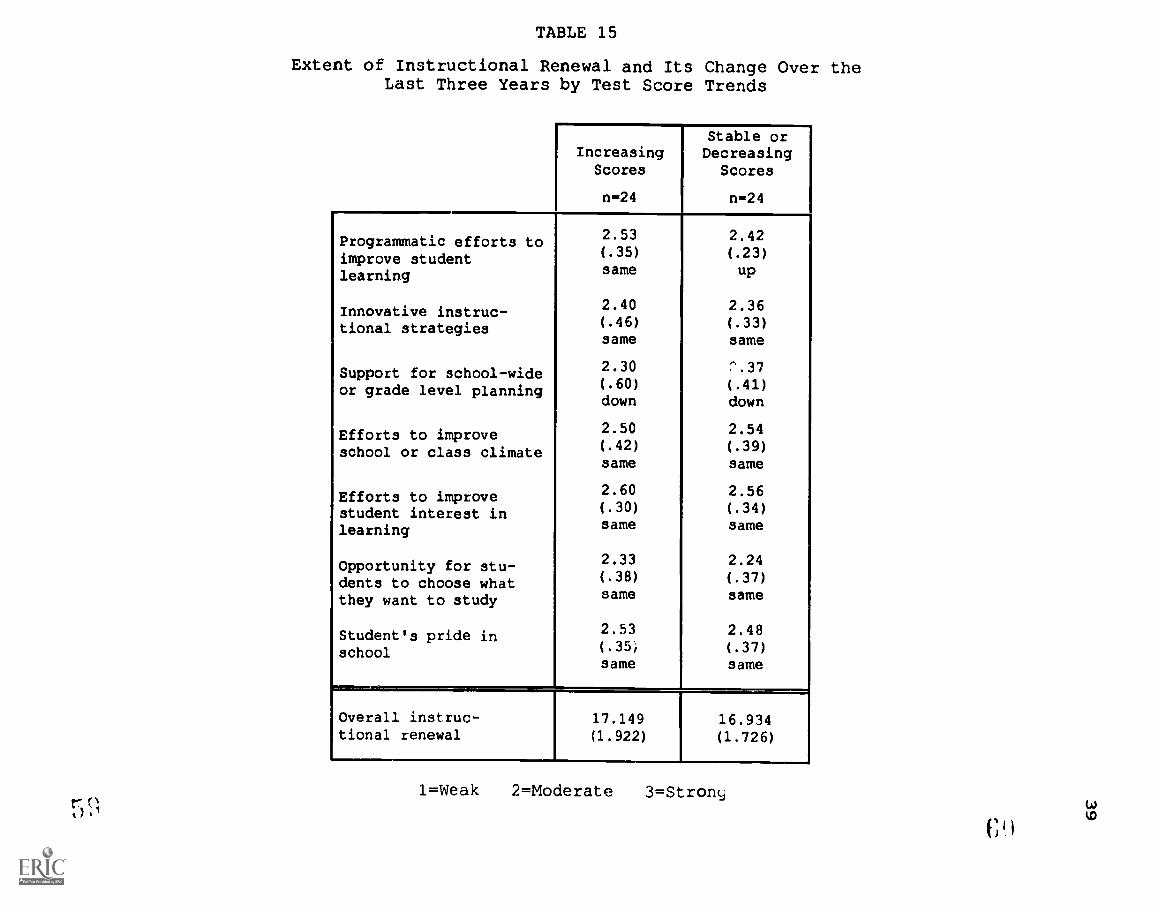
TABLE 15
Extent of Instructional Renewal and Its Change Over theLast Three Years by Test Score Trends
IncreasingScores
n=24
Stable orDecreasing
Scores
n=24
Programmatic efforts toimprove studentlearning
Innovative instruc-tional strategies
Support for school-wideor grade level planning
Efforts to improveschool or class climate
Efforts to improvestudent interest inlearning
Opportunity for stu-dents to choose whatthey want to study
Student's pride inschool
2.53(.35)
same
2.40(.46)
same
2.30(.60)
down
2.50(.42)
same
2.60
(.30)same
2.33(.38)
same
2.53(.35,
same
2.42(.23)up
2.36(.33)
same
^.37
(.41)down
2.54(.39)
same
2.56(.34)same
2.24
(.37)same
2.48(.37)same
Overall instruc-tional renewal
17.149(1.922)
16.934(1.726),
1=Weak 2=Moderate 3=Strony
Cl
TABLE 16
Extent of Instructional Renewal and Its Change Over the LastThree Years by Test Score Trends and Socioeconomic Status
IncreasingScores
High SESn=12
Low SESn=7
Programmatic efforts toimprove studentlearning
Innovative instruc-tional strategies
Support for school-wideor grade level planning
Efforts to improveschool or class climate
Efforts to improvestudent interest inlearning
Opportunity for stu-dents to choose whatthey want to study
Student's pride inschool
2.47(.37)
same
2.46(.35)
same
2.42(.45)
down
2.57(.34)
up
2.50(.22)
same
2.25(.18)
same
2.62
(.24)same
2.75(.27)
same
2.34(.50)same
2.27(.65)
same
2.51(.39)
same
2.80(.25)
same
2.30(.58)
same
2.36(.55)
Overall instructionalrenewal
17.155(1.713)
17.334(1.858)
Stable orDecreasingScores
High SESn=10
Low SESn=9
2.36 2.42(.22) (.24)
same same
2.44 2.24(.22) (.39)same same
2.36 2.19(.40) (.42)
down down
2.61 2.31(.25) (.50)same same
2.60 2.54(.23) (.46)
same same
2.19 2.14(.22) (.41)
same same
2.60 2.37(.15) (.45)
same same
1 17.28 16.038(1.157) (1.781)
1=Weak 2=Moderate 3=Strong
41
presence of instructional renewal in their schools, while low
SES schools with increasing test scores report the greatest
presence of instructional renewal.
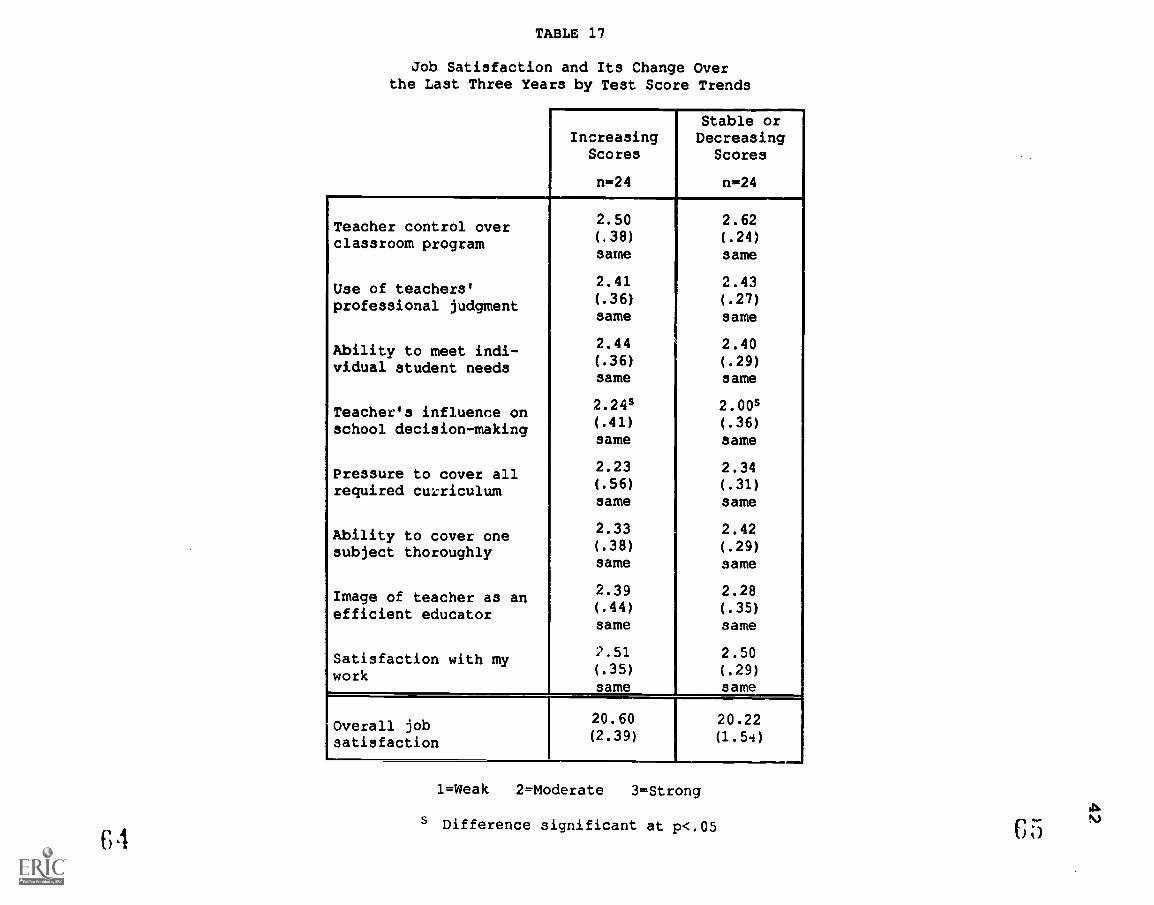
Teachers' sense of their work environment (Tables
17 and 18) .In general, the teachers in this sample report a
moderate to strong and stable sense of job satisfaction over
the last three years. Despite pressure from external
mandates, they see themselves (a) with control over their
classroom programs, (b) at least moderately free both to use
their professional judgment in instructional matters and to
meet individual student needs, and (c) as soewhat influen-
tial in school decision-making. In particular, teachers at
schools with increasing scores report feeling significantly
more influence over school decision-making than those at
schools with stable or decreasing scores.
Further, while teachers report satisfaction with their
work, their image as professionals, their efficacy, and ti.?,ir
ability to deal in depth with specific topics, they also
report a moderate amount of pressure to cover all the
required curriculum.
Teachers appear to have a strong sense of pride in their
work, particularly in schools with increasing scores.
General attitudes teachers hold about the reasons
test scores change, and the fairness and usefulness of
testing (Tables 19-22). Overall, our sample reports that
changes in instructional strategies and teaching effective
6 4
TABLE 17
Job Satisfaction and Its Change Overthe Last Three Years by Test Score Trends
IncreasingScores
n=24
Stable orDecreasing
Scores
n=24
Teacher control overclassroom program
Use of teachers'professional judgment
Ability to meet indi-vidual student needs
Teacher's influence onschool decision-making
Pressure to cover allrequired cuzriculum
Ability to cover onesubject thoroughly
Image of teacher as anefficient educator
Satisfaction with mywork
2.50
(38),
same
2.41(.36)
same
2.44(.36)
same
2.24s(.41)
same
2.23(.56)
same
2.33
(.38)same
2.39(. 44)
same
2.51
(.35)
same
2.62
(.24)same
2.43
(.27)same
2.40(.29)
same
2.00s(.36)
same
2.34
(.31)same
2.42
(.29)same
2.28
(.35)same
2.50
(.29)same
Overall jobsatisfaction
2 0.60
( 2.39)
20.22
(1.5)
1=Weak 2=Moderate 3=Strong
s Difference significant at p<.05 65
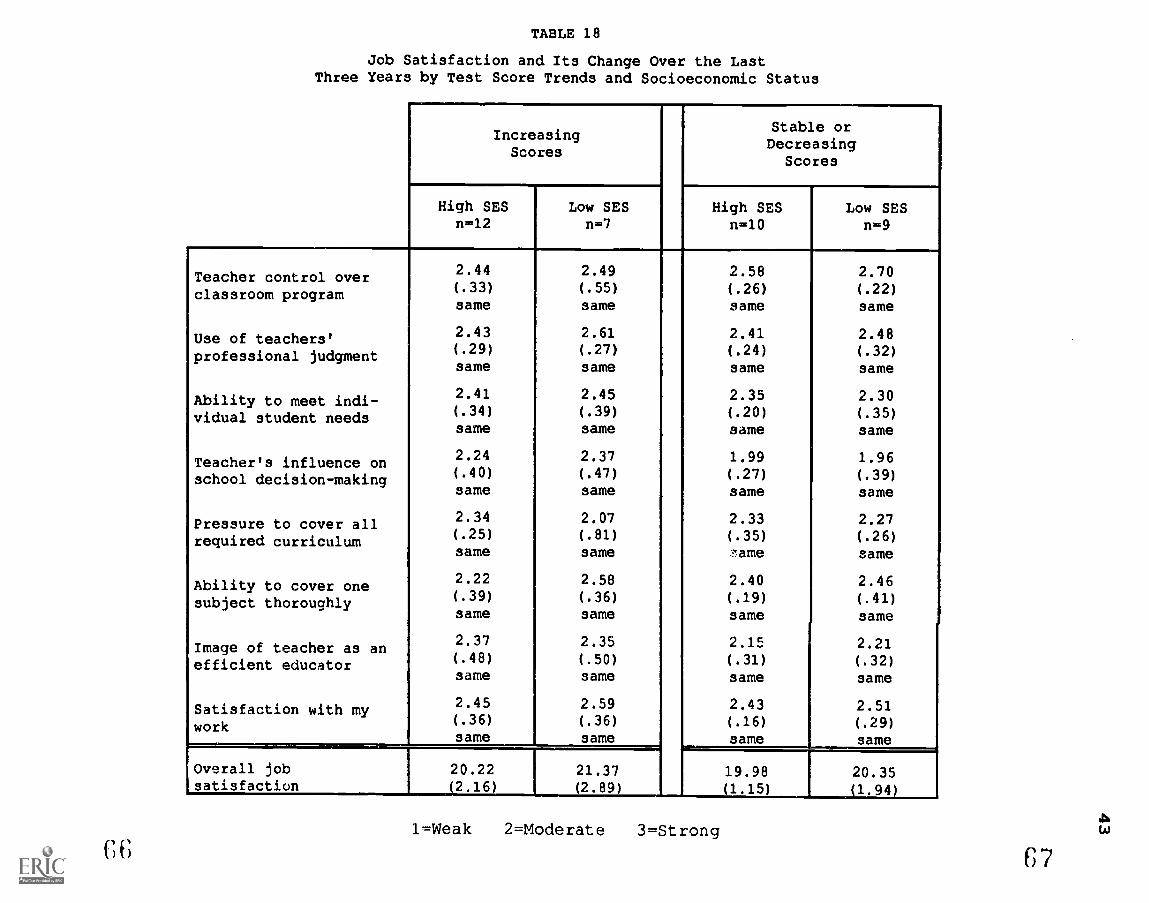
TABLE 18
Job Satisfaction and Its Change Over the LastThree Years by Test Score Trends and Socioeconomic Status
IncreasingScores
Stable orDecreasing
Scores
High SESn=12
Low SESn=7
High SESn=10
Low SESn=9
Teacher control overclassroom program
Use of teachers'professional judgment
Ability to meet indi-vidual student needs
Teacher's influence onschool decision-making
Pressure to cover allrequired curriculum
Ability to cover onesubject thoroughly
Image of teacher as anefficient educator
Satisfaction with mywork
2.44(.33)
same
2.43(.29)
same
2.41(.34)
same
2.24(.40)
same
2.34(.25)
same
2.22(.39)
same
2.37(.48)
same
2.45(.36)
same
2.49(.55)
same
2.61(.27)
same
2.45(.39)
same
2.37
(.47)same
2.07(.81)
same
2.58
(.36)same
2.35
(.50)same
2.59(.36)
same
2.58(.26)
same
2.41(.24)same
2.35(.20)
same
1.99
(.27)same
2.33(.35)
,.ame
2.40
(.19)same
2.15(.31)
same
2.43(.16)
same
2.70
(.22)same
2.48(.32)
same
2.30(.35)
same
1.96(.39)
same
2.27(.26)
same
2.46(.41)
same
2.21
(.32)same
2.51
(.29)same
Overall jobsatisfaction
20.22(2.16)
21.37(2.89)
19.98(1.15)
20.35(1.94)
1=Weak 2=Moderate 3=Strong('
t)t) 67
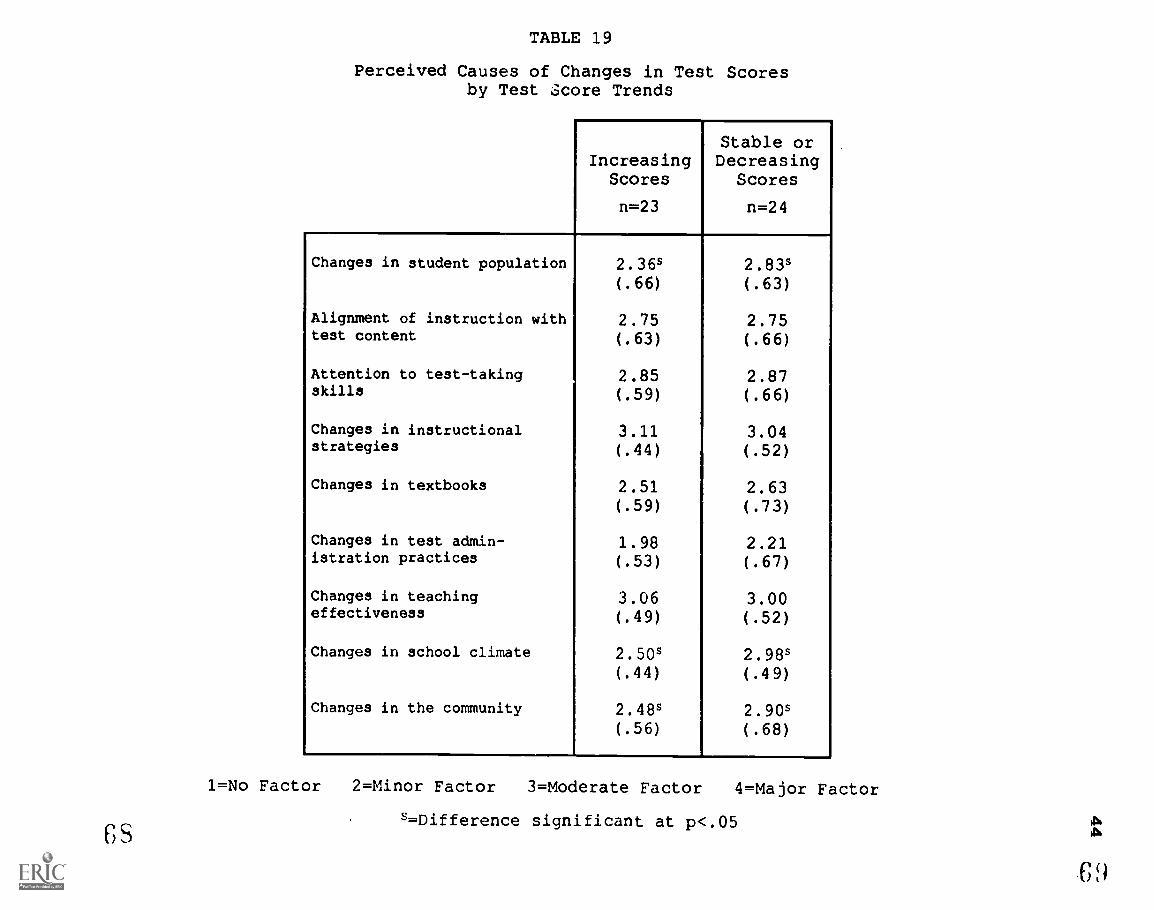
TABLE 19
Perceived Causes of Changes in Test Scoresby Test Score Trends
IncreasingScores
n=23
Stable orDecreasing
Scores
n=24
Changes in student population 2.365 2.835(.66) (.63)
Alignment of instruction with 2.75 2.75test content (.63) (.66)
Attention to test-taking 2.85 2.87skills (.59) (.66)
Changes in instructional 3.11 3.04strategies (.44) (.52)
Changes in textbooks 2.51 2.63(.59) (.73)
Changes in test admin- 1.98 2.21istration practices (.53) (.67)
Changes in teaching 3.06 3.00effectiveness (.49) (.52)
Changes in school climate 2.505 2.985(.44) (.49)
Changes in the community 2.485 2.905(.56) (.68)
1=No Factor
S
2=Minor Factor 3=Moderate Factor 4=Major Factor
s=Difference significant at p<.05
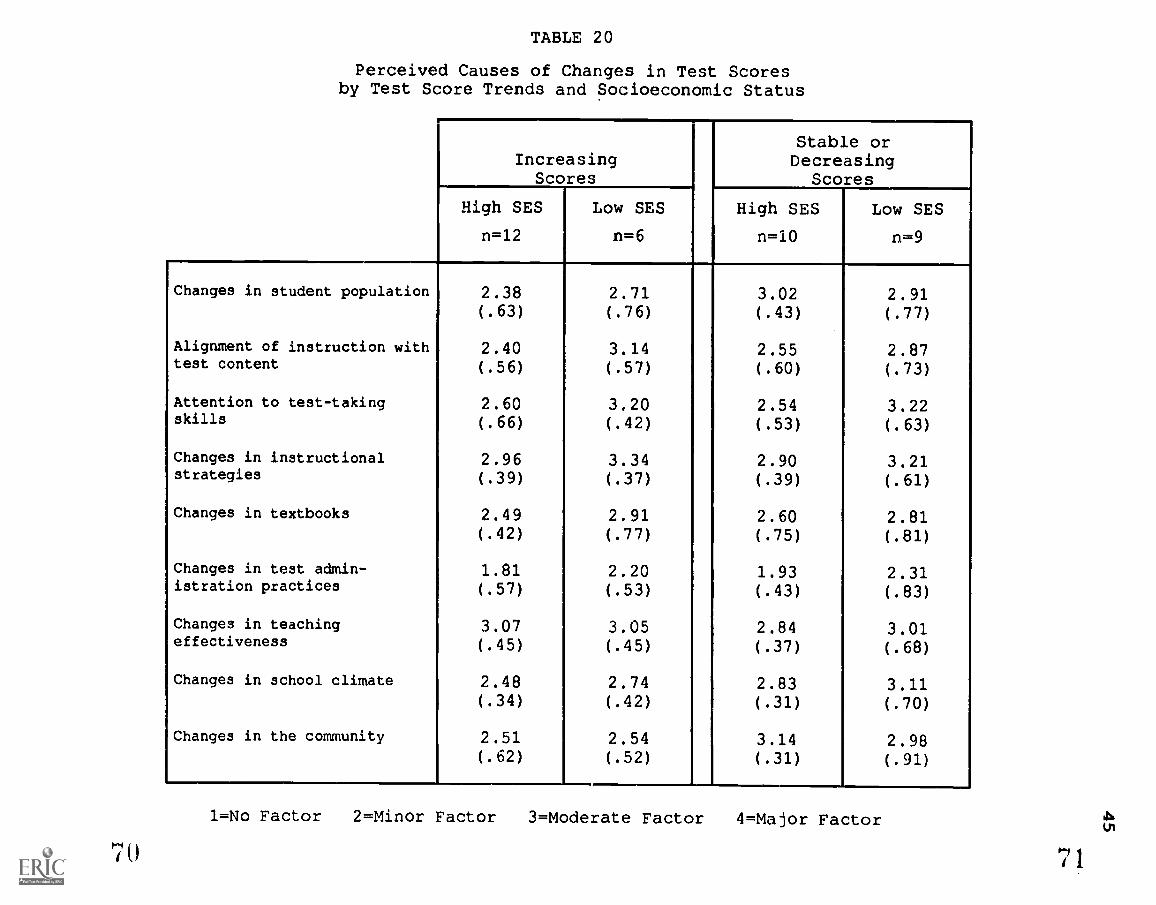
TABLE 20
Perceived Causes of Changes in Test Scoresby Test Score Trends and Socioeconomic Status
IncreasingScores
Stable orDecreasing
Scores
High SES
n=12
Low SES
n=6
High SES
n=10
Low SES
n=9
Changes in student population 2.38 2.71 3.02 2.91.63) (.76) (.43) .77)
Alignment of instruction with 2.40 3.14 2.55 2.87test content .56) (.57) (.60) .73)
Attention to test-taking 2.60 3.20 2.54 3.22skills .66) .42) (.53) .63)
Changes in instructional 2.96 3.34 2.90 3.21strategies .39) .37) (.39) .61)
Changes in textbooks 2.49 2.91 2.60 2.81.42) .77) (.75) .81)
Changes in test admin- 1.81 2.20 1.93 2.31istration practices .57) .53) (.43) .83)
Changes in teaching 3.07 3.05 2.84 3.01effectiveness .45) .45) (.37) .68)
Changes in school climate 2.48 2.74 2.83 3.11.34) .42) (.31) .70)
Changes in the community 2.51 2.54 3.14 2.98.62) .52) (.31) .91)
1=No Factor 2=Minor Factor 3=Moderate Factor 4=Major Factor
70
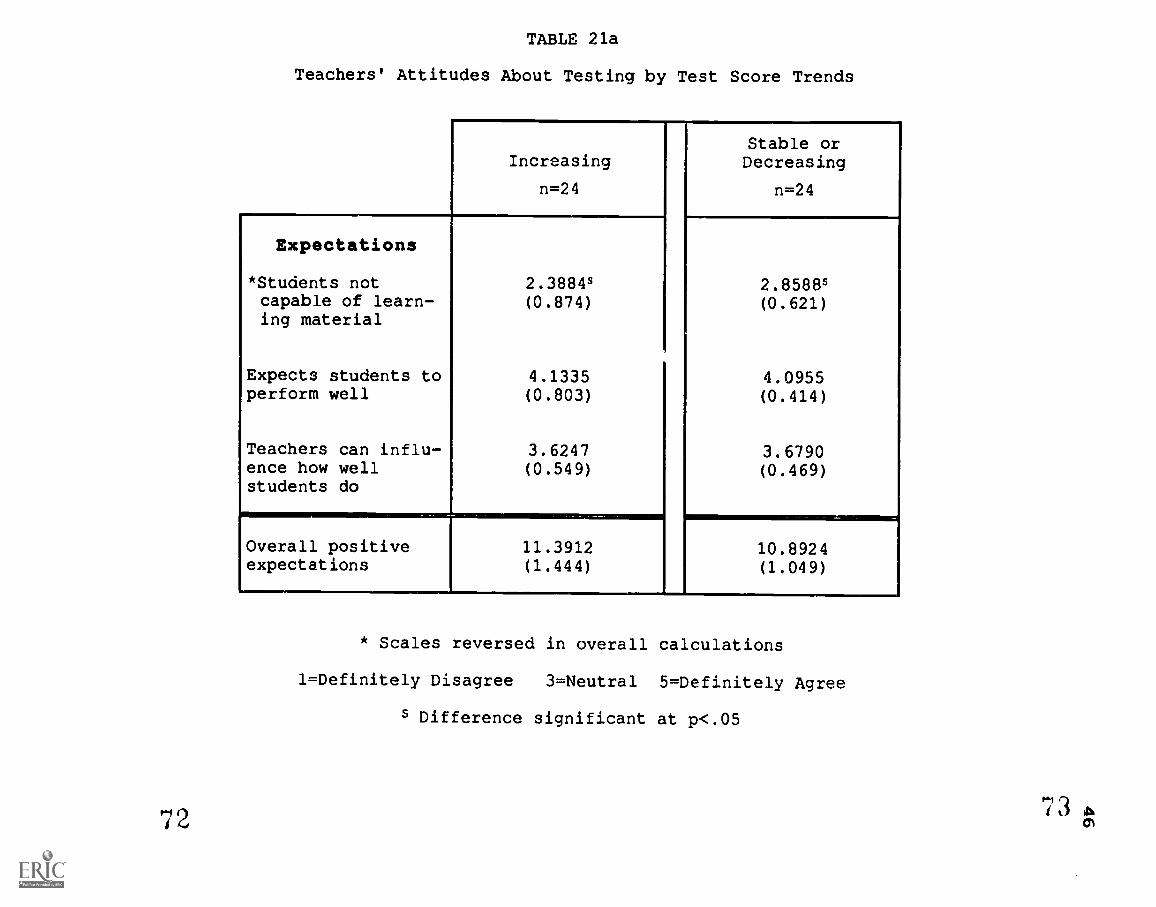
TABLE 21a
Teachers' Attitudes About Testing by Test Score Trends
Increasing
n=24
Stable orDecreasing
n=24
Expectations
*Students not 2.3884s 2.8588scapable of learn-ing material
(0.874) (0.621)
Expects students to 4.1335 4.0955perform well (0.803) (0.414)
Teachers can influ- 3.6247 3.6790ence how wellstudents do
(0.549) (0.469)
Overall positive 11.3912 10.8924expectations (1.444) (1.049)
* Scales reversed in overall calculations
1=Definitely Disagree 3=Neutral 5=Definitely Agree
s Difference significant at p<.05
72
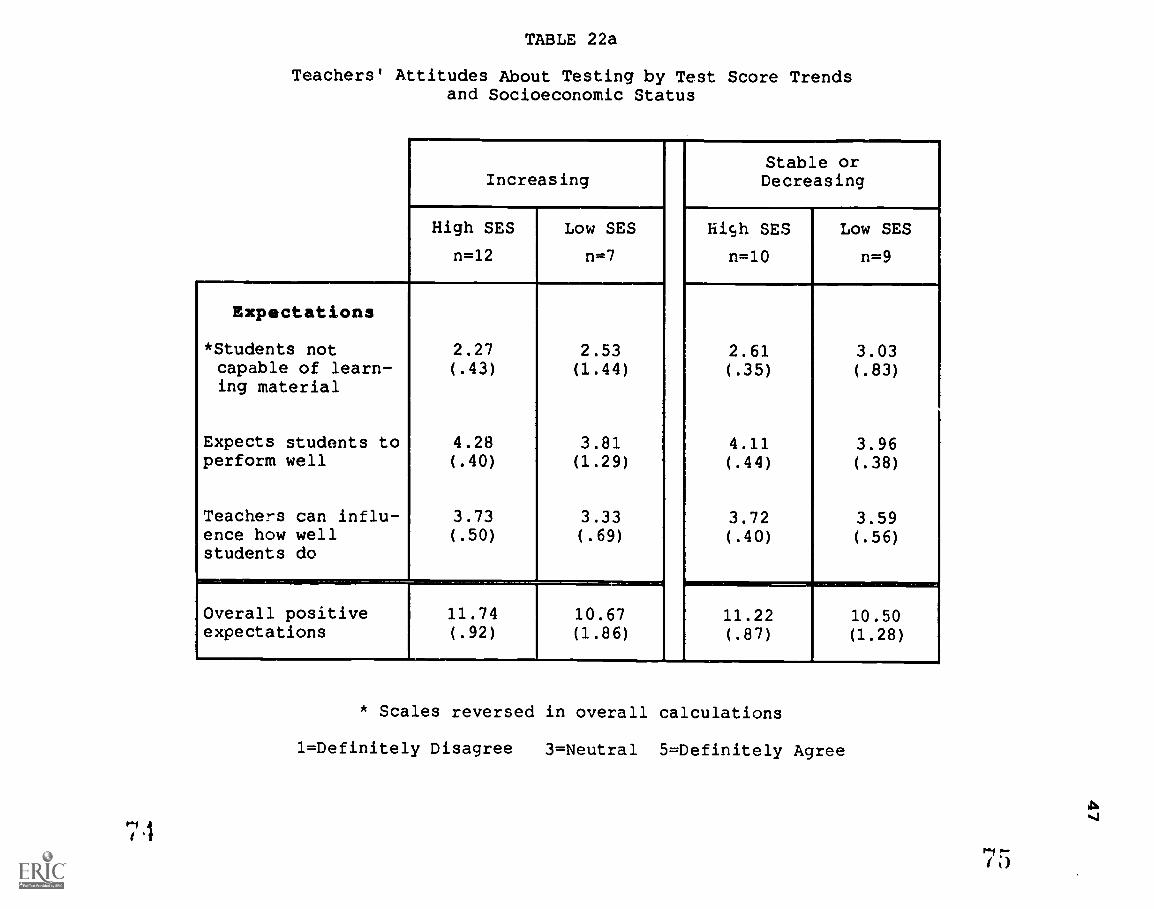
TABLE 22a
Teachers' Attitudes About Testing by Test Score Trendsand Socioeconomic Status
IncreasingStable orDecreasing
High SES
n=12
Low SES
n=7
high SES
n=10
Low SES
n=9
Expectations
*Students not 2.27 2.53 2.61 3.03capable of learn-ing material
(.43) (1.44) (.35) (.83)
Expects students to 4.28 3.81 4.11 3.96perform well (.40) (1.29) (.44) (.38)
Teachers can influ- 3.73 3.33 3.72 3.59ence how wellstudents do
(.50) (.69) (.40) (.56)
Overall positive 11.74 10.67 11.22 10.50expectations (.92) (1.86) (.87) (1.28)
* Scales reversed in overall calculations
1=Definitely Disagree 3=Neutral 5=Definitely Agree
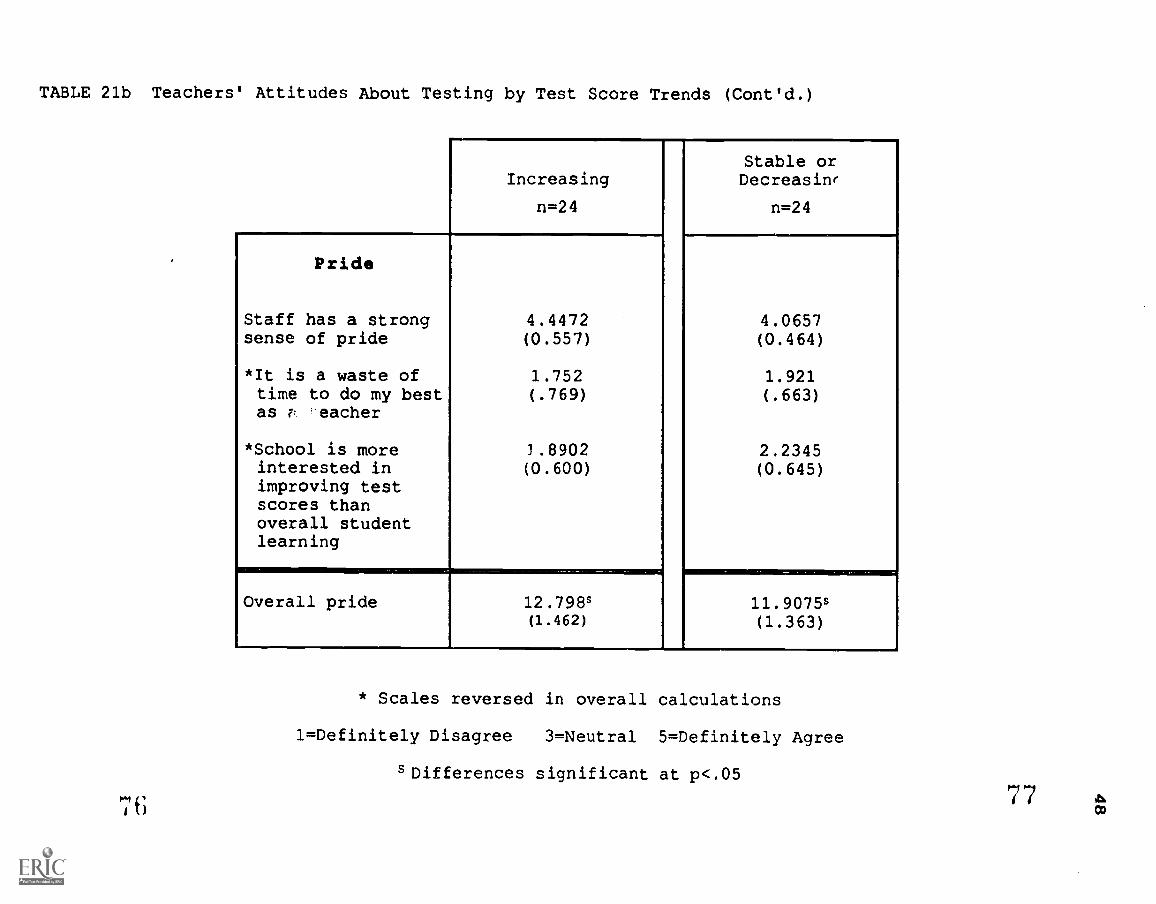
TABLE 21b Teachers' Attitudes About Testing by Test Score Trends (Cont'd.)
Increasing
n=24
Pride
Staff has a strongsense of pride
*It is a waste oftime to do my bestas F eacher
*School is moreinterested inimproving testscores thanoverall studentlearningINMI
Overall pride
4.4472(0.557)
1.752(.769)
3.8902(0.600)
12.798'(1.462)
Stable orDecreasinr
n=24
4.0657(0.464)
1.921(.663)
2.2345(0.645)
11.9075'(1.363)
* Scales reversed in overall calculations
1=Definitely Disagree 3=Neutral 5=Definitely Agree
sDifferences significant at p<.05
PA1
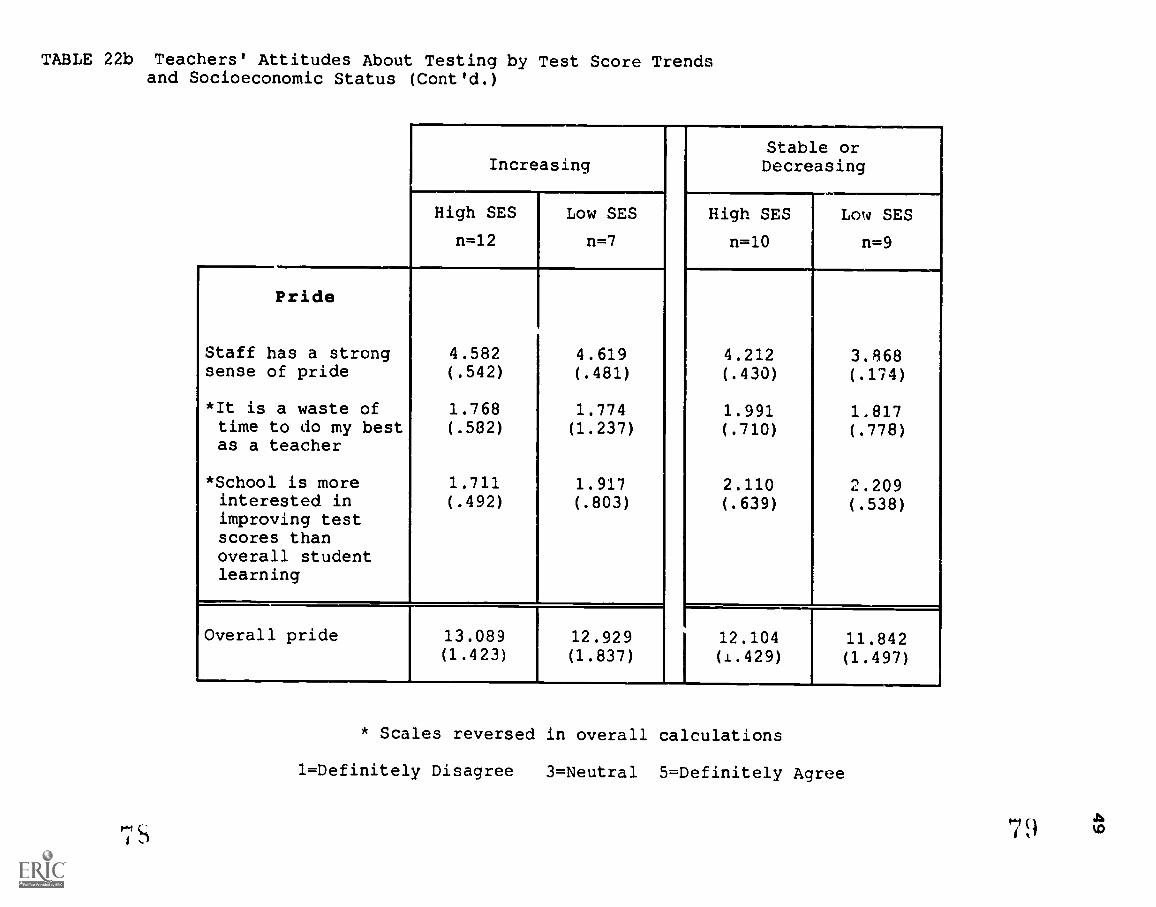
TABLE 22b Teachers' Attitudes About Testing by Test Score Trendsand Socioeconomic Status (Cont'd.)
Increasing
High SES
n=12
Low SES
n=7
Pride
Staff has a strongsense of pride
*It is a waste oftime to do my bestas a teacher
*School is moreinterested inimproving testscores thanoverall studentlearning
4.582(.542)
1.768(.582)
1.711(.492)
4.619(.481)
1.774(1.237)
1.917(.803)
Overall pride 13.089(1.423)
12.929(1.837)
Stable orDecreasing
High SES Low SES
n=10 n=9
4.212(.430)
1.991(.710)
2.110(.639)
3.868(.174)
1.817(.778)
2.209(.538)
12.104(1.429)
11.842(1.497)
* Scales reversed in overall calculations
1=Definitely Disagree 3=Neutral 5=Definitely Agree
7S
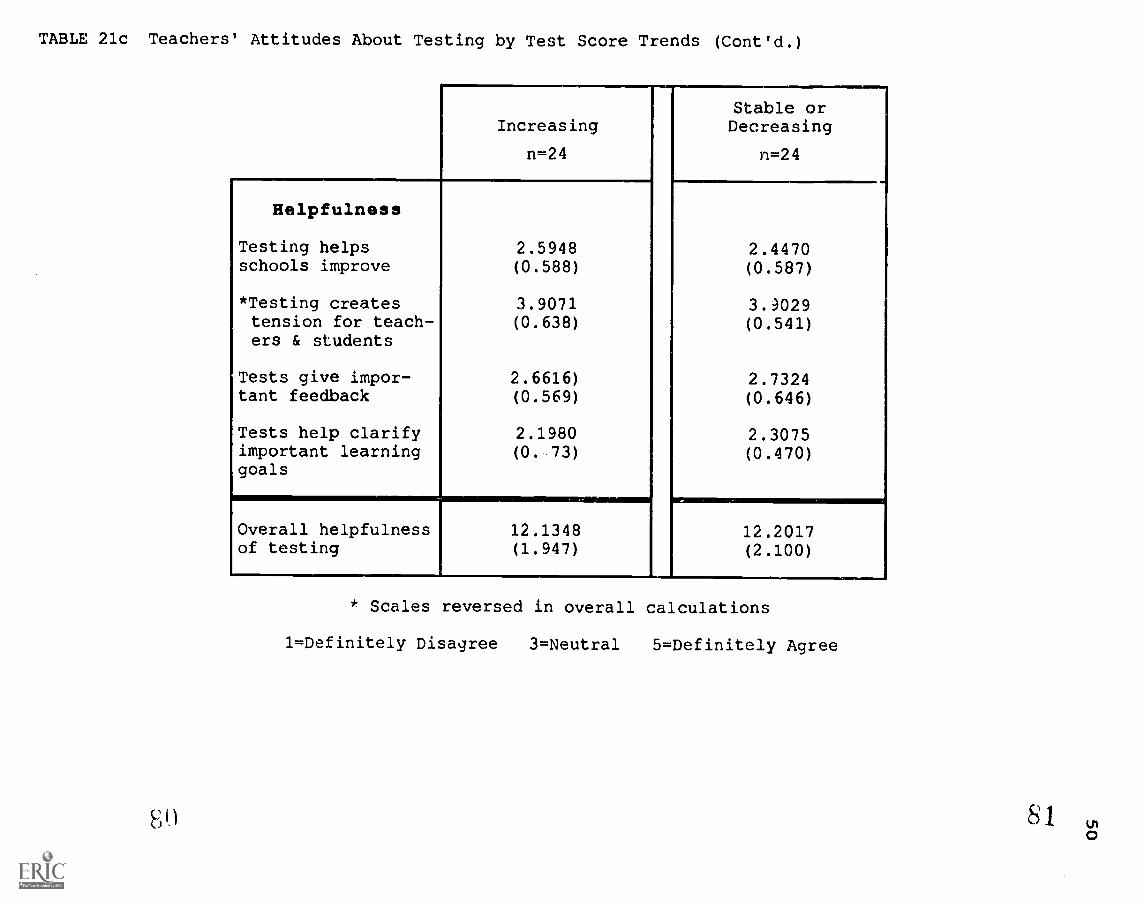
TABLE 21c Teachers' Attitudes About Testing by Test Score Trends (Cont'd.)
Increasing
n=24
Helpfulness
Testing helpsschools improve
*Testing createstension for teach-ers & students
Tests give impor-tant feedback
Tests help clarifyimportant learninggoals
2.5948(0.588)
3.9071(0.638)
2.6616)(0.569)
2.1980(0. 73)
Overall helpfulnessof testing
12.1348(1.947)
Stable orDecreasing
n=24
2.4470(0.587)
3.9029(0.541)
2.7324(0.646)
2.3075(0.470)
12.2017(2.100)
* Scales reversed in overall calculations
1=Definitely Disagree 3=Neutral 5=Definitely Agree
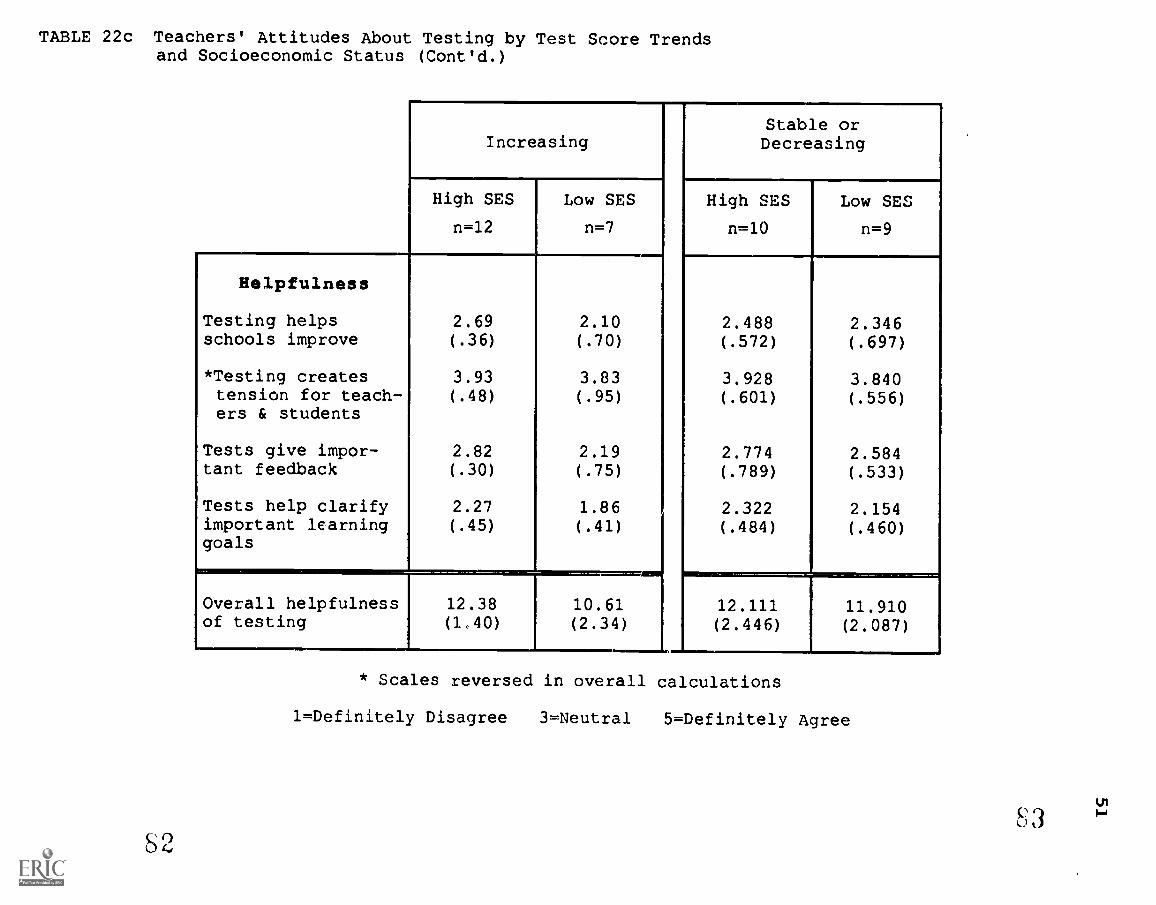
TABLE 22c Teachers' Attitudes About Testing by Test Score Trendsand Socioeconomic Status (Cont'd.)
IncreasingStable orDecreasing
High SES
n=12
Low SES
n=7
High SES
n-10
Low SES
n=9
Helpfulness
Testing helpsschools improve
*Testing createstension for teach-ers & students
2.69(.36)
3.93(.48)
2.10(.70)
3.83(.95)
2.488(.572)
3.928(.601)
2.346(.697)
3.840(.556)
Tests give impor- 2.82 2.19 2.774 2.584tant feedback (.30) (.75) (.789) (.533)
Tests help clarify 2.27 1.86 2.322 2.154important learninggoals
(.45) (.41) (.484) (.460)
Overall helpfulness 12.38 10.61 12.111 11.910of testing (-40) (2.34) (2.446) (2.087)
* Scales reversed in overall calculations
1=Definitely Disagree 3=Neutral 5=Definitely Agree
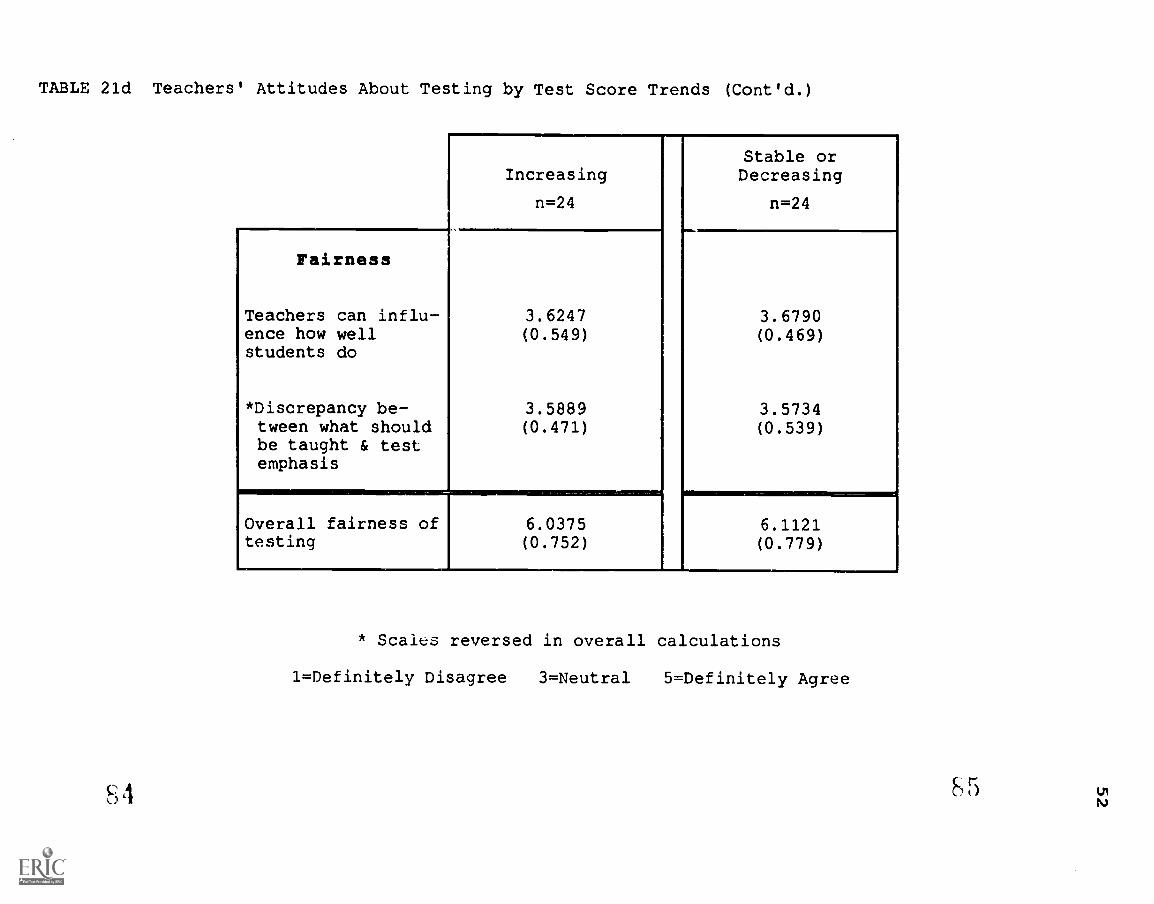
TABLE 21d Teachers' Attitudes About Testing by Test Score Trends (Cont'd.)
Increasing
n=24
Fairness
Teachers can influ-ence how wellstudents do
*Discrepancy be-tween what shouldbe taught & testemphasis
3.6247(0.549)
3.5889(0.471)
Overall fairness oftesting
6.0375(0.752)
Stable orDecreasing
n=24
3.6790(0.469)
3.5734(0.539)
6.1121(0.779)
* Scales reversed in overall calculations
1=Definitely Disagree 3=Neutral 5=Definitely Agree
84
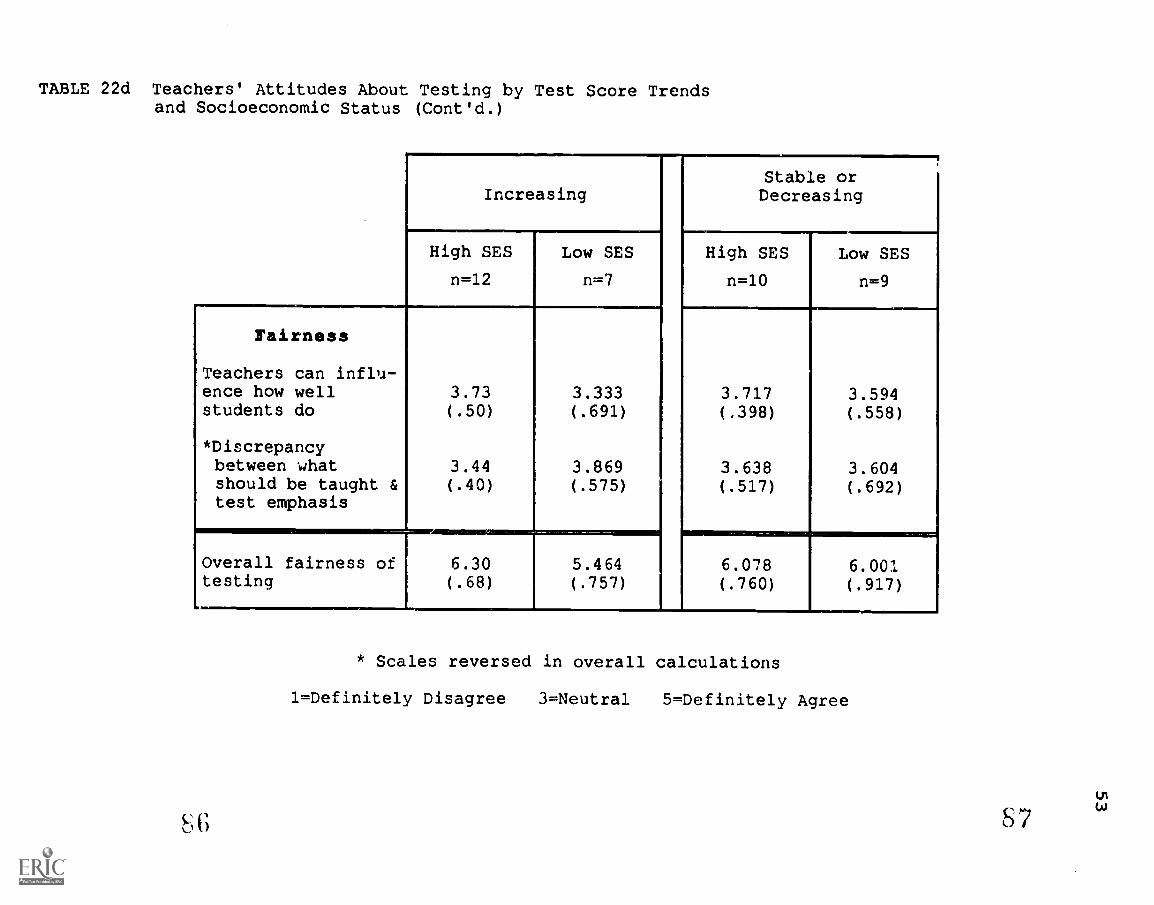
TABLE 22d Teachers' Attitudes About Testing by Test Score Trendsand Socioeconomic Status (Cont'd.)
IncreasingStable orDecreasing
High SES
n=12
Low SES
n=7
High SES
n=10
Low SES
n=9
Fairness
Teachers can influ-ence how well 3.73 3.333 3.717 3.594students do (.50) (.691) (,398) (.558)
*Discrepancybetween what 3.44 3.869 3.638 3.604should be taught &test emphasis
(.40) (.575) (.517) (.692)
Overall fairness of 6.30 5.464 6.078 6.001testing (.68) (.757) (.760) (.917)
* Scales reversed in overall calculations
1=Definitely Disagree 3=Neutral 5=Definitely Agree
SG 87
54
ness are the most important factors underlying changes in
students' test scores over the last three years. More modest
effects are exerted by (a) changes in the student population
and the community, (b) alignment between instruction and test
content, (c) attention to test taking skills, (d) textbooks,
(e) test administration practices, and (f) school climate.
It is of interest to note that the different attribu-
tions for test score changes exist where test scores are
increasing and in those schools where test scores are not
showing gains. The latter schools are significantly more
likely to attribute causes tc, changes in tneir student popu-
lation, in their community, and in the school climate.
Trends in Table 20 suggest that teachers at high SES schools
with stable or decreasing scores are most likel to make such
attributions, while teachers at low SES schools with increas-
ing scores credit their gains to changes in instructional
strategies, attention to test-taking skills, better alignment
of instruction with test content, and changes in teaching
effectiveness.
Despite these differences in attribution, teachers
report having somewhat positive expectations for their
students' test performance. They generally report believing
that their students are capable of learning the tested mate-
rial, that their students will perform well on tests, and
that they, as teachers, can influence how well their students
perform. Teachers at schools with increasing scores do
55
report significantly higher expactations than teachers at
schools with stable or decreasing scores. Similarly, teachers
at high SES schools report higher expectations of their
students than those at low SES schools.
The teachers in our sample were less positive about the
helpfulness of testing. Teachers disagreed that (a) testing
is helping schools improve, (b) that tests give them impor-
tant feedback about how well they are teaching in curricular
areas, and (c) that tests help to clarify learning goals. In
contrast, they believe that testing creates substantial
tension for teachers and students. Teachers at low SES
schools held particularly negative views of testing.
Over&11, teachers were fairly neutral about the fairness
of testing. While they agreed that teachers can influence
how well their students perform on standardized tests, they
feel a discrepancy between what they think should be taught
and what standardized tests actually emphasize. Similar to
responses about the helpfulness of testing, teachers at low
SES schools report feeling less able to influence student
test scores. They also report greater discrepancy between
what they think should be taught and what the test emphasizes
than teachers at more advantaged schools.
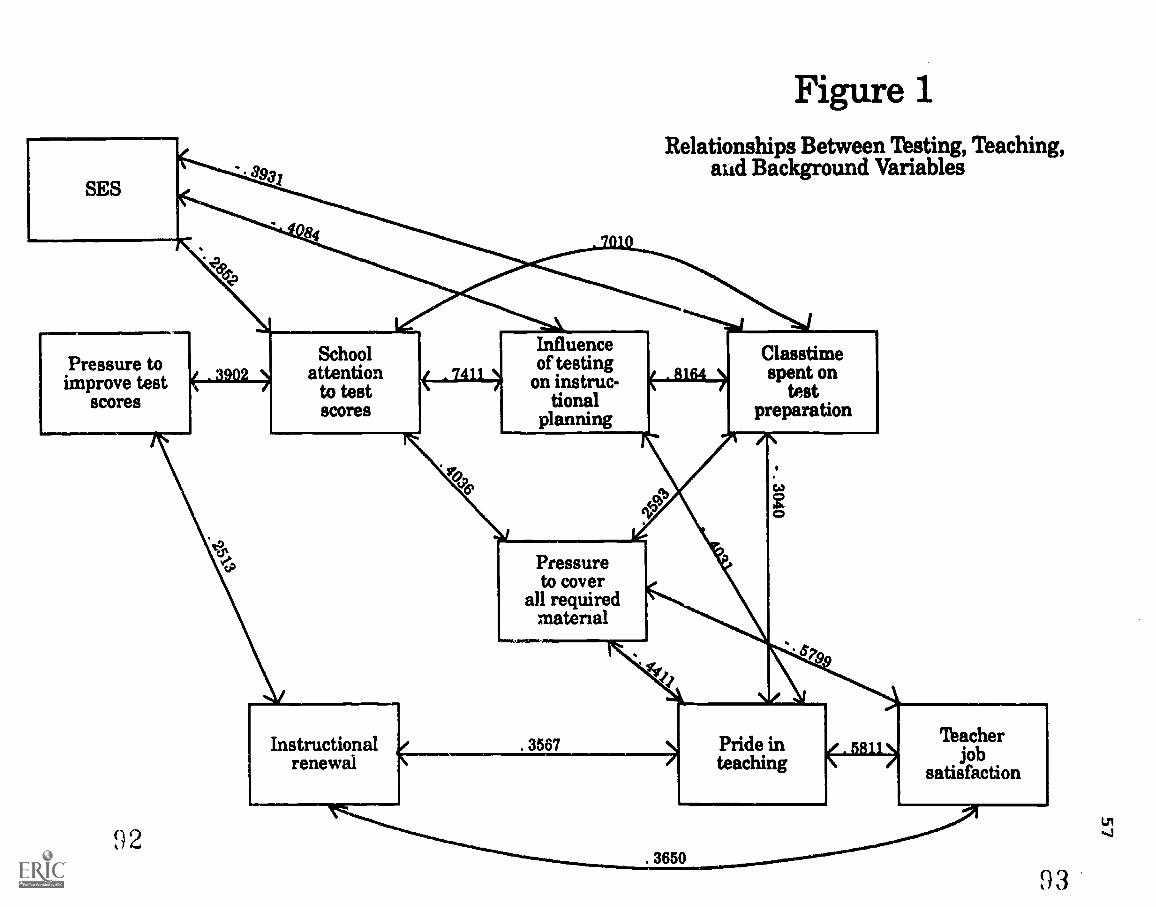
Relationships between background, testing, and
teaching variables (Tables 23 and ' gure 1). Mirroring
differences in responses cited earlier, correlations show
that socioeconomic status is significantly and negatively
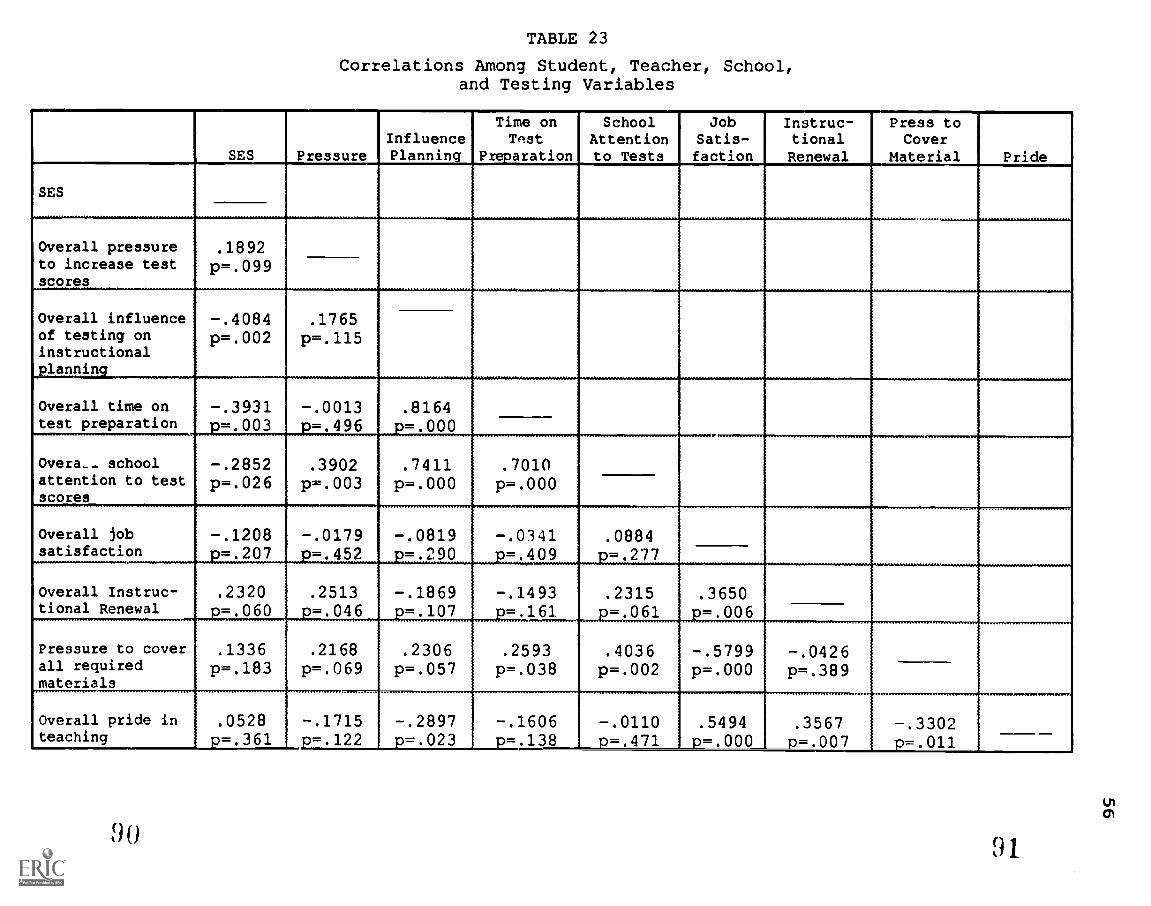
TABLE 23
Correlations Among Student, Teacher, School,and Testing Variables
SES PressureInfluencePlanning
Time onTest
Preparation
SchoolAttentionto Tests
JobSatis-faction
Instruc-tionalRenewal
Press toCover
Material Pride
SES
Overall pressure .1892to increase test p=.099scores
-- --Overall influence -.4084 .1765of testing oninstructionalplanning
p=.002 p=.115
Overall time on -.3931 -.0013 .8164test preparation
,.=.003 .=.496 .=.000 ...---......--.
Overa- school -.2852 .3902 .7411 .7010attention to testscores
p..026 p=.003 p=.000 p=.000
Overall job -.1208 -.0179 -.0819 -.0141 .0884satisfaction =.207 =.452 =.290 =.409 .=.277
Overall Instruc- .2320 .2513 -.1869 -.1493 .2315 .3650tional Renenl2:.060 =.046 =.107 =,161 =.061 =.006
...yr...r.................
Pressure to mver .1336 .2168 .2306 .2593 .4036 -.5799 -.0426all requiredmaterials
p=.183 p=.069 p=.057 p=.038 p=.002 =.000 p=.389WITIVOIPMI
Overall pride in .0528 -.1715 -.2897 -.1606 -.0110 .5494 .3567 -.3302teaching =.361 p=.122 p=.023 p=.138 =,471 =.000 p=.007 p=.011
9091
SES
Pressure toimprove test
scores
Figure 1Relationships Between Thsting, Teaching,
aud Background Variables
9 2
Schoolattentionto testscores
Instructionalrenewal
7411
Maw.
Influenceof testing
on instruc-tional
planning
Pressureto cover
all requiredmaterial
Classtimespent on
testpreparation
. 3567
. 3650
Pride inteaching
5811Thacher
jobsatisfaction
9 3
58
related to the following: school attention to test scores,
teachers' attention to testing in planning their instruction,
and overall time devoted to test preparation activities.
Based on the direction of the relationship, testing is more
influential and exerts stronger effects on teaching in
schools serving more disadvantaged students.
The cluster of variables assessing schools' and teach-
ers attention to testing and test scores also shows signifi-
cant correlations in the expected direction. Where teachers
report stronger school emphasis on testing they also indicate
greater attention to testing in their instructional planning
and report devoting more of their students' time to test
preparation activities. Perceived pressure to improve test
scores, however, appears significantly related only to the
attention given testing by school administrators. School
attention to test scores also is highly related to the
pressure teachers feel to cover all required material.
Such pressure, however, is negatively related both to
teachers' job satisfaction and to their pride in teaching.
Pride in teaching is positively related to instructional
renewal.
These patterns of correlations suggest possible models
of the effects of testing on scnools, the teaching and learn-
ing within them, and on students' test performance. While
intended only as exploratory, Figure 1 shows one such model.
59
Summary and Conclusions
Subject to the caveats of self-report data, survey
results suggest that standardized testing has substantial
effects on schools and the teaching and learning processes
within them:
Teachers feel strong pressure, especially from
district administrators and the media, to
improve their students' test scores.
School administrators encourage attention to
test scores by: holding staft. meetings to review
th- scores, discussing with teachers how to
improve the!..r students' tests scores, emphasiz-
ing instructional changes in specific areas of
test score weakness, and providing materials to
support students' test-taking skills. On average
such meetings and discussions are each held
several times a year.
Testing substantially influences teachers'
classroom planning. Teachers make sure that
their instructional programs cover test objec-
tives and many look at prior tests to assure a
good match. Adjustments are made in curricular
scope and sequence based on test content and
students' prior performance.
60
Teachers devote substantial student time to test
preparation activities, including worksheets
that review test content, test-wiseness instruc-
tion, and practice tests.
Despite substantial reported pressure from test-
ing mandates, teachers indicate a moderate and
relatively stable sense of both job sa,isfaction
and professional efficacy.
Reaffirming findings from other studies, survey results
also consistently indicate that schools serving economically
disadvantaged students show more such effects than those
serving students from higher socioeconomic communities.
While teachers from h. gher SES schools report an increase
over the last three years in instructional time devoted to
higher level thinking skills, teachers in lower SES schools
do not report such an increase. Further, low SES schools
report giving substantially more instructional attention to
test content through planning and delivery of instructional
programs than higher SES schools.
Study results on the meaning of test score gains,
particularly on whether such gains signal school improvement
or teaching to the test, are less clear cut. In comparing
responses from schools with increasing scores to those from
other schools, the study found no evidence to suggest that
increasing scores are an artifact of "teaching to the test"
practices. While teachers in schools with increasing scores
14.4;
61
do report feeling more pressure to produce, they indicate no
more school attention to testi.ng, no more attention to test-
ing in their own instructional planning, and no more instruc-
tional time devoted to test preparation compared to those
practices in other schools.
In fact, the significant relationships found in the
study linking school test score trends with other variables,
imply a broader meaning for test performance. Although the
direction of the relationships and the potential halo effects
are unknown, there is limited evidence to suggest that
schools where test scores are improving are better environ-
ments for children. Compared to other schools, teachers from
schools where tests scores are improving (a) report more
instructional innovation in their schools, (b) feel more
involved in school decision-making, (c) hold higher expecta-
tions for their students performance, and (d) have more
pride in their work. Teachers in schools with stable or
decreasing schools are more likely to believe that their
students are not capable of learning the materials on which
they are tested and are more likely to believe that changes
in test performance are due to changes in the school popula-
tion and the community.
In the minds of teachers, however, test results are of
uncertain meaning and of uncertain value in school improve-
ment. Teachers do not believe that standardized testing is
helping schools to improve. Neither do they believe that such
62
testing helps clarify school goals, provides useful feed-
back, or adequately assesses the most important learning
goals for students.
In conclusion, testing does appear to influence the
teaching and learning within schools. Substantial time and
attention are devoted to assuring students are taught tested
objectives and given practice in test content. Schools send
out messages to their teachers about the importance of test-
curriculum alignment and teachers design their instructional
programs with such alignment in mind. Whether this is good
news or bad news depends on whether or not one views the
standards set by such tests as eaucationally valid and
significant. If test results do represent significant learn-
ing outcomes, then testing may contribute to the attainment
of those outcomes. If test results do not represent such
learning, then in current practice they are a misguided tool.
Whether the test results, under conditions of account-
ability pressure, signal meaningful learning or even repre-
sent broader learning beyond specific test content, remain
critical issues for further investigation. Such meaningful-
ness and generalizability issues are critical to the
productive use of assessment in stimulating educational
reform-and represent provocative challenges, whether the test
instruments are traditional, multiple-choice measures or
newer performance-oriented ones.
63
References
Baker, E.L. (1989). LA11....Ua_LILLIy_measure the quality of
education? (CSE Tech. Rep. No.290) . Los Angeles, CA:
University ot California, Center for Research on
Evaluation, Standards, and Student Testing (Grant No.
OERI-G-86-0003).
Bracey, G.W. (1989) . The $150 million redundancy. Phi Delta
Kappan, 12(9), 698-702.
Cannell, J.J. (1987) . Nationally normed elementary achieve-
ment testing in America's public schools: How all 50
states are above the national average. Educational
Practice, 2(4), 12-15.
Corbett, H.D., & Wilson, B. (1988). Raising the stakes in
statewide mandatory minimum competency testing. In W. L.
Boyd and C. T. Kerchner (Eds.), Ihe_aalitica_aL!Ixsalz
aciusaticuLaaaaaiatim_yadziasmk (pp.27 -39) , New York:
Falmer Press.
Dorr-Bremme, D., (1983) . Assessing students: Teachers
routines, practices and reasoning. Evaluation Comment,
n(4), 1-12.
64
Dorr-Bremme, D., Burry, J., Catterall, J., Cabello, B., &
Daniels, L. (1983) . The costs of_:cestina_in American
public schools (CSE Tech. Rep. No. 198) . Los Angeles,
CA: University of California, Center for the Study of
Evaluation.
Dorr-Bremme, D. & Herman, J. (1983) . Use of testing in
schools: A national profile. In W. Hathaway (Ed.),
Testing in the schools: New directions for testing and
measurement (pp. 3-17), San Fransisco, CA: Jossey Bass.
Dorr-Bremme, D., & Herman, J. (1986). Assessing student
achievement: A profile of classroom practices. CSE
Monograph Series in Evaluation, 11. Los Angeles, CA:
Center for the Study of Evaluation.
Edelman, J. (1981). The impact of mandated testing programs
on classroom practices. education, 102(1), 56-59.
Fish, J. (1988) . la=12s2nae.stoar______
Unpublished doctoral dissertation, University of
California, Los Angeles.
Goslin, D. (1967) . Thachers and_testing. New York: Russell
Sage Foundation.
Herman, J.L. (1989). priorities of_educational_testing and
6- floe e- I I .
(CSE Tech. Rep. No. 304). Los Angeles, CA: University of
California, Center for the Study of Evaluation.
.1 00
65
Linn, R.L., Grauel M.E., & Sanders, N.M. (1989). çomoring
state and district test results to national norms:
II I 0. I I.
(Technical Report) . Boulder, CO: University of
Colorado, Center for Research on Evaluation, Standards,
and Student Testing (Grant No. OERI-G-86-0003).
Madaus, G. (1985) . Test scores as administrative mechanisms
in educational policy. phi Delta Kappan, n(9), 611-17.
Madaus, G. (1988) . The influence of testing on the curricu-
lum. In L. Tanner (Ed.), The politics of reforming
Bchool administration. London: Farmer Press.
Madaus, G. (1990) . The distortion of teaching and testing:
High stakes testing and instruction. ileataay_agamal_at
Egiucation, La(3), 29-46.
Mehrens, W. A. (1984) . National tests and local curriculum:
Match or mismatch. aduratiDiaalligazarement_Laasua,s_and
Practices, 3_(3), 9-15.
Romberg, T.A., Zarinnial A., & Williams, S.R. (1989) . The
influence ormandated testing on_mathemat'c
tion: Grade 8_teachers' perceptions (Monograph).
Madison, WI: University of Wisconsin, National Center
for Research in Mathematical Science Education.
Ruddell, R.B. (1985) . Knowledge and attitude toward testing:
Field educators and legislators. The Reading Teacher,
389, 538-543.
66
Salmon-Cox, L. (1981) . Teachers and standardized achievement
tests: what's really happening? Phl_Delta Kappan,
L2(10), 730-736.
Shepard, L.A. (1990) . Inflated test score gains: Is it old
norms or teaching the test? Educational Measurement:
issues and Practices, 2(3), 15-22.
Smith, M.L., Edelsky, C., Draper, K., Rottenberg, C., &
Cherland, M. (1989) .elementary
schools (Monograph). Tempe, AZ: Arizona State
University, Center for Research on Evaluation,
Standards, and Student Testing (Grant No. OERI-G-86-
0003).
Stake, R.E. (1988, September) . The_effect of reforms in
aaaaaamant_in_tha_12,52. Paper presented at the annual
meeting of the British Educational Association at the
University of East Anglia.
Stodolsky, S.S. (1988) . The subject matters: Classroom
social Chicago:
University of Chicago Press.
Tyler, R.W., & White, S.H. (1979) . Testing, teaching, and
14A Of - -V 011 O,
Washington, DC: U.S. Department of Health, Education,
and Welfare.
Appendix A
ri 3
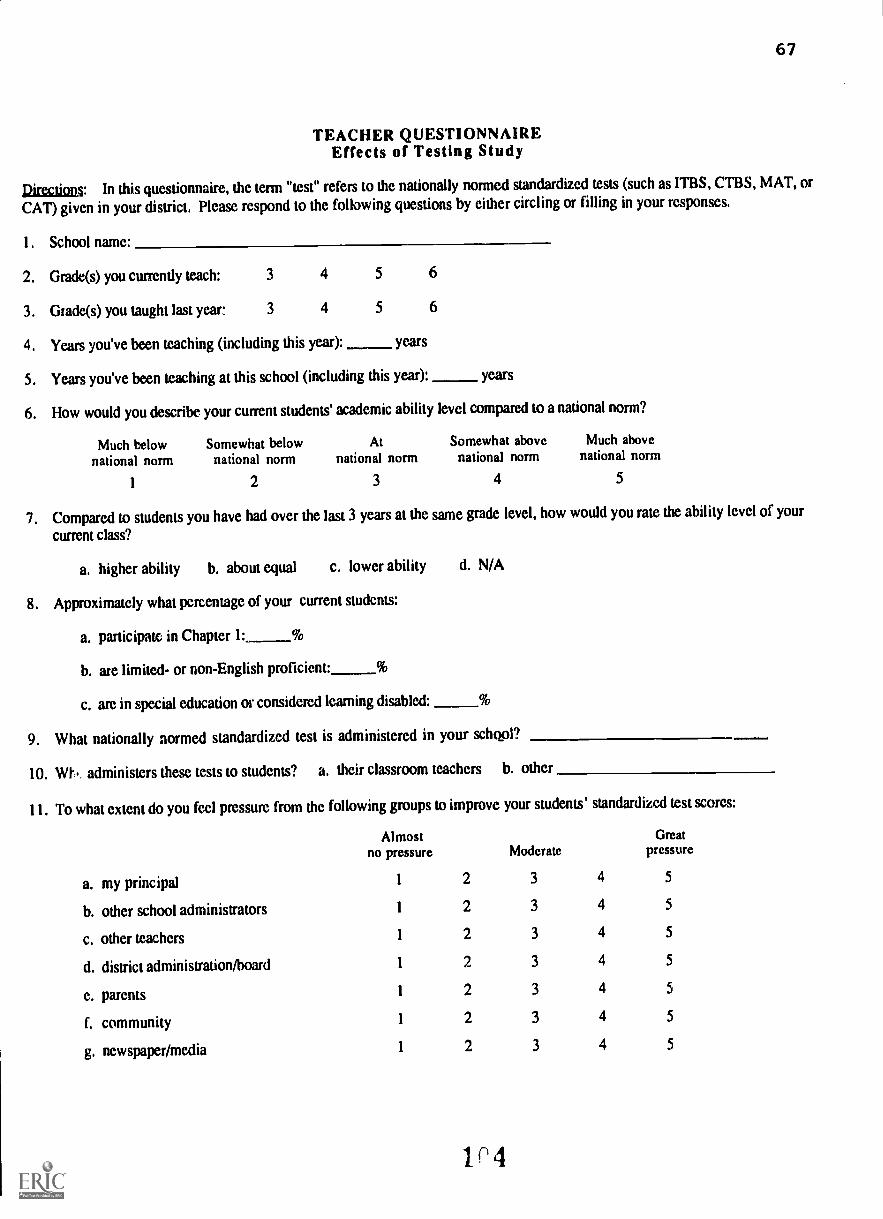
67
TEACHER QUESTIONNAIREEffects of Testing Study
Pircgiggs: In this questionnaire, the term "test" refers to the nationally normed standardized tests (such as ITBS, CTBS, MAT, or
CAT) given in your district. Please respond to the following questions by either circling or filling in your responses.
1. School name:
Grade(s) you currently teach: 3 4 5 6
3. thade(s) you taught last year 3 4 5 6
4. Years you've been teaching (including this year): years
5. Years you've been teaching at this school (including this year): years
6. How would you describe your current students' academic ability level compared to a national norm?
Much belownational norm
1
Somewhat belownational norm
2
Atnational norm
3
Somewhat abovenational norm
4
Much abovenational norm
5
7. Compared to students you have had over the last 3 years at the same grade level, how would you rate the ability level of your
current class?
a. higher ability b. about equal c. lower ability d. N/A
8. Approximately what percentage of your current students:
a. participatc in Chapter 1: %
b. are limited- or non-English proficient: %
c. are in special education or considered learning disabled:
9. What nationally normed standardized test is administered in your schgol?
10. Wk administers these tests to students? a. their classroom teachers b. other
11. To what extent do you feel pressure from the following groups to improve your students' standardized test scores:
Almost Greatno pressure Moderate pressure
a. my principal 1 2 3 4 5
b. other school administrators 1 2 3 4 5
c. other teachers 1 2 3 4 5
d. district administration/board 1 2 3 4 5
e. parents 1 2 3 4 5
f. community 1 2 3 4 5
g. newspaper/media 1 2 3 4 5
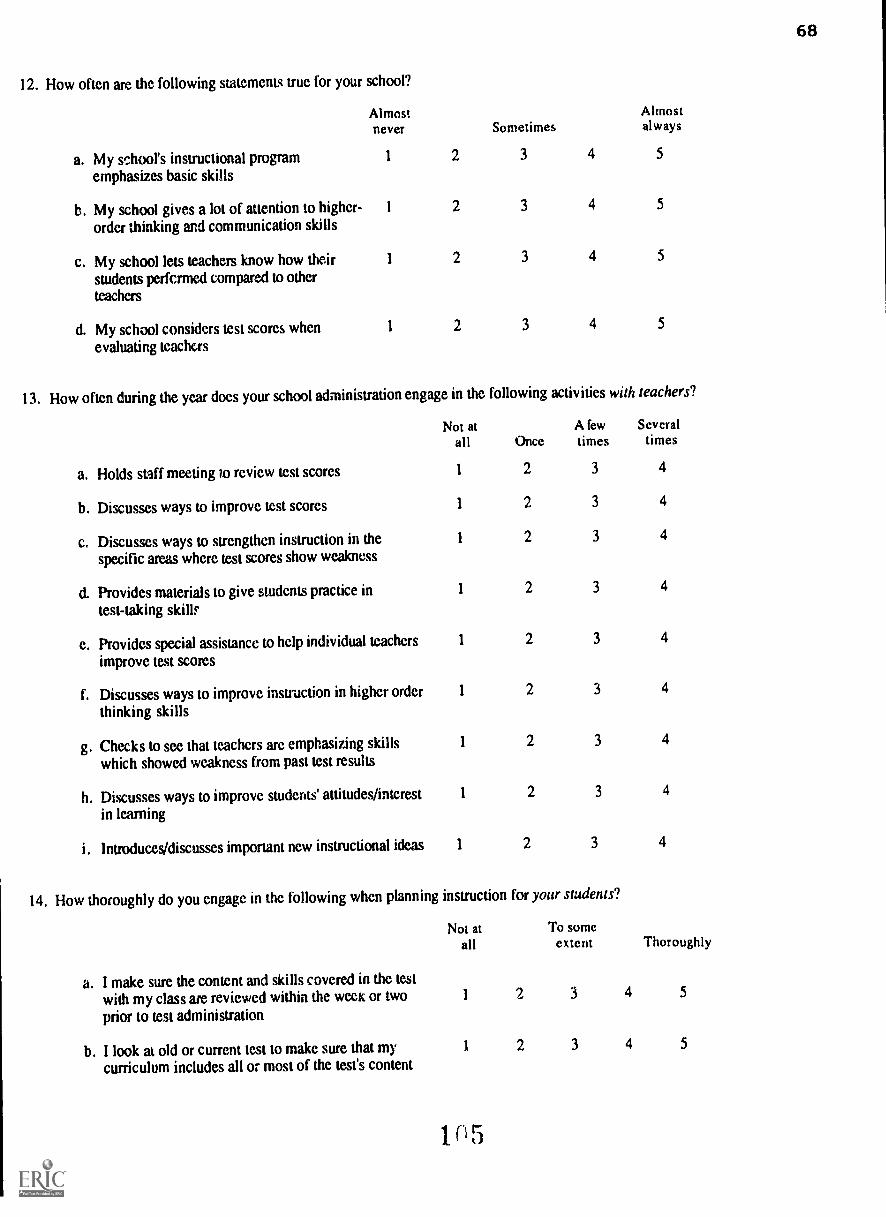
68
12. How often are the following statements true for your school?
Almostnever Sometimes
Almostalways
a. My school's instructional program 1 2 3 4 5
emphasizes basic skills
b. My school gives a lot of attention to higher- 1 2 3 4 5
order thinking and communication skills
c. My school lets teachers know how their 1 2 3 4 5
students perfcrmed compared to otherteachers
d. My school considers test scores when 1 2 3 4 5
evaluating teachers
13. How often during the year does your school administration engage in the following activities with teachers?
Not atall Once
A fewtimes
Severaltimes
a. Holds staff meeting to review test scores 1 2 3 4
b. Discusses ways to improve test scores 1 2 3 4
c. Discusses ways to strengthen instruction in thespecific areas where test scores show weakness
d. Provides materials to give suudents practice intest-taking skills
e. Provides special assistance to help individual teachersimprove test scores
f. Discusses ways to improve instruction in higher orderthinking skills
g. Checks to see that teachers are emphasizing skillswhich showed weakness from past test results
h. Discusses ways to improve students' attitudes/interestin learning
1
1
1
1
1
1
2
2
2
2
2
2
3
3
3
3
3
3
4
4
4
4
4
4
I. Introduces/discusses important new instructional ideas 1 2 3 4
14. How thoroughly do you engage in the following when planning instruction for your students?
a. I make sure the content and skills covered in the test
Not atall
To someextent Thoroughly
with my class are reviewed within the week or two 1 2 3 4 5
prior to test administration
b. I look at old or current test to make sure that my 1 2 3 4 5
curriculum includes all or most of the test's content
n 5
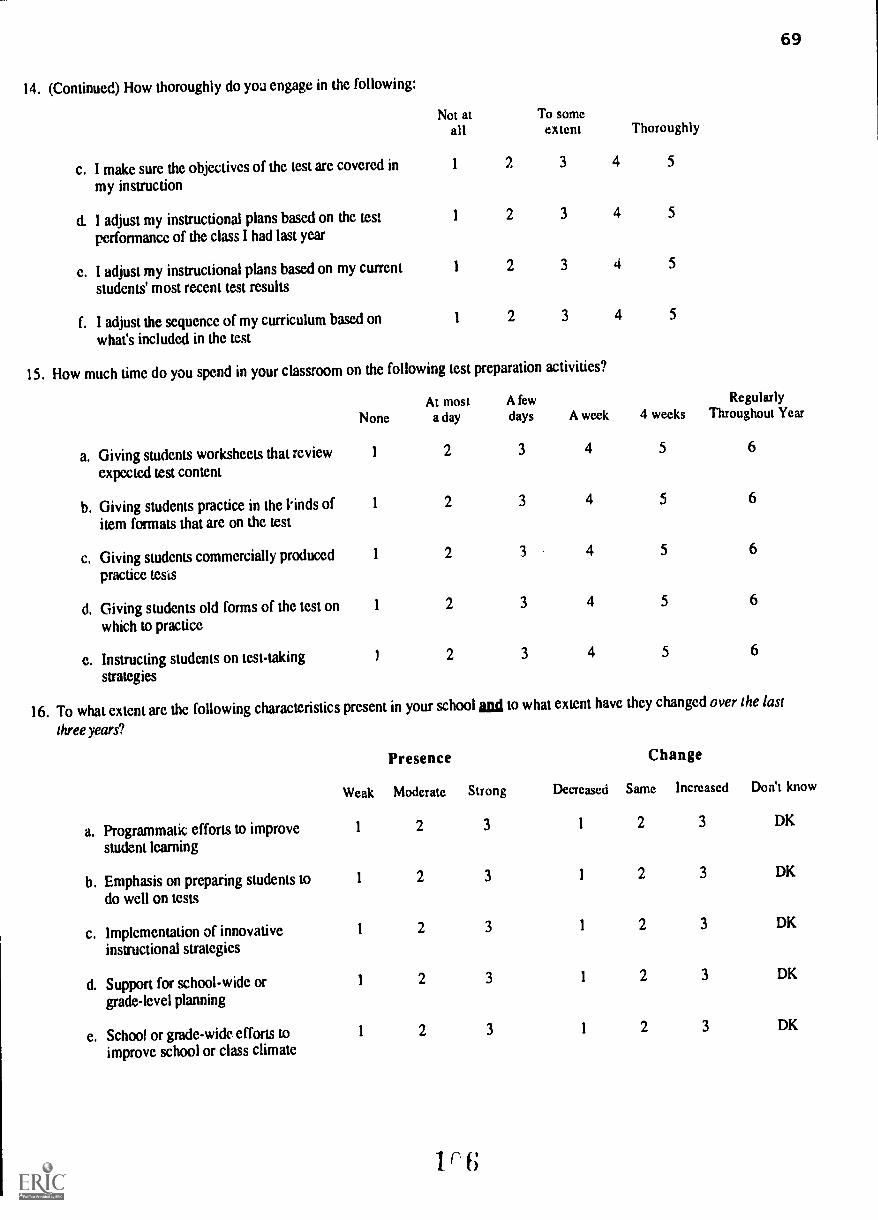
69
14. (Continued) How thoroughly do you engage in the following:
Not atall
To someextent Thoroughly
c. I make sure the objectives of the test are covered in 1 2 3 4 5
my instruction
d. I adjust my instructional plans based on the test 1 2 3 4 5
performance of the class I had last year
e. I adjust my instructional plans based on my current 1 2 3 4 5
students' most recent test results
f. I adjust the sequence of my curriculum based on 1 2 3 4 5
what's included in the test
15. How much time do you spend in your classroom on the following test preparation activities?
NoneAt most
a dayA fewdays A week 4 weeks
RegularlyThroughout Year
a. Giving students worksheets that review 1 2 3 4 5 6
expected test content
b. Giving students practice in the kinds of 1 2 3 4 5 6
item formats that are on the test
c. Giving students commercially produced 1 2 3 4 5 6
practice tesis
d. Giving students old forms of the test on 1 2 3 4 5 6
which to practice
e. Instructing students on test-taking 1 2 3 4 5 6
strategies
16. To what extent are the following characteristics present in your school And to what extent have they changed over the last
three years?
Weak
Presence
Moderate Strong Decreased
Change
Same Increased Don't know
a. Programmatic efforts to improve 1 2 3 1 2 3 DK
student learning
b. Emphasis on preparing students to 1 2 3 1 2 3 DK
do well on tests
c. Implementation of innovative 1 2 3 1 2 3 DK
instructional strategies
d. Support for school-wide or 1 2 3 1 2 3 DK
grade-level planning
e. School or grade-wide efforts to 1 2 3 1 2 3 DK
improve school or class climate
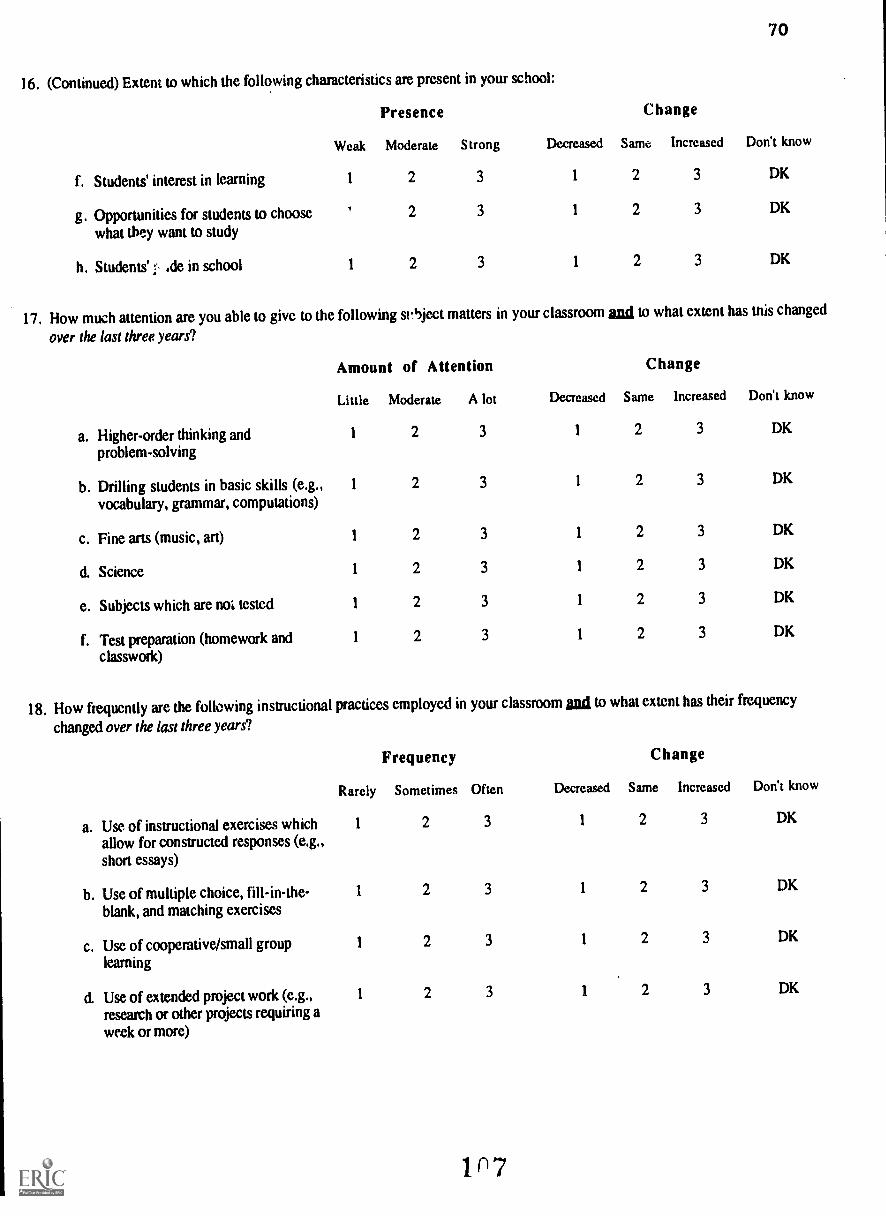
16, (Continued) Extent to which the following characteristics are present in your school:
f. Students' interest in learning
g. Opportunities for students to choosewhat they want to study
h. Students' 1.. .de in school
70
Presence Change
Weak Moderate Strong Decreased Same Increased Don't know
1 2 3 1 2 3 DK
2 3 1 2 3 DK
1 2 3 1 2 3 DK
17. How miKh attention are you able to give to the following srbject matters in your classroom and to what extent has mis changed
over the last three years?
a. Higher-order thinking andproblem-solving
b. Drilling students in basic skills (e.g.,vocabulary, grammar, computations)
c. Fine arts (music, art)
d. Science
e. Subjects which are not tested
1', Test preparation (homework andclasswork)
Amount of Attention
Little Moderate A lot Decreased
Change
Same Increased Don't know
1 2 3 1 2 3 DK
1 2 3 1 2 3 DK
1 2 3 1 2 3 DK
1 2 3 1 2 3 DK
1 2 3 1 2 3 DK
1 2 3 1 2 3 DK
18, How frequently are the following instructional practices employed in your classroom and to what extent has their frequency
changed over the last three years?
Rarely
Frequency
Sometimes Often Decreased
Change
Same Increased Don't know
a. Use of instructional exercises which 1 2 3 1 2 3 DK
allow for constructed responses (e.g.,short essays)
b. Use of multiple choice, fill-in-the- 1 2 3 1 2 3 DK
blank, and matching exercises
c. Use of cooperative/small group 1 2 3 1 2 3 DK
learning
d. Use of extended project work (e.g., 1 2 3 1 2 3 DK
research or other projects requiring aweek or more)
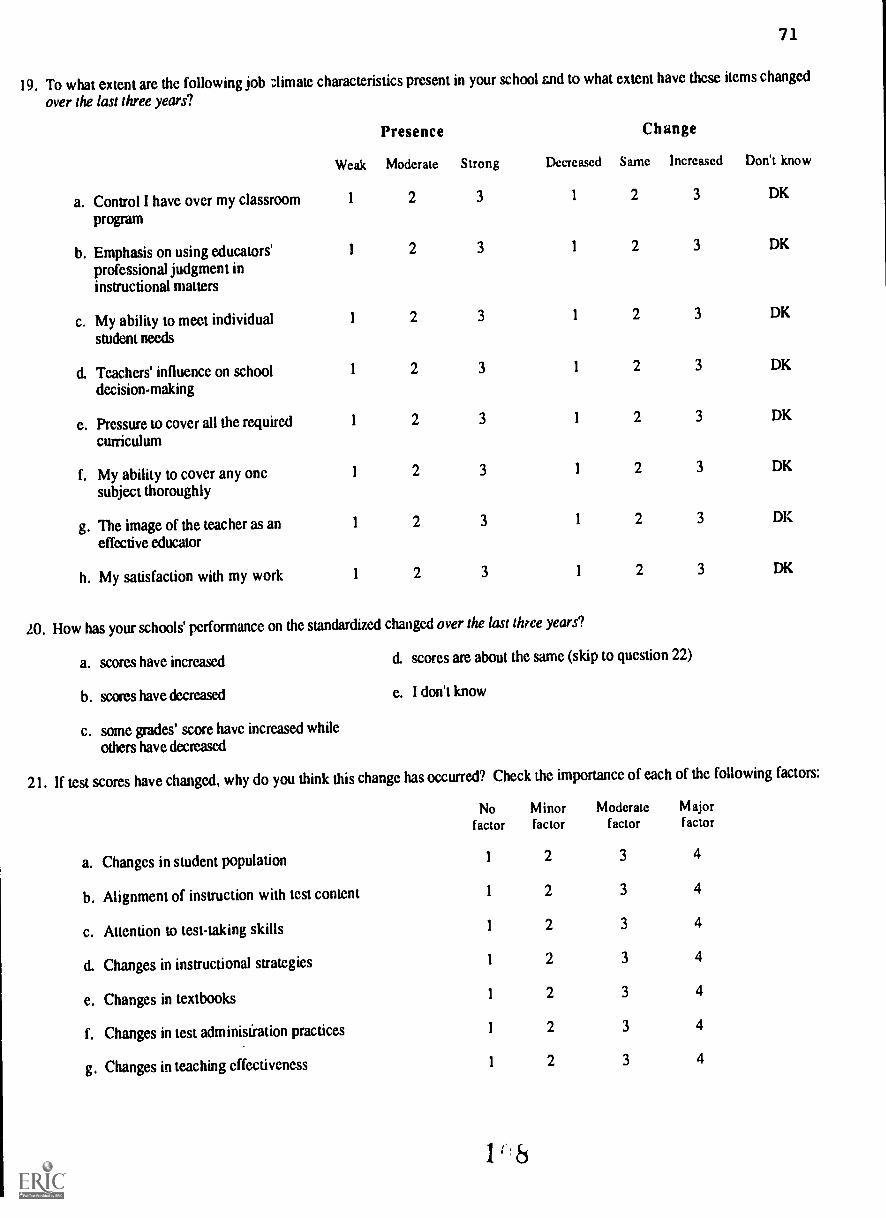
71
19. To what extent are the following job Aimate characteristics present in your school and to what extent have these items changed
over the last three years?
a. Control I have over my classroomprogram
b. Emphasis on using educators'professional judgment ininstructional matters
c. My ability to meet individualstudent needs
d. Teachers' influence on schooldecision-making
e. Pressure to cover all the requiredcurriculum
f. My ability to cover any onesubject thoroughly
g. The image of the teacher as aneffective educator
h. My satisfaction with my work
Weak
Presence
Moderate S trong Decreased
Change
S ame Increased Don't know
1 2 3 1 2 3 DK
1 2 3 1 2 3 DK
1 2 3 1 2 3 DK
1 2 3 1 2 3 DK
1 2 3 1 2 3 DK
1 2 3 1 2 3 DK
1 2 3 1 2 3 DK
1 2 3 1 2 3 DK
20. How has your schools' performance on the standardized changed over the last three years?
a. scores have increased d. scores are about the same (skip to question 22)
b. scores have decreased e. I don't know
c. some grades' score have increased whileothers have decreased
21. If test scores have changed, why do you think this change has occurred? Check the importance of each of the following factors:
a. Changes in student population
b. Alignment of instruction with test content
c. Attention to test-taking skills
d. Changes in instructional strategies
e. Changes in textbooks
f. Changes in test administration practices
g. Changes in teaching effectiveness
Nofactor
M inorfactor
Moderatefactor
M ajorfactor
1 2 3 4
1 2 3 4
1 2 3 4
1 2 3 4
1 2 3 4
1 2 3 4
1 2 3 4
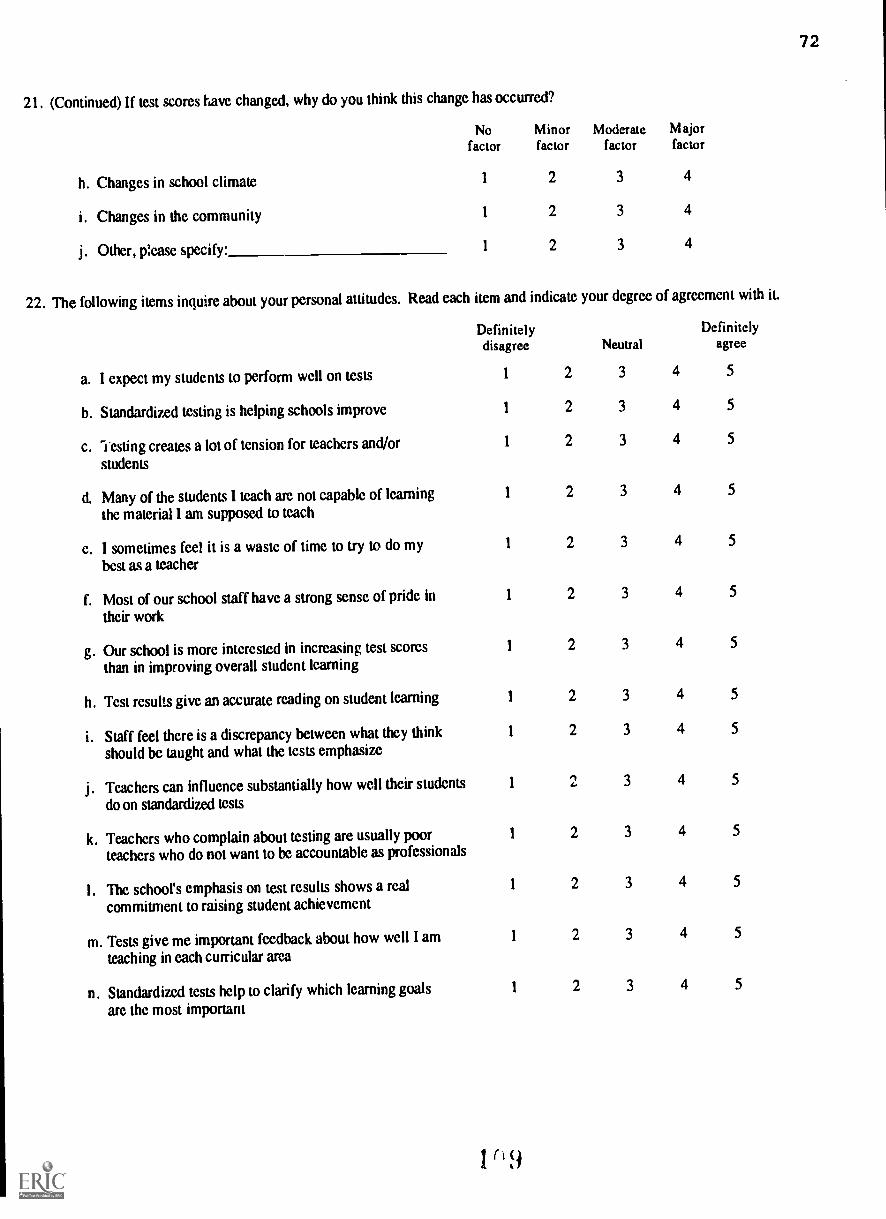
21. (Continued) If test scores have changed, why do you think this change has occurred?
Nofactor
Minorfactor
Moderatefactor
Majorfactor
h. Changes in school climate 1 2 3 4
i. Changes in the community 1 2 3 4
j. Other, ptease specify: 1 2 3 4
22. The following items inquire about your personal attitudes. Read each item and indicate your degree of agreement with it.
a. I expect my students to perform well on tests
b. Standardized testing is helping schools improve
c. Testing creates a lot of tension for teachers and/orstudents
d. Many of the students I teach are not capable of learningthe material I am supposed to teach
e. I sometimes feel it is a waste of time to try to do mybest as a teacher
f. Most of our school staff have a strong sense of pride in
their work
g. Our school is more interested in increasing test scoresthan in improving overall student learning
h. Test results give an accurate reading on student lmming
i. Staff feel there is a discrepancy between what they thinkshould be taught and what the tests emphasize
j. Teachers can influence substantially how well their students
do on standardized tests
k. Teachers who complain about testing are usually poorteachers who do not want to be accountable as professionals
I. The school's emphasis on test results shows a realcommitment to raising student achievement
m. Tests give me important feedback about how well I amteaching in each curricular area
n. Standardized tests help to clarify which learning goalsarc the most important
Definitelydisagree
1 2
1 2
1 2
1 2
1 2
1 2
1 2
1 2
1 2
1n,..
1 2
1 2
1 2
1 2
1 (19
NeutralDefinitely
agree
3 4 5
3 4 5
3 4 5
3 4 5
3 4 5
3 4 5
3 4 5
3 4 5
3 4 5
3 4 5
3 4 5
3 4 5
3 4 5
3 4 5
72
Your Comments
If you think we will not be able to figure out the ways standardized testing is helping or hurting from your answers to thisquestionnaire, please explain below as simply as you can.
Thank you for your patience, time, and lots of good thought.
1 t
73