Embed Size (px)
Citation preview
Wyoming Public Service Commission
Joint Corporations, Elections and Political Subdivisions Interim Committee
May 19, 2017
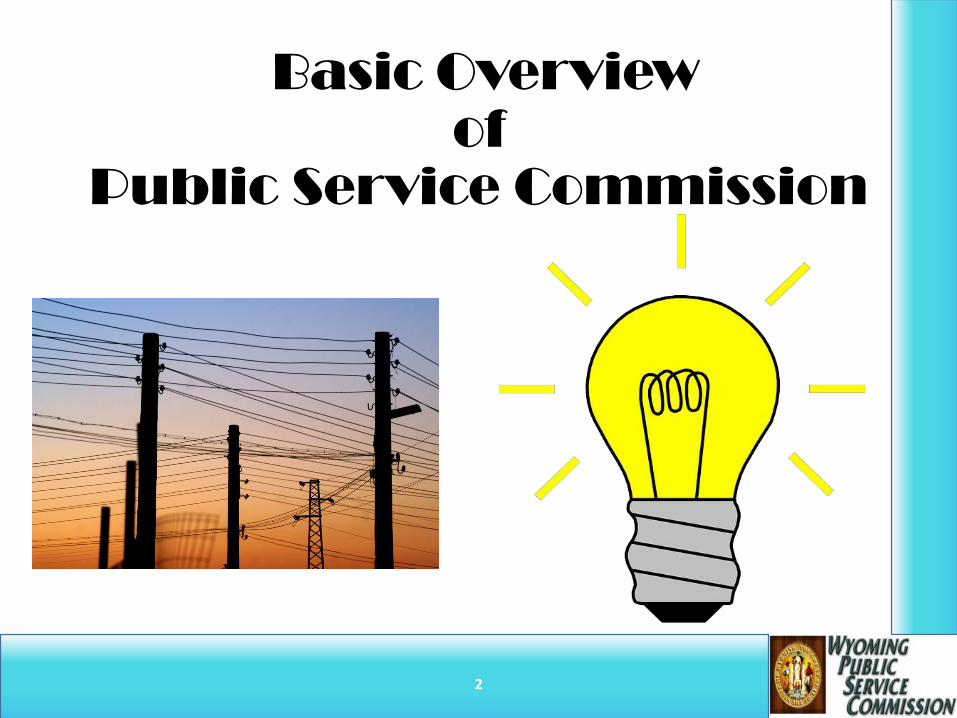
Basic Overview
of
Public Service Commission
2
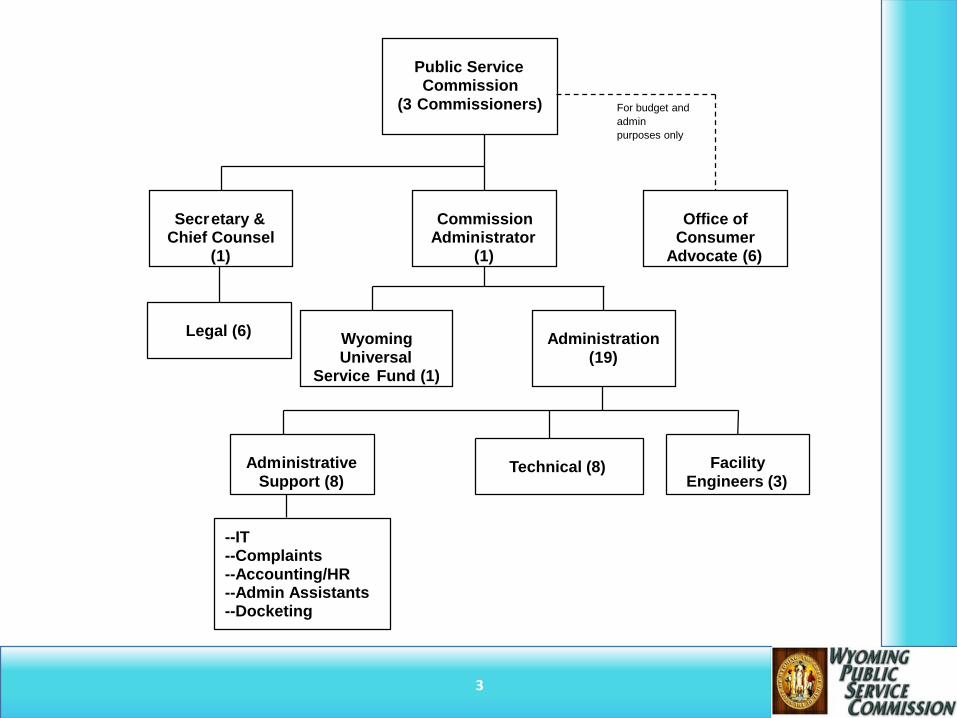
3
Public Service Commission
(3 Commissioners)
Secretary & Chief Counsel
1)(
mission ComAdministrator
(1)
Office of Consumer
Advocate (6)
oming Wyversal Uni
Service Fund (1)
Administration 19)(
Technical (8)
For budget and
admin
purposes only
Facility Engineers (3)
Legal (6)
Administrative Support (8)
--IT--Complaints --Accounting/HR --Admin Assistants --Docketing
4
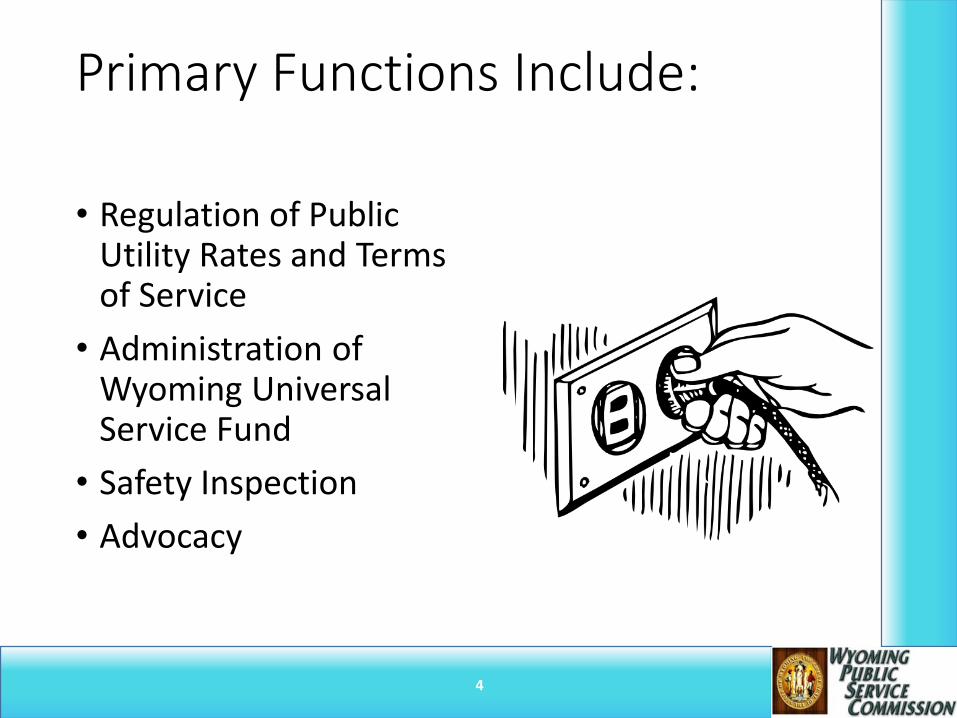
Primary Functions Include:
• Regulation of Public Utility Rates and Terms of Service
• Administration of Wyoming Universal Service Fund
• Safety Inspection
• Advocacy
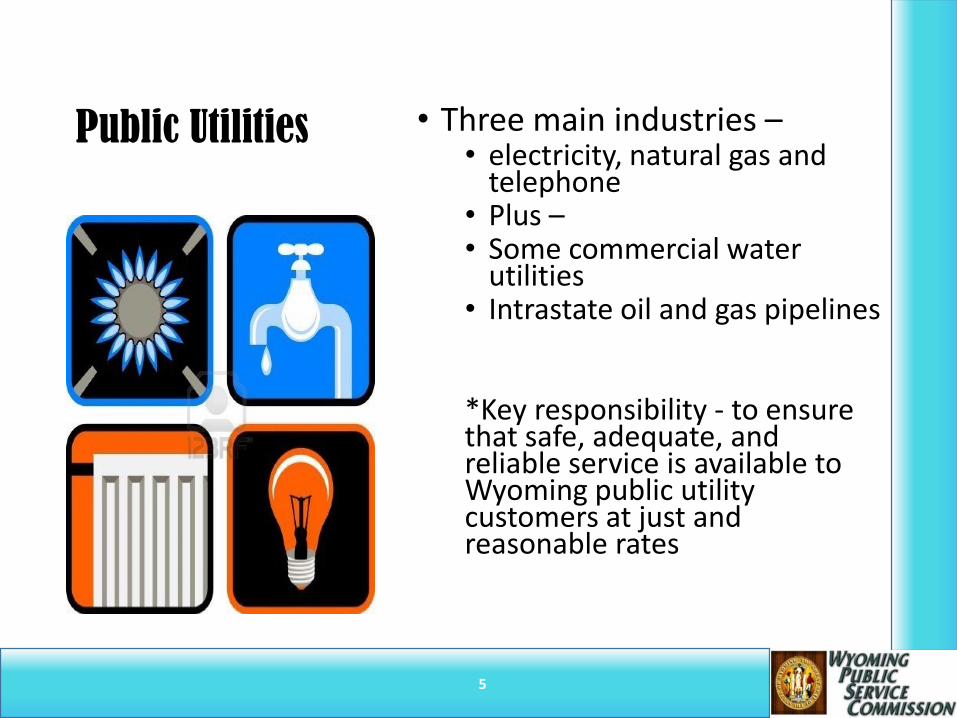
Public Utilities • Three main industries –• electricity, natural gas and
telephone • Plus –• Some commercial water
utilities• Intrastate oil and gas pipelines
*Key responsibility - to ensure that safe, adequate, and reliable service is available to Wyoming public utility customers at just and reasonable rates
5
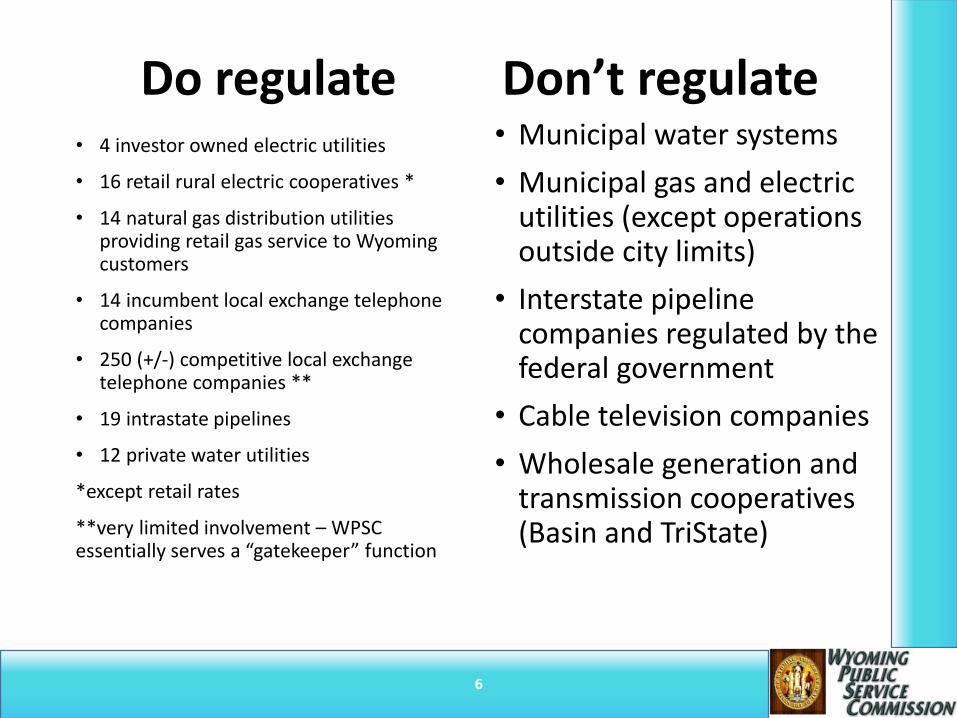
Do regulate Don’t regulate
6
• 4 investor owned electric utilities
• 16 retail rural electric cooperatives *
• 14 natural gas distribution utilities providing retail gas service to Wyoming customers
• 14 incumbent local exchange telephone companies
• 250 (+/-) competitive local exchange telephone companies **
• 19 intrastate pipelines
• 12 private water utilities
*except retail rates
**very limited involvement – WPSC essentially serves a “gatekeeper” function
• Municipal water systems
• Municipal gas and electric utilities (except operations outside city limits)
• Interstate pipeline companies regulated by the federal government
• Cable television companies
• Wholesale generation and transmission cooperatives (Basin and TriState)
7
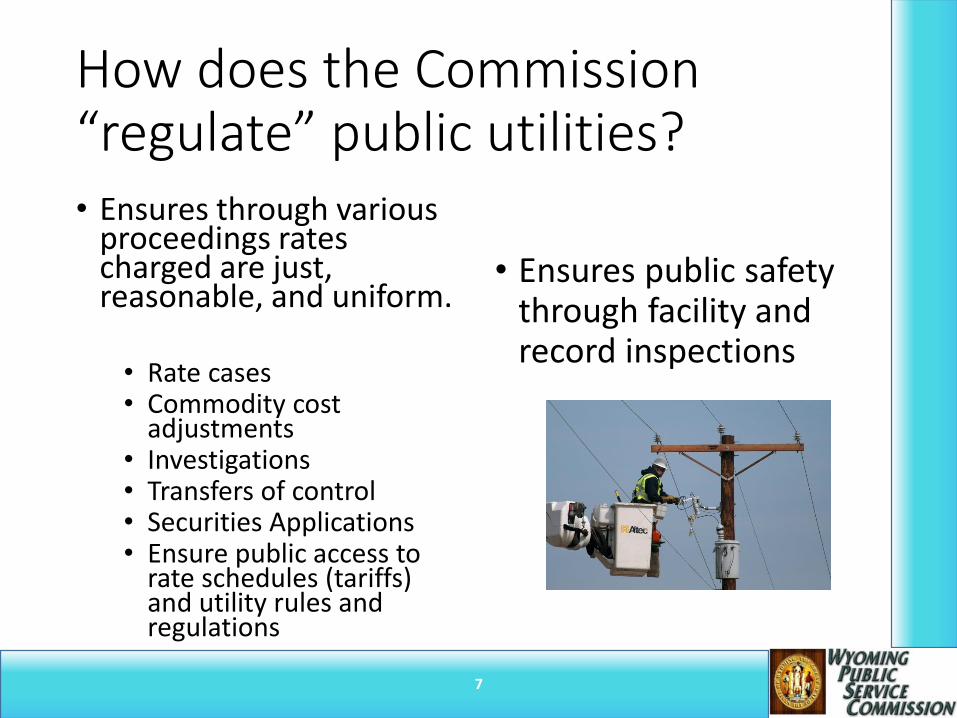
How does the Commission “regulate” public utilities?• Ensures through various
proceedings rates charged are just, reasonable, and uniform.
• Rate cases• Commodity cost
adjustments• Investigations• Transfers of control• Securities Applications• Ensure public access to
rate schedules (tariffs) and utility rules and regulations
• Ensures public safety through facility and record inspections
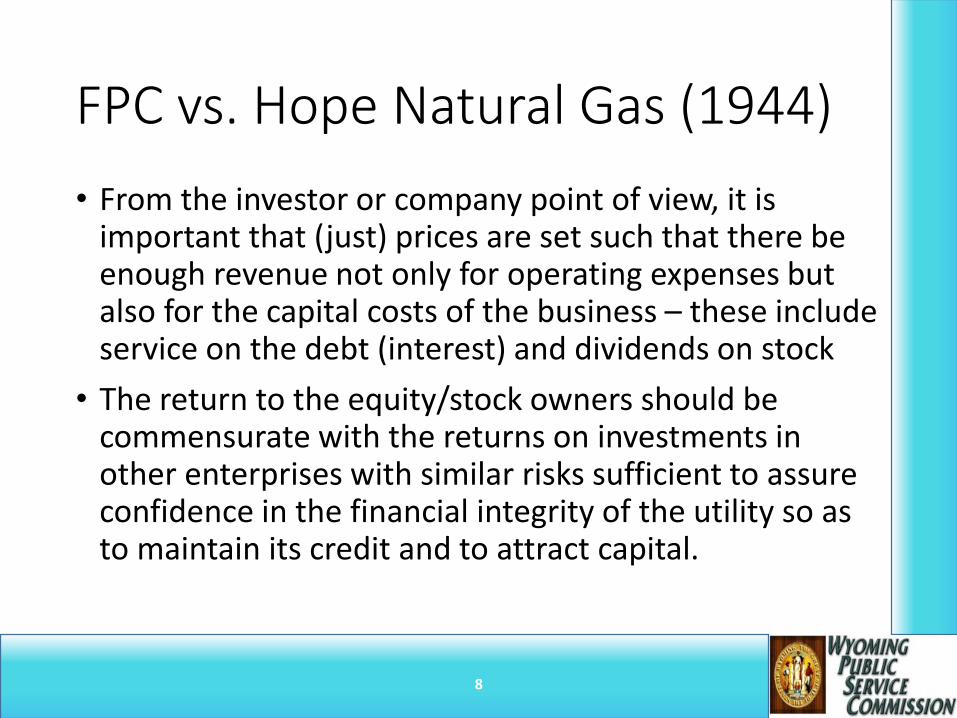
FPC vs. Hope Natural Gas (1944)
• From the investor or company point of view, it is important that (just) prices are set such that there be enough revenue not only for operating expenses but also for the capital costs of the business – these include service on the debt (interest) and dividends on stock
• The return to the equity/stock owners should be commensurate with the returns on investments in other enterprises with similar risks sufficient to assure confidence in the financial integrity of the utility so as to maintain its credit and to attract capital.
8
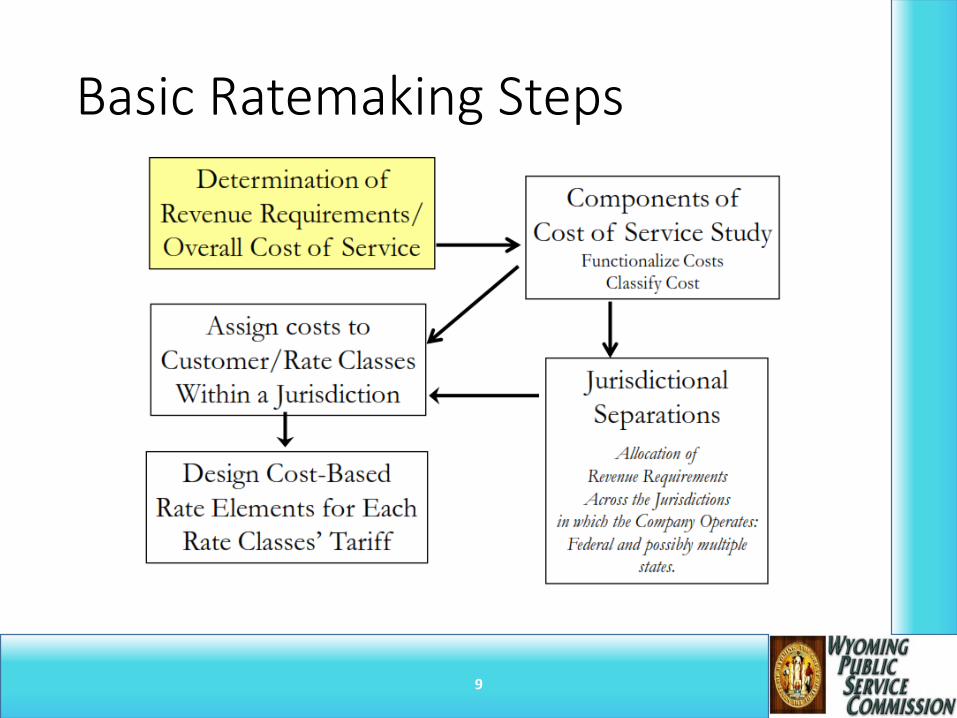
Basic Ratemaking Steps
9
General Rate Case Procedure1. Filing of the Application and Supporting Written Testimony,
Data, Analysis
2. Public Notice of Filing
3. Petitions for Leave to Intervene
4. Pre-hearing or Scheduling Conference
5. Discovery Phase – Information or Data Requests
6. Filing of Written Testimony by Intervenors
7. Filing of Written Rebuttal Testimony by Applicant and Cross Answer Testimony by Intervenors
8. Evidentiary Hearing
9. Possible Legal Briefs
10. Public Deliberation
11. Decision
10
Regulation - substitute for competition
• Under public utility regulation, price, quality of service, profitability as well as entry and exit, are controlled by the state rather than being left to market forces.
11
12
In addition to contested case hearings, Commission action includes:
• Regular open meetings to act on matters that do not require a hearing, receive reports and information, etc.
• Rule-making
Wyoming Universal Service Fund (WUSF)
13
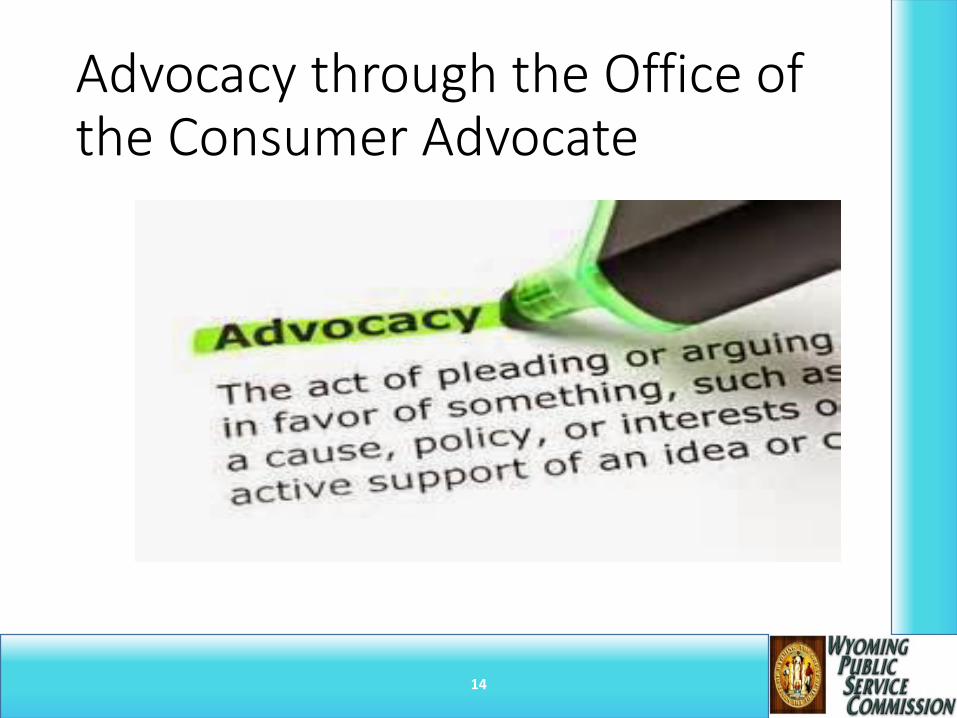
Advocacy through the Office of the Consumer Advocate
14
Wyoming Office of Consumer Advocate - Wyo. Stats. §§
37-2-401 through 404
• Represent the interests of Wyoming citizens and all classes of utility customers in matters involving public utilities by:• Intervening as a party in any proceeding before the
Commission;
• Appealing actions of the Commission;
• Appearing as amicus curiae in any court proceeding;
• Providing information and assistance to individual consumers regarding Commission proceedings.
15
Commission also protects consumers’ interests:
• Commission Rules – ensure accurate metering and billing, reasonable procedures for discontinuation of service, consistent commodity quality, etc.
• Commission Rules have various requirements for the company price schedules to ensure customers are aware of all costs.
• Commission can resolve complaints informally or after a contested case hearing (formally).
16
For instance ---
• Utility Customer Outreach FY2016 - PSC complaint staff processed 232 complaints and 19 requests for information.
• 83% of these matters were resolved within 30 days, and 97% were resolved within 60 days. At the end of FY2016, all but 10 of these matters had been resolved.
• Complaints concerning telephone service accounted for 41% of the total, electric service 31%, gas service 26%, and water service 2%.
• 174 of 251, or 69%, of complaints pertaining to matters within the WPSC’s jurisdiction were categorized as service, billing, and disconnection issues.
• Customers that filed complaints received credits and refunds of over $16,000 during the year.
17
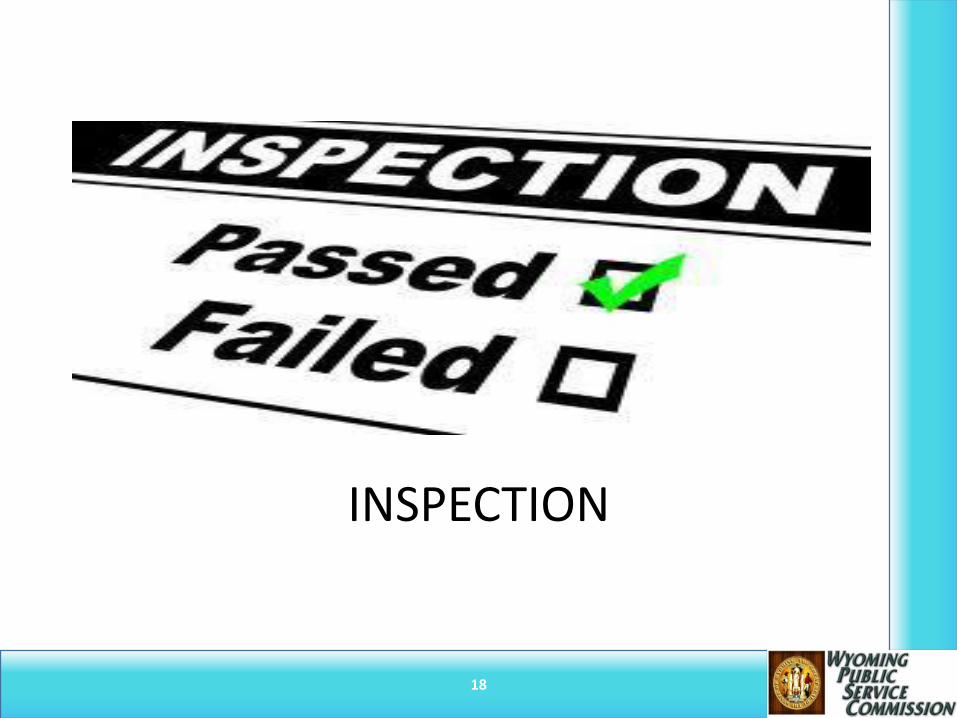
INSPECTION
18
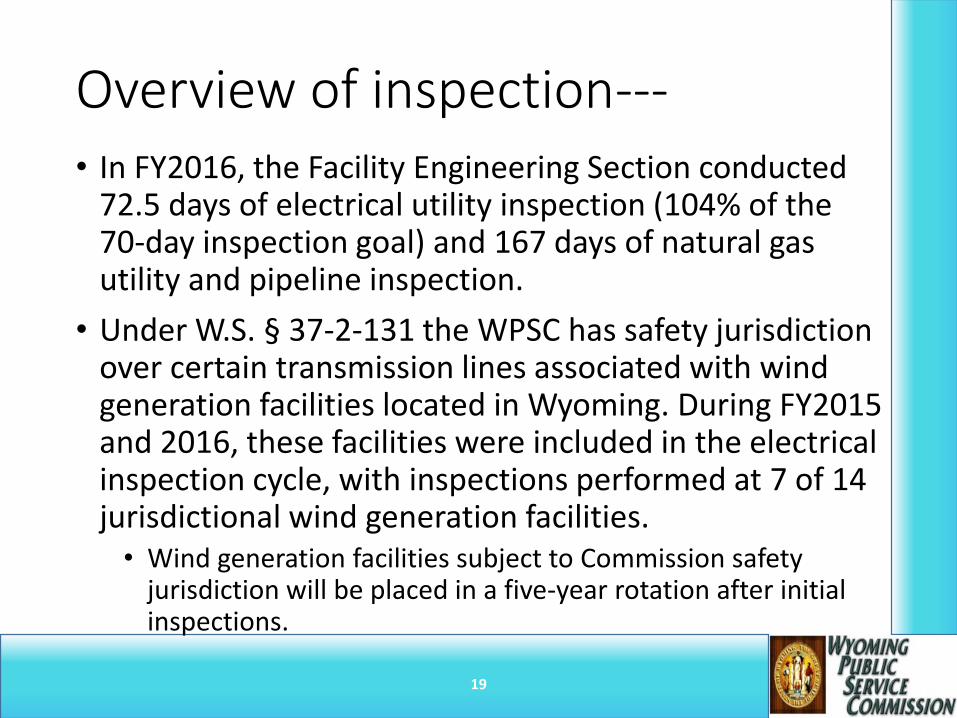
Overview of inspection---• In FY2016, the Facility Engineering Section conducted
72.5 days of electrical utility inspection (104% of the 70-day inspection goal) and 167 days of natural gas utility and pipeline inspection.
• Under W.S. § 37-2-131 the WPSC has safety jurisdiction over certain transmission lines associated with wind generation facilities located in Wyoming. During FY2015 and 2016, these facilities were included in the electrical inspection cycle, with inspections performed at 7 of 14 jurisdictional wind generation facilities. • Wind generation facilities subject to Commission safety
jurisdiction will be placed in a five-year rotation after initial inspections.
19
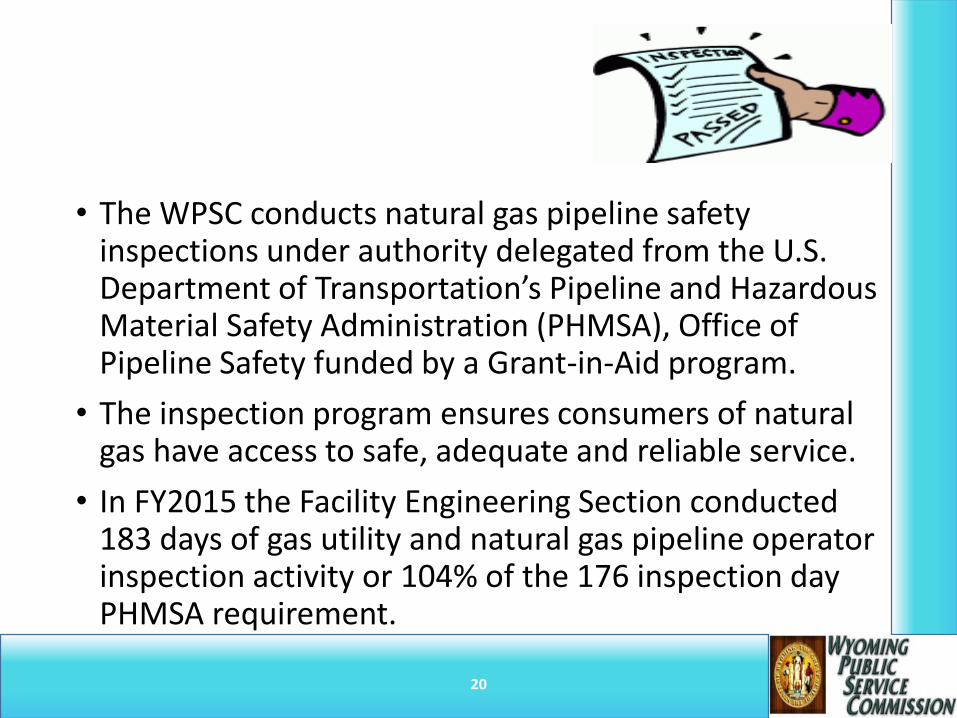
• The WPSC conducts natural gas pipeline safety inspections under authority delegated from the U.S. Department of Transportation’s Pipeline and Hazardous Material Safety Administration (PHMSA), Office of Pipeline Safety funded by a Grant-in-Aid program.
• The inspection program ensures consumers of natural gas have access to safe, adequate and reliable service.
• In FY2015 the Facility Engineering Section conducted 183 days of gas utility and natural gas pipeline operator inspection activity or 104% of the 176 inspection day PHMSA requirement.
20
Wyo. Stat. § 37-3-114 - Safety Standards
• Additional examples of safety requirements in Commission Rules:
• Require service interruption reports for incidents likely to produce significant detrimental effect on customers–the reasons and the outcomes. (These reports are shared with Wyo. Homeland Security as necessary).
• Clear construction and maintenance standards and safety requirements.
21
Telecommunications
22
•WUSF Overview
•Qwest Un-credited FUSF Update
•Quality of Service Investigation Status
•Utility Complaint Comparison
23
Today’s Telecom Presentation

24
Wyoming
Universal
Service
Fund
•Purpose•Assist
Customers
•Rural Areas
•High Telephone Rates
•$30 Imputed Price Benchmark
25
Wyoming Universal Service Fund
26
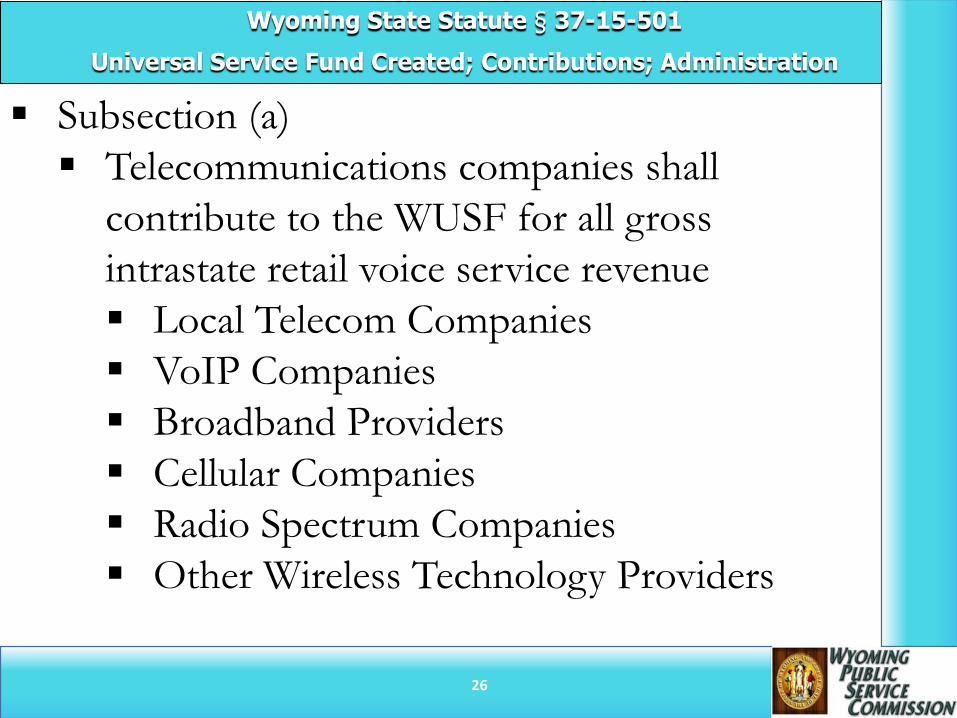
Wyoming State Statute § 37-15-501
Universal Service Fund Created; Contributions; Administration
Subsection (a)
Telecommunications companies shall
contribute to the WUSF for all gross
intrastate retail voice service revenue
Local Telecom Companies
VoIP Companies
Broadband Providers
Cellular Companies
Radio Spectrum Companies
Other Wireless Technology Providers
27
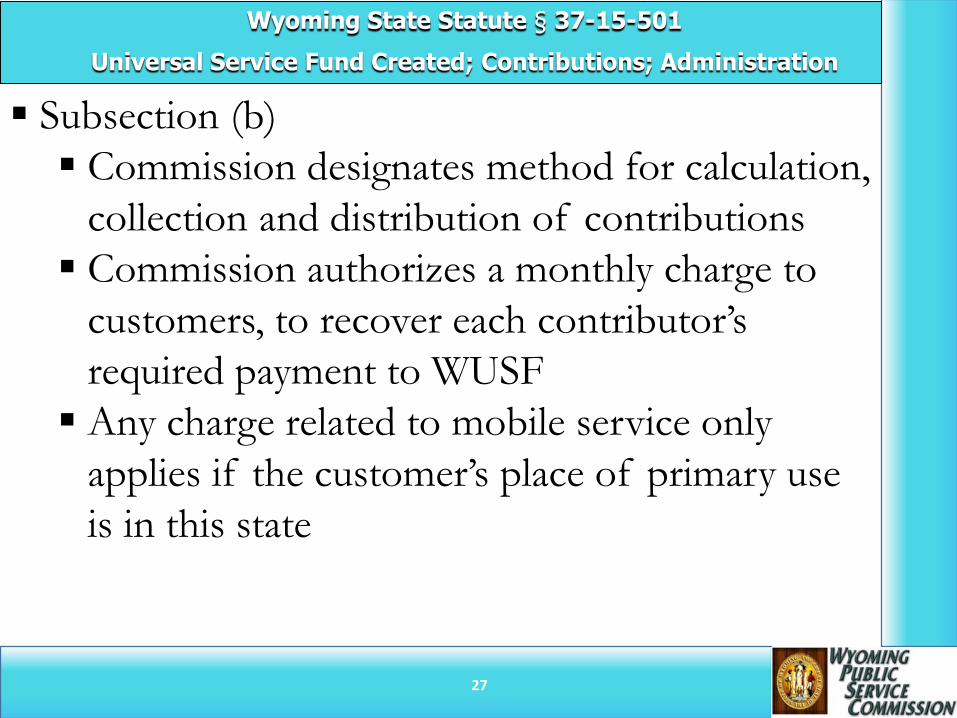
Subsection (b)
Commission designates method for calculation,
collection and distribution of contributions
Commission authorizes a monthly charge to
customers, to recover each contributor’s
required payment to WUSF
Any charge related to mobile service only
applies if the customer’s place of primary use
is in this state
Wyoming State Statute § 37-15-501
Universal Service Fund Created; Contributions; Administration
28
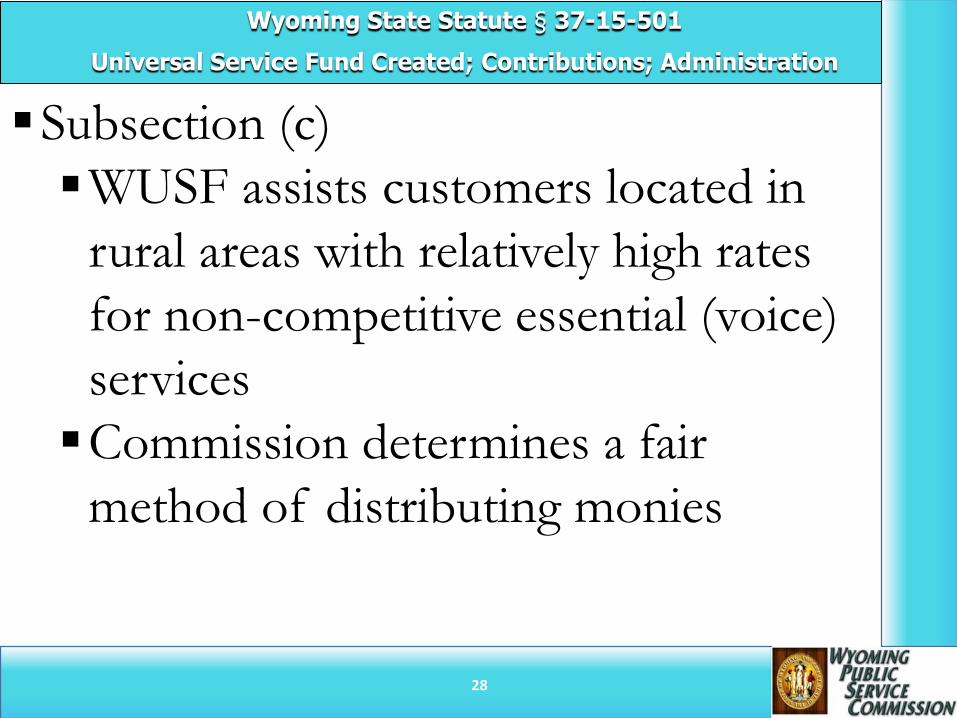
Subsection (c)
WUSF assists customers located in
rural areas with relatively high rates
for non-competitive essential (voice)
services
Commission determines a fair
method of distributing monies
Wyoming State Statute § 37-15-501
Universal Service Fund Created; Contributions; Administration
29
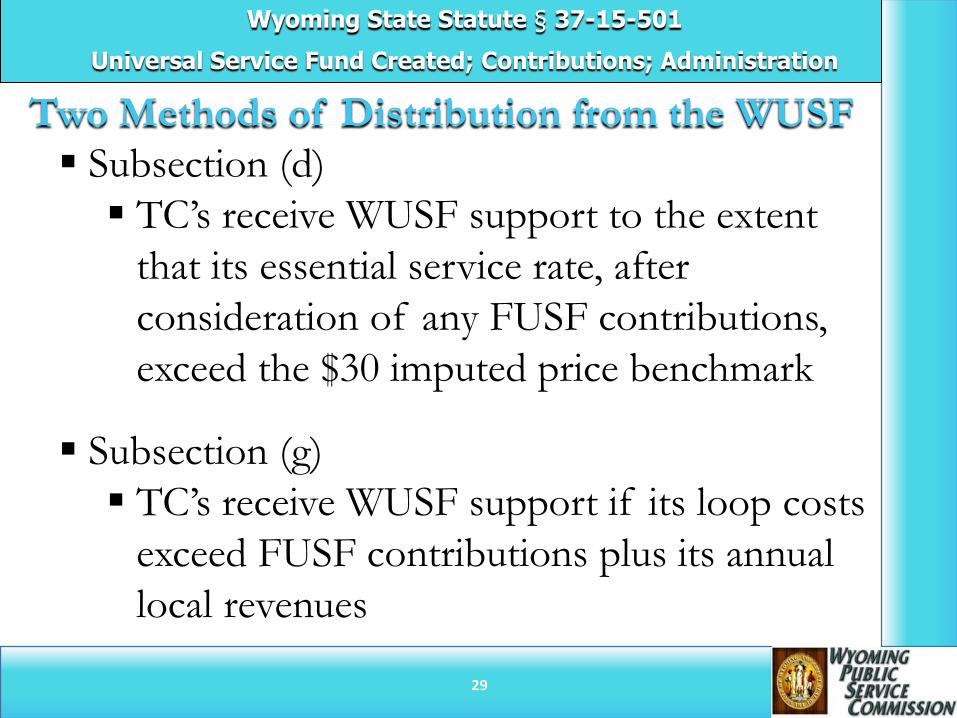
Two Methods of Distribution from the WUSF
Subsection (d)
TC’s receive WUSF support to the extent
that its essential service rate, after
consideration of any FUSF contributions,
exceed the $30 imputed price benchmark
Subsection (g)
TC’s receive WUSF support if its loop costs
exceed FUSF contributions plus its annual
local revenues
Wyoming State Statute § 37-15-501
Universal Service Fund Created; Contributions; Administration
30
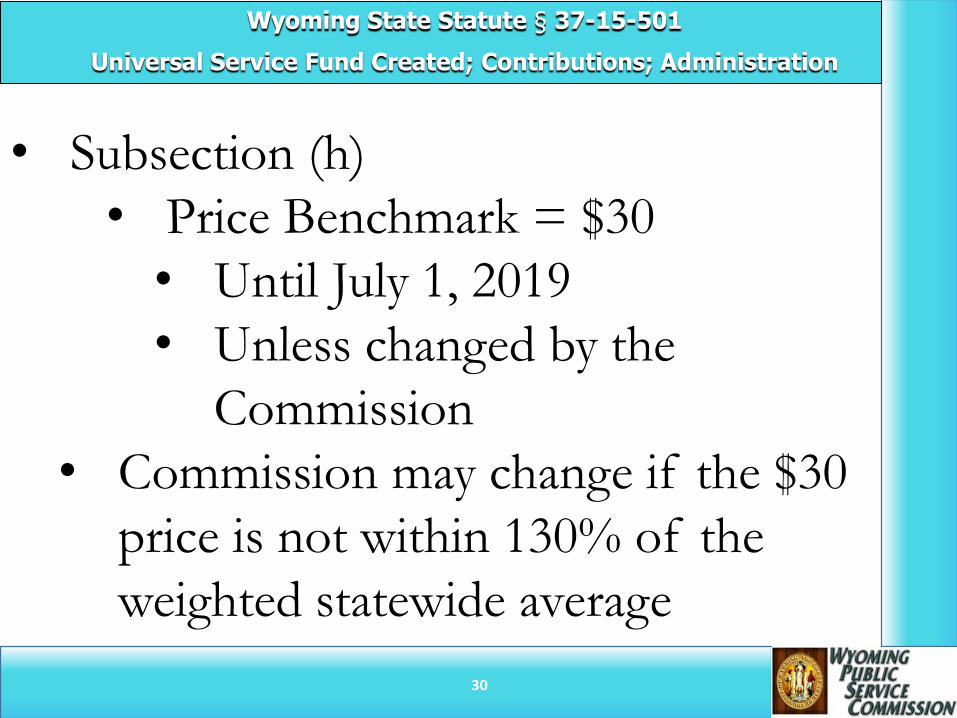
• Subsection (h)
• Price Benchmark = $30
• Until July 1, 2019
• Unless changed by the
Commission
• Commission may change if the $30
price is not within 130% of the
weighted statewide average
Wyoming State Statute § 37-15-501
Universal Service Fund Created; Contributions; Administration
31
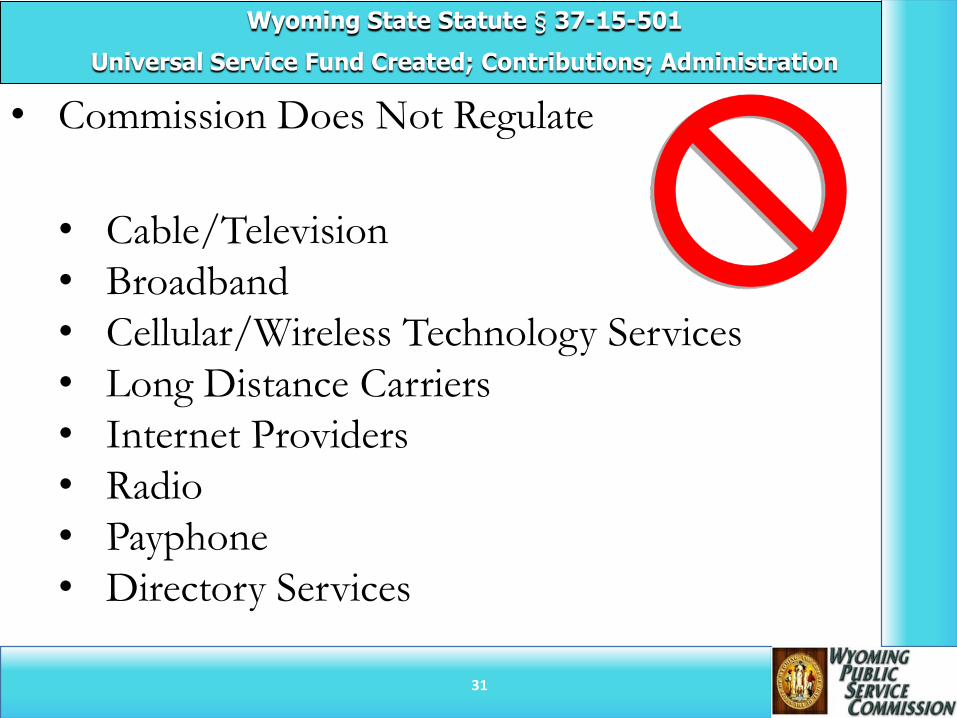
• Commission Does Not Regulate
• Cable/Television
• Broadband
• Cellular/Wireless Technology Services
• Long Distance Carriers
• Internet Providers
• Radio
• Payphone
• Directory Services
Wyoming State Statute § 37-15-501
Universal Service Fund Created; Contributions; Administration
32
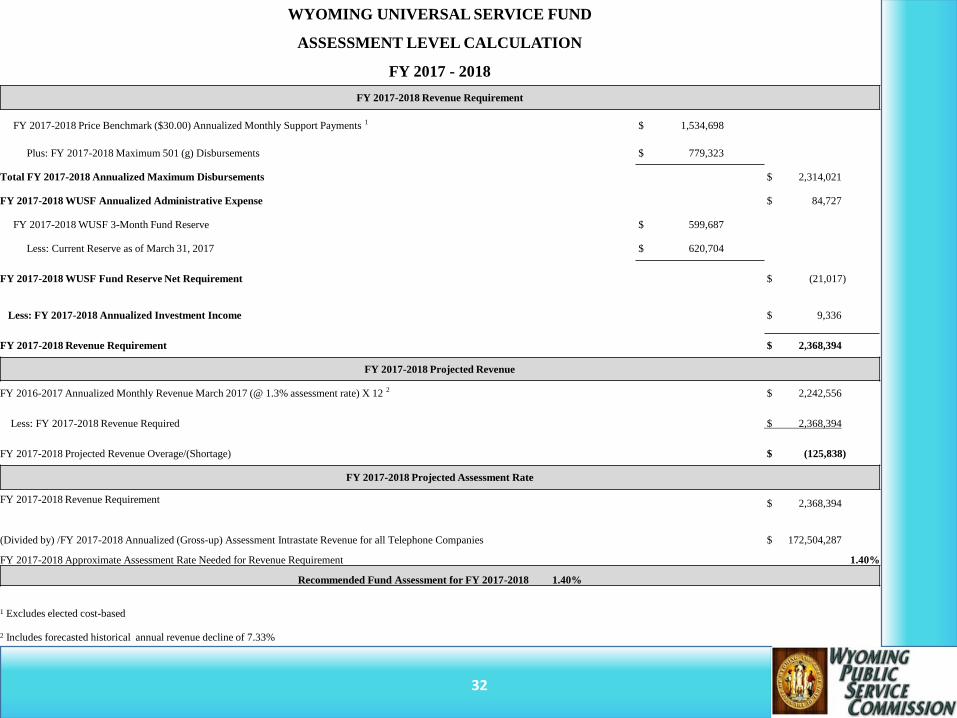
WYOMING UNIVERSAL SERVICE FUND
ASSESSMENT LEVEL CALCULATION
FY 2017 - 2018
FY 2017-2018 Revenue Requirement
FY 2017-2018 Price Benchmark ($30.00) Annualized Monthly Support Payments 1 $ 1,534,698
Plus: FY 2017-2018 Maximum 501 (g) Disbursements $ 779,323
Total FY 2017-2018 Annualized Maximum Disbursements $ 2,314,021
FY 2017-2018 WUSF Annualized Administrative Expense $ 84,727
FY 2017-2018 WUSF 3-Month Fund Reserve $ 599,687
Less: Current Reserve as of March 31, 2017 $ 620,704
FY 2017-2018 WUSF Fund Reserve Net Requirement $ (21,017)
Less: FY 2017-2018 Annualized Investment Income $ 9,336
FY 2017-2018 Revenue Requirement $ 2,368,394
FY 2017-2018 Projected Revenue
FY 2016-2017 Annualized Monthly Revenue March 2017 (@ 1.3% assessment rate) X 12 2 $ 2,242,556
Less: FY 2017-2018 Revenue Required $ 2,368,394
FY 2017-2018 Projected Revenue Overage/(Shortage) $ (125,838)
FY 2017-2018 Projected Assessment Rate
FY 2017-2018 Revenue Requirement $ 2,368,394
(Divided by) /FY 2017-2018 Annualized (Gross-up) Assessment Intrastate Revenue for all Telephone Companies $ 172,504,287
FY 2017-2018 Approximate Assessment Rate Needed for Revenue Requirement 1.40%
Recommended Fund Assessment for FY 2017-2018 1.40%
1 Excludes elected cost-based
2 Includes forecasted historical annual revenue decline of 7.33%
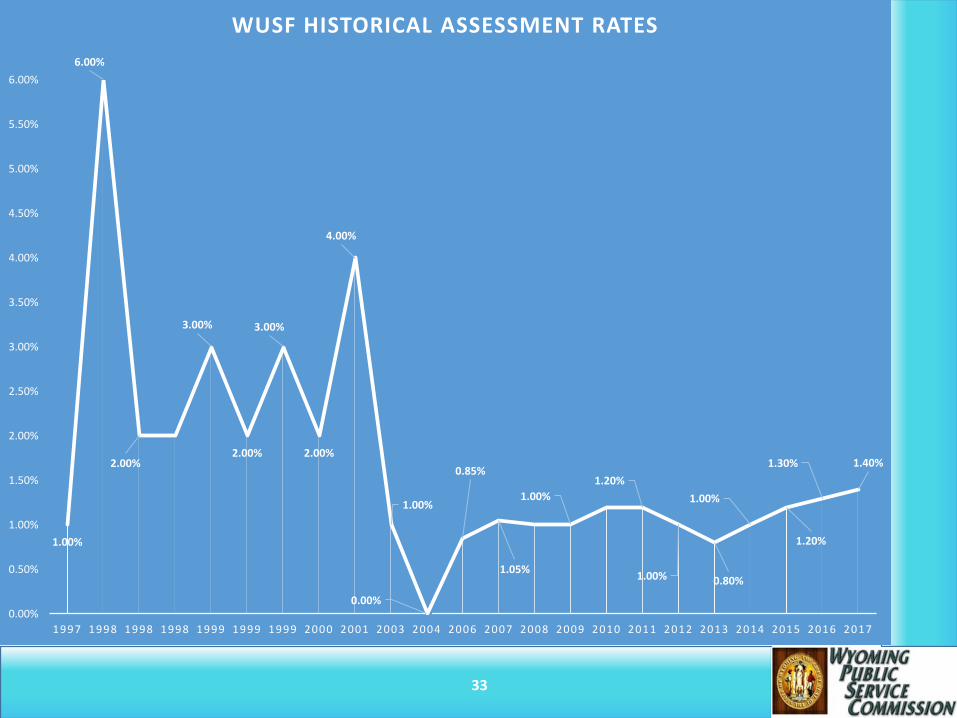
33
1.00%
6.00%
2.00%
3.00%
2.00%
3.00%
2.00%
4.00%
1.00%
0.00%
0.85%
1.05%
1.00%
1.20%
1.00% 0.80%
1.00%
1.20%
1.30% 1.40%
0.00%
0.50%
1.00%
1.50%
2.00%
2.50%
3.00%
3.50%
4.00%
4.50%
5.00%
5.50%
6.00%
1997 1998 1998 1998 1999 1999 1999 2000 2001 2003 2004 2006 2007 2008 2009 2010 2011 2012 2013 2014 2015 2016 2017
WUSF HISTORICAL ASSESSMENT RATES
34
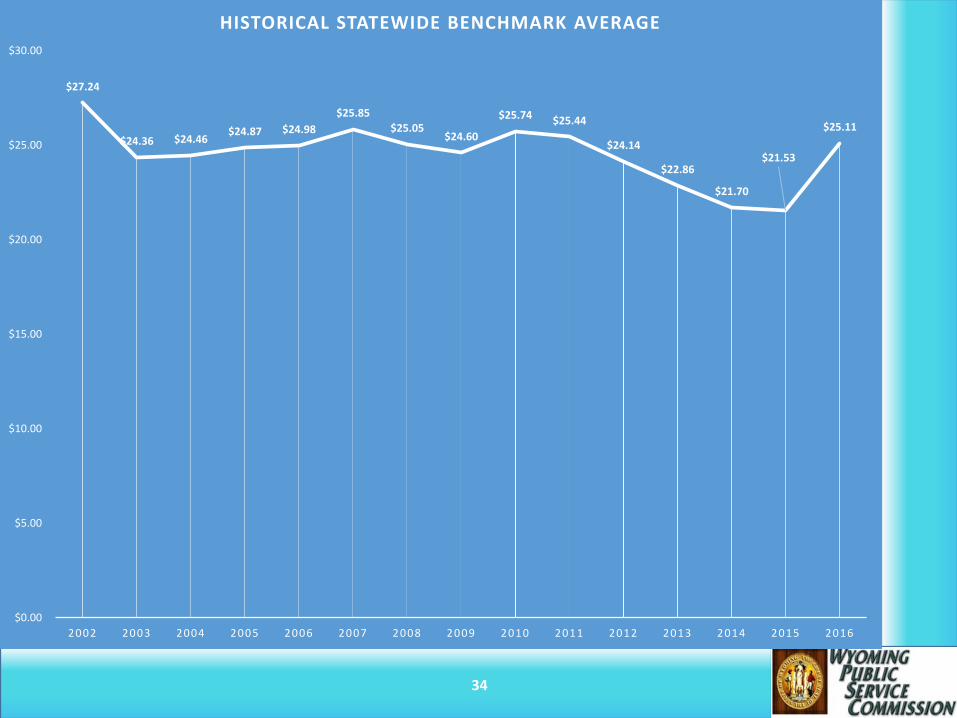
$27.24
$24.36 $24.46 $24.87 $24.98
$25.85
$25.05 $24.60
$25.74 $25.44
$24.14
$22.86
$21.70
$21.53
$25.11
$0.00
$5.00
$10.00
$15.00
$20.00
$25.00
$30.00
2002 2003 2004 2005 2006 2007 2008 2009 2010 2011 2012 2013 2014 2015 2016
HISTORICAL STATEWIDE BENCHMARK AVERAGE
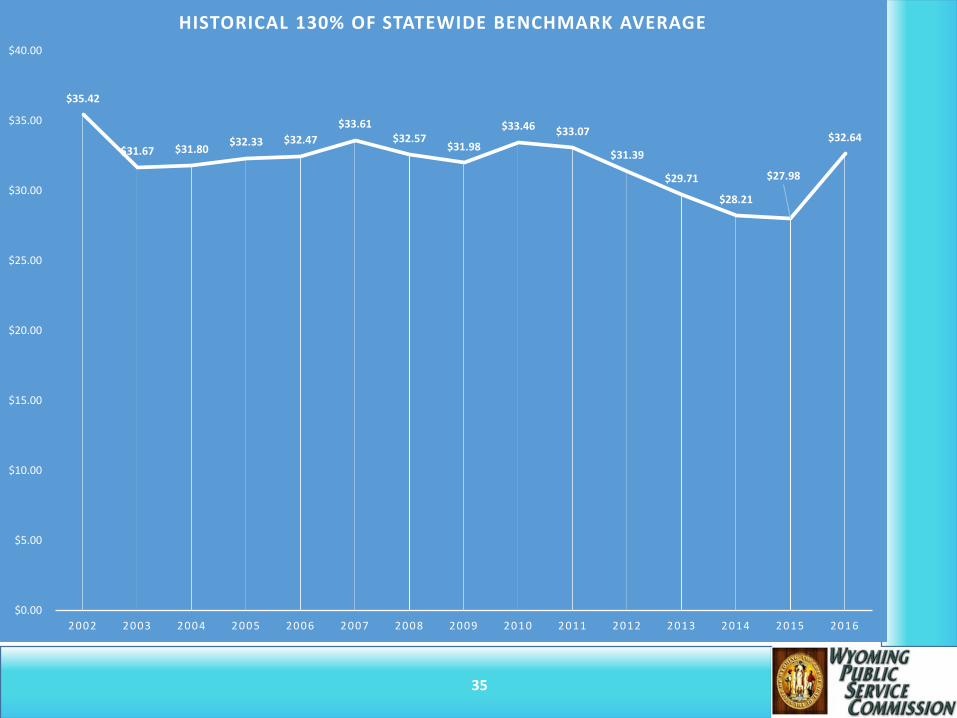
35
$35.42
$31.67 $31.80 $32.33 $32.47
$33.61 $32.57
$31.98
$33.46 $33.07
$31.39
$29.71
$28.21
$27.98
$32.64
$0.00
$5.00
$10.00
$15.00
$20.00
$25.00
$30.00
$35.00
$40.00
2002 2003 2004 2005 2006 2007 2008 2009 2010 2011 2012 2013 2014 2015 2016
HISTORICAL 130% OF STATEWIDE BENCHMARK AVERAGE
36
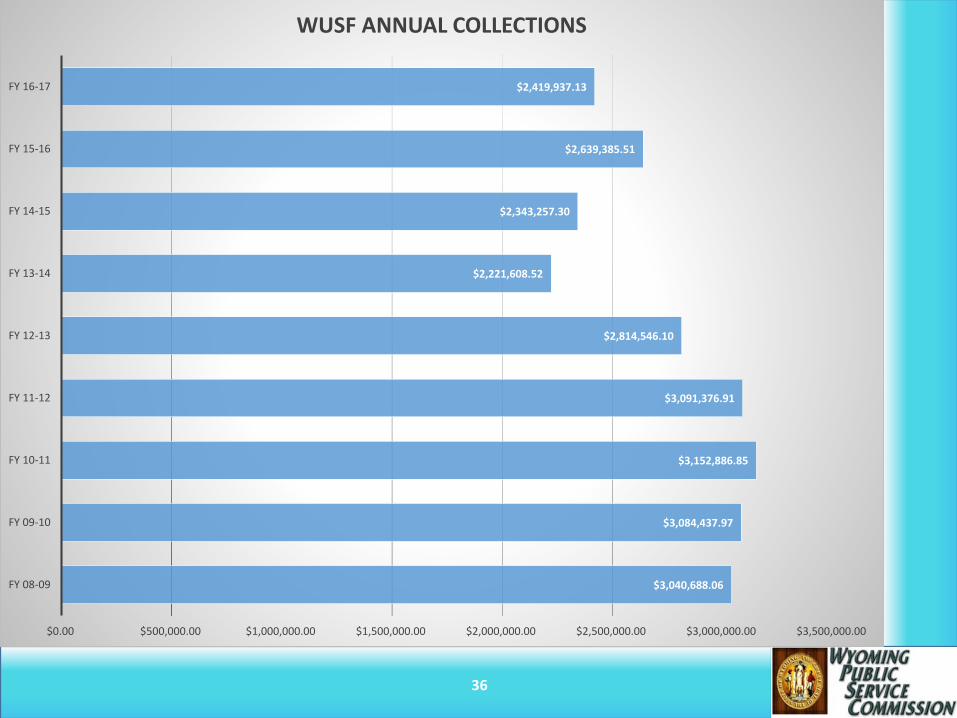
$3,040,688.06
$3,084,437.97
$3,152,886.85
$3,091,376.91
$2,814,546.10
$2,221,608.52
$2,343,257.30
$2,639,385.51
$2,419,937.13
$0.00 $500,000.00 $1,000,000.00 $1,500,000.00 $2,000,000.00 $2,500,000.00 $3,000,000.00 $3,500,000.00
FY 08-09
FY 09-10
FY 10-11
FY 11-12
FY 12-13
FY 13-14
FY 14-15
FY 15-16
FY 16-17
WUSF ANNUAL COLLECTIONS
37
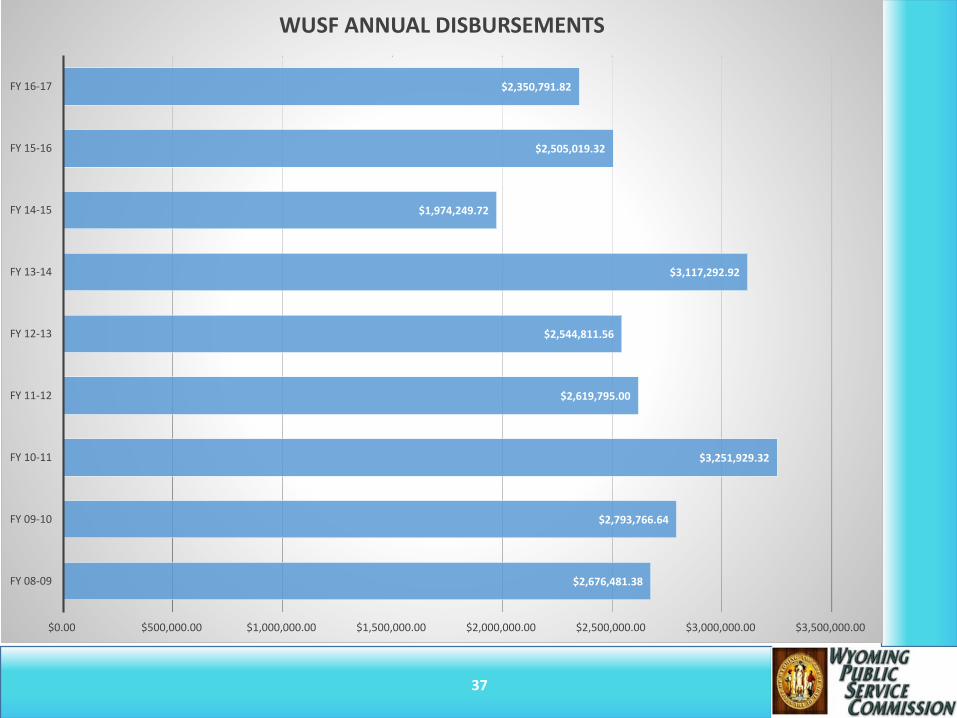
$2,676,481.38
$2,793,766.64
$3,251,929.32
$2,619,795.00
$2,544,811.56
$3,117,292.92
$1,974,249.72
$2,505,019.32
$2,350,791.82
$0.00 $500,000.00 $1,000,000.00 $1,500,000.00 $2,000,000.00 $2,500,000.00 $3,000,000.00 $3,500,000.00
FY 08-09
FY 09-10
FY 10-11
FY 11-12
FY 12-13
FY 13-14
FY 14-15
FY 15-16
FY 16-17
WUSF ANNUAL DISBURSEMENTS
38
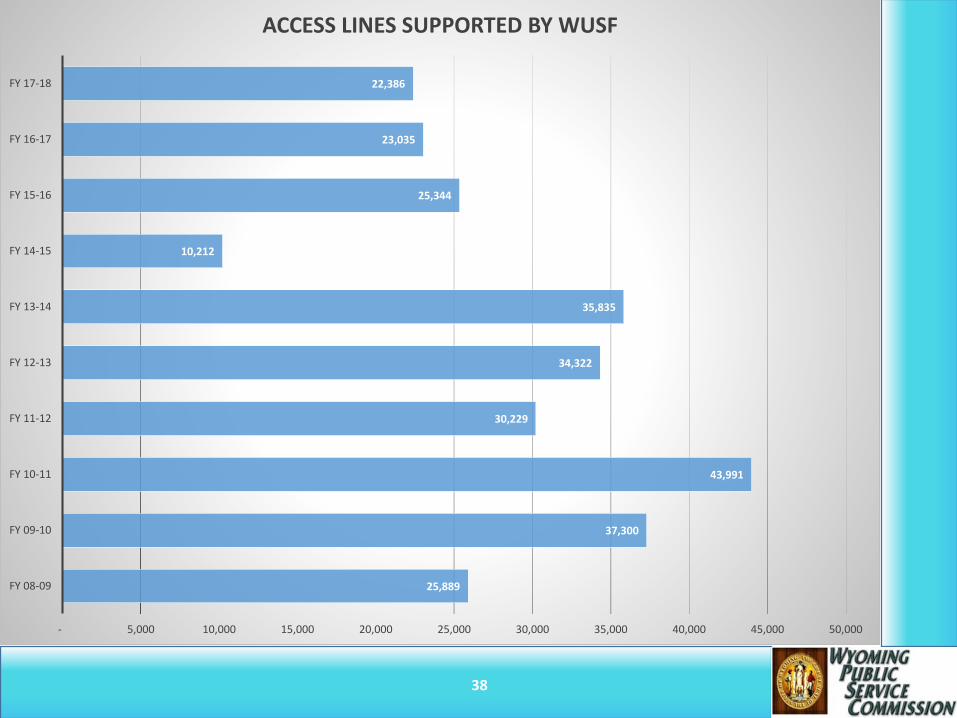
25,889
37,300
43,991
30,229
34,322
35,835
10,212
25,344
23,035
22,386
- 5,000 10,000 15,000 20,000 25,000 30,000 35,000 40,000 45,000 50,000
FY 08-09
FY 09-10
FY 10-11
FY 11-12
FY 12-13
FY 13-14
FY 14-15
FY 15-16
FY 16-17
FY 17-18
ACCESS LINES SUPPORTED BY WUSF
39
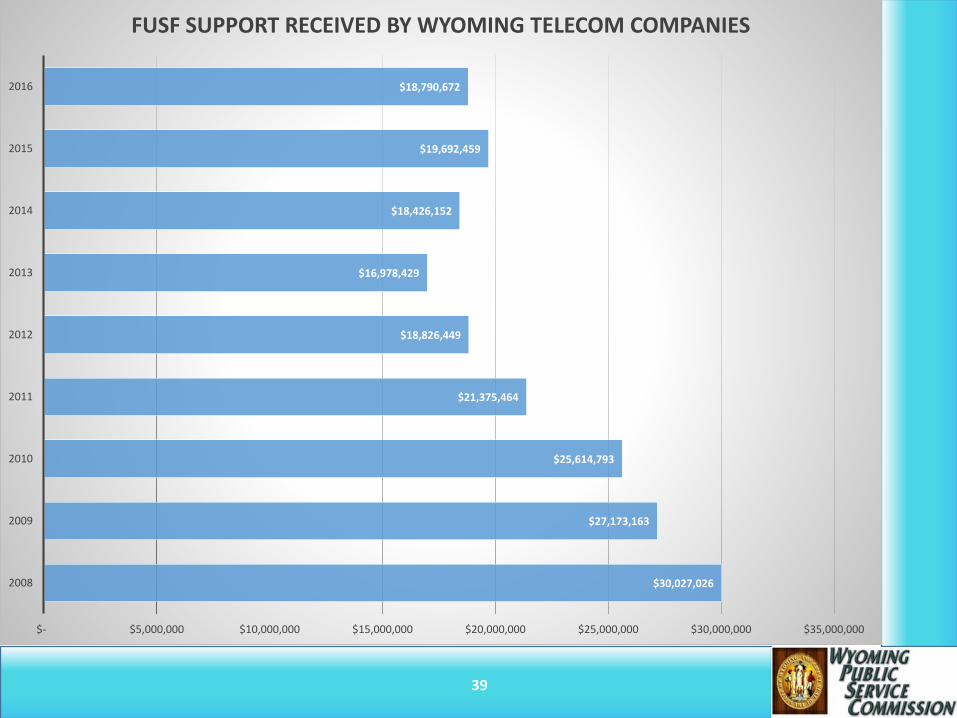
$30,027,026
$27,173,163
$25,614,793
$21,375,464
$18,826,449
$16,978,429
$18,426,152
$19,692,459
$18,790,672
$- $5,000,000 $10,000,000 $15,000,000 $20,000,000 $25,000,000 $30,000,000 $35,000,000
2008
2009
2010
2011
2012
2013
2014
2015
2016
FUSF SUPPORT RECEIVED BY WYOMING TELECOM COMPANIES
40
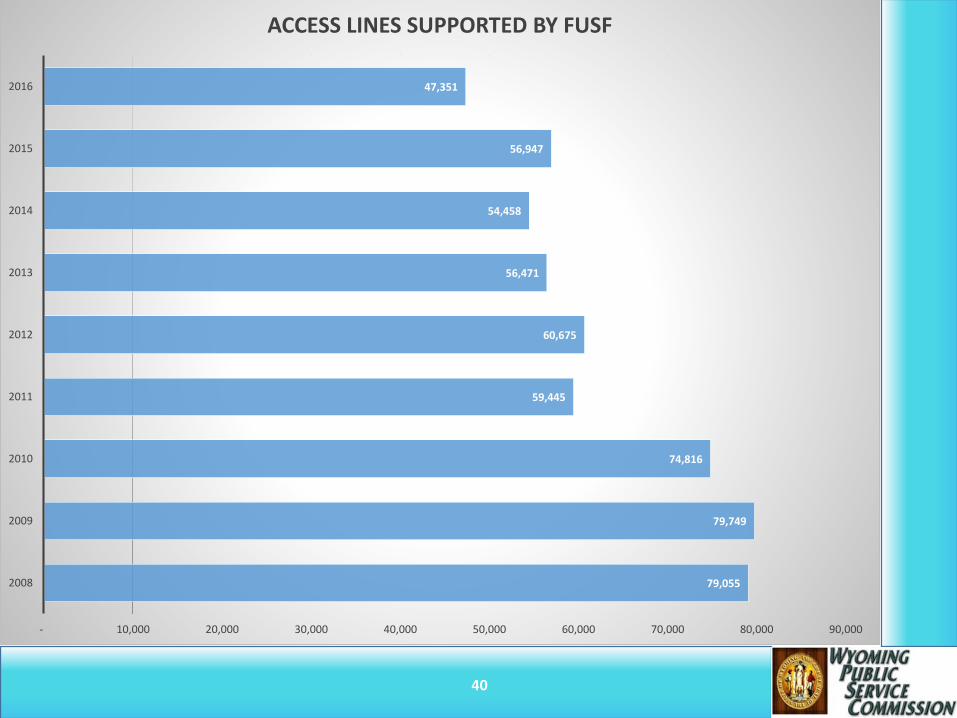
79,055
79,749
74,816
59,445
60,675
56,471
54,458
56,947
47,351
- 10,000 20,000 30,000 40,000 50,000 60,000 70,000 80,000 90,000
2008
2009
2010
2011
2012
2013
2014
2015
2016
ACCESS LINES SUPPORTED BY FUSF

41
QWEST
Un-credited
FUSF
42
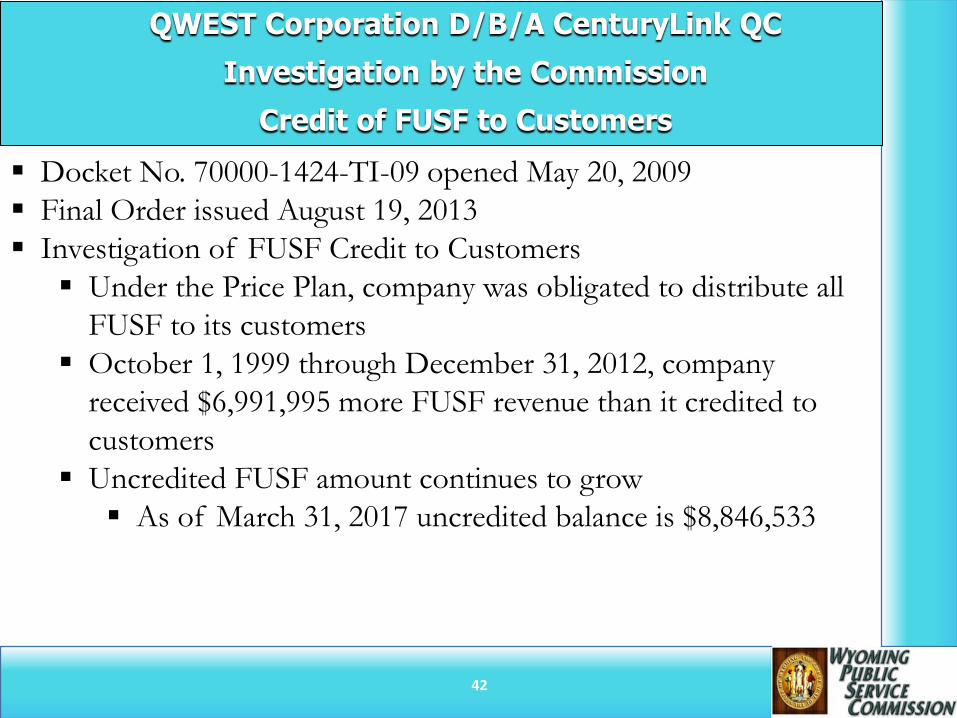
QWEST Corporation D/B/A CenturyLink QC
Investigation by the Commission
Credit of FUSF to Customers
Docket No. 70000-1424-TI-09 opened May 20, 2009
Final Order issued August 19, 2013
Investigation of FUSF Credit to Customers
Under the Price Plan, company was obligated to distribute all
FUSF to its customers
October 1, 1999 through December 31, 2012, company
received $6,991,995 more FUSF revenue than it credited to
customers
Uncredited FUSF amount continues to grow
As of March 31, 2017 uncredited balance is $8,846,533
43
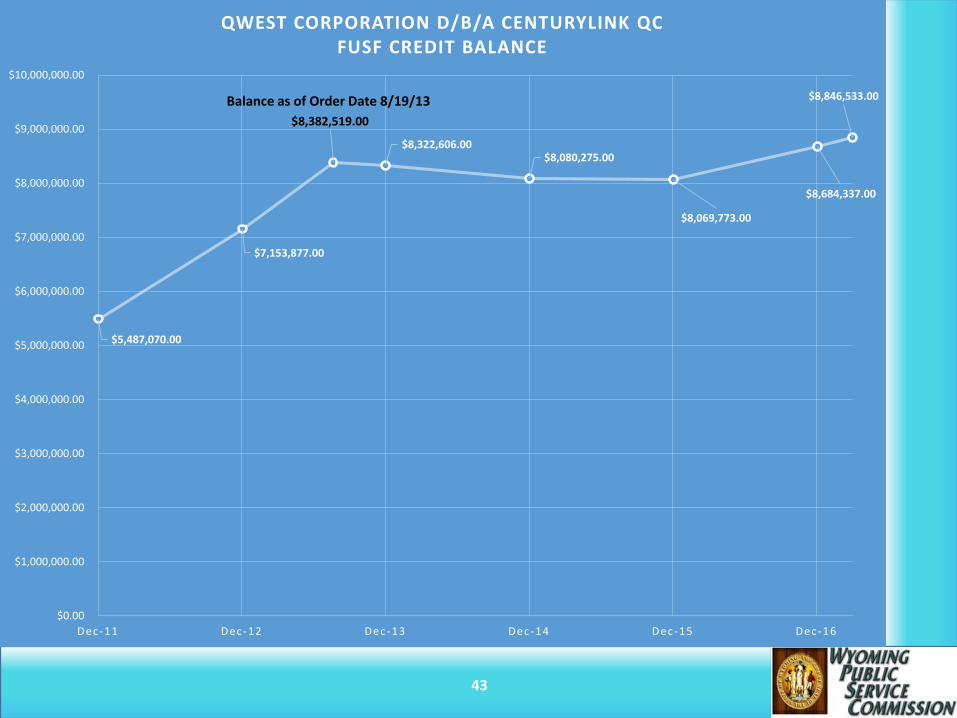
$5,487,070.00
$7,153,877.00
$8,382,519.00
$8,322,606.00 $8,080,275.00
$8,069,773.00
$8,684,337.00
$8,846,533.00
$0.00
$1,000,000.00
$2,000,000.00
$3,000,000.00
$4,000,000.00
$5,000,000.00
$6,000,000.00
$7,000,000.00
$8,000,000.00
$9,000,000.00
$10,000,000.00
Dec-11 Dec-12 Dec-13 Dec-14 Dec-15 Dec-16
QWEST CORPORATION D/B/A CENTURYLINK QCFUSF CREDIT BALANCE
Balance as of Order Date 8/19/13
44
QWEST
Quality of
Service
Investigations
45
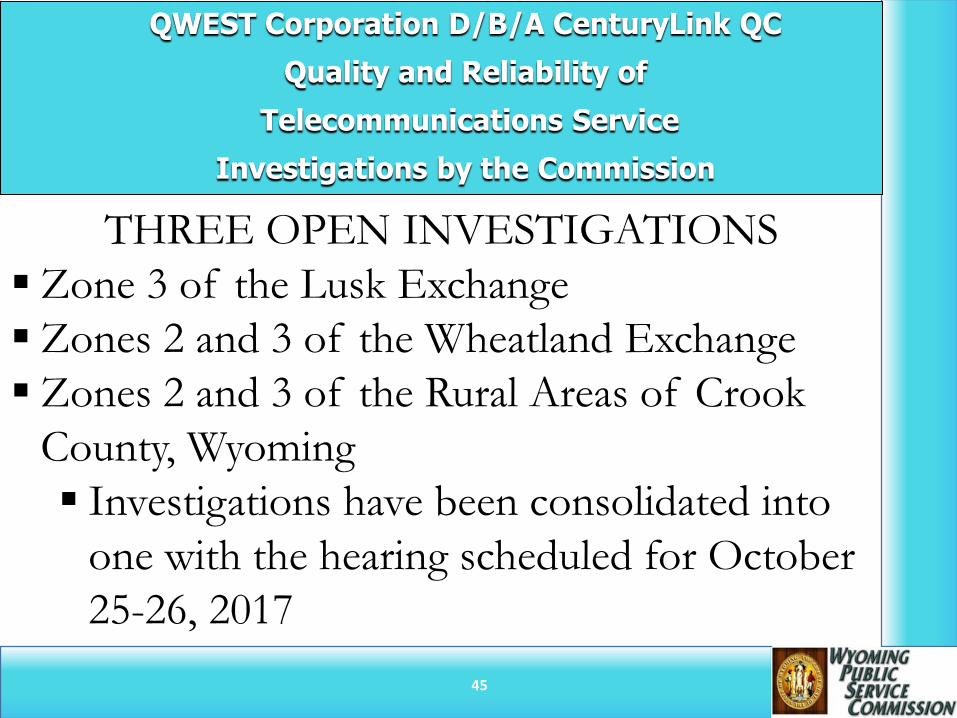
QWEST Corporation D/B/A CenturyLink QC
Quality and Reliability of
Telecommunications Service
Investigations by the Commission
THREE OPEN INVESTIGATIONS
Zone 3 of the Lusk Exchange
Zones 2 and 3 of the Wheatland Exchange
Zones 2 and 3 of the Rural Areas of Crook
County, Wyoming
Investigations have been consolidated into
one with the hearing scheduled for October
25-26, 2017
46
Utility
Complaint
Comparison
47
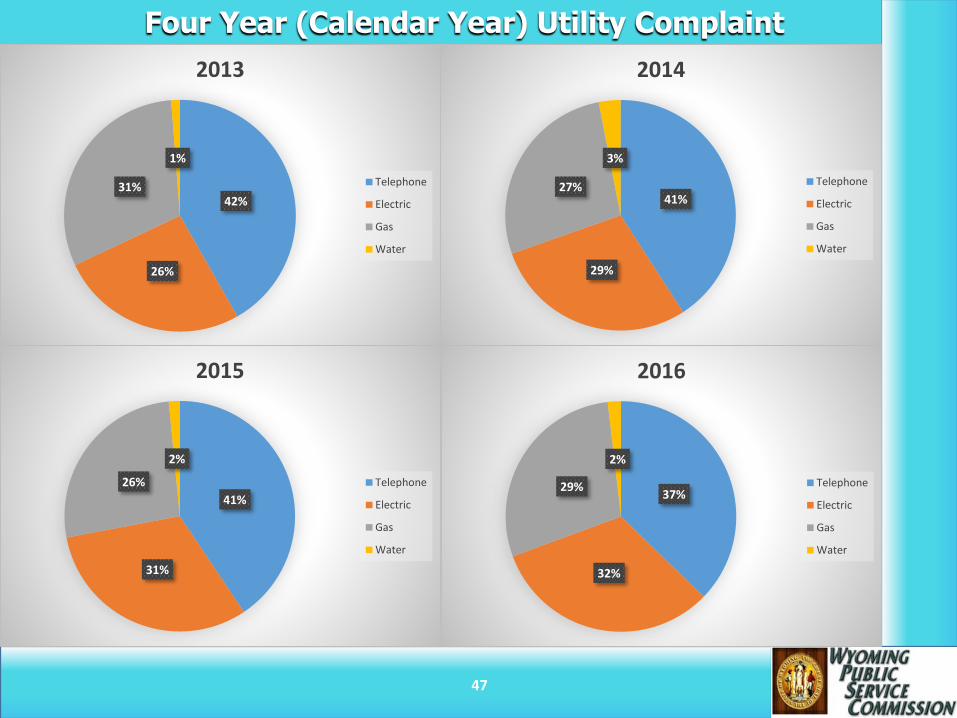
Four Year (Calendar Year) Utility Complaint
Comparison
42%
26%
31%
1%
2013
Telephone
Electric
Gas
Water
41%
29%
27%
3%
2014
Telephone
Electric
Gas
Water
41%
31%
26%
2%
2015
Telephone
Electric
Gas
Water
37%
32%
29%
2%
2016
Telephone
Electric
Gas
Water
Electricity Rates
48
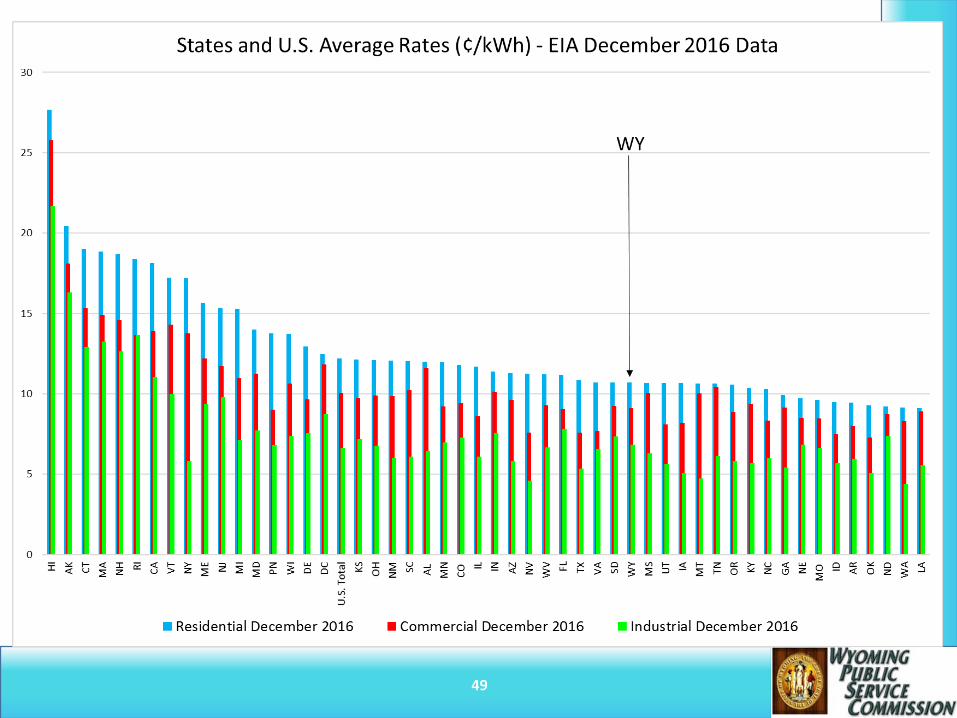
49
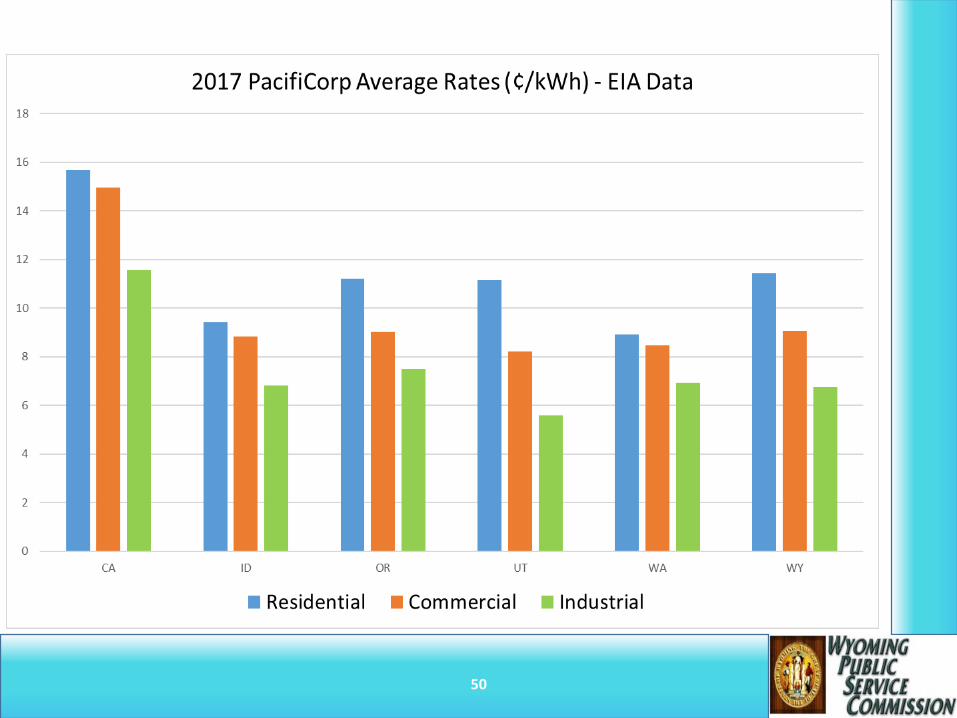
50
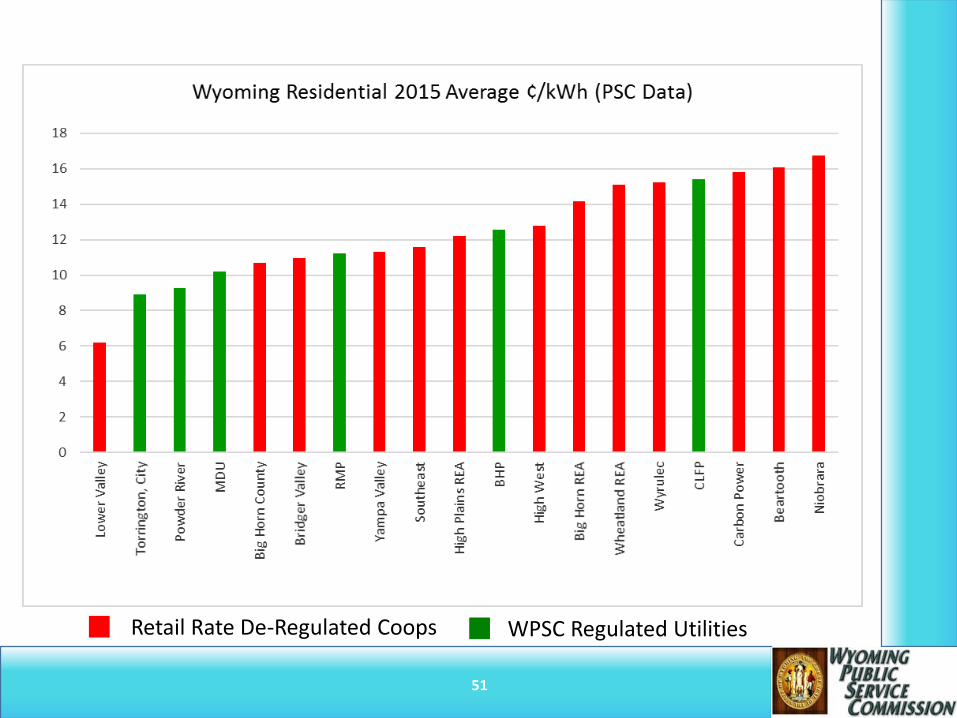
51
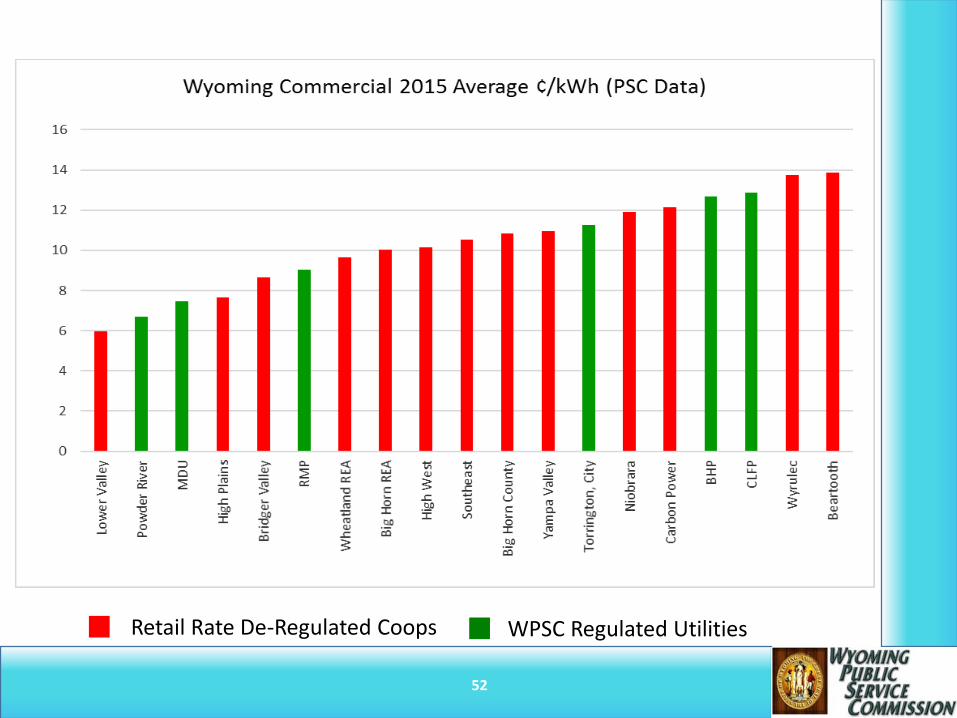
Retail Rate De-Regulated Coops WPSC Regulated Utilities
52
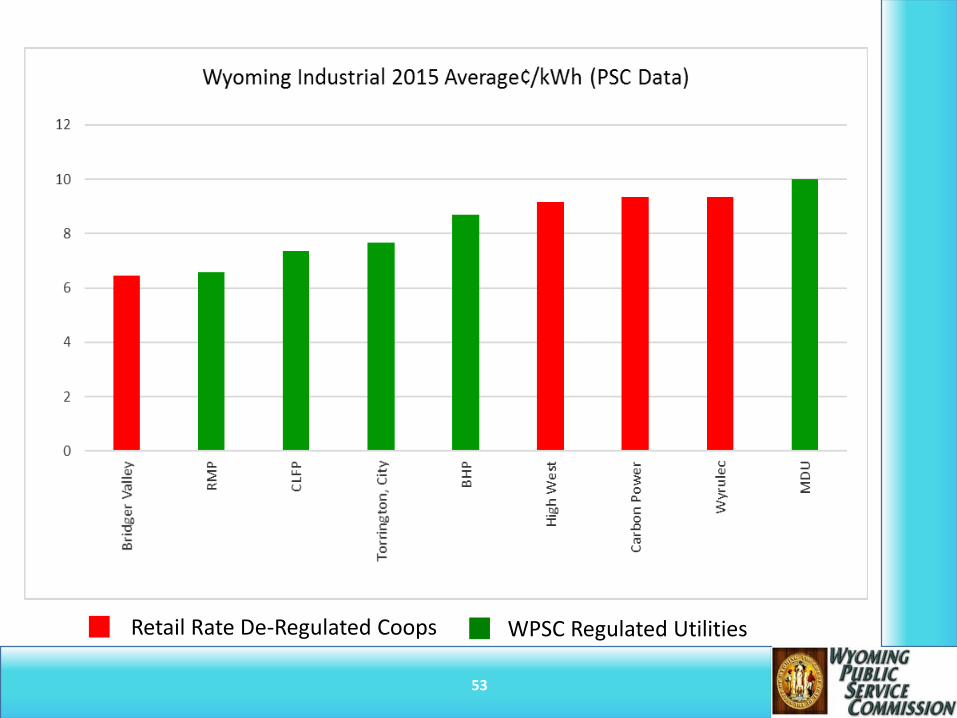
Retail Rate De-Regulated Coops WPSC Regulated Utilities
53
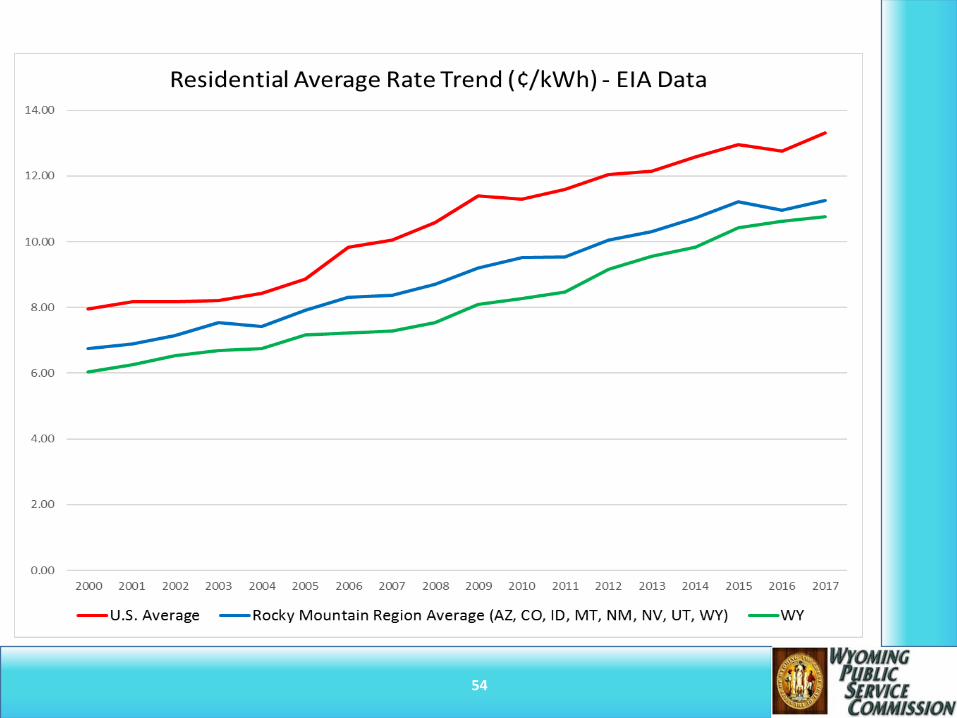
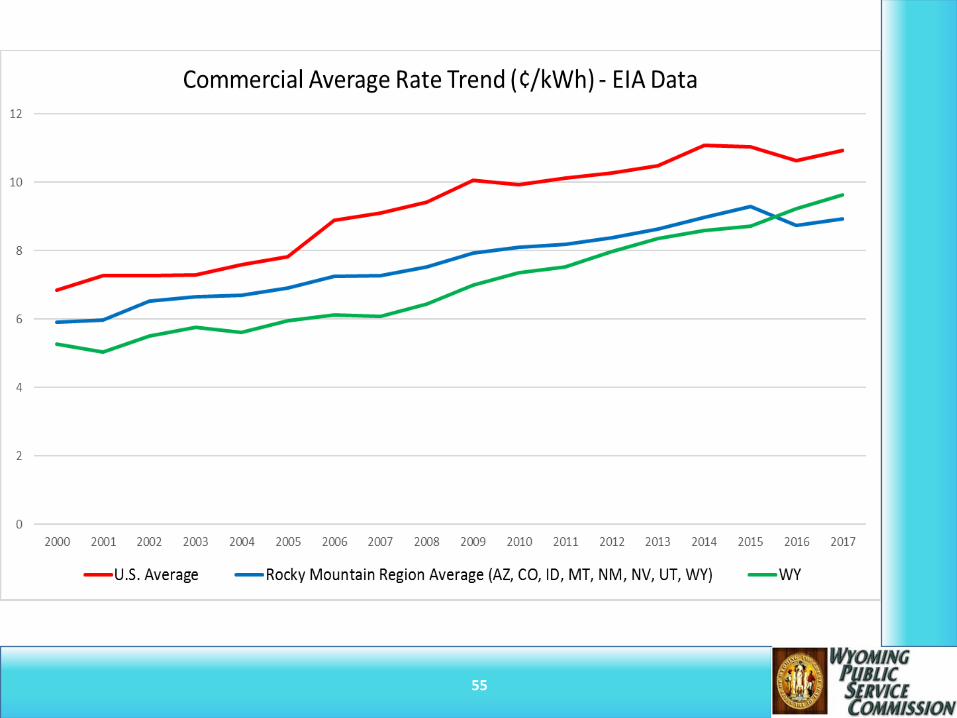
Retail Rate De-Regulated Coops WPSC Regulated Utilities
54
55
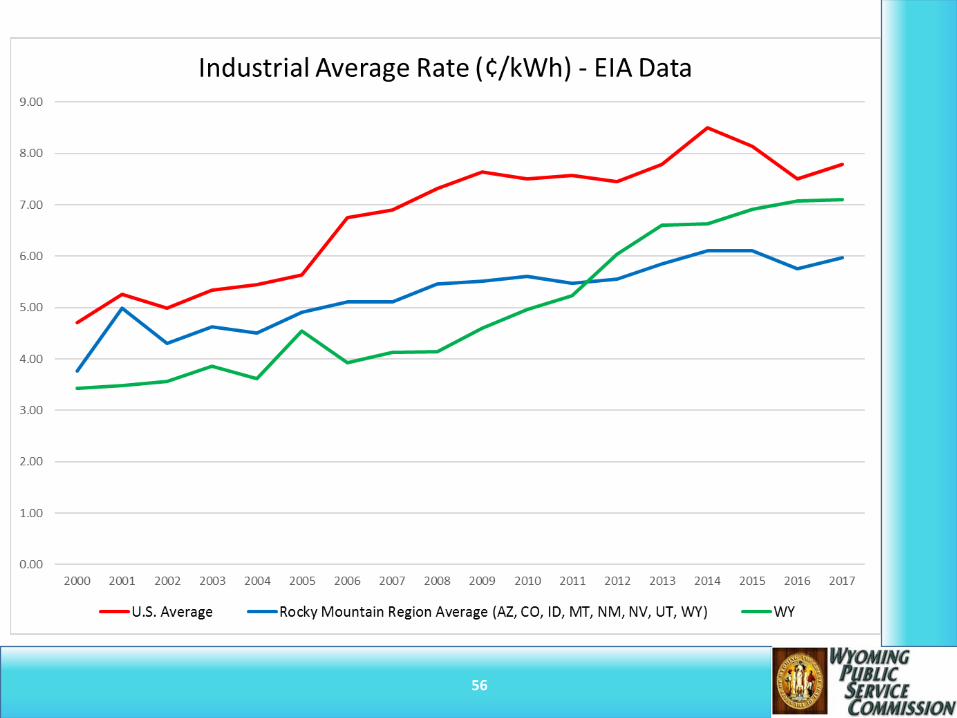
56
PacifiCorp/RMP Interstate Allocation Protocol
57
CAISO Update
58

PURPA
59
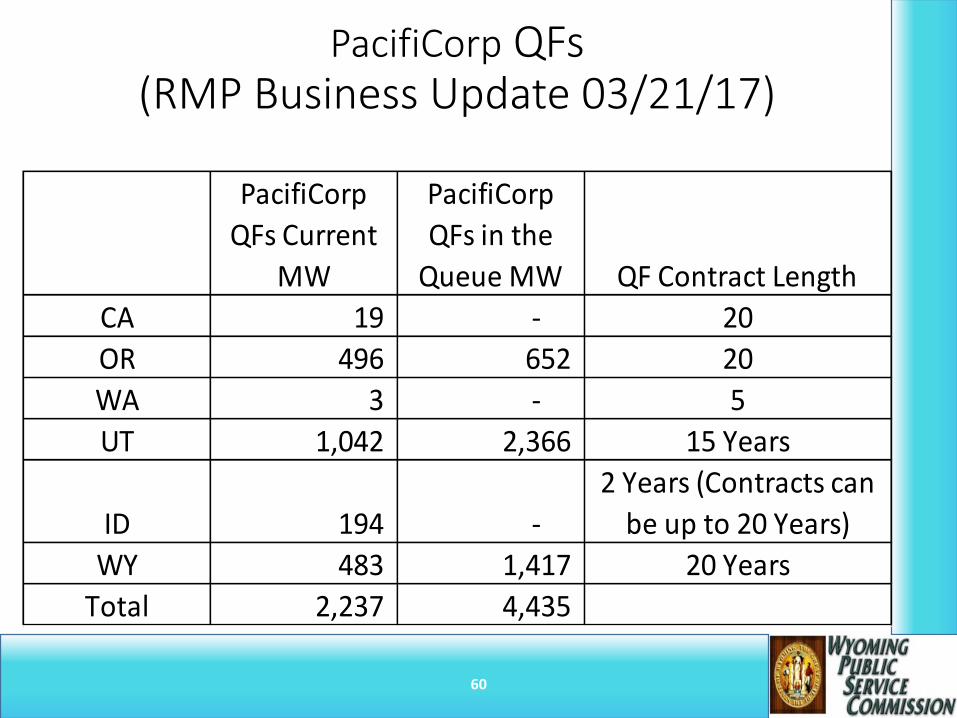
PacifiCorp QFs (RMP Business Update 03/21/17)
PacifiCorp
QFs Current
MW
PacifiCorp
QFs in the
Queue MW QF Contract Length
CA 19 - 20
OR 496 652 20
WA 3 - 5
UT 1,042 2,366 15 Years
ID 194 -
2 Years (Contracts can
be up to 20 Years)
WY 483 1,417 20 Years
Total 2,237 4,435
60
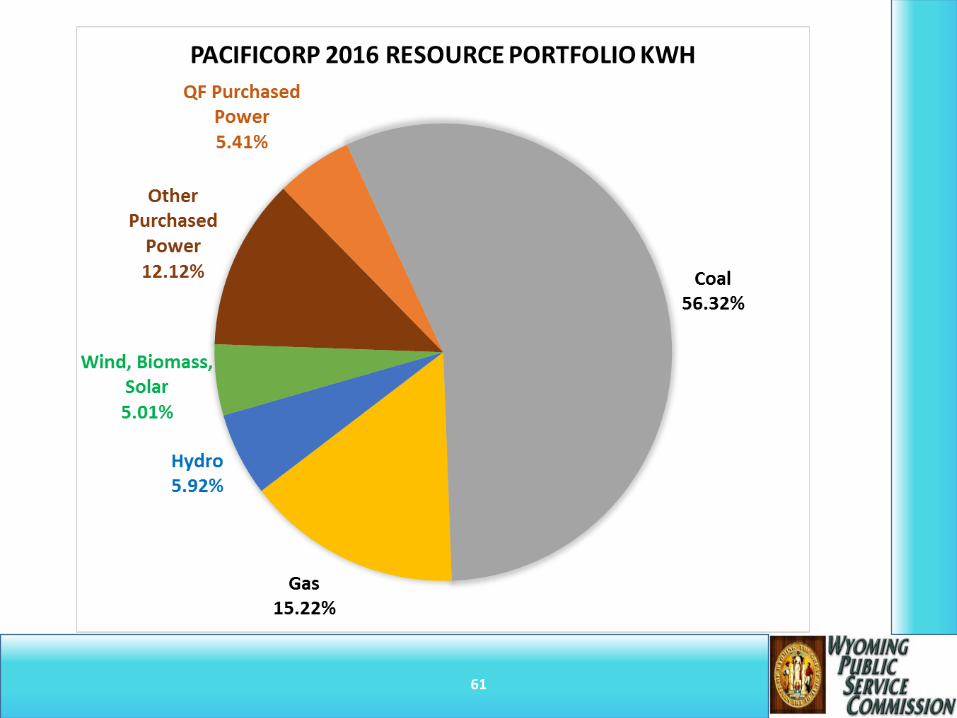
61
QF Effect on WY Rates• State commissions set the avoided cost prices for
purchase power agreements under PURPA.
• For PacifiCorp/Rocky Mountain Power, the 2017 Protocol assigns the costs associated with qualifying facility contracts on a system basis. However, if a portion of the cost of the QF exceeds the costs the Company would have otherwise incurred to acquire a comparable resource, the portion of the cost that exceeds the comparable resource is assigned on a situs basis to the jurisdiction that approved the contract.
• QFs were 5.41% of the total PacifiCorp/Rocky Mountain Power Portfolio MWh in 2016.
62
Renewable Portfolio
Standards
63
Renewable Portfolio Standard (RPS) Effect on Wyoming Rates
• In the case of PacifiCorp/RMP, the utility pursues least cost, least risk compliance alternatives in its IRP planning process and resources procured through RFP.
• The 2017 Protocol includes: Jurisdiction-Specific Initiatives, which states that costs and benefits associated with Resources acquired in accordance with a Jurisdiction-specific initiative will be assigned on a situs basis to the Jurisdiction adopting the initiative. This includes, but is not limited to, the costs and benefits of incentive programs, net-metering tariffs, feed-in tariffs, capacity standard programs, solar subscription programs, electric vehicle programs, and the acquisition of renewable energy certificates (RECs can be utilized as part of meeting an RPS objective).
• When a utility requests to include any resource in Wyoming rates, the costs and prudence are scrutinized by the Commission.
64
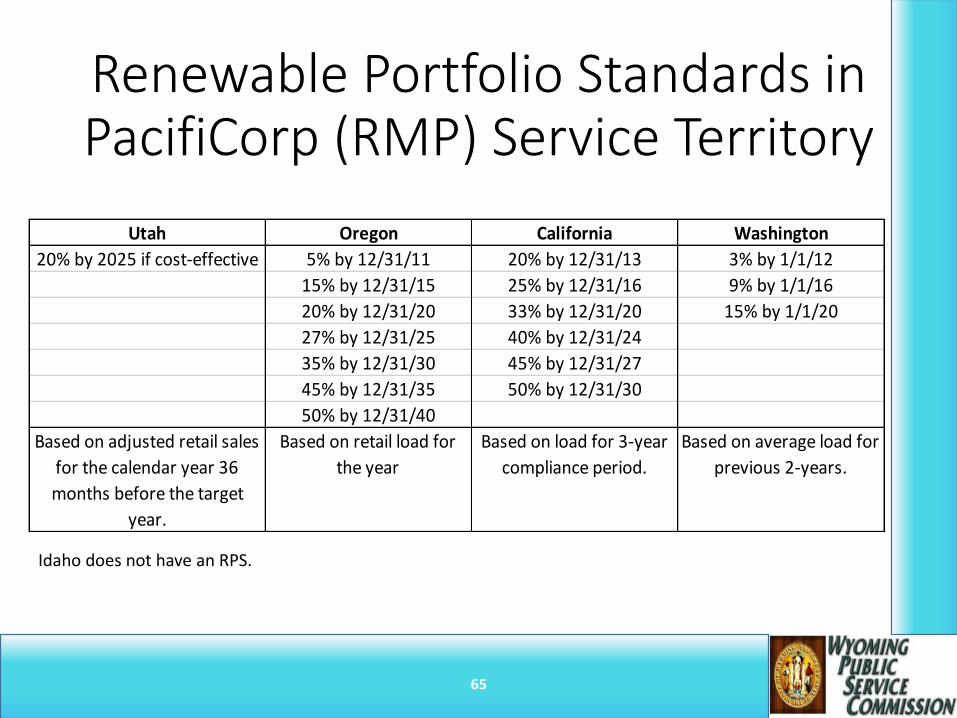
Renewable Portfolio Standards in PacifiCorp (RMP) Service Territory
Utah Oregon California Washington
20% by 2025 if cost-effective 5% by 12/31/11 20% by 12/31/13 3% by 1/1/12
15% by 12/31/15 25% by 12/31/16 9% by 1/1/16
20% by 12/31/20 33% by 12/31/20 15% by 1/1/20
27% by 12/31/25 40% by 12/31/24
35% by 12/31/30 45% by 12/31/27
45% by 12/31/35 50% by 12/31/30
50% by 12/31/40
Based on adjusted retail sales
for the calendar year 36
months before the target
year.
Based on retail load for
the year
Based on load for 3-year
compliance period.
Based on average load for
previous 2-years.
65
Idaho does not have an RPS.
Thank you
Please do not hesitate to contact us with additional questions at 777-7427.
• Bill Russell, Chairman• Kara Brighton Fornstrom, Deputy Chair• Robin Sessions Cooley, Commissioner
66