Embed Size (px)
Citation preview

CIS
Industrial Associates M
eeting, May 12-13, 2003
MCSL
Colorimetric CharacterizationModels for LCD and DLPTM
Projectors
David R. Wyble [email protected]
Munsell Color Science LaboratoryChester F Carlson Center for Imaging Science
Rochester Institute of Technology54 Lomb Memorial Drive
Rochester, NY 14623

CIS
Industrial Associates M
eeting, May 12-13, 2003
MCSLGoals for today
• Describe the differences and similarities of LCDand DLP projection technologies used in currentdata projectors
• Review various evaluation metrics and techniquesto compare projectors
• Propose a new characterization model for DLPprojectors

CIS
Industrial Associates M
eeting, May 12-13, 2003
MCSL
Technologies

CIS
Industrial Associates M
eeting, May 12-13, 2003
MCSLLCD System

CIS
Industrial Associates M
eeting, May 12-13, 2003
MCSLLCD Device
The LCD device operates using a change in thepolarity of the light.

CIS
Industrial Associates M
eeting, May 12-13, 2003
MCSLDLP System

CIS
Industrial Associates M
eeting, May 12-13, 2003
MCSLDLP Device

CIS
Industrial Associates M
eeting, May 12-13, 2003
MCSL
Metrics

CIS
Industrial Associates M
eeting, May 12-13, 2003
MCSLBrightness Uniformity
center
corners
inner

CIS
Industrial Associates M
eeting, May 12-13, 2003
MCSLBrightness Uniformity
50%
60%
70%
80%
90%
100%
LCDDLP
corner
inner
center = 100%

CIS
Industrial Associates M
eeting, May 12-13, 2003
MCSLImage Quality
LCD DLP

CIS
Industrial Associates M
eeting, May 12-13, 2003
MCSLLCD vs DLP Differences
• Number of color channels:
o LCD uses RGB
o DLP uses RGBW
• LCD tend to be more uniform in brightness
• DLP tend to have sharper images

CIS
Industrial Associates M
eeting, May 12-13, 2003
MCSLLCD vs DLP Similarities
• Resolution
• Color gamut
• Optics (zoom, etc)
The range of values for these specifications aresimilar among LCD and DLP projectors.

CIS
Industrial Associates M
eeting, May 12-13, 2003
MCSLEvaluation Wrap-up
• There are several factors you should evaluate
o Cost (including bulb replacement)
o Brightness and image size
o Resolution
o Image quality
o Size and weight
• Specifications are great, but for each you should askyourself these questions
o “Is good enough for my needs?”
• Lastly, always ask “Do I like the image?”

CIS
Industrial Associates M
eeting, May 12-13, 2003
MCSL
Characterization Models

CIS
Industrial Associates M
eeting, May 12-13, 2003
MCSLProjector Characterization Overview
Projector Characterization
or
How can I make the projector display thecolor I choose?

CIS
Industrial Associates M
eeting, May 12-13, 2003
MCSLProjector Characterization Overview
• Users’ desire a particular color
• Projector accept only RBG (“device dependentcolor”)
• RGB does not correspond well to colors people see
• Critical for some issues (eg: logos, marketing)
• Nearly irrelevant for some issues (eg: technicalpresentations)
• Models presented here are not spatial. We assumea uniform image.

CIS
Industrial Associates M
eeting, May 12-13, 2003
MCSLDevice Characterization Basics
• “Device coordinates” are what we send to theprojector, RGB
• Color coordinates correspond to what we see,XYZ(“device independent color”)
• If the color coordinates of two colors are equal,we will perceive those colors as a match*.
• The goal of these device models will be topredict the output color coordinates (XYZ) for agiven set of input device coordinates (RGB)

CIS
Industrial Associates M
eeting, May 12-13, 2003
MCSLDevice Characterization Basics
DeviceCoordinates
(RGB)
ForwardModel
ColorCoordinates
(XYZ)
Inverse Model
DeviceCoordinates
(RGB)
ColorCoordinates
(XYZ)

CIS
Industrial Associates M
eeting, May 12-13, 2003
MCSLDevice Characterization Basics
Inverse Model RGBXYZ
MeasuredXYZ
Project

CIS
Industrial Associates M
eeting, May 12-13, 2003
MCSLDevice Characterization Basics
0 255Digital count
digital count
colo
rco
ordi
nate
Linearized digital count
colo
rco
ordi
nate

CIS
Industrial Associates M
eeting, May 12-13, 2003
MCSLDevice Characterization Basics
digital count
colo
rco
ordi
nate
linearized digital count
colo
rco
ordn
ate
Lookuptable
†
XR XG XB
YR YG YB
ZR ZG ZB
È
Î
Í Í Í
˘
˚
˙ ˙ ˙
¢ R ¢ G ¢ B
È
Î
Í Í Í
˘
˚
˙ ˙ ˙
=
XYZ
È
Î
Í Í Í
˘
˚
˙ ˙ ˙

CIS
Industrial Associates M
eeting, May 12-13, 2003
MCSLLCD Characterization
†
XR XG XB
YR YG YB
ZR ZG ZB
È
Î
Í Í Í
˘
˚
˙ ˙ ˙
-
XYZ
È
Î
Í Í Í
˘
˚
˙ ˙ ˙
black
Ï
Ì Ô
Ó Ô
¸
˝ Ô
˛ Ô
¢ R ¢ G ¢ B
È
Î
Í Í Í
˘
˚
˙ ˙ ˙
+
XYZ
È
Î
Í Í Í
˘
˚
˙ ˙ ˙
black
=
XYZ
È
Î
Í Í Í
˘
˚
˙ ˙ ˙
BlackCorrected
Matrix
LinearInputRGBs
Add Black
PredictedColor

CIS
Industrial Associates M
eeting, May 12-13, 2003
MCSL
0.0
0.2
0.4
0.6
0.8
1.0
0 32 64 96 128 160 192 224 256
Digital Count
Co
lor
Co
ord
inat
e (n
orm
aliz
ed)
white Y
LCD Characterization
Look up table comes directly frommeasured data, normalized to unity.
†
R = 96¢ R = 0.2
CIS
Industrial Associates M
eeting, May 12-13, 2003
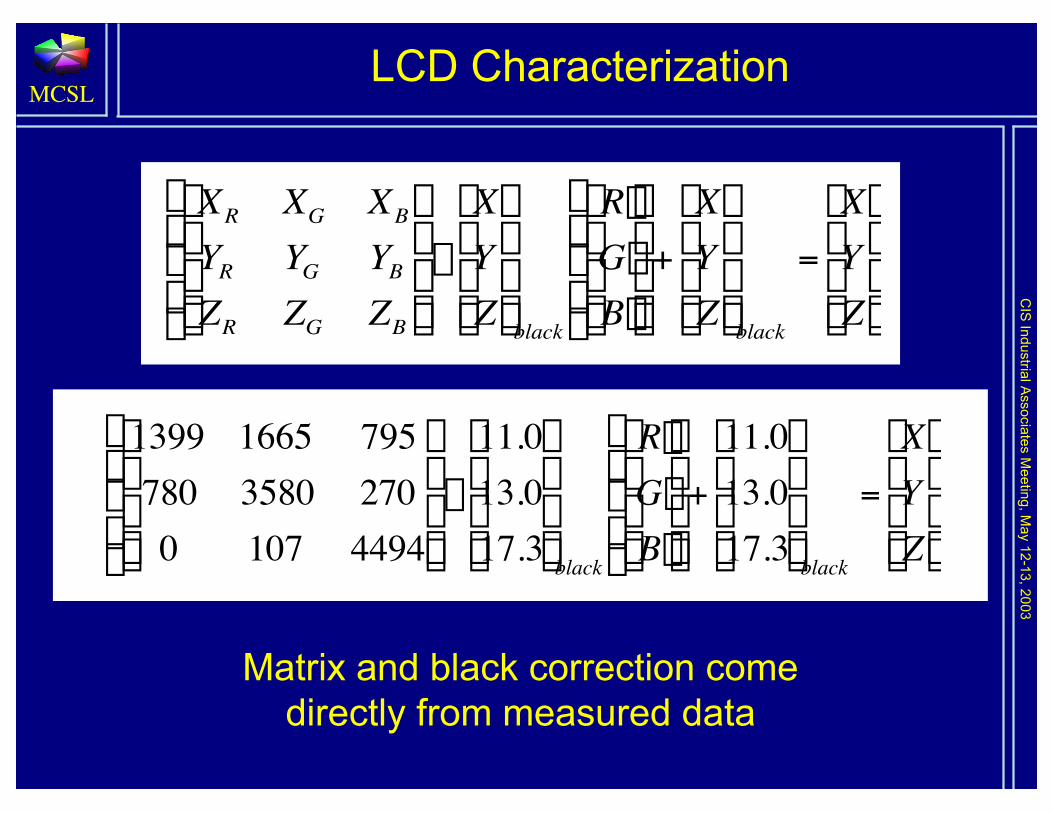
MCSLLCD Characterization
Matrix and black correction comedirectly from measured data†
1399 1665 795780 3580 2700 107 4494
È
Î
Í Í Í
˘
˚
˙ ˙ ˙
-
11.013.017.3
È
Î
Í Í Í
˘
˚
˙ ˙ ˙
black
Ï
Ì Ô
Ó Ô
¸
˝ Ô
˛ Ô
¢ R ¢ G ¢ B
È
Î
Í Í Í
˘
˚
˙ ˙ ˙
+
11.013.017.3
È
Î
Í Í Í
˘
˚
˙ ˙ ˙
black
=
XYZ
È
Î
Í Í Í
˘
˚
˙ ˙ ˙
†
XR XG XB
YR YG YB
ZR ZG ZB
È
Î
Í Í Í
˘
˚
˙ ˙ ˙
-
XYZ
È
Î
Í Í Í
˘
˚
˙ ˙ ˙
black
Ï
Ì Ô
Ó Ô
¸
˝ Ô
˛ Ô
¢ R ¢ G ¢ B
È
Î
Í Í Í
˘
˚
˙ ˙ ˙
+
XYZ
È
Î
Í Í Í
˘
˚
˙ ˙ ˙
black
=
XYZ
È
Î
Í Í Í
˘
˚
˙ ˙ ˙

CIS
Industrial Associates M
eeting, May 12-13, 2003
MCSLLCD Model Results (Verification data)
DE94 is an indication of how perceptuallyclose the measured and predicted XYZ are.
0
5
10
15
20
25
0 0.4 0.8 1.2 1.6 2Color Difference (DE94)
Co
un
t
0
20
40
60
80
100
Cu
mu
lati
ve %Avg=0.5

CIS
Industrial Associates M
eeting, May 12-13, 2003
MCSLDLP Characterization
RGB ramp data cannot account forall the signal in the white ramp.
0
200
400
600
800
1000
1200
1400
1600
0 32 64 96 128 160 192 224 256
digital count
Col
or C
oord
inat
eR+G+B XR+G+B YR+G+B ZWhite XWhite YWhite Z

CIS
Industrial Associates M
eeting, May 12-13, 2003
MCSLDLP Characterization
• Not as easy as the LCD
• We can measure the white ramp, but we know it ismore than just red, green, and blue.
• This violates our linearity assumption:
†
XR XG XB
YR YG YB
ZR ZG ZB
È
Î
Í Í Í
˘
˚
˙ ˙ ˙
¢ R ¢ G ¢ B
È
Î
Í Í Í
˘
˚
˙ ˙ ˙
†
XR XG XB XW
YR YG YB YW
ZR ZG ZB ZW
È
Î
Í Í Í
˘
˚
˙ ˙ ˙
¢ R ¢ G ¢ B ¢ W
È
Î
Í Í Í Í
˘
˚
˙ ˙ ˙ ˙

CIS
Industrial Associates M
eeting, May 12-13, 2003
MCSLDLP Characterization
†
¢ W = min(R,G,B)
There is a threshold, below which no white isadded. The threshold for our example DLPprojector is about 150 digital counts.
So, if:min(R,G,B)<150
W’=0, and there is no white added

CIS
Industrial Associates M
eeting, May 12-13, 2003
MCSLDLP Characterization
These are ramp data of fixed R and G, varying Bfrom 0 to 255. Plot shows data after subtracting
the given contribution from R and G.
0
0.2
0.4
0.6
0.8
1
0 32 64 96 128 160 192 224 256Digital Count
Norm
aliz
ed C
olo
r Coord
inat
e
R=G=255
R=225, G=190
R=255, G=225
thresholdWhat cannot beaccounted for byR=225, G=190
Min(R,G,B)
What cannot beaccounted for byR=255, G=225
Min(R,G,B)

CIS
Industrial Associates M
eeting, May 12-13, 2003
MCSLDLP Characterization
Look up tables for DLP model. White is“leftover” after subtracting RGB contribution.
0
0.1
0.2
0.3
0.4
0.5
0.6
0.7
0.8
0.9
1
0 32 64 96 128 160 192 224 256Digital Count
Co
lor
Co
ord
inat
e (N
orm
aliz
ed)
Red XGreen YBlue ZW-(R+G+B)

CIS
Industrial Associates M
eeting, May 12-13, 2003
MCSLDLP Characterization
†
XR XG XB XW
YR YG YB YW
ZR ZG ZB ZW
È
Î
Í Í Í
˘
˚
˙ ˙ ˙
¢ R ¢ G ¢ B ¢ W
È
Î
Í Í Í Í
˘
˚
˙ ˙ ˙ ˙
+
XYZ
È
Î
Í Í Í
˘
˚
˙ ˙ ˙
black
=
XYZ
È
Î
Í Í Í
˘
˚
˙ ˙ ˙
BlackCorrected
Matrix
LinearInputRGBs
Add Black
PredictedColor

CIS
Industrial Associates M
eeting, May 12-13, 2003
MCSL
The DLP verification data were nearly all in the high intensityareas where the white addition assumptions are stressed.
0
40
80
120
160
200
240
0 0.5 1 1.5 2 2.5 3 3.5
Color Difference (DE94)
Co
un
t
0
20
40
60
80
100
Cu
mu
lati
ve %
DLP Model Results (Verification data)
Avg=1.5

CIS
Industrial Associates M
eeting, May 12-13, 2003
MCSLModel Results Summary
LCD model results
DLP model results
05
1015202530354045
0 0.5 1 1.5 2 2.5 3 3.5
Color Difference (DE94)
Co
un
t
0
20
40
60
80
100
Cu
mu
lati
ve %
0
40
80
120
160
200
240
0 0.5 1 1.5 2 2.5 3 3.5
Color Difference (DE94)
Co
un
t
0
20
40
60
80
100
Cu
mu
lati
ve %

CIS
Industrial Associates M
eeting, May 12-13, 2003
MCSLModel Summary
• Both models use measured data only. Noparameter estimation. (Except interpolatingthe look up table)
• LCD model requires measurement of fullR,G,B and complete white ramp. For ourexample LCD projector, better results werefound using full ramp measurements.
• DLP requires measurement of all fourramps

CIS
Industrial Associates M
eeting, May 12-13, 2003
MCSLModel Summary
• Both are very simple to implement
• LCD model performs very well
• DLP model performs acceptably
• Both models are satisfactory, especiallyconsidering additional variables:
o projection screen
o ambient room conditions
o viewing angles

CIS
Industrial Associates M
eeting, May 12-13, 2003
MCSLFuture Work
• Uncover and correct systematic trendsin the DLP model error.
• Perform additional measurements andimplement the model for the remainingDLP projectors.
• Submitted to 2003 IS&T Color ImagingConference

CIS
Industrial Associates M
eeting, May 12-13, 2003
MCSLThanks
This work was supported by theMunsell Color Science Laboratory.
Special thanks to graduate studentHongqin (Cathy) Zhang