Embed Size (px)
Citation preview
www.sustainability.umd.eduwww.sustainability.umd.edu
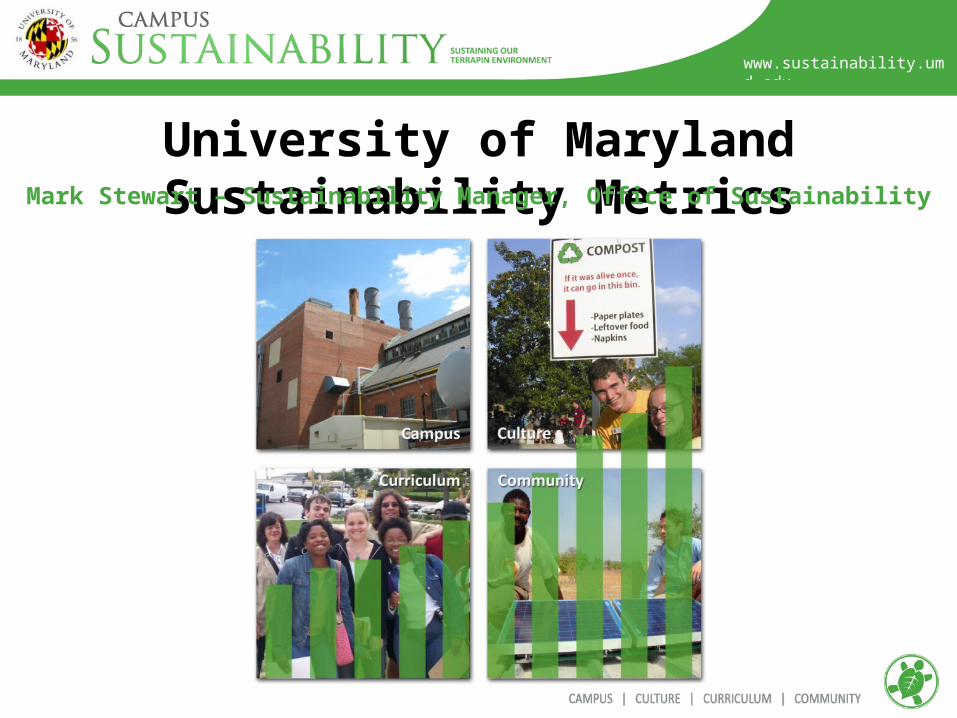
University of Maryland Sustainability MetricsMark Stewart – Sustainability Manager, Office of Sustainability

www.sustainability.umd.edu
The Process
Benchmarking• A student research team investigated institutional
and corporate sustainability metrics
Stakeholder Engagement• Office of Sustainability met with facilities managers and other stakeholders to
develop a comprehensive set of metrics
Support from Senior Administration• University Sustainability Council officially endorsed the metrics and is currently
working to set goals for each metric

www.sustainability.umd.edu
The UM Sustainability StrategyGreening the…
• CAMPUS – Developing a carbon-neutral and resource-efficient campus infrastructure
• CULTURE – Fostering an environment where students, faculty, staff, and visitors can practice sustainability through everyday behaviors
• CURRICULUM – Integrating sustainability across the curriculum and addressing sustainability challenges through research
• COMMUNITY – Engaging the broader community in sustainability through outreach and service
www.sustainability.umd.edu

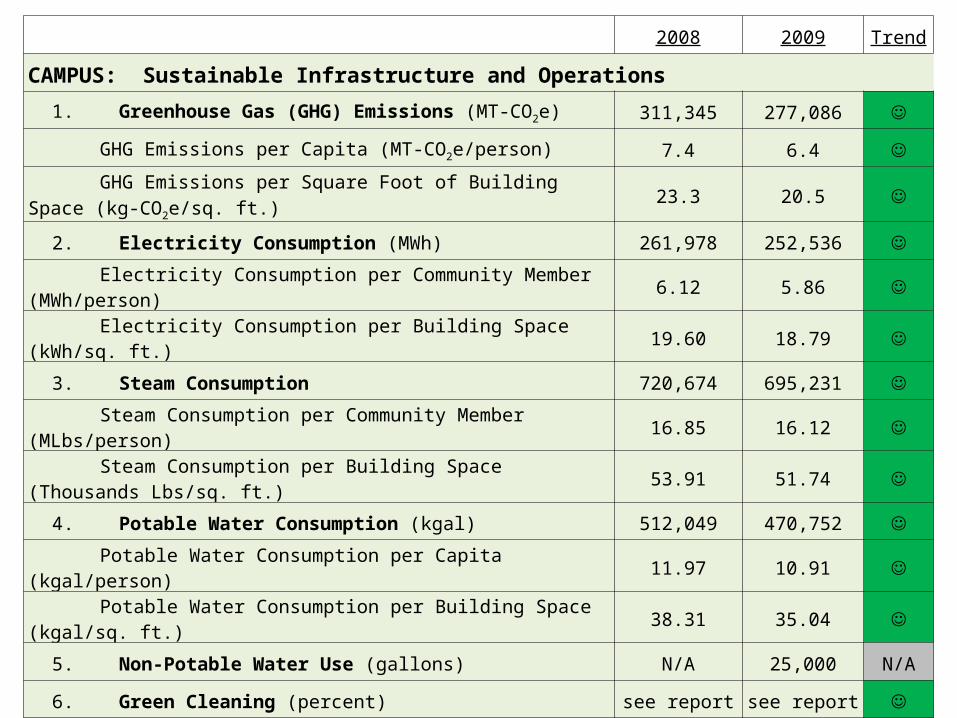
2008 2009 TrendCAMPUS: Sustainable Infrastructure and Operations
1. Greenhouse Gas (GHG) Emissions (MT-CO2e) 311,345 277,086 GHG Emissions per Capita (MT-CO2e/person) 7.4 6.4 GHG Emissions per Square Foot of Building Space (kg-CO2e/sq. ft.) 23.3 20.5
2. Electricity Consumption (MWh) 261,978 252,536 Electricity Consumption per Community Member (MWh/person) 6.12 5.86 Electricity Consumption per Building Space (kWh/sq. ft.) 19.60 18.79
3. Steam Consumption 720,674 695,231 Steam Consumption per Community Member (MLbs/person) 16.85 16.12 Steam Consumption per Building Space (Thousands Lbs/sq. ft.) 53.91 51.74
4. Potable Water Consumption (kgal) 512,049 470,752 Potable Water Consumption per Capita (kgal/person) 11.97 10.91 Potable Water Consumption per Building Space (kgal/sq. ft.) 38.31 35.04
5. Non-Potable Water Use (gallons) N/A 25,000 N/A6. Green Cleaning (percent) see report see report 7. Sustainable Food (percent) N/A 11 N/A8. Composted Food Waste (tons) 212 145
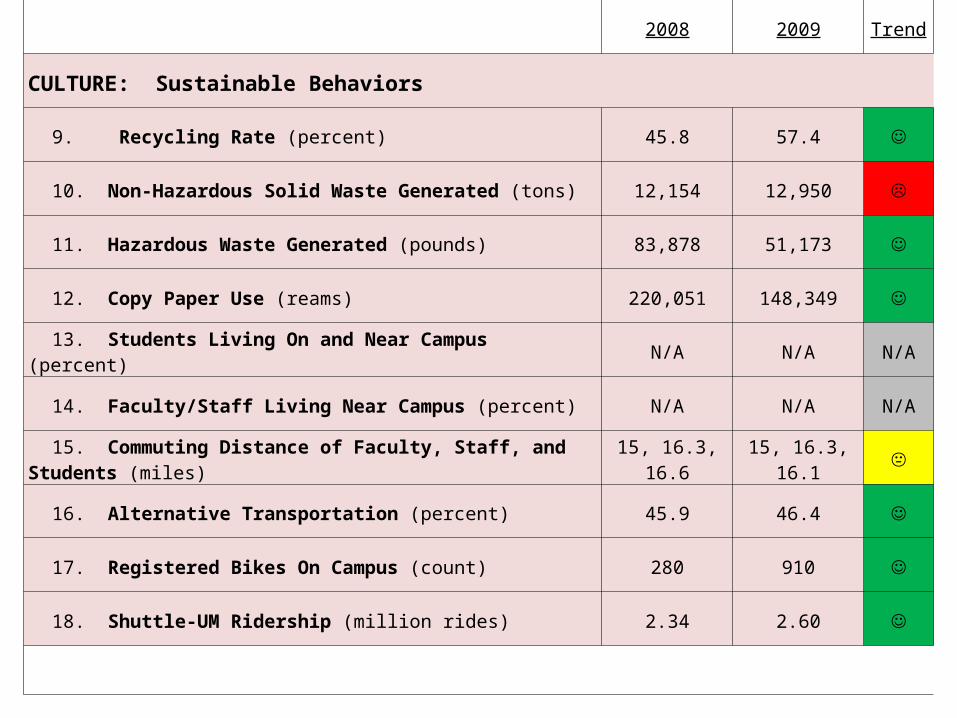
CULTURE: Sustainable Behaviors 9. Recycling Rate (percent) 45.8 57.4 10. Non-Hazardous Solid Waste Generated (tons) 12,154 12,950 11. Hazardous Waste Generated (pounds) 83,878 51,173 12. Copy Paper Use (reams) 220,051 148,349 13. Students Living On and Near Campus (percent) N/A N/A N/A14. Faculty/Staff Living Near Campus (percent) N/A N/A N/A15. Commuting Distance of Faculty, Staff, and Students (miles) 15, 16.3, 16.6 15, 16.3, 16.1 16. Alternative Transportation (percent) 45.9 46.4 17. Registered Bikes On Campus (count) 280 910 18. Shuttle-UM Ridership (million rides) 2.34 2.60
CURRICULUM: Sustainability Education (and Research) 19. Courses Revised to Include Sustainability (count) 0 33 20. First Year Sustainability Education (percent) 9 15 21. Co-Curricular Education (count) 6 6
COMMUNITY: Engaging the Greater Community in Sustainability 22. Community Education and Outreach Programs (count) 57 57
2008 2009 Trend
CAMPUS: Sustainable Infrastructure and Operations
1. Greenhouse Gas (GHG) Emissions (MT-CO2e) 311,345 277,086
GHG Emissions per Capita (MT-CO2e/person) 7.4 6.4
GHG Emissions per Square Foot of Building Space (kg-CO2e/sq. ft.) 23.3 20.5
2. Electricity Consumption (MWh) 261,978 252,536
Electricity Consumption per Community Member (MWh/person) 6.12 5.86
Electricity Consumption per Building Space (kWh/sq. ft.) 19.60 18.79
3. Steam Consumption 720,674 695,231
Steam Consumption per Community Member (MLbs/person) 16.85 16.12
Steam Consumption per Building Space (Thousands Lbs/sq. ft.) 53.91 51.74
4. Potable Water Consumption (kgal) 512,049 470,752
Potable Water Consumption per Capita (kgal/person) 11.97 10.91
Potable Water Consumption per Building Space (kgal/sq. ft.) 38.31 35.04
5. Non-Potable Water Use (gallons) N/A 25,000 N/A
6. Green Cleaning (percent) see report see report
7. Sustainable Food (percent) N/A 11 N/A
8. Composted Food Waste (tons) 212 145
2008 2009 Trend
CULTURE: Sustainable Behaviors
9. Recycling Rate (percent) 45.8 57.4
10. Non-Hazardous Solid Waste Generated (tons) 12,154 12,950
11. Hazardous Waste Generated (pounds) 83,878 51,173
12. Copy Paper Use (reams) 220,051 148,349
13. Students Living On and Near Campus (percent) N/A N/A N/A
14. Faculty/Staff Living Near Campus (percent) N/A N/A N/A
15. Commuting Distance of Faculty, Staff, and Students (miles) 15, 16.3, 16.6 15, 16.3, 16.1
16. Alternative Transportation (percent) 45.9 46.4
17. Registered Bikes On Campus (count) 280 910
18. Shuttle-UM Ridership (million rides) 2.34 2.60

2008 2009 Trend
CURRICULUM: Sustainability Education (and Research)
19. Courses Revised to Include Sustainability (count) 0 33
20. First Year Sustainability Education (percent) 9 15
21. Co-Curricular Education (count) 6 6
COMMUNITY: Engaging the Greater Community in Sustainability
22. Community Education and Outreach Programs (count) 57 57

www.sustainability.umd.edu
Full Reports are Available Online at www.sustainability.umd.edu

www.sustainability.umd.edu
CAMPUS Developing a carbon-neutral and resource-efficient
campus infrastructure
The Metrics:

www.sustainability.umd.edu
2012 Target: 15% below 2005 emissions (270,748 MT-CO2e)
2020 Target: 50% below 2005 emissions (159,264 MT-CO2e)
2015 Target: 25% below 2005 emissions (238,895 MT-CO2e)
1. Greenhouse Gas (GHG) Emissions Metric: The University's carbon footprint: the greenhouse gas (GHG) emissions – measured in metric tons of carbon dioxide equivalents (MT-CO2e) – of the infrastructure, operations, and travel associated with the College Park campus

www.sustainability.umd.edu
1A. Greenhouse Gas (GHG) Emissions per CapitaMetric: Metric tons of carbon dioxide equivalents (MT-CO2e) per capita
1B. Greenhouse Gas (GHG) Emissions per Square Foot of Building SpaceMetric: Kilograms of carbon dioxide equivalents (kg-CO2e) per square foot of total building space

www.sustainability.umd.edu
2. Electricity ConsumptionMetric: Megawatt hours (MWh) used by facilities on the College Park campus. This metric includes electricity delivered to campus by the cogeneration power plant and purchased from off-site suppliers.

www.sustainability.umd.edu
2A. Electricity Consumption per CapitaMetric: Megawatt hours (MWh) per capita
2B. Electricity Consumption per Square Foot of Building SpaceMetric: Megawatt hours (MWh) per square foot of total building space

www.sustainability.umd.edu
3. Steam ConsumptionMetric: Million Pounds (MLbs) of steam used by facilities on the College Park campus

www.sustainability.umd.edu
3A. Steam Consumption per Capita Metric: Million Pounds (MLbs) steam consumed per capita 3B. Steam Consumption per Square Foot of Building SpaceMetric: Thousands Pound (kLbs) per square foot of total building space

www.sustainability.umd.edu
4. Potable Water Consumption Metric: Thousand gallons (kgal.) of fresh water consumed on the College Park campus

www.sustainability.umd.edu
4A. Potable Water Consumption per CapitaMetric: Thousand gallons (kgal.) of fresh water consumed per capita
4B. Potable Water Consumption per Square Foot of Building SpaceMetric: Thousand gallons (kgal.) of fresh water consumed per square foot of building space

www.sustainability.umd.edu
5. Non-Potable Water Metric: Thousands of gallons (kgal.) of non-potable water used on campus

www.sustainability.umd.edu
6. Green Cleaning Metric: Percentage of the cleaning chemical budget spent on cleaning products certified as "green" or "sustainable" by a third-party organization (such as Green Seal).
www.sustainability.umd.edu
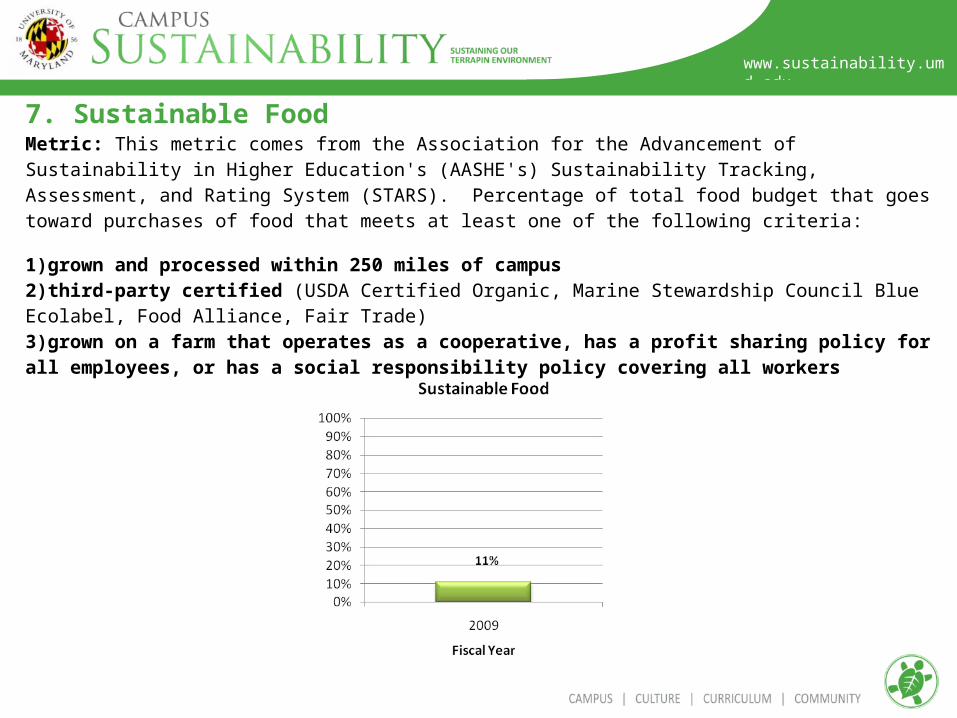
7. Sustainable FoodMetric: This metric comes from the Association for the Advancement of Sustainability in Higher Education's (AASHE's) Sustainability Tracking, Assessment, and Rating System (STARS). Percentage of total food budget that goes toward purchases of food that meets at least one of the following criteria:
1)grown and processed within 250 miles of campus2)third-party certified (USDA Certified Organic, Marine Stewardship Council Blue Ecolabel, Food Alliance, Fair Trade)3)grown on a farm that operates as a cooperative, has a profit sharing policy for all employees, or has a social responsibility policy covering all workers

www.sustainability.umd.edu
8. CompostingMetric: Tons of food waste composted

www.sustainability.umd.edu
Possible Future Campus Metrics
Campus Stormwater Runoff Quality and Quantity
Green Space
Biodiversity

www.sustainability.umd.edu
CULTURE Fostering an environment where students, faculty, staff, and visitors can practice sustainability through
everyday behaviors
The Metrics:

www.sustainability.umd.edu
9. Recycling Metric: Percentage of waste stream diverted from landfills
10. Non-Hazardous Solid WasteMetric: Tons of non-hazardous solid waste landfilled and recycled

www.sustainability.umd.edu
11. Hazardous Waste Metric: Pounds of hazardous waste disposed per 1,000 Net Assignable Square Feet (NASF)

www.sustainability.umd.edu
12. Paper Metric: Reams of virgin and recycled-content paper purchased through Department of Procurement & Supply. Ream = 500 sheets. Department of Business Services paper purchasing is not included.

www.sustainability.umd.edu
13. Students Living On and Near CampusMetric: Percentage of students living on campus and within a specific radius of campus (TBD)
14. Faculty/Staff Living Near CampusMetric: Percentage of faculty and staff living within a specific radius of campus (TBD)
In 2009, 41 percent of degree seeking undergraduates lived in college-owned, -operated, or -affiliated housing. The Office of Sustainability needs access to address data to determine the percent of students who live near campus.
The Department of Facilities Management conducted a GIS study in 2005 showing that 3,155 faculty and staff (22.6 percent) lived within a 5 mile radius of campus (center of the radius is South Gate) and that 5,418 (38.7 percent) lived within a 10 mile radius. The Office of Sustainability needs access to address data to determine the percent of faculty and staff who live near campus.
15. Commuting DistanceMetric: Average one-way commuting distance (miles)of faculty, staff, and students
www.sustainability.umd.edu
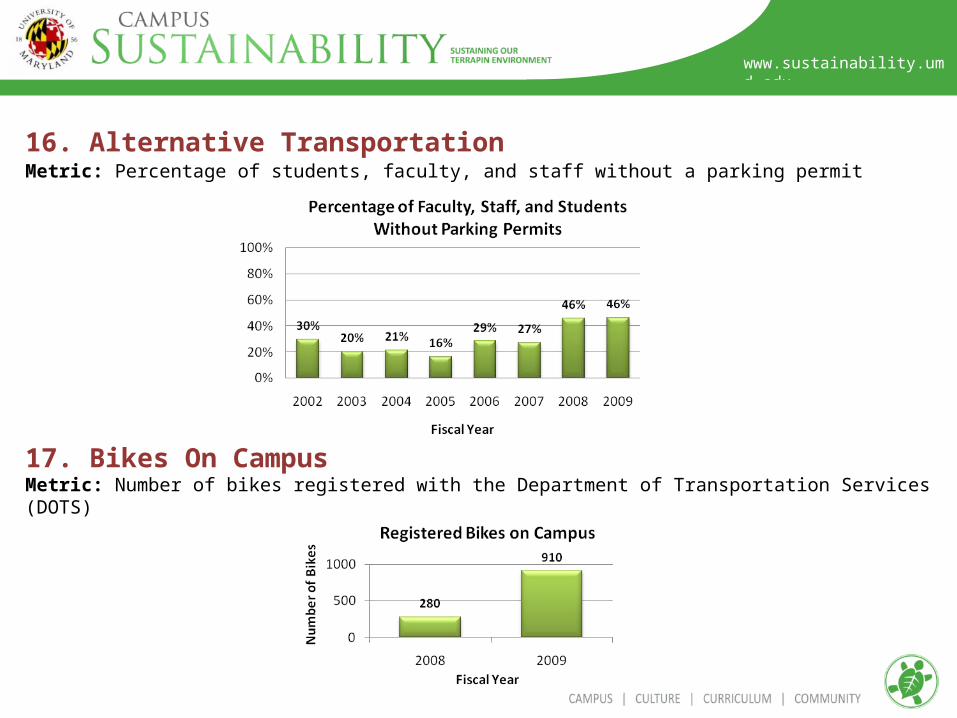
16. Alternative Transportation Metric: Percentage of students, faculty, and staff without a parking permit
17. Bikes On CampusMetric: Number of bikes registered with the Department of Transportation Services (DOTS)

www.sustainability.umd.edu
18. Shuttle-UM RidershipMetric: Millions of rides on Shuttle-UM

www.sustainability.umd.edu
Possible Future Culture Metrics
What is missing??

www.sustainability.umd.edu
CURRICULUM Integrating sustainability across the curriculum and
addressing sustainability challenges through research
The Metrics:

www.sustainability.umd.edu
19. Courses Revised to Include Sustainability Metric: Count of courses revised to include sustainability as part of the curriculum
33 courses were revised to include sustainability in 2009 through the Chesapeake Project
20. First Year Sustainability EducationMetric: Percentage of first year students who receive a peer-educator sustainability lesson
21. Co-Curricular EducationMetric: Count of living-learning programs with sustainability integration
There were 6 living-learning programs with sustainability integration in 2008 and 2009
www.sustainability.umd.edu
Possible Future Curriculum Metrics
Sustainability Literacy
Sustainability Research Activity??

www.sustainability.umd.edu
COMMUNITY Engaging the broader community in sustainability
through outreach and service
The Metrics:

www.sustainability.umd.edu
22. Community Education and Outreach ProgramsMetric: Count of programs whose mission, outreach, or operations serve to enhance sustainability locally, in the State, and around the world.
In 2009, there were at least 57 University programs that focus on community education and outreach.
Possible Future Community Metrics
Number of students who participate in community service
Number of hours students spend doing community service
Others??